
Active Confinement of Masonry Walls with Stainless Steel Straps: The Effect of Strap Arrangement on the in-Plane Behavior of Strength, Poisson’s Ratio, and Pseudo-Ductility

Abstract
:
1. Introduction
1.1. General Information on the CAM® System
1.2. The Idea behind the Experimental Program
2. Experimental Program
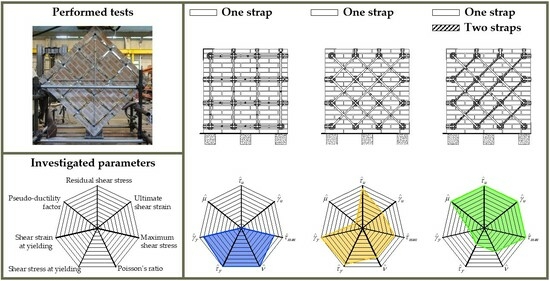
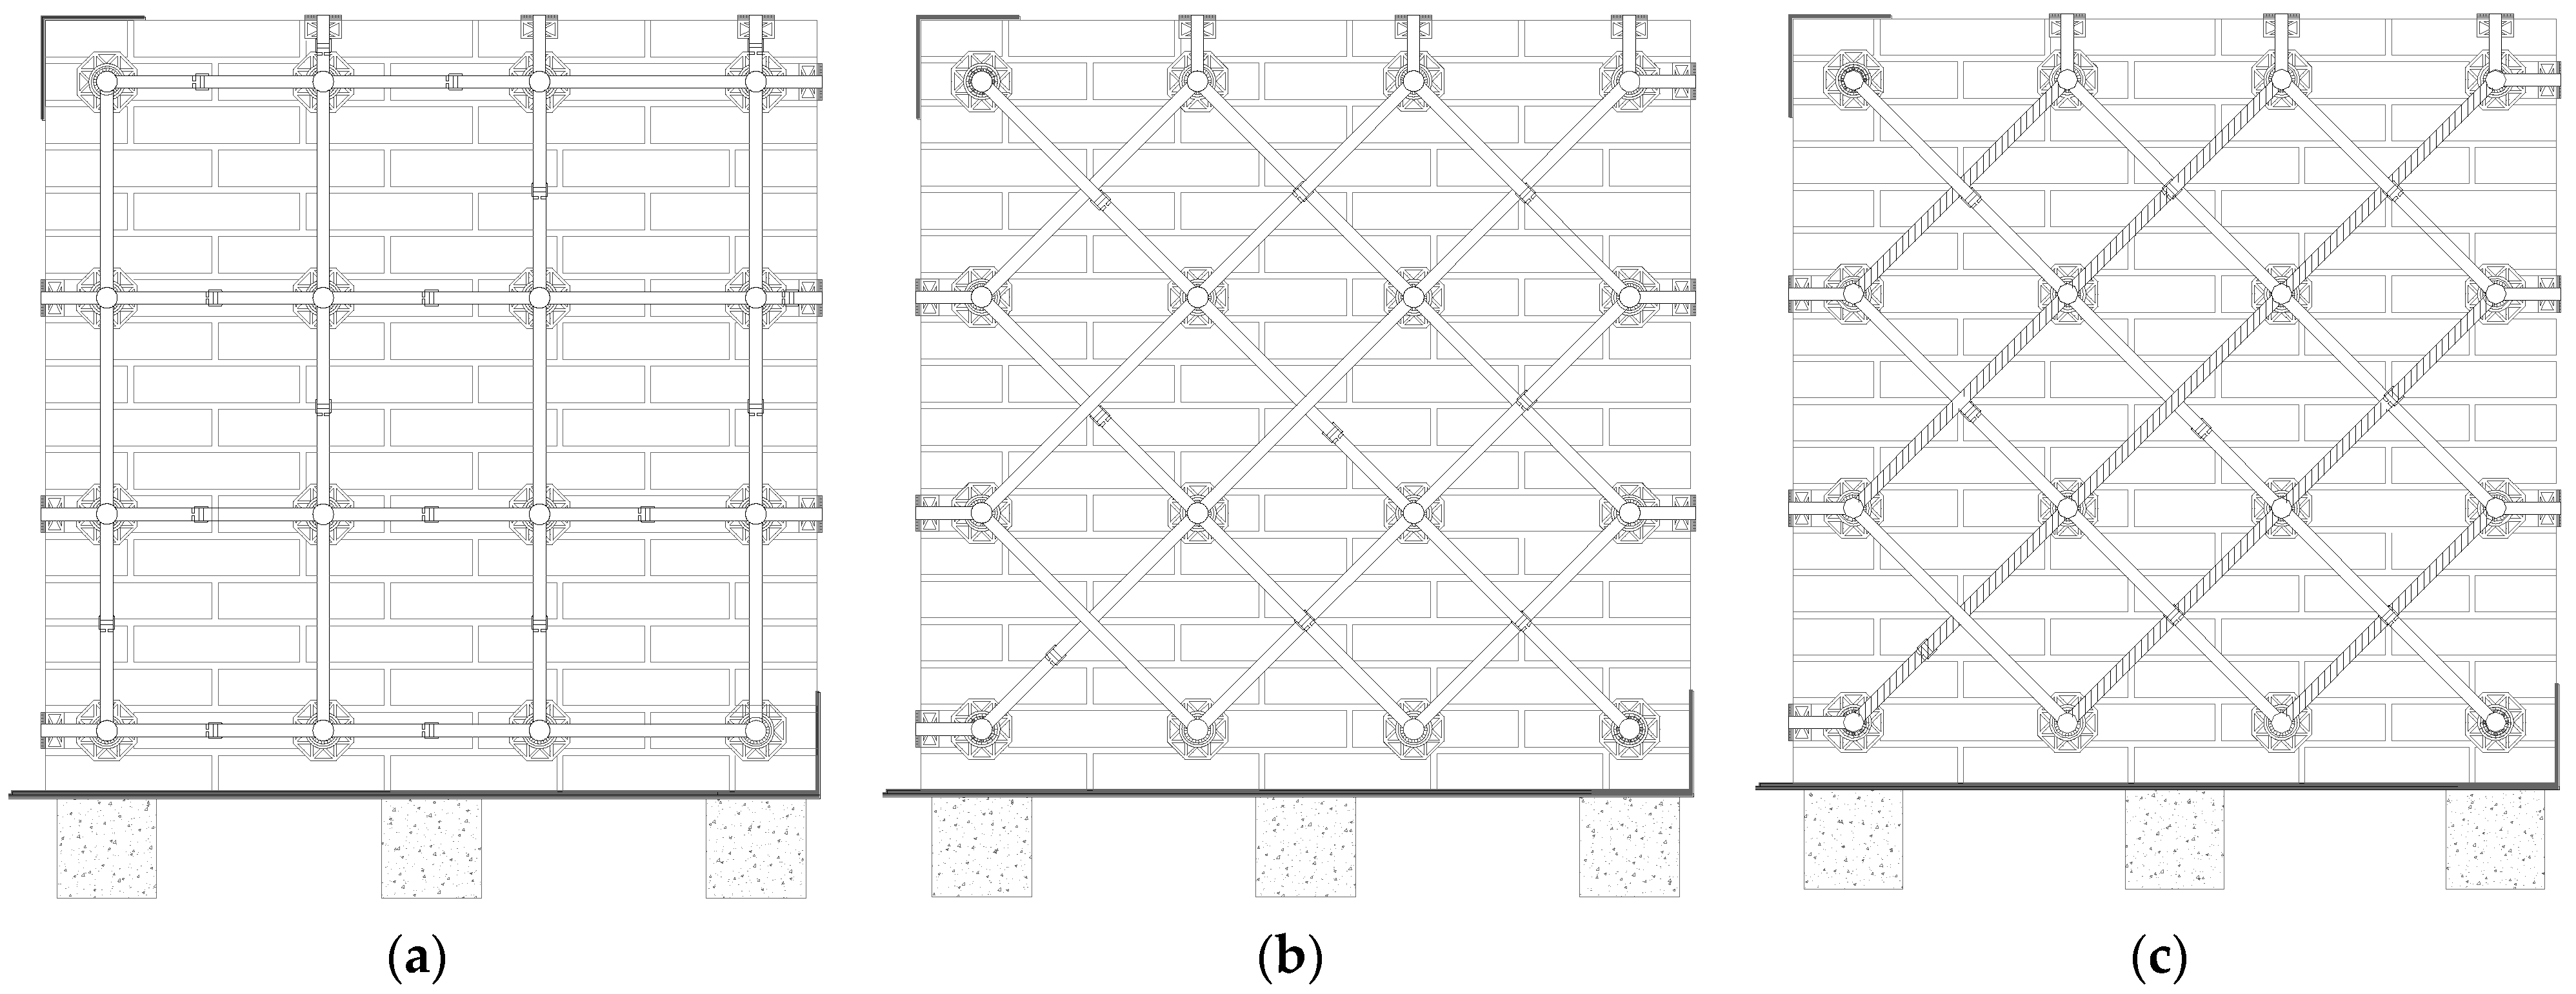
- Specimen M1-90: one strap per loop along the directions of the mortar head and bed joints (Figure 8a);
- Specimen M1-45: one strap per loop along the directions forming angles with the mortar head and bed joints (Figure 8b), that is, along the compressed and tensioned directions (Appendix A);
2.1. Material Properties
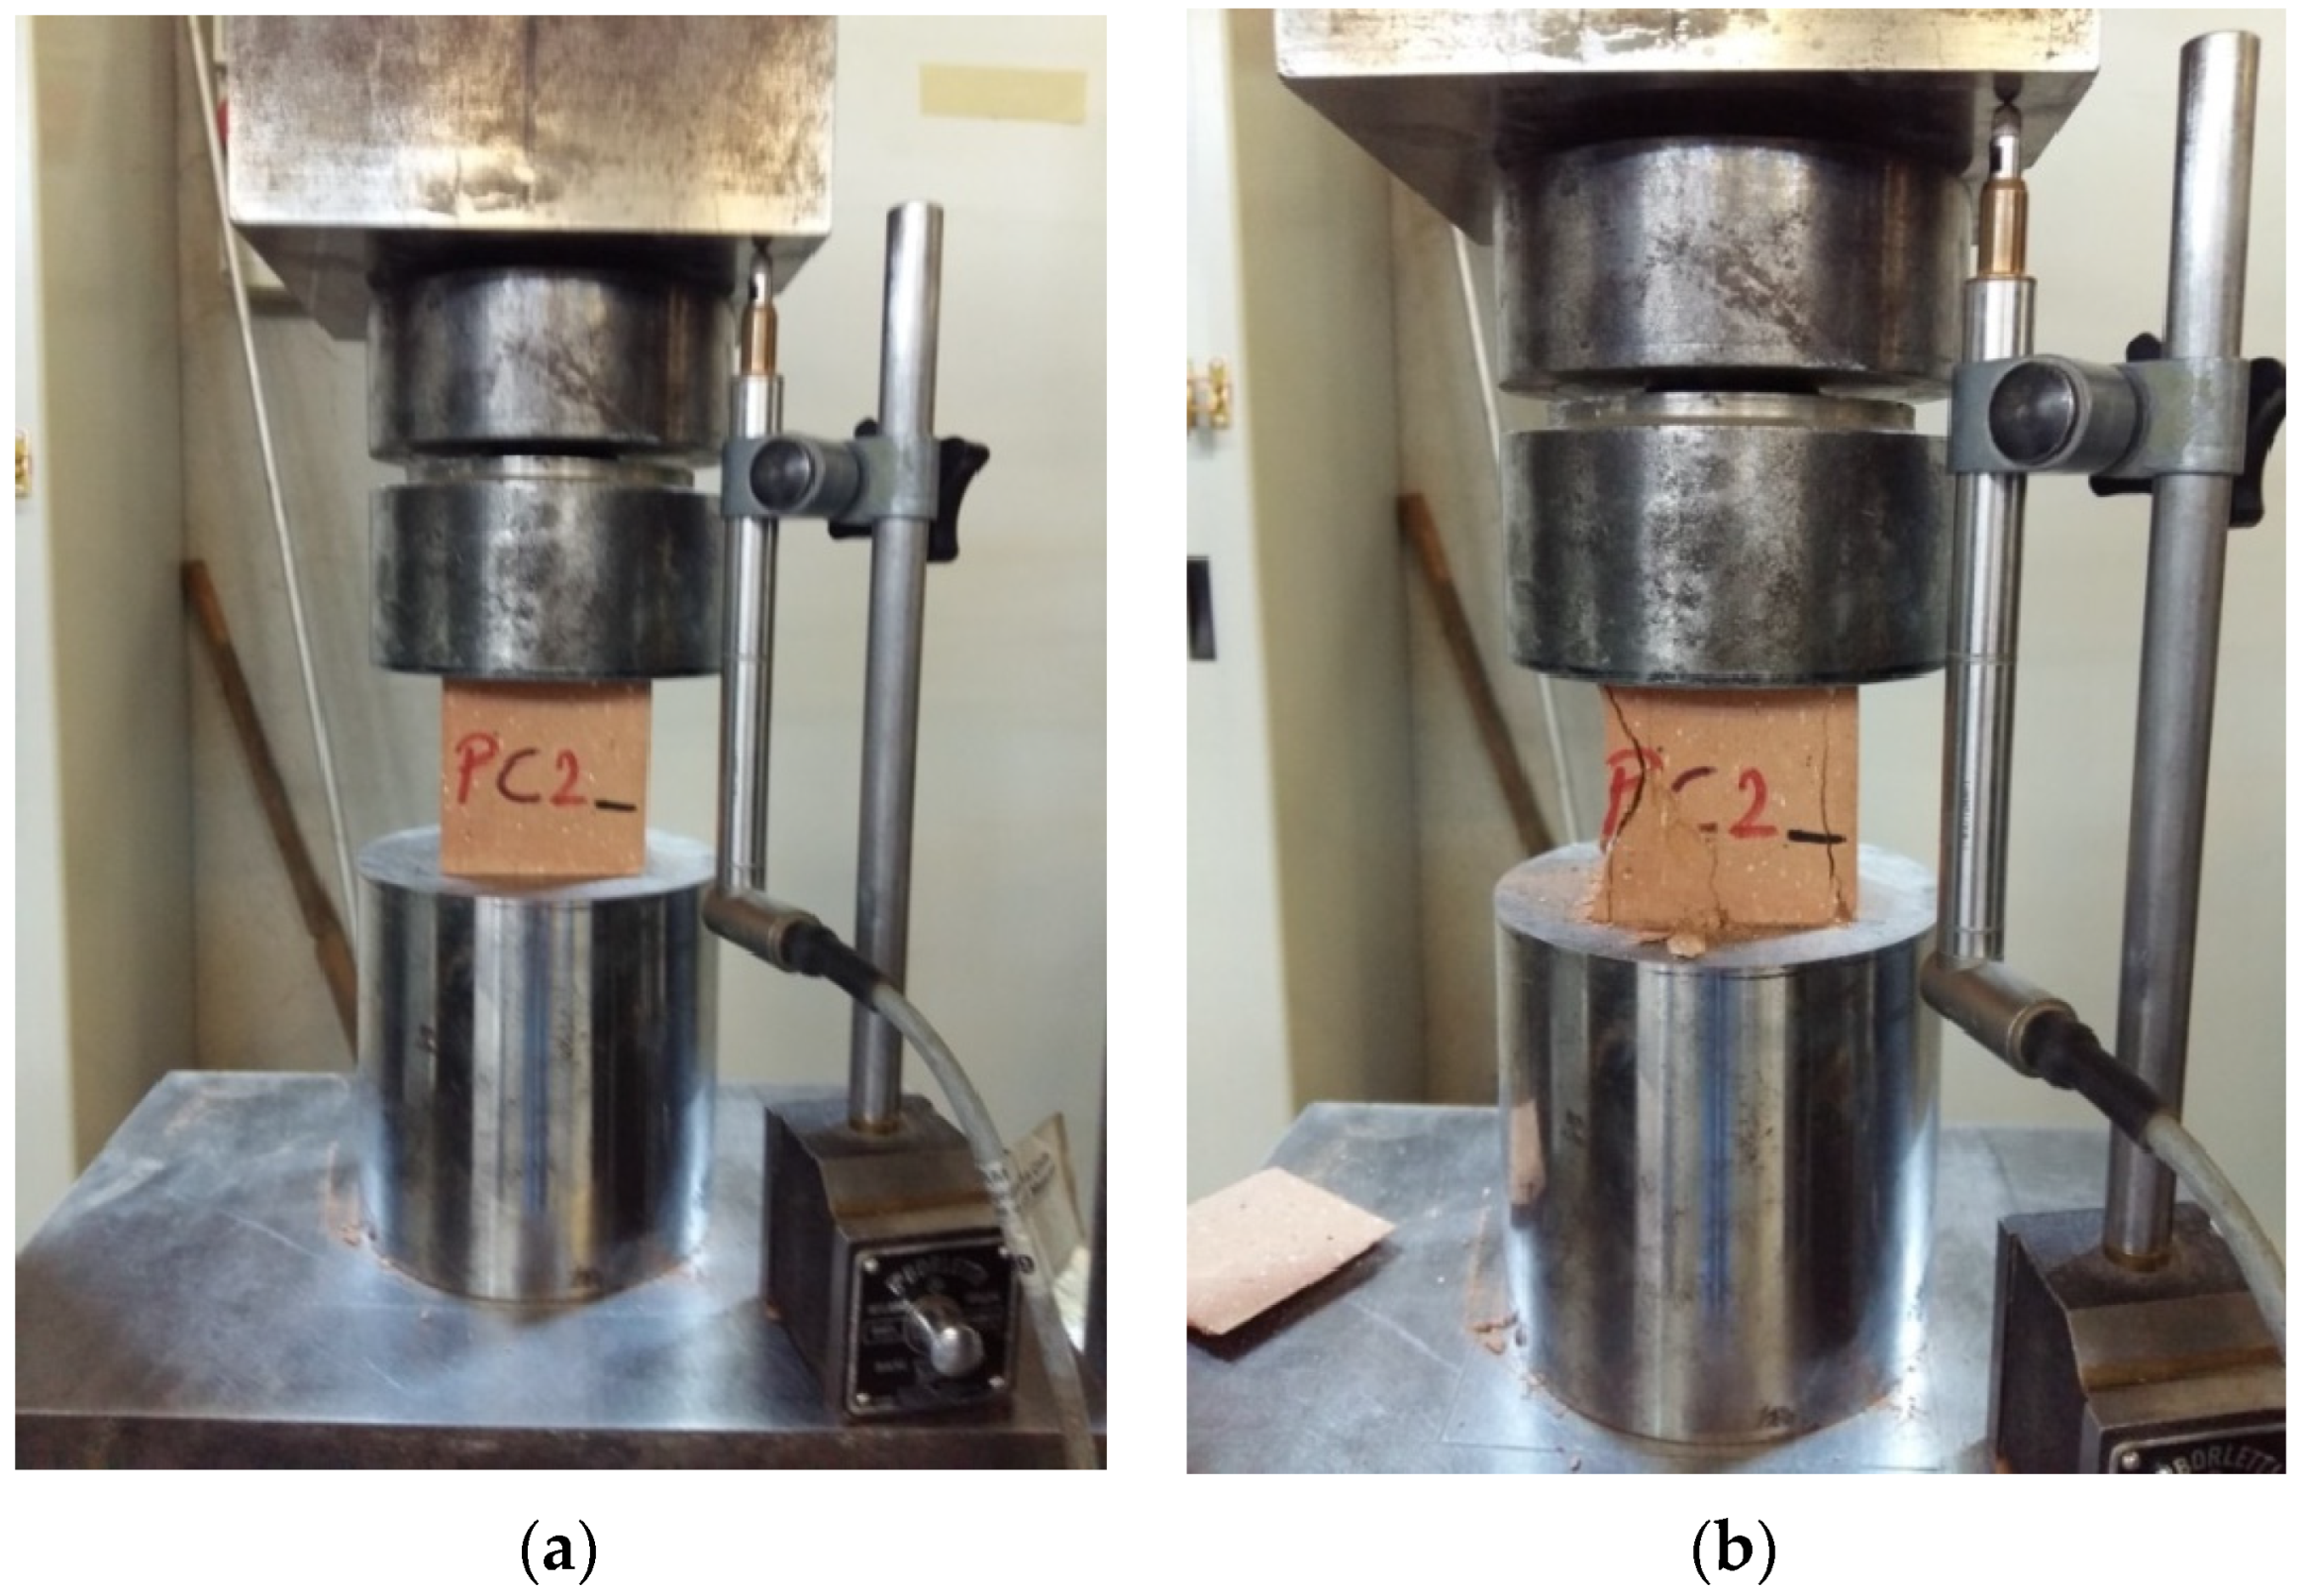
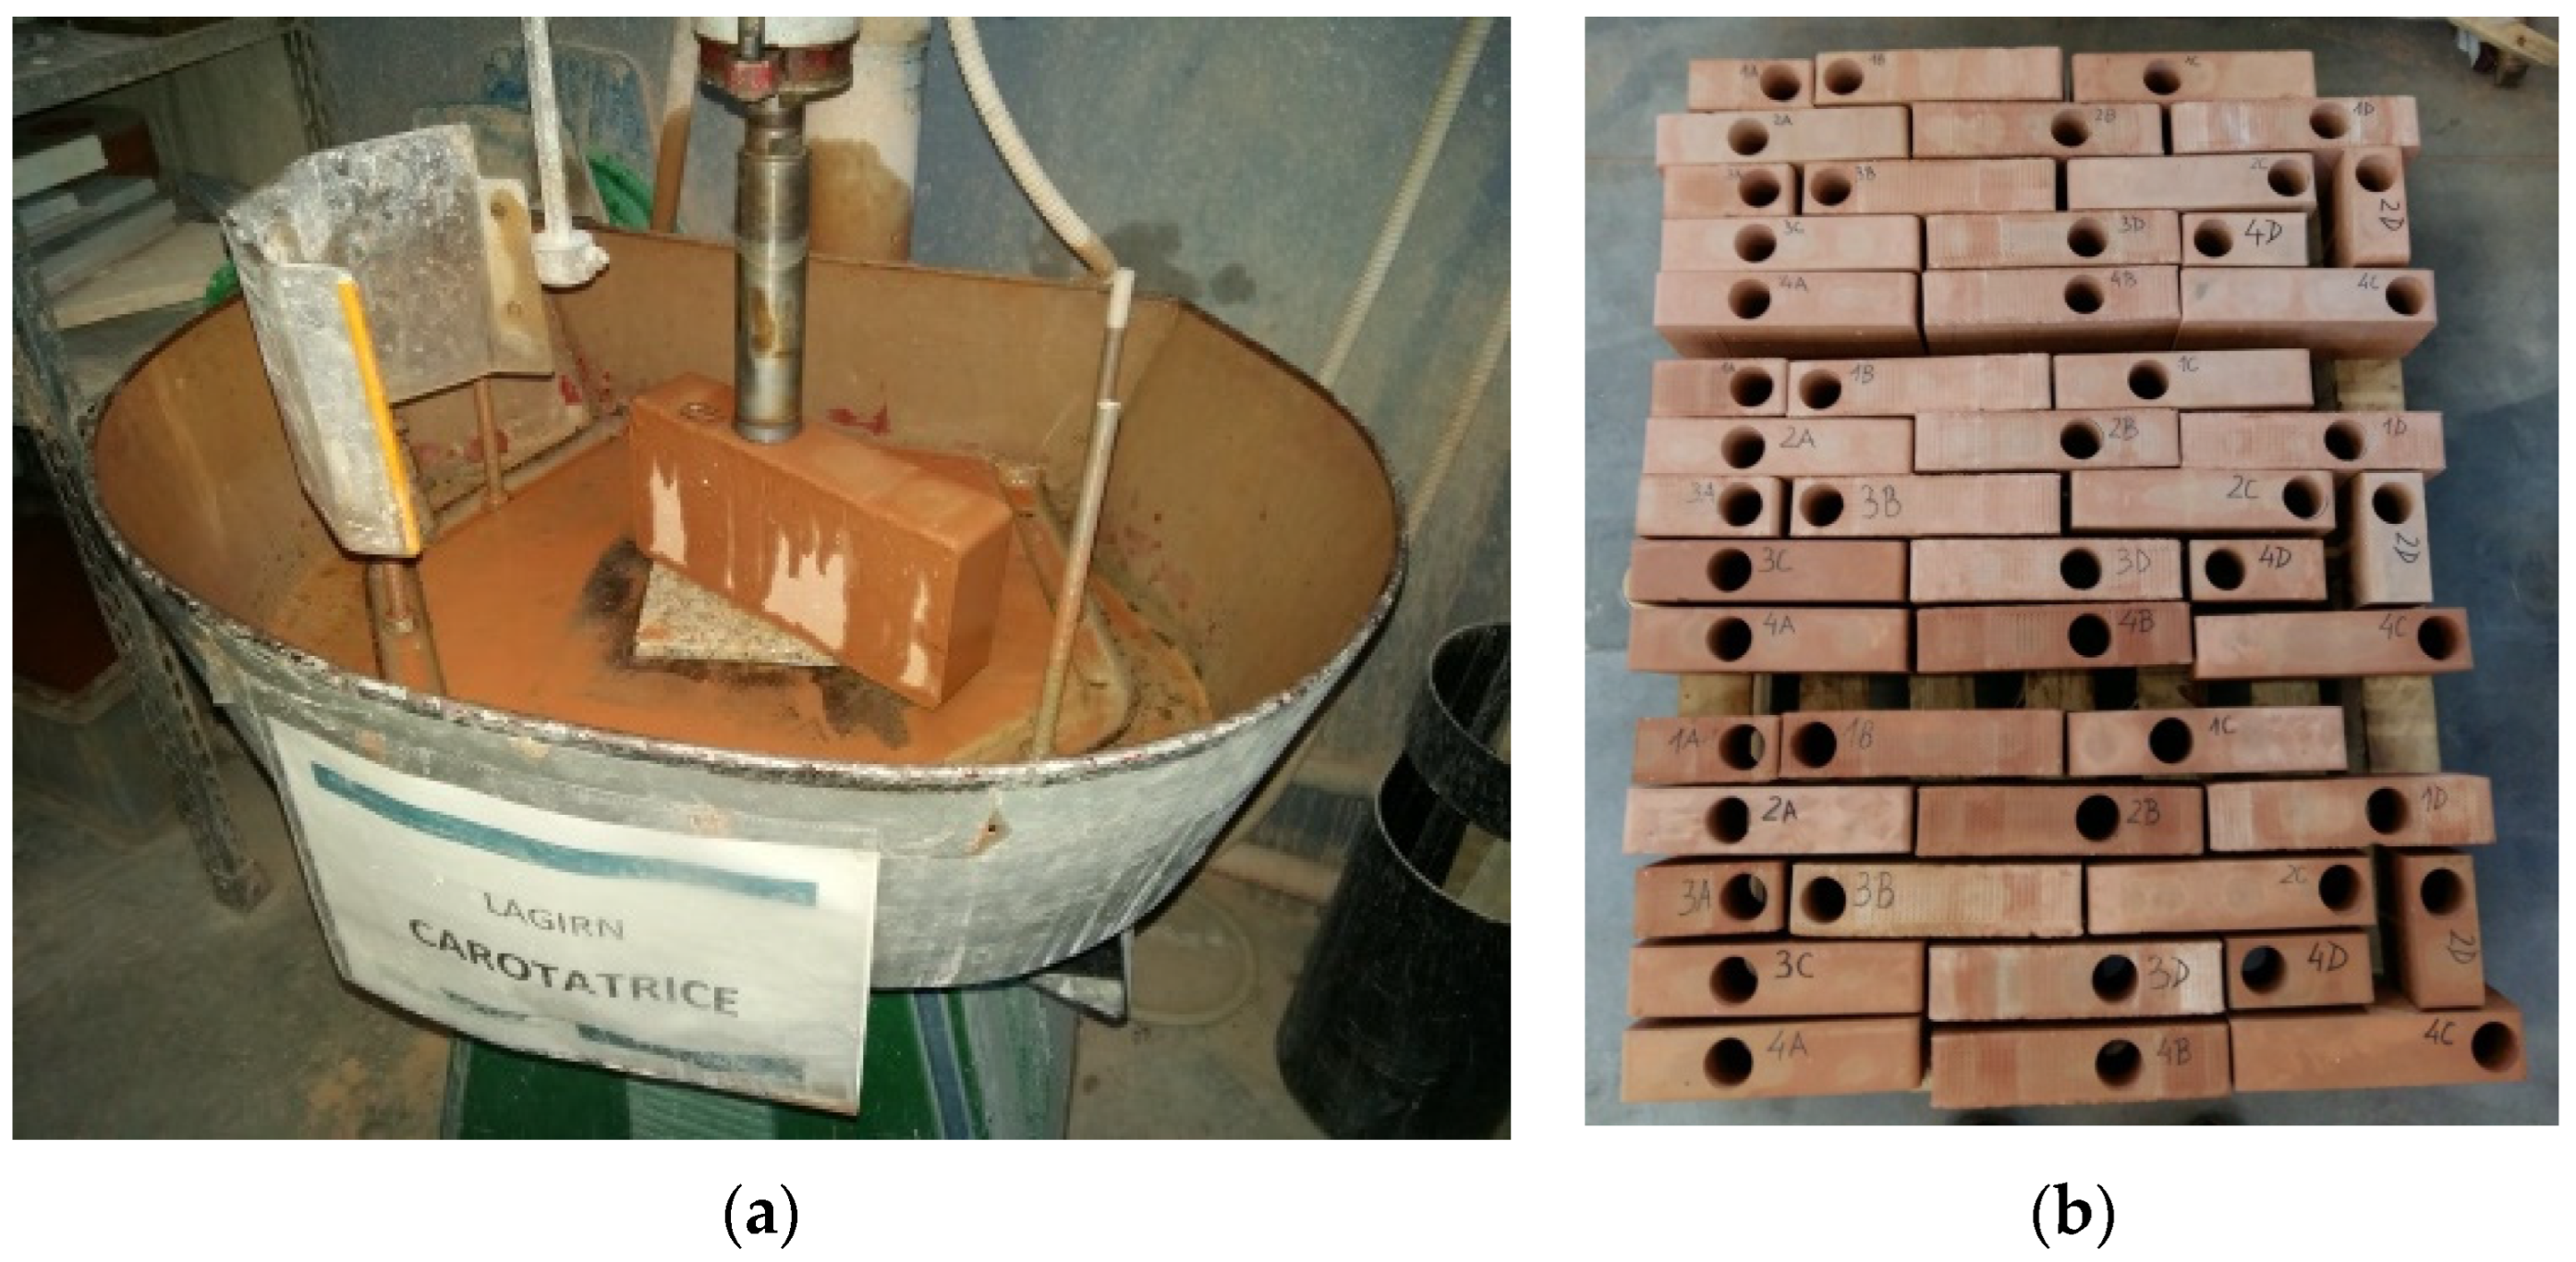
2.1.1. Bricks
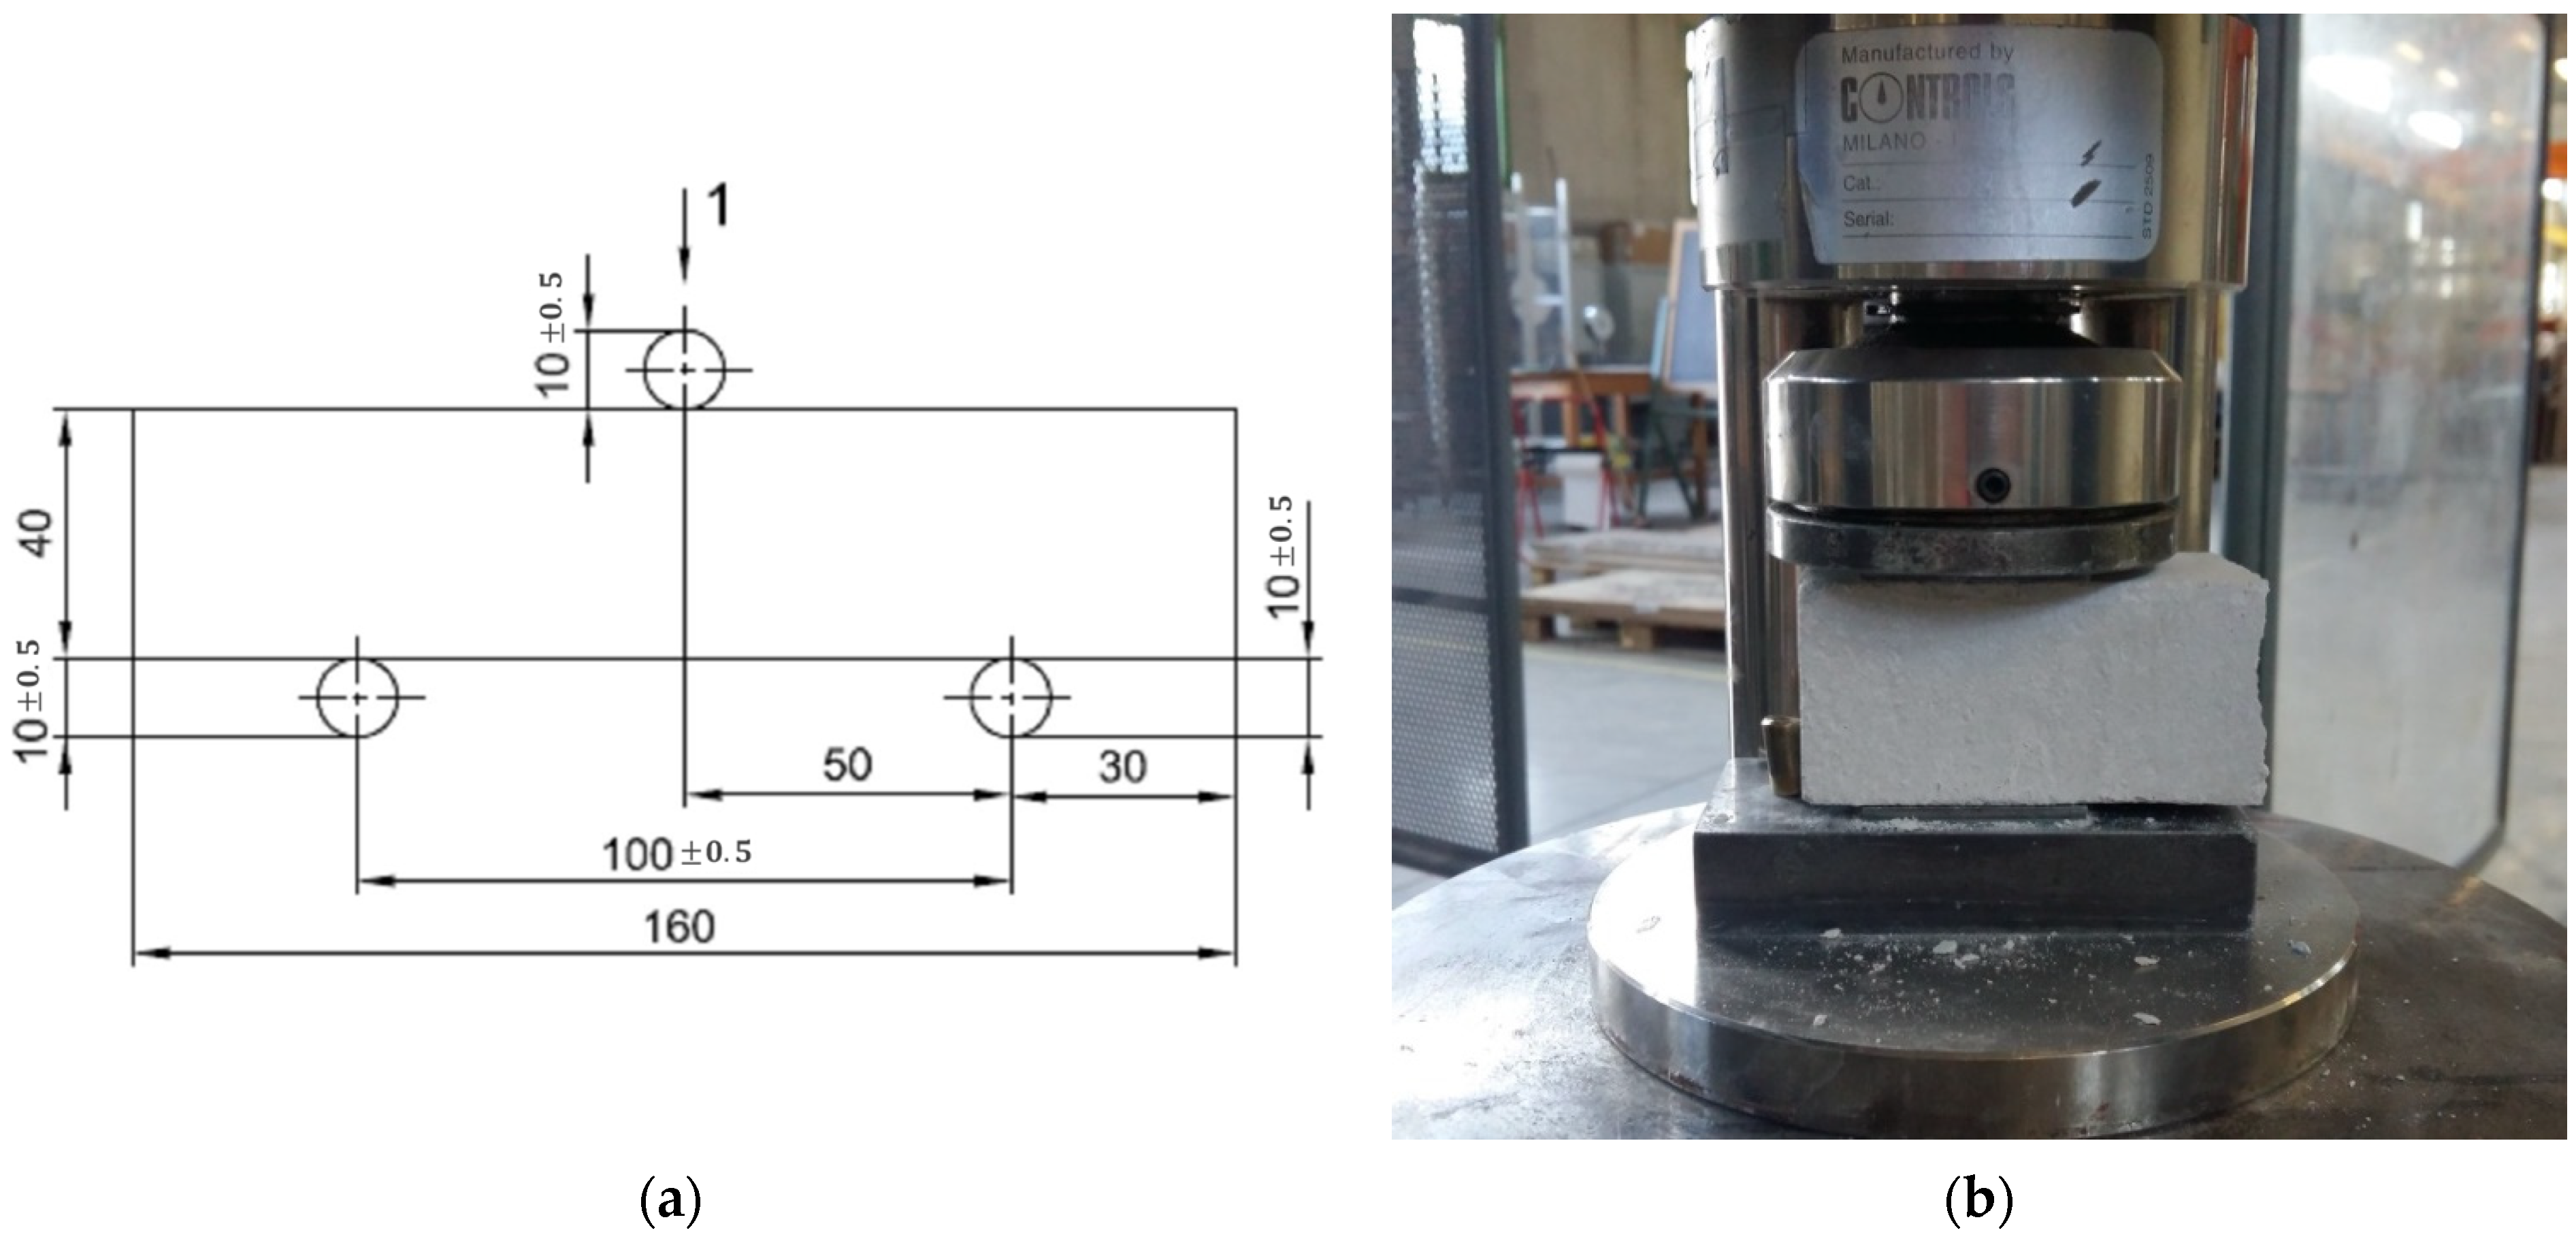
2.1.2. Mortar
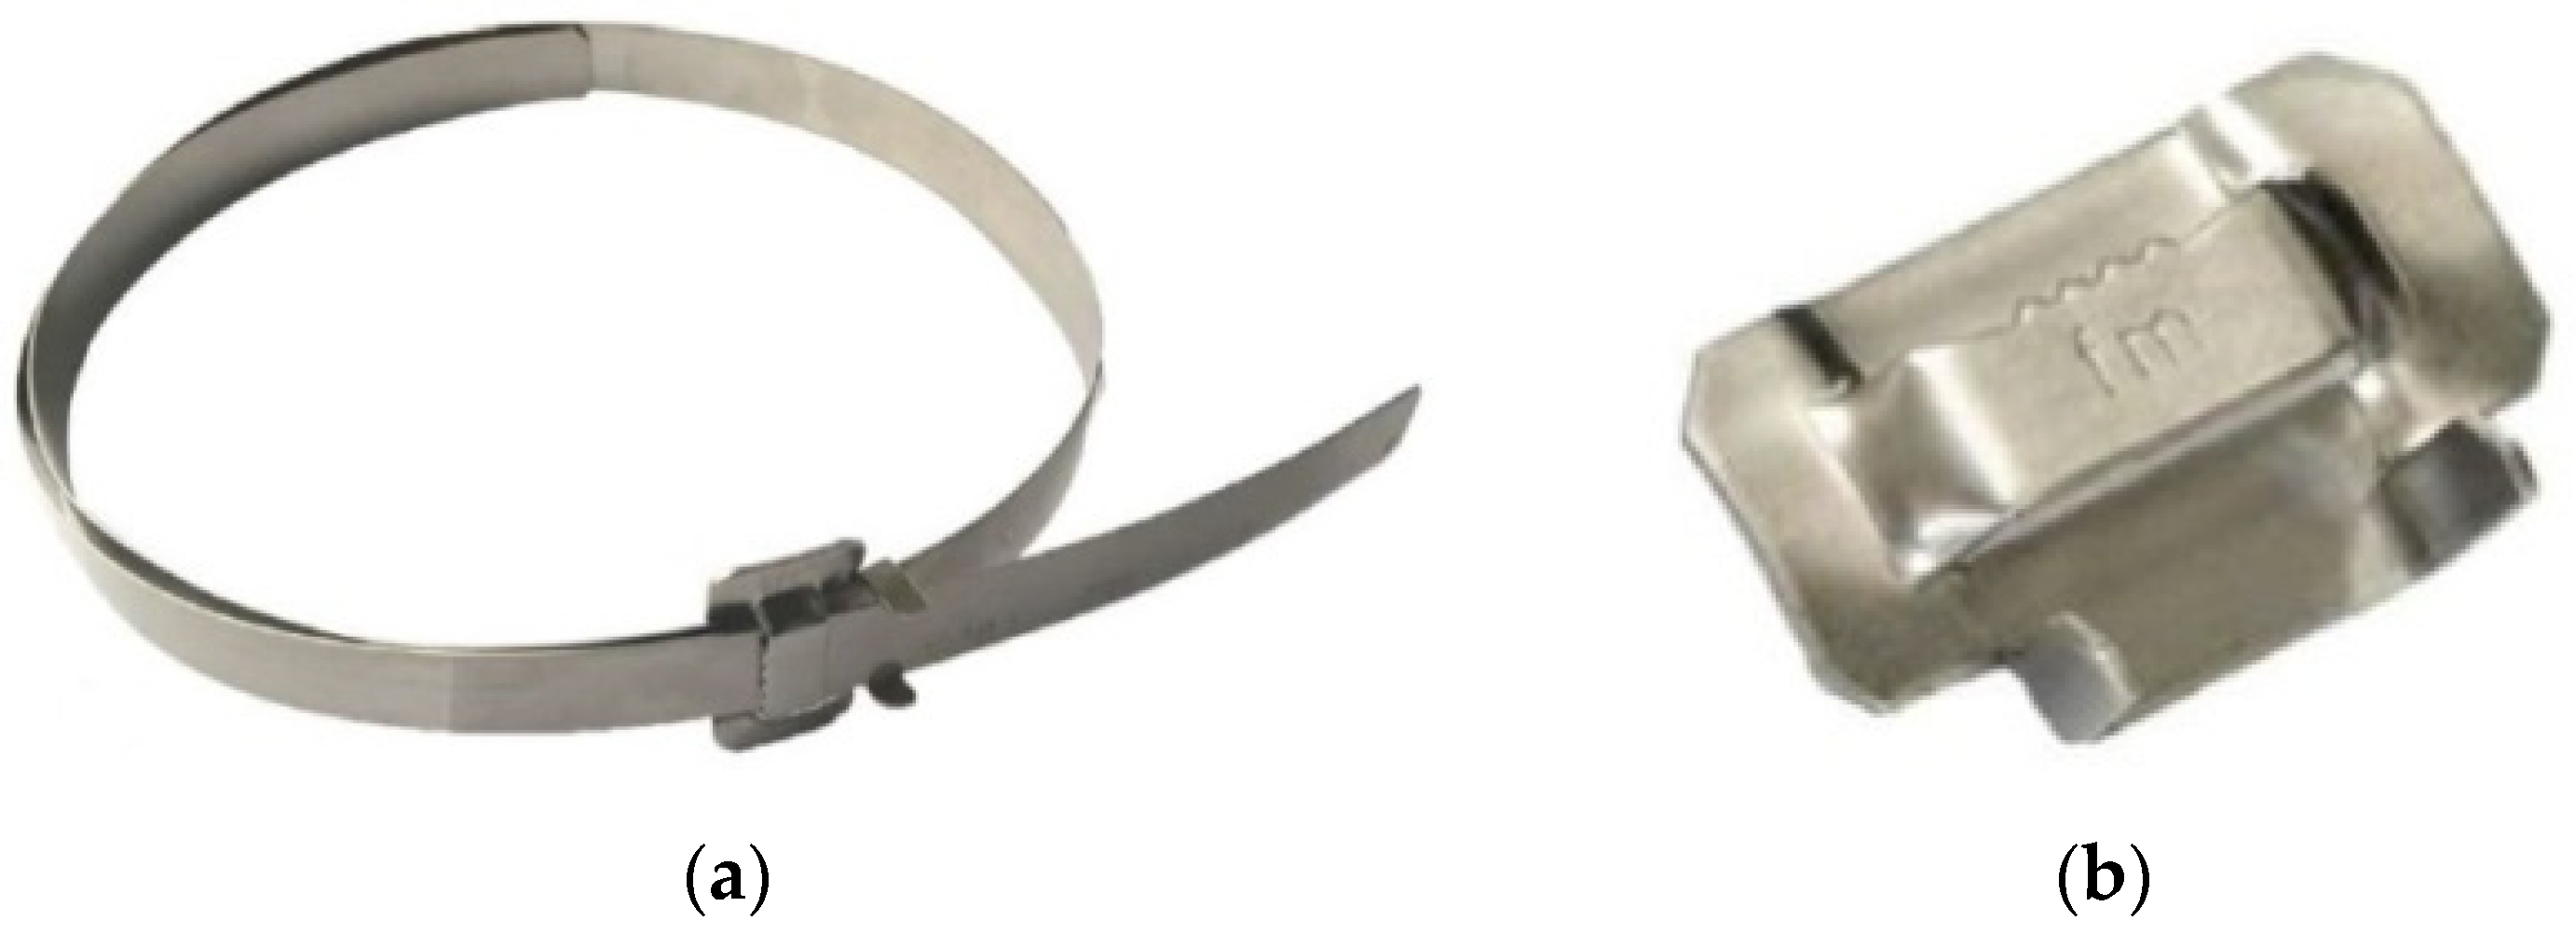
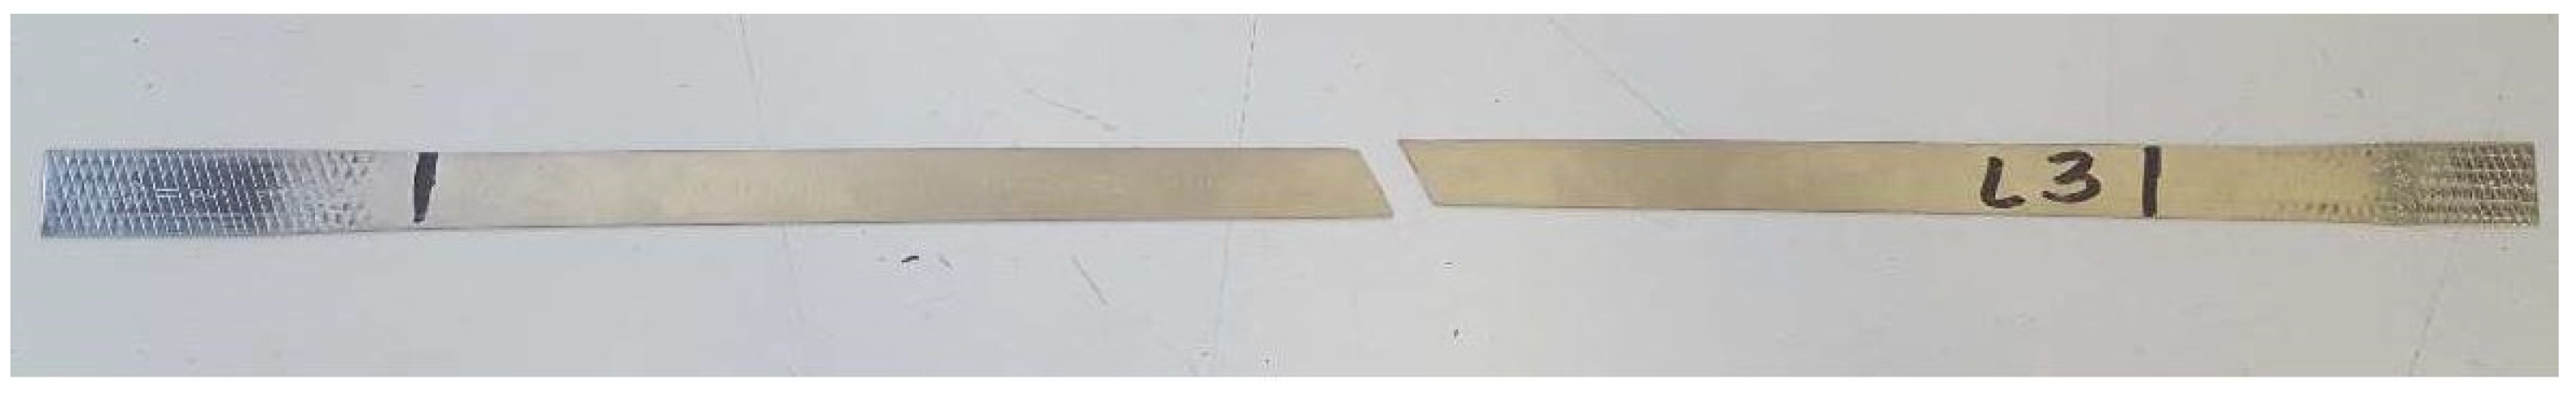
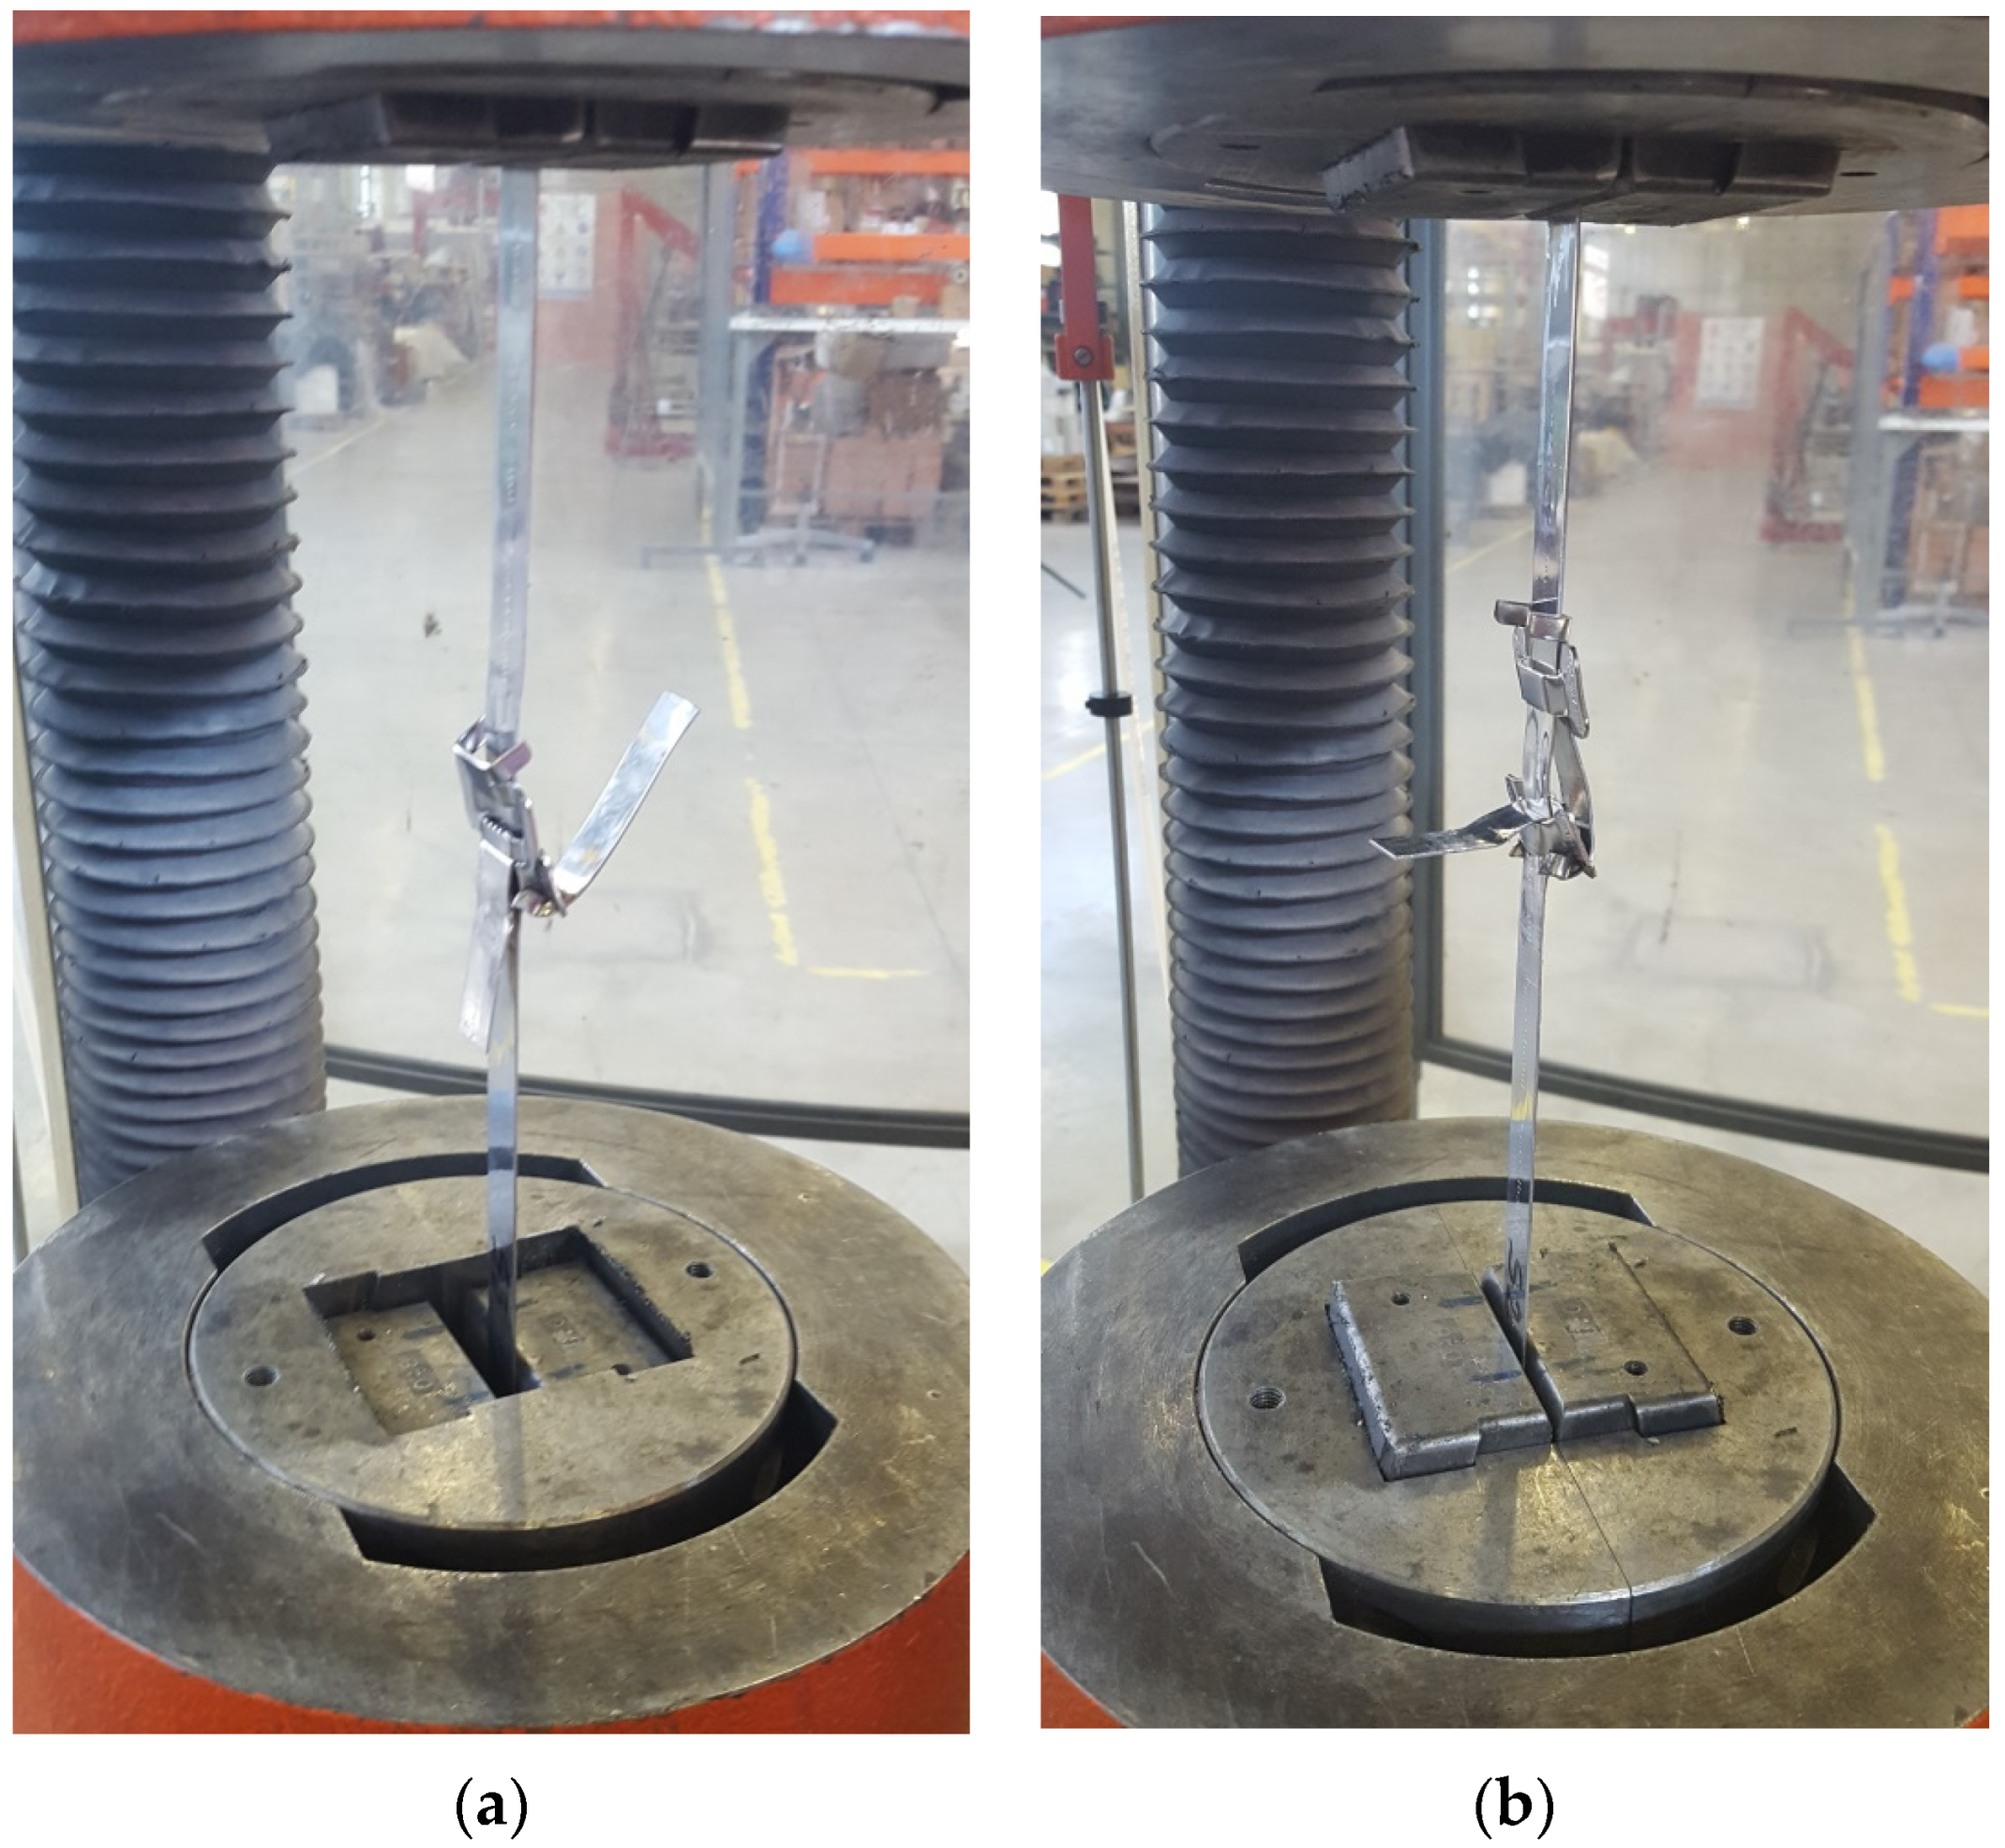
2.1.3. Stainless Steel Straps and Seals
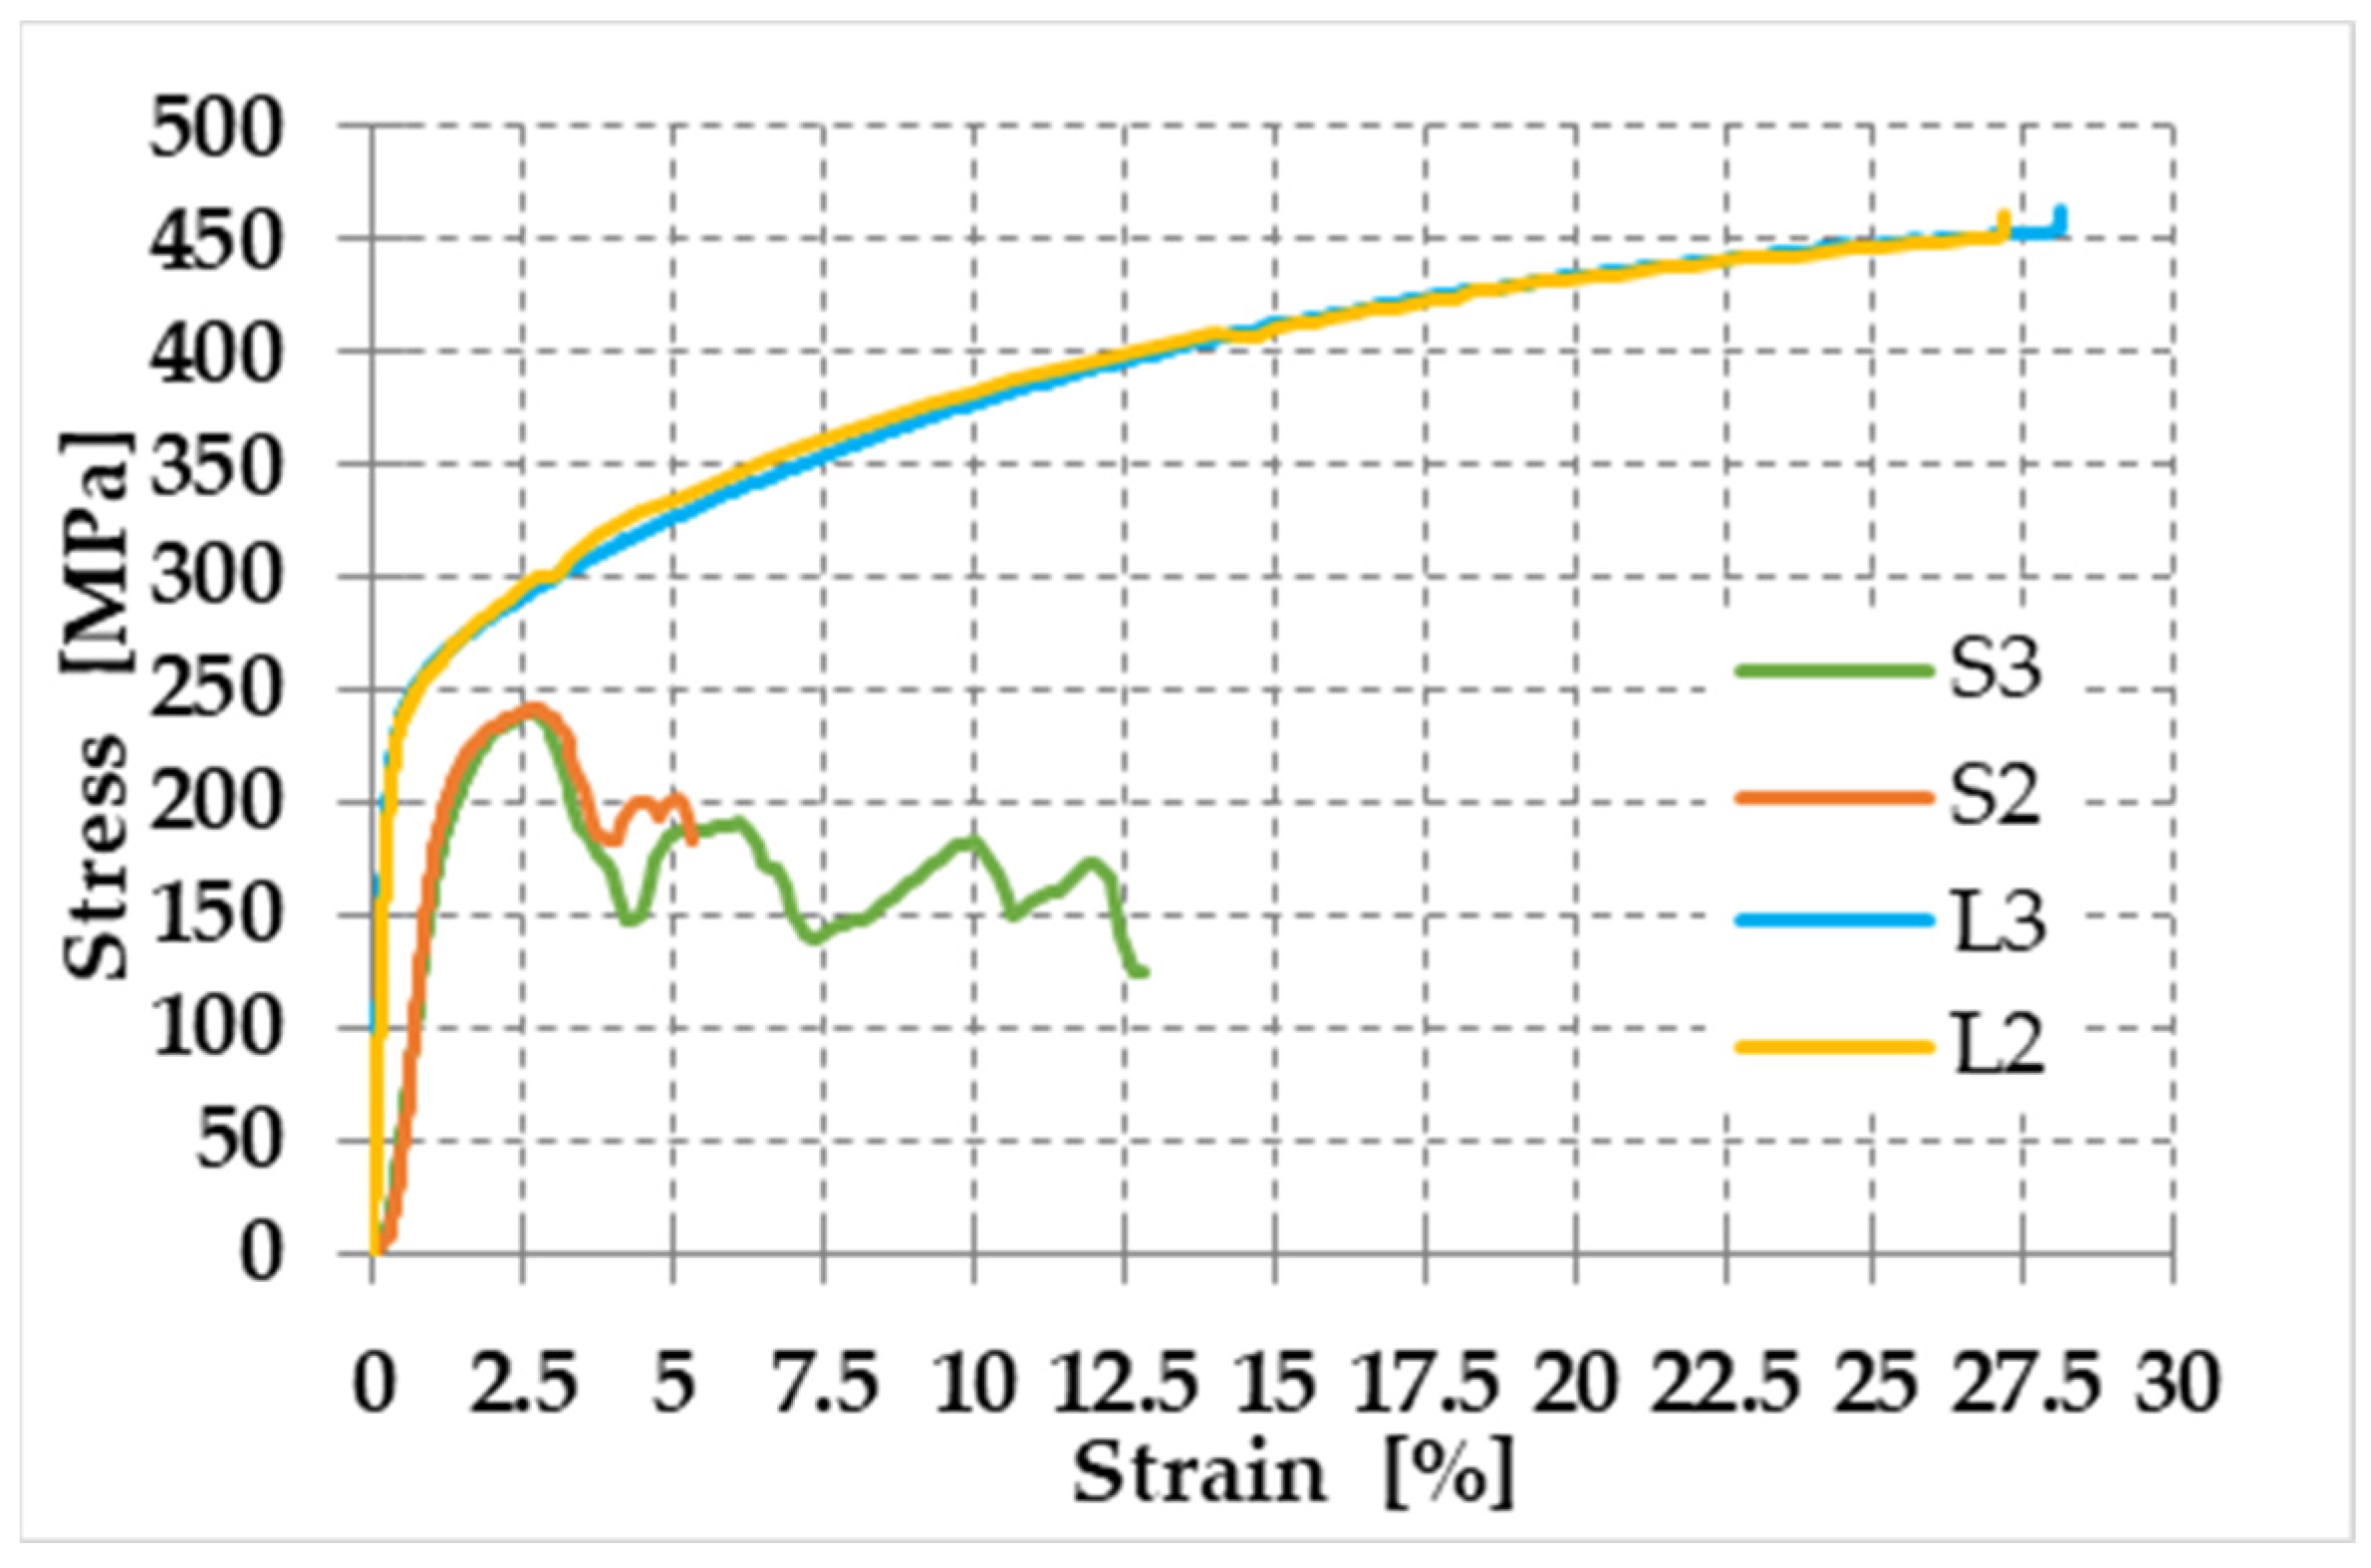
- Specimen L2 consisted of a piece of steel tape (unclamped strap);
- Specimen L3 consisted of a piece of steel tape (unclamped strap);
- Specimen S2 consisted of two pieces of steel tape, fastened together by one seal (clamped strap);
- Specimen S3 consisted of two pieces of steel tape, fastened together by two seals (clamped strap).
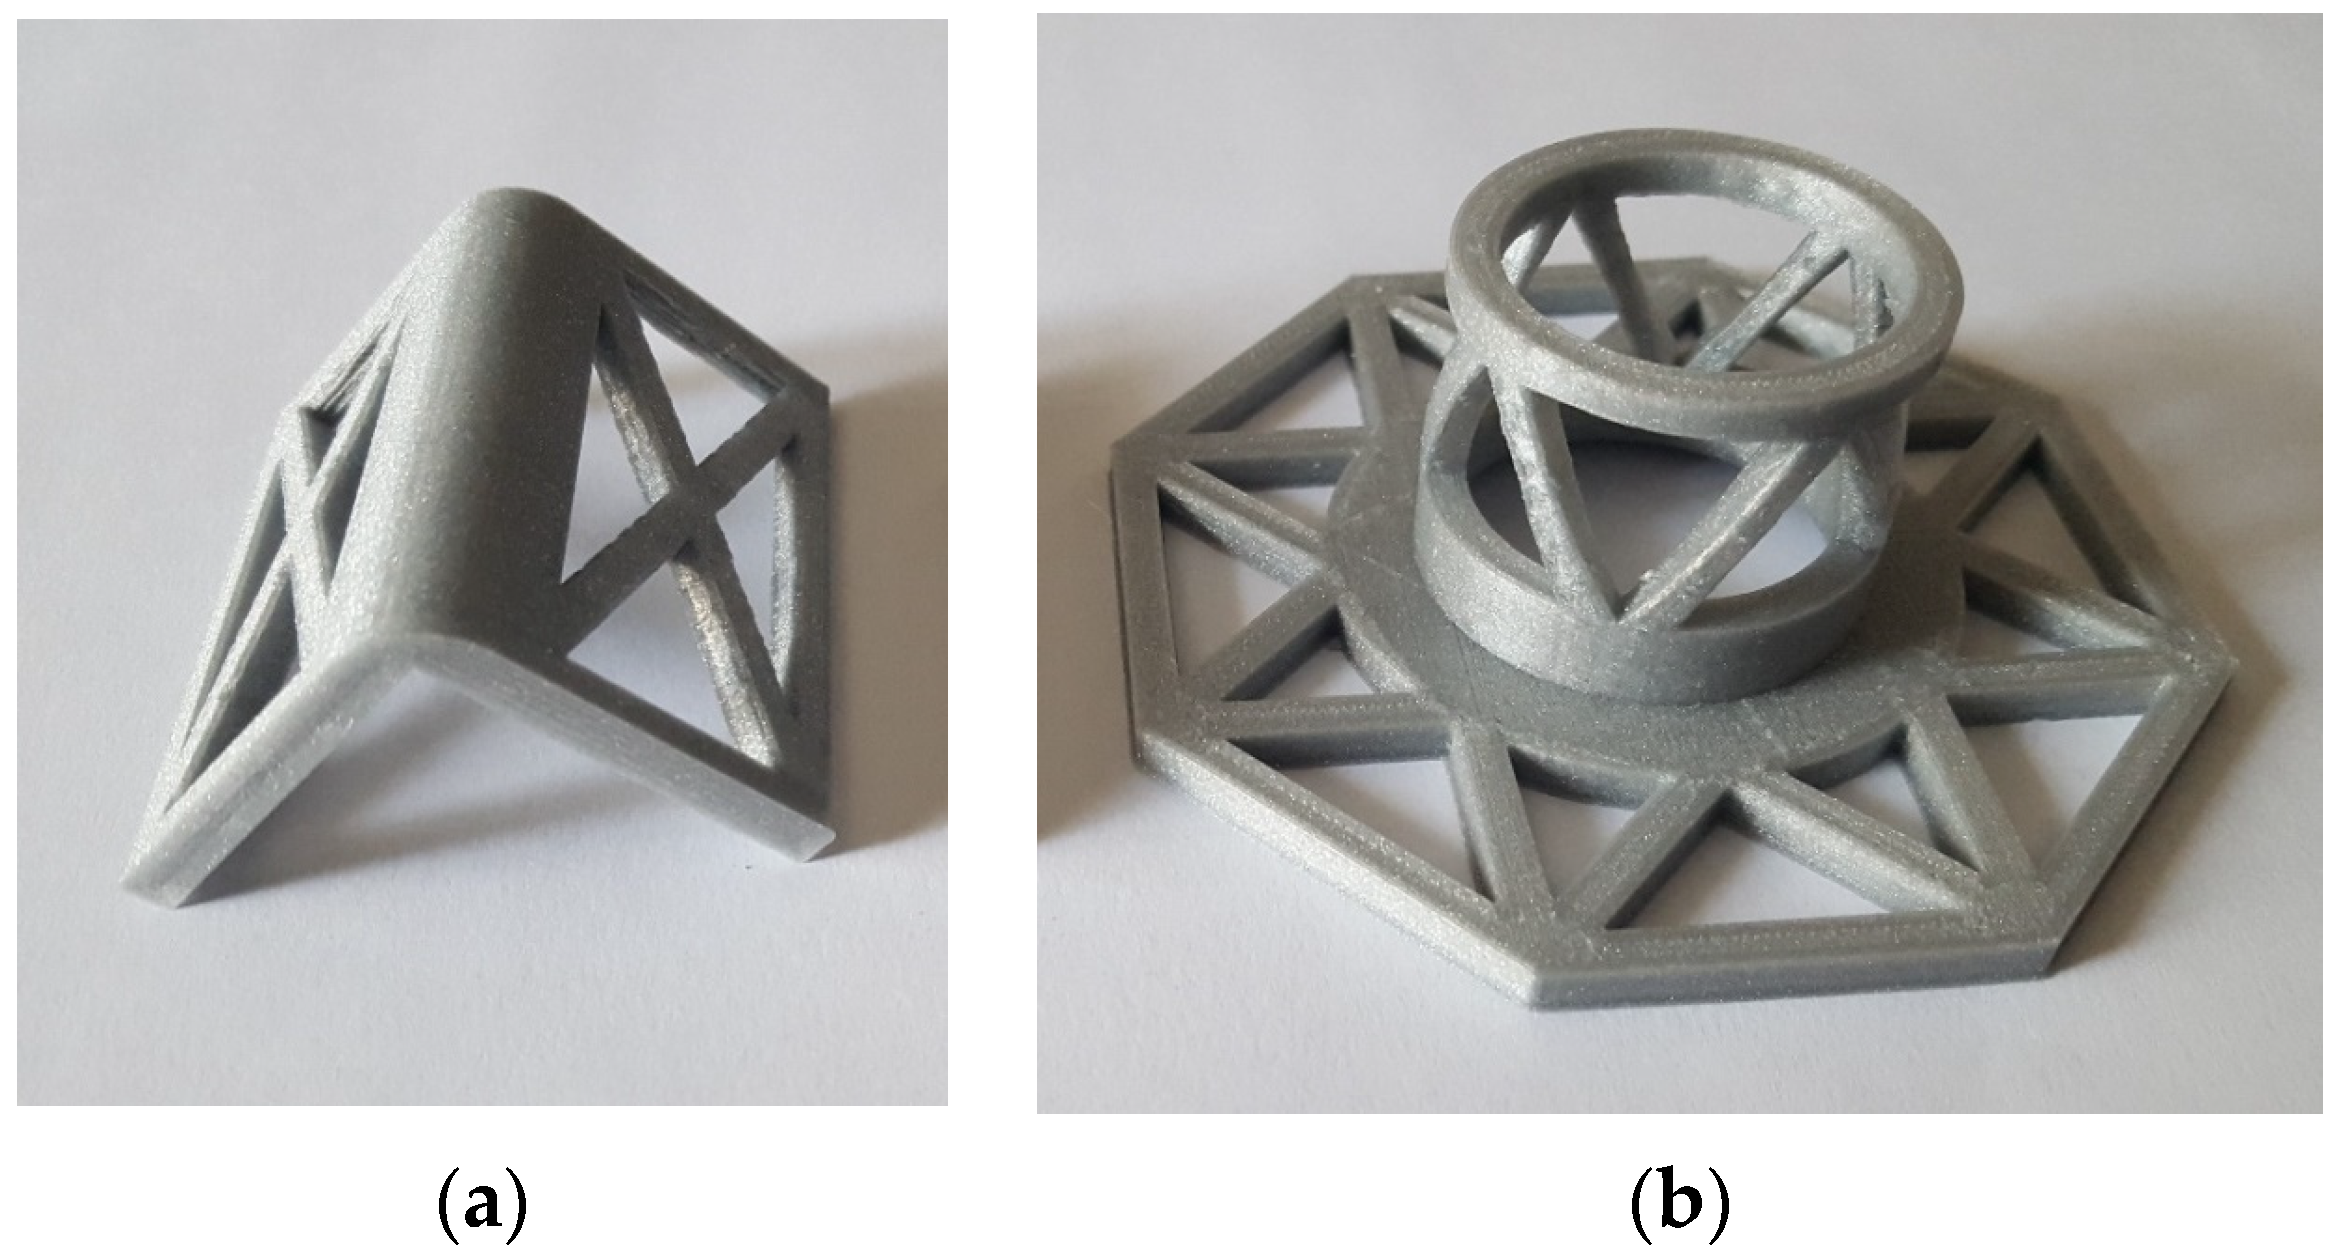
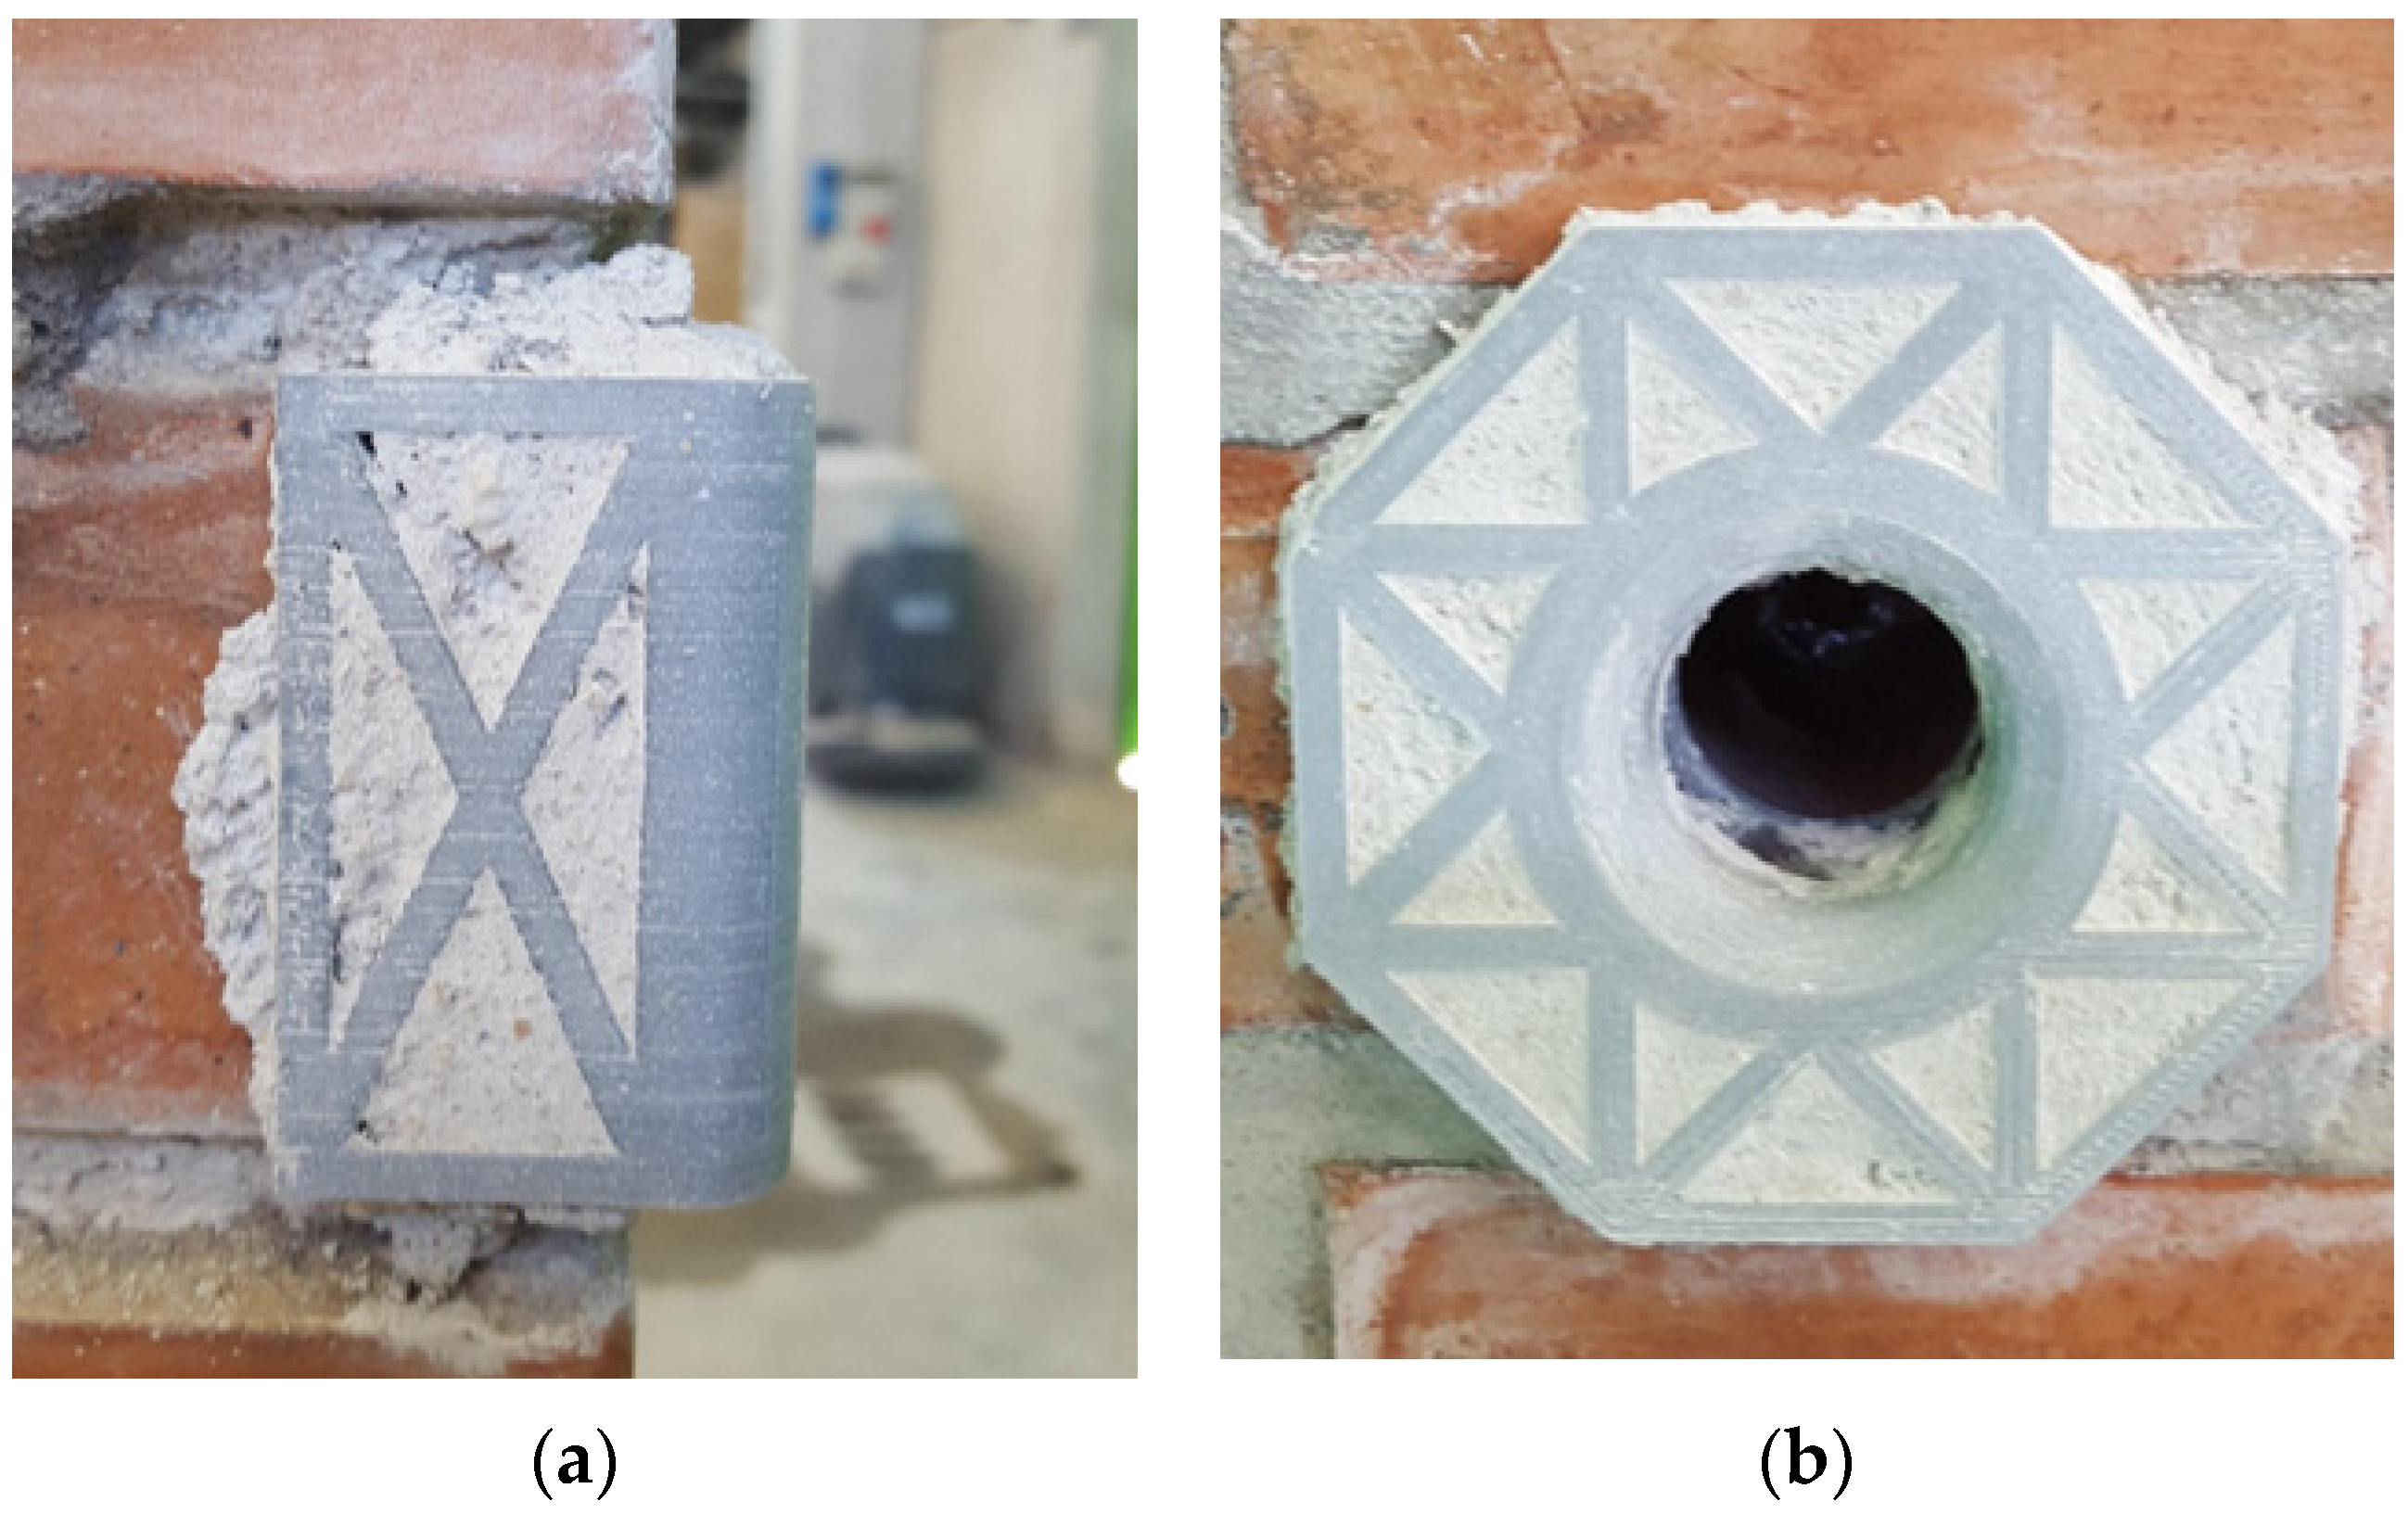
2.1.4. Elements for the Protection of the Edges of Masonry Walls
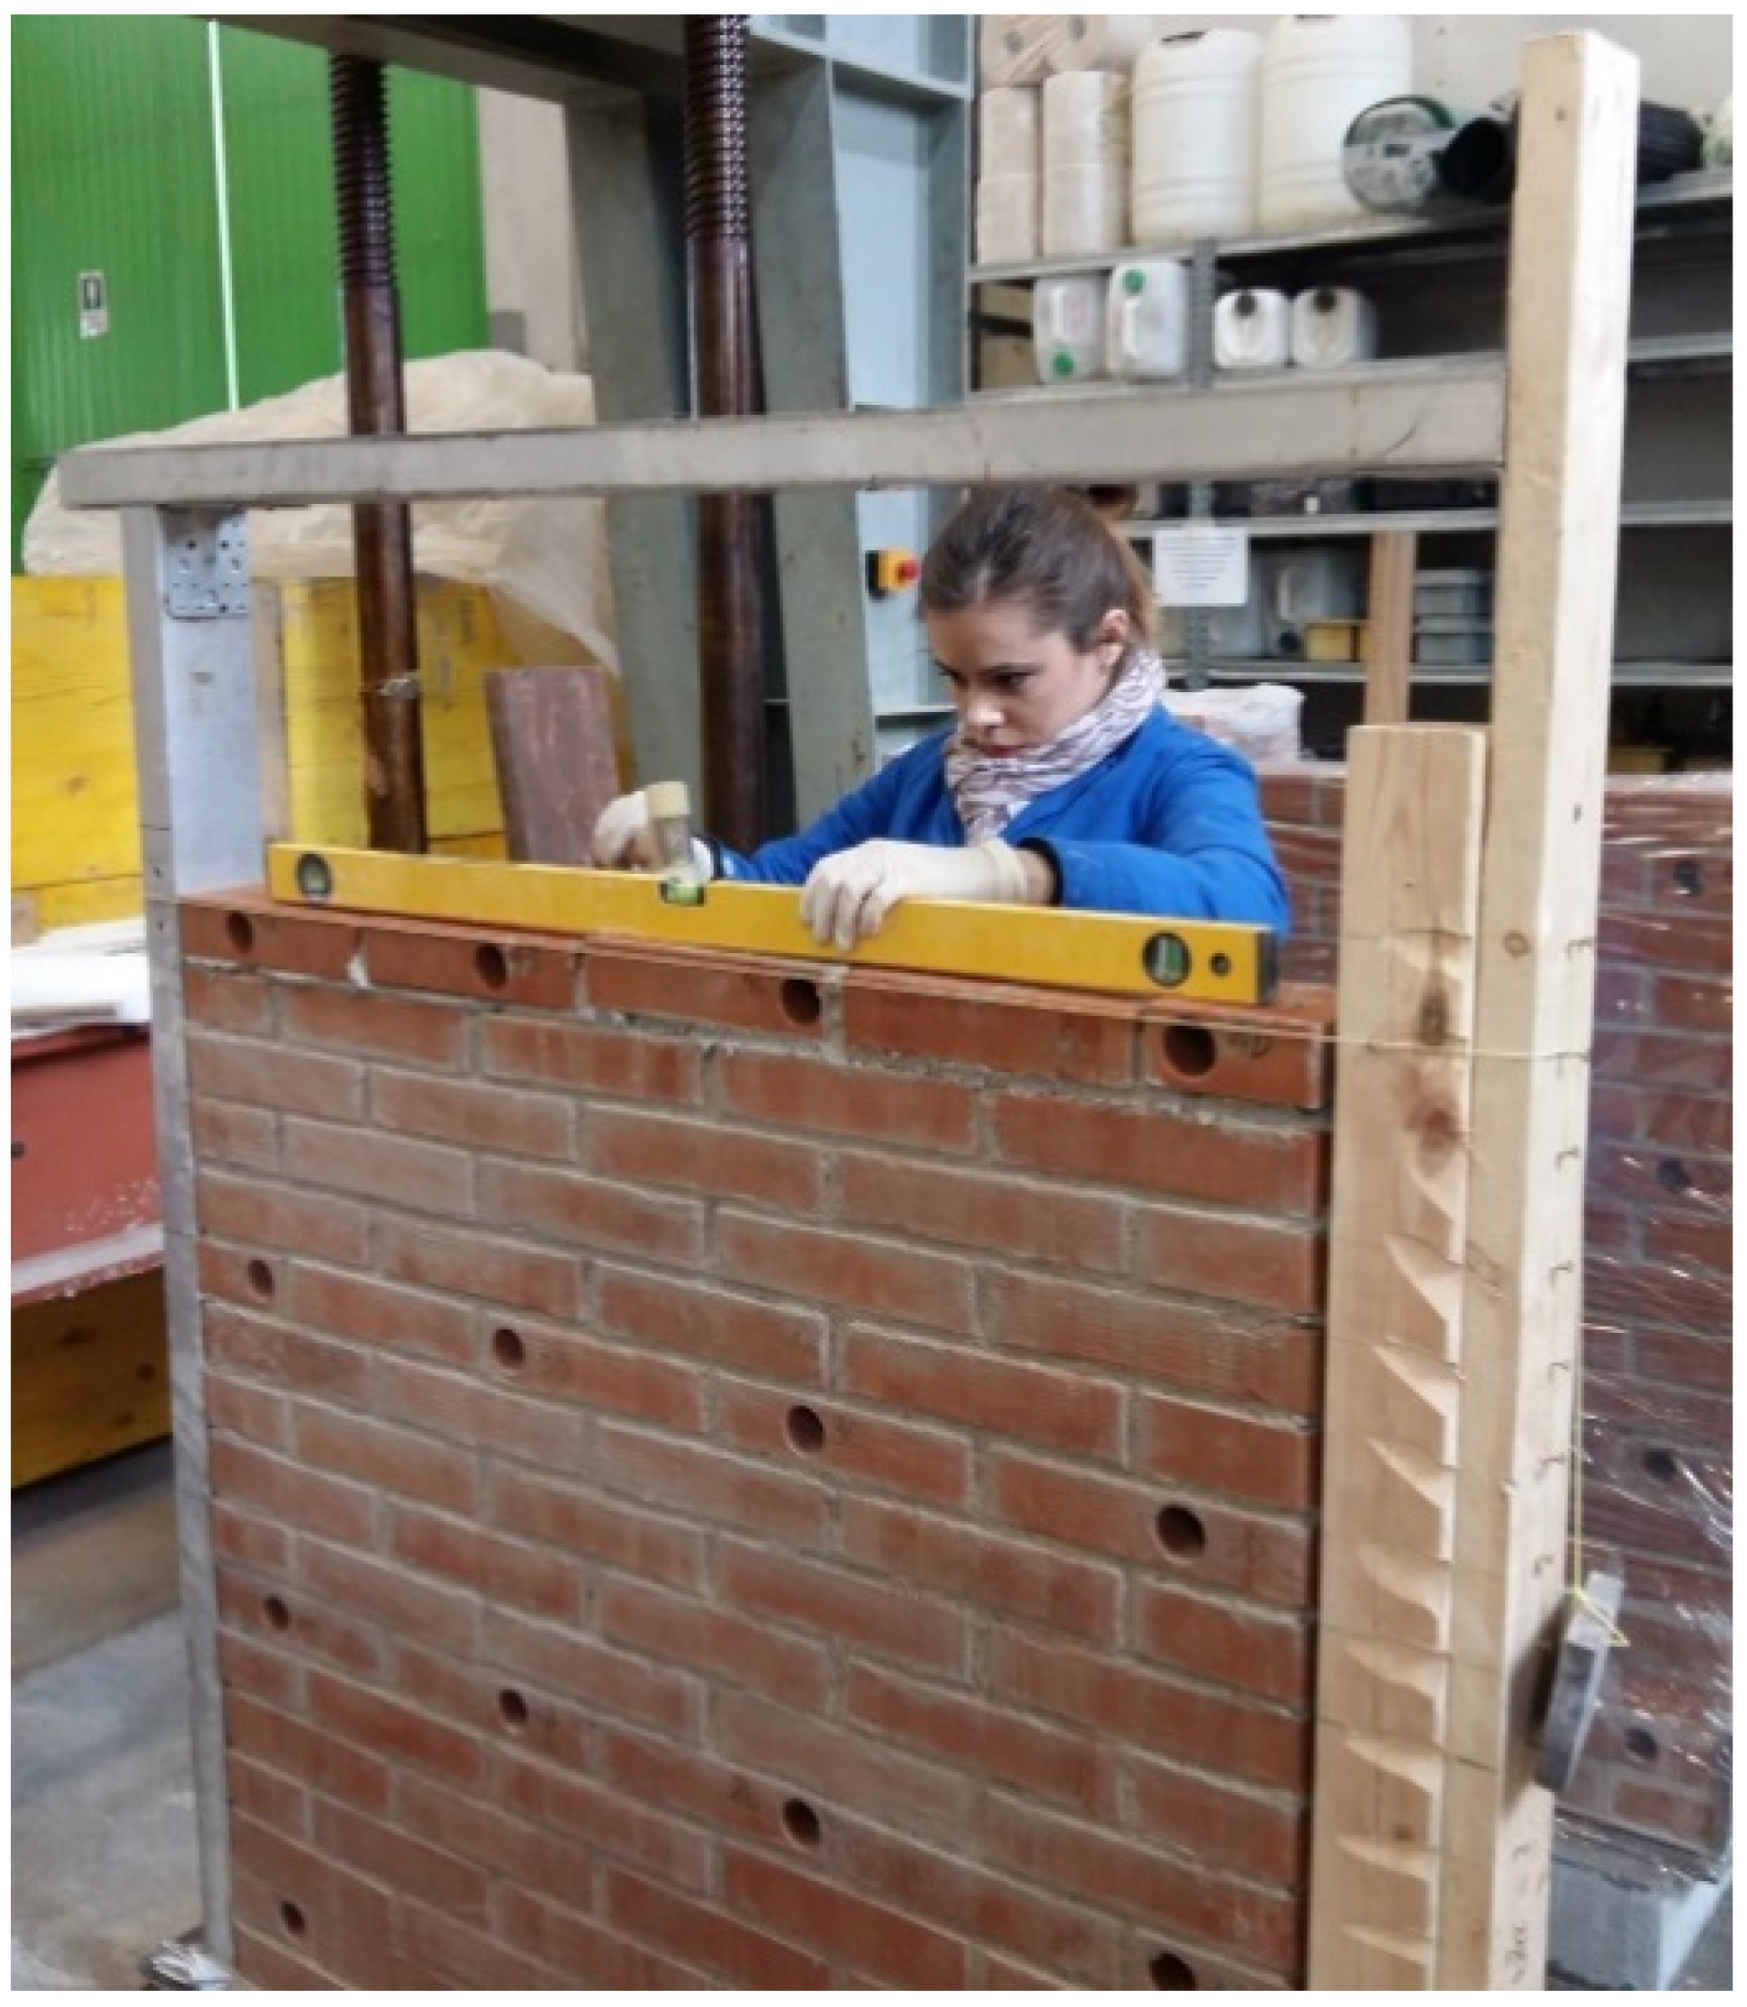
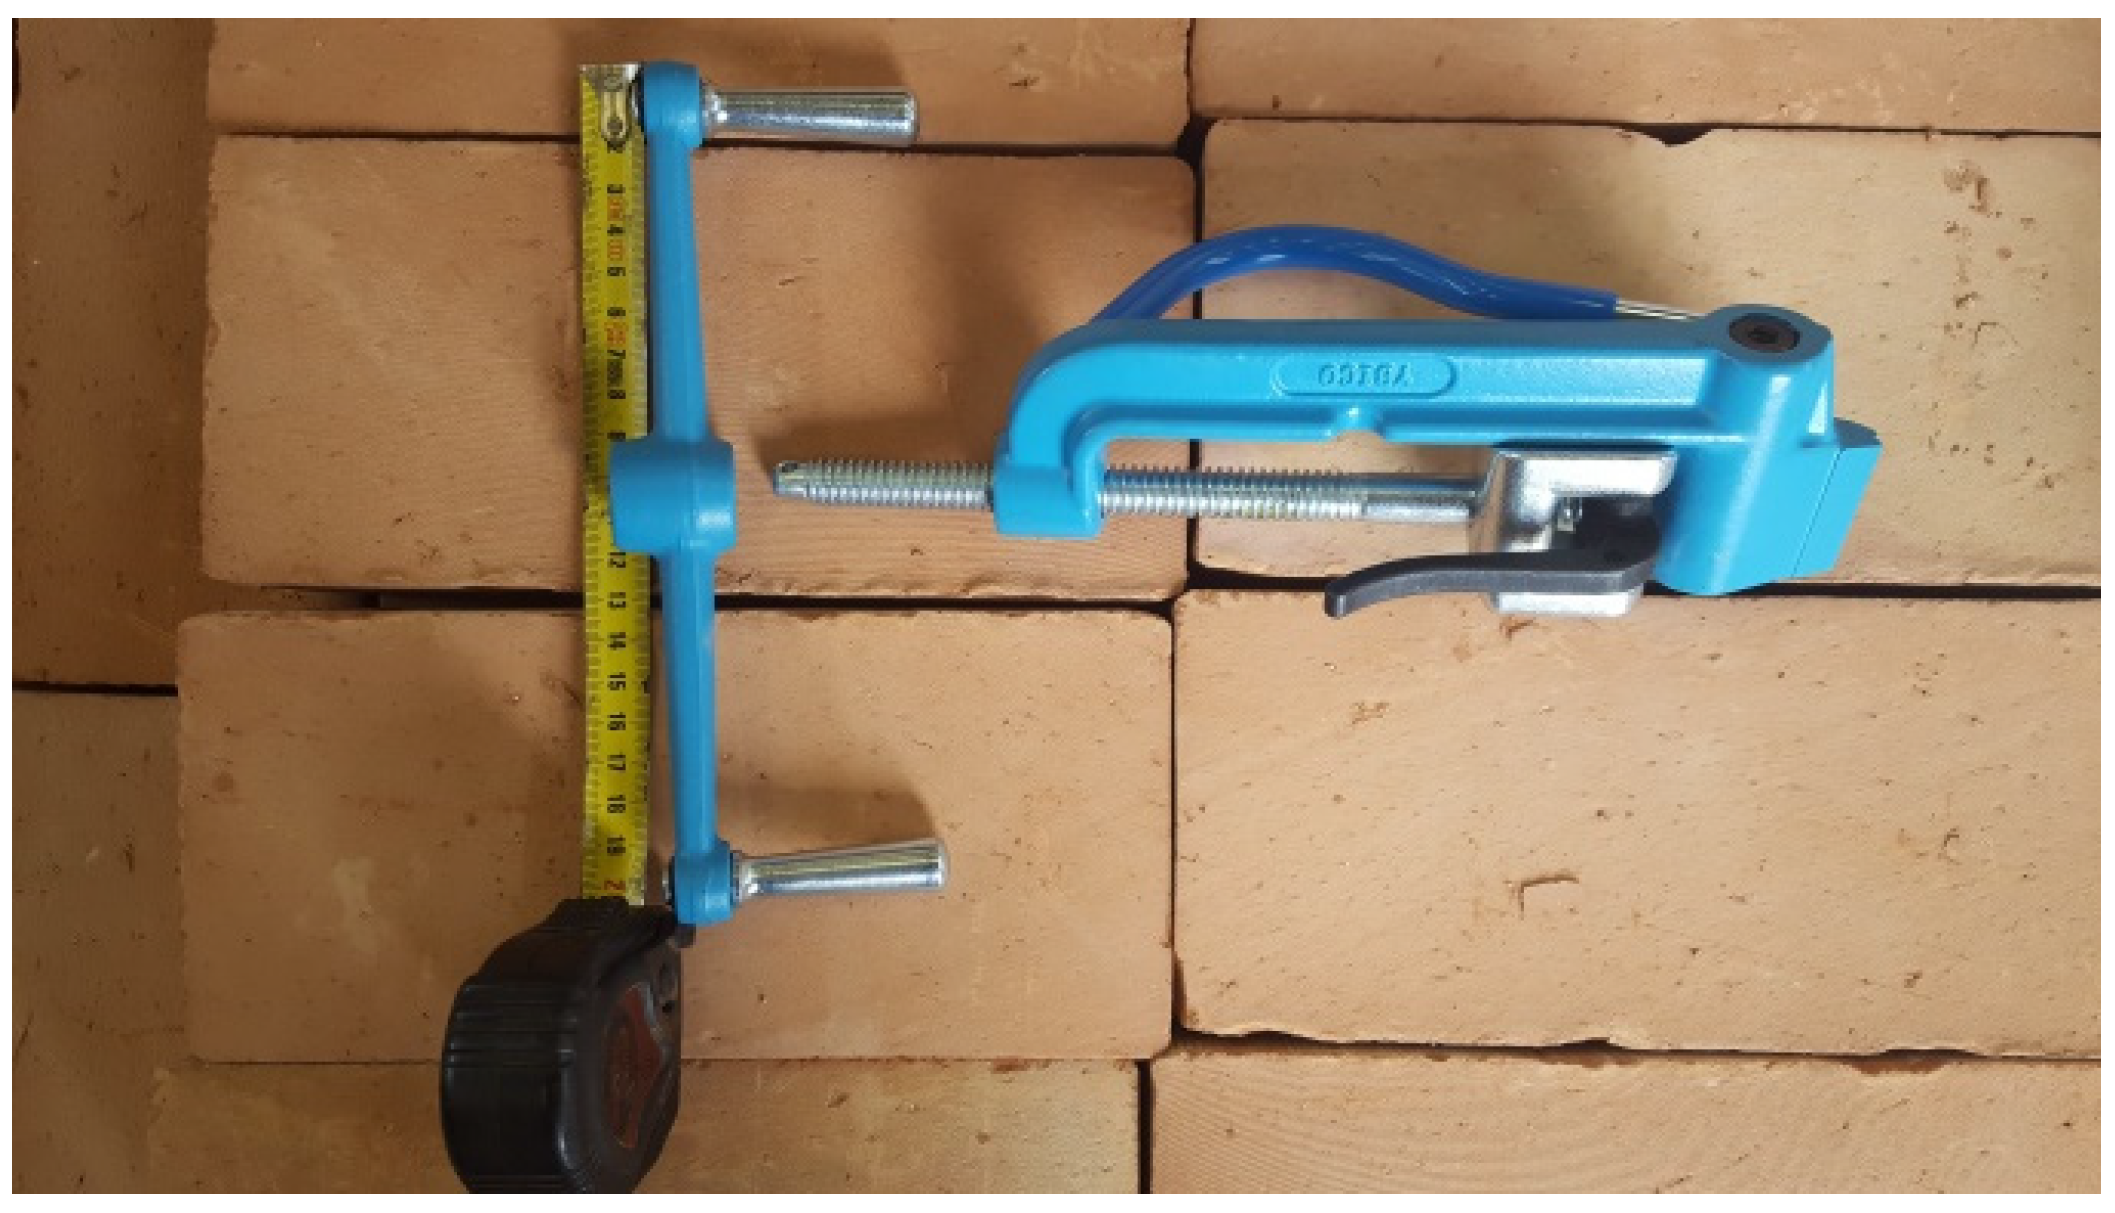
2.2. Preparation of the Specimens
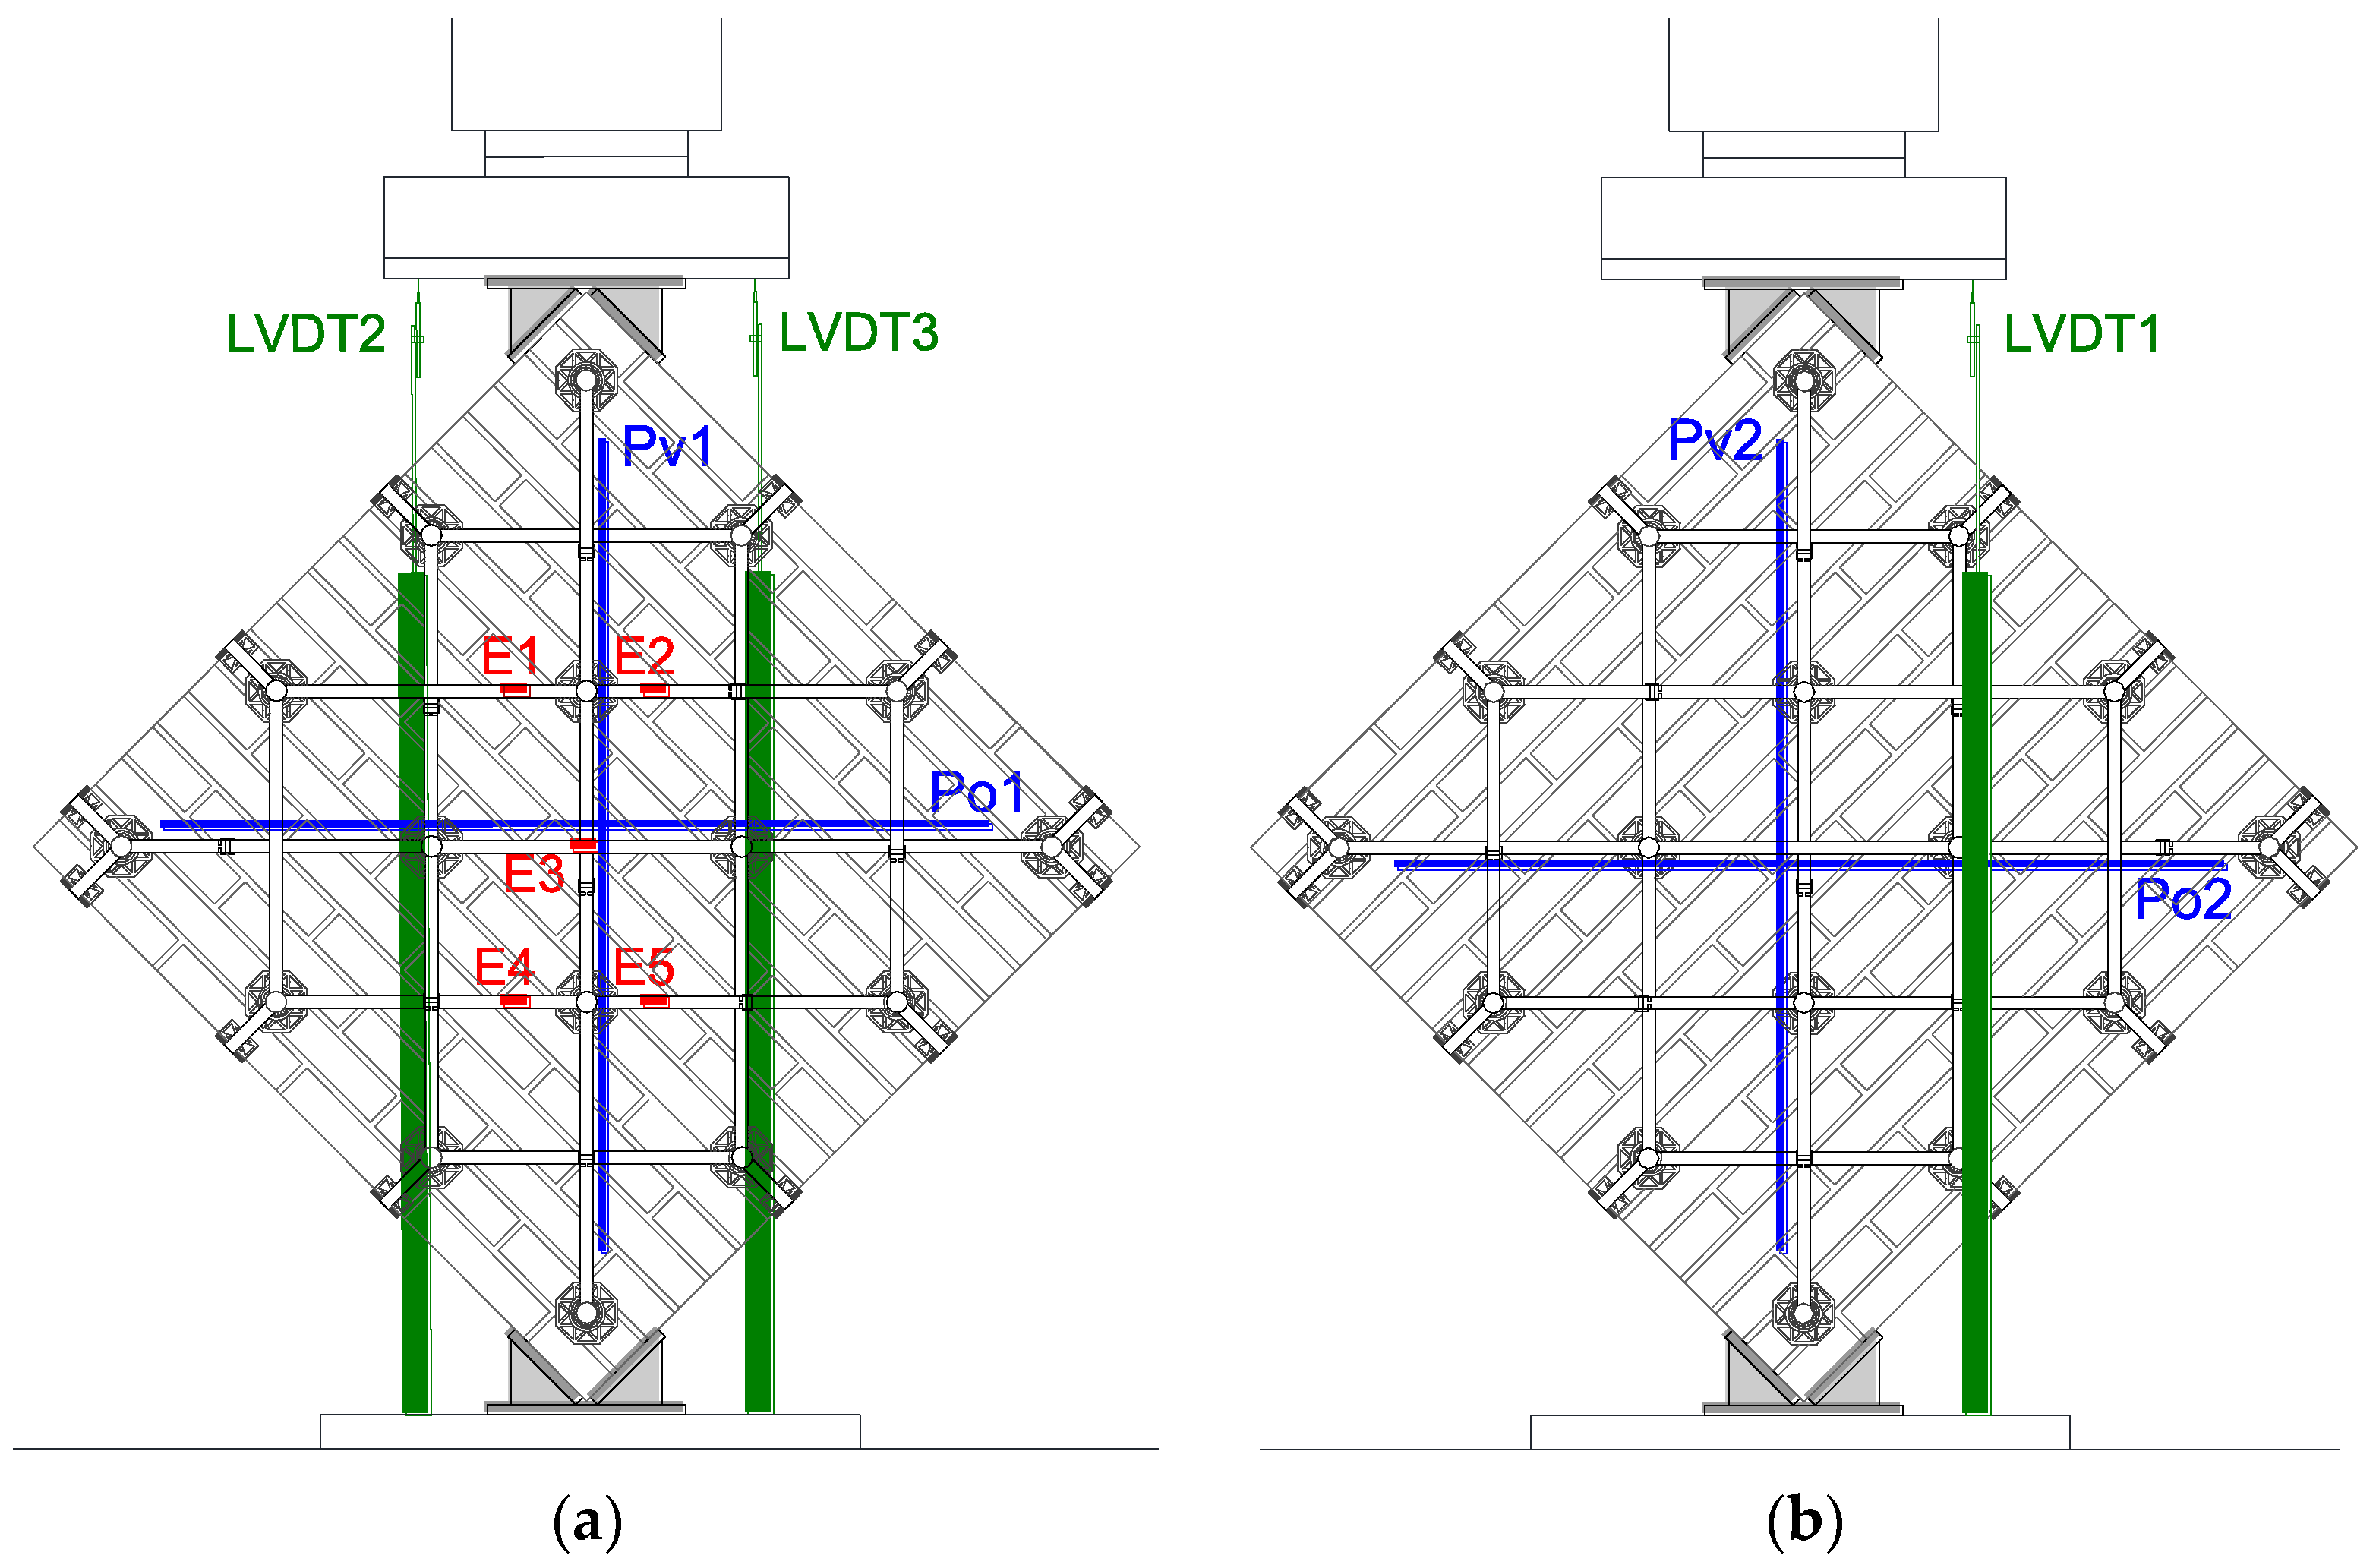
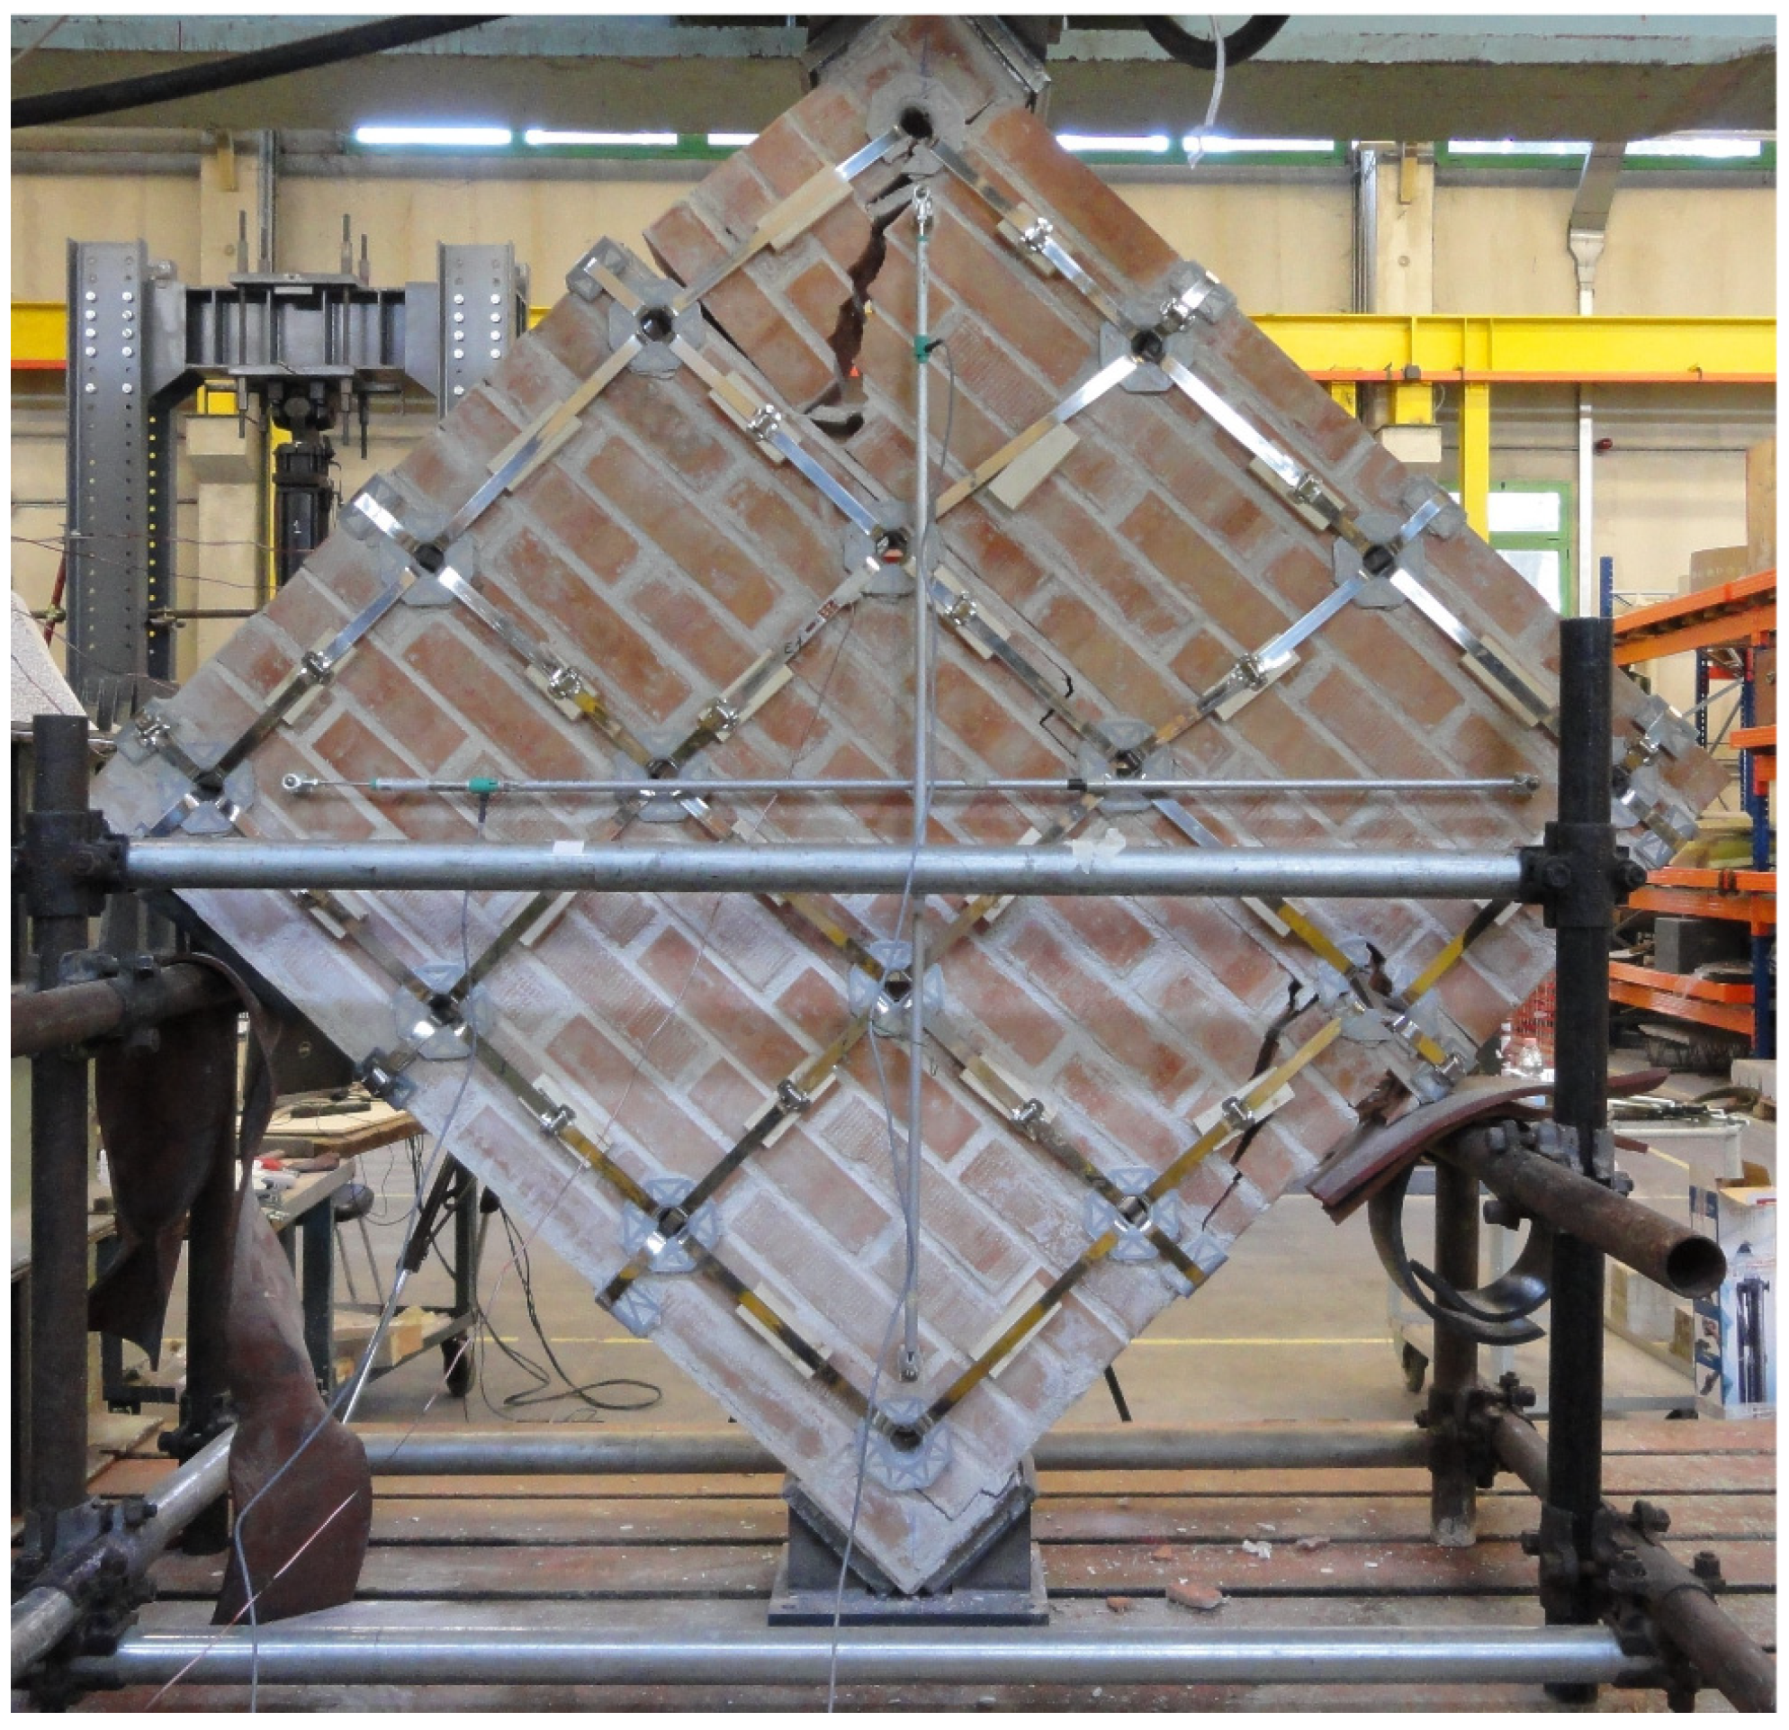
2.3. Instrumentation and Test Setup
- LOSENHAUSEN hydraulic load frame with a load capacity of 200 kN, for specimen M1-90;
- LOSENHAUSEN UBP hydraulic load frame with a load capacity of 600 kN, for specimens M1-45 and M2-45.
- Strain gauges produced by Tokyo Sokki Kenkyujo Co., Ltd. (Tokyo, Japan);
- Potentiometers produced by Gefran SpA (Brescia, Italy);
- Linear variable differential transformers (LVDTs) produced by Gefran SpA (Brescia, Italy).
- is the displacement acquired by LVDT2 (positive values are downward displacements);
- is the displacement acquired by LVDT3 (positive values are downward displacements);
- is the distance between LVDT2 and LVDT3.
- is the displacement acquired by LVDT1 (positive values are downward displacements);
- is the distance between LVDT1 and LVDT2.
3. Failure Mode of the Specimens
3.1. Specimen M1-90
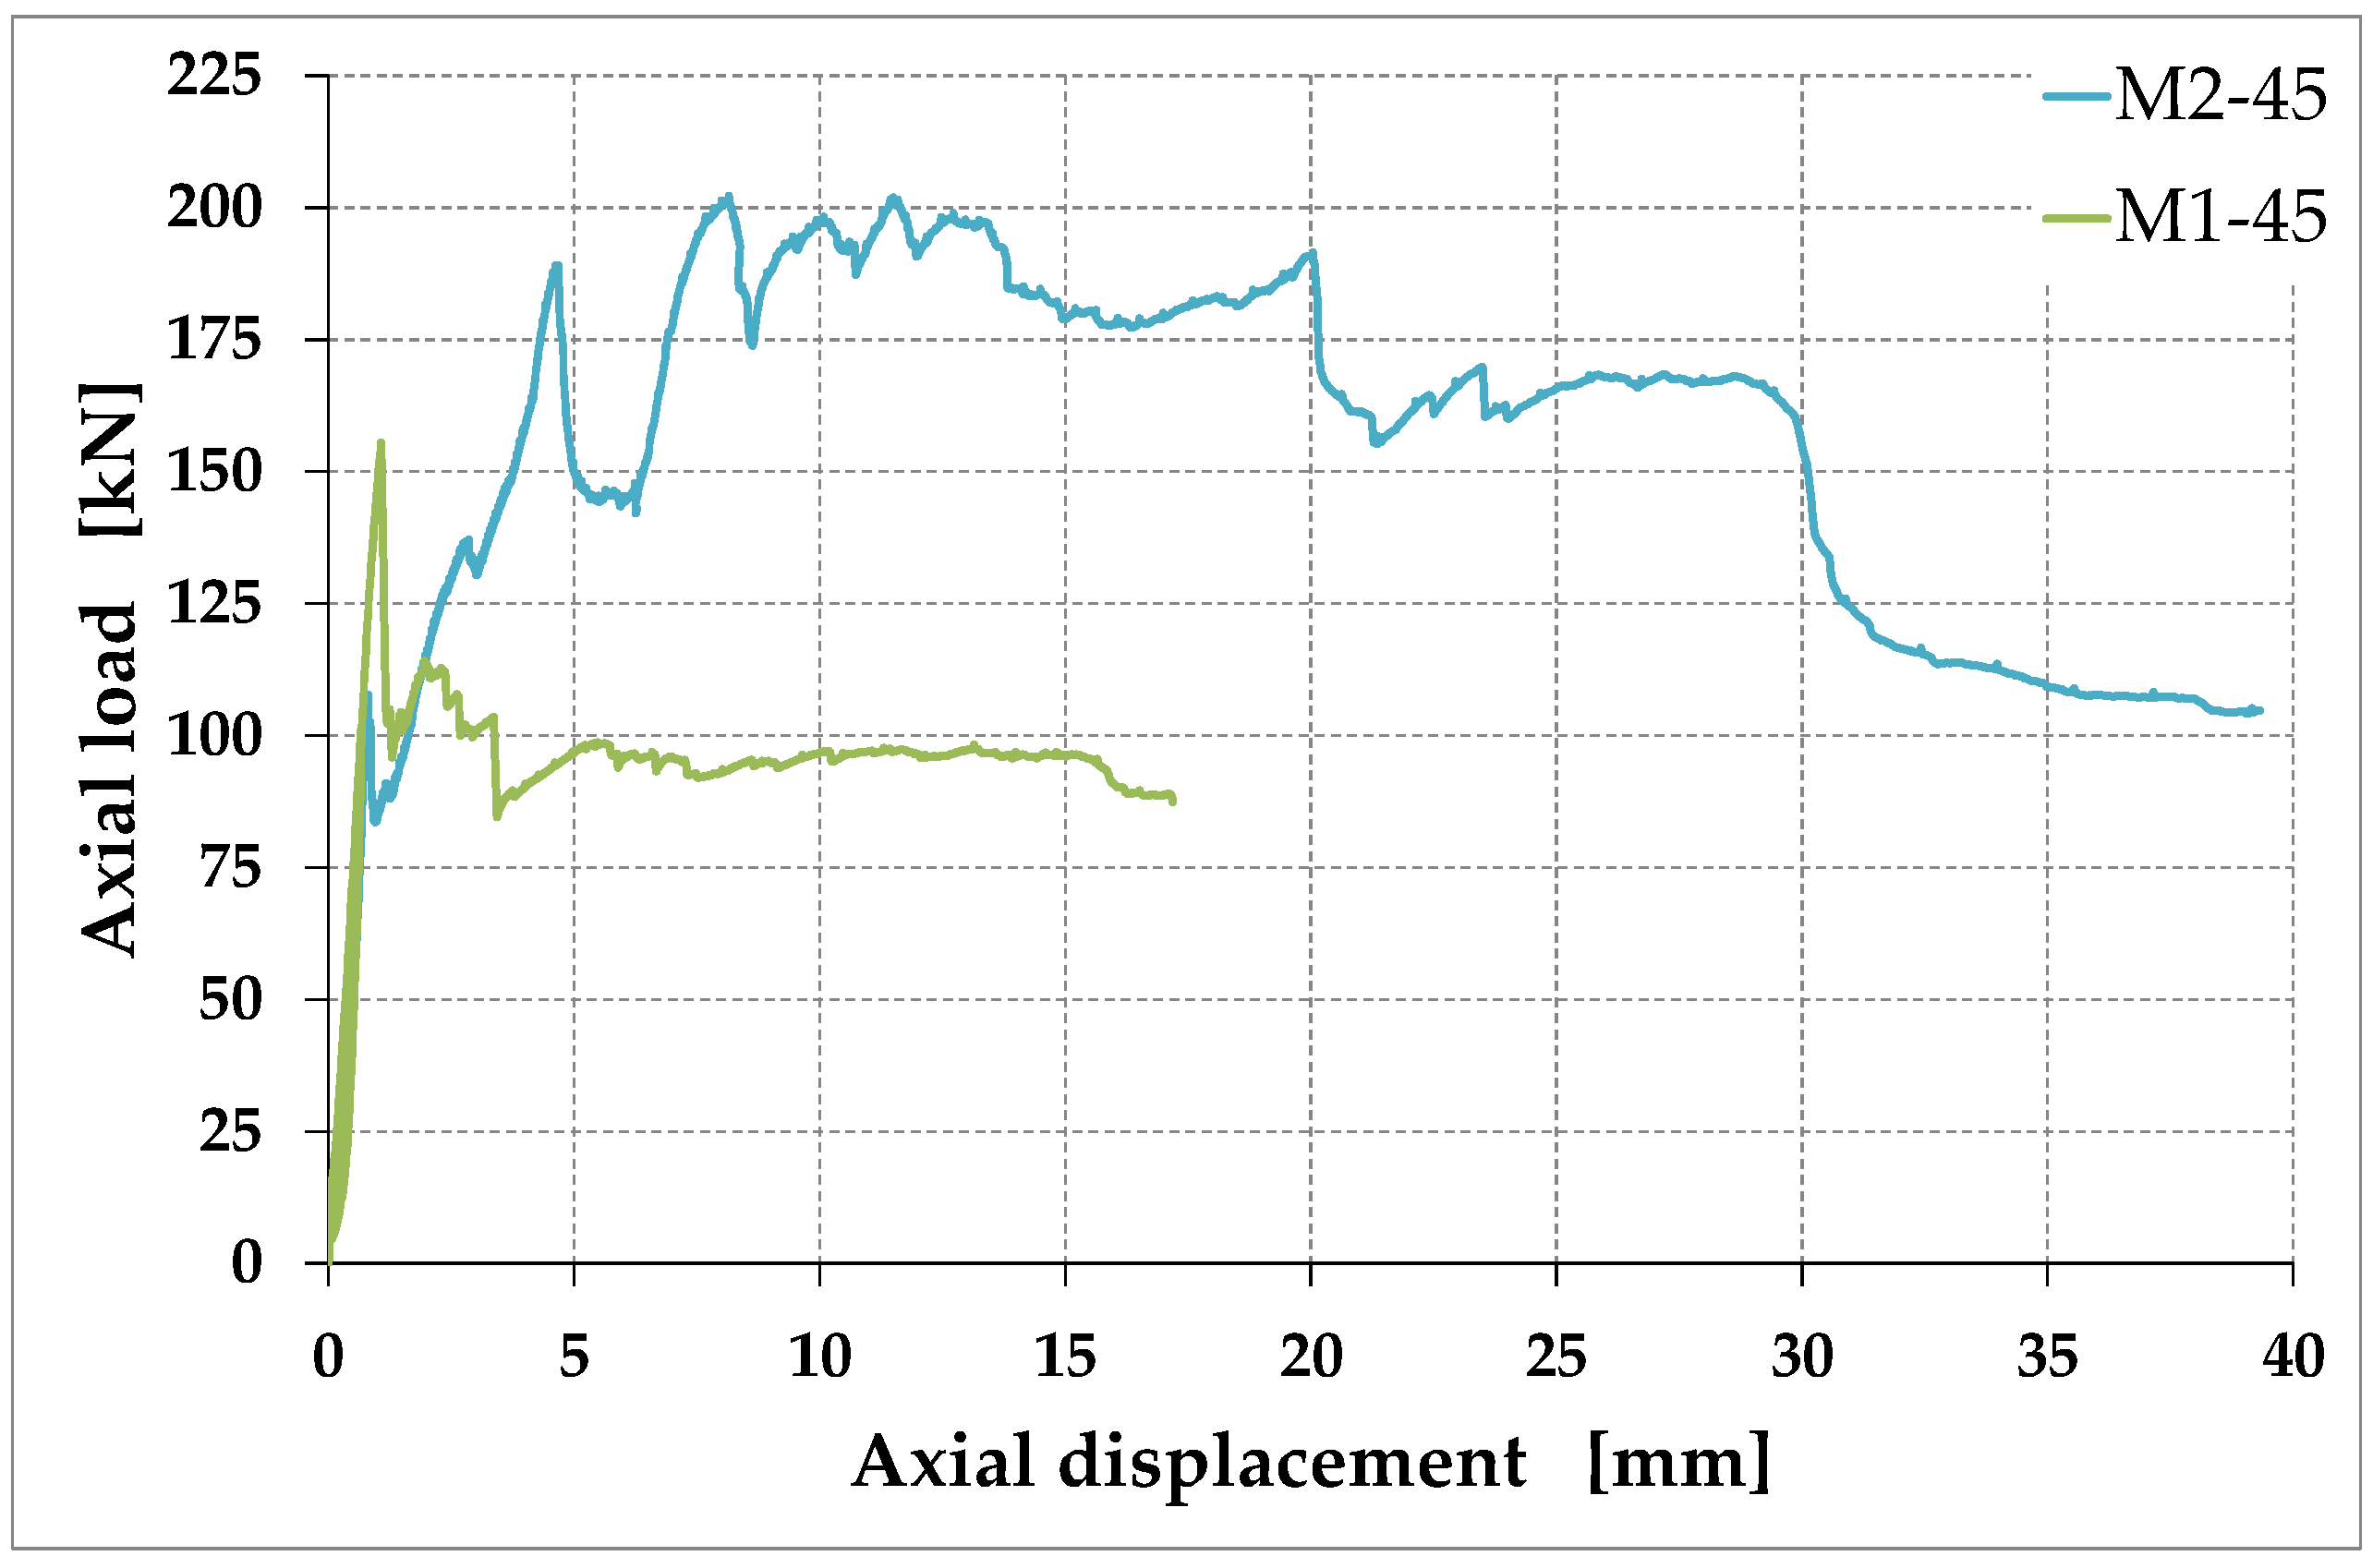
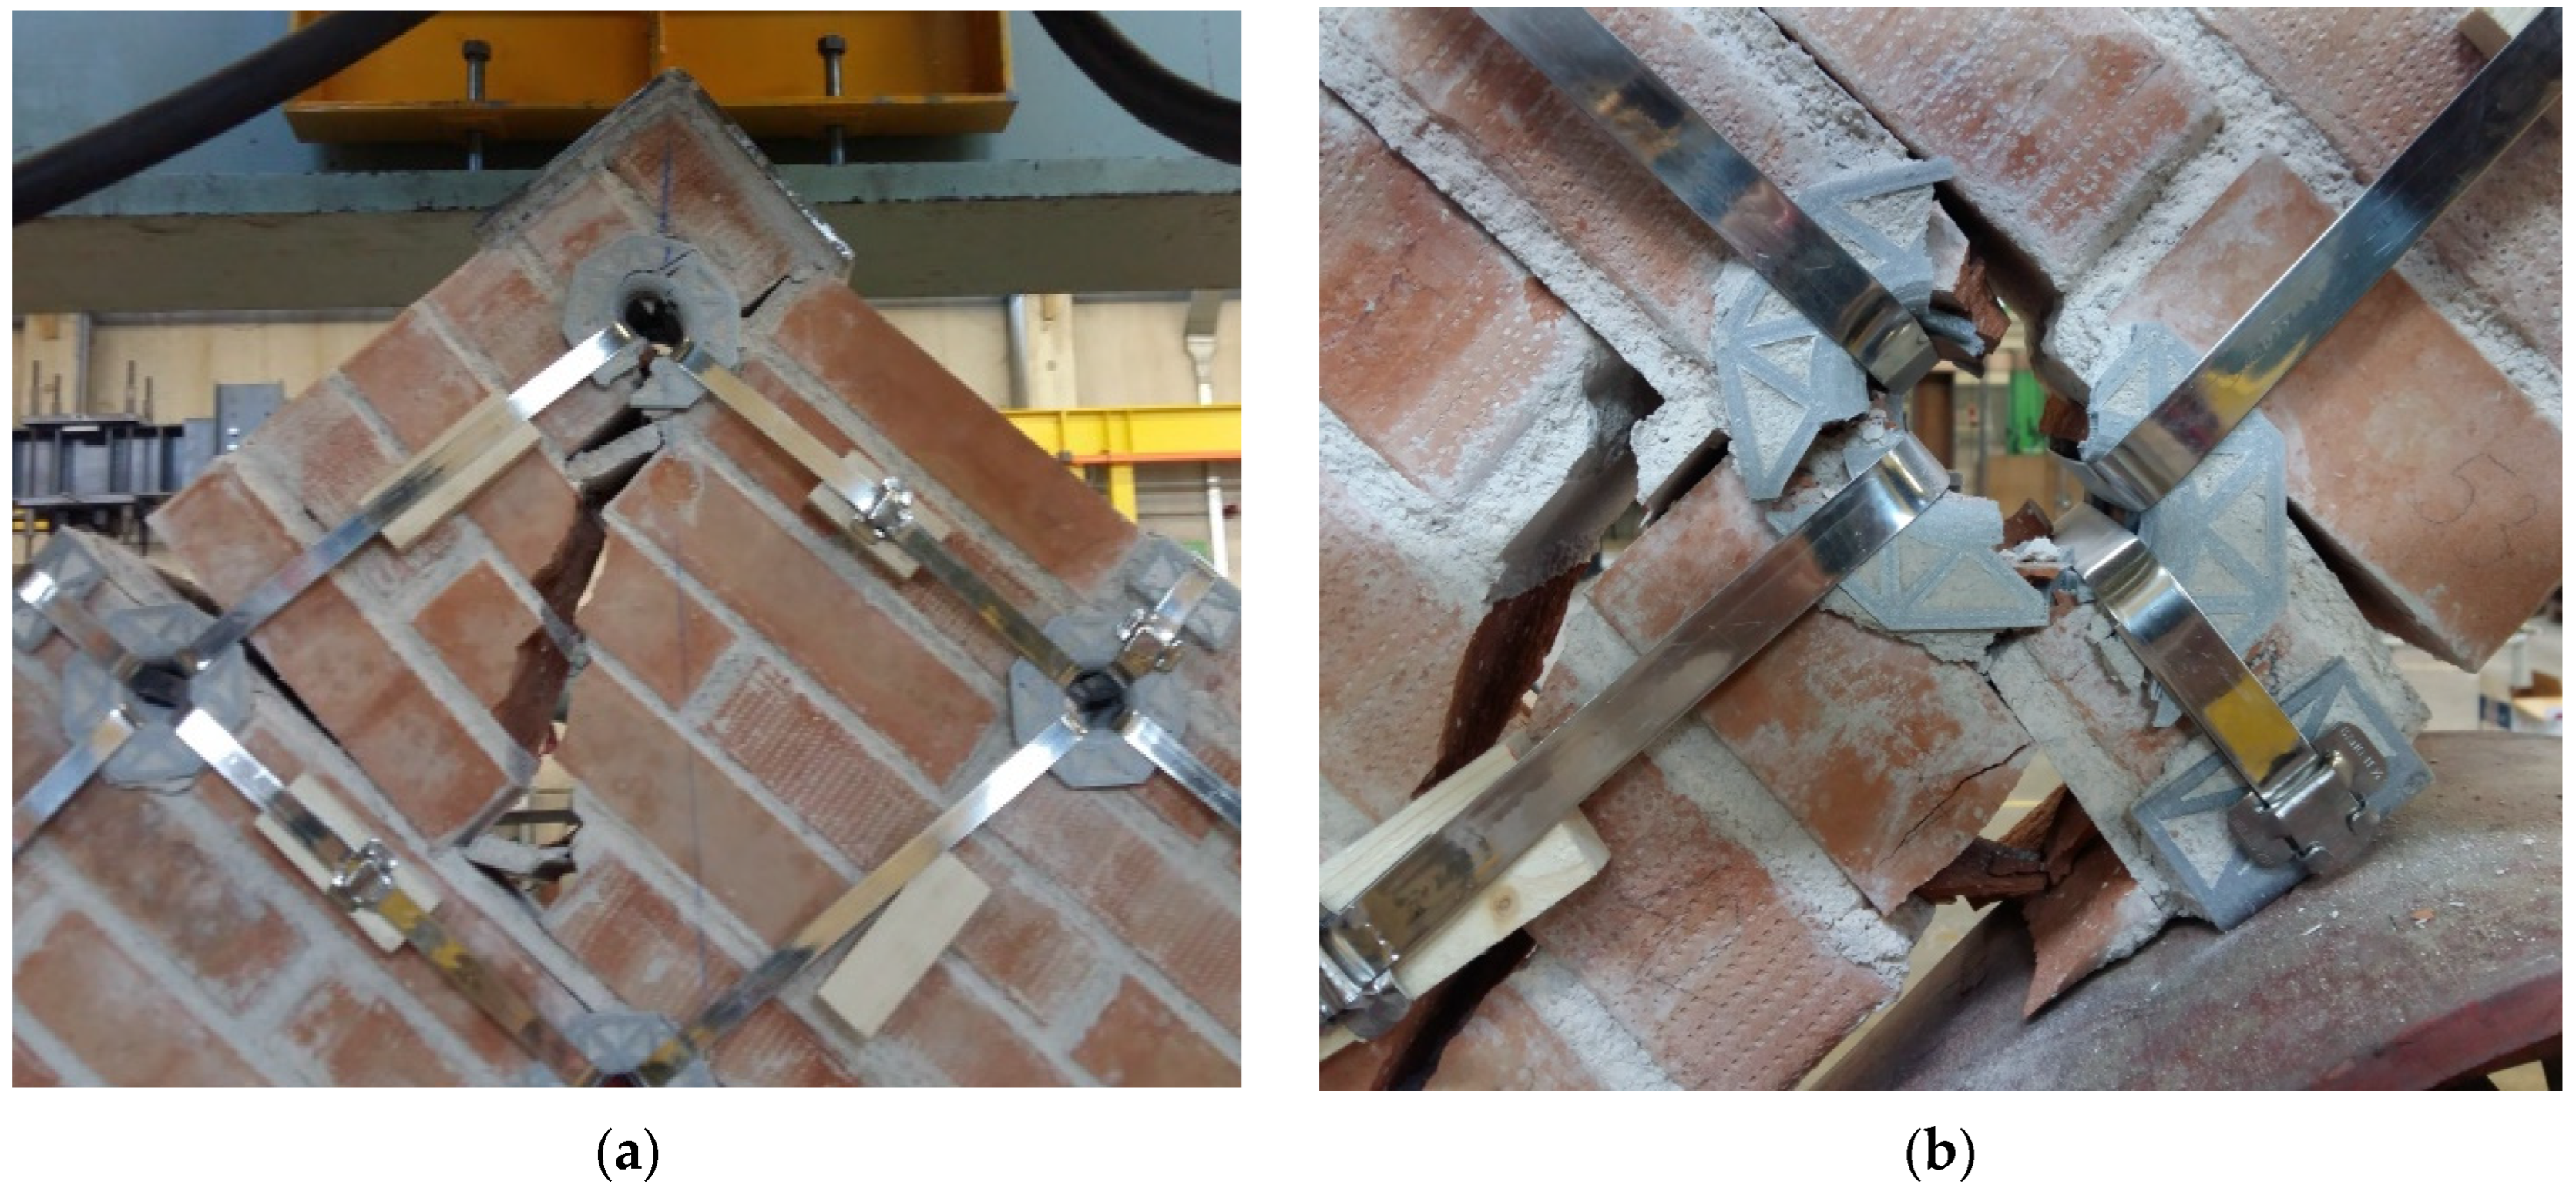
3.2. Specimen M1-45
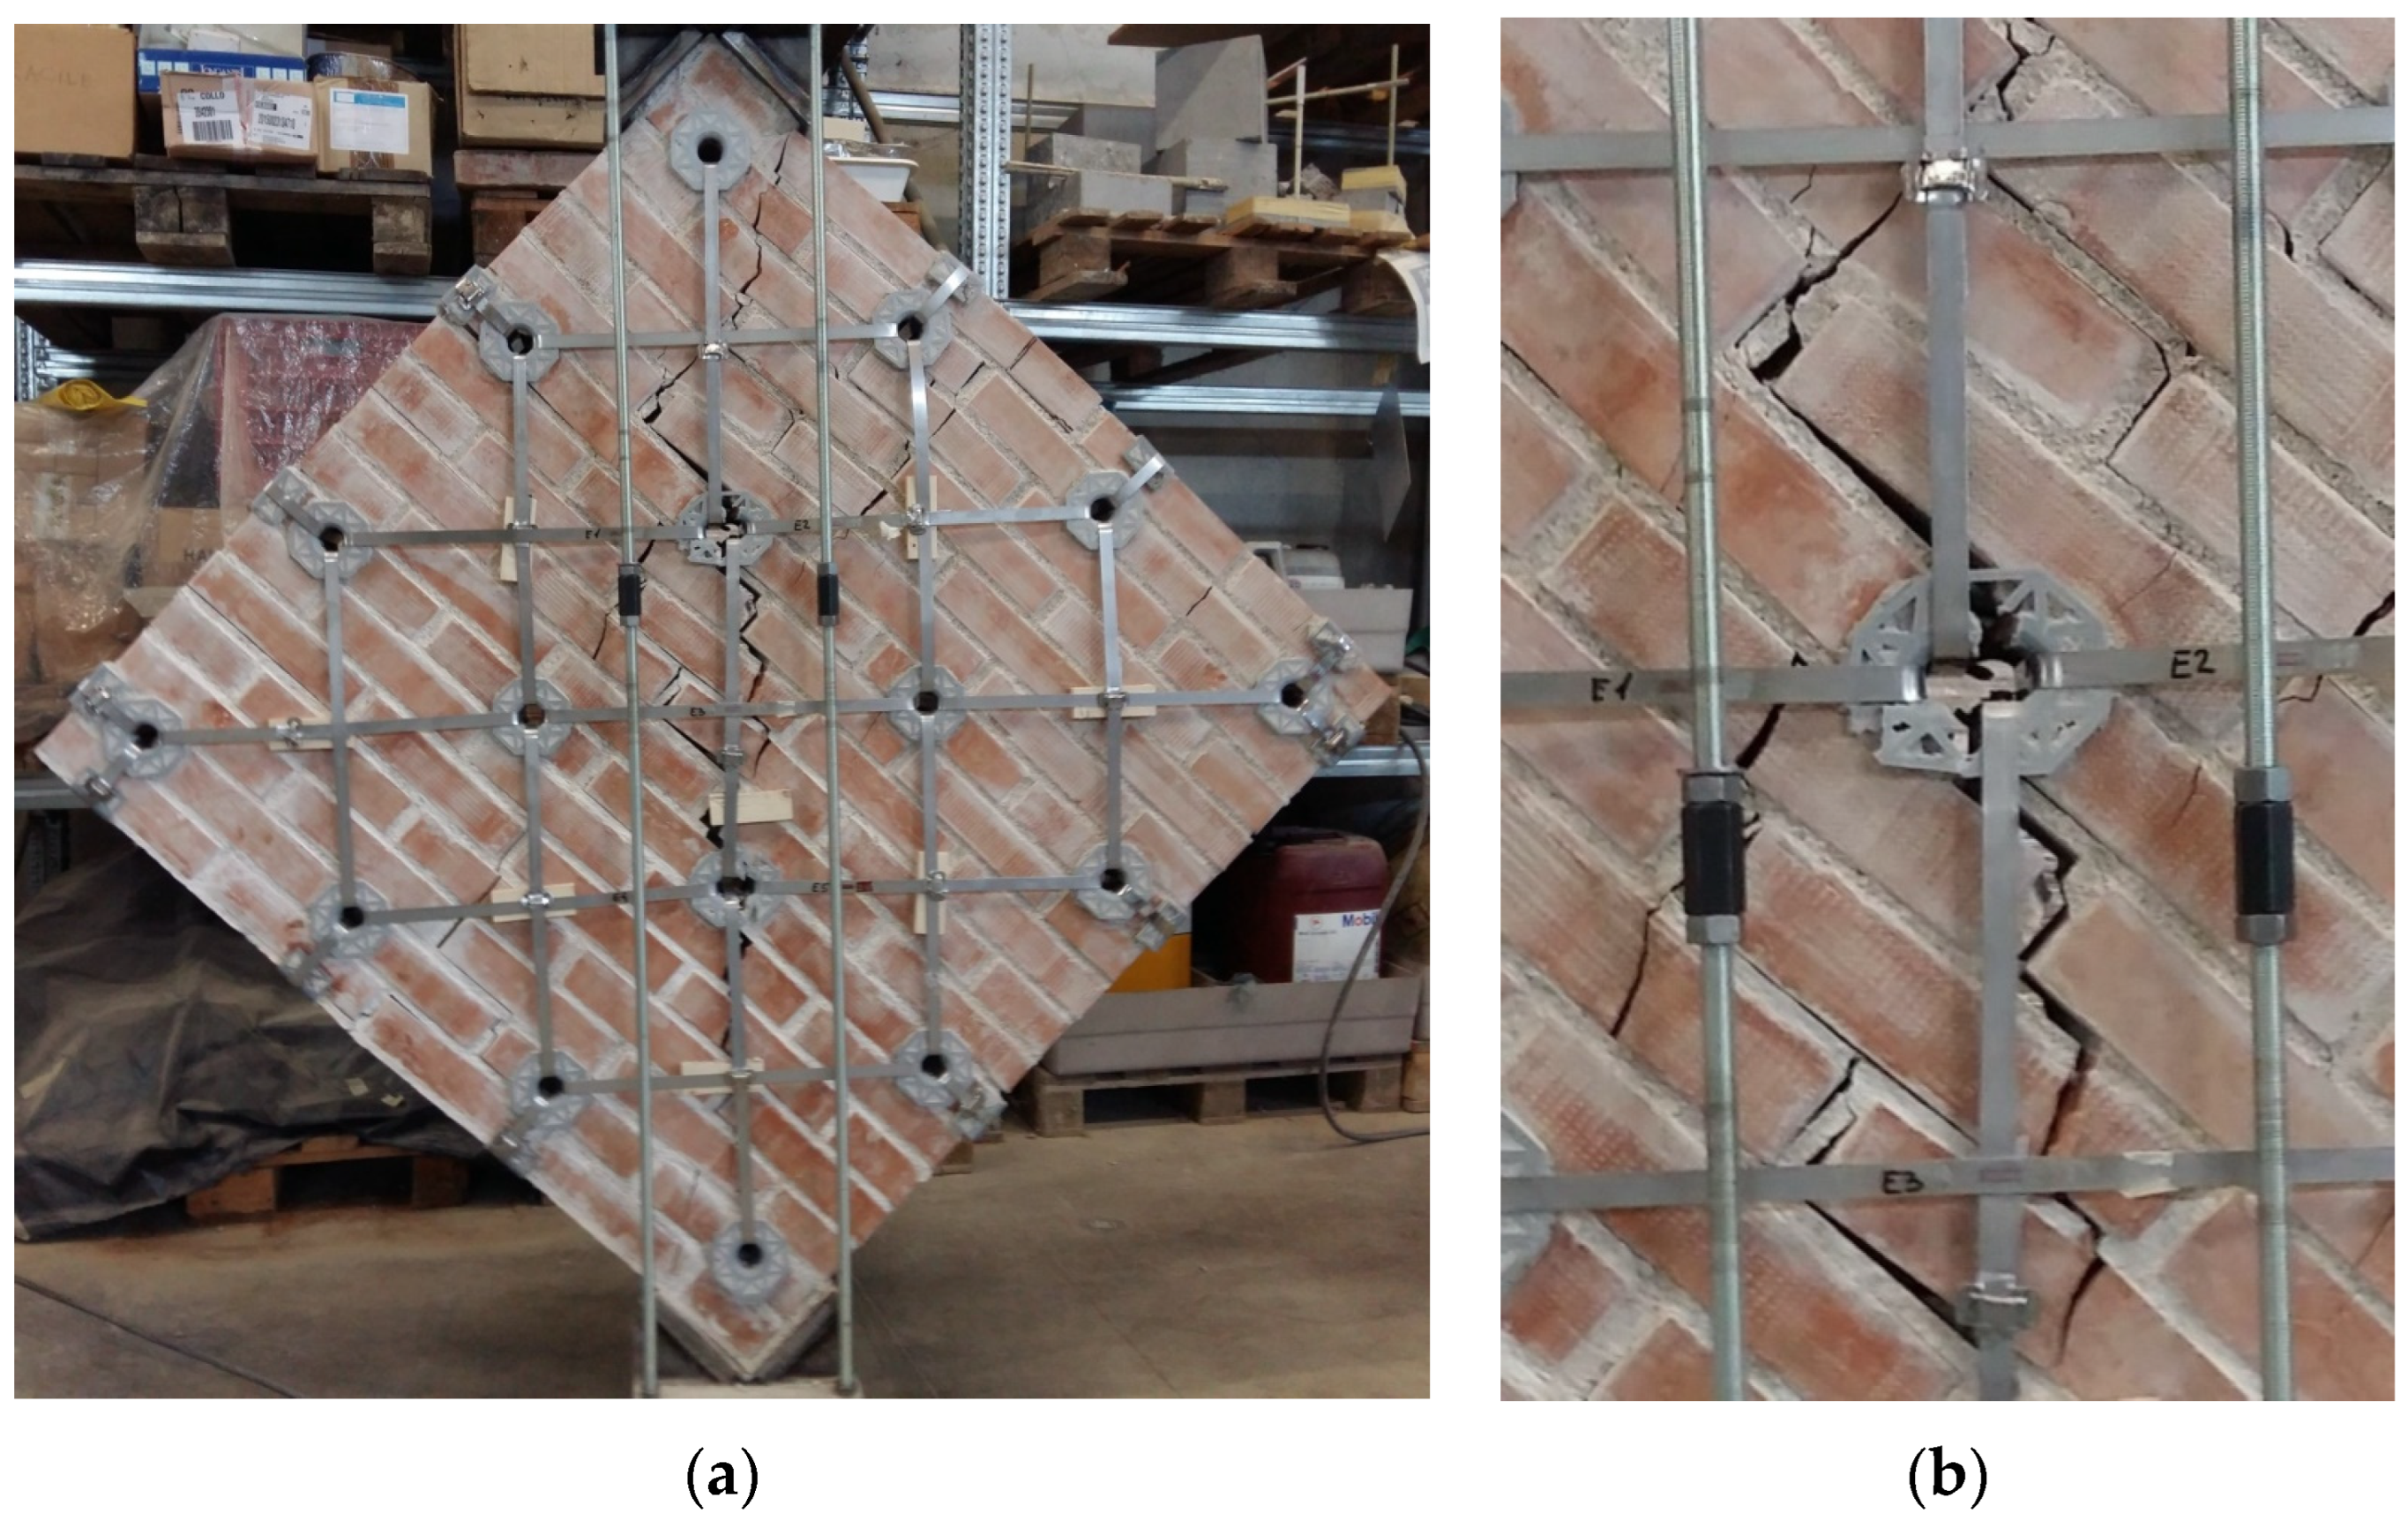
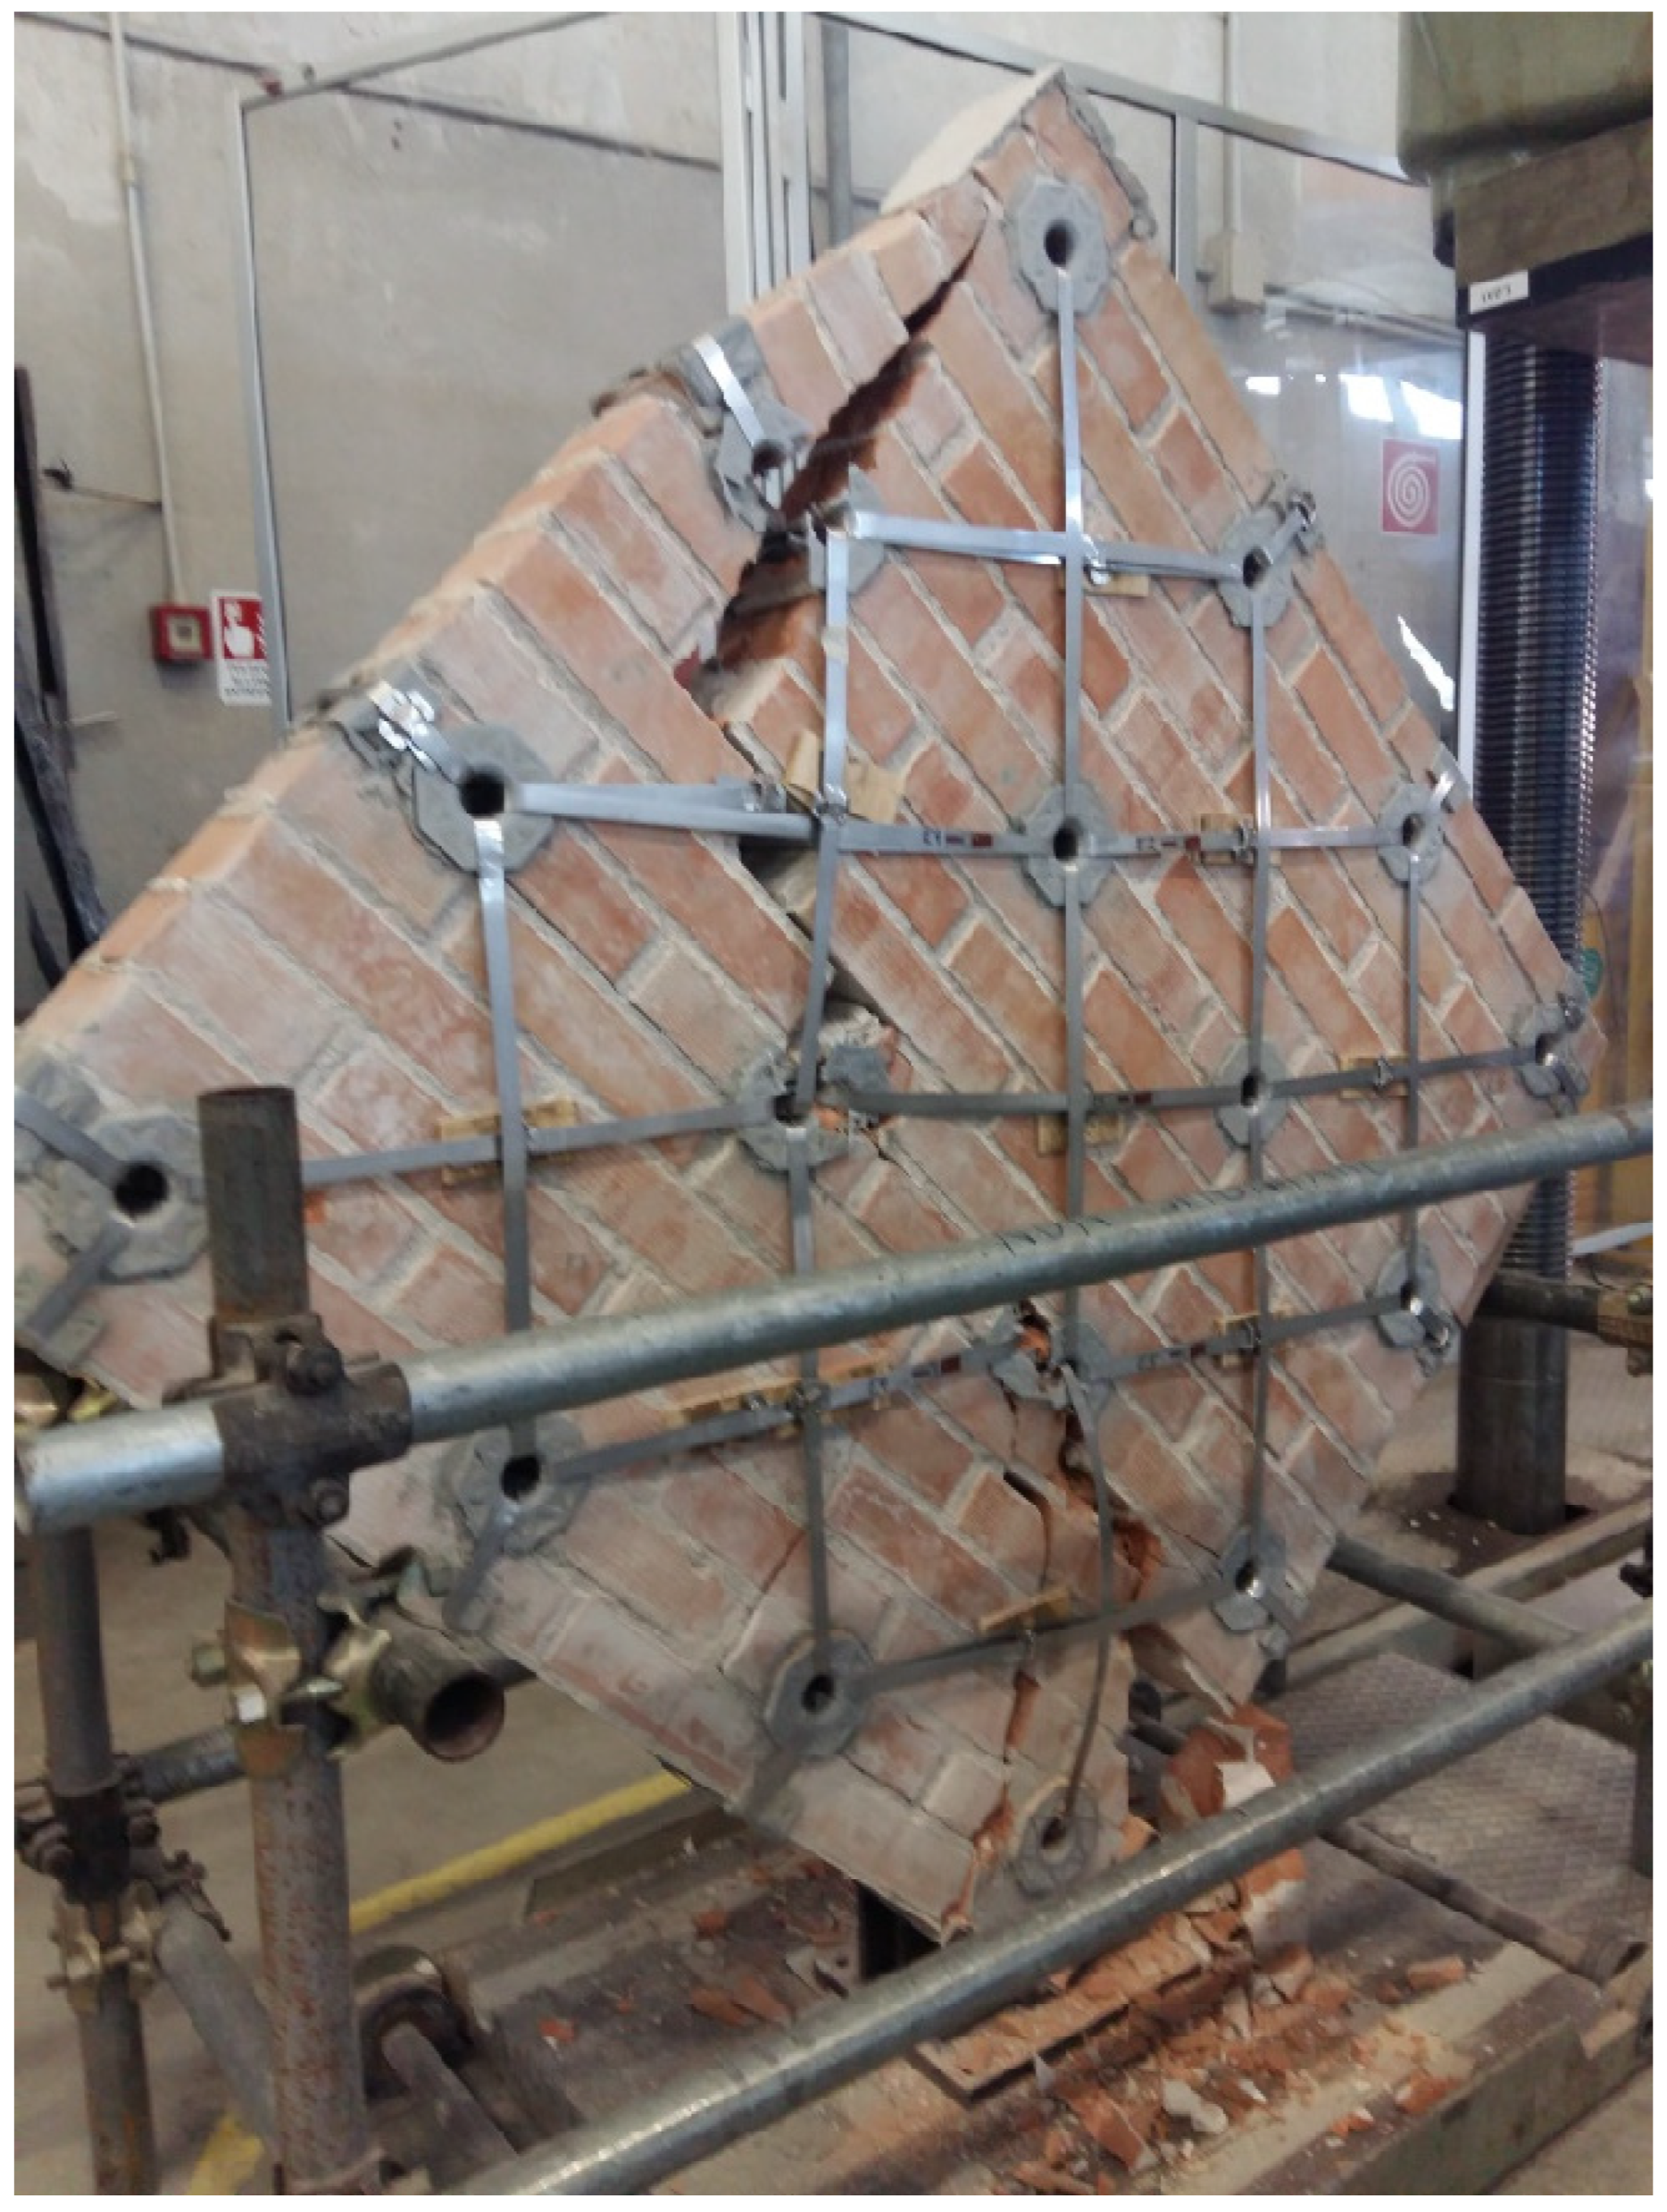
3.3. Specimen M2-45
- No primary cracks opened along the compressed diagonal;
- The maximum load () increased by 30% compared to the maximum load of specimen M1-45 ();
- The high load values and the lack of cracks along the compressed diagonal meant that the failure occurred due to a combination of the punching effect of the load heads and boundary effects (Figure 27).
4. Analysis of the Results
- is the absolute value of the diagonal compression load, , at collapse;
- is the net transversal area of the specimen.
4.1. Shear Stress/Shear Strain Curves
- is the shortening in the direction parallel to loading (vertical direction);
- is the extension in the direction perpendicular to loading (horizontal direction);
- is the gage length in the direction parallel to loading (the gage length for the identification of must be equal to the gage length for the identification of [42]).
4.1.1. Contribution of the Arrangement of the Straps to the Maximum Shear Stress
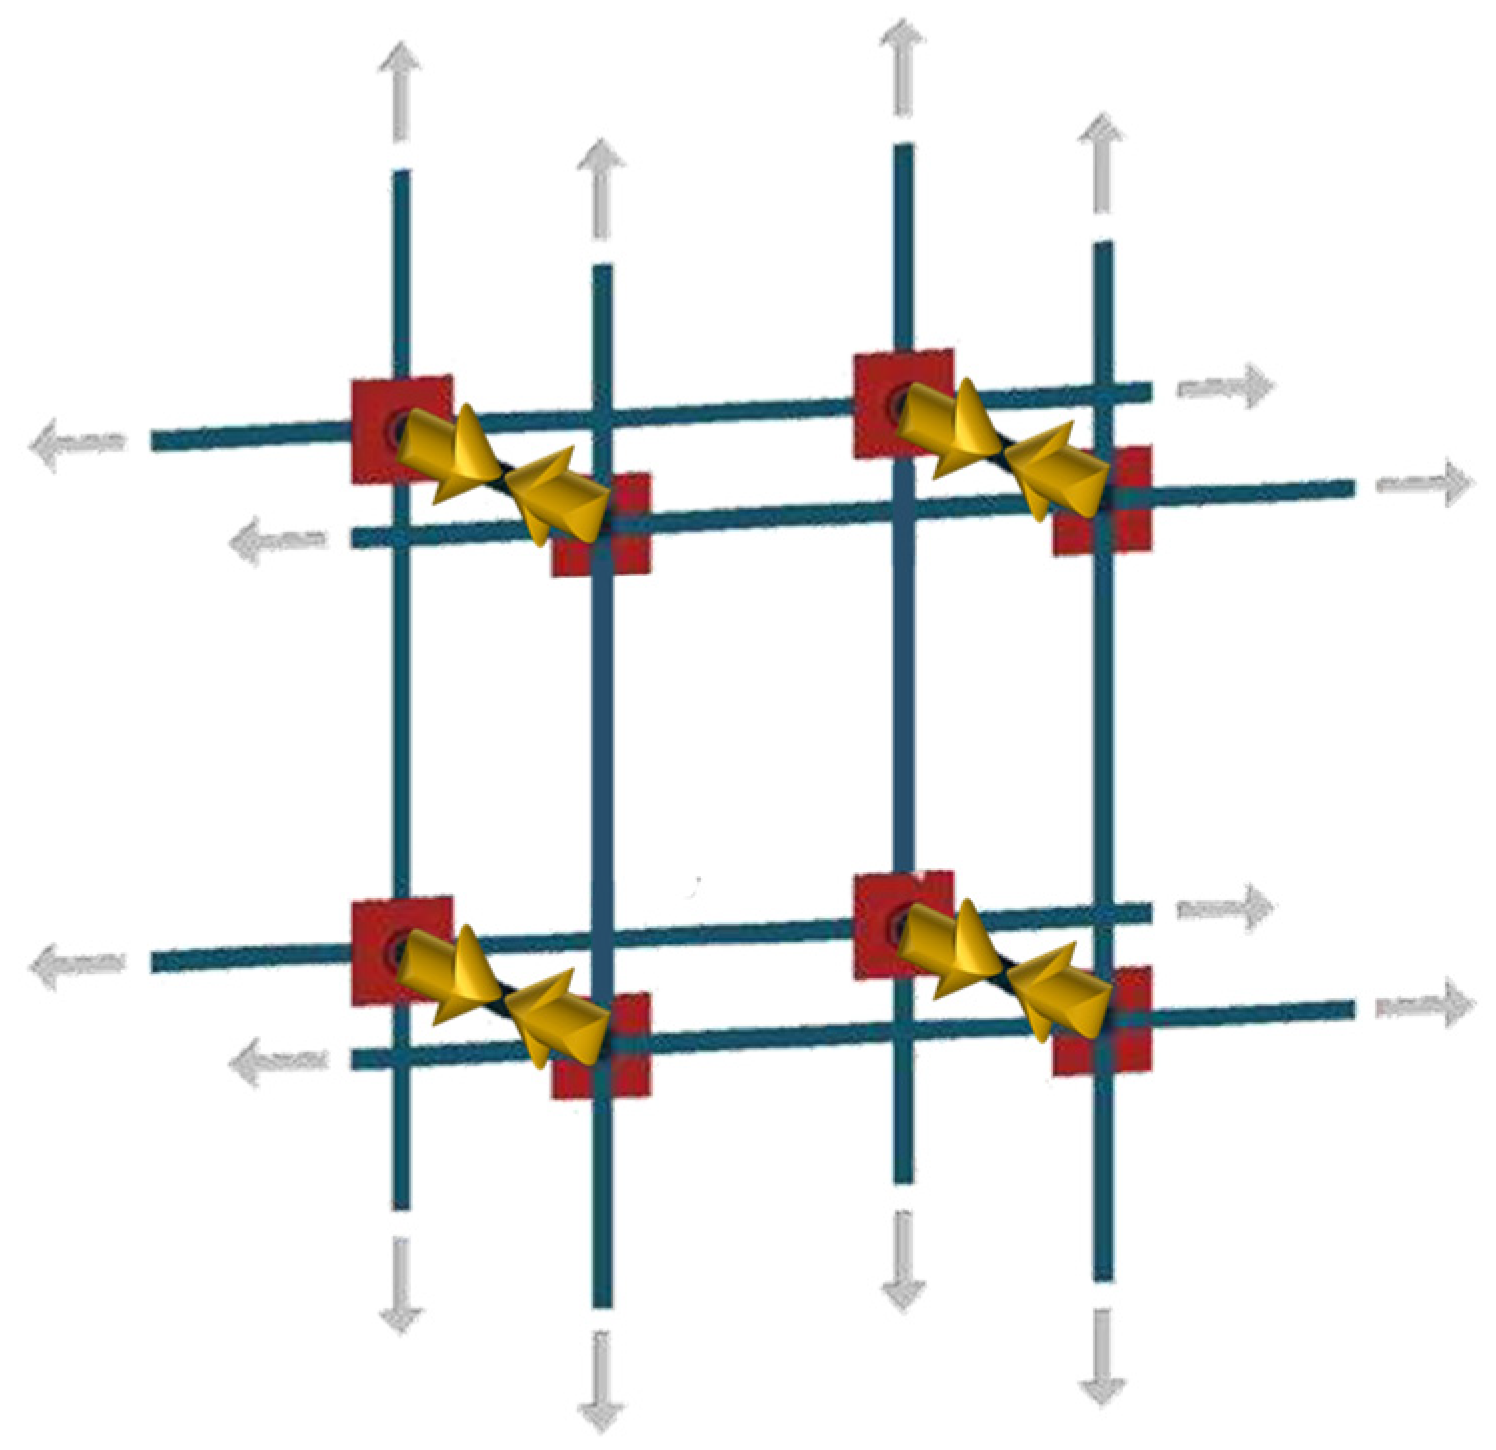
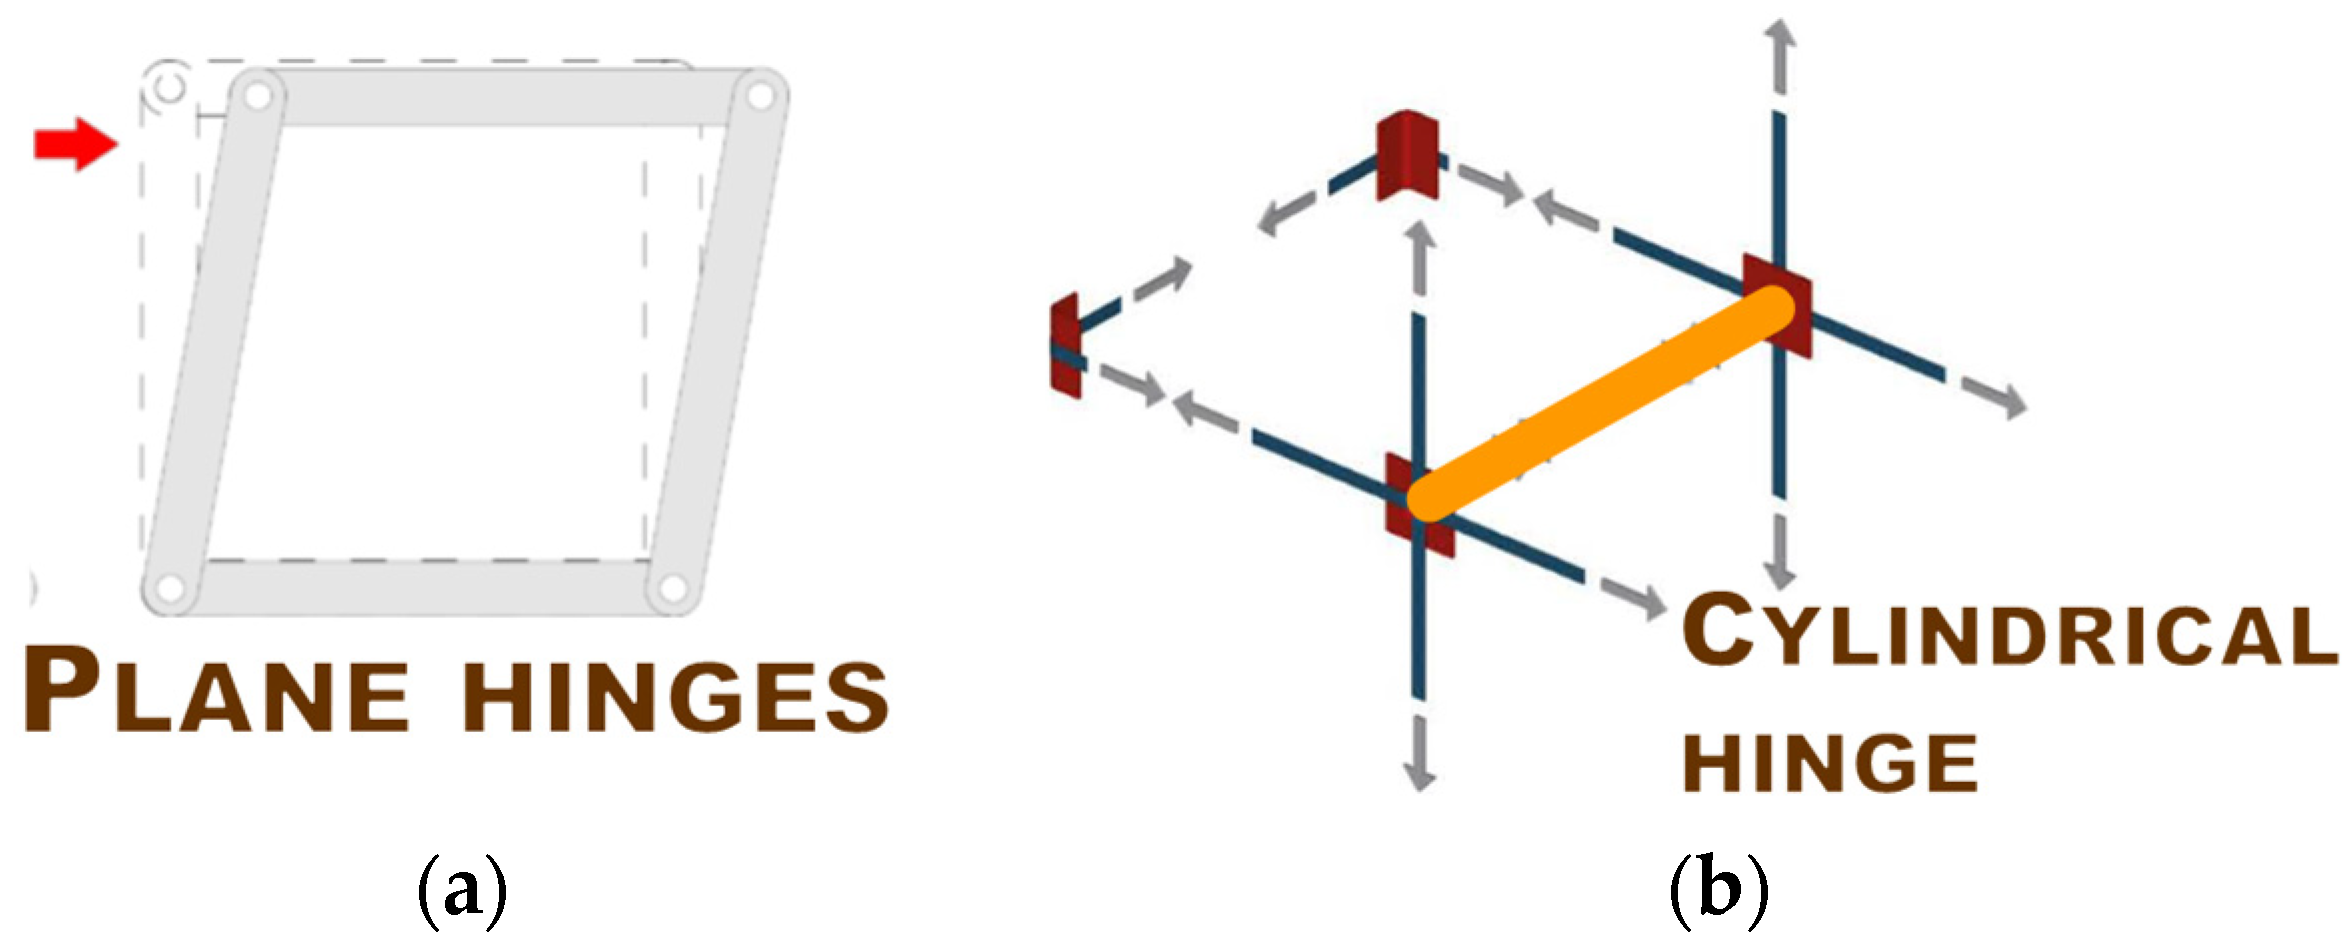
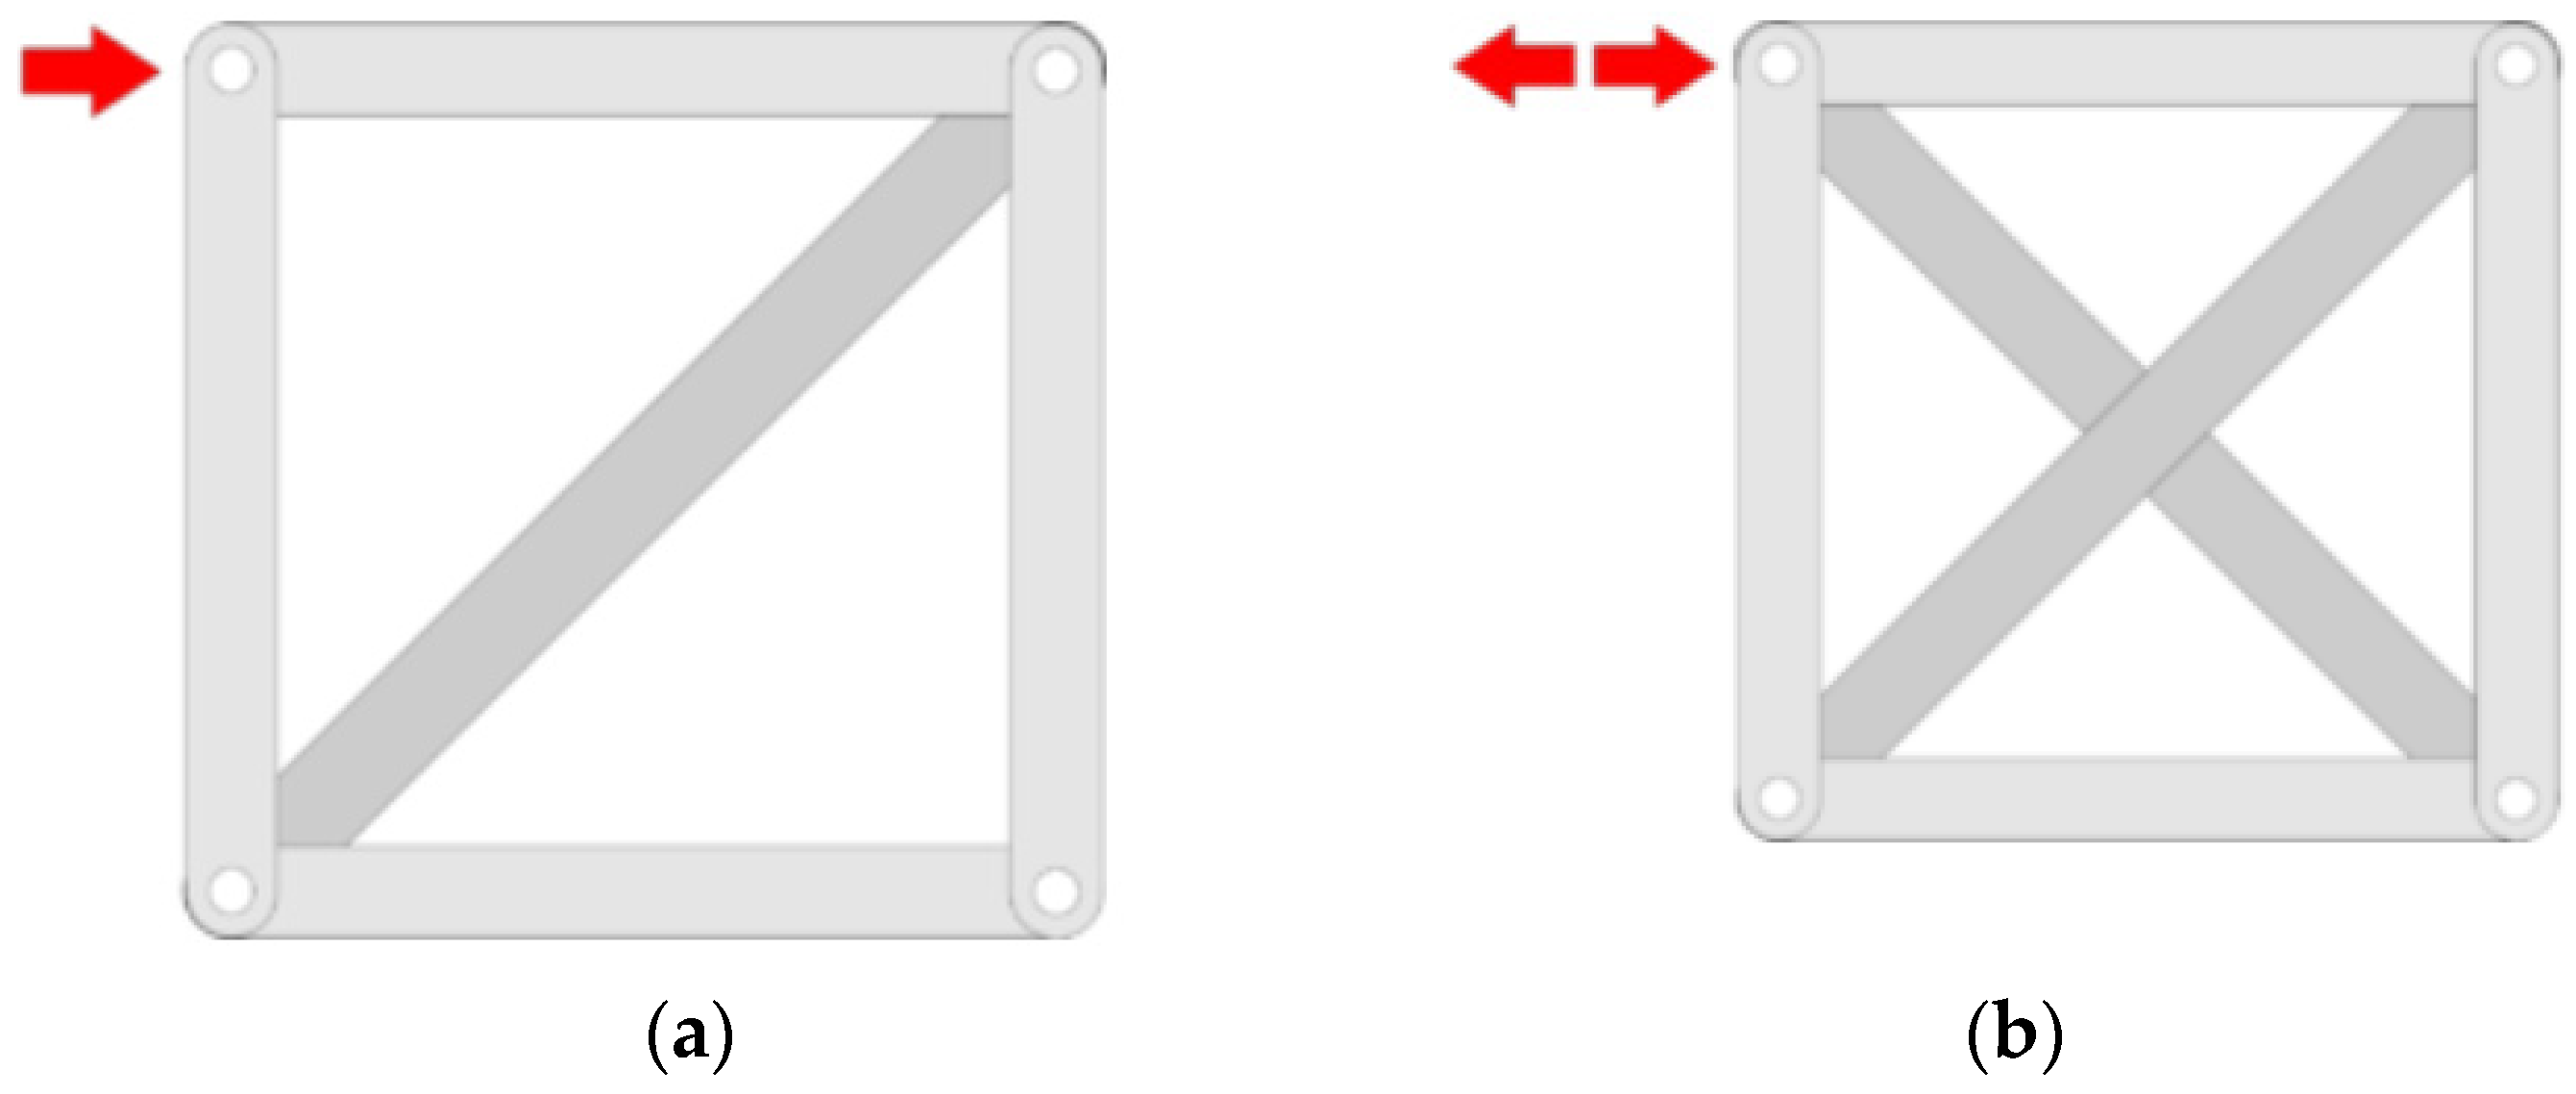
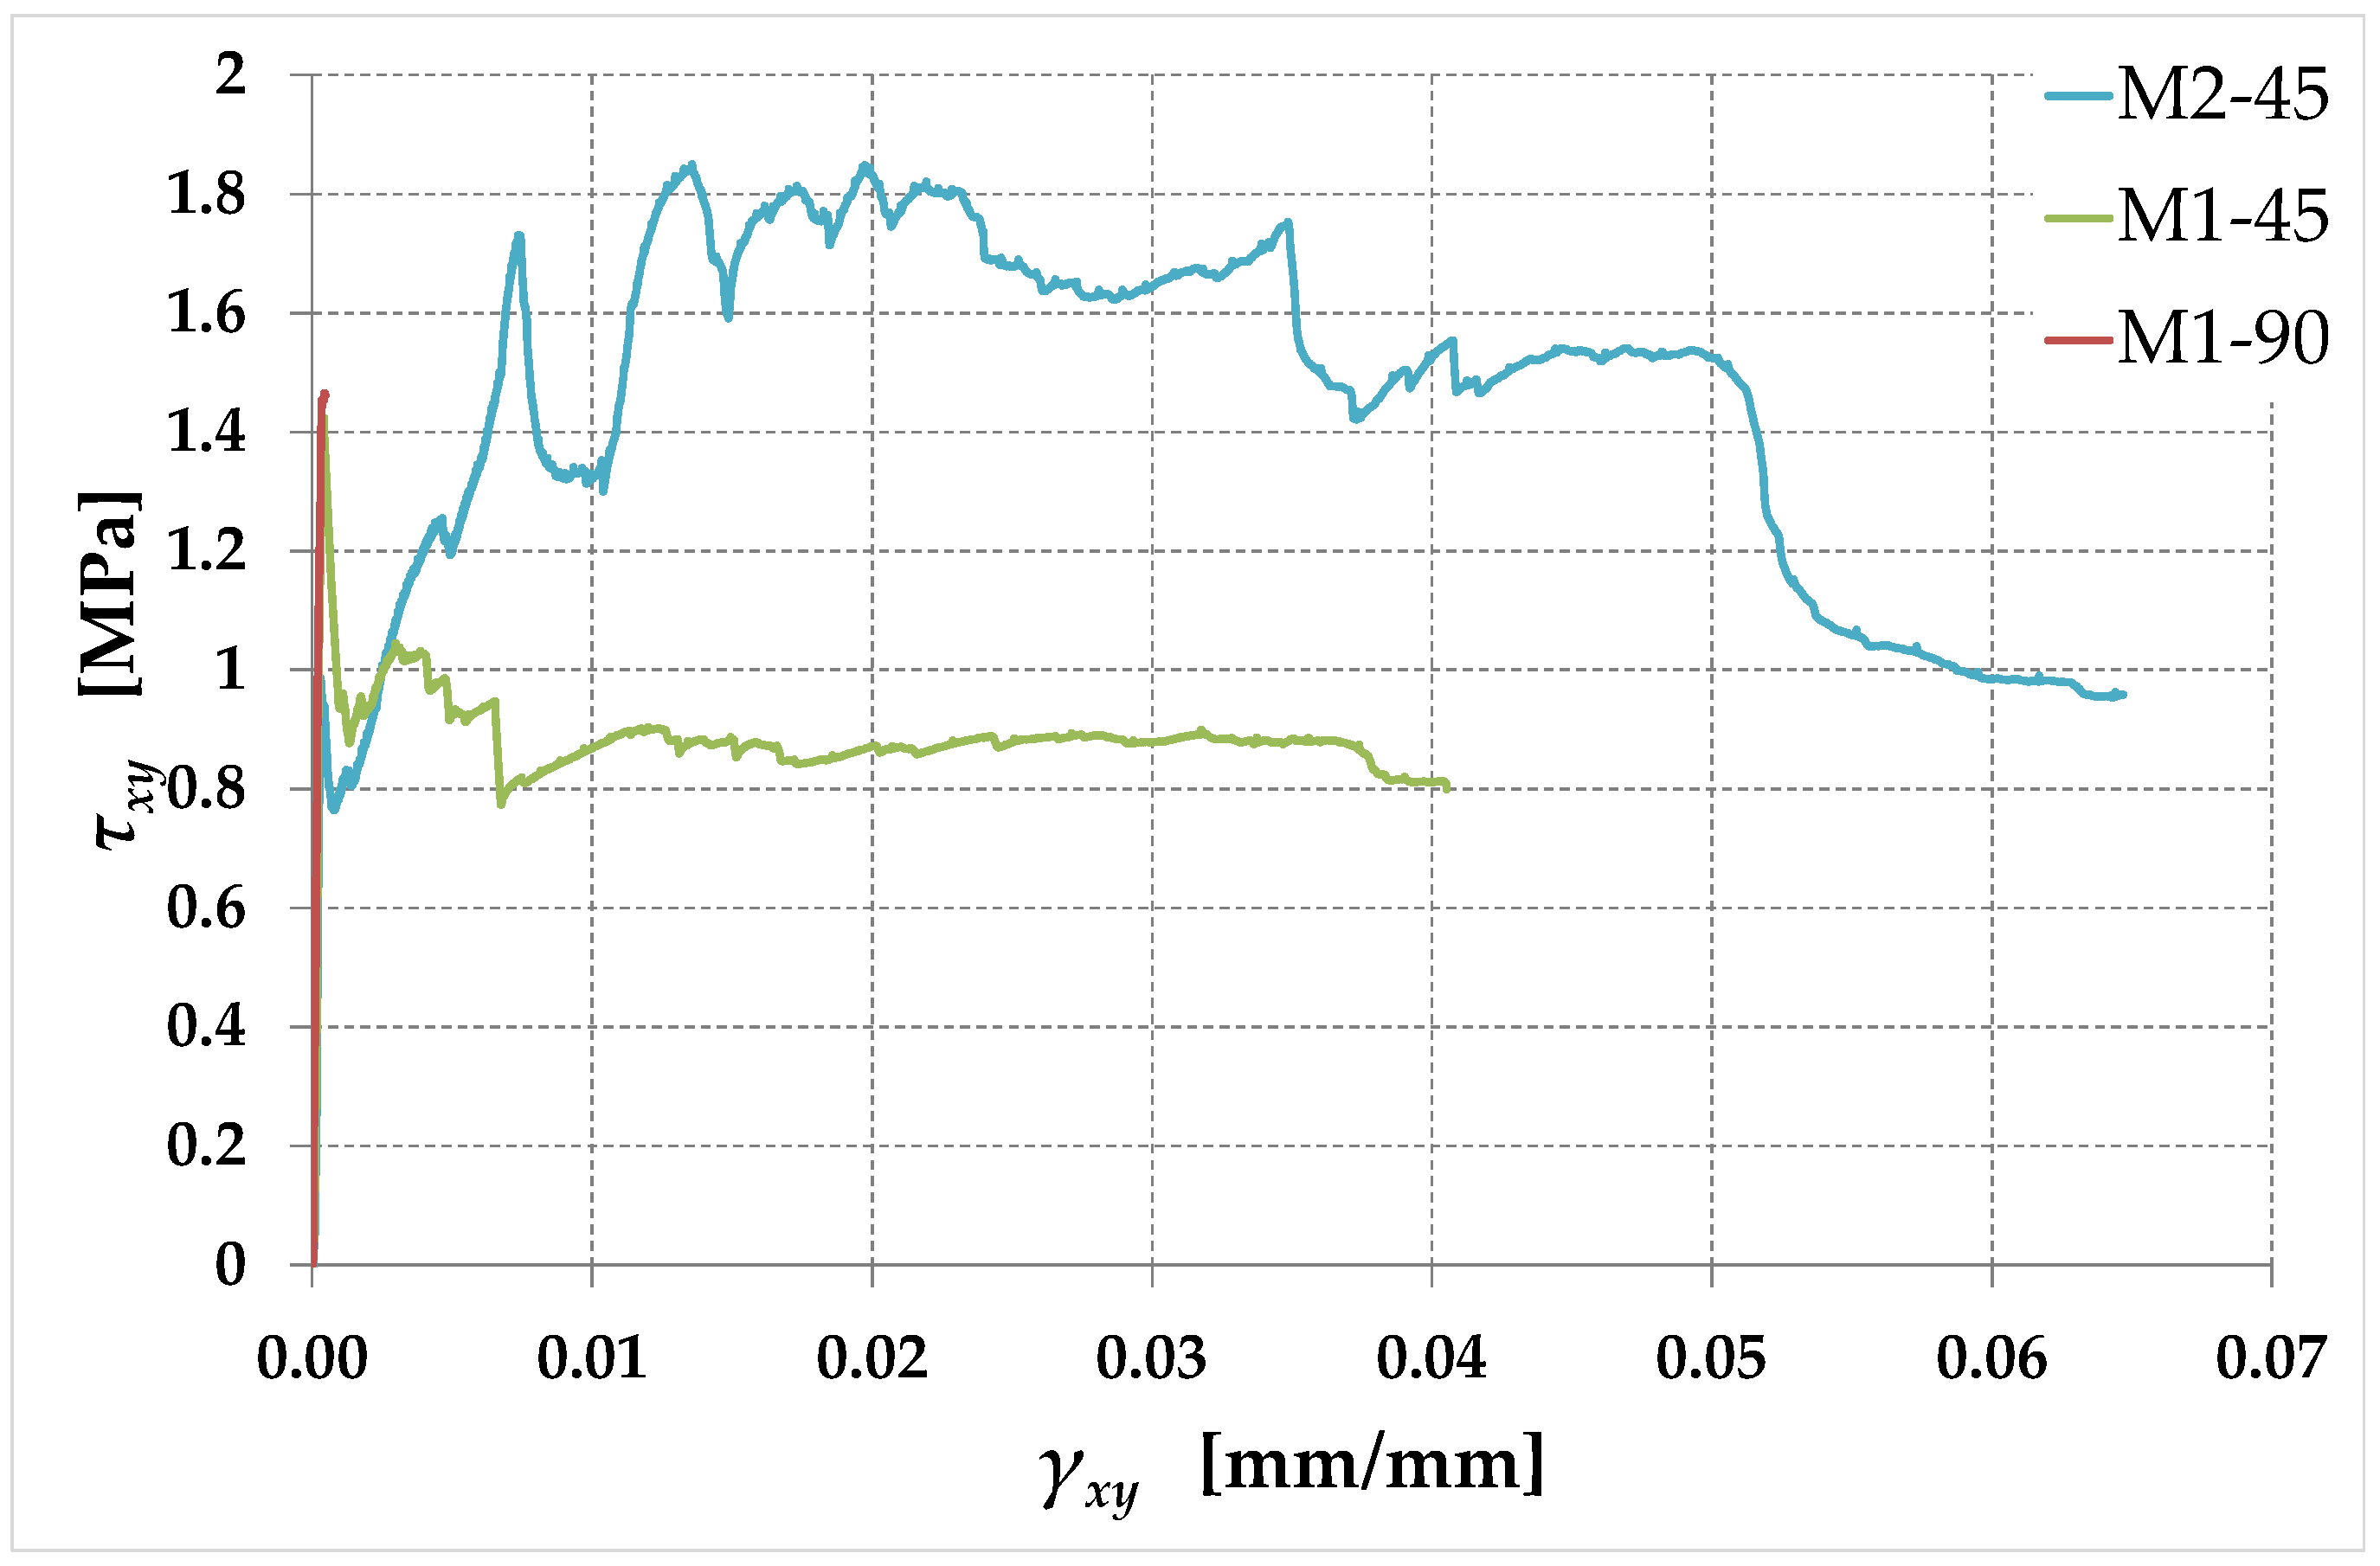
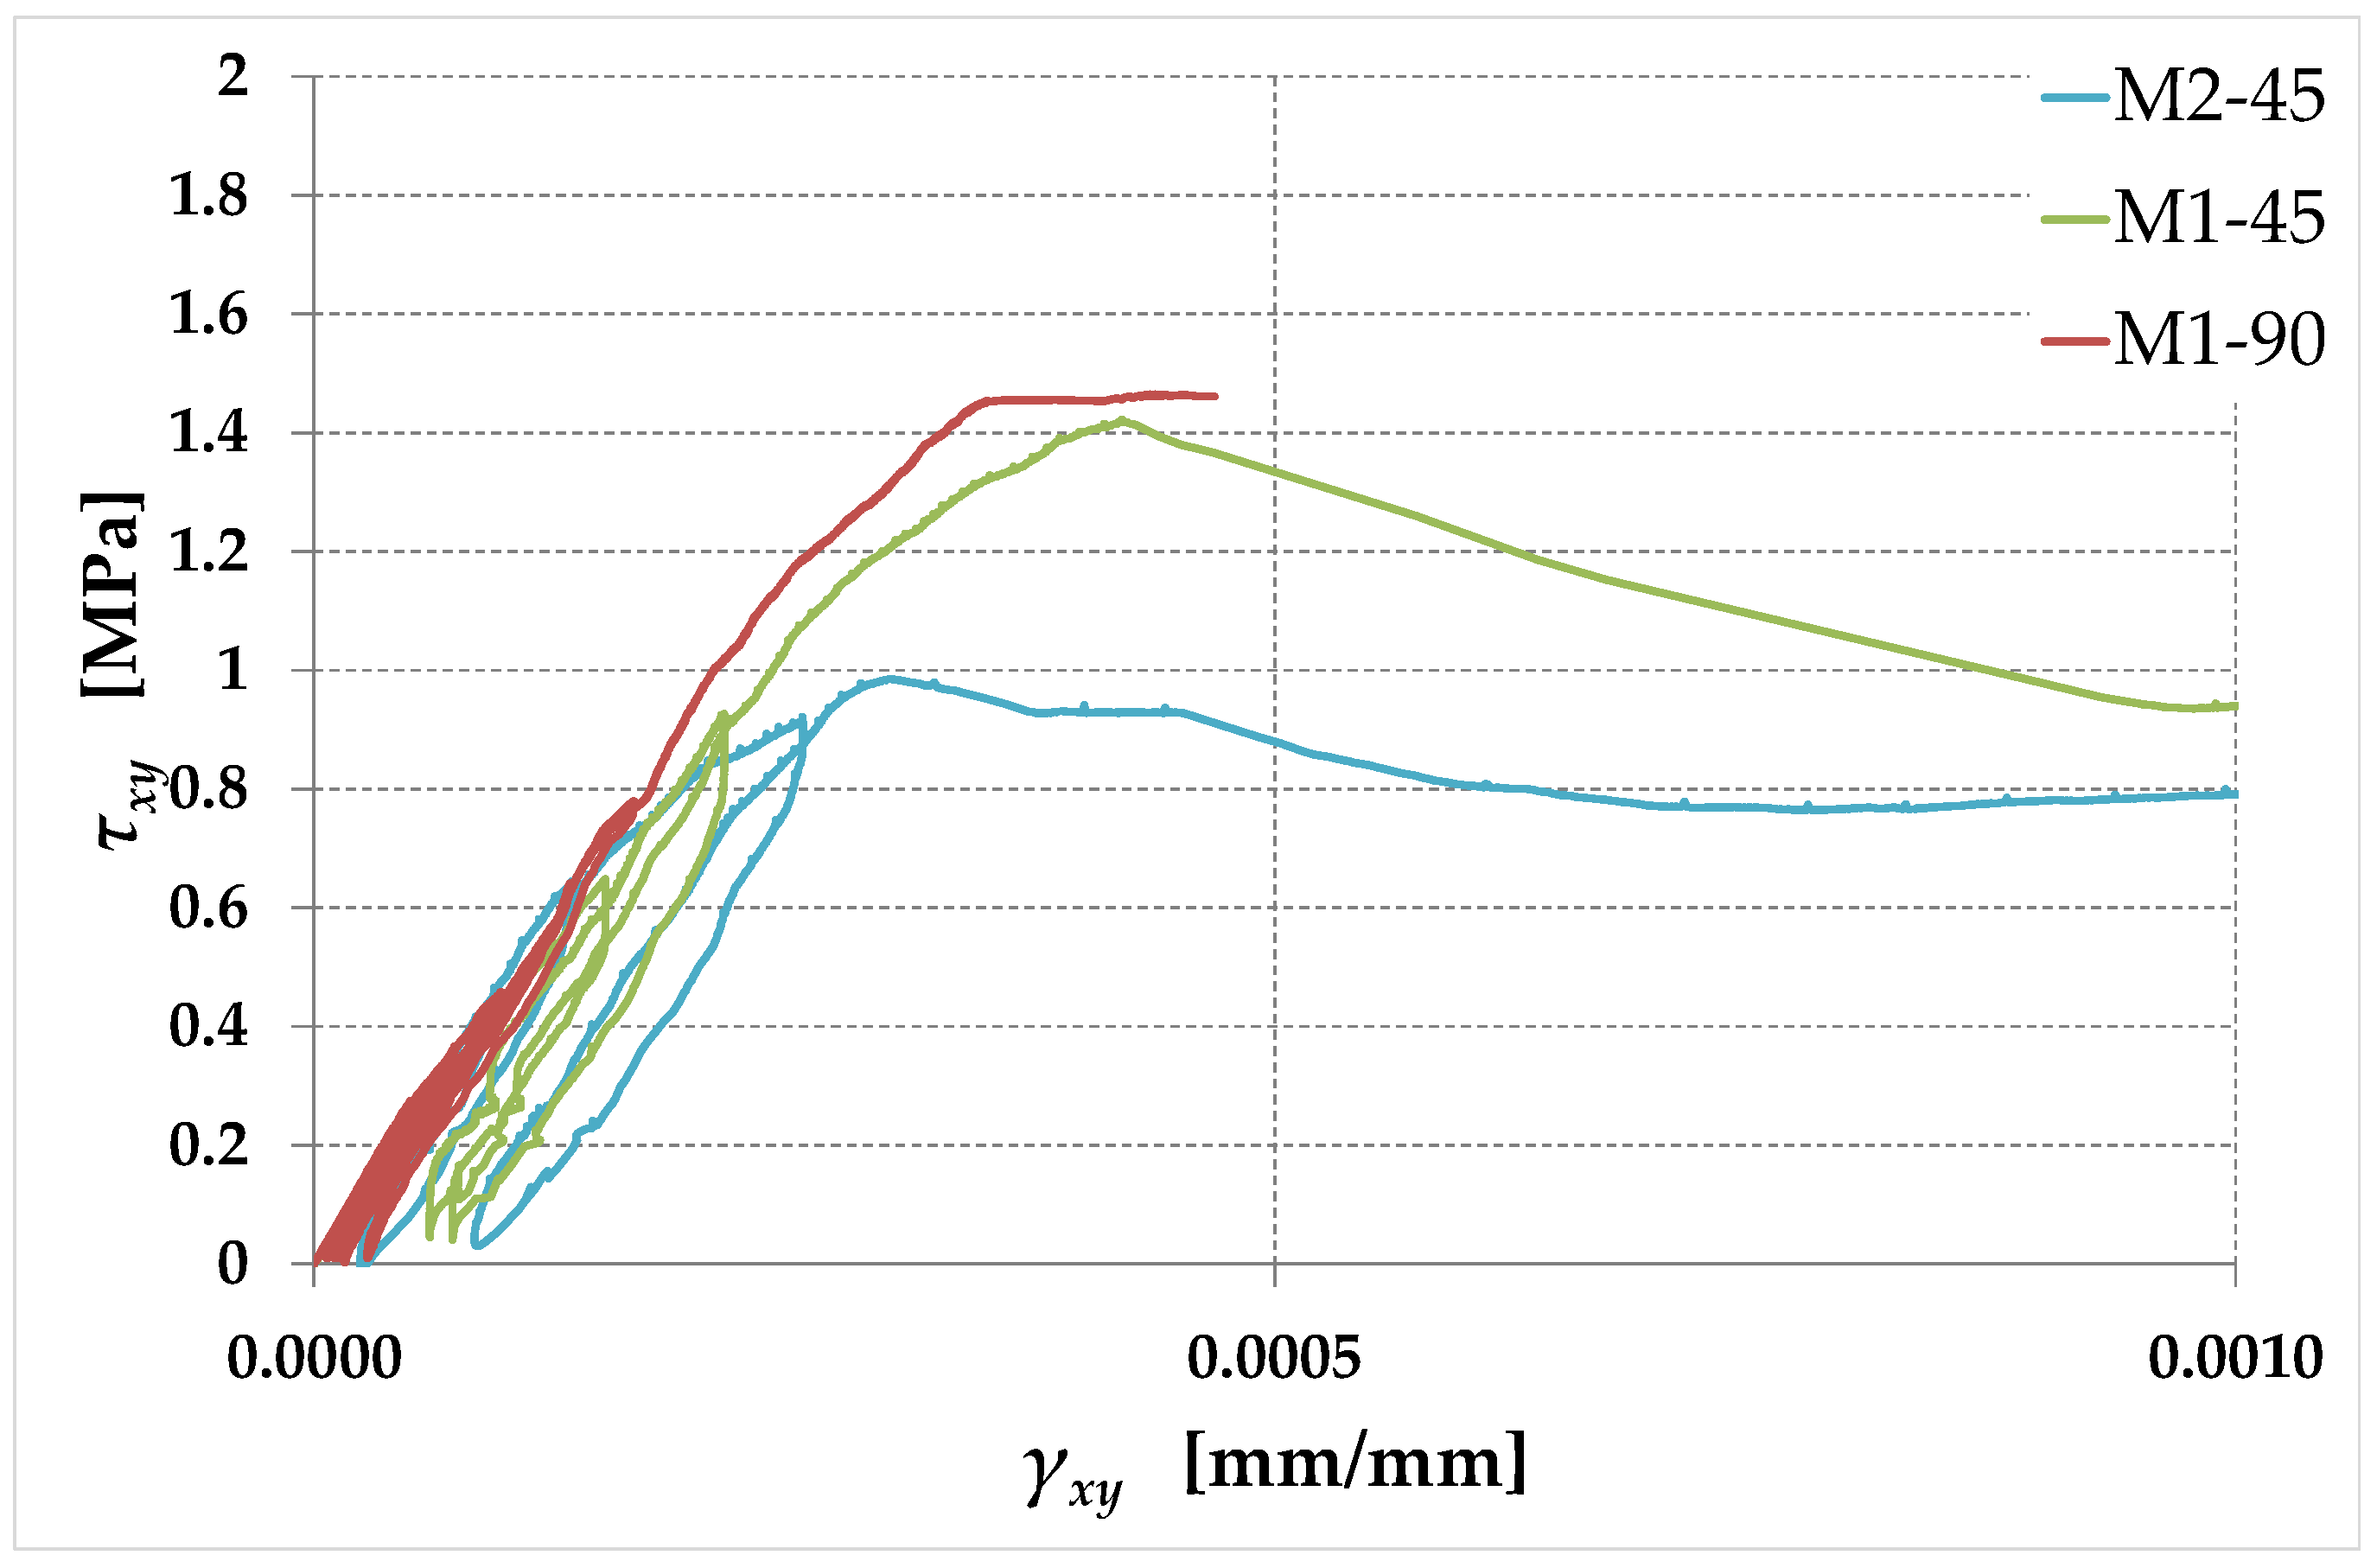
- As assumed in Section 1.2, the rectangular arrangement with straps parallel to the mortar joints (in both directions) is labile. In fact, after a short horizontal plateau at the maximum shear stress (Figure 30), specimen M1-90 undergoes a brittle failure. This means that the straps crossing the failure planes are unable to counteract the relative displacements activated by the failure process along the slip planes. Due to the forces acting orthogonally to their direction, these straps rotate around the hinged nodes of the CAM-like system, which activates the free nodal displacements of the unbraced scheme shown in Figure 3a. Consequently, the rectangular strengthening system with straps arranged along the mortar joints is ineffective in terms of increasing the maximum load. However, it is not entirely useless: keeping the various parts that make up the masonry wall together even after the activation of the slip planes prevents the debris from falling. In fact, the steel straps do not break at the maximum load. This allows them to act as a debris containment garrison, similar to rock-fall nets on rocky slopes. Furthermore, the box-type behavior created by the continuous strengthening system in a building (Figure S3) protects individual structural elements from out-of-plane overturning and prevents the entire structure from collapsing. Therefore, each structural element undergoes limited horizontal displacements after failure, which allows us to define a pseudo-ductility even for the building that has exceeded the shear strength. This makes the strap arrangement of specimen M1-90 a very useful tool for the (preventive) safety of the structures and, ultimately, for safeguarding the safety of the inhabitants. As a final remark, since specimen M1-90 deviates only slightly from linearity up to the maximum shear stress, it seems reasonable that the straps have no effect on the pre-peak behavior of specimen M1-90. Thus, the maximum shear stress of specimen M1-90 is, to a good approximation, the URM maximum shear stress.
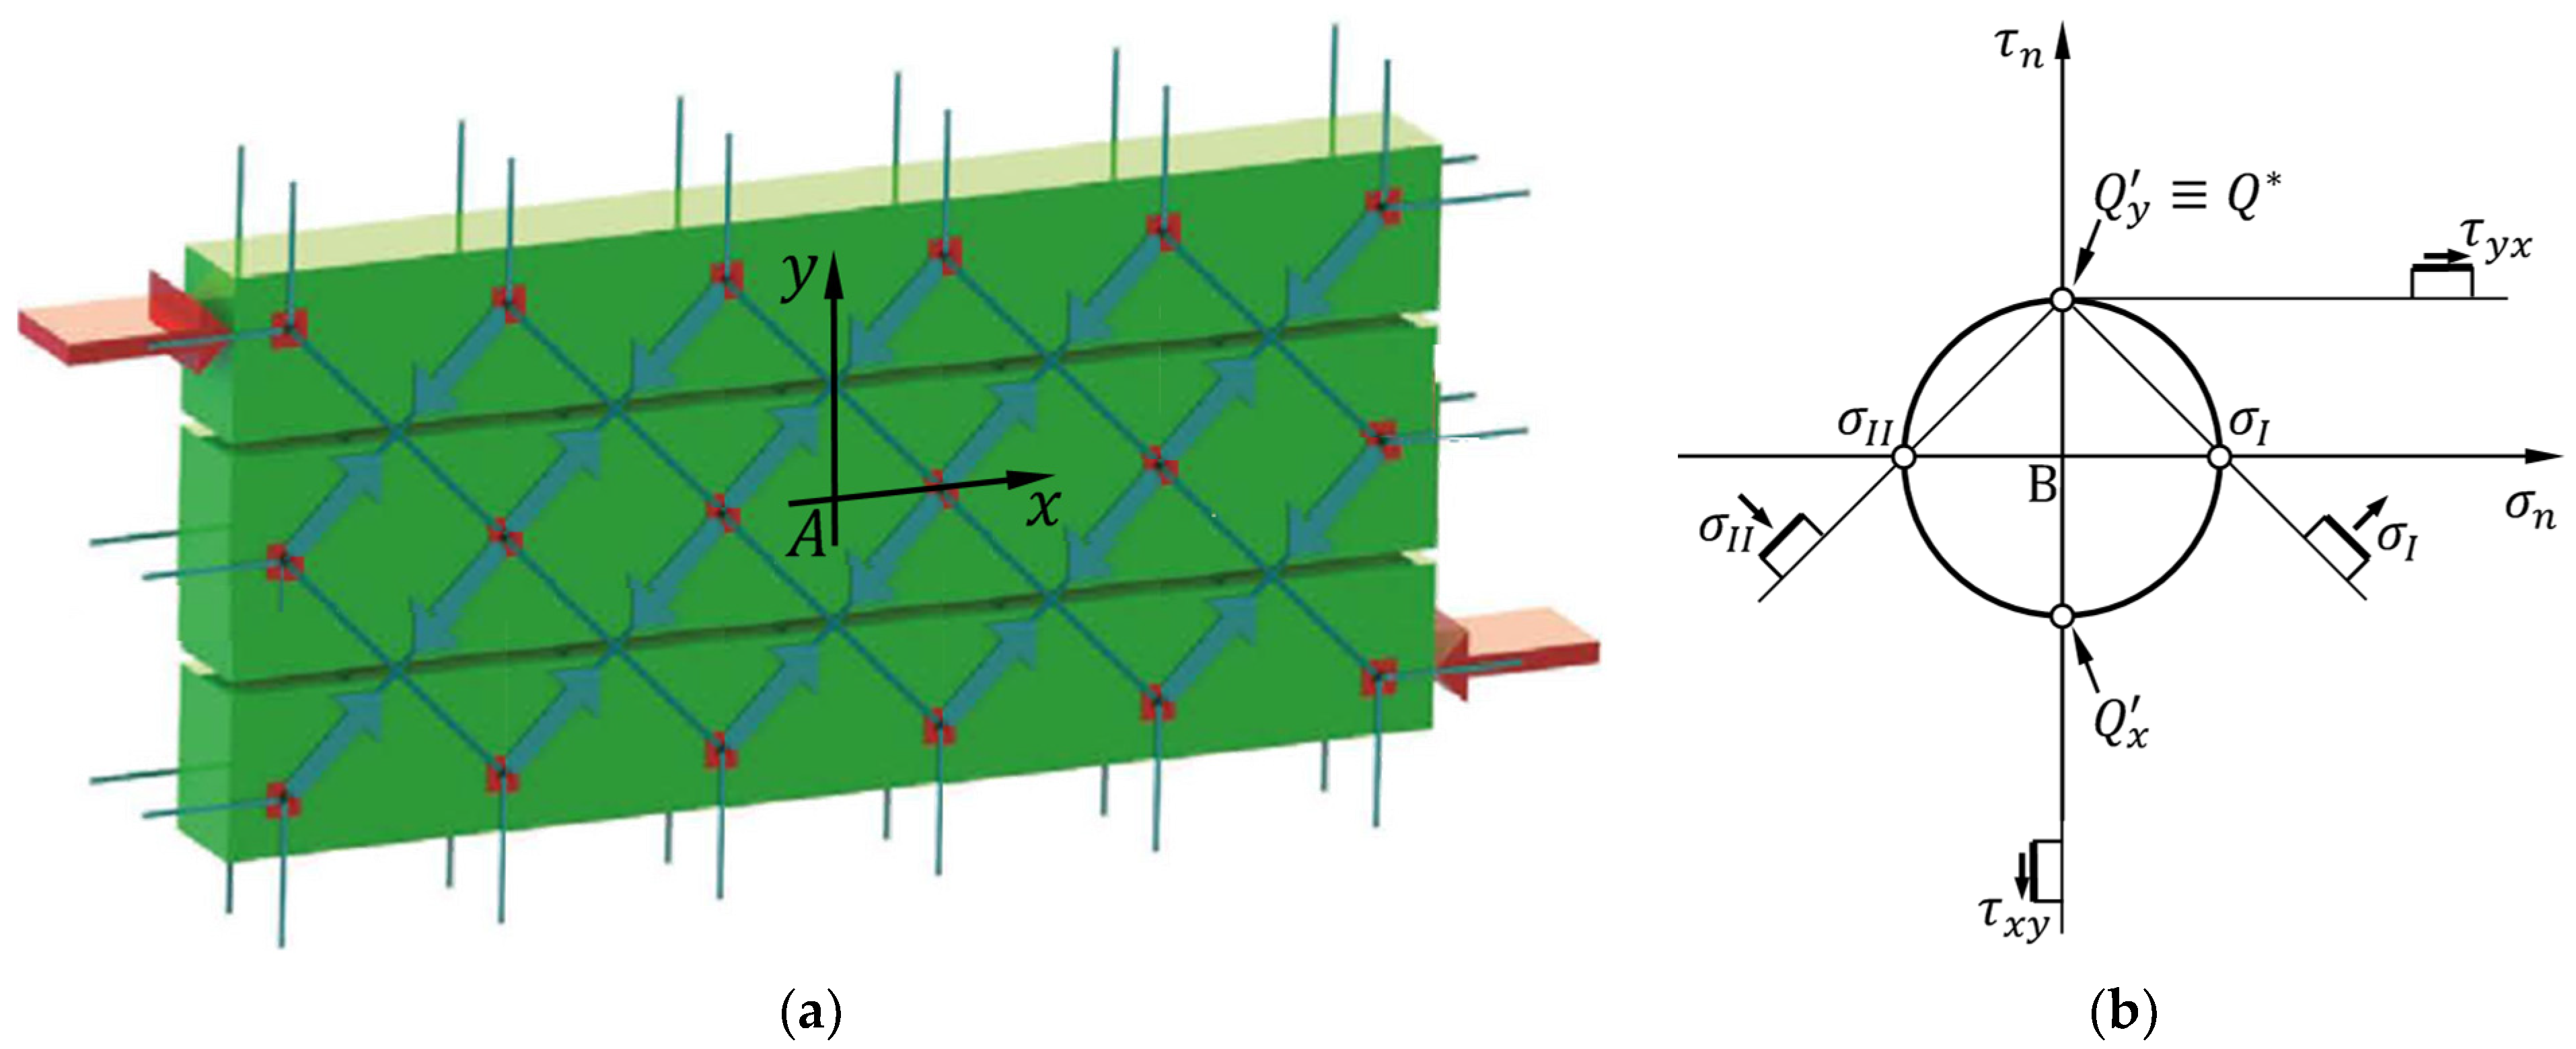
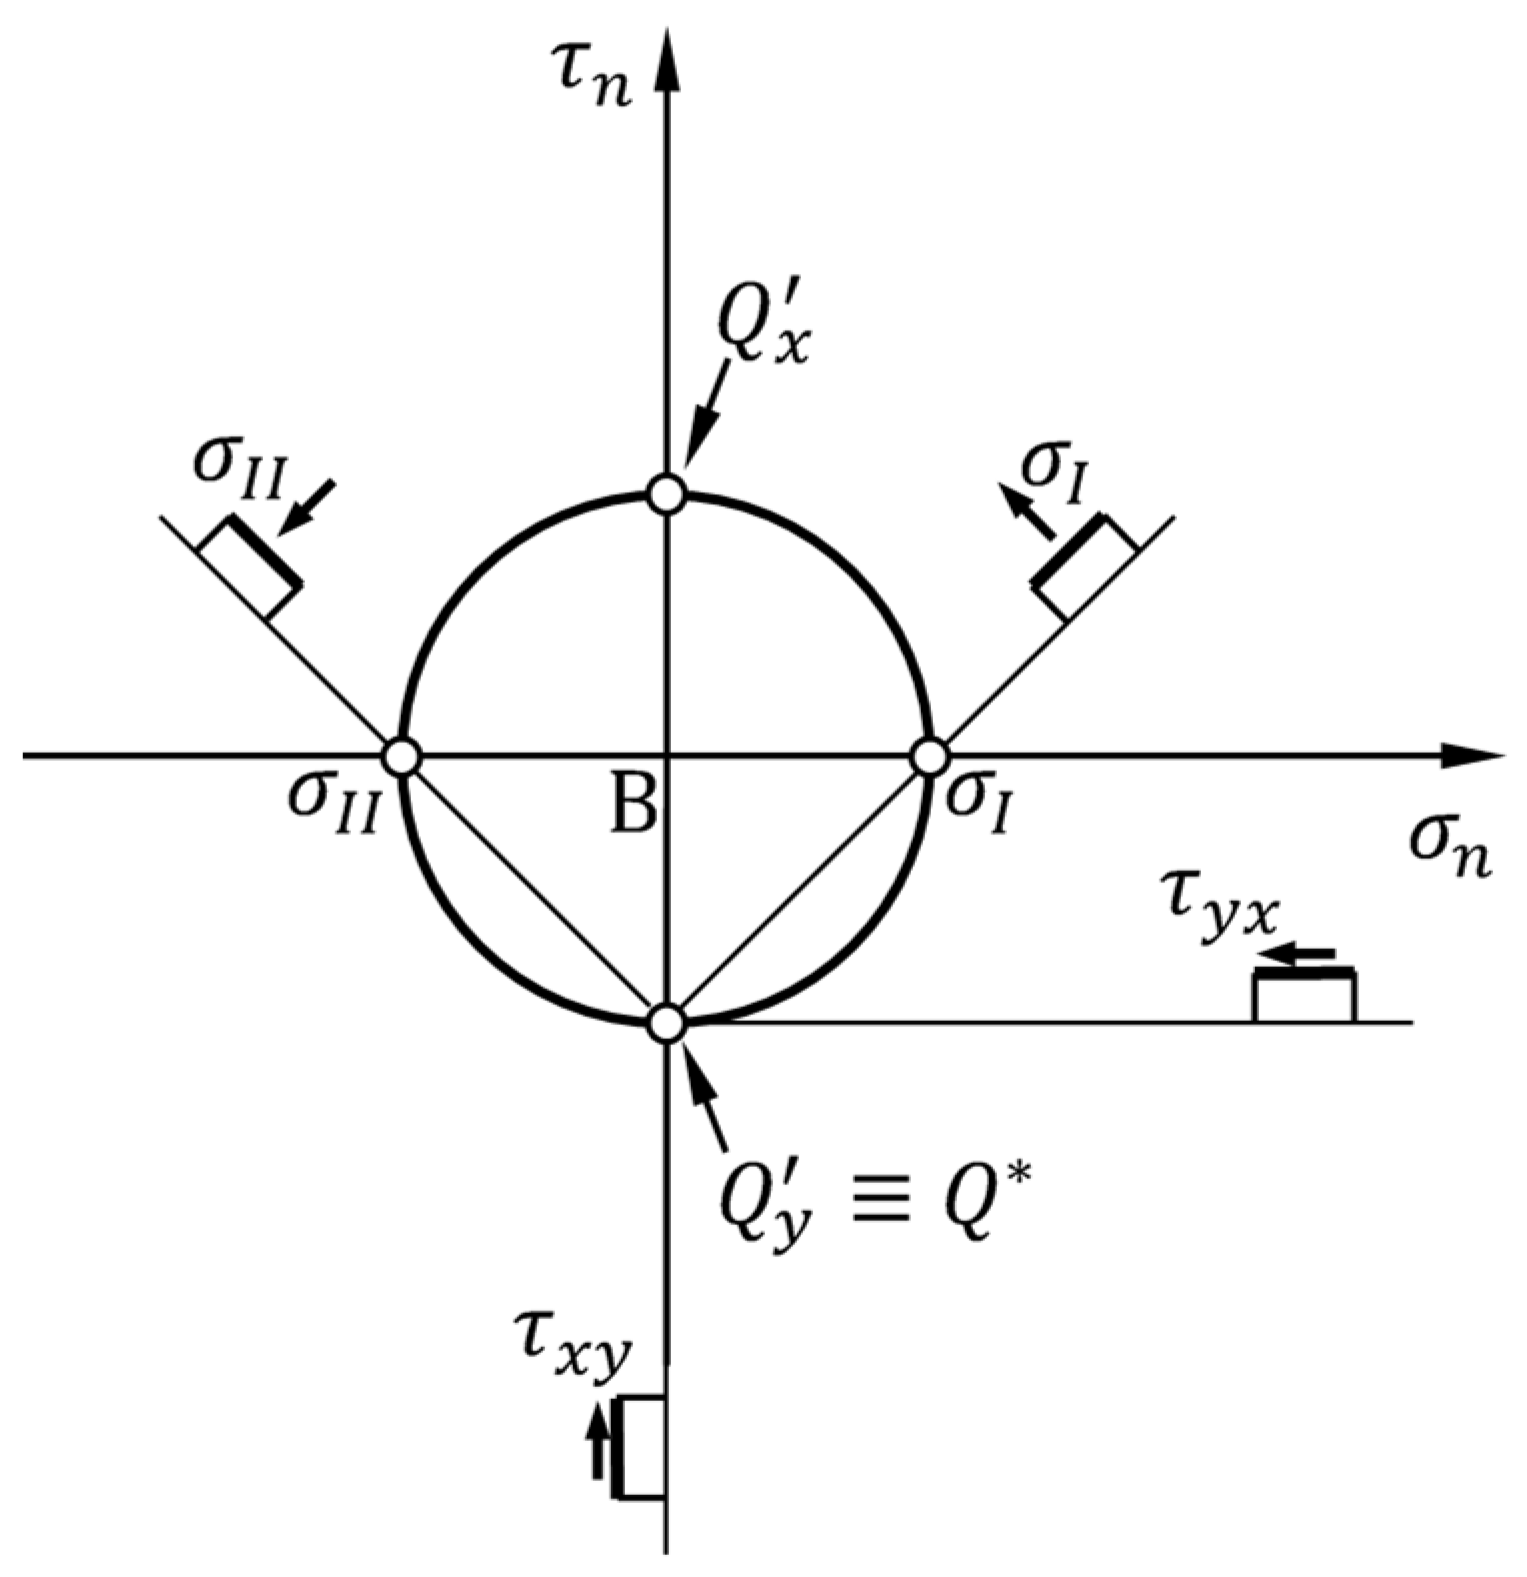
- A rotation of the straps allows the rectangular arrangement to find equilibrium while remaining a labile configuration. The curves of specimens M1-45 and M2-45 in Figure 29 testify to the effectiveness of the arrangement, since they continue well beyond the first peak, caused by the initiation of the crisis in the masonry. This greatly increases the pseudo-ductility of the strengthened masonry wall (Section 4.4). The activation of the strengthening system allowed by the rotation of the straps therefore transforms the failure of the specimen from brittle to markedly ductile. The continuation of the curves beyond the peak of the first crack (first peak) is possible as the arrangement of the straps is labile but balanced, and therefore effective, given the particular load condition. Figure 31 provides an explanation in the Mohr plane of the effectiveness of the arrangement for an actual case of masonry subjected to horizontal (seismic) loading, using the pole method (Appendix A).
4.1.2. Contribution of the Number of Straps to the Maximum Shear Stress
4.2. Stress/Strain Curves
- is the Young’s modulus;
- is the shear modulus, defined by Equation (10).
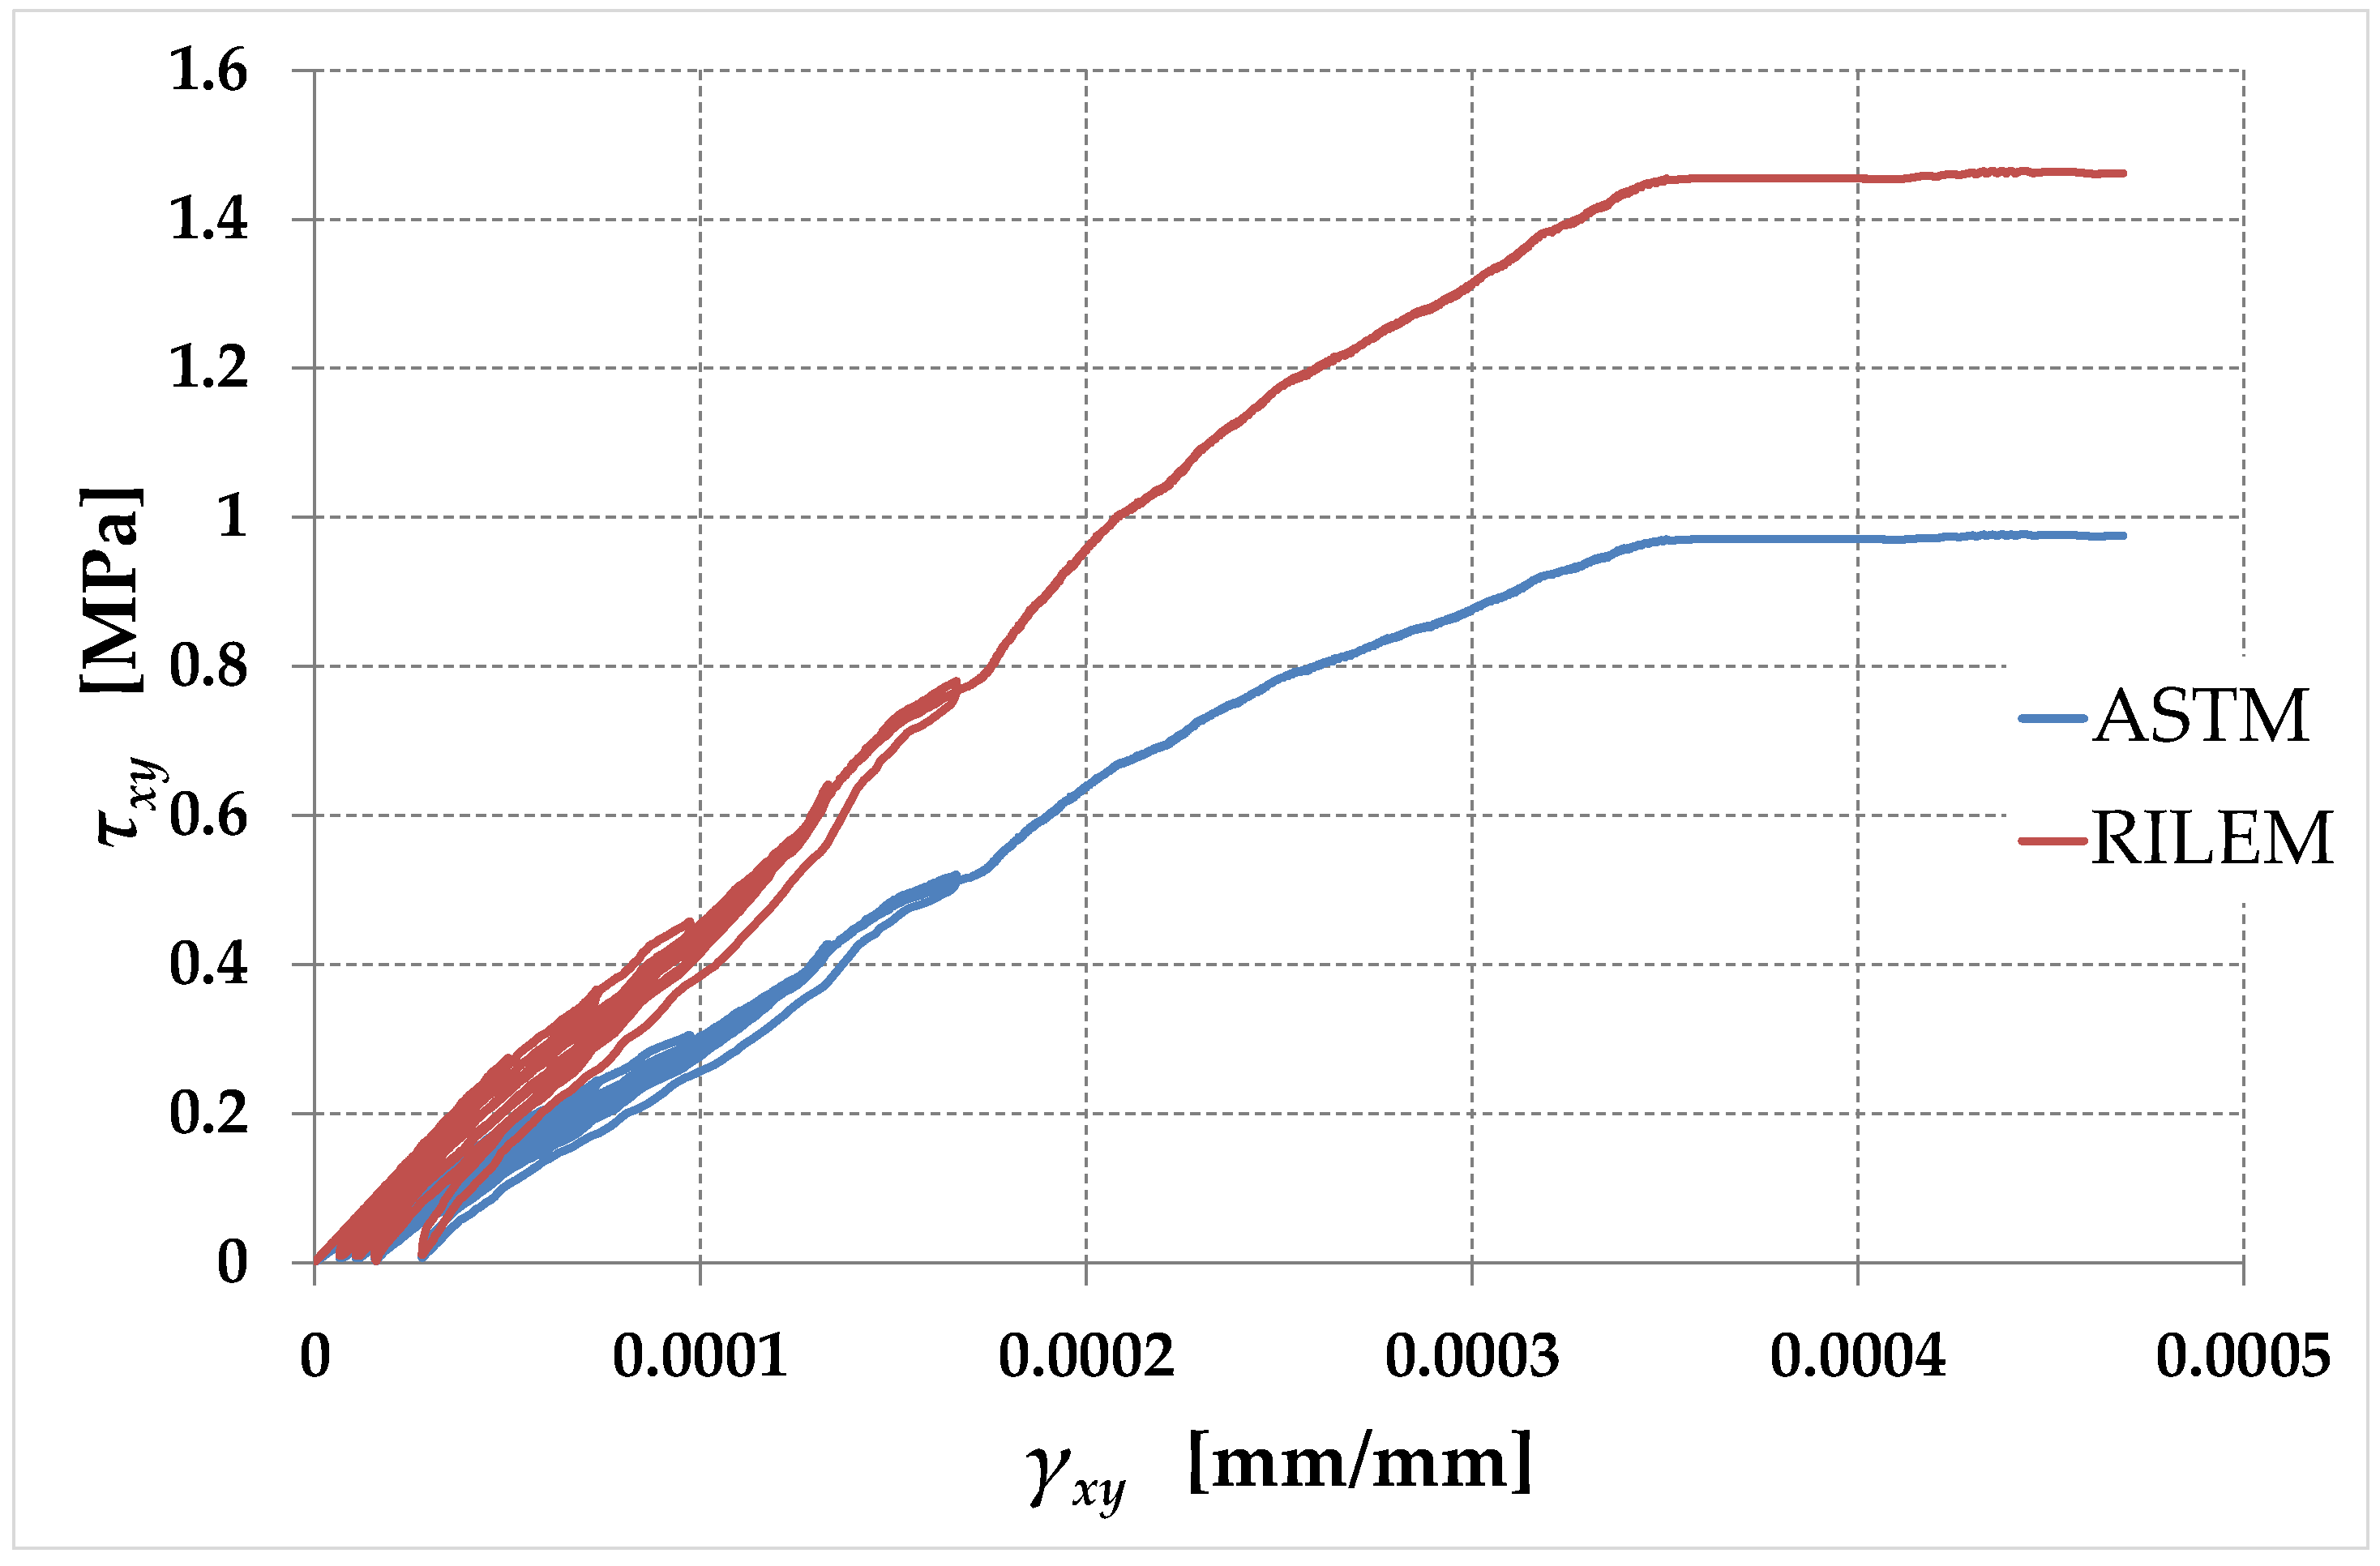
- The stresses given by the principal stresses, and , in the RILEM interpretation of the diagonal compression test (Equation (A24));
- The strains, and , obtained as the ratios of the relative displacements between the ends of the horizontal and vertical potentiometers (Section 2.3) to the initial lengths of the potentiometers:
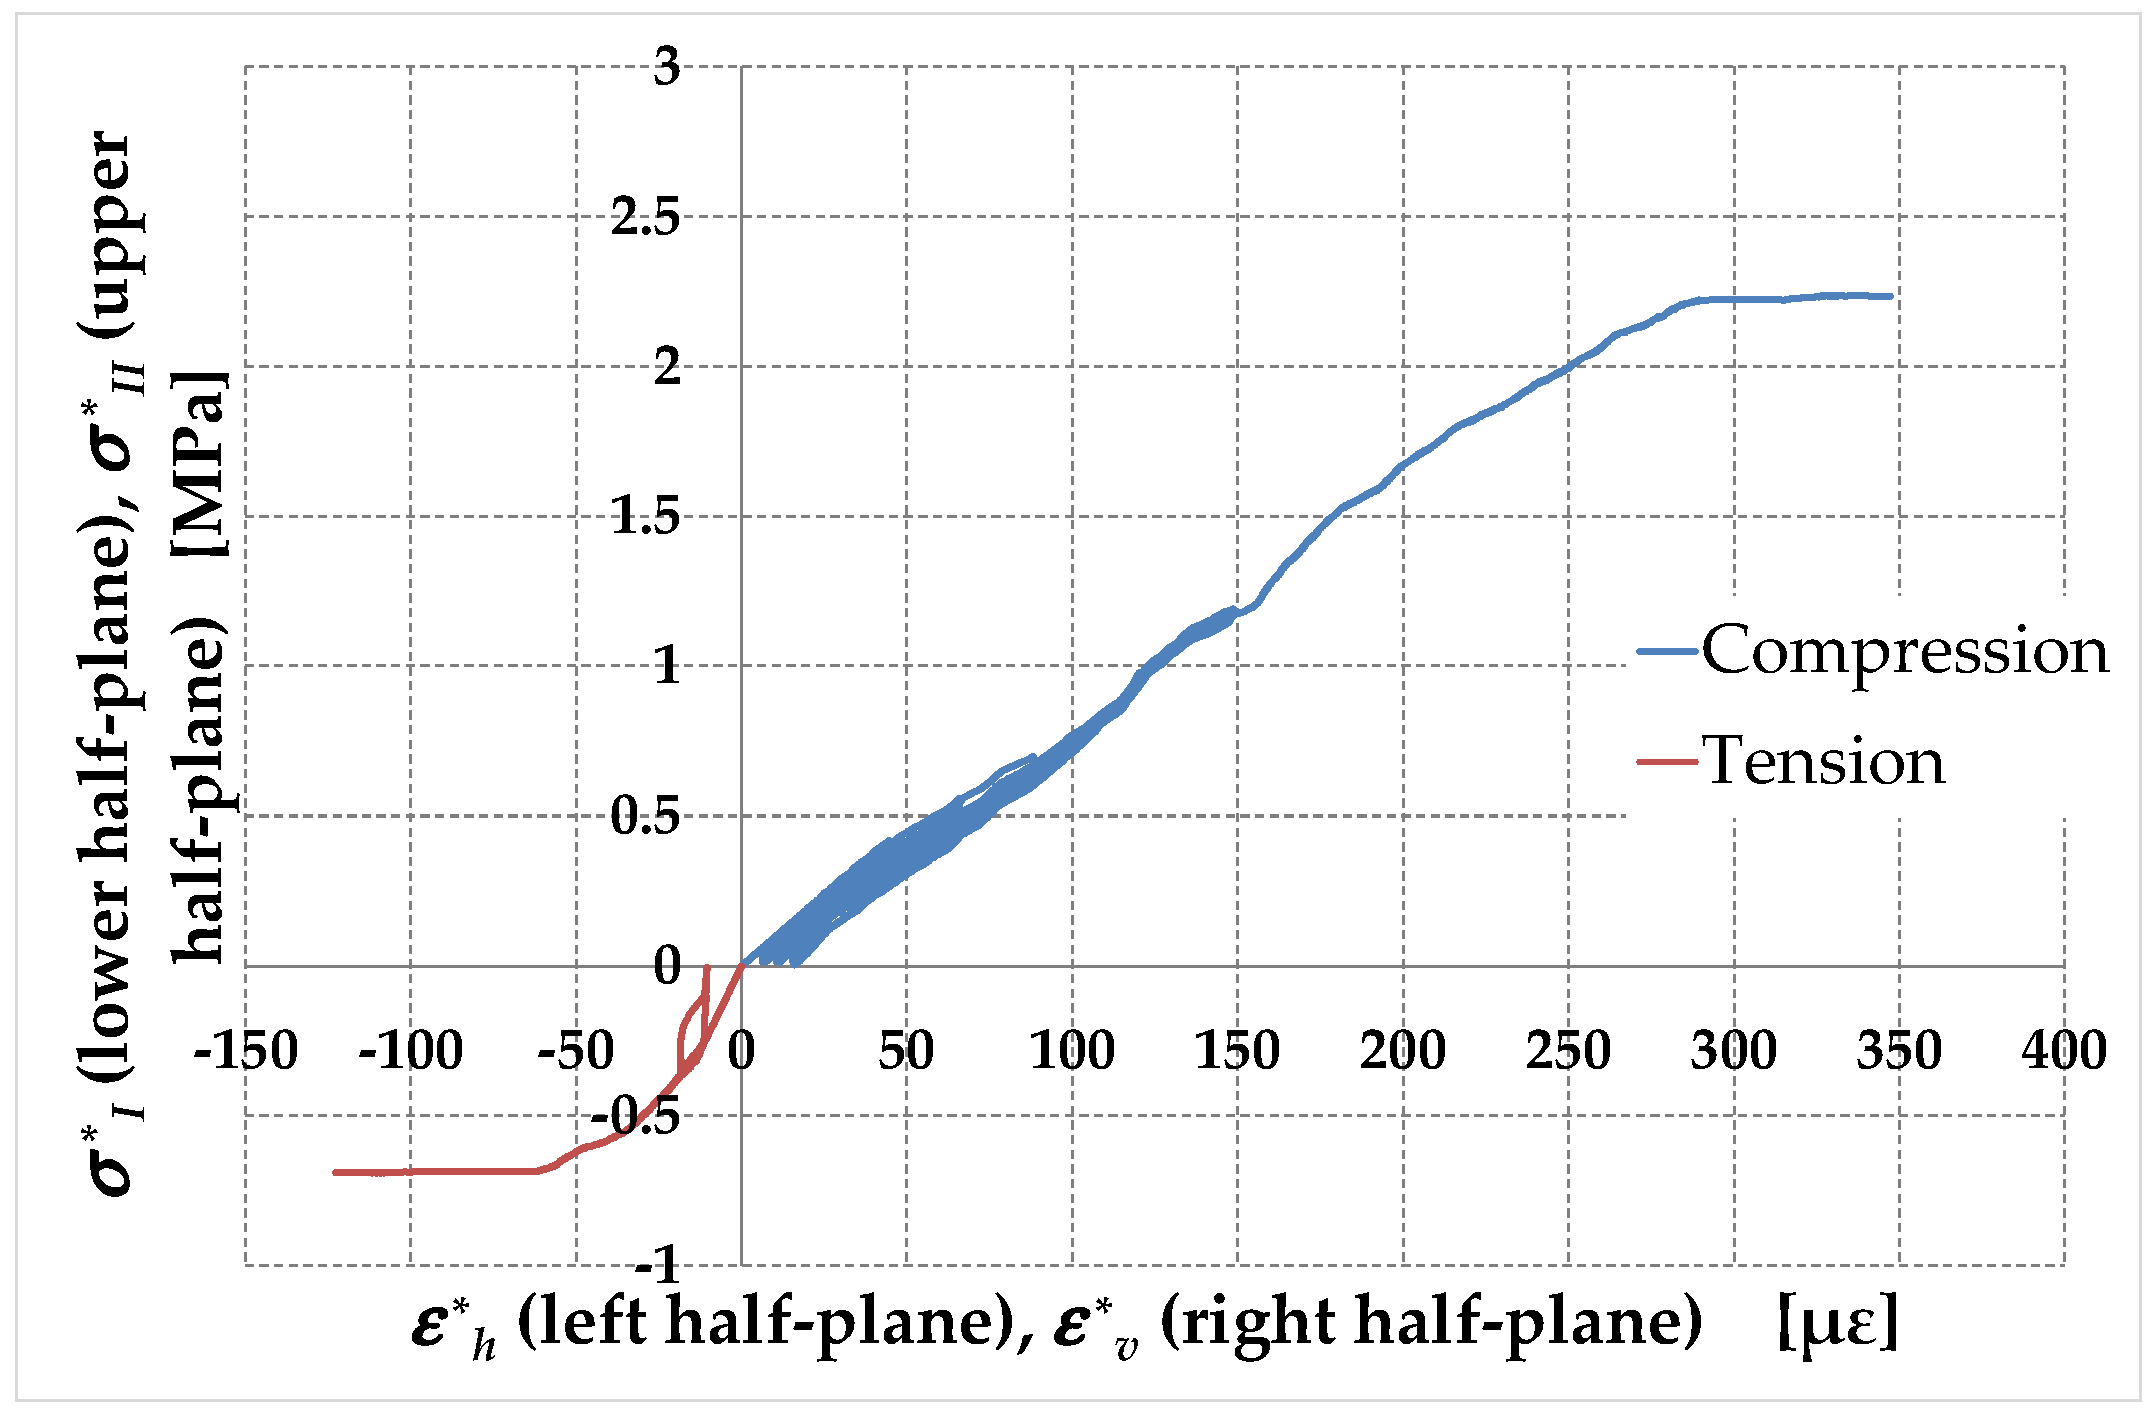
- The 0.3 ratio of the estimated diagonal tensile strength, :to the estimated diagonal compressive strength, :is a direct consequence of the ratio of the two principal stresses, and , in Equation (A24). This value, however, is not consistent with the experimental results on the tensile and compressive strengths of masonries, and , respectively. In fact, although it is difficult to identify a reliable value of tensile strength with the standard statistical methods, the ratio is usually less than [72]. As specified above, it is incorrect to confuse with and with . However, the difference between the and ratios is too large to depend only on the approximations introduced.
- Since specimen M1-90 behaves like a URM specimen, the different values assumed by the initial slopes in the two opposite quadrants of Figure 34 would indicate that the tensile stiffness of the URMs is different from the compressive stiffness. In fact, even the difference between these slopes is too large to depend only on the approximations introduced. This would mean that there is no single Young’s modulus in tension and compression in the URMs, which is physically unacceptable. In particular, Figure 34 shows an estimated Young’s modulus in compression, , that is significantly lower than the estimated Young’s modulus in tension, (Table 6).
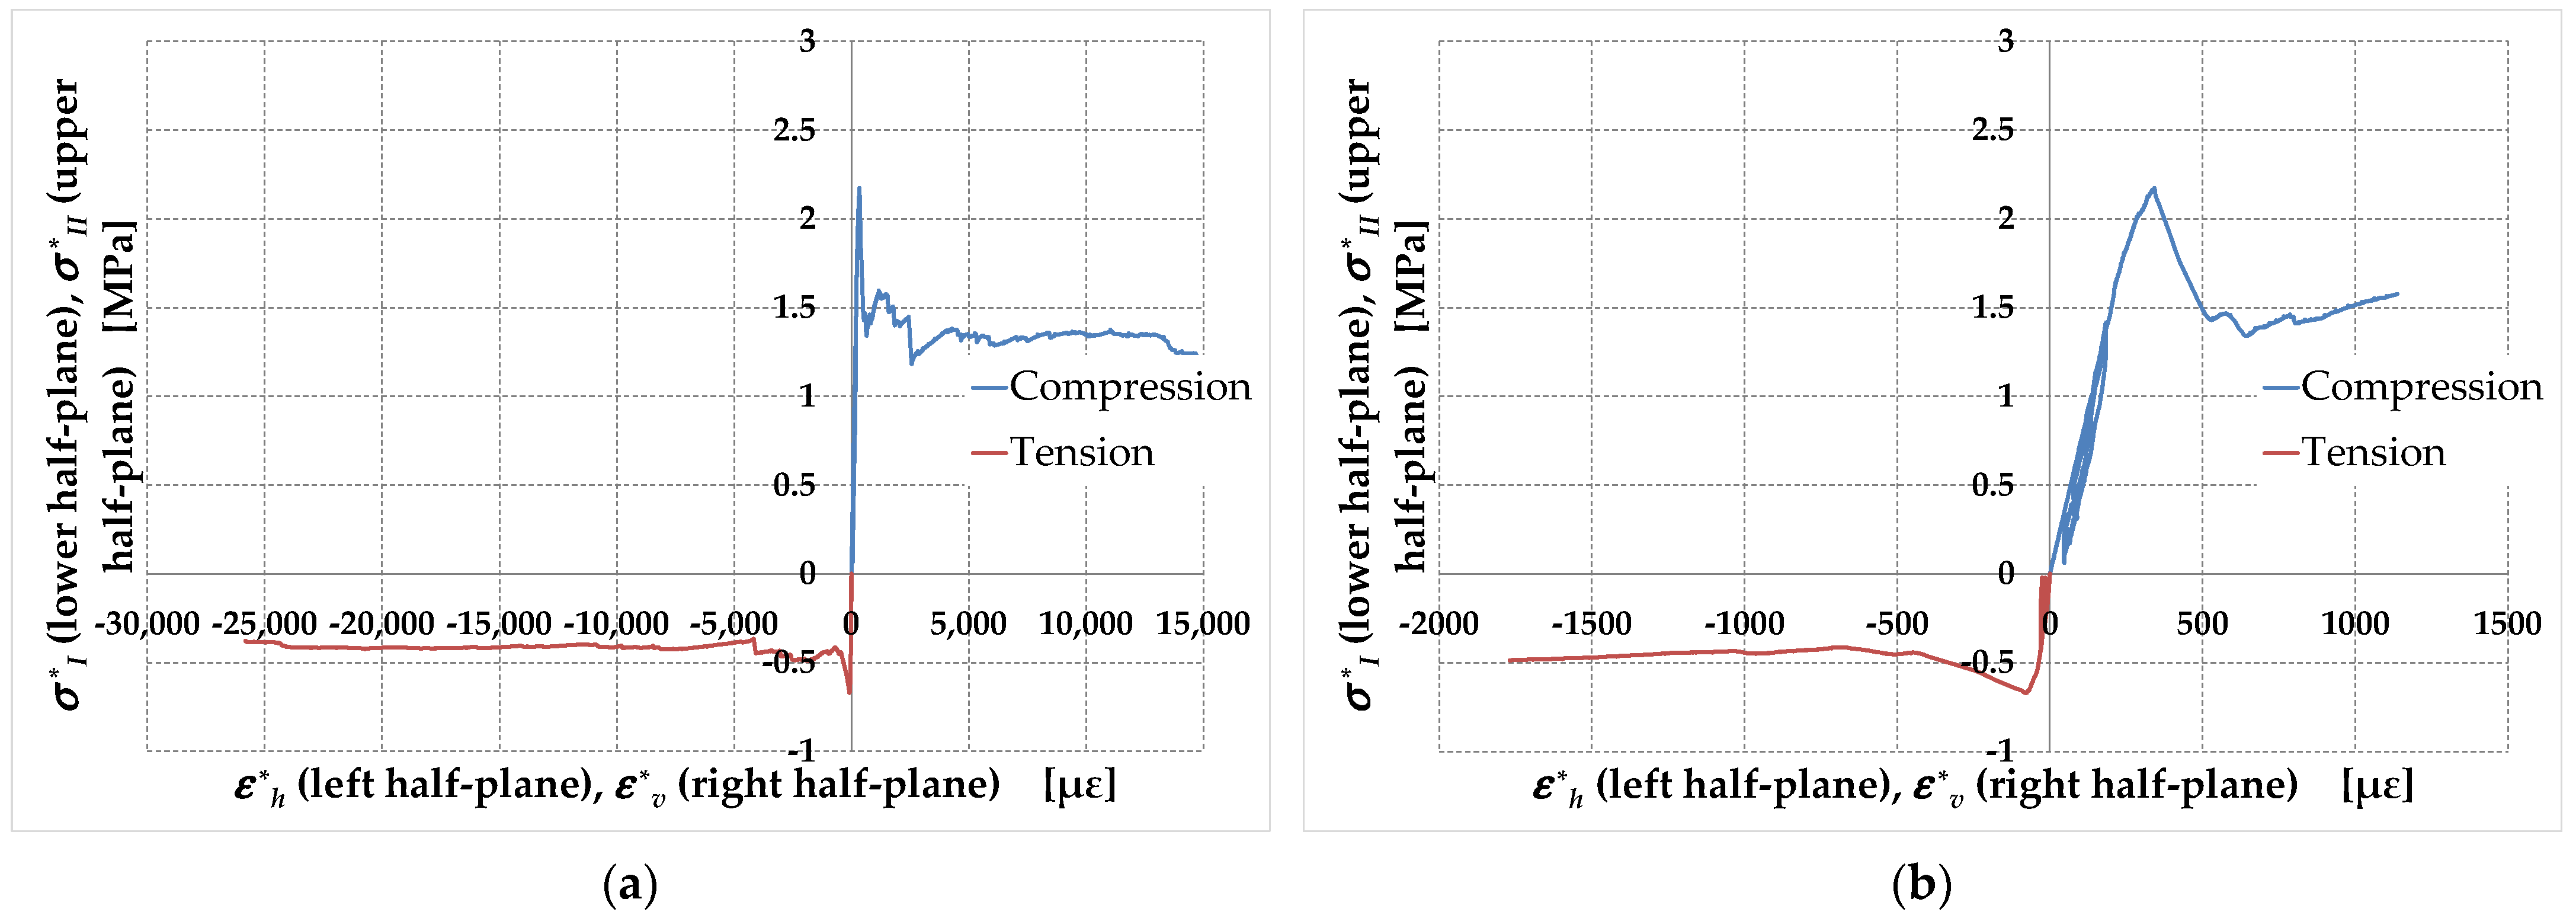
- The details in Figure 35b and Figure 36b show that and take on different values in both specimen M1-45 and specimen M2-45 (Table 6), which is not evident from Figure 35a and Figure 36a. However, although it is reasonable to think that the straps modify the stiffness along the first principal stress direction, the inconsistencies that emerged regarding the discussion on the values of and for specimen M1-90 do not allow us to reach definitive conclusions on the elastic moduli for the RMs.
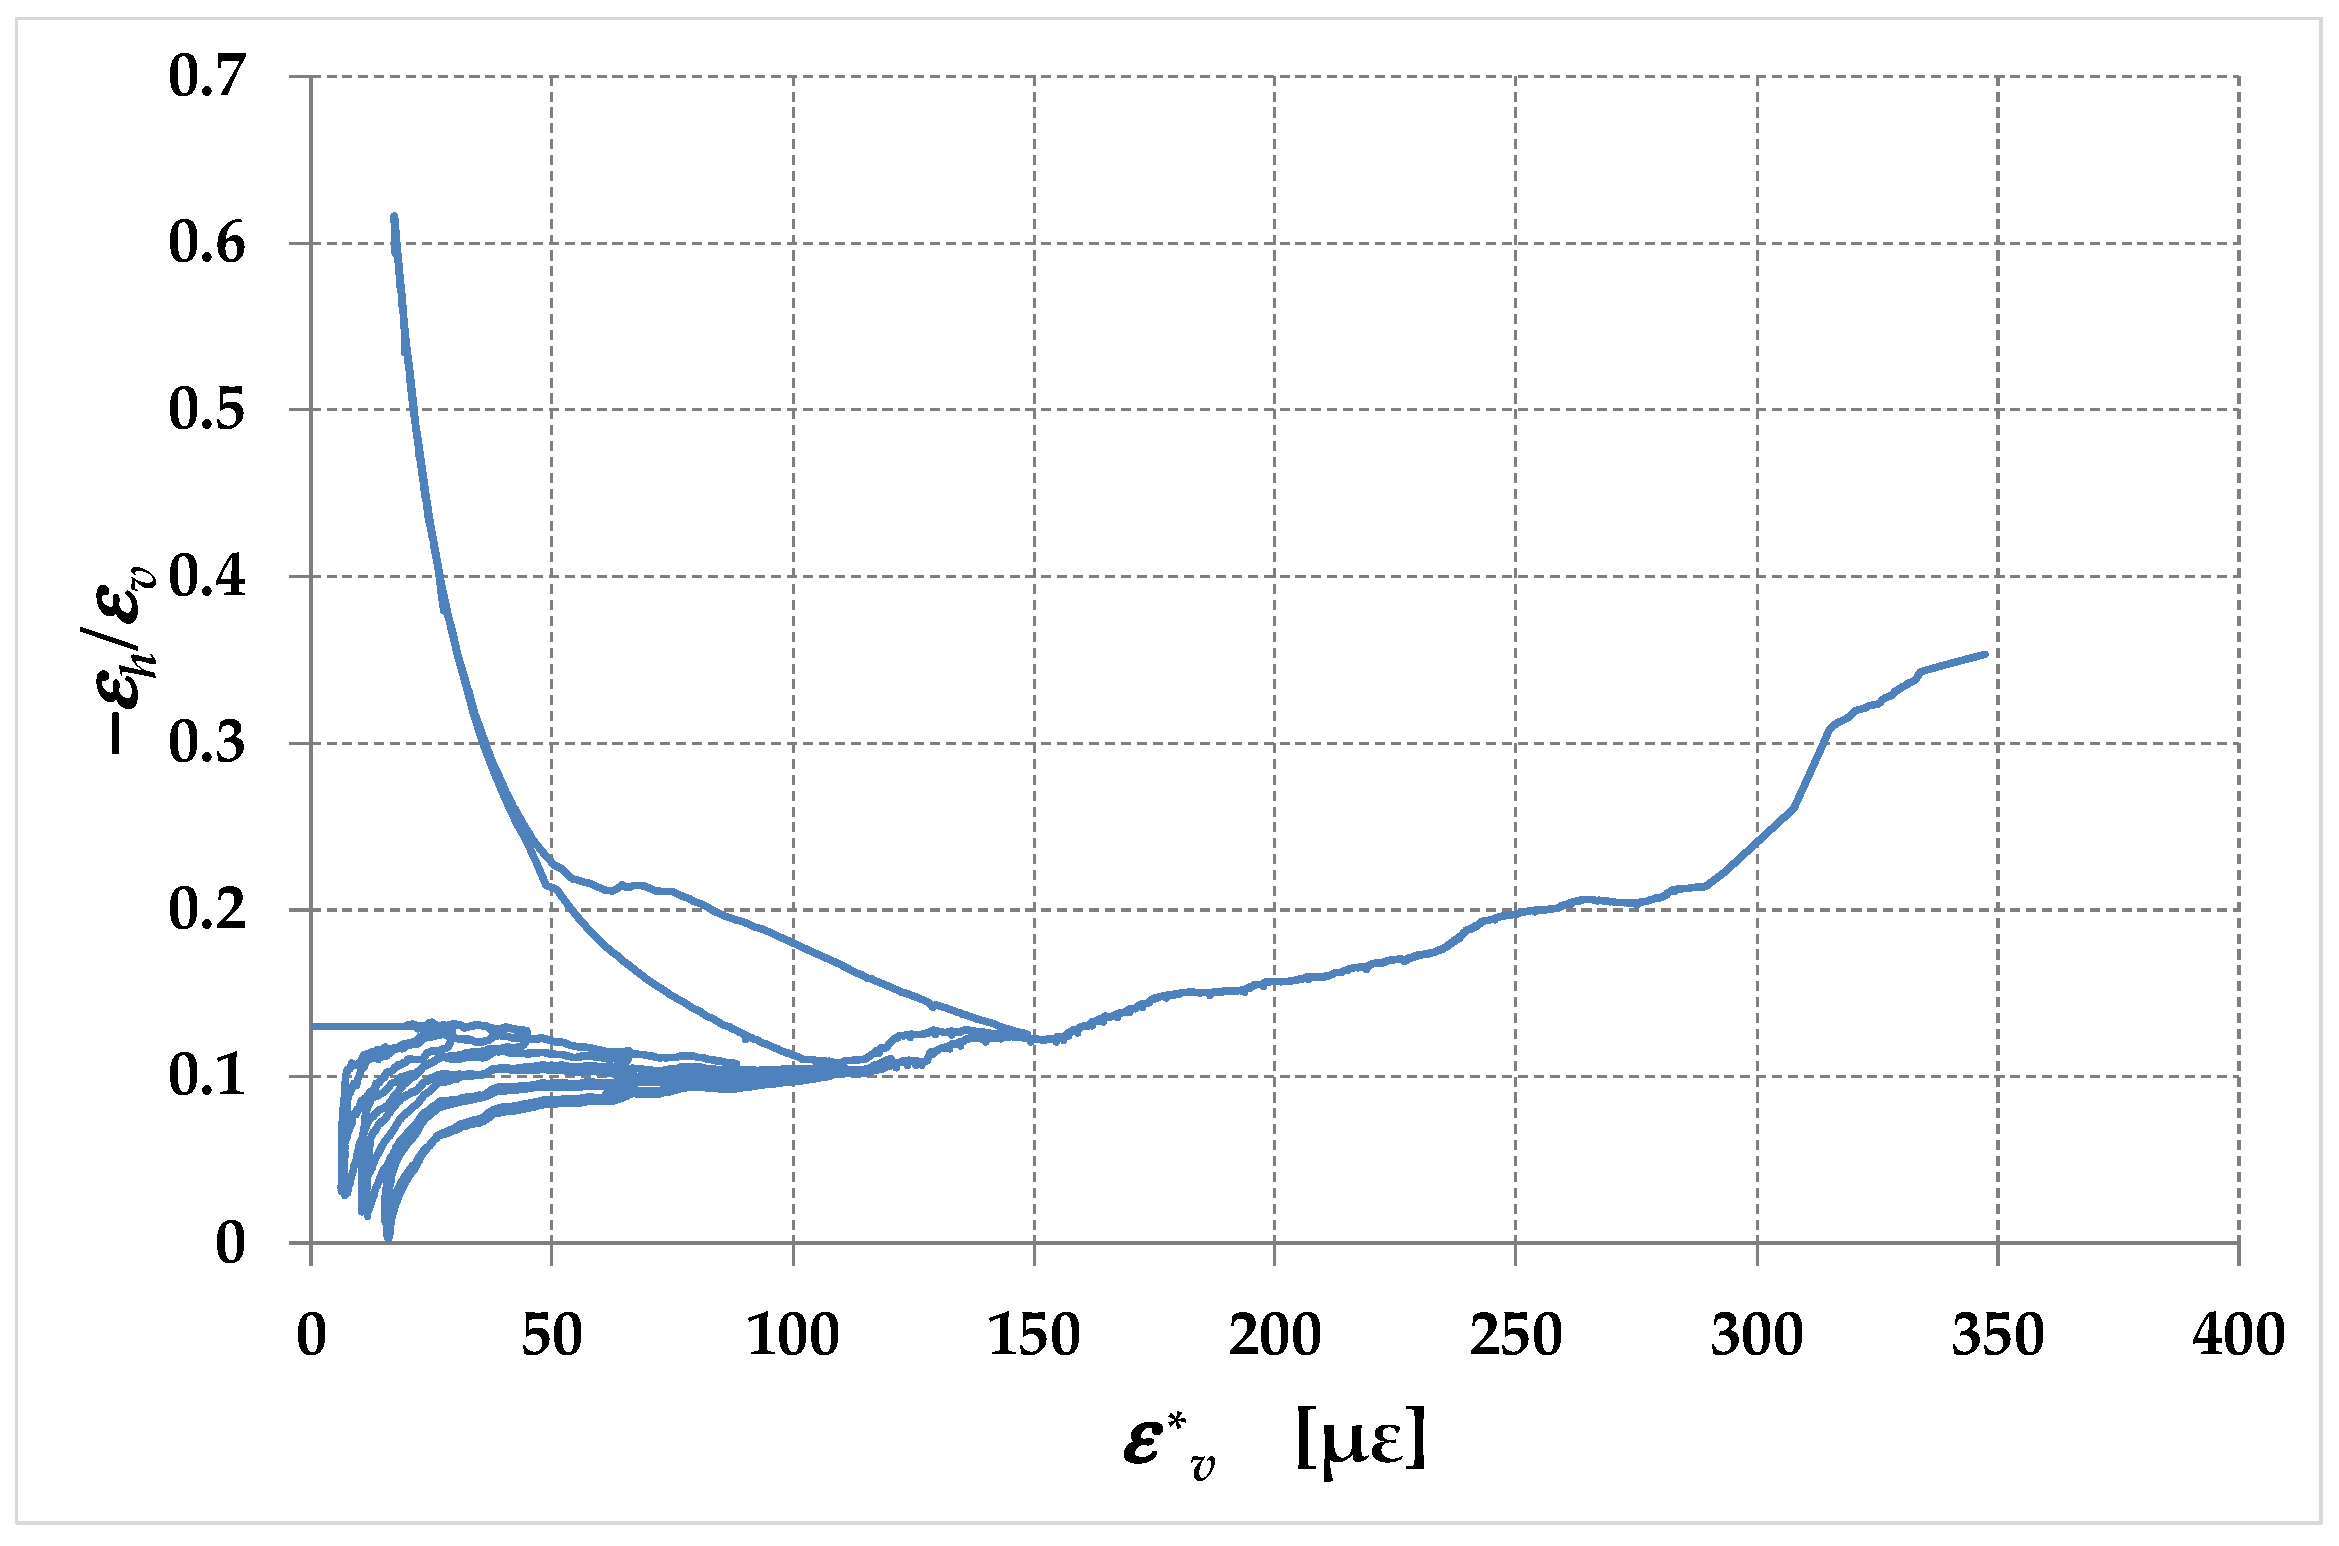
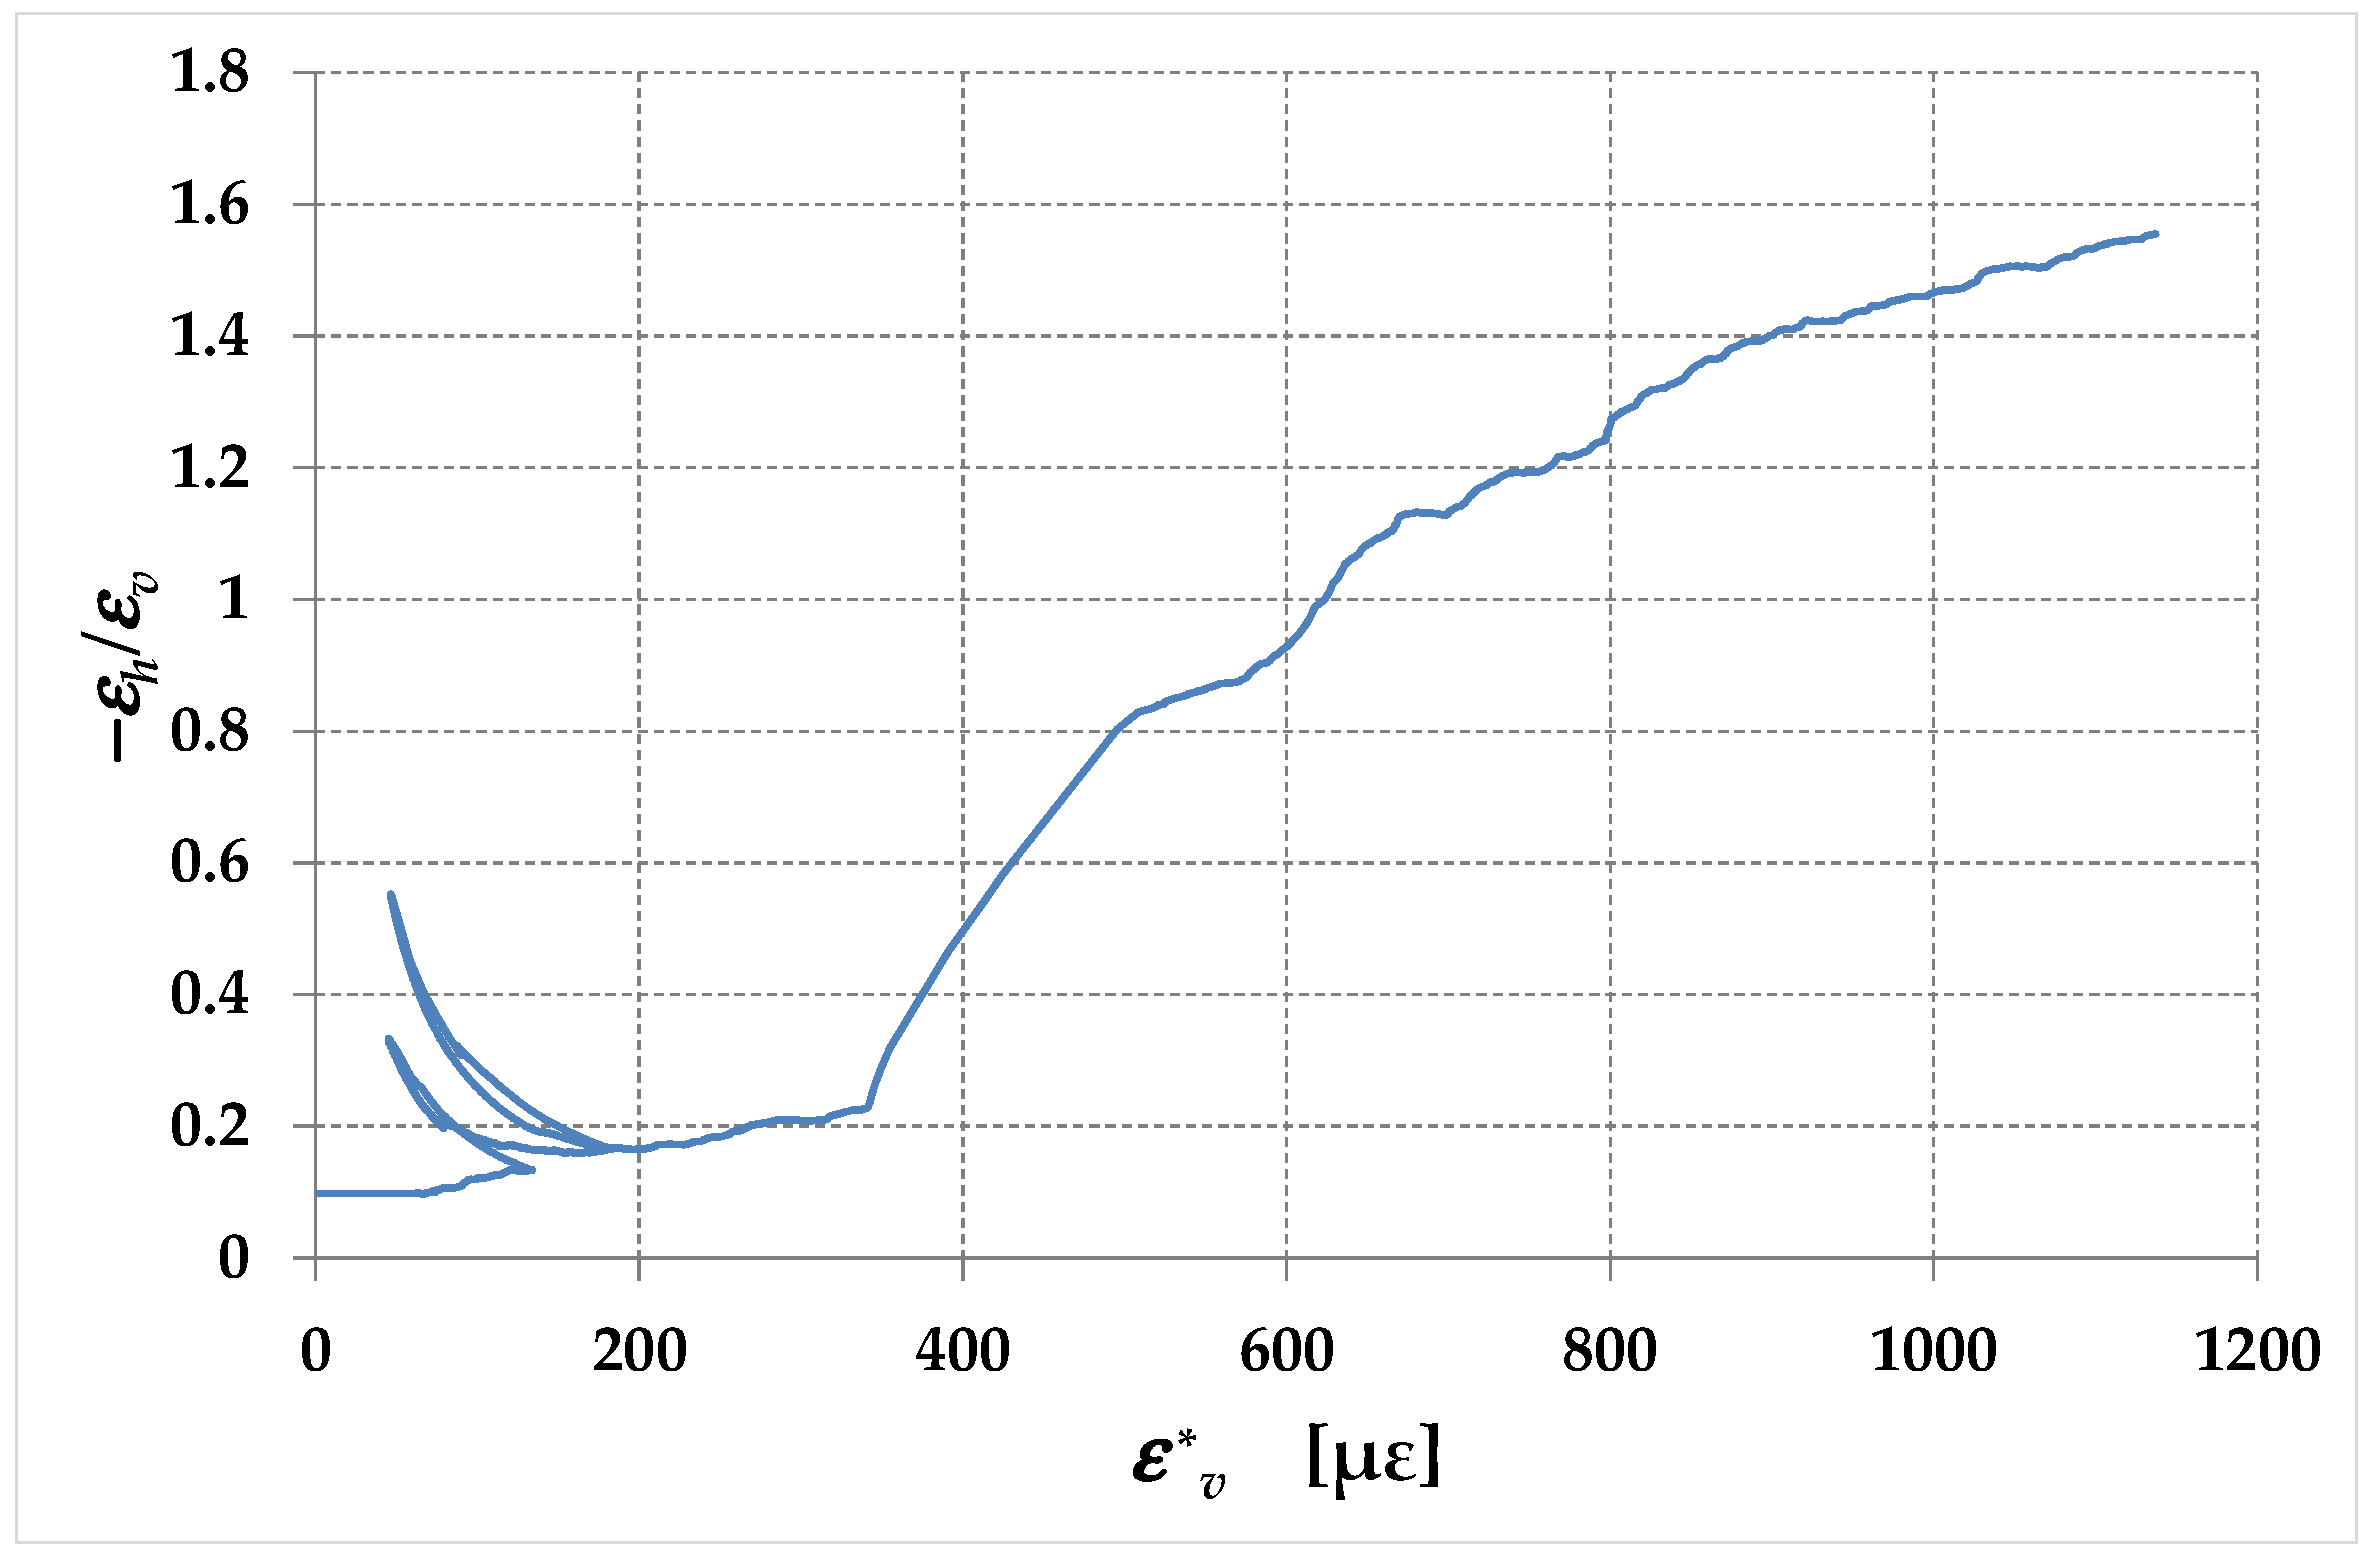
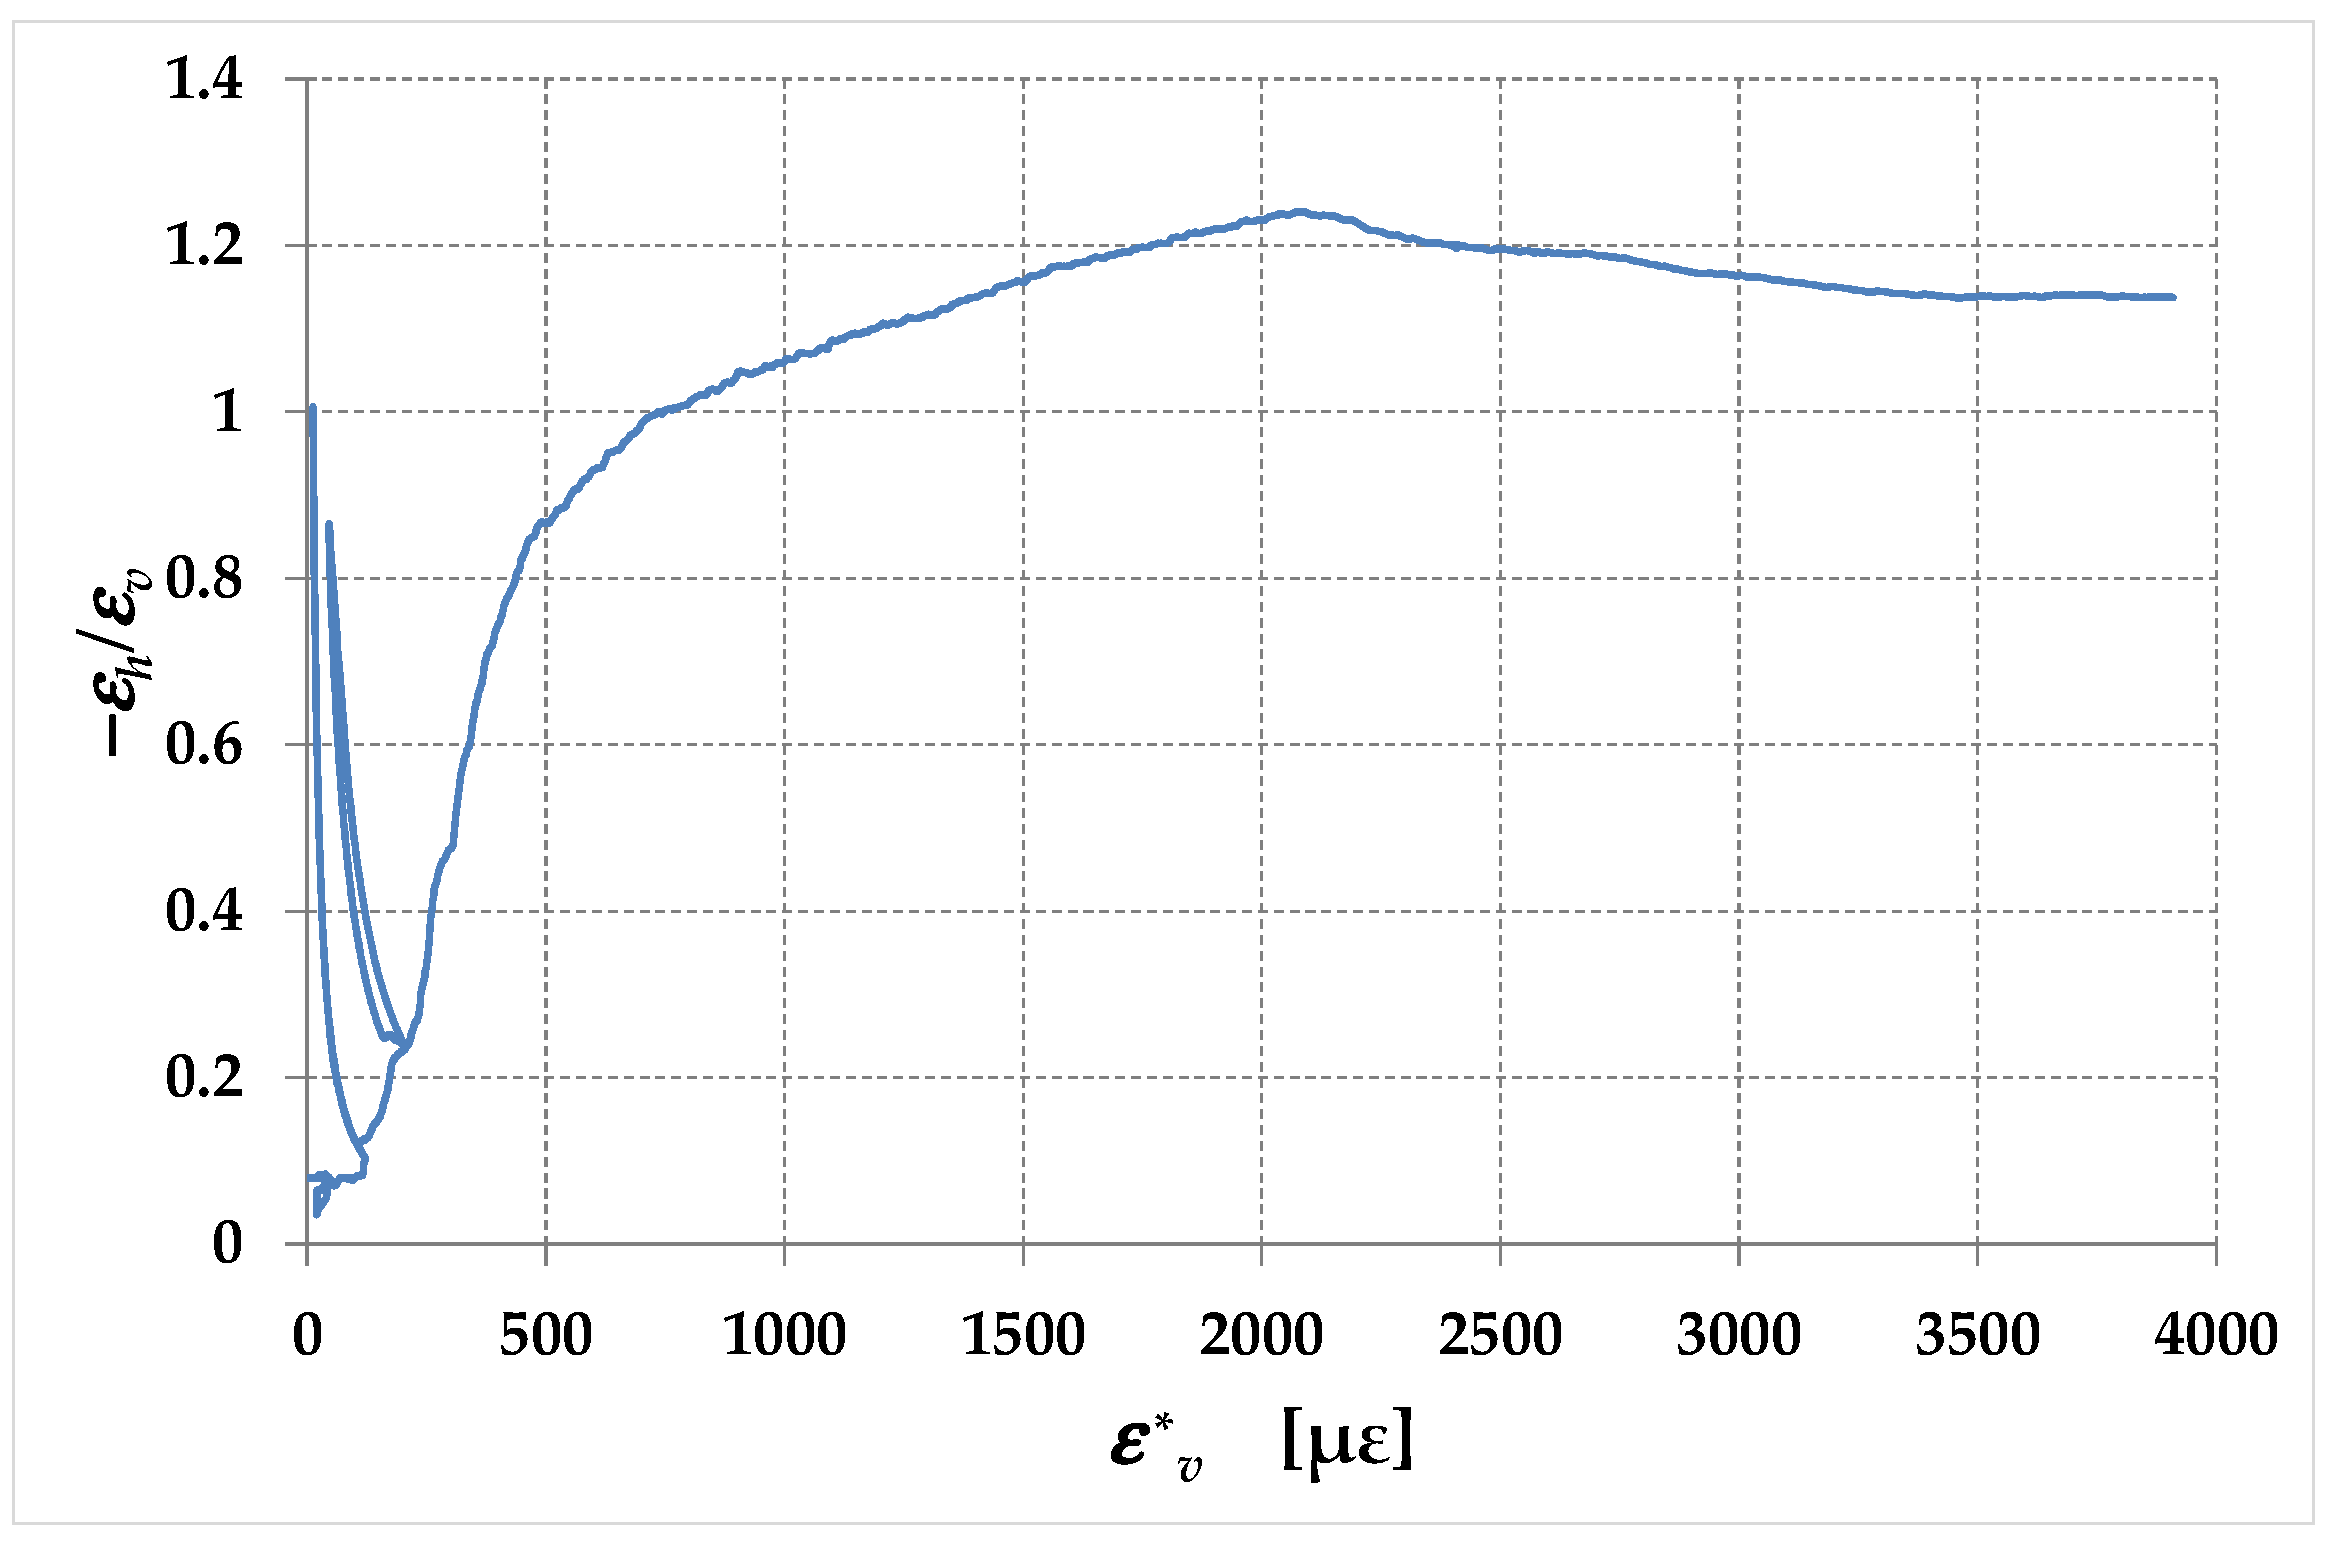
4.3. Poisson’s Ratio and Apparent Poisson’s Ratio
- Since the strengthening system of specimen M1-90 is labile (Section 4.1.1), the value in Table 7 represents the URM Poisson’s ratio. This value is about 52% of the assumption , usually made to identify the Young’s modulus from the shear modulus with Equation (13). This constitutes a well-founded reason for uncertainty regarding the values of Young’s modulus obtained in the literature from the use of Equation (13) with , which leads to an overestimation of Young’s modulus equal to about 11%.
- The Poisson ratios of the specimens with effective strengthening (specimens M1-45 and M2-45) are lower than the Poisson ratio of the specimen with ineffective strengthening (specimen M1-90) and the difference is greater the greater the number of straps. The reason for this is twofold: the possible crushing of the walls of the micro-cavities during the pre-tensioning operations and the confining action of the straps arranged along the direction of the maximum principal stress (horizontal straps), which decreases the value of . The decrease in Poisson’s ratio in RMs compared to URMs makes the use of Equation (13)—together with the hypothesis —even more unacceptable in RMs than in URMs. In fact, the overestimations of Young’s modulus for specimen M1-45 and specimen M2-45 would be about 14% and 16%, respectively.
4.4. Pseudo-Ductility
- The shear strain at the ultimate point of the shear stress–shear strain curve [69];
- The shear strain at the peak point of the shear stress–shear strain curve [77];
- The shear strain at the point on the descending branch of the shear stress–shear strain curve where the shear stress is 50% of the maximum shear stress, [79].
- Where the tangent at the origin intersects the horizontal tangent at the peak point of the curve [77];
- Where the area under the experimental curve is equal to the area under the bilinear elastoplastic approximating relationship [68];
- Where [84]:
- the shear stress is 85% of the maximum shear stress, , if:where is the area below the shear stress–shear strain curve from the first point of the curve to the point corresponding to 80% of the maximum shear stress on the descending branch; is the slope of the line connecting the first point of the shear stress–shear strain curve to the point corresponding to 40% of the maximum stress;
- the shear strain takes on the value:
4.5. Comparisons
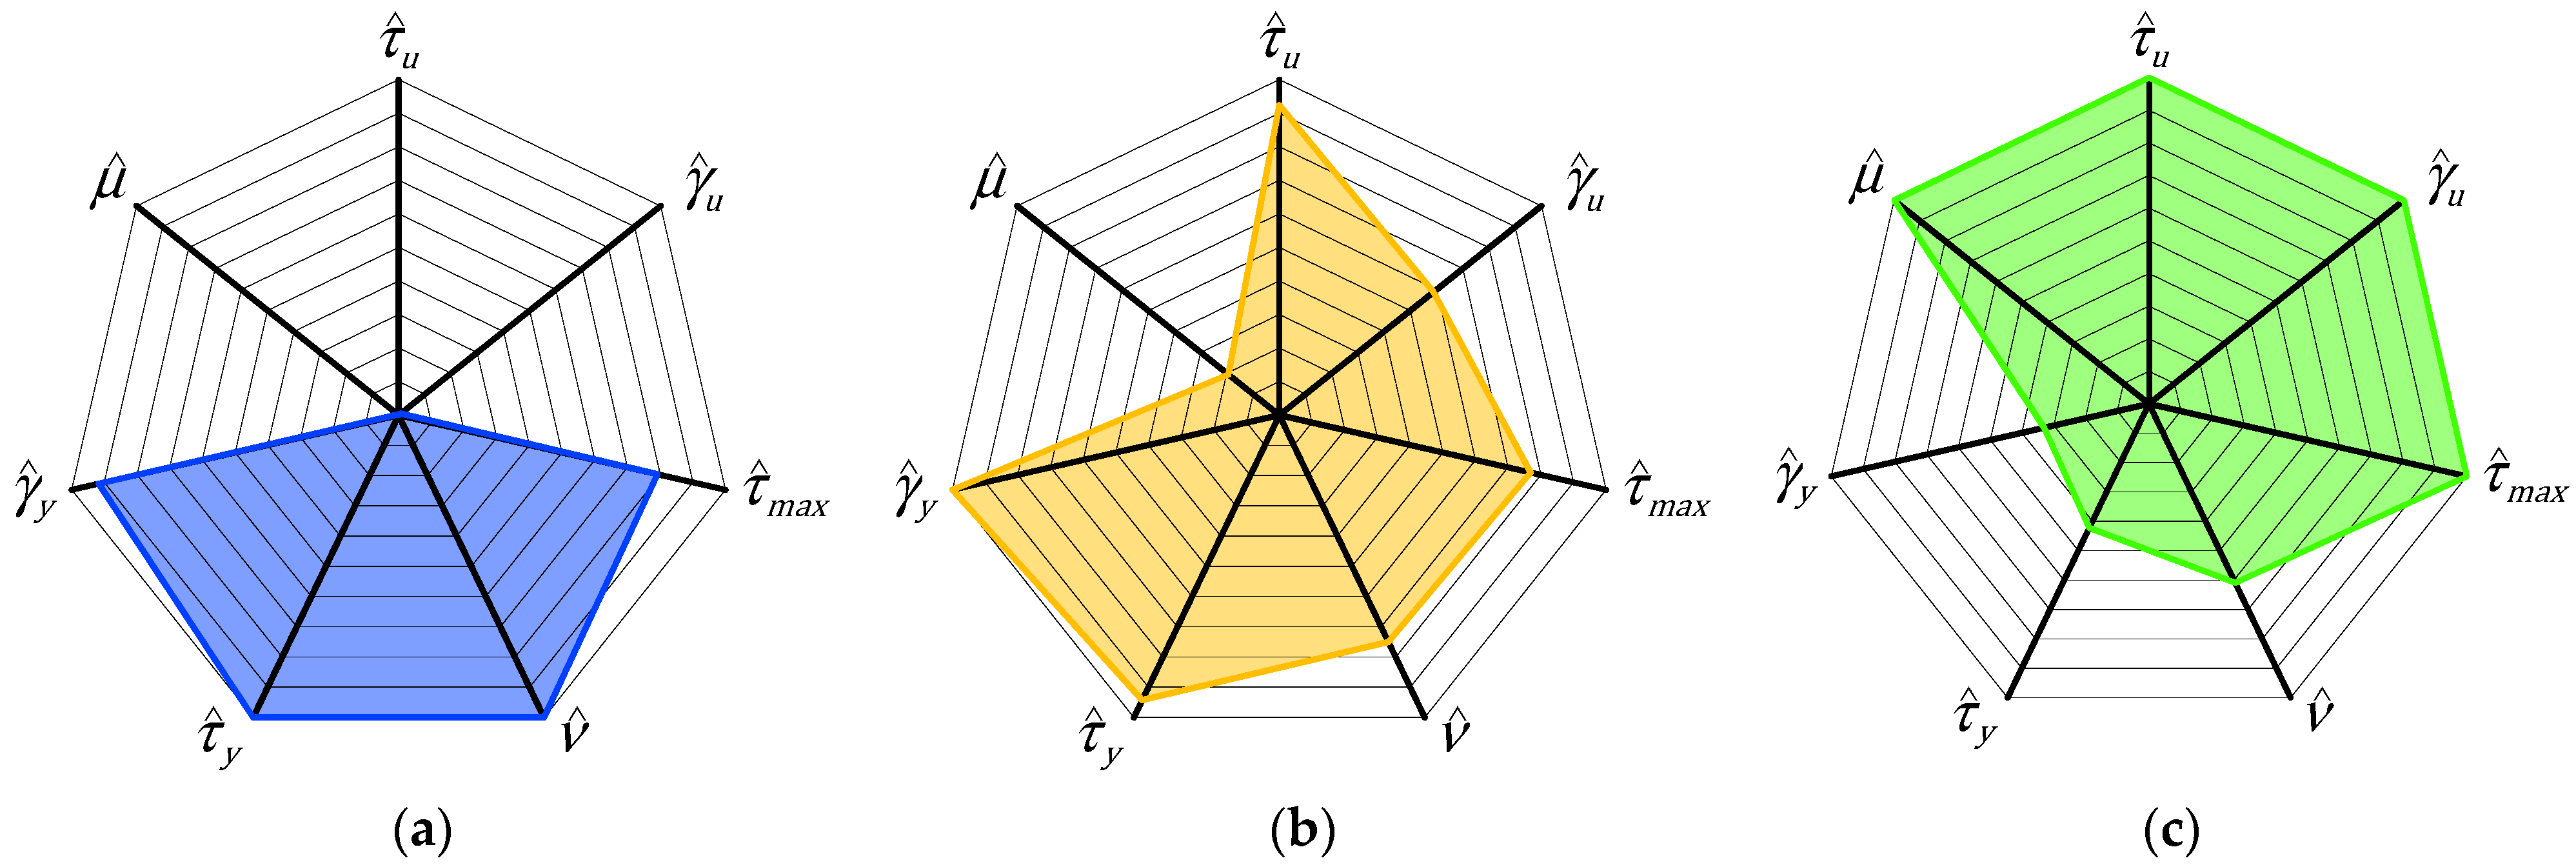
- The residual shear stress at the end of the test ();
- The ultimate shear strain ();
- The maximum shear stress ();
- The Poisson ratio ();
- The shear stress at yielding ();
- The shear strain at yielding ();
- The pseudo-ductility factor ().
- The larger area covered by specimens M1-45 (Figure 41b) and M2-45 (Figure 41c) compared to specimen M1-90 (Figure 41a) along the axes of the variables , , , and is a measure of the increase in both shear strength and ductility, a specific feature of the CAM® system. Of particular relevance are the values along the axis. In fact, since in specimen M1-90 , the strengthening gives the masonry walls a characteristic that the masonry does not possess, that is, the ability to withstand shear stresses even for large values of the shear strains, without ever reaching an actual failure. Therefore, the strengthening not only significantly increases the low values of some variables in the ultimate state, such as and , but also gives the masonry walls completely new characteristics.
- The smaller area covered by specimens M1-45 (Figure 41b) and M2-45 (Figure 41c) compared to specimen M1-90 (Figure 41a) along the and axes does not in itself have a negative meaning. It simply indicates that damage occurs earlier in RMs than in URMs, but this has no negative effect on the overall behavior at the ultimate state (governed by the variables , , and ) and the shear strength (governed by the variable ).
- The variation in the values of indicates that the strengthening technique decreases the Poisson ratio, which requires evaluation of the single test setup.
5. Conclusions
- The straps parallel to the mortar joints (one strap per loop) provide no increase in either shear strength or ductility. However, they are helpful in preventing falling debris, which is a major cause of injury.
- The straps forming angles with the mortar joints (one strap per loop) do not increase the maximum shear stress but provide the masonry wall with the ability to withstand large shear strains without losing shear-bearing capacity.
- By increasing the number of straps per loop in the arrangement, both the maximum shear stress and the ductility increase. This means that the CAM® system is a strengthening system capable of increasing both ductility and shear strength.
- The static analysis performed in the Mohr plane according to the RILEM interpretation of the diagonal compression test leads to stress/strain curves that are not consistent with the experimental evidence, for the values assumed by both the ratio and the ratio. The reason for this seems to lie in the underestimation of the hydrostatic stress at the center of the specimen by the RILEM approach. Therefore, the interpretation of the diagonal compression test needs a more accurate analysis in the Mohr plane.
- The Poisson ratio, , is much smaller than , which is the value usually taken as a reference in interpreting the experimental results of masonry walls. The experimental program provided the value , which is about 52% of the conventional value .
- In the context of linear elasticity for homogeneous and isotropic materials, the usual overestimation of the Poisson ratio leads to an overestimation of Young’s modulus of about 11%, which gives rise to a well-founded doubt regarding the values of Young’s moduli obtained in the literature from diagonal compression tests.
- The apparent Poisson’s ratio decreases for low values of the applied load and increases for high values of the applied load. The reason for the initial decreasing behavior could be the presence of micro-cavities that collapse during the early stages of the load test.
- The use of CAM-like strengthening systems anticipates the onset of damage and shortens the length of the initial linear branch.
- The value of depends on the percentage of reinforcement. In particular, the greater the percentage of reinforcement, the lower the value of . This makes it impossible to use a single value for the Poisson ratio in RMs, which is in any case lower than that in URMs.
- Being a greater overestimation in RMs than in URMS, the value of 0.25 usually assumed for the Poisson ratio leads to even greater overestimations of Young’s modulus.
- The trend of the apparent Poisson’s ratio is different from the trend of the apparent Poisson’s ratio in diagonal compression tests performed on URMs since it gives rise to a monotonically non-decreasing function. This could be a consequence of the pre-tensioning of the straps, in particular of those arranged along the direction of the load. In fact, the pre-tension could cause the collapse of the micro-cavities before the start of the load test, which would eliminate the initial decreasing branch in the law of the apparent Poisson’s ratio.
- The experimental program provided evidence of a possible anisotropy caused by the use of straps in CAM-like strengthening systems.
6. Future Developments
Supplementary Materials
Funding
Data Availability Statement
Acknowledgments
Conflicts of Interest
Appendix A. Some Insights into the Interpretation of the Diagonal Compression Test
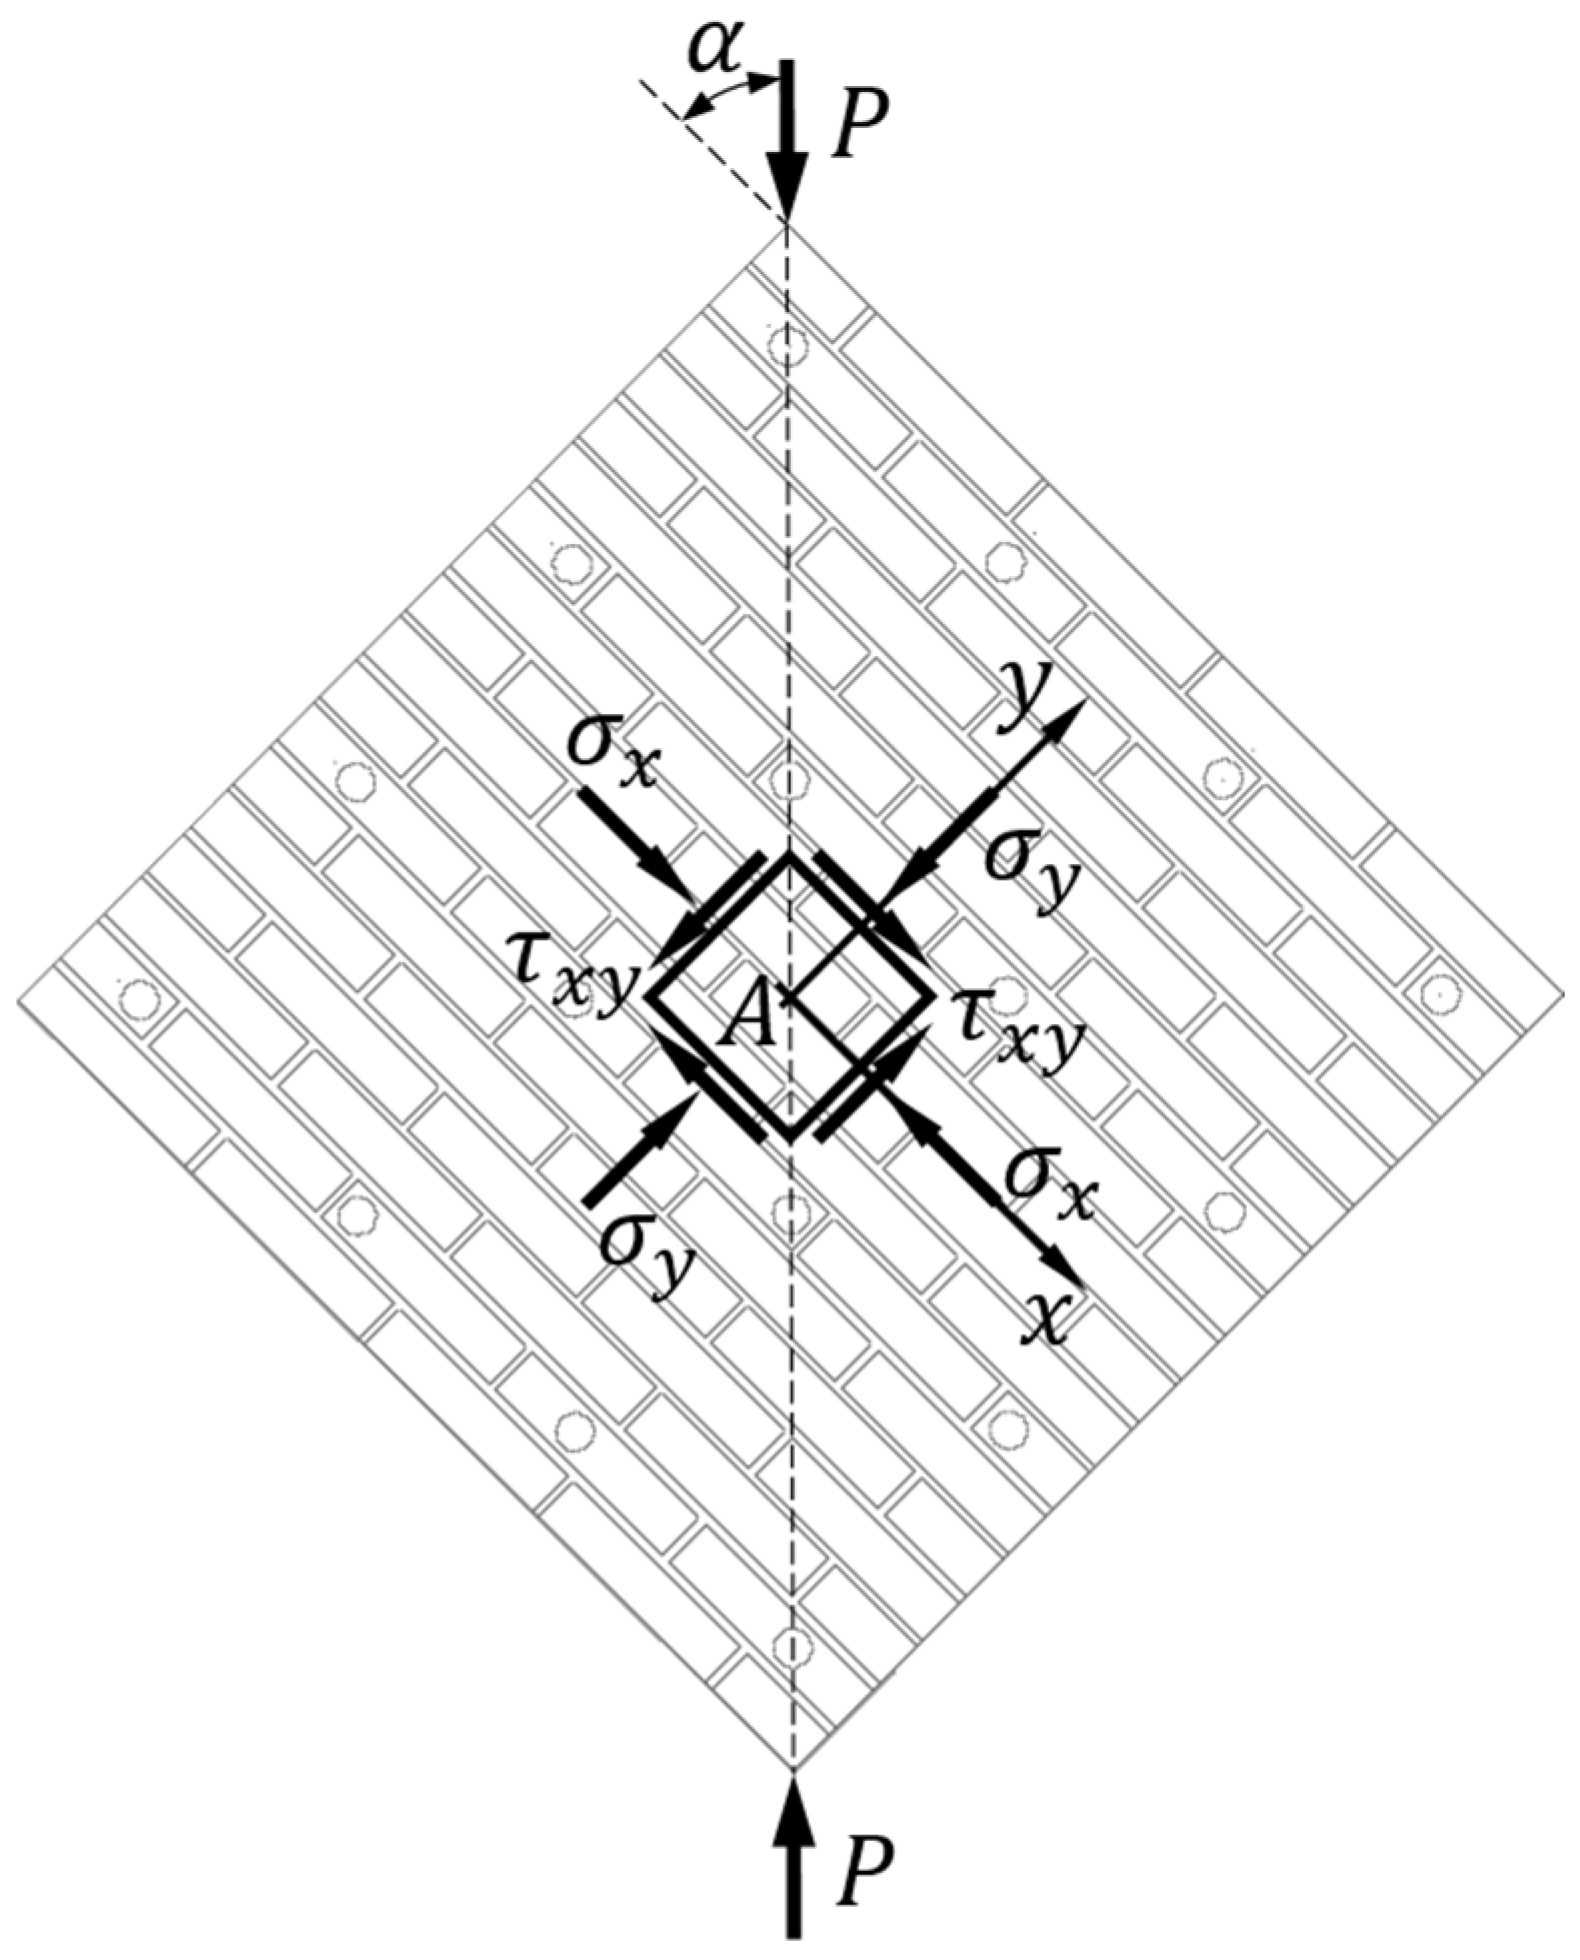
- P is the diagonal compression load applied during the test;
- α is the angle between the direction of loading and the horizontal mortar joints (bed joints);
- A is the center of gravity of the wall specimen and origin of the local reference frame;
- x and y are the axes (of the local reference frame of origin A) parallel, respectively, to the horizontal mortar joints (bed joints) and to the vertical mortar joints (head joints);
- σx is the normal stress acting—in the x direction—on the planes of the infinitesimal neighborhood of A that are perpendicular to the x-axis;
- σy is the normal stress acting—in the y direction—on the planes of the infinitesimal neighborhood of A that are perpendicular to the y-axis;
- τxy is the shear stress—directed along the y-axis—acting on the planes of the infinitesimal neighborhood of A that are perpendicular to the x-axis (the x index designates the unit normal vector to the coordinate plane on which the shear stress acts, the y index identifies the coordinate direction along which the shear stress acts).


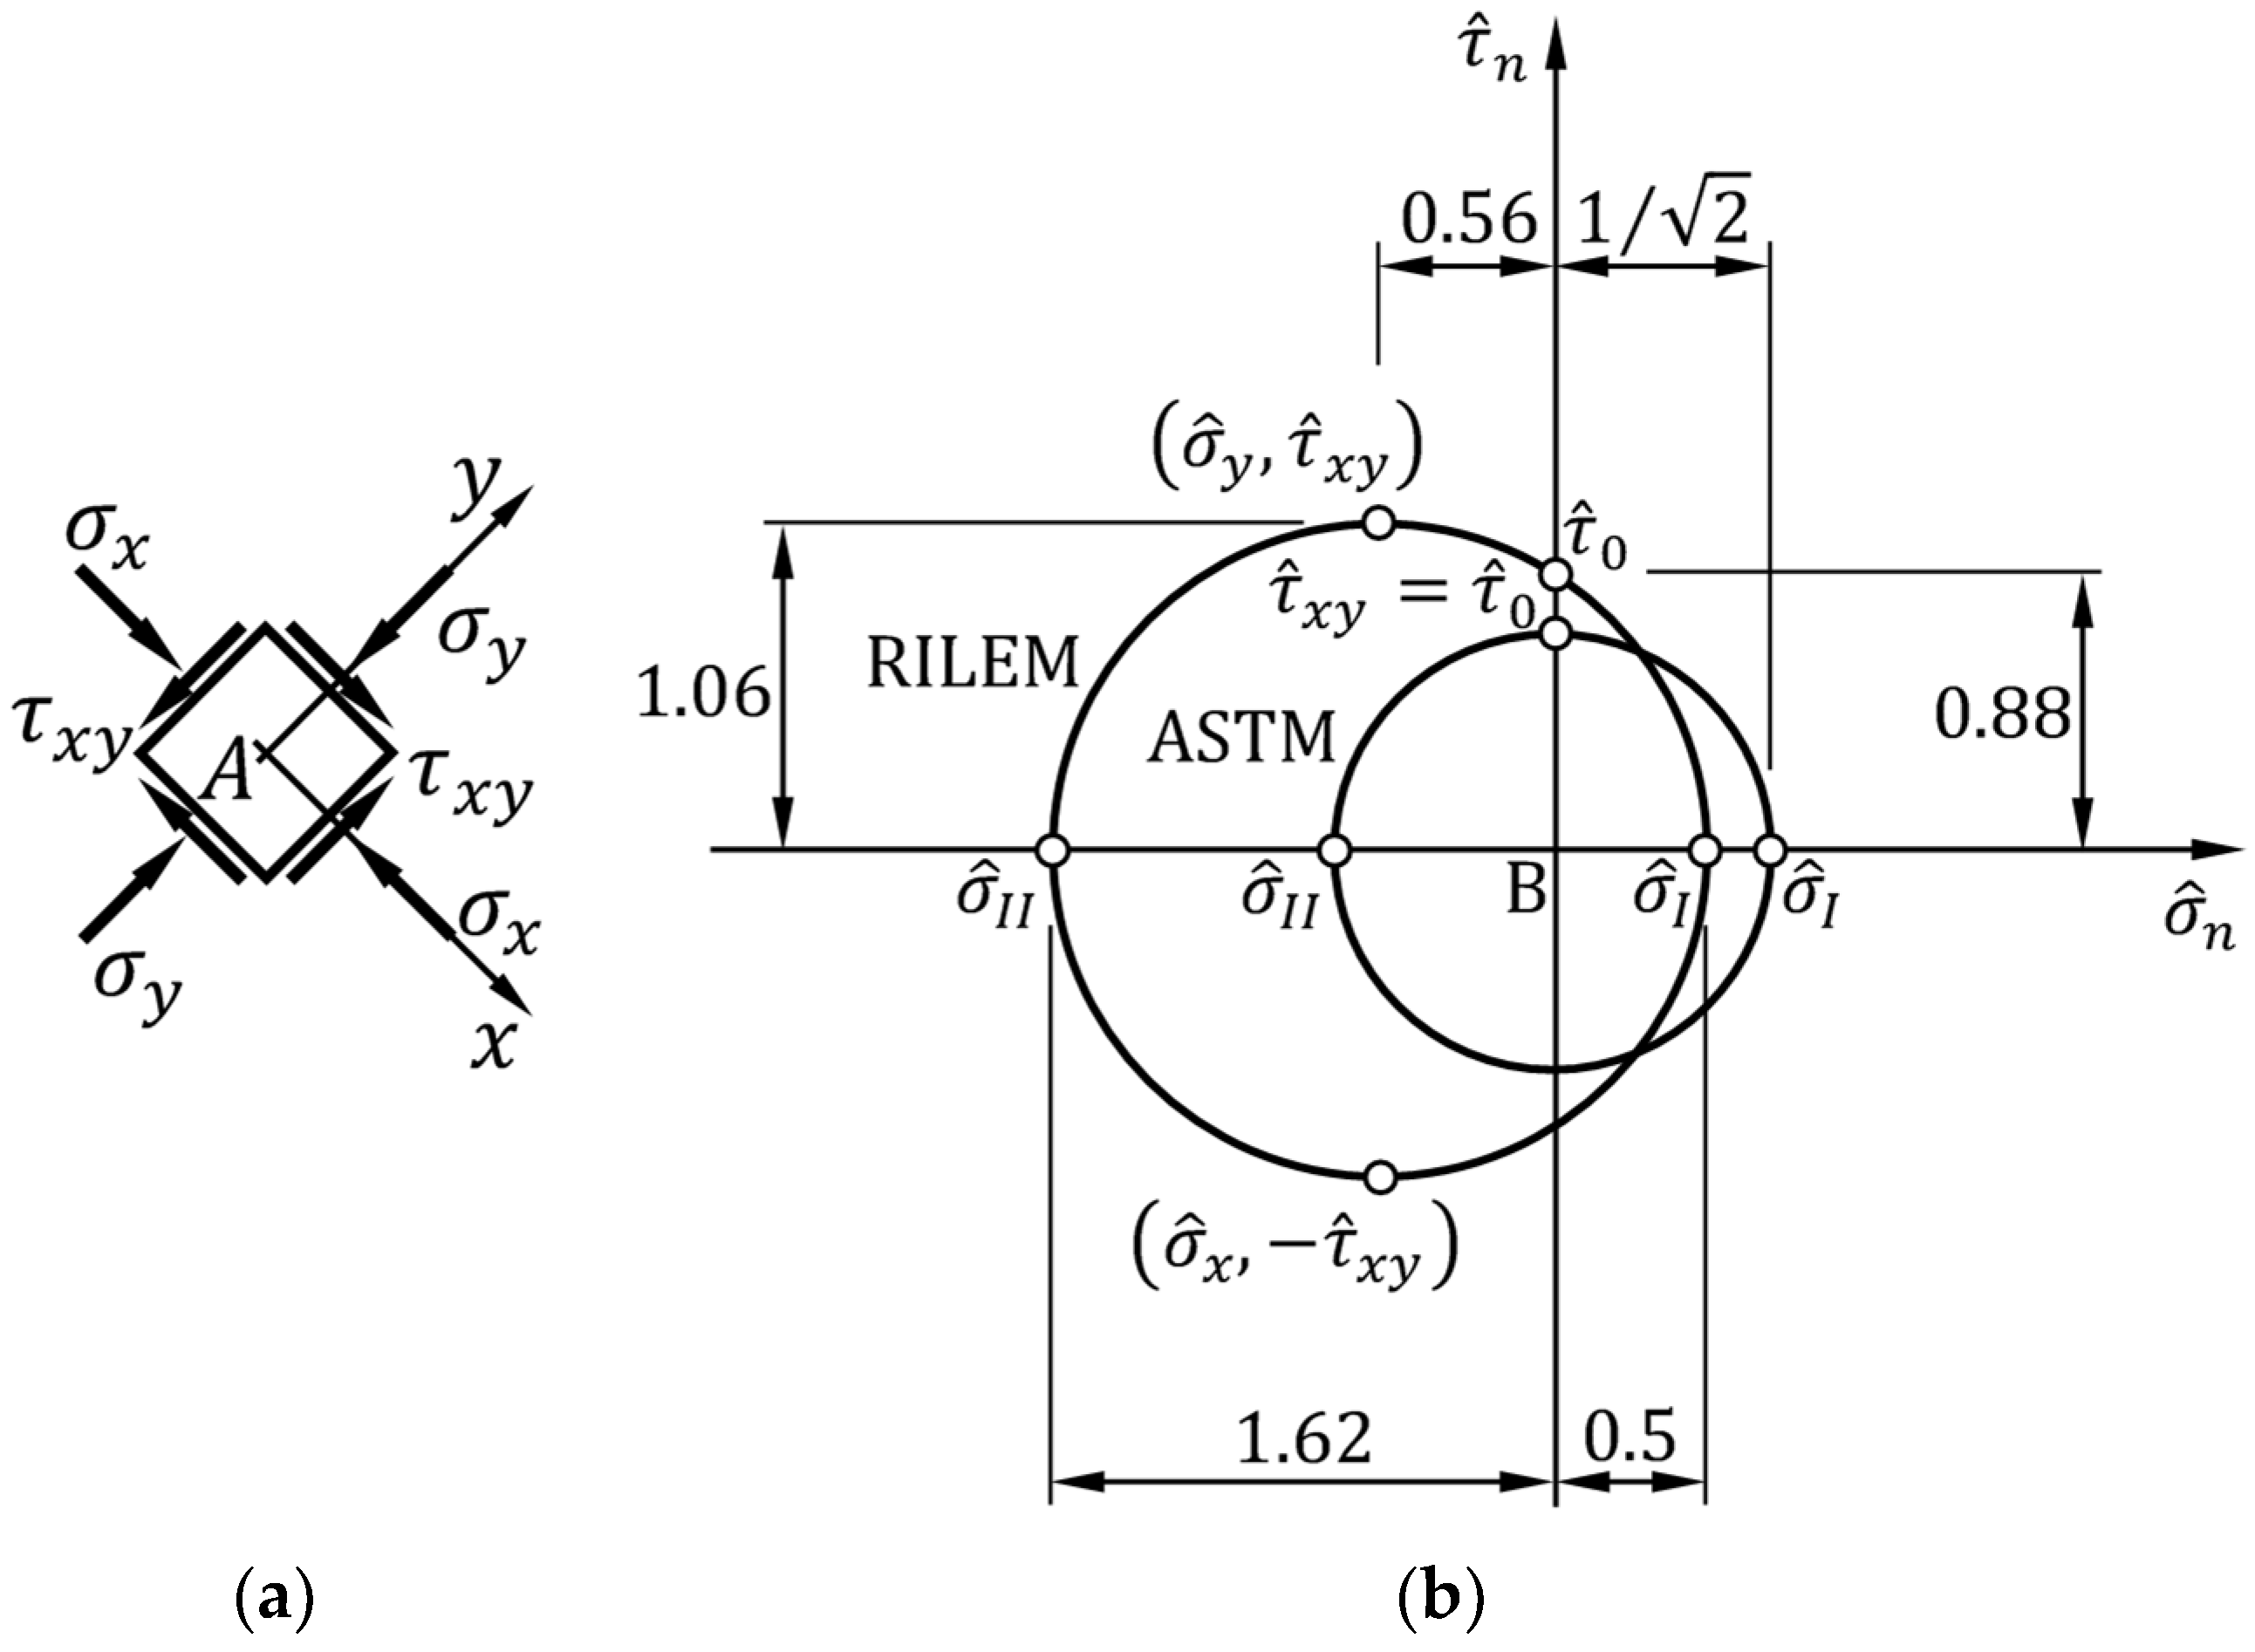
- The straight line connecting the Mohr pole with the stress point of coordinates is not inclined by . Due to the Mohr pole property, this means that the stress point does not provide the stress state acting on the bed joint passing through point A.
- Even if the straight line connecting the Mohr pole with the stress point was at , the non-homogeneous stress state inside the specimen does not allow us to apply the results found for the neighborhood of A to other points and their neighborhoods. Thus, the stress state at the center of gravity A cannot provide information on the shear force applied to the upper and lower faces of the specimen.
References
- Cundari, G.A.; Milani, G.; Failla, G. Seismic vulnerability evaluation of historical masonry churches: Proposal for a general and comprehensive numerical approach to cross-check results. Eng. Fail. Anal. 2017, 82, 208–228. [Google Scholar] [CrossRef]
- Andreini, M.; De Falco, A.; Giresini, L.; Sassu, M. Mechanical Characterization of Masonry Walls with Chaotic Texture: Procedures and Results of In-Situ Tests. Int. J. Archit. Herit. 2014, 8, 376–407. [Google Scholar] [CrossRef]
- Bothara, J.K.; Hiçyilmaz, K.M.O. General observations of building behaviour during the 8th October 2005 Pakistan earthquake. Bull. N. Z. Soc. Earthq. Eng. 2008, 41, 209–233. [Google Scholar] [CrossRef]
- Zhao, T.; Zhang, X.; Tian, Z. Analysis of earthquake damage to masonry school buildings in Wenchuan earthquake. World Inf. Earthq. Eng. 2009, 25, 150–158. [Google Scholar]
- Kaplan, H.; Bilgin, H.; Yilmaz, S.; Binici, H.; Öztas, A. Structural damages of L’Aquila (Italy) earthquake. Nat. Hazards Earth Syst. Sci. 2010, 10, 499–507. [Google Scholar] [CrossRef]
- Dizhur, D.; Ismail, N.; Knox, C.; Lumantarna, R.; Ingham, J.M. Performance of unreinforced and retrofitted masonry buildings during the 2010 Darfield earthquake. Bull. N. Z. Soc. Earthq. Eng. 2010, 43, 321–339. [Google Scholar] [CrossRef]
- Brandonisio, G.; Lucibello, G.; Mele, M.; De Luca, A. Damage and performance evaluation of masonry churches in the 2009 L’Aquila earthquake. Eng. Fail. Anal. 2013, 34, 693–714. [Google Scholar] [CrossRef]
- Ismail, N. Selected Strengthening Techniques for the Seismic Retrofit of Unreinforced Masonry Buildings. Ph.D. Thesis, The University of Auckland, Auckland, New Zealand, 2012. Available online: https://researchspace.auckland.ac.nz/handle/2292/19106 (accessed on 2 December 2023).
- Konthesingha, K.M.C.; Masia, M.J.; Petersen, R.B.; Mojsilovic, N.; Simundic, G.; Page, A.W. Static cyclic in-plane shear response of damaged masonry walls retrofitted with NSM FRP strips—An experimental evaluation. Eng. Struct. 2013, 50, 126–136. [Google Scholar] [CrossRef]
- Sayin, B.; Yildizlar, B.; Akcay, C.; Gunes, B. The retrofitting of historical masonry buildings with insufficient seismic resistance using conventional and non-conventional techniques. Eng. Fail. Anal. 2019, 115, 454–463. [Google Scholar] [CrossRef]
- Ferretti, E.; Pascale, G. Some of the Latest Active Strengthening Techniques for Masonry Buildings: A Critical Analysis. Materials 2019, 12, 1151. [Google Scholar] [CrossRef]
- Angiuli, R.; Corvaglia, P.; Micelli, F.; Aiello, M.A. SMA-Based Composites for Active Confinement of Masonry Columns. In Proceedings of the International Conference on Shape Memory and Superelastic Technologies (SMST), Hong Kong, China, 6–9 November 2011. [Google Scholar]
- Micelli, F.; Angiuli, R.; Corvaglia, P.; Aiello, M.A. Passive and SMA-activated confinement of circular masonry columns with basalt and glass fibers composites. Compos. Part B-Eng. 2014, 67, 348–362. [Google Scholar] [CrossRef]
- Recupero, A.; Spinella, N. The Strengthening of Masonry Walls in Seismic-Prone Areas with the CAM System: Experimental and Numerical Results. Infrastructures 2020, 5, 108. [Google Scholar] [CrossRef]
- Di Re, P.; Greco, M.; Lofrano, E.; Paolone, A. Finite element modeling of masonry elements reinforced with the CAM system. Structures 2022, 44, 740–754. [Google Scholar] [CrossRef]
- Dolce, M.; Nigro, D.; Ponzo, F.C.; Marnetto, R. The CAM system for the retrofit of masonry structures. In Proceedings of the 7th International Seminar on Seismic Isolation, Passive Energy Dissipation and Active Control of Vibrations of Structures, Assisi, Italy, 2–5 October 2001. [Google Scholar]
- Dolce, M.; Ponzo, F.C.; Di Croce, M.; Moroni, C.; Giordano, F.; Nigro, D.; Marnetto, R. Experimental assessment of the CAM and DIS-CAM systems for the seismic upgrading of monumental masonry buildings. In Proceedings of the PROHITECH 2009 1st International Conference on Protection of Historical Constructions, Rome, Italy, 21–24 June 2009; CRC Press/Balkema: Leiden, The Netherlands, 2009; pp. 1021–1028. [Google Scholar]
- Dolce, M.; Ponzo, F.C.; Goretti, A.; Moroni, C.; Giordano, F.; De Canio, G.; Marnetto, R. 3d dynamic tests on 2/3 scale masonry buildings retrofitted with different systems. In Proceedings of the 14th World Conference on Earthquake Engineering, Beijing, China, 12–17 October 2008. [Google Scholar]
- Marnetto, R.; Vari, A.; Marnetto, L.; Leonori, M. Conservare l’Edilizia in Muratura: Il Sistema CAM—Cuciture Attive dei Manufatti [Conserving the Building Heritage in Masonry: The CAM System—Active Confinement of Manufactured Buildings]; Edizioni PREprogetti: Rome, Italy, 2014. [Google Scholar]
- Marnetto, R.; Vari, A. Linee Guida—Cuciture Attive per la Muratura: Procedura Generale per la Progettazione, Modellazione, Calcolo e Verifica di Edifici in Muratura Rinforzati con il Sistema di Cucitura attiva CAM; EDIL CAM Sistemi S.r.l.: Roma, Italy, 2015. [Google Scholar]
- Al-Manaseer, A.A.; Neis, V.V. Load tests on post-tensioned masonry wall panels. ACI Struct. J. 1987, 84, 467–472. [Google Scholar] [CrossRef]
- Ganz, H.R.; Shaw, G. Stressing masonry’s future. Civ. Eng. 1997, 67, 42–45. [Google Scholar]
- Rosenboom, O.A.; Kowalsky, M.J. Reversed in-plane cyclic behavior of post-tensioned clay brick masonry walls. J. Struct. Eng. ASCE 2004, 130, 787–798. [Google Scholar] [CrossRef]
- Bean Popehn, J.R.; Schultz, A.E.; Lu, M.; Stolarski, H.K.; Ojard, N.J. Influence of transverse loading on the stability of slender unreinforced masonry walls. Eng. Struct. 2008, 30, 2830–2839. [Google Scholar] [CrossRef]
- Sperbeck, S. Seismic Risk Assessment of Masonry Walls and Risk Reduction by Means of Prestressing. Ph.D. Thesis, Technical University of Braunschweig, University of Florence, Florence, Italy, 2009. [Google Scholar]
- Preciado, A. Seismic Vulnerability Reduction of Historical Masonry Towers by External Prestressing Devices. Ph.D. Thesis, Technical University of Braunschweig (Germany), University of Florence, Florence, Italy, 2011. [Google Scholar]
- Ismail, N.; Schultz, A.E.; Ingham, J.M. Out-of-Plane Seismic Performance of Unreinforced Masonry Walls Retrofitted using Post-Tensioning. In Proceedings of the 15th International Brick and Block Masonry Conference, Florianópolis, Brazil, 3–6 June 2012. [Google Scholar]
- Ordinanza del Presidente del Consiglio dei Ministri 20 Marzo 2003 n.3274. Primi Elementi in Materia di Criteri Generali per la Classificazione Sismica del Territorio Nazionale e Normative Tecniche per le Costruzioni in Zona Sismica, G.U. n. 105 - S.o. n. 72, 8 May 2003. Available online: https://www.gazzettaufficiale.it/eli/id/2003/05/08/03A04408/sg (accessed on 1 December 2023).
- Ferretti, E.; Pascale, G. Combined Strengthening Techniques to Improve the Out-of-Plane Performance of Masonry Walls. Materials 2019, 12, 1171. [Google Scholar] [CrossRef] [PubMed]
- Cilia, M.; Cipolla, I.; Colajanni, P.; Marnetto, R.; Recupero, A.; Spinella, N. Prove sperimentali su travi in c.a. rinforzate con metodo CAM®: Valutazione del comportamento a taglio. Progett. Sismica 2015, VII, 93–108. [Google Scholar]
- Leonori, M.; Vari, A. L’influenza della tipologia di terreno sui meccanismi locali di collasso degli edifici in muratura e miglioramento sismico con il sistema CAM®. In Dynamic Interaction of Soil and Structure (DISS_15), Proceedings of the 4th International Workshop on Archaeology, Cryptoportici, Hypogea, Geology, Geotechnics, Geophysics, Rome, Italy, 12–13 November 2015; Monti, G., Valente, G., Eds.; Università dell’Aquila, Dipartimento DICEAA—Sapienza, Università di Roma: Rome, Italy, 2015; pp. 1–15. [Google Scholar]
- Marnetto, R. Sviluppo ed applicazioni delle tecniche antisismiche presso la società TIS SpA di Roma. In Proceedings of the Seminario di Studi sui Sistemi e Tecnologie Antisismici, Rome, Italy, 12 September 2007; pp. 2–27. [Google Scholar]
- Kalali, A.; Kabir, M.Z. Experimental response of double-wythe masonry panels strengthened with glass fiber reinforced polymers subjected to diagonal compression tests. Eng. Struct. 2012, 39, 24–37. [Google Scholar] [CrossRef]
- Mustafaraj, E.; Yardim, Y. Retrofitting damaged unreinforced masonry using external shear strengthening techniques. J. Build. Eng. 2019, 26, 100913. [Google Scholar] [CrossRef]
- Ferretti, E. Recent advances in the Straps/Strips technique for out-of-plane strengthening of load-bearing masonry walls. Procedia Struct. Integr. 2020, 25, 33–46. [Google Scholar] [CrossRef]
- Ferretti, E. Wire Ropes and CFRP Strips to Provide Masonry Walls with Out-Of-Plane Strengthening. Materials 2019, 12, 2712. [Google Scholar] [CrossRef] [PubMed]
- Spinella, N.; Colajanni, P.; Recupero, A. Experimental in situ behaviour of unreinforced masonry elements retrofitted by pretensioned stainless steel ribbons. Constr. Build. Mater. 2014, 73, 740–753. [Google Scholar] [CrossRef]
- Zizi, M.; Vari, A.; Colajanni, P.; De Matteis, G. Steel based retrofitting interventions for existing masonry walls: A comparative numerical investigation. ce/papers Proc. Civ. Eng. 2021, 4, 2442–2450. [Google Scholar] [CrossRef]
- Ferretti, E.; Casadio, E.; Di Leo, A. Masonry Walls under Shear Test: A CM Modeling. CMES-Comp. Model. Eng. Sci. 2008, 30, 163–190. [Google Scholar] [CrossRef]
- Borri, A.; Corradi, M.; Castori, G.; Sisti, R. Reinforcement of masonry panels with GFRP grids. In Proceedings of the 9th International Conference on Structural Analysis of Historical Constructions (SAHC2014), Mexico City, Mexico, 14–17 October 2014. [Google Scholar]
- Crisci, G.; Ceroni, F.; Lignola, G.P. Comparison between Design Formulations and Numerical Results for In-Plane FRCM-Strengthened Masonry Walls. Appl. Sci. 2020, 10, 4998. [Google Scholar] [CrossRef]
- ASTM E519/E519M–15; Standard Test Method for Diagonal Tension (Shear) in Masonry Assemblages. ASTM International: West Conshohocken, PA, USA, 2021.
- RILEM. LUM B6: Diagonal tensile strength of small walls specimens. In RILEM Recommendations for the Testing and Use of Constructions Materials; RILEM: Sheffield, UK, 1994; pp. 488–489. [Google Scholar]
- UNI EN 772-1:2015; Methods of Test for Masonry Units—Part 1: Determination of Compressive Strength. UNI—Ente Italiano di Normazione: Milano, Italy, 2015.
- UNI EN 998-2:2016; Specification for Mortar for Masonry—Part 2: Masonry Mortar. UNI—Ente Italiano di Normazione: Milano, Italy, 2016.
- UNI EN 1015−1:2007; Methods of Test for Mortar for Masonry—Part 1: Determination of Particle Size Distribution (by Sieve Analysis). UNI—Ente Italiano di Normazione: Milano, Italy, 2007.
- UNI EN 1015−11:2019; Methods of Test for Mortar for Masonry—Part 11: Determination of Flexural and Compressive Strength of Hardened Mortar. UNI—Ente Italiano di Normazione: Milano, Italy, 2019.
- UNI EN 13501-1:2019; Fire Classification of Construction Products and Building Elements—Part 1: Classification Using Data from Reaction to Fire Tests. UNI—Ente Italiano di Normazione: Milano, Italy, 2019.
- UNI EN 1015-19:2008; Methods of Test for Mortar for Masonry—Part 19: Determination of Water Vapour Permeability of Hardened Rendering and Plastering Mortars. UNI—Ente Italiano di Normazione: Milano, Italy, 2008.
- UNI EN 1745:2020; Masonry and Masonry Products—Methods for Determining Thermal Properties. UNI—Ente Italiano di Normazione: Milano, Italy, 2020.
- UNI EN 1015-18:2004; Methods of Test for Mortar for Masonry—Part 18: Determination of Water Absorption Coefficient Due to Capillary Action of Hardened Mortar. UNI—Ente Italiano di Normazione: Milano, Italy, 2004.
- Regulation (EC) No 1272/2008; CLP—Regulation on Classification, Labelling and Packaging of Substances and Mixtures. European Parliament and Council: Brussels, Belgium, 2008.
- UNI EN ISO 6892-1:2020; Metallic Materials—Tensile Testing—Part 1: Method of Test at Room Temperature (ISO 6892-1:2019). UNI—Ente Italiano di Normazione: Milano, Italy, 2020.
- Solutions and Correct Use of Clay Facing Bricks; ANDIL—Associazione Nazionale degli Industriali dei Laterizi: Roma, Italy, 2014.
- UNI EN 1015−2:2007; Methods of Test for Mortar for Masonry—Part 2: Bulk Sampling of Mortars and Preparation of Test Mortars. UNI—Ente Italiano di Normazione: Milano, Italy, 2007.
- Ferretti, E. A discussion of strain-softening in concrete. Int. J. Fract. 2004, 126, L3–L10. [Google Scholar] [CrossRef]
- Ferretti, E.; Moretti, M.; Chiusoli, A.; Naldoni, L.; de Fabritiis, F.; Visonà, M. Rice-Husk Shredding as a Means of Increasing the Long-Term Mechanical Properties of Earthen Mixtures for 3D Printing. Materials 2022, 15, 743. [Google Scholar] [CrossRef]
- Brignola, A.; Frumento, S.; Lagomarsino, S.; Podestà, S. Identification of Shear Parameters of Masonry Panels Through the In-Situ Diagonal Compression Test. Int. J. Archit. Herit. 2018, 3, 52–73. [Google Scholar] [CrossRef]
- Dong, F.; Wang, H.; Jiang, F.; Xing, Q.; Yu, J. In-plane shear behavior of masonry panels strengthened with ultra-high ductile concrete (UHDC). Eng. Struct. 2022, 252, 113609. [Google Scholar] [CrossRef]
- Calderini, C.; Cattari, S.; Lagomarsino, S. Identification of shear mechanical parameters of masonry piers from diagonal compression test. In Proceedings of the 11th Canadian Masonry Symposium, Toronto, ON, Canada, 31 May–3 June 2009. [Google Scholar]
- Calderini, C.; Cattari, S.; Lagomarsino, S. The use of the diagonal compression test to identify the shear mechanical parameters of masonry. Constr. Build. Mater. 2010, 24, 677–685. [Google Scholar] [CrossRef]
- Mezrea, P.E. Retrofitting of historical brick masonry walls with textile reinforced mortar (FRCM). Master’s Thesis, Istanbul Technical University Graduate School of Science Engineering and Technology, Istanbul, Türkiye, 2014. (In Turkish). [Google Scholar]
- Guide for the Design and Construction of Externally Bonded Fibre Reinforced Inorganic Matrix Systems for Strenghtening Existing Structures; CNR-DT 215; Council of National Research (CNR): Rome, Italy, 2018.
- Aggiornamento sulle Norme Tecniche per le Costruzioni; Italian Building Code (IBC); Italian Ministry of Infrastructures and Transportation: Rome, Italy, 2018. (In Italian)
- Commentary on Technical Regulations for Constructions; Italian Building Code Commentary (IBCC), Circolare n.7 C.S.LL.PP.; Italian Ministry of Infrastructures and Transportation: Rome, Italy, 2019. (In Italian)
- Mezrea, P.E.; Ispir, M.; Balci, I.A.; Bal, I.E.; Ilki, A. Diagonal tensile tests on historical brick masonry wallets strengthened with fabric reinforced cementitious mortar. Structures 2021, 33, 935–946. [Google Scholar] [CrossRef]
- Timoshenko, S.P.; Goodier, J.N. Theory of Elasticity, 3rd ed.; McGraw-Hill International Editions: New York, NY, USA, 1970. [Google Scholar]
- Ismail, N.; Petersen, R.B.; Masia, M.J.; Ingham, J.M. Diagonal shear behaviour of unreinforced masonry walletts strengthened using twisted steel bars. Constr. Build. Mater. 2011, 25, 4386–4393. [Google Scholar] [CrossRef]
- Ungureanu, D.; Țăranu, N.; Ghiga, D.A.; Isopescu, D.N.; Mihai, P.; Cozmanciuc, R. Diagonal Tensile Test on Masonry Panels Strengthened with Textile-Reinforced Mortar. Materials 2021, 14, 7021. [Google Scholar] [CrossRef]
- Shahzamani, S.; Eftekhar, M.R. Experimental study on using steel wires via the NSM method to improve the behaviour of masonry panels. Constr. Build. Mater. 2023, 385, 131473. [Google Scholar] [CrossRef]
- Ferretti, E. Shape-effect in the effective laws of plain and rubberized concrete. Comput. Mater. Contin. 2012, 30, 237–284. [Google Scholar] [CrossRef]
- Angelillo, M.; Lourenço, P.B.; Milani, G. Masonry behaviour and modelling. In Mechanics of Masonry Structures; CISM International Centre for Mechanical Sciences Book Series; Angelillo, M., Ed.; Springer: Vienna, Austria, 2014; Volume 551, pp. 1–26. [Google Scholar] [CrossRef]
- Park, J.G.; Kim, J.-G.; So, K.P.; Hwang, J.Y.; Kim, E.S.; Li, J.; Suh, D.; Lee, Y.H. Anisotropic mechanical properties and strengthening mechanism in superaligned carbon nanotubes-reinforced aluminum. Carbon 2019, 153, 513–524. [Google Scholar] [CrossRef]
- Ferretti, E. Cell Method Analysis of Crack Propagation in Tensioned Concrete Plates. Comp. Model. Eng. Sci. 2009, 54, 253–281. [Google Scholar] [CrossRef]
- Ferretti, E. A discrete nonlocal formulation using local constitutive laws. Int. J. Fract. 2004, 130, L175–L182. [Google Scholar] [CrossRef]
- Ferretti, E. On nonlocality and locality: Differential and discrete formulations. In Proceedings of the 11th International Conference on Fracture 2005—ICF11, Turin, Italy, 20–25 March 2005; International Congress on Fracture (ICF)—Curran Associates, Inc.: New York, NY, USA, 2010; Volume 3, pp. 1728–1733. [Google Scholar]
- Stoica, D. About masonry walls ductility capacities calculation. In Proceedings of the 5th International Conference “Advanced Composite Materials Engineering” (COMAT 2014), Transilvania University of Braşov, Brașov, Romania, 16–17 October 2014. [Google Scholar]
- Ferretti, F.; Incerti, A.; Mazzotti, C. Experimental study on the shear behavior of FRCM strengthened masonry panels. In Proceedings of the 12th International Conference on Structural Analysis of Historical Constructions (SAHC 2020), Barcelona, Spain, 30 July 2019. [Google Scholar]
- Konthesingha, K.M.C.; Masia, M.J.; Petersen, R.B.; Page, A.W. Experimental evaluation of static cyclic in-plane shear behavior of unreinforced masonry walls strengthened with NSM FRP strips. J. Compos. Constr. 2014, 19, 04014055. [Google Scholar] [CrossRef]
- Babaeidarabad, S. Masonry Walls Strengthened with Fabric-Reinforced Cementitious Matrix Composite Subjected to In-Plane and Out-of-Plane Load. Ph.D. Thesis, University of Miami, Coral Gables, FL, USA, 2013. [Google Scholar]
- Li, T.; Galati, N.; Tumialan, J.G.; Nanni, A. Analysis of unreinforced masonry concrete walls strengthened with glass fiber-reinforced polymer bars. ACI Struct. J. 2005, 102, 569–577. [Google Scholar]
- Mahmood, H.; Ingham, J.M. Diagonal Compression Testing of FRP-Retrofitted Unreinforced Clay Brick Masonry Wallettes. J. Compos. Constr. 2011, 15, 810–820. [Google Scholar] [CrossRef]
- Petersen, R.B.; Ismail, N.; Masia, M.J.; Ingham, J.M. Finite element modeling of unreinforced masonry shear walletts strengthened using twisted steel bars. Constr. Build. Mater. 2012, 33, 14–24. [Google Scholar] [CrossRef]
- ASTM E2126−11; Standard Test Methods for Cyclic (Reversed) Load Test for Shear Resistance of Vertical Elements of the Lateral Force Resisting Systems for Buildings. ASTM International: West Conshohocken, PA, USA, 2011.
- Turnšek, V.; Čačovič, F. Some experimental results on the strength of brick masonry walls. In Proceedings of the 2nd International Brick Masonry Conference, Stoke-on-Trent, UK, 12–15 April 1970; pp. 149–156. [Google Scholar]
- Mann, W.; Müller, H. Failure of shear-stressed masonry—An enlarged theory, tests and application to shear-walls. Proc. Br. Ceram. Soc. 1982, 30, 223–235. [Google Scholar]
- Alecci, V.; Fagone, M.; Rotunno, T.; de Stefano, M. Shear strength of brick masonry walls assembled with different types of mortar. Constr. Build. Mater. 2013, 40, 1038–1045. [Google Scholar] [CrossRef]
- Borri, A.; Castori, G.; Corradi, M. Determination of Shear Strength of Masonry Panels Through Different Tests. Int. J. Archit. Herit. 2015, 9, 913–927. [Google Scholar] [CrossRef]
- Aliabadi, M.H. Boundary Element Methods in Linear Elastic Fracture Mechanics. Compr. Struct. Integr. 2003, 3, 89–125. [Google Scholar] [CrossRef]
- Frocht, M.M. Recent advances in photoelasticity. ASME Trans. 1931, 55, 135–153. [Google Scholar]
- Allison, L. The pole of the Mohr diagram. J. Struct. Geol. 1984, 6, 331–333. [Google Scholar] [CrossRef]


| Specimen | Compressive Strength (MPa) | Normalized Compressive Strength (MPa) |
|---|---|---|
| PA1 | 36.43 | 30.96 |
| PA2 | 36.18 | 30.75 |
| PB1 | 35.30 | 30.01 |
| PB2 | 33.27 | 28.28 |
| PC1 | 37.87 | 32.19 |
| PC2 | 38.31 | 32.57 |
| Technical Characteristic | Value |
|---|---|
| Maximum grain size [46] | |
| Compressive strength—after 28 days [47] | |
| Flexural strength—after 28 days [47] | |
| Reaction to fire [48] | Euroclass A1: Non-combustible |
| Shrinkage rate | |
| Bulk of hardened product | |
| Water vapor permeability coefficient [49] | |
| Cement content by weight | |
| Lime content by weight | |
| Aggregate content by weight | |
| Thermal conductivity [50] | |
| Water absorption [51] | |
| Hazardousness [52] | Eye Dam. 1, H318: Causes serious eye damage Skin Irrit. 2, H315: Causes skin irritation Skin Sens. 1, H317: May cause an allergic skin reaction |
| Specimen | Flexural Strength (MPa) | Broken Half-Specimen | Compressive Strength (MPa) |
|---|---|---|---|
| P1 | 2.74 | P1A | 9.28 |
| P1B | 9.93 | ||
| P2 | 2.85 | P2A | 9.56 |
| P2B | 9.50 | ||
| P3 | 3.22 | P3A | 9.72 |
| P3B | 9.59 | ||
| P4 | 2.10 | P4A | 7.06 |
| P4B | 6.83 | ||
| P5 | 2.29 | P5A | 6.72 |
| P5B | 6.96 | ||
| P6 | 2.29 | P6A | 7.58 |
| P6B | 7.03 |
| Mechanical Property | Value |
|---|---|
| Yield strength | |
| Breaking strength | |
| Elongation at break (also called fracture strain, or tensile elongation at break) |
| Specimen | Shear Stress at the End of the Linear Range (MPa) | Shear Stress of First Peak (MPa) | Maximum Shear Stress (MPa) | Residual Shear Stress (MPa) | Shear Strain at the End of the Test (mm/mm) |
|---|---|---|---|---|---|
| M1-90 | 1.118 | 1.465 | 1.465 | / | 0.00047 |
| M1-45 | 1.044 | 1.423 | 1.423 | 0.886 | 0.03806 |
| M2-45 | 0.545 | 0.985 | 1.850 | 0.959 | 0.06469 |
| Specimen | (MPa) | (MPa) | |
|---|---|---|---|
| M1-90 | 9551 | 22,676 | 2.37 |
| M1-45 | 7385 | 23,375 | 3.17 |
| M2-45 | 8080 | 31,496 | 3.90 |
| Specimen | ν |
|---|---|
| M1-90 | 0.130 |
| M1-45 | 0.098 |
| M2-45 | 0.079 |
| Specimen | * (mm/mm) | (MPa) | (%) | (mm/mm) | ||
|---|---|---|---|---|---|---|
| M1-90 | 0.00047 | 0.214 | 1.453 | 99 | 0.00035 | 1.34 |
| M1-45 | 0.03806 | 0.210 | 1.369 | 96 | 0.00038 | 99.82 |
| M2-45 | 0.06469 | 0.084 | 0.613 | 33 | 0.00013 | 513.97 |
Disclaimer/Publisher’s Note: The statements, opinions and data contained in all publications are solely those of the individual author(s) and contributor(s) and not of MDPI and/or the editor(s). MDPI and/or the editor(s) disclaim responsibility for any injury to people or property resulting from any ideas, methods, instructions or products referred to in the content. |
© 2023 by the author. Licensee MDPI, Basel, Switzerland. This article is an open access article distributed under the terms and conditions of the Creative Commons Attribution (CC BY) license (https://creativecommons.org/licenses/by/4.0/).
Share and Cite
Ferretti, E. Active Confinement of Masonry Walls with Stainless Steel Straps: The Effect of Strap Arrangement on the in-Plane Behavior of Strength, Poisson’s Ratio, and Pseudo-Ductility. Buildings 2023, 13, 3027. https://doi.org/10.3390/buildings13123027
Ferretti E. Active Confinement of Masonry Walls with Stainless Steel Straps: The Effect of Strap Arrangement on the in-Plane Behavior of Strength, Poisson’s Ratio, and Pseudo-Ductility. Buildings. 2023; 13(12):3027. https://doi.org/10.3390/buildings13123027
Chicago/Turabian StyleFerretti, Elena. 2023. "Active Confinement of Masonry Walls with Stainless Steel Straps: The Effect of Strap Arrangement on the in-Plane Behavior of Strength, Poisson’s Ratio, and Pseudo-Ductility" Buildings 13, no. 12: 3027. https://doi.org/10.3390/buildings13123027