

Bond Strength of Reinforcing Steel Bars in Self-Consolidating Concrete


Abstract
:1. Introduction
2. Literature Review
3. Materials and Mixture Proportioning
3.1. Materials
3.2. Proportioning
4. Experimental Investigations
5. Bond Test Results
5.1. Bond Strength of SCC and CVC
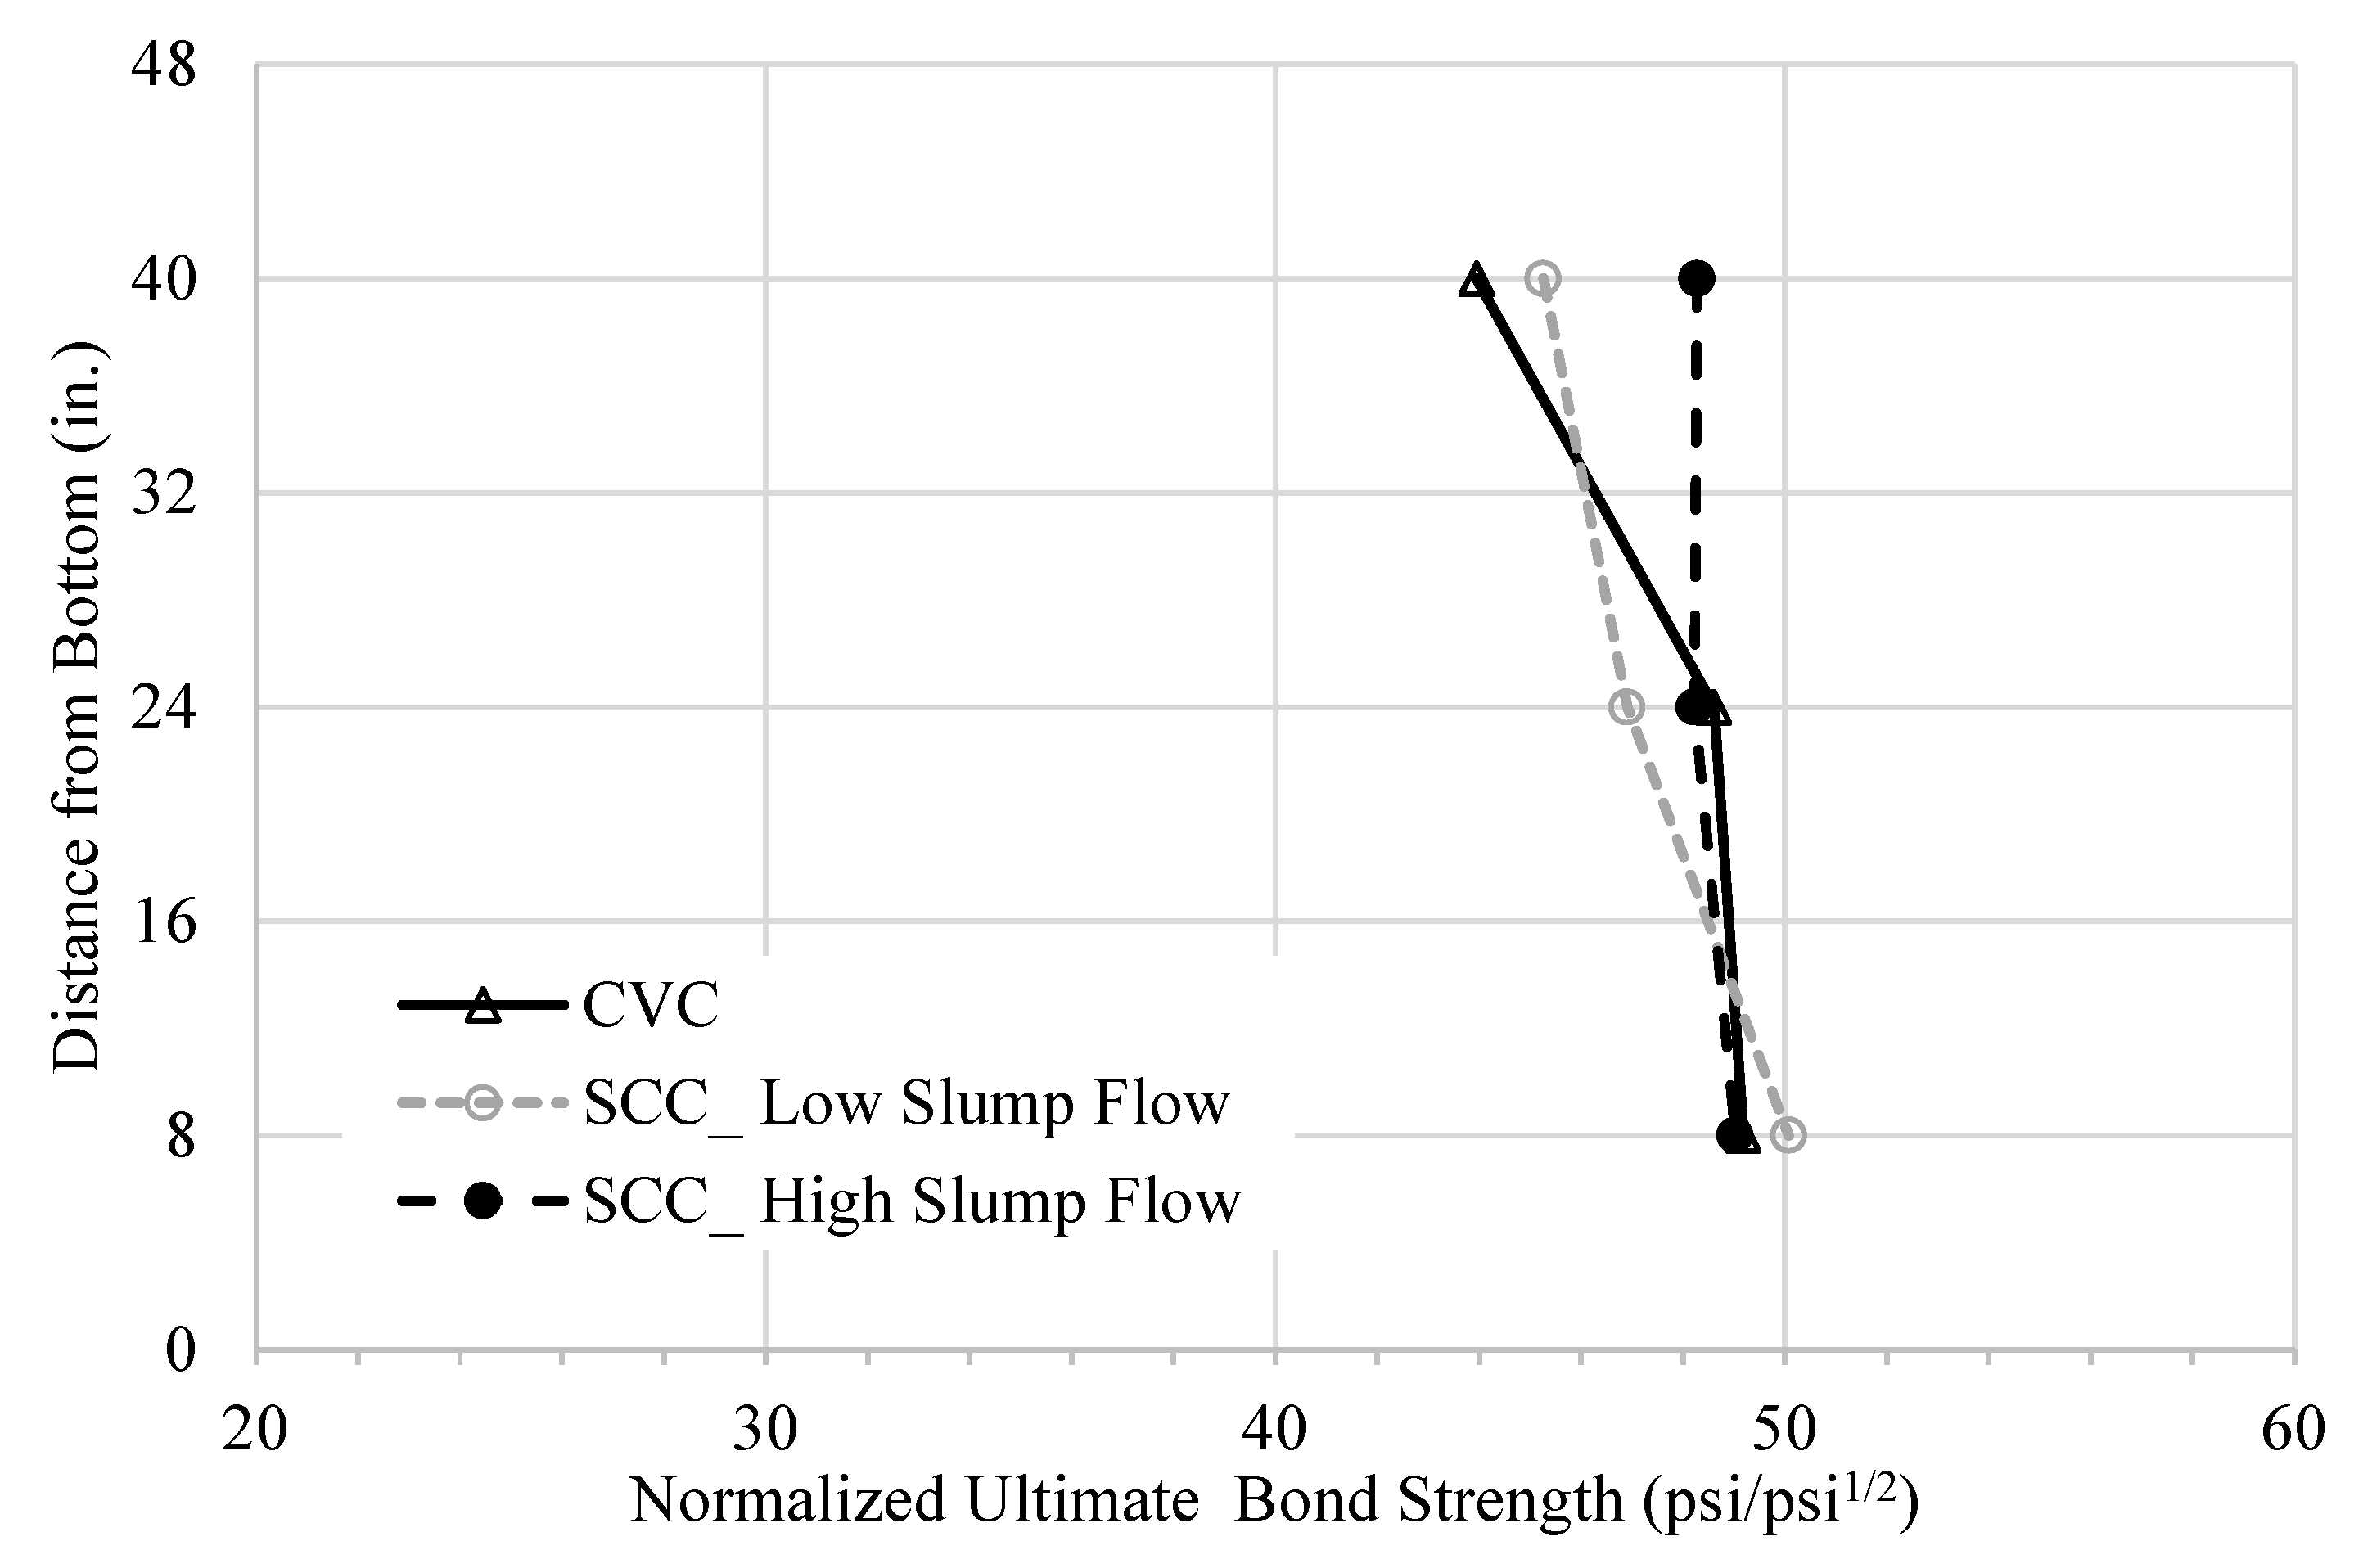
5.2. Top-Bar Effect
5.3. Bond of Horizontal Bars
5.4. Bond of Vertical Bars
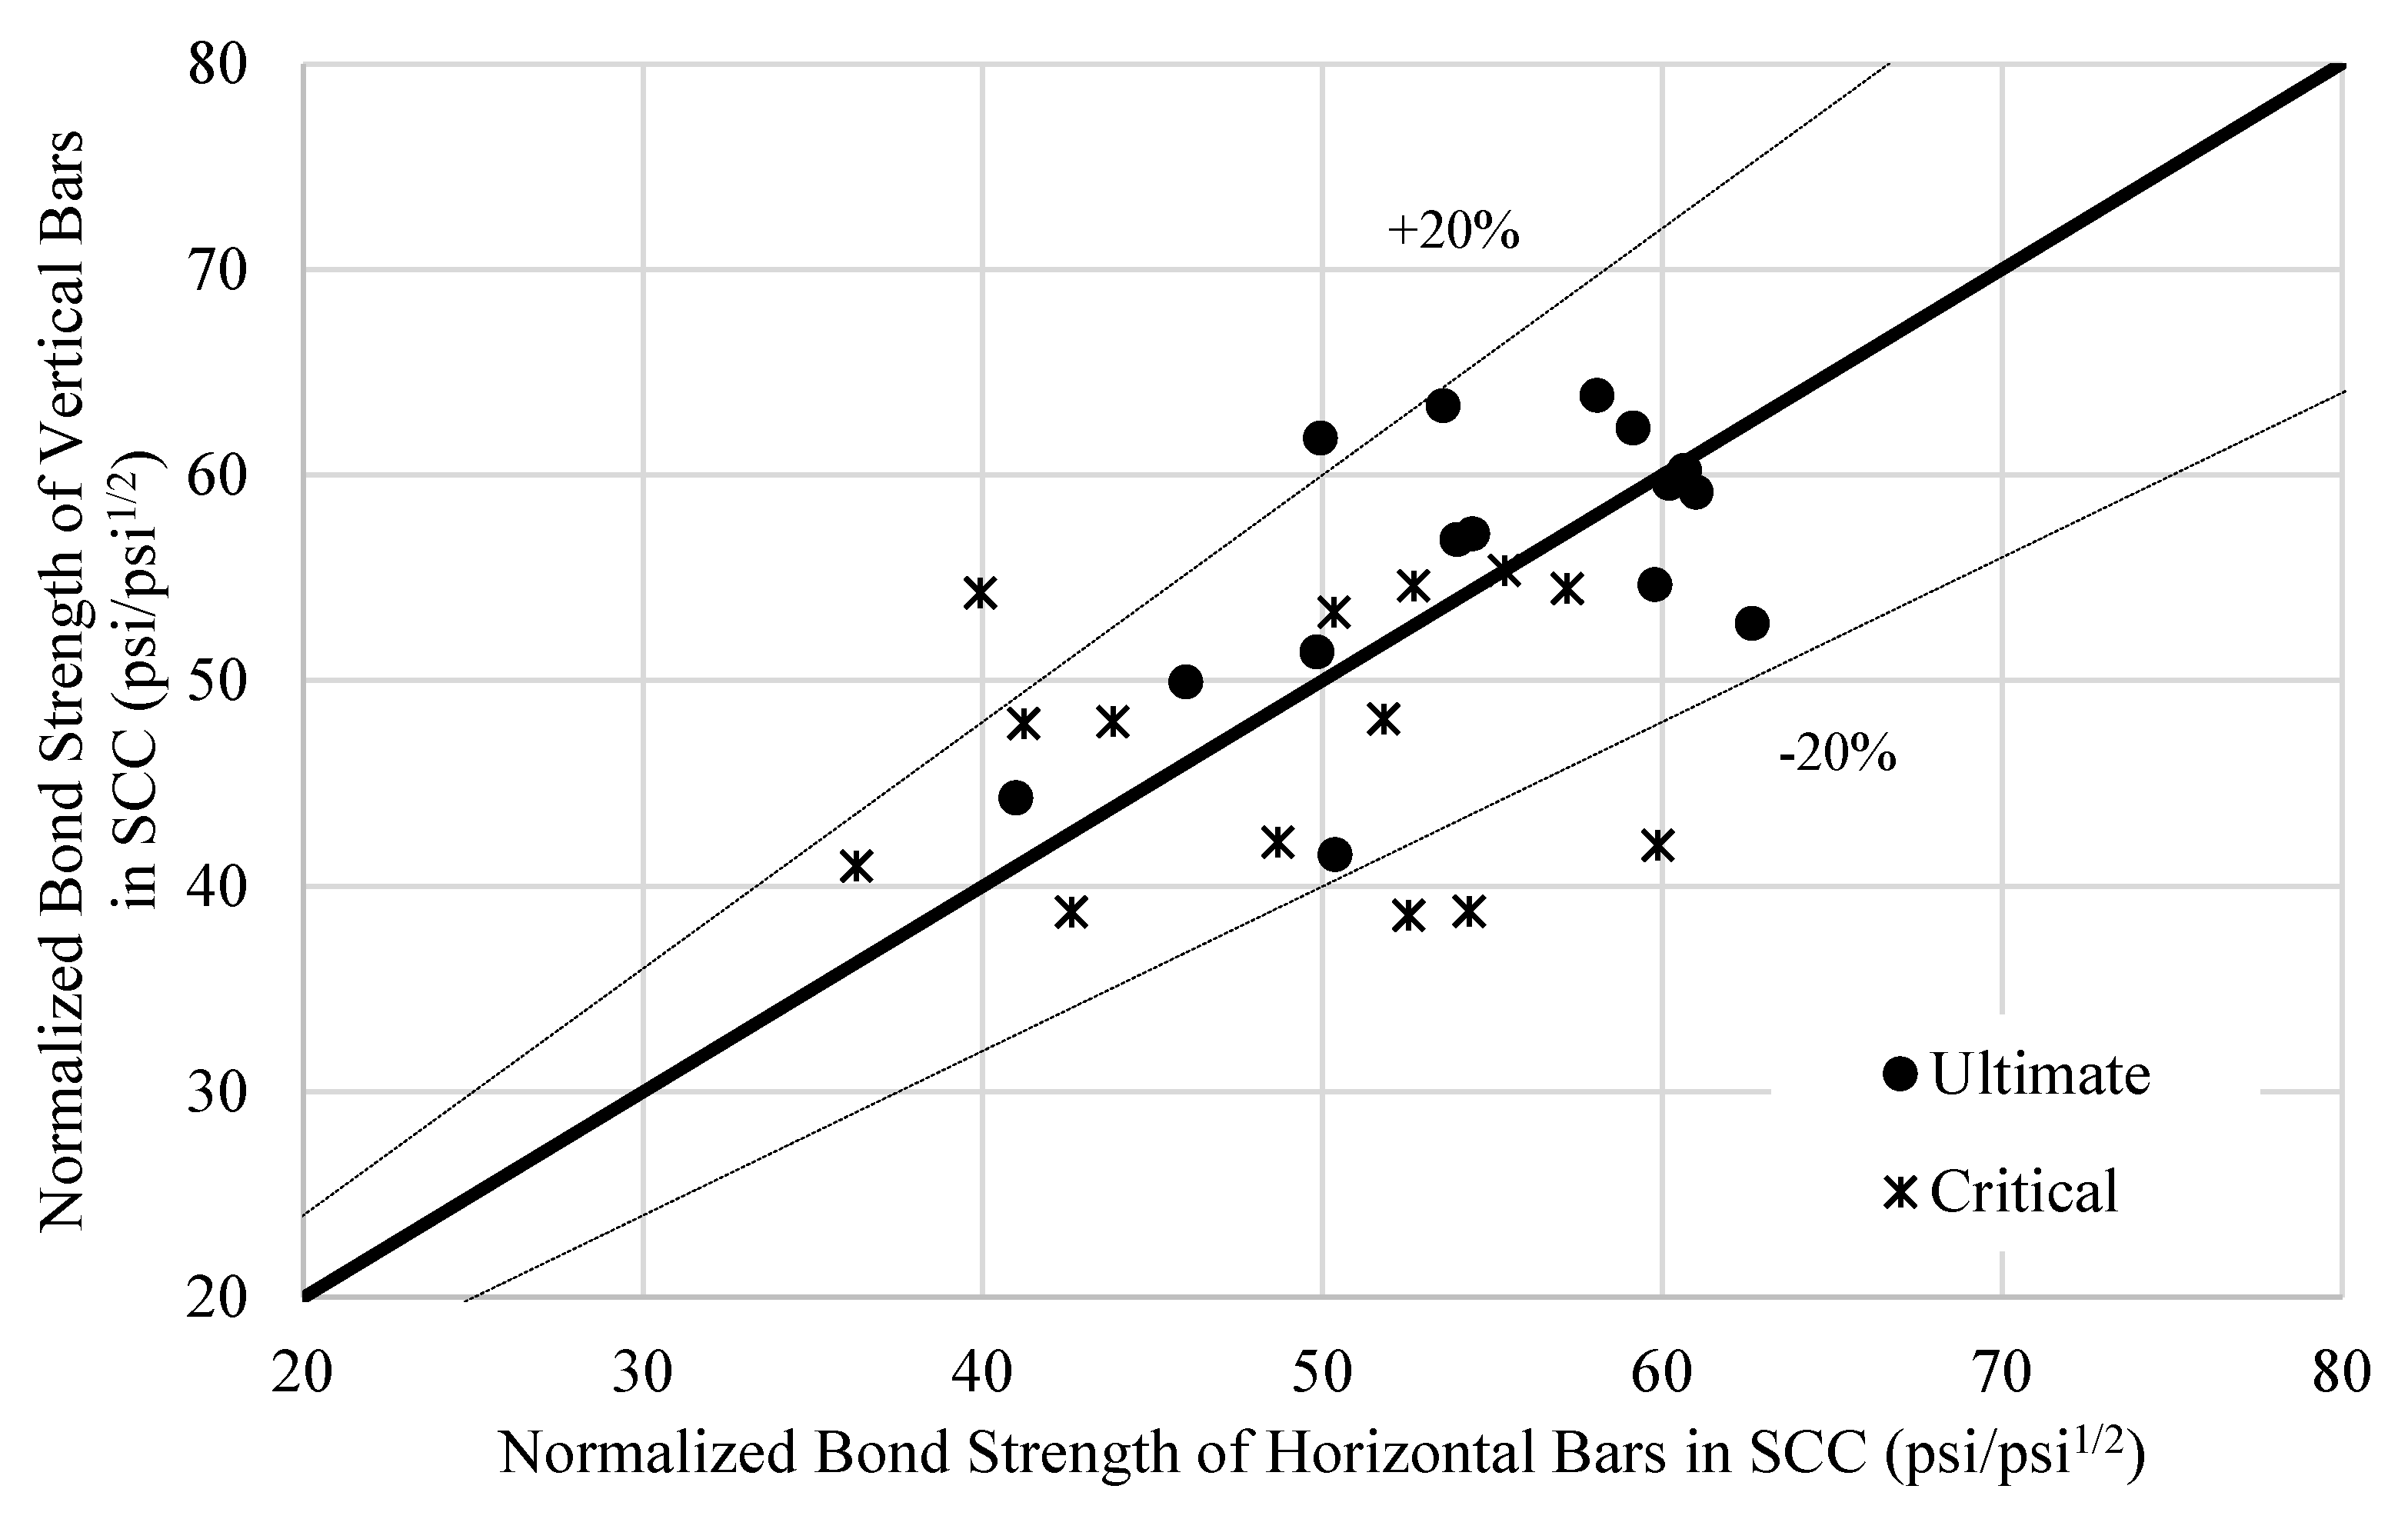
5.5. Effect of Bar Orientation
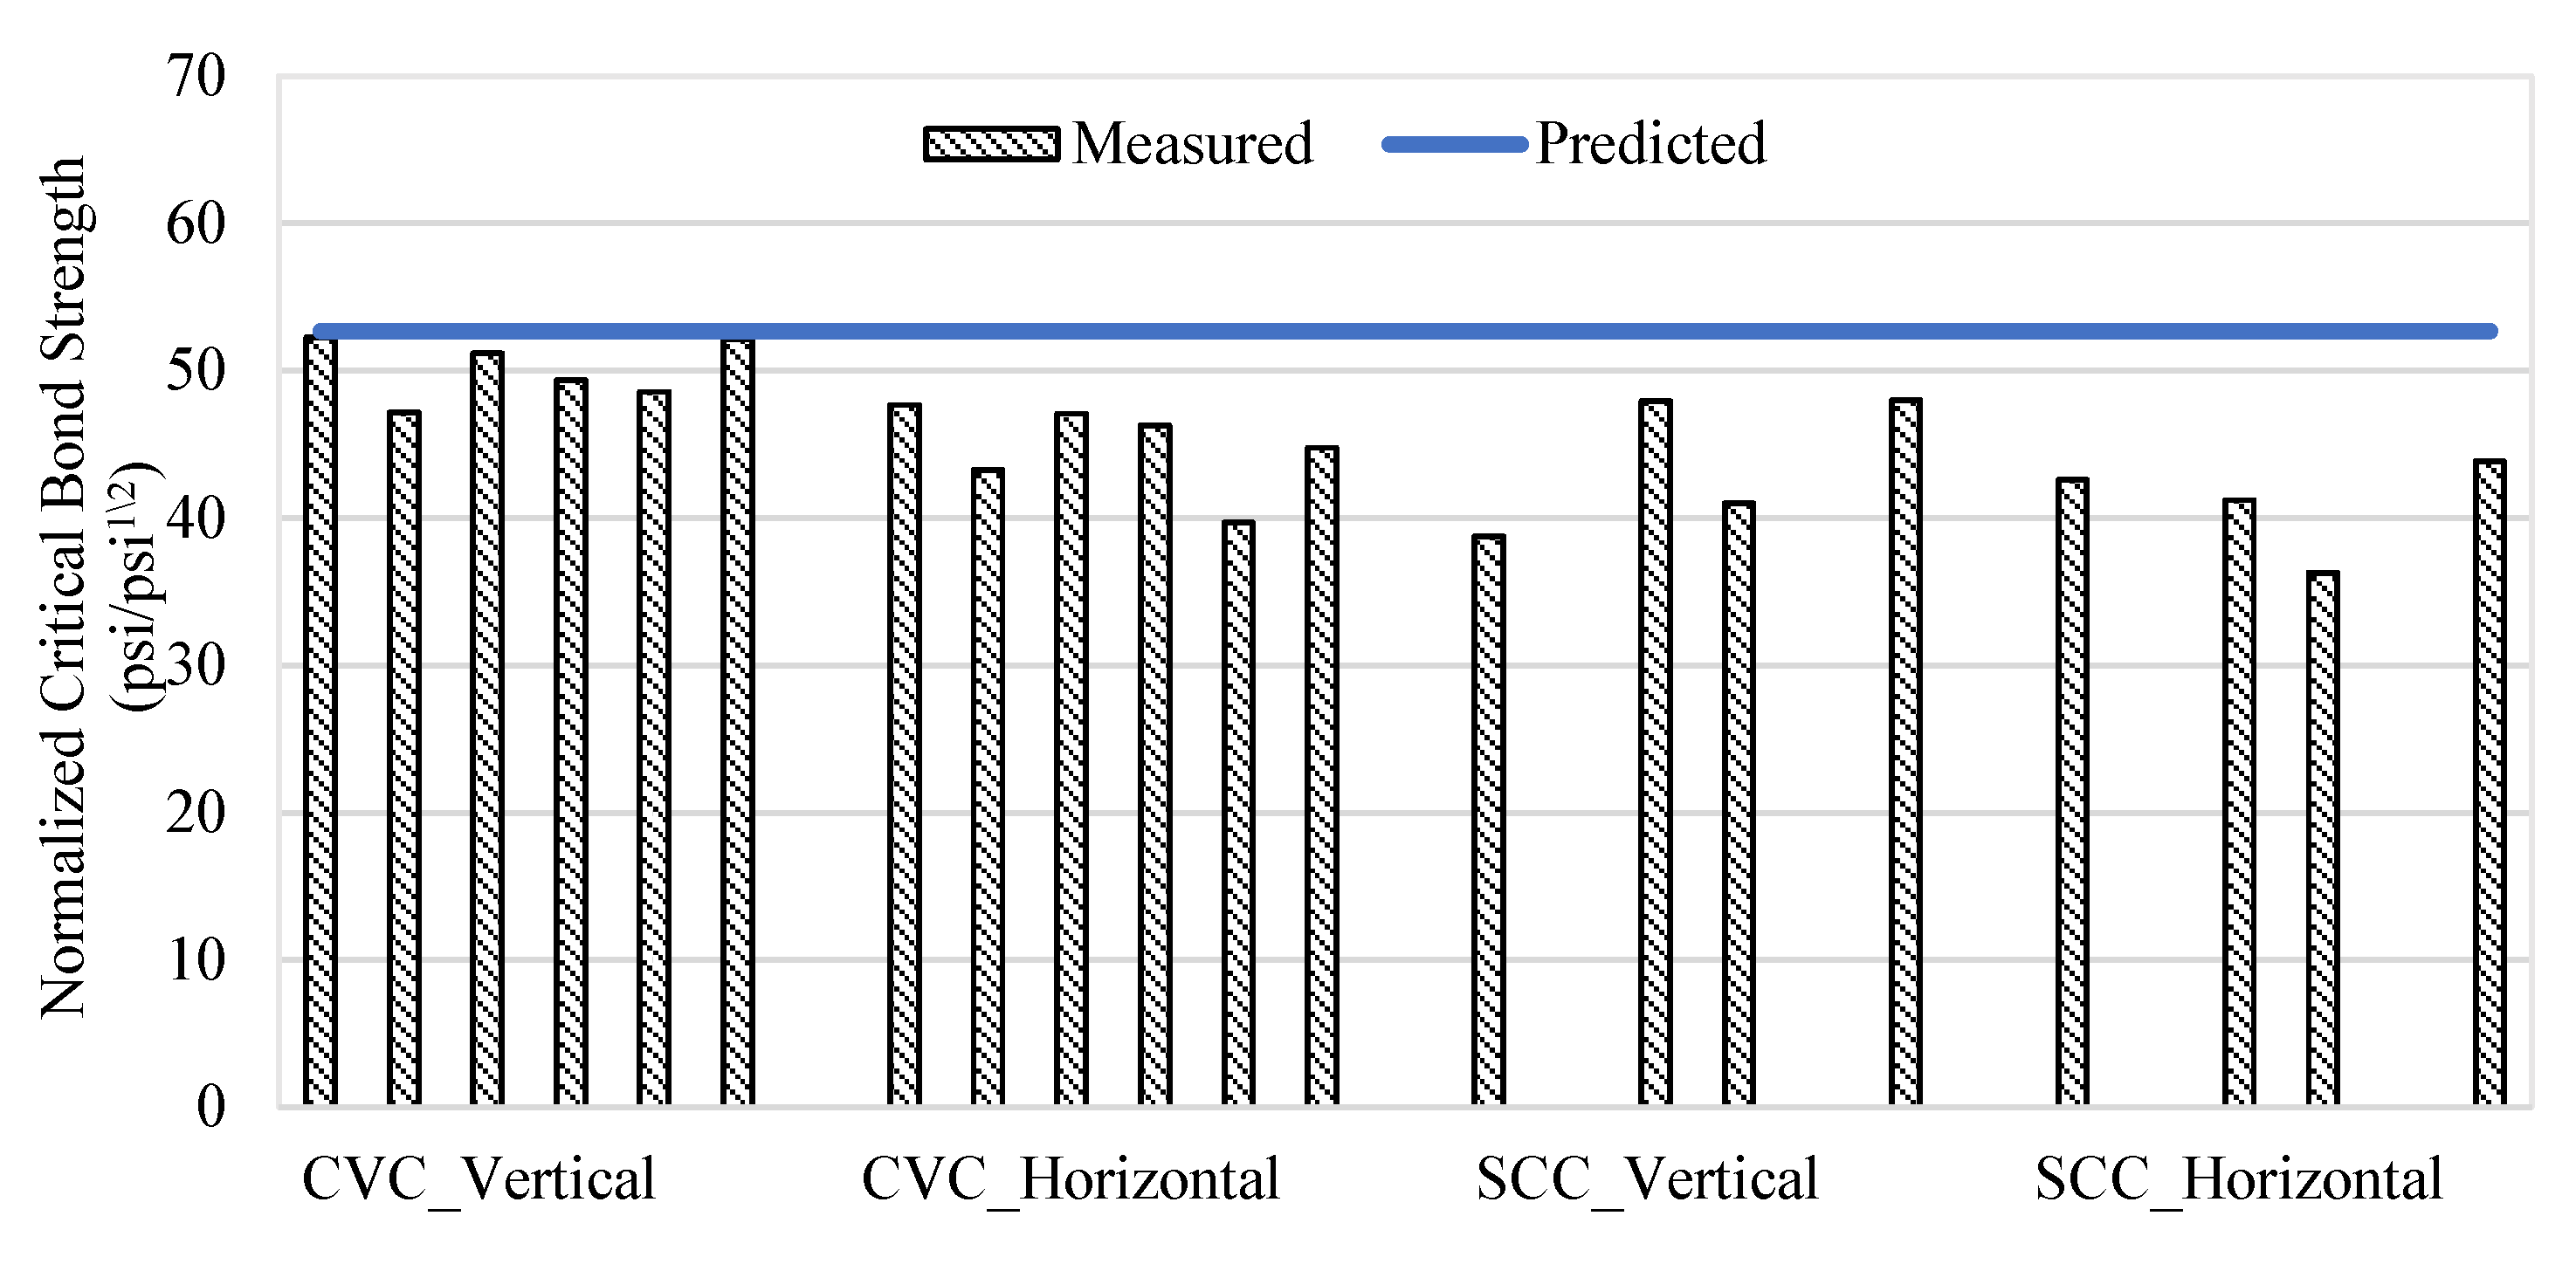
5.6. Bond Strength Prediction
6. Conclusions
- The pull-out bond strength of horizontal reinforcing steel bars cast in high-slump-flow SCC was similar to that of bars cast in CVC, but the pull-out bond strength of horizontal reinforcing steel bars cast in medium- and low-slump-flow SCC was lower than that of bars cast in CVC.
- A development length modification factor of 1.3 was recommended to account for the difference between the bond strength of SCC and CVC.
- The top-bar effect was lower in high-slump-flow SCC than that in low-slump-flow SCC and CVC. Therefore, the development length modification factor of 1.3 (ACI 318-19) for top horizontal bars with more than 12 in. (300 mm) of fresh concrete cast below them could conservatively be applied to SCC regardless of the slump flow.
- The orientation of the bar could have a significant effect on the bond strength, in both CVC and SCC, depending on bar’s size and coating.
- The bond strength prediction using ACI 408R–03 overestimates the bond strength of # 6 (19M) black bars in SCC, #8 (25M) epoxy-coated in CVC and #5 (16M) black bars in both concrete types.
Author Contributions
Funding
Data Availability Statement
Conflicts of Interest
Appendix A

| Coarse Aggregate | Mixture Type | fc′ (psi) | Parameter | Specimen | Average | COV | |||
|---|---|---|---|---|---|---|---|---|---|
| Type | NMSA | #1 | #2 | #3 | |||||
| Gravel | 3/4″ | SCC 2111 | 4323 | Ultimate Load (lb) | 21,500 | 19,100 | 18,160 | 19,587 | 8.8% |
| Bond Strength (psi) | 2433 | 2162 | 2055 | 2217 | 8.8% | ||||
| Load at Slip 0.01 in. (lb) | 14,780 | 16,730 | 17,174 | 16,228 | 7.8% | ||||
| Failure Mode | Slippage | Slippage | Slippage | N/A | N/A | ||||
| CVC No. 67 | 4571 | Ultimate Load (lb) | 25,000 | 25,300 | 26,100 | 25,467 | 2.2% | ||
| Bond Strength (psi) | 2829 | 2863 | 2954 | 2882 | 2.2% | ||||
| Load at Slip 0.01 in. (lb) | 23,190 | 22,800 | 23,976 | 23,322 | 2.6% | ||||
| Failure Mode | Slippage | Slippage | Slippage | N/A | N/A | ||||
| 1/2″ | SCC 2221 | 3956 | Ultimate Load (lb) | 17,020 | 14,670 | 16,080 | 15,923 | 7.4% | |
| Bond Strength (psi) | 1926 | 1660 | 1820 | 1802 | 7.4% | ||||
| Load at Slip 0.01 in. (lb) | 15,095 | 14,042 | 13,633 | 14,257 | 5.3% | ||||
| Failure Mode | Slippage | Slippage | Slippage | N/A | N/A | ||||
| CVC No. 78 | 4626 | Ultimate Load (lb) | 21,400 | 20,700 | 20,700 | 20,933 | 1.9% | ||
| Bond Strength (psi) | 2422 | 2343 | 2343 | 2369 | 1.9% | ||||
| Load at Slip 0.01 in. (lb) | 15,631 | 16,846 | 18,365 | 16,947 | 8.1% | ||||
| Failure Mode | Slippage | Slippage | Slippage | N/A | N/A | ||||
| 3/8″ | SCC 2222 | 4911 | Ultimate Load (lb) | 20,000 | 19,300 | 16,730 | 18,677 | 9.2% | |
| Bond Strength (psi) | 2264 | 2184 | 1893 | 2114 | 9.2% | ||||
| Load at Slip 0.01 in. (lb) | 18,444 | 17,555 | 16,730 | 17,576 | 4.9% | ||||
| Failure Mode | Slippage | Slippage | Splitting | N/A | N/A | ||||
| CVC No. 8 | 4738 | Ultimate Load (lb) | 26,700 | 27,300 | 26,300 | 26,767 | 1.9% | ||
| Bond Strength (psi) | 3022 | 3090 | 2977 | 3029 | 1.9% | ||||
| Load at Slip 0.01 in. (lb) | 24,850 | 25,350 | 23,630 | 24,610 | 3.6% | ||||
| Failure Mode | Slippage | Splitting | Slippage | N/A | N/A | ||||
| Limestone | 3/4″ | SCC 2111 | 7090 | Ultimate Load (lb) | 29,900 | 30,100 | 35,400 | 31,800 | 9.8% |
| Bond Strength (psi) | 3384 | 3407 | 4006 | 3599 | 9.8% | ||||
| Load at Slip 0.01 in. (lb) | 28,955 | 27,450 | 30,370 | 28,925 | 5.0% | ||||
| Failure Mode | Slippage | Slippage | Slippage | N/A | N/A | ||||
| CVC No. 67 | 4269 | Ultimate Load (lb) | 23,600 | 25,600 | 26,900 | 25,367 | 6.6% | ||
| Bond Strength (psi) | 2671 | 2897 | 3044 | 2871 | 6.6% | ||||
| Load at Slip 0.01 in. (lb) | 22,241 | 21,388 | 16,766 | 20,132 | 14.6% | ||||
| Failure Mode | Slippage | Slippage | Splitting | N/A | N/A | ||||
| 1/2″ | SCC 2221 | 8177 | Ultimate Load (lb) | 30,600 | 32,200 | 31,800 | 31,533 | 2.6% | |
| Bond Strength (psi) | 3463 | 3644 | 3599 | 3569 | 2.6% | ||||
| Load at Slip 0.01 in. (lb) | N/A | 28,640 | 29,500 | 29,070 | 2.1% | ||||
| Failure Mode | N/A | Slippage | Slippage | N/A | N/A | ||||
| CVC No. 78 | 5783 | Ultimate Load (lb) | 30,100 | 33,100 | 33,700 | 32,300 | 6.0% | ||
| Bond Strength (psi) | 3407 | 3746 | 3814 | 3656 | 6.0% | ||||
| Load at Slip 0.01 in. (lb) | 25,930 | 30,300 | 29,520 | 28,583 | 8.2% | ||||
| Failure Mode | Splitting | Splitting | Splitting | N/A | N/A | ||||
| 3/8″ | SCC 2222 | 6037 | Ultimate Load (lb) | 26,900 | 26,200 | 27,000 | 26,700 | 1.6% | |
| Bond Strength (psi) | 3044 | 2965 | 3056 | 3022 | 1.6% | ||||
| Load at Slip 0.01 in. (lb) | 24,347 | 21,299 | 25,071 | 23,572 | 8.5% | ||||
| Failure Mode | Splitting | Slippage | Splitting | N/A | N/A | ||||
| CVC No. 8 | 6593 | Ultimate Load (lb) | 33,400 | 30,900 | 34,700 | 33,000 | 5.9% | ||
| Bond Strength (psi) | 3780 | 3497 | 3927 | 3735 | 5.9% | ||||
| Load at Slip 0.01 in. (lb) | 32,900 | 28,100 | 34,000 | 31,667 | 9.9% | ||||
| Failure Mode | Splitting | Splitting | Splitting | N/A | N/A | ||||
| Mixture Type | fc′ (ksi) | Load Stage | Bar Location | Wall Specimen #1 | Wall Specimen #2 | Average | COV | ||||
|---|---|---|---|---|---|---|---|---|---|---|---|
| Bar #1 | Bar #2 | Bar #3 | Bar #1 | Bar #2 | Bar #3 | ||||||
| SCC (Low slump flow) | 8.3 | Load at 0.01 in. Slip (lb) | Top | 36,570 | 32,851 | 28,321 | 37,475 | 29,656 | 30,276 | 32,525 | 11.7% |
| Center | 37,905 | 32,135 | 35,807 | 34,472 | 34,758 | 37,142 | 35,370 | 5.8% | |||
| Bottom | 32,217 | 41,528 | 28,130 | 35,235 | 36,570 | 32,898 | 34,430 | 13.2% | |||
| Maximum Load (lb) | Top | 41,385 | 35,854 | 34,186 | 40,002 | 32,898 | 34,376 | 36,450 | 9.5% | ||
| Center | 38,429 | 35,425 | 38,095 | 36,521 | 38,429 | 39,764 | 37,777 | 4.1% | |||
| Bottom | 41,766 | 41,814 | 38,191 | 38,810 | 37,285 | 44,103 | 40,328 | 6.5% | |||
| SCC (High slump flow) | 7.1 | Load at 0.01 in. Slip (lb) | Top | 31,277 | 27,511 | 31,802 | 32,708 | 39,907 | 39,716 | 33,820 | 14.7% |
| Center | 32,231 | 31,659 | 31,945 | 39,478 | 38,858 | 35,807 | 34,996 | 10.2% | |||
| Bottom | 32,326 | 33,184 | 25,746 | 36,808 | 32,326 | 37,046 | 32,906 | 12.5% | |||
| Maximum Load (lb) | Top | 34,948 | 36,999 | 38,763 | 36,856 | 42,672 | 43,054 | 38,882 | 8.5% | ||
| Center | 36,236 | 34,948 | 35,592 | 40,861 | 43,101 | 42,291 | 38,838 | 9.4% | |||
| Bottom | 41,671 | 38,095 | 37,952 | 40,575 | 37,666 | 40,956 | 39,486 | 4.5% | |||
| CVC | 7.6 | Load at 0.01 in. Slip (lb) | Top | 31,420 | 30,228 | 37,571 | 28,750 | 33,041 | 29,847 | 31,810 | 10.0% |
| Center | 32,469 | 39,144 | 35,711 | 37,523 | 32,708 | 37,666 | 35,870 | 7.7% | |||
| Bottom | 36,283 | 36,379 | 37,189 | 35,378 | 35,091 | 32,088 | 35,401 | 5.1% | |||
| Maximum Load (lb) | Top | 34,758 | 35,330 | 40,765 | 30,991 | 35,664 | 34,853 | 35,394 | 8.8% | ||
| Center | 35,044 | 44,532 | 38,906 | 39,907 | 34,281 | 42,196 | 39,144 | 10.2% | |||
| Bottom | 40,336 | 40,431 | 42,148 | 39,716 | 38,810 | 36,236 | 39,613 | 5.0% | |||
| Bar Type | Load Stage | Bar Location | Wall Specimen #1 | Wall Specimen #2 | Average (lb) | COV (%) | ||||
|---|---|---|---|---|---|---|---|---|---|---|
| Bar #1 | Bar #2 | Bar #3 | Bar #1 | Bar #2 | Bar #3 | |||||
| #8 Black | Load at 0.01 in. Slip (lb) | Top | 23,422 | 23,329 | 23,145 | 21,320 | 26,057 | 24,339 | 23,602 | 6.6% |
| Center | 31,090 | 37,419 | 33,493 | 33,861 | 31,259 | 30,377 | 32,917 | 7.9% | ||
| Bottom | 32,938 | 37,327 | 40,930 | 37,112 | 34,139 | 38,830 | 36,879 | 8.0% | ||
| Max. Load (lb) | Top | 37,281 | 35,433 | 39,036 | 41,485 | 43,009 | 40,930 | 39,529 | 7.2% | |
| Center | 45,966 | 50,585 | 53,172 | 47,767 | 42,732 | 44,303 | 47,421 | 8.3% | ||
| Bottom | 49,985 | 52,526 | 54,281 | 57,053 | 52,248 | 56,083 | 53,696 | 4.9% | ||
| #5 Black | Load at 0.01 in. Slip (lb) | Top | 19,911 | 19,264 | 19,079 | 12,473 | 16,954 | 15,245 | 17,154 | 16.8% |
| Center | 20,327 | NA | 18,894 | 19,865 | 15,568 | 19,495 | 18,830 | 10.1% | ||
| Bottom | 22,036 | 20,003 | 21,759 | 21,389 | 18,340 | 20,696 | 20,704 | 6.6% | ||
| Max. Load (lb) | Top | 24,346 | 23,606 | 23,422 | 19,356 | 21,112 | 20,096 | 21,990 | 9.4% | |
| Center | 25,870 | 22,036 | 24,346 | 25,362 | 22,128 | 25,085 | 24,138 | 6.9% | ||
| Bottom | 26,471 | 24,530 | 26,332 | 25,916 | 25,316 | 26,748 | 25,886 | 3.2% | ||
| #8 Epoxy Coated | Load at 0.01 in. Slip (lb) | Top | 22,128 | 22,636 | 24,253 | 39,129 | 43,425 | 48,414 | 33,331 | 35.1% |
| Center | 24,068 | 27,025 | 26,794 | 48,737 | 44,903 | 49,246 | 36,796 | 32.6% | ||
| Bottom | 34,878 | 30,028 | 29,473 | 56,129 | 47,444 | 52,849 | 41,800 | 28.3% | ||
| Max. Load (lb) | Top | 47,490 | 48,229 | 50,770 | N/A | 19,541 | 20,558 | 37,318 | 42.4% | |
| Center | 51,324 | 55,066 | 50,308 | N/A | 23,191 | 23,976 | 40,773 | 38.7% | ||
| Bottom | 59,317 | 54,604 | 56,637 | 29,520 | N/A | 30,259 | 46,067 | 32.3% | ||
| Bar Type | Load Stage | Bar Location | Wall Specimen #1 | Wall Specimen #2 | Average (lb) | COV (%) | ||||
|---|---|---|---|---|---|---|---|---|---|---|
| Bar #1 | Bar #2 | Bar #3 | Bar #1 | Bar #2 | Bar #3 | |||||
| #8 Black | Load at 0.01 in. Slip (lb) | Top | 37,281 | 35,433 | 39,036 | 35,533 | 31,167 | 33,768 | 35,370 | 7.7% |
| Center | 45,966 | 50,585 | 53,172 | 42,732 | 37,855 | 45,751 | 46,010 | 11.9% | ||
| Bottom | 49,985 | 52,526 | 54,281 | 38,087 | 49,421 | 48,027 | 48,721 | 11.6% | ||
| Max. Load (lb) | Top | 51,786 | 48,276 | 49,569 | 44,210 | 44,025 | 50,401 | 48,045 | 6.8% | |
| Center | 56,037 | 54,004 | 57,838 | 52,849 | 48,691 | 54,604 | 54,004 | 5.8% | ||
| Bottom | 57,884 | 57,561 | 57,145 | 47,398 | 59,455 | 56,129 | 55,929 | 7.7% | ||
| #5 Black | Load at 0.01 in. Slip (lb) | Top | 22,498 | 21,343 | 23,791 | 17,786 | 17,324 | 20,604 | 20,558 | 12.5% |
| Center | 22,036 | 22,636 | 26,286 | 24,253 | 23,191 | 23,468 | 23,645 | 6.3% | ||
| Bottom | 25,547 | NA | 24,715 | 21,759 | NA | 26,286 | 24,577 | 8.1% | ||
| Max. Load (lb) | Top | 26,378 | 25,039 | 26,979 | 23,145 | 21,943 | 22,313 | 24,300 | 8.8% | |
| Center | 26,424 | 27,071 | 29,196 | 27,533 | 25,547 | 25,685 | 26,909 | 5.1% | ||
| Bottom | 30,213 | NA | 27,579 | 24,577 | NA | 29,889 | 28,065 | 9.3% | ||
| #8 Epoxy Coated | Load at 0.01 in. Slip (lb) | Top | 35,607 | 46,881 | 45,481 | 52,341 | 52,710 | 47,213 | 46,706 | 13.3% |
| Center | 54,655 | 47,269 | 62,663 | 57,238 | 54,281 | 49,430 | 54,256 | 10.2% | ||
| Bottom | 53,022 | 54,811 | 60,408 | NA | 54,050 | 60,333 | 56,525 | 6.3% | ||
| Max. Load (lb) | Top | 53,172 | 51,001 | 50,031 | 47,036 | 49,446 | 37,396 | 48,014 | 11.6% | |
| Center | 50,724 | 53,496 | 57,376 | 54,888 | 47,036 | 51,079 | 52,433 | 6.9% | ||
| Bottom | 54,466 | 54,928 | 58,624 | NA | 49,135 | 64,062 | 56,243 | 9.8% | ||
| Concrete Type | Bar Type | Load Stage | Bar #1 | Bar #2 | Bar #3 | Bar #4 | Bar #5 | Bar #6 | Average (lb) | COV (%) |
|---|---|---|---|---|---|---|---|---|---|---|
| CVC | #8 Black | Load at 0.01 in Slip (lb) | 36,264 | 37,650 | 38,620 | 42,547 | 35,525 | 40,422 | 38,505 | 6.8% |
| Max. Load (lb) | 47,398 | 46,197 | 48,737 | 43,009 | 45,227 | 46,335 | 46,151 | 4.2% | ||
| #5 Black | Load at 0.01 in Slip (lb) | 24,161 | 21,805 | 23,653 | 22,821 | 22,452 | 24,115 | 23,168 | 4.1% | |
| Max. Load (lb) | 28,041 | 25,547 | 26,332 | 25,501 | 26,101 | 26,194 | 26,286 | 3.5% | ||
| #8 Epoxy Coated | Load at 0.01 in Slip (lb) | 27,395 | 28,781 | 30,628 | 28,827 | 27,395 | 30,998 | 29,004 | 5.3% | |
| Max. Load (lb) | 48,229 | 50,863 | 53,080 | 55,898 | 48,645 | 52,803 | 51,586 | 5.7% | ||
| SCC | #8 Black | Load at 0.01 in Slip (lb) | 51,833 | 52,526 | 51,694 | 51,509 | 45,688 | 50,585 | 50,639 | 4.9% |
| Max. Load (lb) | 56,129 | 57,145 | 56,545 | 58,624 | 50,077 | 59,086 | 56,268 | 5.8% | ||
| #5 Black | Load at 0.01 in Slip (lb) | 23,237 | 25,270 | 28,734 | 24,577 | 25,657 | 28,781 | 26,043 | 8.7% | |
| Max. Load (lb) | 24,900 | 28,041 | 29,935 | 26,563 | 28,629 | 30,813 | 28,147 | 7.7% | ||
| #8 Epoxy Coated | Load at 0.01 in Slip (lb) | 38,944 | 39,129 | 42,362 | 42,732 | 42,547 | NA | 41,143 | 4.7% | |
| Max. Load (lb) | 57,376 | 57,653 | 64,444 | 61,857 | 63,936 | 55,159 | 60,071 | 6.4% |
References
- American Concrete Institute Committee 318 (ACI 318). Building Code Requirements for Structural Concrete and Commentary; ACI CODE 318: Farmington Hills, MI, USA, 2019. [Google Scholar]
- Mathey, R.G.; Watstein, D. Investigation of Bond in Beam and Pull-Out Specimens with High-Yield-Strength Deformed Bars. ACI J. Proc. 1961, 62, 1071–1090. [Google Scholar]
- Chan, Y.W.; Chen, Y.S.; Liu, Y.S. Development of Bond Strength of Reinforcement Steel in Self-Consolidating Concrete. ACI Struct. J. 2003, 100, 490–498. [Google Scholar]
- Hassan, A.A.A.; Hossain, K.M.A.; Lachemi, M. Bond Strength of Deformed Bars in Large Reinforced Concrete Members Cast with Industrial Self-Consolidating Concrete Mixture. Constr. Build. Mater. 2010, 24, 520–530. [Google Scholar] [CrossRef]
- Cattaneo, S.; Rosati, G. Bond between Steel and Self-Consolidating Concrete: Experiments and Modeling. ACI Struct. J. 2009, 106, 540–550. [Google Scholar]
- König, G.; Holschemacher, K.; Dehn, F.; Weibe, D. Self-compacting concrete-time development of material properties and bond behaviour. In Proceedings of the Second International RILEM Symposium on Self-Compacting Concrete, Tokyo, Japan, 11–15 December 2001; pp. 507–516. [Google Scholar]
- König, G.; Holschemacher, K.; Dehn, F.; Weibe, D. Bond of reinforcement in self-compacting concrete (SCC) under monotonic and cyclic loading. In Proceedings of the Third International RILEM Symposium on Self-Compacting Concrete, Reykjavik, Iceland, 17–20 August 2003; pp. 939–947. [Google Scholar]
- Almeida, F.M.; Nardin, S.; Gresce, A.L.H. Evaluation of the bond strength of self-compacting concrete in pull-out tests. In Proceedings of the Second North American Conference on the Design and Use of Self-Consolidating Concrete and Fourth International RILEM Symposium on Self-Compacting Concrete, Chicago, IL, USA, 26–28 May 2005; pp. 953–958. [Google Scholar]
- Almeida, F.M.; El Debs, M.K.; El Debs, A.L.H.C. Bond-Slip Behavior of Self-Compacting Concrete and Vibrated Concrete Using Pullout and Beam Tests. Mater. Struct. 2008, 41, 1073–1089. [Google Scholar]
- Aslani, F.; Nejadi, S. Bond Behavior of Reinforcement in Conventional and Self-Compacting Concrete. Adv. Struct. Eng. 2012, 15, 2033–2051. [Google Scholar] [CrossRef]
- Valcuende, M.; Parra, C. Bond Behavior of Reinforcement in Self-Compacting Concretes. Construction and Building Materials 2009, 23, 162–170. [Google Scholar] [CrossRef]
- Gibbs, J.C.; Zhu, W. Strength of Hardened Self-Compacting Concrete. In Proceedings of the 1st International Rilem Symposium on Self-Compacting Concrete, Stockholm, Sweden, 13–14 September 1999; pp. 199–209. [Google Scholar]
- Wang, G.; Zheng, J. Bond Behaviors of Self-Compacting Concrete. In Proceedings of the First International Symposium on Design, Performance and Use of Self-Consolidating Concrete, Changsha, China, 26–28 May 2005; pp. 465–471. [Google Scholar]
- Daoud, A.; Lorrain, M.; Laborderie, C. Anchorage and Cracking Behaviour of Self-Compacting Concrete. In Proceedings of the 3rd International RILEM Symposium on Self-Compacting Concrete, Bagneux, France, 17–20 August 2003; pp. 692–702. [Google Scholar]
- Zhu, W.; Sonebi, M.; Bartos, P.J.M. Bond and interfacial properties of reinforcement in self-compacting concrete. Mater. Struct. 2004, 37, 442–448. [Google Scholar] [CrossRef]
- Desnerck, P.; Schutter, G.D.; Taerwe, L. Bond Strength of Reinforcing Bars in Self-Compacting Concrete: Experimental Determination. In Proceedings of the 3rd North American conference on the Design and Use of Self-Consolidating Concrete, Challenges and Barriers to Application, Center for Advanced Cement-Based Materials (ACBM), Chicago, IL, USA, 10–12 November 2008; pp. 433–438. [Google Scholar]
- Khayat, K.H. Workability, Testing, and Performance of Self-Consolidating Concrete. ACI Mater. J. 1999, 96, 346–353. [Google Scholar]
- Attiogbe, E.K.; See, H.T.; Daczko, J.A. Engineering Properties of Self-Consolidating Concrete. In Proceedings of the First North American Conference on the Design and Use of Self-Consolidating Concrete, Chicago, IL, USA, 12–13 November 2002; pp. 331–336. [Google Scholar]
- Castel, A.; Vidal, T.; Viriyametanont, K.; François, R. Effect of Reinforcing Bar Orientation and Location on Bond with Self-Consolidating Concrete. ACI Struct. J. 2006, 103, 559–567. [Google Scholar]
- Trezos, K.G.; Sfikas, I.P.; Palmos, M.S.; Sotiropoulou, E.K. Top-Bar Effect in Self-Compacting Concrete Elements. Design, Production and Placement of Self-Consolidating Concrete. RILEM Book Ser. 2010, 1, 355–366. [Google Scholar]
- Esfahani, M.R.; Lachemi, M.; Kianoush, M.R. Top-Bar Effect of Steel Bars in Self-Consolidating Concrete (SCC). Cem. Concr. Compos. 2008, 30, 52–60. [Google Scholar] [CrossRef]
- Morcous, G.; Wang, K.; Taylor, P.; Surendra, P.S. Self-Consolidating Concrete for Cast-in-Place Bridge Components; National Corporative Highway Research Program (NCHRP), Project 18-16; Transportation Research Board: Washington, DC, USA, 2016. [Google Scholar]
- Daczko, J. Self-Consolidating Concrete: Applying What We Know; Spon Press: New York, NY, USA, 2012. [Google Scholar]
- European Federation of National Trade Associations (EFNARC). The European Guidelines for Self-Compacting Concrete: Specification, Production, and Use; EFNARC: Norfolk UK, 2005. [Google Scholar]
- American Concrete Institute Committee 237 (ACI 237). Self-Consolidating Concrete; Emerging Technologies Series (ETS); ACI PRC 237R: Farmington Hills, MI, USA, 2007. [Google Scholar]
- Khayat, K.H.; Mitchell, D. Self-Consolidating Concrete for Precast, Prestressed Concrete Bridge Elements; National Corporative Highway Research Program (NCHRP), Report 628; Transportation Research Board: Washington, DC, USA, 2009. [Google Scholar]
- Precast/Prestressed Concrete Institute (PCI). Interim Guidelines for the Use of Self-Consolidating Concrete in Precast/Prestressed Concrete Institute Member Plants; TR-6-03; PCI: Chicago, IL, USA, 2003. [Google Scholar]
- Domone, P. Proportioning of Self-Compacting Concrete—The UCL Method; Technical Report; Department of Civil, Environmental and Geomatics Engineering, University College London (UCL): London, UK, 2009. [Google Scholar]
- European Federation of National Trade Associations (EFNARC). Specifications and Guidelines for Self-Compacting Concrete; EFNARC: Norfolk, UK, 2002. [Google Scholar]
- Kheder, G.F.; Al Jadiri, R.S. New Method for Proportioning Self-Consolidating Concrete Based on Compressive Strength Requirements. ACI Mater. J. 2010, 7, 490–497. [Google Scholar]
- Koehler, E.P.; Fowler, D.W. ICAR Mixture Proportioning Procedure for Self-Consolidating Concrete; ICAR Project 108-1; International Center for Aggregates Research: Austin, TX, USA, 2007. [Google Scholar]
- Okamura, H.; Ozawa, K. Mix Design for Self-Compacting Concrete. Concr. Libr. JSCE 1995, 25, 107–120. [Google Scholar]
- CSA CAN3-A23.3; Design of Concrete Structures; Canadian Standards Association: Rexdale, ON, Canada, 2004.
- American Concrete Institute Committee 211 (ACI 211). Guide for Selecting Proportions for High-Strength Concrete Using Portland Cement and Other Cementitious Materials; ACI PRC 211.4R: Farmington Hills, MI, USA, 2008. [Google Scholar]
- RILEM/CEB/FIP. Test and Specifications of Reinforcement for Reinforced and Pre-stressed Concrete: Four recommendations of the RILEM/CEB/FIB, 2: Pullout test. Mater. Struct. 1970, 3, 175–178. [Google Scholar]
- CEB-fib. Bond of Reinforcement in Concrete; CEB-fib: Lausanne, Switzerland, 2000; Volume 10, p. 427. [Google Scholar]
- American Concrete Institute Committee (ACI 408R). Bond and Development of Straight Reinforcing Bars in Tension; ACI: Farmington Hills, MI, USA, 2003. [Google Scholar]


| Property | Limestone | Gravel | Sand | ||||
|---|---|---|---|---|---|---|---|
| 3/4 in. | 1/2 in. | 3/8 in. | 3/4 in. | 1/2 in. | 3/8 in. | ||
| Specific Gravity | 2.66 | 2.66 | 2.66 | 2.74 | 2.68 | 2.69 | 2.62 |
| Absorption | 1.3% | 1.3% | 1.3% | 1.1% | 1.4% | 1.4% | 0.5% |
| Sand-to-Aggregate Ratio | 0.45 | 0.47 | 0.50 | 0.45 | 0.47 | 0.50 | N/A |
| Combined Aggregate Unit Weight (pcf) | 117 | 118 | 118 | 127 | 124 | 123 | N/A |
| Percent of Voids | 29.0 | 28.4 | 28.4 | 23.7 | 25.9 | 27.0 | N/A |
| Component | Component Content by Percentage of Weight | ||||
|---|---|---|---|---|---|
| Type I/II Cement | Class C Fly Ash | Class F Fly Ash | GGBFS | Limestone Powder | |
| SiO2 | 20.10 | 42.46 | 50.87 | 31.63 | 1.56 |
| Al2O3 | 4.44 | 19.46 | 20.17 | 11.30 | - |
| Fe2O3 | 3.09 | 5.51 | 5.27 | 0.34 | 0.48 |
| SO3 | 3.18 | 1.20 | 0.61 | 3.30 | 1.77 |
| CaO | 62.94 | 21.54 | 15.78 | 41.31 | 52.77 |
| MgO | 2.88 | 4.67 | 3.19 | 10.77 | 0.48 |
| Na2O | 0.10 | 1.42 | 0.69 | 0.19 | 0.03 |
| K2O | 0.61 | 0.68 | 1.09 | 0.36 | 0.09 |
| P2O5 | 0.06 | 0.84 | 0.44 | 0.02 | - |
| TiO2 | 0.24 | 1.48 | 1.29 | 0.56 | - |
| SrO | 0.09 | 0.32 | 0.35 | 0.04 | - |
| BaO | - | 0.67 | 0.35 | - | - |
| LOI | 2.22 | 0.19 | 0.07 | - | 42.50 |
| Component Geometric Characteristics | Class | Value/Definition |
|---|---|---|
| Length | Low | ≤33 ft |
| High | >33 ft | |
| Depth | Low | ≤16 ft |
| High | >16 ft | |
| Thickness | Low | ≤8 in. |
| High | >8 in. | |
| Shape Intricacy | Low | Concrete flows in a single direction |
| High | Concrete flow around corners and cutouts | |
| Formed Surface Quality | Low | Unexposed to the travelling public |
| High | Exposed to the travelling public | |
| Level of Reinforcement | Low | Large spacing between bars (≥3 in.) |
| High | Small spacing between bars (<3 in.) |
| Workability Property | Class | Value/Range | Application |
|---|---|---|---|
| Filling Ability (FA) | FA1 | 22 in. ≤ Slump Flow < 26 in. | Simple sections |
| FA2 | 26 in. ≤ Slump Flow ≤ 30 in. | Complex sections or high formed surface quality | |
| Passing Ability (PA) | PA1 | 80% > Filling Capacity ≥ 70% 2 in. < J-Ring ΔD ≤ 4 in. 0.6 in. < J-Ring ΔH ≤ 0.8 in. | Wide spacing between reinforcing bars |
| PA2 | Filling Capacity ≥ 80% J-Ring ΔD ≤ 2 in. J-Ring ΔH ≤ 0.6 in. | Narrow spacing between reinforcing bars | |
| Segregation Resistance (SR) | SR1 | 10% < Column Segregation ≤ 15% 0.5 in. < Penetration ≤ 1 in. VSI = 1 | Short or shallow components |
| SR2 | Column Segregation ≤ 10% Penetration ≤ 0.5 in. VSI = 0 | Long or deep components |
| Mixture Type | SCC Mixtures | CVC Mixtures | |||||||||||||||||||||
|---|---|---|---|---|---|---|---|---|---|---|---|---|---|---|---|---|---|---|---|---|---|---|---|
| SCMs/Fillers | 25% Class C Fly Ash | 25% Class F Fly Ash | 30% GGBFS | 20% Class F Fly Ash + 15% LSP | 25% Class F Fly Ash | ||||||||||||||||||
| Flowability | Low Slump Flow | High Slump Flow | Low Slump Flow | High Slump Flow | Low Slump Flow | High Slump Flow | Low Slump Flow | High Slump Flow | 2–4 in. Slump | ||||||||||||||
| NMSA, in. | 3/4 | 1/2 | 3/4 | 1/2 | 3/8 | 3/4 | 1/2 | 3/4 | 1/2 | 3/8 | 3/4 | 1/2 | 3/4 | 1/2 | 3/8 | 3/4 | 1/2 | 3/4 | 1/2 | 3/8 | 3/4 | 1/2 | 3/8 |
| Mixture ID | 111 | 121 | 211 | 221 | 222 | 111 | 121 | 211 | 221 | 222 | 111 | 121 | 211 | 221 | 222 | 111 | 121 | 211 | 221 | 222 | No. 67 | No. 78 | No. 8 |
| Cement Type I/II, lb/cy | 531 | 535 | 568 | 572 | 587 | 531 | 535 | 568 | 572 | 587 | 521 | 525 | 539 | 543 | 558 | 456 | 460 | 488 | 491 | 504 | 494 | 553 | 572 |
| SCM, lb/cy | 177 | 178 | 189 | 191 | 196 | 177 | 178 | 189 | 191 | 196 | 223 | 225 | 231 | 233 | 239 | 140 | 141 | 150 | 151 | 155 | 165 | 184 | 191 |
| Filler, lb/cy | 0 | 0 | 0 | 0 | 0 | 0 | 0 | 0 | 0 | 0 | 0 | 0 | 0 | 0 | 0 | 105 | 106 | 113 | 113 | 116 | 0 | 0 | 0 |
| Coarse Agg., lb/cy | 1542 | 1462 | 1518 | 1439 | 1334 | 1542 | 1462 | 1518 | 1439 | 1334 | 1542 | 1462 | 1530 | 1450 | 1345 | 1542 | 1462 | 1518 | 1439 | 1334 | 1674 | 1485 | 1350 |
| Natural Sand, lb/cy | 1262 | 1297 | 1242 | 1276 | 1334 | 1262 | 1297 | 1242 | 1276 | 1334 | 1262 | 1297 | 1252 | 1286 | 1345 | 1262 | 1297 | 1242 | 1276 | 1334 | 1193 | 1271 | 1356 |
| Water, lb/cy | 280 | 295 | 280 | 295 | 305 | 280 | 295 | 280 | 295 | 305 | 280 | 295 | 280 | 295 | 305 | 280 | 295 | 280 | 295 | 305 | 280 | 295 | 305 |
| HRWRA, oz/cwt | 12.0 | 14.0 | 12.0 | 16.0 | 13.0 | 6.0 | 4.0 | 8.0 | 8.0 | 13.0 | 12.0 | 10.0 | 18.0 | 16.0 | 15.0 | 11.0 | 9.0 | 12.0 | 12.0 | 15.0 | 0.0 | 0.0 | 0.0 |
| VMA, oz/cwt | 0.0 | 0.0 | 6.0 | 0.0 | 0.0 | 3.0 | 0.0 | 3.0 | 6.0 | 0.0 | 0.0 | 0.0 | 3.0 | 3.0 | 0.0 | 0.0 | 0.0 | 3.0 | 6.0 | 0.0 | 0.0 | 0.0 | 0.0 |
| AEA, oz/cwt | 1.5 | 1.5 | 1.5 | 1.5 | 1.5 | 1.5 | 1.5 | 1.5 | 1.5 | 1.5 | 1.5 | 1.5 | 1.5 | 1.5 | 1.5 | 1.5 | 1.5 | 1.5 | 1.5 | 1.5 | 1.5 | 1.5 | 1.5 |
| Total Weight, lb/cy | 3792 | 3767 | 3797 | 3772 | 3756 | 3792 | 3767 | 3797 | 3772 | 3756 | 3828 | 3803 | 3832 | 3807 | 3792 | 3786 | 3761 | 3790 | 3765 | 3749 | 3806 | 3788 | 3774 |
| Total Aggregate, lb/cy | 2804 | 2759 | 2760 | 2714 | 2669 | 2804 | 2759 | 2760 | 2714 | 2669 | 2804 | 2759 | 2782 | 2737 | 2691 | 2804 | 2759 | 2760 | 2714 | 2669 | 2867 | 2756 | 2706 |
| Total Powder, lb/cy | 708 | 713 | 757 | 763 | 783 | 708 | 713 | 757 | 763 | 783 | 744 | 750 | 770 | 776 | 797 | 702 | 707 | 751 | 756 | 776 | 659 | 738 | 763 |
| W/P Ratio | 0.40 | 0.41 | 0.37 | 0.39 | 0.39 | 0.40 | 0.41 | 0.37 | 0.39 | 0.39 | 0.38 | 0.39 | 0.36 | 0.38 | 0.38 | 0.40 | 0.42 | 0.37 | 0.39 | 0.39 | 0.43 | 0.40 | 0.40 |
| S/A Ratio | 0.45 | 0.47 | 0.45 | 0.47 | 0.50 | 0.45 | 0.47 | 0.45 | 0.47 | 0.50 | 0.45 | 0.47 | 0.45 | 0.47 | 0.50 | 0.45 | 0.47 | 0.45 | 0.47 | 0.50 | 0.42 | 0.46 | 0.50 |
| Paste Volume % | 37.0% | 38.0% | 38.0% | 39.0% | 40.0% | 37.0% | 38.0% | 38.0% | 39.0% | 40.0% | 37.0% | 38.0% | 37.5% | 38.5% | 39.5% | 37.0% | 38.0% | 38.0% | 39.0% | 40.0% | 36.0% | 38.5% | 39.6% |
| Coarse Agg. Vol. % | 34.4% | 32.6% | 33.9% | 32.1% | 29.8% | 34.4% | 32.6% | 33.9% | 32.1% | 29.8% | 34.4% | 32.6% | 34.1% | 32.4% | 30.0% | 34.4% | 32.6% | 33.9% | 32.1% | 29.8% | 37.4% | 33.1% | 30.1% |
| Mixture Type | SCC Mixtures | CVC Mixtures | |||||||||||||||||||||
|---|---|---|---|---|---|---|---|---|---|---|---|---|---|---|---|---|---|---|---|---|---|---|---|
| SCMs/Fillers | 25% Class C Fly Ash | 25% Class F Fly Ash | 30% GGBFS | 20% Class F Fly Ash + 15% LSP | 25% Class F Fly Ash | ||||||||||||||||||
| Flowability | Low Slump Flow | High Slump Flow | Low Slump Flow | High Slump Flow | Low Slump Flow | High Slump Flow | Low Slump Flow | High Slump Flow | 2–4 in. Slump | ||||||||||||||
| NMSA, in. | 3/4 | 1/2 | 3/4 | 1/2 | 3/8 | 3/4 | 1/2 | 3/4 | 1/2 | 3/8 | 3/4 | 1/2 | 3/4 | 1/2 | 3/8 | 3/4 | 1/2 | 3/4 | 1/2 | 3/8 | 3/4 | 1/2 | 3/8 |
| Mixture ID | 111 | 121 | 211 | 221 | 222 | 111 | 121 | 211 | 221 | 222 | 111 | 121 | 211 | 221 | 222 | 111 | 121 | 211 | 221 | 222 | No. 67 | No. 78 | No. 8 |
| Cement Type I/II, lb/cy | 494 | 498 | 568 | 572 | 587 | 494 | 498 | 568 | 572 | 587 | 485 | 489 | 539 | 543 | 558 | 440 | 444 | 488 | 491 | 504 | 459 | 516 | 534 |
| SCM, lb/cy | 165 | 166 | 189 | 191 | 196 | 165 | 166 | 189 | 191 | 196 | 208 | 209 | 231 | 233 | 239 | 135 | 137 | 150 | 151 | 155 | 153 | 172 | 178 |
| Filler, lb/cy | 0 | 0 | 0 | 0 | 0 | 0 | 0 | 0 | 0 | 0 | 0 | 0 | 0 | 0 | 0 | 102 | 102 | 113 | 113 | 116 | 0 | 0 | 0 |
| Coarse Agg., lb/cy | 1580 | 1497 | 1530 | 1450 | 1344 | 1580 | 1497 | 1530 | 1450 | 1344 | 1580 | 1497 | 1543 | 1462 | 1355 | 1567 | 1486 | 1530 | 1450 | 1344 | 1674 | 1485 | 1350 |
| Natural Sand, lb/cy | 1292 | 1328 | 1252 | 1286 | 1344 | 1292 | 1328 | 1252 | 1286 | 1344 | 1292 | 1328 | 1262 | 1296 | 1355 | 1282 | 1317 | 1252 | 1286 | 1344 | 1277 | 1358 | 1455 |
| Water, lb/cy | 280 | 295 | 280 | 295 | 305 | 280 | 295 | 280 | 295 | 305 | 280 | 295 | 280 | 295 | 305 | 280 | 295 | 280 | 295 | 305 | 260 | 275 | 285 |
| HRWRA, oz/cwt | 5.0 | 5.0 | 9.0 | 5.0 | 8.0 | 7.0 | 4.0 | 7.0 | 5.0 | 5.5 | 6.0 | 5.0 | 10.0 | 7.0 | 7.5 | 3.0 | 3.0 | 6.0 | 7.5 | 6.0 | 0.0 | 0.0 | 0.0 |
| VMA, oz/cwt | 0.0 | 0.0 | 3.0 | 0.0 | 3.0 | 0.0 | 0.0 | 2.0 | 3.0 | 3.0 | 0.0 | 0.0 | 3.0 | 0.0 | 0.0 | 0.0 | 0.0 | 2.0 | 3.0 | 0.0 | 0.0 | 0.0 | 0.0 |
| AEA, oz/cwt | 1.5 | 1.5 | 1.5 | 1.5 | 1.5 | 1.5 | 1.5 | 1.5 | 1.5 | 1.5 | 1.5 | 1.5 | 1.5 | 1.5 | 1.5 | 1.5 | 1.5 | 1.5 | 1.5 | 1.5 | 1.5 | 1.5 | 1.5 |
| Total Weight, lb/cy | 3811 | 3784 | 3819 | 3793 | 3776 | 3811 | 3784 | 3819 | 3793 | 3776 | 3844 | 3818 | 3854 | 3829 | 3812 | 3807 | 3781 | 3813 | 3787 | 3769 | 3823 | 3806 | 3803 |
| Total Aggregate, lb/cy | 2872 | 2825 | 2782 | 2736 | 2688 | 2872 | 2825 | 2782 | 2736 | 2688 | 2872 | 2825 | 2805 | 2758 | 2711 | 2849 | 2803 | 2782 | 2736 | 2688 | 2951 | 2843 | 2805 |
| Total Powder, lb/cy | 659 | 664 | 757 | 763 | 783 | 659 | 664 | 757 | 763 | 783 | 692 | 698 | 770 | 776 | 797 | 677 | 683 | 751 | 756 | 776 | 612 | 688 | 713 |
| W/P Ratio | 0.43 | 0.44 | 0.37 | 0.39 | 0.39 | 0.43 | 0.44 | 0.37 | 0.39 | 0.39 | 0.40 | 0.42 | 0.36 | 0.38 | 0.38 | 0.41 | 0.43 | 0.37 | 0.39 | 0.39 | 0.43 | 0.40 | 0.40 |
| S/A Ratio | 0.45 | 0.47 | 0.45 | 0.47 | 0.50 | 0.45 | 0.47 | 0.45 | 0.47 | 0.50 | 0.45 | 0.47 | 0.45 | 0.47 | 0.50 | 0.45 | 0.47 | 0.45 | 0.47 | 0.50 | 0.43 | 0.48 | 0.52 |
| Paste Volume % | 36.0% | 37.0% | 38.0% | 39.0% | 40.0% | 36.0% | 37.0% | 38.0% | 39.0% | 40.0% | 36.0% | 37.0% | 37.5% | 38.5% | 39.5% | 36.5% | 37.5% | 38.0% | 39.0% | 40.0% | 33.9% | 36.3% | 37.4% |
| Coarse Agg. Vol. % | 34.7% | 32.9% | 33.6% | 31.9% | 29.5% | 34.7% | 32.9% | 33.6% | 31.9% | 29.5% | 34.7% | 32.9% | 33.9% | 32.1% | 29.8% | 34.5% | 32.7% | 33.6% | 31.9% | 29.5% | 37.4% | 33.1% | 30.1% |
| Testing Phase | Bar Orientation | Bar Size | No. of Tested Bars | Purpose |
|---|---|---|---|---|
| PHASE I | Vertical | #6 (19M) | 36 | Compare SCC vs. CVC |
| PHASE II | Horizontal | #6 (19M) | 54 | Evaluate top bar and SCC flowability effects |
| PHASE III | Vertical and Horizontal | #5 (16M) #8 (25M) | 144 | Evaluate bar location, orientation, coating, and size effects |
| ID | No. of Specimens | Concrete Type | Bar Orientation | Bar Size and Coating | ||||
|---|---|---|---|---|---|---|---|---|
| CVC | SCC | Vertical | Horizontal | #5 Black | #8 Black | #8 Epoxy-Coated | ||
| S1 | 1 | 18 | 18 | 6 | 6 | 6 | ||
| W1 | 2 | 18 | 18 | 18 | ||||
| W2 | 2 | 18 | 18 | 18 | ||||
| W3 | 2 | 18 | 18 | 18 | ||||
| S2 | 1 | 18 | 18 | 6 | 6 | 6 | ||
| W4 | 2 | 18 | 18 | 18 | ||||
| W5 | 2 | 18 | 18 | 18 | ||||
| W6 | 2 | 18 | 18 | 18 | ||||
| TOTAL | 72 | 72 | 36 | 108 | 48 | 48 | 48 | |
Disclaimer/Publisher’s Note: The statements, opinions and data contained in all publications are solely those of the individual author(s) and contributor(s) and not of MDPI and/or the editor(s). MDPI and/or the editor(s) disclaim responsibility for any injury to people or property resulting from any ideas, methods, instructions or products referred to in the content. |
© 2023 by the authors. Licensee MDPI, Basel, Switzerland. This article is an open access article distributed under the terms and conditions of the Creative Commons Attribution (CC BY) license (https://creativecommons.org/licenses/by/4.0/).
Share and Cite
Asaad, M.; Morcous, G. Bond Strength of Reinforcing Steel Bars in Self-Consolidating Concrete. Buildings 2023, 13, 3009. https://doi.org/10.3390/buildings13123009
Asaad M, Morcous G. Bond Strength of Reinforcing Steel Bars in Self-Consolidating Concrete. Buildings. 2023; 13(12):3009. https://doi.org/10.3390/buildings13123009
Chicago/Turabian StyleAsaad, Micheal, and George Morcous. 2023. "Bond Strength of Reinforcing Steel Bars in Self-Consolidating Concrete" Buildings 13, no. 12: 3009. https://doi.org/10.3390/buildings13123009