Article

Techno-Economic Analysis of the Energy Resilience Performance of Energy-Efficient Buildings in a Cold Climate and Participation in the Flexibility Market

VTT Technical Research Centre of Finland, Otaniemi, 02044 Espoo, Finland
*
Authors to whom correspondence should be addressed.
Buildings 2023, 13(12), 2936; https://doi.org/10.3390/buildings13122936
Submission received: 25 October 2023 / Revised: 17 November 2023 / Accepted: 21 November 2023 / Published: 24 November 2023

Abstract

:
Unexpected power outages and extreme weather encouraged research on energy-resilient buildings throughout the world. Resilient building research mainly focuses on hot weather rather than cold extremes. This study defines resilience terminologies based on the available literature and discusses the impact of energy efficiency on energy resilience performance in energy-efficient buildings due to abrupt power outages in an extremely cold climate. The assessment involves the case simulation of a multistory apartment located in southern Finland at design outdoor conditions (−26 °C) in IDA-ICE 4.8, a dynamic building simulation software, and its techno-economic assessment to ensure building resilience for up to 7 days of power outages. The assessment shows the efficient building envelope can enhance the time taken by the building to drop the indoor temperature to the threshold by approximately 15%. Additionally, the efficient heating system along with the building envelope can reduce the instantaneous power demand by up to 5.3 times, peak power demand by up to 3.5 times, and on average power consumption by 3.9 times. Similarly, the study finds that the total energy requirement during a blackout can be reduced by 4.1 times. The study concludes that enhanced building resilience is associated with energy-efficient parameters such as an efficient energy system and an efficient building envelope that has low thermal losses and high thermal inertia retention. The batteries contribute the maximum proportion to the overall retrofitting cost, and the proportion can go up to 70% in baseline configurations and 77% in efficient configurations of buildings. The analysis concludes that the required investment varies largely with the technologies involved and the combination of components of these energy systems. The assessment finds that the high investment costs associated with batteries and battery recharging costs are the main bottlenecks to feasible flexibility in market participation.

1. Introduction

A prominent approach to decarbonization is the increasing penetration of renewables in energy generation. An Intergovernmental Panel on Climate Change (IPCC) report warned about the serious health risks for more than 350 million people due to the after-effects of climate change [1]. Recent worldwide events show the susceptibility of energy infrastructure to failure during extreme situations, such as extreme weather, natural disasters, and international conflicts [2]. Lack of planning for resource utilization in development strategies can lead to tragic consequences during extreme weather.
Residential, commercial, and public services encompass approximately 30% of Europe’s total energy consumption. Among this major portion are buildings and common areas [3]. Abrupt weather can lead to abnormal temperatures within buildings and common areas. Thus, the buildings require retrofitting with insulators and energy systems that can satisfy the energy demand to maintain indoor conditions during the disruption. This integration of energy systems, or retrofitting, involves extra investment and operational and maintenance costs. The cost involved varies with the technology used and is constrained by numerous factors, including technological maturity, geographical locations, local availability, and policies.

2. State of the Art

Although resilience research has been ongoing for a while, it primarily focuses on the grid system rather than the building system. Among building resilience research, overheating scenarios studies fill the major research proportion, and very limited research is available on extremely cold weather conditions. Lisa and Graham examined passive survivability assessment protocols and metrics and proposed an evaluation methodology for building resilience. The research includes power outage simulation and analyzing the results of building design in a multifamily building [4]. Hamdy et al. introduced the cost-effective flexibility index (CEFI) and active survivability index (ASI) as comparison indicators of building design to analyze survivability from an economic viewpoint in fully electrified buildings in the cold climate of Norway [5]. Homaei and Hamdy experimented with the quantification of thermal resilience in buildings for prolonged power outages and formulated a standard framework for the cold climate. The study introduces weighted unmet thermal performance as an indicator to benchmark the building resilience class [6]. Zhivov intensified the role of thermal mass in building resilience. It scrutinizes the system’s resilience through a quantitative approach derived from analytical and experimental studies of the extremely cold climate [7].
Ozkan and Good established the positive impact of the building envelope on maintaining thermal resilience in both temperature extremes. They performed a comparative evaluation of different envelope conditions within the same building with defined performance indicators such as energy use intensity, thermal energy demand intensity, and thermal autonomy [8]. Kesik et al. used thermal autonomy, passive habitability metrics, and other critical building parameters to establish a standard framework for building resilience benchmarking using a common set of conventions and protocols [9]. Nik et al. discussed the different resilience definitions, emphasizing the energy systems and the associated framework of the resilient energy systems. The paper highlights that the lack of a standardized framework and ambiguity in resilience definitions exhibit challenges in designing climate-resilient energy systems [10]. Attia et al. examined resilience through varied terminologies such as vulnerability, resistance, robustness, and recovery from a disruptive event. The difference in these terminologies thwarts reaching a consensus over resilience calculation methodology and framework for buildings [11]. Referring to the literature considered, it is clear that an opportunity exists to analyze building resilience in an extremely cold climate, which will enrich the existing research and help in achieving more resilient buildings.
As discussed above, research on resilience has been going on for some time. Along with cold climate resilience research, there have been research studies about resilience targeting overheating in buildings. Wang et al. developed a forecast model for heating and cooling and analyzed the overheating severity and duration in high-thermal-performance buildings across varied climate zones in China [12]. Roostaie and Nawari built a comprehensive building assessment framework, integrating the sustainability framework and resilience indicators. The paper assessed the impact of resilience indicators on building sustainability through a decision-making trial and evaluation laboratory (DEMATEL) approach [13]. Zhang et al. investigated and highlighted the importance of resilience criterion inclusion in the design phase in achieving resilient cooling. The technological performance was analyzed for different cooling technologies for heatwave and power outage situations [14]. Tariq et al. scrutinized the efficacy of natural ventilation to achieve resilience during a heatwave for locations with future warm climate scenarios by maintaining thermal comfort and acceptable indoor air quality [15]. Shady et al. analyzed critical resilience cooling parameters within the building and suggested performance-driven thermal environmental quality indicators for resilience against power outages and heatwaves [11].

3. Objective and Novelty

As seen in the state of the art, very little research focuses on resilience in cold climates. Even though the population residing in cold climates is small compared to hot or tropical climates, extreme weather in cold regions is equally fatal and needs research and assessment. The logistic disruption in extreme cold exacerbates the situation, apart from infrastructure challenges. This research aims to define resilience and establish survivability conditions for building parameters during power cut-offs in extremely cold climates. The study paper performs a case simulation in an energy-efficient multiapartment building in Southern Finland to present the impact of energy-efficient systems on building resilience. Furthermore, the assessment shows the type and extent of the system required for different resilience durations and the associated investment for retrofitting or installation. The study explores the possibilities of the system’s participation in the flexibility market to achieve a return on investment and increase the system’s operational time.

4. Methodology

This study first establishes its definition of resilience, habitability, and survivability based on the technical literature in the scientific community. Similarly, this study establishes the minimum threshold boundary condition of relevant parameters based on the academic literature and discussions with experts.
After the parameter setup, the system proceeds to the case study simulation. The case study progresses by developing both configurations of the buildings within IDA-ICE 4.8, a dynamic building simulation software. The building model resembles the real-life multiapartment positive energy building located in Southern Finland [16]. IDA-ICE provides the localization of Finland, which encompasses the standard climate file, wind profiles, and relative humidity. Since the study aims for blackout analysis in extremely cold climates, there was no radiation during the simulation duration, and the outdoor temperature was modified to −26 °C, the design temperature condition of Southern Finland according to the Finnish decree [17]. After establishing the model and the parameters within the software, the study proceeds to simulate the building operations for two weeks and record the temperature within the typical apartments. During the first week, the building maintains the normal temperature, and grid power is available. During the start of the second week, a blackout occurs. The study includes the simulation of two weeks to smooth the simulation process.
The study moves ahead with the processing of simulation results in Microsoft Excel (version 1808) to plot them as graphs. To obtain the energy and power matrix, the system is simulated again to turn on the power supply as soon as the setpoint touches the survivability threshold. The new simulation results are plotted as graphs to provide the energy and power matrix sizing points for different resilience durations. Further on, the assessment explores different energy system components that fulfill the technical requirements to ensure building resilience during the blackout while following the pertinent constraints. The relevant technical specifications of selected components are assumed based on real-life components available on the market. After the selection of technologies and the sizing of the energy system, the study performs an economic assessment of the participating energy systems. The costs of components are comparable to those of real-life components with similar technical specifications, and specific caution is considered for the application of value-added tax.
Toward the end of the study, it explores the participation of the proposed energy system in the flexibility market under two scenarios to check the return on investment of the integrated system. The formulae used and assumptions are discussed in the respective sections. The study performs only theoretical analysis and simulation due to the unavailability of blackout data for the Finnish region. The study finishes with the findings of the assessment and the possible future work.

5. Material and Simulation Setup

5.1. Definitions of Resilience in Building

The state-of-the-art section depicts the variations in building resilience terminologies. A consensus over definitions, parameters, and terminologies can expedite further research on the same. This section presents the different definitions of building resilience and represents the author’s definitions.
UN (United Nations) General Assembly resolution 71/276 describes resilience as “the ability of a system, community or society to resist, absorb, accommodate, adapt to, transform and recover from the effects of a hazard in a timely and efficient manner, including through the preservation and restoration of its essential basic structures and functions through risk management” [11]. The resilience definition and the associated characteristics vary with the domain of study performing the investigation.
From an engineering perspective, a resilient building is a building that can withstand a power outage while maintaining safe indoor environmental conditions such as operational temperature and ventilation rate, along with the supply of minimum energy required for a definite time or before being recovered. Table 1 shows the different definitions of building resilience among different engineering disciplines.
From a thermally resilient building standpoint, resilience is the ability of a building to adapt thermally and maintain safe thermal conditions indoors during power disruptions. Thermal conditions can be classified as habitable conditions or survivable conditions while assessing the building’s resilience. Different terminologies, such as habitability or survivability, define the building’s resilience based on the conditions maintained within the building. The next paragraph presents the authors’ definitions of habitability and survivability.
“Habitability refers to the time duration for which the building remains habitable in case of energy supply disruption to the building due to seen or unseen circumstances”. Habitability can further be classified as active or passive based on the components used to maintain the indoor conditions. Passive habitability indicates the situation in which the thermal inertia retained via the building envelope maintains the thermal conditions within the building. In the case of active habitability, an on-site energy system or an external energy source assists in maintaining indoor conditions.
Moreover, “Survivability indicates the ability of a building to maintain thermal conditions along with minimum operational capabilities during a power outage”. Habitability ascribes to thermal resilience, while survivability employs thermal resilience along with minimum operational capabilities such as lighting, appliances, sewage, and domestic hot water. Apart from minimum operational capabilities, survivability encompasses a broader temperature range compared to the comfortable range.

5.2. Boundary Conditions

This section explores the parameters used in building resilience and establishes a recommended range to maintain survivability conditions within the building based on the different literature.
According to the American Society of Heating, Refrigerating, and Air-Conditioning Engineers (ASHRAE), the acceptable temperature range for naturally ventilated buildings ranges from 10 to 34 °C. The ASHRAE-55 model confers a prevalent mean outdoor temperature range of 10 °C to 33 °C for passive survivability. Additionally, the ASHRAE Thermal Environmental Conditions for Human Occupancy standard 55-2004 [22] defines a comfort temperature range of 19–26 °C for winters at a maximum humidity ratio of 0.12 Kgwater/kgdryair [4]. The guide for resilient thermal energy systems design in cold and arctic climates prescribes a minimum temperature of 16 °C indoors during emergency situations such as blackouts for human comfort and maintaining dexterity in critical operations [23]. Homaei and Hamdy define the lower threshold of the habitability range in the Norwegian environment as 15 °C in their work on the quantification of energy flexibility and survivability with batteries. The habitability defined in their work is analogous to survivability in this study [5]. Similarly, Kesik et al. define the lower temperature threshold for passive habitability as 15 °C in mechanically cooled buildings. Their habitability temperature corresponds to the survivability temperature threshold of this study [9]. Compiling all the work, the advocated lower temperature threshold is 15 °C. This study only defines the lower temperature threshold because the study focuses on resilience in a cold climate.
High relative humidity also impacts human health with extended exposure, but this study considers a short-duration exposure in exceptional circumstances (one-week blackout). Thus, this study employs standard relative humidity values, which are shown in Table 2. The Federation for European Heating, Ventilation, and Air Conditioning Associations prescribes 1000–2000 ppm CO2 concentration in an indoor environment and suggests intervention if concentration goes out of this range [24]. Contrary to this, the Finnish decree advocates an upper threshold limit in the range of 1500–1600 ppm in an indoor environment [25]. Incorporating recommendations, the study considers the upper threshold limit of CO2 as 1500 ppm and the lower ventilation setpoint as 1.26 m3/h/m2. Air change within the building maintains the CO2 concentration and is depicted by the ventilation setpoint.
The expected operational household equipment during the blackout includes a fridge, freezer, microwave oven, communication devices (laptop, Wi-Fi, and mobile charger), and minimum lighting. There was no usage of dishwashers, saunas, laundry, or showers during the blackout. Figure 1 shows the typical occupants’ household behavior in the Finnish region in terms of the proportion of average peak power used per hour of the day. The profile incorporates the usage of the above-mentioned necessities only and is modified based on online tools and the available literature [26,27]. Survivability conditions for a short duration require a minimum of 5 to 7 L of hot water per day, according to the Safe Drinking Water Foundation [28]. The study assumes an even distribution of hot water over 24 h to simplify the simulation. Table 2 represents the building’s indoor parameters for survivability and normal conditions.
Table 2. Building indoor parameters (setpoints) for survivability and normal conditions.
ParametersSurvivability ConditionNormal ConditionUnits
Lower temperature threshold1521°C
CO2 upper threshold concentration 1500800ppm
Ventilation lower threshold1.261.8m3/h
Outside temperature −26−26°C
Domestic hot water consumption748liters/person/day
Domestic hot water idling load1.21.2W/m2 [29]
Relative humidityNA, restricted by microbial growth20–80%
Occupancy presence10060%/24 h
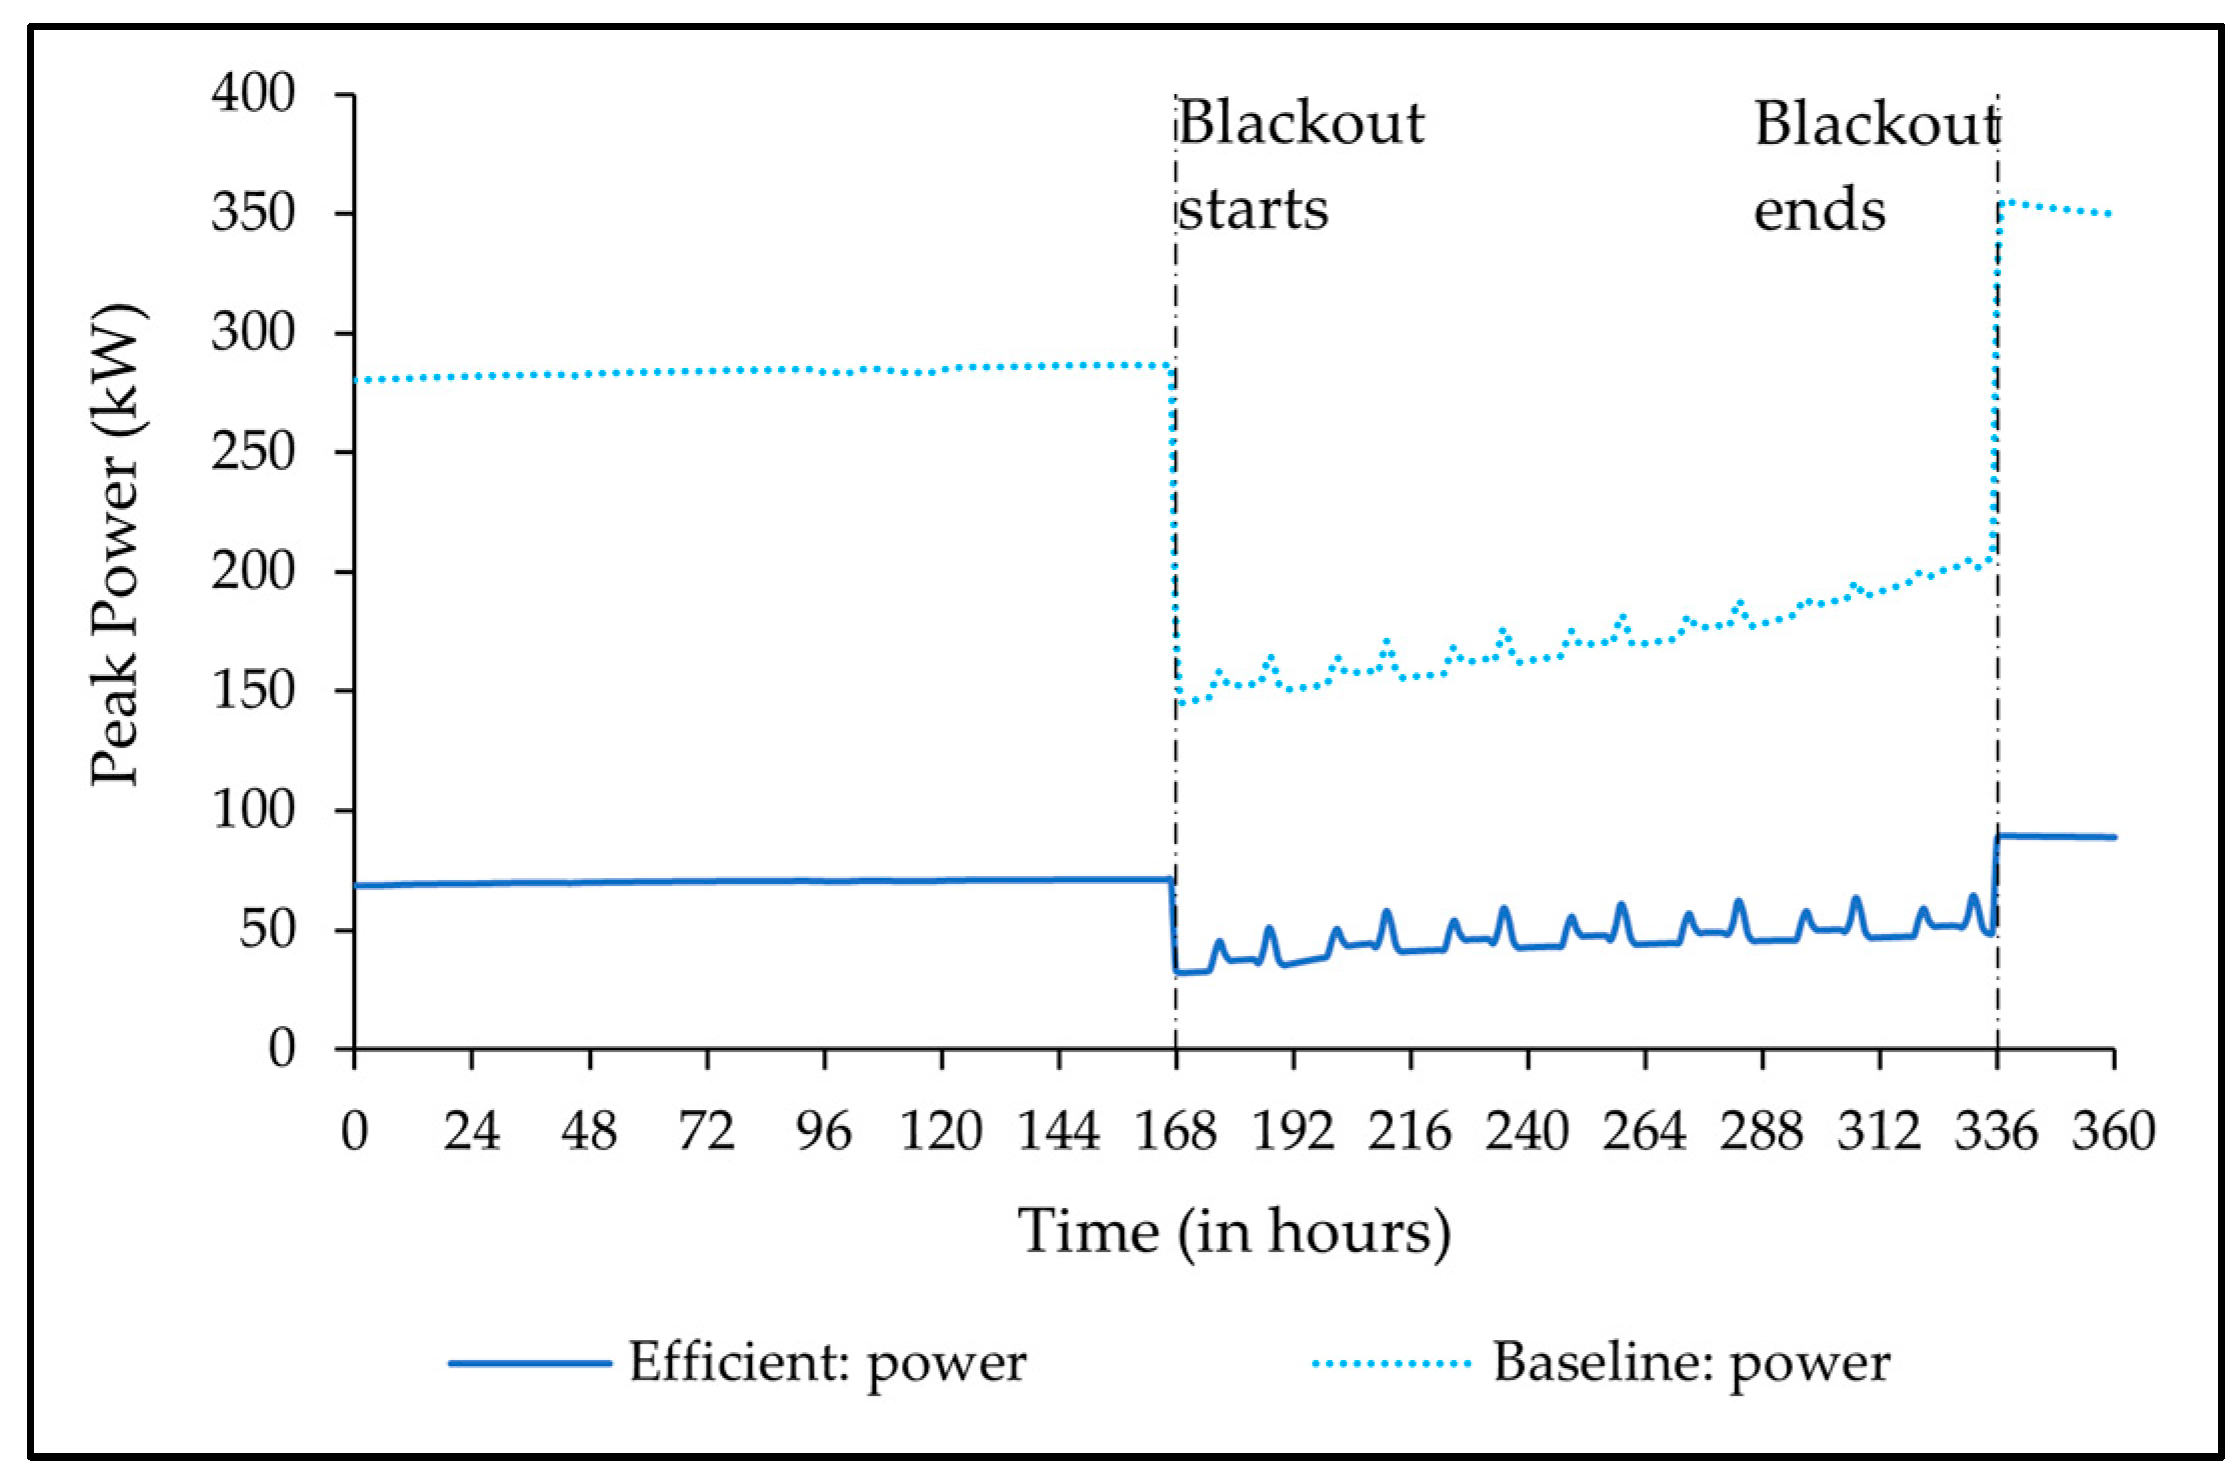
Based on assumed occupants’ behavior and power consumption during a blackout, a typical apartment consumes an average power of 113 W and 341 W of peak power. The typical energy consumption per day, excluding space heating and domestic hot water energy, is 2.7 kWh. Table 3 shows the space heating and domestic hot water temperatures for the blackout duration, which follow the Finnish standards for net-zero energy buildings.
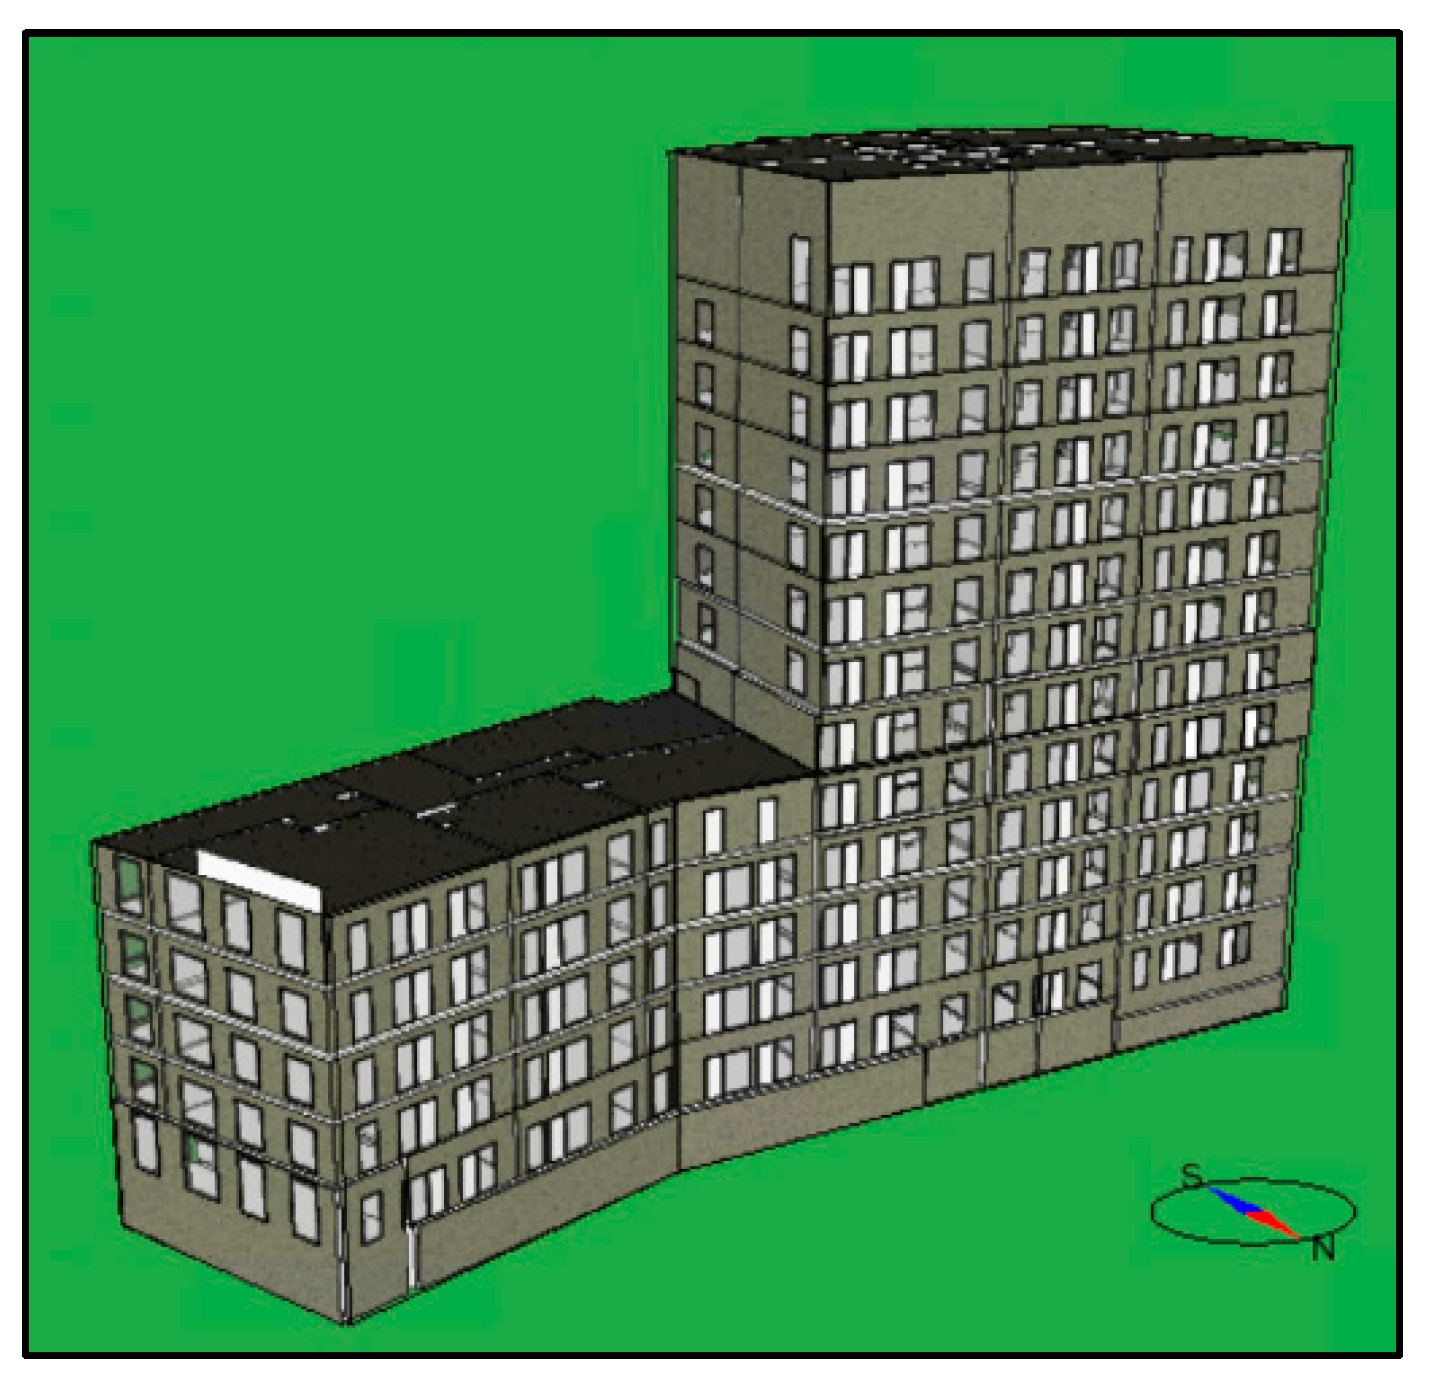
This study scrutinizes an urban building block located in the Kalasatama urban area, Helsinki, in Southern Finland, containing residential apartments and commercial spaces. It comprises two towers with 5 floors and 13 floors, respectively, with an aggregated area of 7391.5 m2 and an effective apartment area of 5863.84 m2. Figure 2 shows the 3D (3-dimensional) diagram of the reference building in IDA-ICE simulation software, Version: 4.8.
The study performs a resilience simulation for two sets of energy efficiency parameters for buildings. The two sets are named baseline configuration and efficient configuration. The baseline configuration building derives its U-values and glazing values for the building envelope from the Finnish building code. Similarly, the efficient configuration building acquires these values from the Flexible user-centric energy-positive houses (EXCESS) project under EU Horizon 2020. The district heating system ratifies the heating and domestic hot water requirements for the baseline building configuration. However, a heat pump suffices all the heating energy requirements in an efficient configuration building. Table 4 illustrates the parameter values for both configuration buildings.
The default configuration of IDA-ICE employs ideal heaters and coolers for heating and cooling and operates on a proportional–integral (PI) controller. These controllers cannot record the data for the individual zones. Thus, both buildings employ a custom macro-controller that can document individual zone temperatures. The macro-controller operates on PI logic and maintains the normal condition and survivability condition setpoints accordingly. After setting up the building parameters, survivability parameters, and macro-controller, the system simulates for two weeks in both building configurations and records the temperature profiles for all typical apartments. Both buildings withstand the blackout in the same conditions, except for their building envelope and heating system.

5.3. Energy and Power Required

The indoor temperature can drop below the threshold value during the blackout if no external power is supplied. Thus, to calculate the required power to maintain survivability temperature thresholds, the system is modified to turn on the power supply within the building as soon as the indoor temperature touches the survivability threshold.
The hourly time-series data provide the power required at each hour to maintain the survivability conditions. The product of the power supplied and the duration for which the power is supplied calculates the energy required for the specific duration. In this way, the assessment provides the power and energy matrix, which specifies the power and energy required for each resilience duration.

5.4. Energy System for Building Resilience

The scenario under consideration includes a blackout; hence, no power is available from the grid. Thus, external energy systems need to support the energy supply post thermal inertia depletion of the building. Multiple energy systems possess the potential to fulfill the energy requirements but are thwarted by practical constraints such as availability at the site, space availability for installation, technological maturity, and local policies. Therefore, diesel generators, oil boilers, and lithium-ion batteries turn out to be the most feasible solutions considering different constraints, such as technical, economical, geographical, and local constraints.
Diesel generators produce one-phase or three-phase electrical energy, depending on the type of generator. The reference building employs a three-phase diesel generator and lithium-ion batteries coupled with the inverter to supply electrical energy while the oil boiler and heat pump deliver the heating, depending on the building configuration. The technical specifications of the considered components reflect the technical specifications of real-life components that can be used in the building.
As shown in Table 4, both configuration buildings require electricity as an input for necessities other than space heating and domestic hot water. The baseline configuration building fulfills the heat energy requirement through district heating, while the efficient configuration building generates the heat energy through the heat pump. Since the baseline configuration building connects to the district heating system, it needs heat as an energy input for space heating and domestic hot water. The efficient configuration building requires electricity as an energy input, even for space heating and domestic hot water, due to the connection with the heat pump.
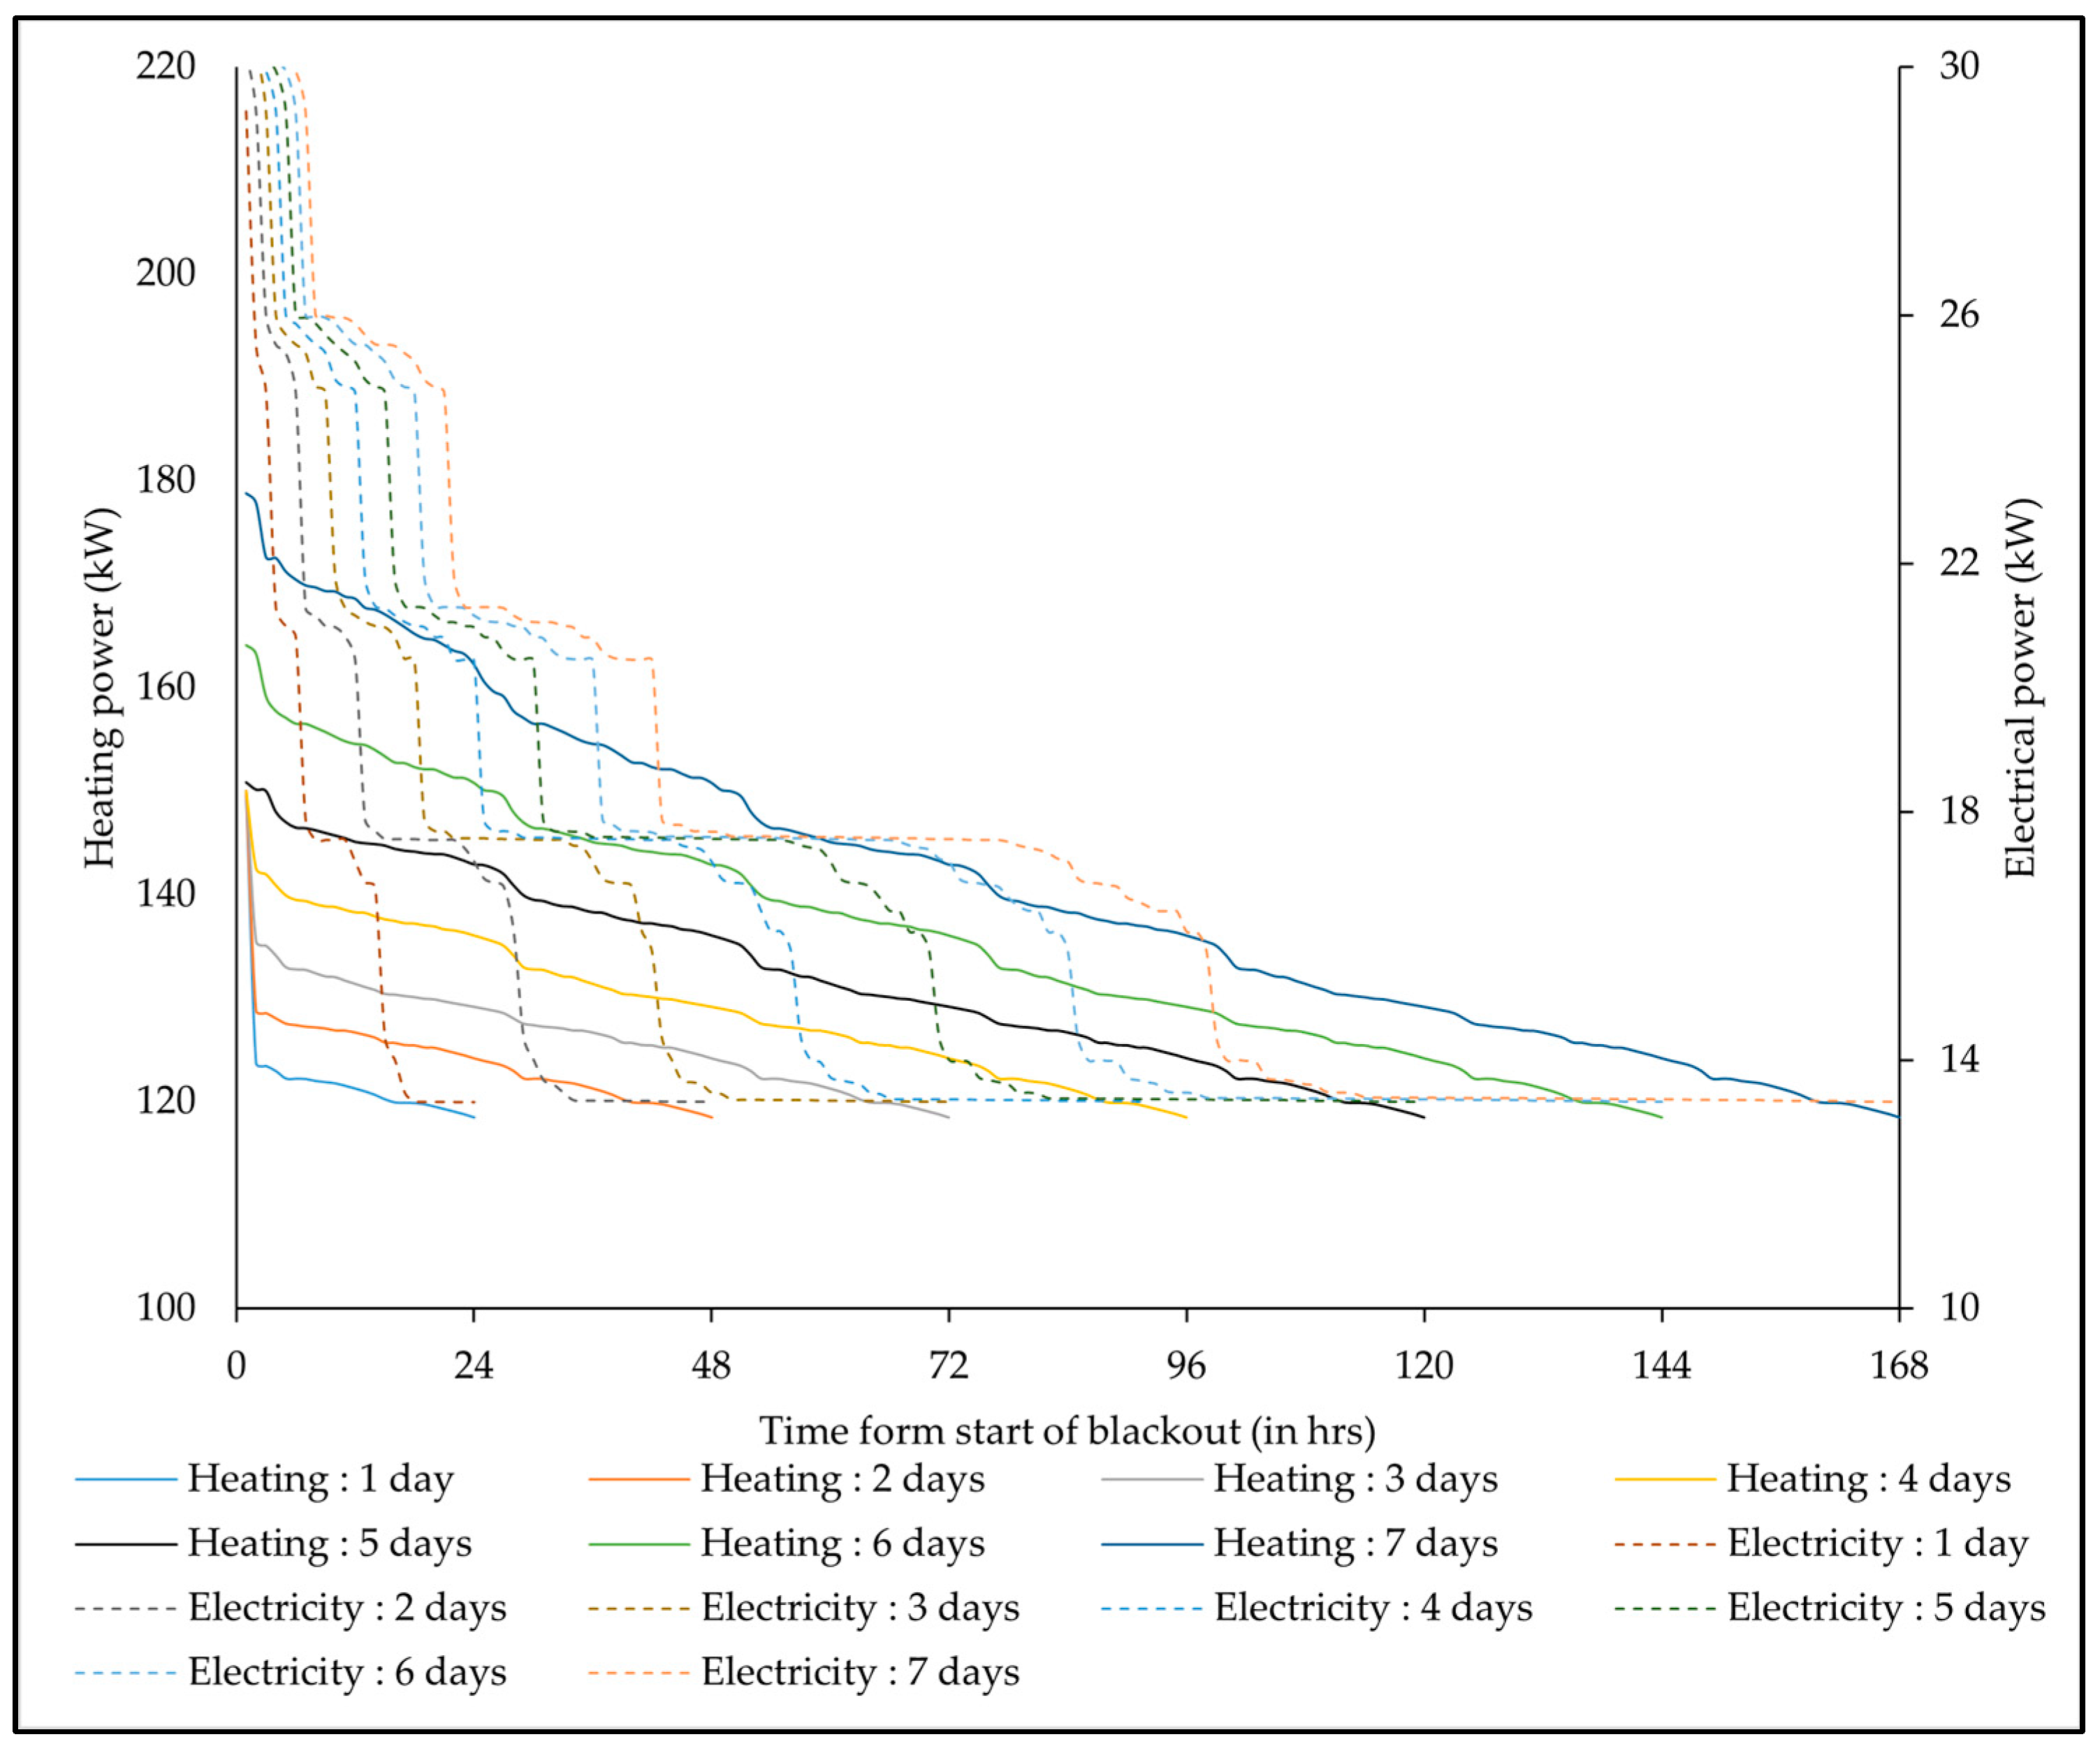
Since the baseline configuration building requires heating and electrical energy separately as input, the sizing requires two types of duration curves. On the contrary, only electrical energy duration curves show the energy required within the efficient configuration building. The delivered power simulation results plot the duration curve after sorting. The baseline configuration plots the electrical and heating energy duration curves separately, while the efficient configuration building only plots the electrical duration curve.

5.5. Energy Systems Cost

The energy system tries to simulate real-life work. Thus, the cost of system components also matches real-life values. The cost includes all product costs, shipment costs, and installation costs, with special consideration of appropriate value-added tax (VAT) applicability. Relevant assumptions are made for installation costs in cases of data unavailability as per reference product installation instructions. Appendix A shows the reference costs of the products. The prices of diesel fuel and heating oils are dynamic; thus, the final price in the study is the average market price from 18 July to 24 October 2022. Table 5 depicts the additional costs and fuel costs associated with the energy system integration.

5.6. Energy Flexibility

The integration of the energy system is a precautionary measure to withstand unplanned power outages. Since the integrated system includes different components, with strategic implementation, some components can operate during normal duration without impacting the building’s resilience potential. The expanded operation opens the possibility of increased operational time for the system and helps in achieving a return on investment.
The increased renewable energy penetration in electricity and energy-intensive equipment usage has increased power quality disruptions in the form of harmonics, voltage, and frequency disruptions [35]. A new market emerged due to these disruptions, ensuring the grid’s operation according to the National Code. Energy reserves with rapid power delivery capabilities can participate in this market and earn revenue for their service. These energy markets are called ancillary services markets or flexibility markets. The different types of ancillary markets include frequency containment reserve (FCR), frequency restoration reserve (FRR), and fast frequency reserve (FFR), depending upon the activation time from the start of disruption. These energy markets operate in the form of a yearly market or hourly market, based on which participation requirements change. Each market requires a minimum size of bid to participate [36]. The systems with less power reserve availability can participate through an aggregator who charges a fee in exchange for its service. The aggregator combines the smaller power reserves and regulates them according to the TSO’s requirements.
Due to the smaller size of building power reserves, the study considers participation in the hourly market. This study performs a perfunctory calculation to assess the impact of the participation of energy systems in the flexibility market on achieving a return on investment. Appendix B describes the assumptions for participation in the flexibility market in both scenarios. It describes the system characteristics participating in the flexibility market for both building configurations. The first scenario considers daily participation with full reserve activation, while the second scenario considers daily participation with no reserve activation. Economic calculations assess the system’s feasibility to participate in the flexibility market and achieve a return on investment using the system’s characteristics. The revenue calculation employs the capacity fee calculation formula prescribed by FINGRID for participation in the respective flexibility markets, which are shown in Equations (1) and (2) [37]. The return-on-investment time calculation and net yearly revenue calculations employ Equations (3) and (4).
Capacity fee (€) = maintained reserve capacity (MW,h) × hourly market price (€/MW,h) − sanctions (€)
Sanctions (€) = reserve capacity not delivered (MW,h) × 3 × hourly market price for specific hour (€/MW,h)
Return on investment (years) = system cost/net yearly revenue
Net yearly revenue (€) = yearly revenue (€) − yearly recharging cost (€)

6. Simulation Results and Discussion

The simulation duration is two weeks, during which the building operates at normal conditions for the first week. The blackout occurs at the start of the second week, and the building tries to maintain the survivability conditions indoors. This section discusses the results of the building simulations performed in IDA-ICE with the above-mentioned boundary conditions.

6.1. Temperature Decay Profile

The custom macro-controller records the temperature profile in all typical apartments for both building configurations. The temperature decay profiles are represented in Figure 3 and Figure 4 for efficient and baseline building configurations, respectively. The building operates at normal conditions during the first week, and then the blackout occurs at the 168th hour. The indoor temperature within both buildings starts to drop and follows the curve as shown in the figures. The multiple lines imply the variation in temperature drop rate in different apartments due to the number of parameters such as the size of the apartment, location within the building, and so on. The apartments’ names follow the building drawing convention for both configuration buildings [38].
Table 6 presents the maximum, minimum, and average time taken by the apartments to drop the indoor temperature to the survivability condition threshold. From Figure 3 and Figure 4, and Table 6, it is clear that the typical apartments with an efficient configuration building take more time to drop the indoor temperature to the lower temperature threshold value of the survivability parameters. The analysis shows that on an average basis, a typical apartment with the efficient configuration takes 15% more time than the baseline configuration building apartment to drop the indoor temperature to the lower temperature threshold.
Figure 5 represents the temperature profile of apartments, which takes the maximum, minimum, and closest to the average time to drop the indoor temperature to 15 °C. The efficient configuration building apartments take more decay time. The blackout occurs at the same temperature in both configuration buildings while maintaining the same survivability conditions. The only difference among buildings lies in the building envelope parameters and energy system for heating. Since no heat supply occurs during the blackout, it is clear that the improved building envelope parameters, higher thermal inertia retention, and lower thermal loss rate enhance the decay time in efficient configuration building apartments.

6.2. Delivered Power

As evident from Figure 5, the temperature within the building keeps dropping below the survivability threshold if no power is supplied during the blackout. Hence, the system is simulated with the macro-controller to turn on the power supply as soon as the setpoints touch the survivability threshold. The simulated results provide the temperature and power required to maintain the survivability parameters within the building. Additionally, IDA-ICE can classify the total power consumption among different components.
As discussed previously, both buildings differ in the building envelope and the heating system used. Thus, space heating–electric and domestic hot water–electric represent typical electrical energy consumption in maintaining thermal setpoints of space heating and domestic hot water production in an efficient configuration building. Similarly, space heating–thermal and domestic hot water–thermal illustrate heat energy input for the baseline configuration building. HVAC implies the ventilation system power that maintains the CO2 concentration and moisture level within the building. Equipment resident and lighting resident refer to the electrical energy consumption for household amenities and light bulbs, respectively. Figure 6 shows the power consumption among different components during the simulation period in both configuration buildings.
Both configuration buildings have almost equal power requirements for equipment resident and lighting resident because of the same occupant behavior and the same household appliance usage. The slight difference observed in equipment energy consumption is due to the variation in internal gains due to the different thermal envelopes and thermal loss rates. HVAC electricity consumption in an efficient configuration building is less due to the lower ventilation setpoints. The efficient configuration building’s peak power consumption in space heating and domestic hot water is much less compared to the baseline configuration building. This is due to the highly efficient heat pump, better thermal envelope, and low thermal losses. The heat pump operates at a COP ranging from 3 to 5 against the standard district heating COP of 0.98 as per the Finnish localization of IDA-ICE.
The combined effect of the improved building envelope and highly efficient heat pump leads to 3 to 5.3 times less peak power requirement in the efficient configuration building compared to the baseline configuration building, which is shown in Figure 7. On an average consumption basis, the baseline configuration building consumes 3.9 times more power. This indicates that more energy-efficient heating systems, along with improved building parameters, help achieve building resilience.

6.3. Power and Energy Matrix for Building Resilience

The section explores the peak power and total energy required to maintain the survivability conditions for different resilience durations within both configuration buildings based on the simulation results from the delivered power section. Figure 8 depicts the peak power and peak power per m2 needed in both configuration buildings to maintain the survivability conditions for resilience duration varying from 1 to 7 days.
The peak power required in both configuration buildings increases with the resilience duration. The rate of increment is higher in baseline configuration building because of the less efficient heating systems, reduced thermal inertia retention, and higher thermal losses from the building envelope. From Figure 8, it is clear that the baseline configuration building dissipates 3.1 to 3.6 times more peak power than the efficient configuration building. The peak power per m2 follows the same trend as peak power, as both buildings occupy the same area. The use of a less efficient heating system and a less thermal-resistant building envelope causes increased power consumption within the baseline configuration building.
Therefore, an efficient heating system and an improved building envelope, which help in higher thermal inertia retention and fewer thermal losses, enhance the building’s resilience prospects.
Table 7 depicts the peak power requirement among different components for both configuration buildings. Analyzing Table 7 shows that within the baseline configuration building, space heating consumes the maximum power amount followed by equipment resident and domestic hot water for all resilience durations. Less efficient heating systems, higher thermal losses, and lower thermal inertia retention cause the maximum power requirement in space heating, hence this power consumption trend.
Considering the efficient configuration building’s power consumption trend, the order for the first two days is equipment resident, followed by space heating and domestic hot water. From the third day, the power dissipation order among components is the same as in the baseline configuration building. In an efficient configuration building, the power consumption trend among components during the initial days varies due to higher thermal inertia retention for the increased duration due to the efficient building envelope. Table 8 shows the peak power per m2 among different components in both configuration buildings, and the consumption trend is the same as observed in peak power for the respective buildings.
Figure 9 shows the total energy and energy per m2 required in both configuration buildings for different resilience durations. Similar to the peak power, total energy and energy per m2 needed in both configurations increase with enlarged resilience duration. The rate of increment in the baseline configuration is much higher than in the efficient configuration building. Through analysis of Figure 9, it is evident that the baseline configuration building consumes 3.7 to 4.1 times more energy than the baseline configuration building. The energy consumption ratio and rate of energy consumption increase with resilience duration more in the baseline configuration building because of the less efficient heating system and higher thermal losses. The less efficient heating system and high thermal losses mandate the steady usage of higher average power for a longer duration, which causes this energy requirement trend. Table 9 and Table 10 depict the classification of total energy and energy per m2 consumed by different components in both configuration buildings, respectively.
On analyzing Table 7, Table 8, Table 9 and Table 10 together, it is clear that the same components occupy the maximum proportion of total energy consumption as in peak power consumption for the baseline configuration building. The order of energy consumption in an efficient configuration building is space heating, followed by equipment resident and domestic hot water. It is clear from Figure 6 that the equipment resident consumes more peak power than space heating for the first two days, but the duration of peak power is relatively small during the entire day. The total energy is the average power consumed throughout the resilience duration. Thus, on an average power basis, space heating consumes more energy throughout the day, which leads to the above-discussed trend of energy consumption within an efficient configuration building.

6.4. Energy System Sizing for Building Resilience

The Energy System for Building Resilience section discussed the different energy systems that possess the capability to fulfill the energy requirement following the different constraints. This section deals with the sizing of those components to ensure building resilience for different resilience durations.
As mentioned before, efficient configuration building plots the electrical energy duration curve, which is shown in Figure 10. The duration curve in Figure 10 shows that 75% of the total time requires less than 40 kW of peak power for 1-day resilience. Similarly, for 2- and 3-day resilience, 84% and 70% of total time require less than 45 kW of peak power; 80% of total time requires less than 50 kW of peak power for a resilience duration of 4 to 7 days.
Figure 11 shows the electrical power consumption within the efficient configuration building. It also describes the average power consumption for each resilience duration. Along with these, it also depicts the duration for which the power requirement is fulfilled if different generators (with technical specifications similar to real life) provide power supply for the mentioned resilience duration.
Peak power consumption occurs for a very short duration, and average power is more than instantaneous power for the majority of the time, as shown in Figure 11. Therefore, the generator fulfills the energy supply until the above-mentioned power consumption point to avoid excess oversizing of the generator. The battery assists in fulfilling the remaining energy peak.
Similarly, Figure 12 shows the electrical and thermal power duration curves for each resilience duration for the baseline configuration building. Figure 13 represents the instantaneous heating and electrical power curve for the baseline configuration building. The electrical power duration curves have steep peak power for a short duration, as shown in Figure 13. Thus, the electrical power is divided among batteries and generators in such a way that the generator compensates for more than the average power and the battery assists with the remaining peak power. The heating power is separately provided using the boilers.
The combined analysis of Figure 10, Figure 11, Figure 12 and Figure 13 gives the sizing points for power distribution among electrical (generator and battery) and heating. Table 11 represents the discussed total power distribution among heating and electrical components for both configuration buildings.
The technical specifications, such as the rated power of selected generators, are closest to the average required power and resemble the power rating of real-life equipment. The battery and power conversion device’s technical specifications also resemble those of a real-life product with the potential to fulfill energy requirements. Major technical specifications for generators and batteries are shown in Appendix A.
The system assesses the combination of energy system components that can ensure building resilience for different durations for both configuration buildings. The assessment of energy systems assesses the different scenarios of system components for both configuration buildings. The baseline configuration includes a system containing all boilers, generators, and batteries, a system containing only boilers and generators, and a system containing only boilers and batteries. Similarly, the efficient configuration building assessment includes scenarios combining both generators and batteries, only generators, and only batteries. The scenarios in both configuration buildings give the range of components needed for any resilience duration in each configuration building, for any resilience duration of up to 7 days. The assessment ensures that the combination of components in each system fulfills the power and energy requirements for each duration while following the electrical technical constraint.
Table 12 shows the different combinations of components of energy systems in an efficient configuration and baseline configuration building, respectively, that fulfill the energy requirements during the power outage.
Analyzing Table 12, within the efficient configuration building, the number of battery modules used observes a dip after 3 days due to a change in the prime-rated power of generators used. The baseline configuration building shows an increasing trend in the number of batteries used with the resilience duration due to the constant rated power of the generator for all resilience durations. Two sets of generators in both buildings ensure that the system can withstand the worst scenario, which is a blackout when the batteries are discharged.

6.5. Energy System Cost Matrix for Resilience Duration

This section discusses the retrofitting cost of energy systems within the buildings calculated using the product and the additional costs mentioned in Appendix A and Table 5. Table 13 represents the overall cost needed and cost per m2 needed to maintain resilience through different combinations of components within both configuration buildings. Compared to the system with no batteries, the retrofitting cost is low in the efficient configuration building. The same component ensures the energy supply for both energy types (heat and electricity). Hence, the observed trend is due to the single energy input in the efficient configuration building versus two separate energy inputs in the baseline configuration building. The two separate energy requirements imply the usage of two types of components, which means more initial investment. Both configuration buildings consume similar amounts of energy, except for thermal temperature maintenance. Thus, the cost increment rate with prolonged resilience duration is low in the efficient configuration building because of fewer thermal losses and a more efficient heating system, which together lead to less fuel consumption to maintain survivability conditions.
Analyzing the no-generator systems, the batteries supply electrical energy in this case. The baseline configuration building directly obtains heat from the boiler and has less associated investment and operational costs. In an efficient configuration building, electricity is required as an input, even for heating. The heat pump consumes electricity to produce heat energy, thus requiring additional energy conversion. More batteries are required to fulfill the energy demand, thus resulting in more investment costs. Hence, the single type of energy input leads to a higher retrofitting cost in an efficient configuration building. The trend in the proposed system (containing both batteries and a generator) for retrofitting costs varies with the rated power of the generator included in the system to supply electricity.
Figure 14 depicts the distribution of overall cost among different components of the system containing both generators and batteries for both building configurations. Both graphs show that the batteries occupy the maximum proportion of the overall cost for all resilience durations, and the proportion varies from 40% to 77% of the overall cost. In an efficient configuration building, for a small resilience duration, the generator cost is higher than the safety and storage cost at constant generator power, while for a higher resilience duration, the safety and storage cost is higher. This trend appears due to the increasing area required by the system and the additional safety compliance arrangements associated with that area. For short-period resilience, the system requires a smaller number of batteries and generators, resulting in less area and a low proportion of overall cost. With increased resilience duration, the number of batteries required increases even with a constant number of generators. Therefore, with increased resilience duration, safety and storage cost constitute the second-largest proportion of the overall cost. A similar trend is observed in the baseline configuration building: for smaller resilience durations, the generator and boiler occupy a higher proportion of the overall cost against the safety and storage cost. With the increased resilience duration, the area requirement increases, thus safety and storage cost become the largest contributor to the overall cost next to the battery in retrofitted energy systems.
Figure 14 shows that batteries constitute the maximum proportion of the overall cost, and the associated initial investment cost is also higher. Thus, the efficient configuration building has a higher resilience cost because the heating energy required is supplied through a heat pump, which requires electrical input. However, the boiler supplies the heat directly in the baseline configuration building, thus resulting in less retrofitting costs.

6.6. Flexibility Market Participation

This section assesses the participation of both configuration building energy systems in the flexibility market under two scenarios. The first scenario involves daily participation with full reserve activation all the time, and the second scenario considers daily participation with no reserve activation. Appendix B describes the assumptions for both scenarios’ participation in the flexibility market. Additionally, it discusses the characteristics of integrated energy systems for both configuration buildings.
Table 14 shows the yearly recharging cost and the revenue generated through participation in different flexibility markets at the full activation scenario at March 2022 electricity prices for both configuration buildings. The analysis of Table 14 shows that the yearly recharging cost of participation in the flexibility market is more than the revenue earned through participation in the respective flexibility market for efficient configuration building. While in the baseline configuration building, the revenue is higher than the recharging cost in the case of the aFRR market with the most favorable bidding price. Even in this case of higher revenue, the return-on-investment time is higher than 10 years, which is more than the lithium-ion battery shelf life. Hence, the system becomes non-feasible in a full activation scenario at the March 2022 electricity prices. Since the electricity price in October 2022 is almost 3–4 times higher than March 2022 electricity prices, there is therefore no return on investment at higher electricity prices in both configuration buildings’ energy systems under the full reserve activation scenario.
The above-discussed energy market compensation is capacity-based. Thus, the scenario with an equal number of hours of participation per day with no reserve activation will not have any recharging costs. Hence, the system will have a return on investment even within the feasible time limit. Table 15 shows the revenue earned through participation in the energy market in the case of no activation of the reserve.
From Table 14 and Table 15, it is clear that the possible reasons for no return on investment in energy systems include the high electricity cost of battery recharge and the high initial investment of battery modules. However, an increasing number of battery energy storage system plants as reserves in the flexibility market indicates the probable future feasibility of the technology. The reduction in battery investment costs may help make this concept more feasible. Additionally, an onsite renewable energy system also supports the flexibility and market participation of energy reserves.

7. Conclusions

The recent trends indicate the challenge of climate change to human health and dwellings. The study shows the lack of research on resilience in extremely cold climates. The existing research does not assume consensus over terminologies, characteristics, or thresholds for relevant parameters. This study establishes the terminology and threshold parameters by compiling the available literature. This will further support resilience analysis in extremely cold climates.
Simulation results from IDA-ICE show that the time taken by the building to drop the indoor temperature to the threshold value from the normal temperature increases by 15%. The efficient building envelope, having higher thermal inertia retention and low thermal losses, enhances the building’s resilience. The integration of an efficient heating system along with the building envelope reduces instantaneous power consumption by 3 to 5.3 times and, on an average basis, by 3.9 times. While peak power reduces by a range of 3.1 to 3.6 times, depending on the resilience duration, the total energy required similarly reduces by 3.7 to 4.1 times due to the efficient building envelope and efficient heating system.
Withstanding all the technical requirements and applicable constraints for energy systems—diesel generators, lithium-ion batteries, and oil boilers—are found apt and sized for usage in both buildings. Real-life products’ analogous technical specifications and prices simulate the system closer to reality. The economic assessment shows that battery proportions in overall cost can go up to 70% and 77% in the baseline and efficient building configuration, respectively. The range of investment needed highly depends upon the number of batteries involved in the system. The range of investment varies from 10.09 EUR/m2 to 10.86 EUR/m2 for the efficient configuration building and from 15.97 EUR/m2 to 20.84 EUR/m2 for the baseline configuration building in the case of no battery system. For the system with no generator, the efficient configuration building’s resilience cost varies from 107 EUR/m2 to 922 EUR/m2. The baseline configuration building’s resilience cost varies from 59 EUR/m2 to 367 EUR/m2 depending upon the duration of resilience. The system containing no batteries has a very low retrofitting cost because of the lower initial investment and the lower associated fuel cost.
Ancillary services markets emerged as the outcome of grid fluctuations. The reserves can participate within them to ensure the grid’s operation according to the National Code and earn revenue for their service. This study assessed the participation of building reserves in different hourly ancillary markets for two scenarios, including full activation of reserves and no activation of reserves. In the full activation scenario, the recharging cost of the battery is higher than the potential revenue in both configuration buildings. Thus, no return is feasible in the situation of recharging from grid electricity. The scenario with no activation of reserves implies a feasible return on investment because no battery recharging cost is incurred during participation. The increasing number of renewable-integrated battery reserve pilot plants participating in the flexibility market also corroborates the same. Thus, more of these systems can participate in flexibility markets in the future if battery costs are reduced, or an onsite renewable energy generation system is installed.

8. Future Work

This work can be further extended to assess and establish the resilience characteristics of buildings in extreme cold climates. The assessment included the case simulation in the multiapartment building, which primarily comprises the newly built buildings. Thus, the study can be expanded to the different building stocks available. The energy system retrofitting varies with the type of building and location of the site, thus also extending the techno-economic assessment to the different building stocks. This study assesses the participation in the flexibility market for a range of revenue with appropriate assumptions to simplify the calculations. Thus, participation in the flexibility market can be assessed for the more realistic operational scenario.

Author Contributions

Conceptualization, J.S. and A.H.; methodology, A.S., A.H. and J.S.; original draft preparation, A.S.; writing—review and editing, A.H. and J.S.; supervision, A.H. and J.S.; funding, A.H. and J.S. All authors have read and agreed to the published version of the manuscript.

Funding

The authors acknowledge the financial support from the Academy of Finland’s project “Integration of building flexibility into future energy systems (FlexiB)” grant No. 333364 and the VTT Technical Research Centre of Finland’s self-funded project. The first author also acknowledges EIT InnoEnergy, the KTH Royal Institute of Technology in Sweden, and Aalto University in Finland for the Master studies during which the main research work of this study was performed.

Data Availability Statement

All data is contained within the article.

Conflicts of Interest

The authors declare no conflict of interest.

Appendix A

  • Battery cell specifications
ParameterValueUnit
Rated power7kW
Peak power11kW
Battery efficiency90%
Area0.15m2
Product cost8987EUR
Shipment cost95EUR
  • Inverter
ParameterValueUnit
Maximum power input45kW
Maximum current input43.5Adc
Input voltage680–1000Vdc
Maximum power output29.9kW
Maximum current output43.5Aac
Output voltage (line to neutral)230Vac
Output voltage (line to line)400Vac
Inverter efficiency98%
Area0.12m2
Product cost2190EUR
Shipment cost70EUR
Maximum power input45kW
  • Generators
ParameterType 1Type 2Type 3Type 4Type 5Unit
Rated power2432486480kW
Fuel consumption at full6.79.419.219.223.8L/h
Fuel consumption at (3/4)th 5.97.114.614.617.9L/h
Generator area1.261.972.792.902.90m2
Product cost12,35013,40016,70017,15018,950EUR
Shipment cost155155155155155EUR
Rated power2432486480kW
  • Boilers
ParameterValueUnit
Thermal power70kW
Effective thermal power65.43kW
Electrical power6kW
Efficiency93.47%
Area0.49m2
  • Boiler burner
ParameterValueUnit
Power rating (up to)120kW
Area0.18m2

Appendix B

The following are the assumptions made in the calculation of potential revenue through participation in the flexibility market:
  • During analysis, the battery reserve participates in only one type of flexibility market for the entire year;
  • The time duration of January 2022 to October 2022 has been analyzed to calculate the potential number of bids;
  • The bid is procured daily for the entire year, and procurement of the bid is conducted in the same proportion as it was conducted from January 2022 to October 2022;
  • In the case of full activation, the reserve is activated all the times for which the bid is accepted;
  • In case of no activation, the bid is accepted, and the reserve will provide the flexibility capacity, but the reserve will not be activated;
  • The price for which the bid is accepted is considered constant, which is the average of the actual bidding price in the respective market for the mentioned time duration;
  • Aggregator facilitates the small reserves’ participation in the flexibility market and charges 20% of revenue for the service;
  • The electricity price in the year 2022 varies a lot. Thus, the calculations are performed with the average electricity price for March 2022. Sensitivity analysis was performed with an electricity price of October 2022;
  • No replacement of batteries is considered. Hence, no replacement cost is included in the calculations;
  • The participation of batteries is considered in the complete number of hours;
  • Batteries’ charging and discharging times are considered equal;
  • In the case of participation in the FCR-N market, the batteries are to be maintained at a 50% state of charge at all times due to their symmetric nature. Therefore, only half of the energy reserve can be used.
Table A1. Efficient building configuration energy system’s characteristics for participation in the flexibility market.
Resilience DurationNumber of GeneratorNumber of Battery ModulesNumber of InvertersMax Power Rating Possible for Participation in Energy Markets Total Energy PossibleNumber of Hours PossibleCharging Time with Fast ChargerDaily Available HoursNumber of Daily Participations in Flexibility Market in HoursDaily Energy UsedCost of Daily RechargingTotal Energy Possible for FCR-NNumber of Hours Possible for FCR-NBattery Recharging Time (Fast Charging)Number of Daily Participations in FCR-NDaily Hours of Participation in FCR-N Daily Energy UsedCost of Daily Recharging
kWkWhhourshourshours MWhEURMWhhourshours hoursMWhEUR
1 day23242962.32.312120.579481.11.110110.573
2 days253701602.32.312120.8132801.11.110110.8121
3 days21371824162.32.312122.23442081.11.110112316
4 days274982242.32.312121.21851121.11.110111.1170
5 days21051403202.32.312121.72651601.11.110111.5243
6 days21682245122.32.312122.74242561.11.110112.5389
7 days227143788642.32.312124.57154321.11.110114.2656
Table A2. Baseline building configuration energy system’s characteristics for participation in flexibility market.
Resilience DurationNumber of GeneratorNumber of BoilerNumber of BatteryNumber of InvertersMax Power Rating Possible for Participation in Energy Markets Total Energy Possible Number of Hours Possible Charging Time with Fast Charger Daily Available Hours for FlexibilityNumber of Daily Participations in Flexibility MarketCost of Daily RechargingYearly Recharging CostTotal Energy Possible for FCR-NNumber of Hours Possible for FCR-N Battery Recharging Time (Fast Charging)Number of Daily Praticipations in FCR-NDaily Hours of Participation in FCR-NDaily Energy UsedCost of Daily RechargingYearly Recharging Cost
kWkWhhourshourshours EUR1000×EURkWhhourshours hoursMWhEUR1000×EUR
1 day233242962.32.3121279.529.0481.11.110110.57326.6
2 days2363841922.32.31212159.058.0961.11.110110.914653.3
3 days23841122562.32.31212211.977.41281.11.110111.219470.8
4 days231161543522.32.31212291.4106.41761.11.110111.726797.5
5 days231371824162.32.31212344.4125.72081.11.110112.0316115.3
6 days231792385442.32.31212450.4164.42561.11.110112.5389142.0
7 days2319102666082.32.31212503.4183.73041.11.110112.9461168.3

References

  1. Intergovernmental Panel on Climate Change (IPCC). Impacts of 1.5 °C Global Warming on Natural and Human Systems. In Global Warming of 1.5 °C; Cambridge University Press: Cambridge, UK, 2022; pp. 175–312. [Google Scholar] [CrossRef]
  2. King, C.W.; Zarnikau, J.; Funkhouser, E. Committee Chairs Committee Members Other Contributors the Timeline and Events of the February 2021 Texas Electric Grid Blackouts. 2021. Available online: https://energy.utexas.edu/sites/default/files/UTAustin%20%282021%29%20EventsFebruary2021TexasBlackout%2020210714.pdf (accessed on 14 November 2023).
  3. IEA. IEA—Energy Consumption. Available online: https://www.iea.org/data-and-statistics/data-tools/energy-statistics-data-browser?country=WORLD&fuel=Energy%20consumption&indicator=TFCShareBySector (accessed on 20 October 2022).
  4. White, L.M.; Wright, G.S. Assessing Resiliency and Passive Survivability in Multifamily Buildings. 2020. Available online: www.ibpsa.us (accessed on 8 November 2022).
  5. Homaei, S.; Hamdy, M. Quantification of energy flexibility and survivability of all-electric buildings with cost-effective battery size: Methodology and indexes. Energies 2021, 14, 2787. [Google Scholar] [CrossRef]
  6. Homaei, S.; Hamdy, M. Thermal resilient buildings: How to be quantified? A novel benchmarking framework and labelling metric. Build. Environ. 2021, 201, 108022. [Google Scholar] [CrossRef]
  7. Zhivov, A.M. Parameters for Thermal Energy Systems Resilience. E3S Web Conf. 2021, 246, 08001. [Google Scholar] [CrossRef]
  8. Ozkan, A.; Good, J. Evaluation of the Thermal Resilience of a Community Hub. 2022. Available online: www.ashrae.org (accessed on 27 March 2023).
  9. Kesik, T.; O’brien, W.; Ozkan, A. Toward a standardized framework for thermal resilience modelling and its practical application to futureproofing. Sci. Technol. Built Environ. 2022, 28, 742–756. [Google Scholar] [CrossRef]
  10. Nik, V.M.; Perera, A.T.D.; Chen, D. Towards climate resilient urban energy systems: A review. Natl. Sci. Rev. 2021, 8, nwaa134. [Google Scholar] [CrossRef] [PubMed]
  11. Attia, S.; Levinson, R.; Ndongo, E.; Holzer, P.; Kazanci, O.B.; Homaei, S.; Zhang, C.; Olesen, B.W.; Qi, D.; Hamdy, M.; et al. Resilient cooling of buildings to protect against heat waves and power outages: Key concepts and definition. Energy Build. 2021, 239, 110869. [Google Scholar] [CrossRef]
  12. Wang, R.; Lu, S.; Zhai, X.; Feng, W. The energy performance and passive survivability of high thermal insulation buildings in future climate scenarios. Build. Simul. 2022, 15, 1209–1225. [Google Scholar] [CrossRef]
  13. Roostaie, S.; Nawari, N. The DEMATEL approach for integrating resilience indicators into building sustainability assessment frameworks. Build. Environ. 2022, 207, 108113. [Google Scholar] [CrossRef]
  14. Zhang, C.; Kazanci, O.B.; Levinson, R.; Heiselberg, P.; Olesen, B.W.; Chiesa, G.; Sodagar, B.; Ai, Z.; Selkowitz, S.; Zinzi, M.; et al. Resilient cooling strategies—A critical review and qualitative assessment. Energy Build. 2021, 251, 111312. [Google Scholar] [CrossRef]
  15. Ahmed, T.; Kumar, P.; Mottet, L. Natural ventilation in warm climates: The challenges of thermal comfort, heatwave resilience and indoor air quality. Renew. Sustain. Energy Rev. 2021, 138, 110669. [Google Scholar] [CrossRef]
  16. EXCESS Project. Demo Case—Finland. Available online: https://positive-energy-buildings.eu/demo-cases/finland (accessed on 15 November 2023).
  17. Ministry of the Environment. Unofficial Translation. Legally Binding only in Finnish and Swedish Decree of the Ministry of the Environment on the Energy Performance of New Buildings. 2018. Available online: https://ym.fi/documents/1410903/35099218/1010+2017+YMA_uuden_rakennuksen_energiatehokkuus+EN.pdf/87c893a5-08cf-cc7b-b2a1-90032ebb9368/1010+2017+YMA_uuden_rakennuksen_energiatehokkuus+EN.pdf?t=1680607785707 (accessed on 14 November 2023).
  18. Mallawarachchi, H.; Rameezdeen, R.; De Silva, L.; Rameezedeen, R. Green Buildings, Resilience Ability and the Challenge of Disaster Risk Collaboration of Formal and Informal Sector in MSWM View Project Green Buildings, Resilience Ability and the Challenge of Disaster Risk. 2013. Available online: https://www.researchgate.net/publication/277892802 (accessed on 8 November 2022).
  19. Moazami, A.; Carlucci, S.; Geving, S. Robust and resilient buildings: A framework for defining the protection against climate uncertainty. IOP Conf. Ser. Mater. Sci. Eng. 2019, 609, 072068. [Google Scholar] [CrossRef]
  20. Cer, G.; Rezgui, Y.; Zhao, W. Critical review of existing built environment resilience frameworks: Directions for future research. Int. J. Disaster Risk Reduct. 2017, 25, 173–189. [Google Scholar] [CrossRef]
  21. Sharifi, A.; Yamagata, Y. Principles and criteria for assessing urban energy resilience: A literature review. Renew. Sustain. Energy Rev. 2016, 60, 1654–1677. [Google Scholar] [CrossRef]
  22. ANSI/ASHRAE Standard 55-2004; Thermal Environmental Conditions for Human Occupancy. ASHRAE Standard: Atlanta, GA, USA, 2004.
  23. Alexander, Z. Guide for Resilient Thermal Energy Systems Design in Cold and Arctic Climates; ASHRAE: Atlanta, GA, USA, 2021; pp. 8–20. ISBN 978-1-947192-84-3. [Google Scholar]
  24. Küçükhüseyin, Ö. CO₂ Monitoring and Indoor Air Quality. REHVA Eur. HVAC J. 2021, 58, 54–59. [Google Scholar]
  25. Finlex. Decree of the Ministry of Social Affairs and Health the Health Conditions of the Dwelling and Other Living Area, as well as the Qualifications of External Experts. Available online: https://www.finlex.fi/fi/laki/alkup/2015/20150545#Pidm45237817260688 (accessed on 8 November 2022).
  26. Paatero, J.V.; Lund, P.D. A model for generating household electricity load profiles. Int. J. Energy Res. 2006, 30, 273–290. [Google Scholar] [CrossRef]
  27. Reda, F.; Fatima, Z. Northern European nearly zero energy building concepts for apartment buildings using integrated solar technologies and dynamic occupancy profile: Focus on Finland and other Northern European countries. Appl. Energy 2019, 237, 598–617. [Google Scholar] [CrossRef]
  28. Safe Water Drinking Foundation. Water Consumption. Available online: https://www.safewater.org/fact-sheets-1/2017/1/23/water-consumption (accessed on 8 November 2022).
  29. Wallin, A. Trilateral. Master’s Degree Programme in Energy Technology Simulation Study of a Semi-Deep Ground Source Heat Pump System for a New Residential Building. Master’s Thesis, LUT University, Lappeenranta, Finland, 2020. [Google Scholar]
  30. ur Rehman, H.; Hasan, A.; Reda, F. Challenges in reaching positive energy building level in apartment buildings in the Nordic climate: A techno-economic analysis. Energy Build. 2022, 262, 111991. [Google Scholar] [CrossRef]
  31. Statistics Finland. Work, Wages and Livelihood. Available online: https://www.stat.fi/tup/suoluk/suoluk_palkat_en.html#Index%20of%20wage%20and%20salary%20earnings,%20average%20annual%20changes (accessed on 10 November 2022).
  32. Helsinki Diesel Prices. Available online: https://www.globalpetrolprices.com/Finland/Helsinki/diesel_prices/#:~:text=Helsinki%20Diesel%20prices%2C%20liter.%20Diesel%20prices%3A%20We%20show,the%20world%20for%20this%20period%20is%200.95%20Euro (accessed on 24 October 2022).
  33. Finland Heating Oil Prices. Available online: https://www.globalpetrolprices.com/Finland/heating_oil_prices/ (accessed on 26 October 2022).
  34. Lindberg, R.; Kivimäki, C.; Heinolainen, P. Rakennusosien Kustannuksia 2022; Rakennustieto: Helsinki, Finland, 2022; Available online: https://www.adlibris.com/fi/kirja/rakennusosien-kustannuksia-2022-9789522674005 (accessed on 8 November 2022).
  35. Liang, X. Emerging power quality challenges due to integration of renewable energy sources. In Proceedings of the IEEE Industry Application Society, 52nd Annual Meeting: IAS 2016, Portland, OR, USA, 2–6 October 2016; Institute of Electrical and Electronics Engineers Inc.: Piscataway, NJ, USA, 2016. [Google Scholar] [CrossRef]
  36. Modig, N.; Eriksson, R.; Ruokolainen, P.; Ødegård, J.N.; Weizenegger, S.; Fechtenburg, T.D. Overview of Frequency Control in the Nordic Power System. Available online: https://www.epressi.com/media/userfiles/107305/1648196866/overview-of-frequency-control-in-the-nordic-power-system-1.pdf (accessed on 8 November 2022).
  37. Oyj, F. Appendix 1 to the Market Agreement of Frequency Containment Reserves Unofficial Translation Terms and Conditions for Providers of Frequency Containment Reserves (FCR). Available online: https://www.fingrid.fi/globalassets/dokumentit/fi/sahkomarkkinat/reservit/terms-and-conditions-for-providers-of-frequency-containment-reserves-fcr-as-of-22-may-2023.pdf (accessed on 12 August 2023).
  38. Rakentaja.fi. Building Drawings. Available online: https://www.rakentaja.fi/artikkelit/11940/rakennuspiirustukset.htm (accessed on 27 March 2023).
Figure 1. Assumed power consumption profile for residents during the blackout.
Buildings 13 02936 g001
Figure 2. A 3D model of the building in IDA-ICE software [29].
Buildings 13 02936 g002
Figure 3. Temperature decay profiles of all typical zones in the efficient configuration building.
Buildings 13 02936 g003
Figure 4. Temperature decay profiles of all typical zones in the baseline configuration building.
Buildings 13 02936 g004
Figure 5. Temperature decay profile for apartments with maximum, minimum, and closest to the average time in both configuration buildings (dotted lines represent baseline configuration building zones).
Buildings 13 02936 g005
Figure 6. Power delivered during the simulation period in both configuration buildings (dotted lines represent the baseline configuration building).
Buildings 13 02936 g006
Figure 7. Power required to maintain survivability parameters within both configuration buildings (the dotted line represents the baseline configuration building).
Buildings 13 02936 g007
Figure 8. Peak power and power per m2 needed in both configuration buildings for different resilience durations (circle represents the baseline configuration building).
Buildings 13 02936 g008
Figure 9. Total energy and energy per m2 needed in both building configurations for different resilience durations (circle represents the baseline building configuration).
Buildings 13 02936 g009
Figure 10. Electrical power duration curves for an efficient building configuration.
Buildings 13 02936 g010
Figure 11. Peak power, average power needed, and average generator power for different resilience durations of an efficient configuration building.
Buildings 13 02936 g011
Figure 12. Electrical and heating power duration curves for the baseline configuration building (electrical power is represented by dotted lines).
Buildings 13 02936 g012
Figure 13. Peak power, average power needed, and average generator power for different resilience durations in the baseline configuration building.
Buildings 13 02936 g013
Figure 14. Component distribution in the overall cost of the proposed system ((a): efficient configuration building and (b): baseline configuration building).
Buildings 13 02936 g014
Table 1. Different definitions of resilient buildings.
S. No.DefinitionResilience Characteristics
1Building resilience is the ability of a building to cope with severe weather disruptions and recover in a timely and efficient manner [18]Withstand, mitigation, recoverability, rapidity
2A resilient building is a building that is not only robust but can also fulfill its functional requirements (withstand) during a major disruption. Its performance might even be disrupted, but it must recover to an acceptable level promptly in order to avoid disaster impacts [19]Withstand, absorption, recoverability, rapidity
3A resilient built environment is one that is designed, located, built, operated, and maintained in a way that maximizes the ability of built assets, associated support systems, and the people that reside or work within the built asset to withstand, recover from, and mitigate the impacts of threats [14]Withstand, recoverability, mitigation
4Resilience is the intrinsic ability of the system to proactively react to the disruption (external or internally generated), adapt, and recover to reach a new state of the system to serve the normal functionalities [20] Vulnerability, adaptation, recoverability
5Resilient urban energy systems need to be capable of planning and preparing for, absorbing, recovering from, and adapting to any adverse events that may happen in the future. The complex, dynamic, and adaptive system (for example, cities) would not necessarily return to an equilibrium state [21]Preparation, absorption, recoverability, adaptation
Table 3. Temperature maintained for heating and hot water within the building [29].
S. No. SystemTemperature Range
1Space heating20–35 °C
2Domestic hot water58 °C
Table 4. Building parameters for simulation scenarios [29,30].
Building ParametersBaseline ConfigurationEfficient Configuration
External walls (W/m2k)0.170.15
Internal walls (W/m2k)4.024.02
Internal floors (W/m2k)2.372.37
Roof (W/m2k)0.090.09
Slab toward ground (W/m2k)0.180.16
Glazing (W/m2k)0.700.60
Heating typeDistrictElectric
Heating Coefficient of Performance (COP)0.974.60
Domestic hot water typeDistrictElectric
Domestic hot water COP0.972.50
Ventilation controlConstant air volumeConstant air volume
VHR efficiency [%]6075
Table 5. Additional costs and fuel costs associated with the integration of energy systems.
ParameterValueUnit
VAT24 %
Average monthly salary—skilled labor3311EUR/month [31]
Diesel cost2.14EUR/L [32]
Heating oil cost0.096528EUR/L [33]
Heating installation cost10% of equipment[34]
Occupancy (area of component/total area)70 %
Other electronics cost0.05EUR/W
Battery system operation and maintenance cost5EUR/Wp/a
Table 6. Maximum, minimum, and average time taken by the typical zones to drop the zone temperature to 15 °C.
Time Taken in Hours to Drop the Temperature to 15 °CBaseline Configuration Building (in Hours)Efficient Configuration Building (in Hours)
Minimum time3642
Maximum time131151
Average time7993
Table 7. Resilience matrix for peak power required by different components in the apartment to maintain survivability conditions in both building configurations.
Resilience DurationPeak Power in the Efficient Configuration BuildingPeak Power in the Baseline Configuration Building
Efficient: Equipment Resident, ElectricEfficient: Domestic Hot Water, Electric (Heat Pump) Efficient: HVAC ElectricityEfficient: Space Heating, Electric (Heat Pump)Efficient: Lighting Resident Baseline: Equipment ResidentBaseline: Domestic Hot Water, Thermal (District Heating)Baseline: HVAC Electricity Baseline: Space Heating, Thermal (District Heating) Baseline: Lighting Resident
kWkWkWkWkWkWkWkWkWkW
1 day23.215.353.6219.930.8623.0713.785.36149.980.86
2 days24.015.354.7624.260.8624.0013.785.38149.980.86
3 days24.015.354.9325.680.8624.1413.785.39149.980.86
4 days24.015.354.9527.040.8624.1413.785.40149.980.86
5 days24.015.354.9928.430.8624.1413.785.41150.810.86
6 days24.015.355.0029.770.8624.4613.785.41164.120.86
7 days24.015.355.0231.640.8624.4613.785.42178.820.86
Table 8. Resilience matrix for peak power per m2 required by different components in the apartment to maintain survivability conditions in both configuration buildings.
Resilience DurationPeak Power per m2 in Efficient Configuration BuildingPeak Power per m2 in Baseline Configuration Building
Efficient: Equipment Resident, ElectricEfficient: Domestic Hot Water, Electric (Heat Pump) Efficient: HVAC ElectricityEfficient: Space Heating, Electric (Heat Pump)Efficient: Lighting Resident Baseline: Equipment ResidentBaseline: Domestic Hot Water, Thermal (District Heating)Baseline: HVAC Electricity Baseline: Space Heating, Thermal (District Heating) Baseline: Lighting Resident
W/m2W/m2W/m2W/m2W/m2W/m2W/m2W/m2W/m2W/m2
1 day3.140.720.492.700.123.121.860.7320.290.12
2 days3.250.720.643.280.123.251.860.7320.290.12
3 days3.250.720.673.470.123.271.860.7320.290.12
4 days3.250.720.673.660.123.271.860.7320.290.12
5 days3.250.720.683.850.123.271.860.7320.400.12
6 days3.250.720.684.030.123.311.860.7322.200.12
7 days3.250.720.684.280.123.311.860.7324.190.12
Table 9. Resilience matrix for total energy required by different components in the apartment to maintain survivability conditions in both configuration buildings.
Resilience DurationEnergy in the Efficient Configuration BuildingEnergy in the Baseline Configuration Building
Efficient: Equipment Resident, ElectricEfficient: Domestic Hot Water, Electric (Heat Pump) Efficient: HVAC ElectricityEfficient: Space Heating, Electric (Heat Pump)Efficient: Lighting Resident Baseline: Equipment ResidentBaseline: Domestic Hot Water, Thermal (District Heating)Baseline: HVAC Electricity Baseline: Space Heating, Thermal (District Heating) Baseline: Lighting Resident
MWhMWhMWhMWhMWhMWhMWhMWhMWhMWh
1 day0.240.130.080.430.020.270.330.132.930.02
2 days0.480.260.180.970.040.530.660.265.960.04
3 days0.720.390.301.570.060.800.990.399.110.06
4 days0.950.510.422.200.081.071.320.5212.430.08
5 days1.190.640.542.870.101.331.650.6515.920.10
6 days1.430.770.663.560.121.601.980.7819.640.12
7 days1.670.900.784.280.141.872.320.9123.670.14
Table 10. Resilience matrix for total energy per m2 needed by different components in the apartment to maintain survivability conditions in both building configurations.
Resilience DurationEnergy per m2 in the Efficient Configuration BuildingEnergy per m2 in the Baseline Configuration Building
Efficient: Equipment Resident, ElectricEfficient: Domestic Hot Water, Electric (Heat Pump) Efficient: HVAC ElectricityEfficient: Space Heating, Electric (Heat Pump)Efficient: Lighting Resident Baseline: Equipment ResidentBaseline: Domestic Hot Water, Thermal (District Heating)Baseline: HVAC Electricity Baseline: Space Heating, Thermal (District Heating) Baseline: Lighting Resident
Wh/m2Wh/m2Wh/m2Wh/m2Wh/m2Wh/m2Wh/m2Wh/m2Wh/m2Wh/m2
1 day32.2717.3610.3158.542.7836.1344.7517.48396.482.78
2 days64.6734.7324.39131.805.5572.3089.5034.92806.265.55
3 days96.8552.0940.17212.598.33108.36134.2552.391232.618.33
4 days129.0169.4556.22297.9811.10144.34179.0069.911681.5111.10
5 days161.3786.8172.40387.6313.88180.49223.7587.462153.4513.88
6 days193.82104.1888.62480.9816.66216.77268.50105.032656.5516.66
7 days226.24121.54104.89579.2119.43252.93313.25122.613202.4519.43
Table 11. Peak power distribution among heating and electrical components for both building configurations.
Resilience DurationEfficient Configuration BuildingBaseline Configuration Building
Total PowerGenerator-Rated PowerGenerator Power Battery Power Total PowerHeating Power Required Electrical Power Required
GeneratorBattery
kWkWkWkWkWkWkWkW
1 day 536440131671372010
2 days 596445141731432010
3 days 606445161801492011
4 days628050121871562011
5 days638050141951652010
6 days658050152091782011
7 days678050172231932010
Table 12. Number of components needed in both building configurations for different combinations of the energy system.
Resilience DurationEfficient Configuration BuildingBaseline Configuration Building
System Contains Both Generators and BatteriesIf Only Generator Is Used for Resilience, No BatteryIf Only Battery Is Used for Resilience, No GeneratorSystem Contains All Boilers, Generators, and BatteriesIf Only Boilers and Generators Are Used, No BatteryIf Only Boilers and Batteries Are Used, No Generator
Number of GeneratorsGenerator-Prime-Rated Power (kW)Number of Battery ModulesNumber of InvertersNumber of GeneratorsGenerator-Prime-Rated Power (kW)Number of Battery ModulesNumber of InvertersNumber of GeneratorsGenerator-Prime-Rated Power (kW)Number of BoilersNumber of BatteriesNumber of InvertersNumber of GeneratorsGenerator-Prime-Rated Power (kW)Number of BoilersNumber of Battery ModulesNumber of InvertersNumber of Boilers
1 day2643228032822433224831583
2 days264532806918224363248330153
3 days26413728010827224384248345233
4 days28074 280148372243116248360303
5 days280105280190482243137248374373
6 days280168280232582243168248389453
7 days280271428027669224319102483104523
Table 13. Cost matrix showing overall cost and cost per m2 needed in both configuration buildings for different combinations of energy systems.
Resilience DurationEfficient Configuration BuildingBaseline Configuration Building
System Contains Both Generators and BatteriesOnly Generator System, No BatteryOnly Battery System, No GeneratorSystem Contains Both Generators and BatteriesOnly Boiler and Generator System, No BatteryOnly Boiler and Battery System, No Generator
Overall Cost Cost per m2Overall CostCost per m2Overall Cost Cost per m2Overall Cost Cost per m2Overall CostCost per m2Overall Cost Cost per m2
(1000×EUR)(EUR/m2)(1000×EUR)(EUR/m2)(1000×EUR)(EUR/m2)(1000×EUR)(EUR/m2)(1000×EUR)(EUR/m2)(1000×EUR)(EUR/m2)
1 day152217510.097931071712311815.9743359
2 days206287610.2417092312503412416.78815110
3 days413567710.3626693613044113017.601202163
4 days270377810.4936554943865213618.411584214
5 days349477810.6146936354416014219.221945263
6 days505687910.7457277755197014820.032331315
7 days7901078010.8668119226018115420.842716367
Table 14. Yearly recharging cost and potential revenue from participation in various flexibility markets by the energy systems of both configuration buildings at March 2022 electricity prices in full activation scenario.
Resilience DurationEfficient Configuration BuildingBaseline Configuration Building
Yearly Recharging CostYearly Recharging Cost for FCR-N MarketPotential RevenueYearly Recharging CostYearly Recharging Cost for FCR-N MarketPotential Revenue
Participation in FCR-NParticipation in FCR-DParticipation in aFRRParticipation in FCR-NParticipation in FCR-DParticipation in aFRR
60% of Average Price200% of Average Price60% of Average Price200% of Average Price60% of Average Price200% of Average Price60% of Average Price200% of Average Price60% of Average Price200% of Average Price60% of Average Price200% of Average Price
1000×EUR1000×EUR1000×EUR1000×EUR1000×EUR1000×EUR1000×EUR1000×EUR1000×EUR1000×EUR1000×EUR1000×EUR1000×EUR1000×EUR1000×EUR1000×EUR
1 day29.0 2.37.70.20.84.615.3 26.62.37.70.51.710.535.0
2 days48.4 3.812.80.41.37.725.5 53.24.615.31.03.528.070.0
3 days125.7115.210.033.21.03.319.966.477.470.96.120.41.44.637.393.3
4 days67.762.15.417.90.51.810.735.7106.497.58.428.11.96.451.3128.3
5 days96.788.67.725.50.82.515.351.0125.7115.210.033.22.37.560.7151.7
6 days154.7141.812.340.81.24.124.581.7164.4141.813.043.43.09.879.3198.3
7 days261.1239.320.768.92.16.841.3137.8183.7168.414.648.53.311.088.7221.7
Table 15. Yearly recharging cost and potential revenue from participation in various flexibility markets by the energy systems of both configuration buildings at March 2022 electricity prices in no activation scenario.
Resilience
Duration
Efficient Configuration BuildingBaseline Configuration Building
System CostPotential RevenueSystem CostPotential Revenue
Participation in FCR-NParticipation in FCR-DParticipation in aFRRParticipation in FCR-NParticipation in FCR-DParticipation in aFRR
60% of Average Price200% of Average Price60% of Average Price200% of Average Price60% of Average Price200% of Average Price60% of Average Price200% of Average Price60% of Average Price200% of Average Price60% of Average Price200% of Average Price
1000×EUR1000×EUR1000×EUR1000×EUR1000×EUR1000×EUR1000×EUR1000×EUR1000×EUR1000×EUR1000×EUR1000×EUR1000×EUR1000×EUR
1 day152.22.68.60.20.86.923.0171.02.68.60.20.86.923.0
2 days206.34.314.30.41.411.538.3249.65.117.10.51.713.845.9
3 days413.111.137.11.13.629.999.5304.46.922.90.72.218.461.2
4 days270.06.020.00.61.916.153.6386.19.431.40.93.025.384.2
5 days348.58.628.60.82.823.076.5440.911.137.11.13.629.999.5
6 days504.913.745.71.34.436.7122.5546.514.648.61.44.739.0130.1
7 days790.123.177.22.27.462.0206.7601.216.354.31.65.243.6145.4
Disclaimer/Publisher’s Note: The statements, opinions and data contained in all publications are solely those of the individual author(s) and contributor(s) and not of MDPI and/or the editor(s). MDPI and/or the editor(s) disclaim responsibility for any injury to people or property resulting from any ideas, methods, instructions or products referred to in the content.

