Article

Thermal Performance Analysis of Windows, Based on Argon Gas Percentages between Window Glasses

1
Department of Building Energy Research, Korea Institute of Civil Engineering & Building Technology, 283 Goyangdae-ro, Ilsanseo-gu, Goyang-si 10223, Gyeonggi-do, Republic of Korea
2
Department of Building Research, Korea Institute of Civil Engineering & Building Technology, 283 Goyangdae-ro, Ilsanseo-gu, Goyang-si 10223, Gyeonggi-do, Republic of Korea
*
Author to whom correspondence should be addressed.
Buildings 2023, 13(12), 2935; https://doi.org/10.3390/buildings13122935
Submission received: 22 October 2023 / Revised: 15 November 2023 / Accepted: 21 November 2023 / Published: 24 November 2023
(This article belongs to the Topic Building Energy Efficiency)

Abstract

:
Windows in new buildings in Korea are equipped with double or triple glazing, a low-E coating, and gas injection between the panes of glass, in accordance with the regulations for the reinforced insulation of windows. However, these windows have certain issues, such as thermal transmittance variations and injected gas leakage. In this study, we investigated the current status of double-glazed windows filled with argon gas and analyzed the actual deterioration degree in terms of insulation performance via field experiments and simulations. Accordingly, we manufactured a 26-millimeter low-E double-glazed window test specimen and conducted tests in accordance with the KS F 2278 standard. The test results indicated that the thermal performance decreased by 10.9% when the argon gas filling rate was reduced from 95% to 0%. The simulation results showed that the thermal performance of windows that were insulated using only glazing decreased by 22.6% with the decrease in the argon gas filling rate; the thermal performance of the double-glazed windows also decreased by 13.6%. A comprehensive analysis of the field surveys and simulations predicted a 92% probability that the argon gas filling rate of double-glazed windows would be below 65% by two years after completion, in addition to a ~4.3% decrease in thermal performance.

1. Introduction

Given the increase in greenhouse gas emissions from the building sector [1], the Korean government has set a greenhouse gas emission reduction target of 32.8% and has made considerable efforts to meet this target by strengthening the insulation standards for buildings [2]. Designing buildings in an energy-saving manner is necessary to reduce greenhouse gas emissions from the building sector. An energy-saving building can be designed by strengthening the insulation-related performance of the envelope and by subsequently minimizing energy consumption through the use of high-efficiency facilities [3]. The insulation performance of the envelope can be determined based on the insulation performances of the windows and walls. Windows exhibit greater heat loss than walls, and their insulation performance significantly affects the insulation performance of the building envelope [4]. The heat loss attributed to glazing accounts for a large proportion of energy wastage worldwide [5], and a building with 30% of its envelope being composed of windows can lose up to 60% of its energy [6]. Accordingly, the Korean government strengthened the insulation regulations for windows and applied various insulation-related technologies to comply with these strengthened regulations [7].
Windows in new buildings in Korea are equipped with triple glazing, low-E coatings, and gas injection technology between the panes of glass to comply with the reinforced insulation regulations for windows [8]. Although a low-E coating significantly affects the insulation performance of double-glazed windows compared to when using gas injection, the best thermal performance can be achieved by simultaneously applying a low-E coating and gas injection [9]. Double glazing filled with argon gas (90%) and air (10%) improves the U-value of the center of the glass by more than 5% compared to double glazing filled with 100% air [10]. Filling a cavity with gas reduces heat transmission and affects the thermal conductivity and convection, thereby improving the U-value [11]. Furthermore, the insulation performance can be improved by 15–20% when argon gas is combined with a low-E coating and multi-glazing [12].
However, the thermal transmittance of windows can differ from that measured in the laboratory because of the installation location, installation method, and aging [13]. Gas-injected insulated glass units can suffer from leakage problems, which are attributable to the expansion and contraction of glass caused by temperature differences between the indoor and outdoor environments during winter and summer [9,14]. Thus, it is necessary to analyze the deterioration degree in the insulation performance of gas-filled insulated windows installed in the field; however, the related research is limited [8,9,15].
To address this knowledge gap, in this study, the degree of deterioration in the thermal performance of argon-filled double-glazed windows caused by argon gas leakage was analyzed and examined from various perspectives. In summary, field surveys, insulation performance tests for various argon gas filling rates, and simulations using THERM 7.4 and WINDOW 7.4 were conducted. The research process was as follows:
  • Korean standards related to the thermal performance of building envelopes were examined to assess the thermal performance of windows installed in existing buildings.
  • In the next stage, double-glazed windows installed in existing buildings with similar thermal performances and located in similar climate zones were investigated to identify their argon gas leakage rates.
  • Based on the identified status survey data, the types and air leakage rates of the representative windows were confirmed, and the U-values were examined by conducting a KS F 2278 [16] certified performance test for the air leakage rate of each window specimen.
  • Using simulation programs, the thermal transmittance of double-glazed windows was calculated based on the argon gas leakage rates, and the window U-value deterioration in the field was analyzed.

2. Literature Review

As mentioned in Section 1, the insulation performance of windows is a crucial aspect of buildings; accordingly, the insulation performance of windows has been extensively studied. Double- or triple-glazed windows, low-E coatings, and gas injection between the panes of glass are the most commonly used approaches for enhancing the insulation performance of windows [17]. Figure 1 shows the composition of a gas-filled double-glazed window, consisting of two or more glass panes separated by spacers and a desiccant bonded with edge seals. Gas and air have been introduced between the panes, and a low-E coating has been applied to Surface #2.
Research on insulating window systems has been conducted since the 1970s [18], including studies on reducing the energy consumption of buildings by improving the U-value and solar heat gain coefficient (SHGC) of windows [19,20,21] and achieving an energy consumption reduction in buildings by adjusting the windows ratio [22,23]. Until recently, such studies have been conducted in various climate zones [24]. To enhance the insulation performance of windows, generating a vacuum in the air layer between the glass panes [25,26], applying electrochromic glass [27,28], and injecting silica aerogel into the window system [29,30] have also been considered and researched. Despite ongoing progress and development, it has been confirmed by researchers that the insulation performance of windows deteriorates over time [31,32]. Consequently, studies on developing methods to measure the insulation performance of windows have also been conducted. Representative examples include EN 675 [33] and ISO 9869-1 [34], which are laboratory and field measurement methods, respectively. However, ISO 9869-1 has limitations as it requires a minimum testing period of three days and windows that can be opened. Consequently, the U-value has been analyzed in real time using data measured in the field with a low-cost method [35,36]. Despite many studies being conducted on window insulation performance deterioration, there is limited research on the decline in thermal performance as influenced by the gas leakage rates of gas-injected double-glazed windows [8,9,15]. According to the existing research, the nominal gas-filling rate is 85–90%, and the U-value degrades when the percentage of gas falls below 80% [15]. Therefore, spacer bars, gas filling, and sealants, which determine the initial quality, must be applied using an appropriate manufacturing process that significantly affects the sustainability of the thermal performance of the insulating glass [31,32].
One study in the literature analyzed the filling rates of gas-filled windows and doors from various manufacturers, which were determined to be 66–94% [37]; however, that study was conducted in 1983, limiting its current relevance. Furthermore, some studies measured the leakage and analyzed the changes in the U-values; however, these calculations relied on laboratory values [9].
The EN 1279-3 standard checks the gas loss rate using an artificial aging test. This standard specifies that double-glazed windows meet the specifications when the gas leakage rate is within −5% after 56 repeated cycle tests from −20 to 5 °C and is maintained for 4 weeks [38]. This aging test was conducted under the assumption that the maximum gas loss rate of double-glazed windows installed in a building would be less than 5% over 25 years. Leakage defects caused by gas filling in these windows occur frequently in Korea, and one of the causes of these gas leakage defects is the improper sealing-in of the gas after filling [39]. Another cause is the sealing material, which can cause the filled gas to leak when applied to an IGU without checking the characteristics of the sealing material [8]. Therefore, in Korea, there is a collective standard for gas-filled double-glazed windows, and a certification mark is granted when the gas content is greater than 85%. The filling-gas leakage amount is less than 0.5% per year, and the gas content is maintained within −5% [40]. However, there are still concerns regarding the deterioration of thermal performance caused by argon gas leakage in the field. Studies on changes in the U-value based on argon gas concentrations that are linked to field data are rare.

3. Field Measurements

3.1. Selection of the Target Area

To receive a new building permit in Korea, the U-values of the building envelope components must be lower than the standard U-values dictated by the energy-saving design standards for buildings (hereafter, the building energy code) [12]. This standard has been strengthened in a step-by-step manner since 2009 and was revised in 2018. Figure 2a shows the relevant geographical information, such as South Korea’s latitude, longitude, and neighboring countries. Figure 2b illustrates the four South Korean zones defined by the building energy code, from Region 1, the coldest, to Region 4 (an island), located in the southernmost region. Figure 3 shows the minimum temperature time series for representative cities in the four regions from 2011 to 2020.
Table 1 lists the regional standard U-values of the windows as specified by the energy code, which was revised in 2018. Figure 2 shows that Region 2 has the largest area, is located in the center, and has the largest residential population because of the location of major cities such as Seoul. The field survey area in this study was limited to the windows of buildings in Region 2 that were newly built after 2018. This is because windows installed in buildings in the same region that were newly built after 2018 were likely to have a similar performance.

3.2. Field Investigation

The target scope of this research includes windows installed in new buildings located in Region 2 that were completed after 2018. The filling rates of windows with argon gas were measured. A Sparklike HandheldTM device 3.0 (Sparklike, Helsinki, Finland), which operates based on spectroscopy, was used for the measurements. This device assesses gas concentrations by measuring the light emissions induced in the spatial layer of gas-filled double-glazed windows through a high-pressure spark [42]. Table 2 and Figure 4 summarize the technical specifications of the Sparklike Handheld™ device, as provided by the manufacturer. Windows composed of glass with a thickness of less than 6 mm and a cavity of less than 20 mm can be measured at temperatures between 0 and 35 °C. According to the data, the measurement error was within 1% when the argon gas concentration exceeded 90%; however, it decreased to ~3.7% at the 50% level.
Although a few studies have compared the argon gas filling rate of several windows installed in the same building, the measured values are affected by the environmental characteristics of the various window faces [9,13,14]. Therefore, the argon gas filling rates were measured and analyzed as follows:
  • The average of the values measured on three or more sides was calculated, assuming that there would be environmental differences caused by factors such as the orientation of the window or the surrounding buildings.
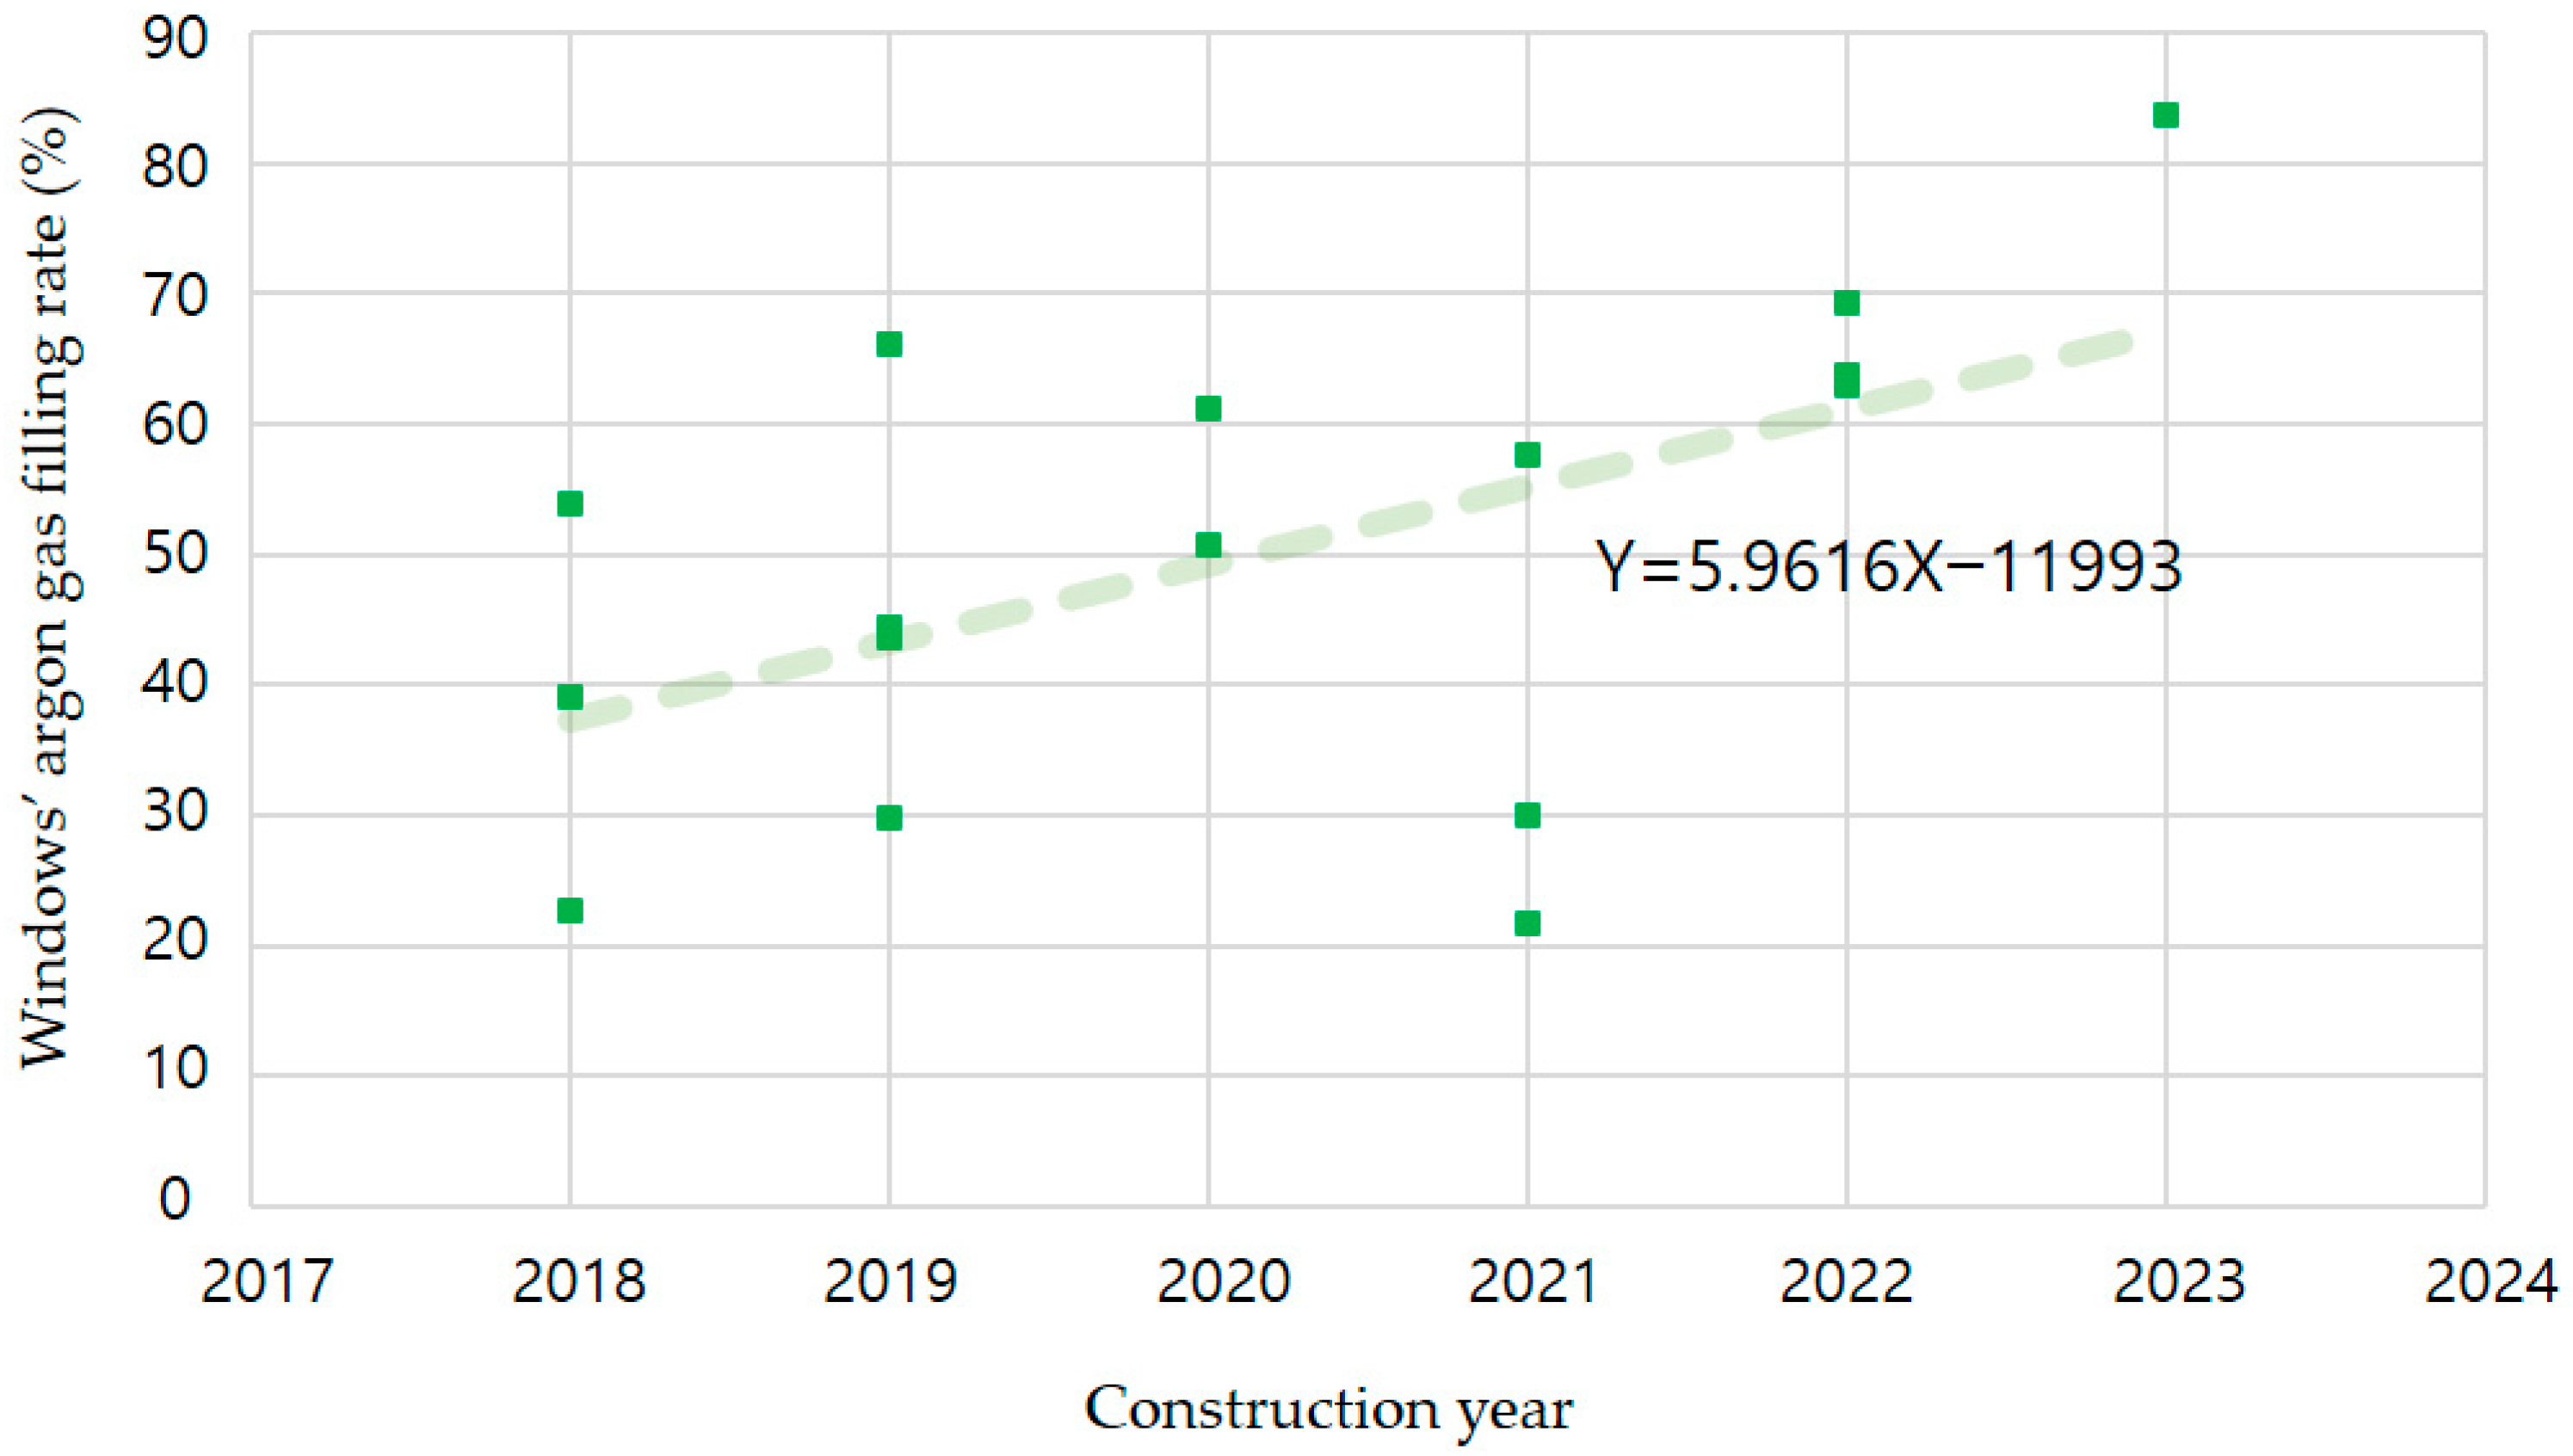
  • The position of the spacer affects the argon gas filling rate; therefore, the gas filling rate is measured at four points located 10 cm away from the edge of each window frame. Furthermore, the average value is calculated. Figure 5 illustrates the listed measurement data from four locations (windows 1, 2, and 3) according to the year of completion. The upper left, upper right, lower right, and lower left points are shown in the order of MP1, MP2, MP3, and MP4. The argon gas filling rate is maintained at a higher value at the top of the window than at the bottom.
Figure 6 shows the equipment used for the measurements and a preview of the field measurements being taken. Table 3 lists the specifications of the measured windows and the argon gas filling rate results. The completion date, measured window size, glass composition, and frame material are explained on the left. Windows 1, 2, and 3 indicate the average values of the argon gas filling rates, obtained by selecting one or more windows of the same size from each of the three sides of the building and by measuring the values at the four corners, as shown in Figure 5. Figure 7 shows the average values for Windows 1, 2, and 3 in chronological order according to the completion year. This indicates that there is some correlation between the completion date and the argon gas filling rate; however, this is not entirely visible.
The average filling rates of the windows installed in buildings completed from 2018 to 2023 were analyzed to be 49.9%; the standard deviation was 19.2–23.6% and the filling rate for each window showed a large difference, from a maximum of 95.4% to a minimum of 0.6%. The more recent the construction year, the higher the argon gas filling rate; however, this is not an absolute trend, and it can be attributed to the argon gas filling rate being influenced by the appropriate manufacturing process and initial quality, as indicated in previous studies. As reported in a previous study [15], the thermal performance of gas-filled windows deteriorates when the argon gas filling rate falls below 80%. In this study, the argon gas filling rate of all investigated windows was confirmed to be less than 80%, except in the case of a building completed in 2023. This indicates that argon gas leakage from the windows is a serious problem.
The field measurement results indicate that the probability the argon gas filling rate of double-glazed windows will be less than 65% two years after completion is approximately 92%; the probability that the argon gas filling rate will be less than 35% is approximately 33%.

4. Certified Laboratory Test

4.1. KS F 2278

KS F 2278 is a Korean standard that defines a test method to measure the heat transmittance of a window set, comprising an evaluation method for measuring the amount of heat supplied to the heating device and the air temperature. The test is conducted in a test rig equipped with a protective thermal box, a cold-air-blowing device to achieve a cold room, and other measuring devices inside a constant- and low-temperature room with an opening of 2 × 2 m, as shown in Figure 8.
The test method involves the following process:
The thermal resistance of the surrounding wall of the hot box is approximately 2.6–4.3 m2∙K/W. A heating device and airflow-stirring device are installed inside the hot box, and the inside of the warm chamber is set to (20 ± 1) °C. The air temperature in the cold chamber is set to (0 ± 1) °C at the temperature measurement locations shown in Figure 9, to maintain a steady state. The temperature measurement locations for calculating the thermal resistance consist of nine points, including measuring the air temperature of the warm chamber at five points, the air temperature of the cold chamber, and the air temperature of the hot box using a thermocouple. The temperature and heat-quantity measurements were conducted three times at 30-minute intervals after reaching normalization. The heat transmission resistance was calculated using this temperature difference and the heat value that passed through the test specimen.
The thermal transmittance resistance (R) (m2∙K/W) is calculated as follows:
R = ( Q H a Q C a ) · A Q H + Q F Q I + R ,
where A, QHa, QCa, QH, QF, and QI represent the opening area for heat transfer (m2), average air temperature in the hot box (K), average air temperature in the cold chamber (K), heat supplied by the heater (W), heat supplied by the air circulation fan (W), and calibrated heat (W), respectively, which reflect the difference between the average values of the hot box and the warm chamber air temperatures.

4.2. Experiment According to KS F 2278

A thermal transmittance test performed according to the KS F 2278 window insulation test requirements was conducted at a testing laboratory located in Region G, to quantitatively determine the degree of change in the insulation performance of multilayer insulated glass windows according to the argon gas filling rate. Based on the high-efficiency energy equipment certification window set data provided by the Korea Energy Agency [43], a 26-millimeter double-layer glass that is commonly applied in the field was used as the target.
The test double-glazed window was manufactured as a fixed window with a size of 2000 × 2000 mm, produced according to KS F 2278, and with a 60-millimeter aluminum frame. Four argon gas filling rates were specified for this test: 95%, 75%, 65%, and 0%, which were selected because of the following reasons.
  • The Sparklike Handheld™ 3.0 device has a problem wherein the measurement error increases when the argon gas filling rate is less than 50% [15]; therefore, measurements with a filling rate of less than 50% were excluded from the test conditions.
  • According to market research, the highest argon gas filling rate is 95%.
  • Excluding the data below 50% from the field measurement results, data with a filling rate of 60–80% accounted for 65% of the total data; therefore, 65% was added to the test conditions.
The argon gas filling rates of the test specimens were set to approximately 1% of the targets: 0%, 65.9%, and 95.7% in the first, second, and third tests, respectively. Figure 10a shows a technical drawing of the test specimen; Figure 10b shows images of the experiments. Figure 11 shows the test results based on the KS F 2278 standard. The test results show that the U-values increased from 1.332 to 1.477 W/m2K along with a decrease from 95% to 0% in the argon gas concentration, deteriorating the thermal performance of the test window. A comparison of the thermal performance of the double-glazed window for each case, based on an argon gas concentration of 95%, indicated that the thermal performance was −0.3% for 75% argon gas, −3.0% for 65%, and −10.9% for 0% argon gas, revealing a thermal performance deterioration.

5. Simulations

The double-glazed window simulations, based on different argon gas filling rates, were conducted under the same conditions as the official test, which uses WINDOW 7.4 and THERM 7.4, as conducted in the Lawrence Berkeley National Laboratory (LBNL). The programs provide a simulation-based window performance evaluation tool as used by the National Fenestration Rating Council, Incorporated (NFRC).
WINDOW 7.4 is a program that can be used to calculate the thermal performance index (thermal transmittance, solar heat gain coefficient, shading coefficient, and visible light transmittance) of windows. WINDOW 7.4 incorporates a library of glass materials produced worldwide and can perform relatively accurate thermal performance simulations. Therefore, it is commonly used in related research because it has numerous features that allow its use.
For a comparative analysis of the test results based on the KS F 2278 standard, the indoor and outdoor temperature conditions of the same standard were entered, and a thermal transmittance analysis was conducted on the double-glazed windows used in the actual experiment. Furthermore, the thermal transmittance rate of double glazing without a window frame was analyzed to verify the results when the effect of the window frame was excluded. The simulation model involves the same frame structure and glass specifications as the actual experimental model (Figure 10). The thermal transmittance rate of the entire window was calculated by simulating the one-dimensional thermal transmittance rate of each frame and glass using THERM/WINDOW 7.4; then, the area proportion of the relevant part to the entire window was calculated. This is based on the thermal transmittance calculation formula presented in ISO 15099 [44]. The one-dimensional thermal transmittance of each frame, calculated from THERM’s 2D heat transfer analysis and glass center thermal transmittance value, was established via WINDOW 7.4:
U t = A g v U g v + A f U f + l ψ ψ A t
where Ut, Agv, Ugv, Af, Uf, lψ, ψ, and At represent the total transmittance of the window (W/m2K), projected vision area (m2), thermal transmittance of the vision area (W/m2K), projected frame area (m2), thermal transmittance of the frame area (W/m2K), length of the vision area perimeter (m), linear thermal transmittance, which accounts for the interaction between the frame and glazing or the interaction between the frame and an opaque panel (W/mK), and the projected window area (m2), respectively.
This system assumes a fixed window comprising a 60-millimeter aluminum frame, which is surrounded by polystyrene foam. Figure 12 illustrates the jamb, head, and sill thermal analysis model images obtained using THERM 7.4.
Table 4 and Table 5 list the physical properties of the window’s structural members applied to the thermal analysis model and the areas, arranged by sector, which are applied in the calculations. The environmental conditions for analysis were set according to KS F 2278. The internal and external temperatures were 20 and 0 °C, respectively.
Figure 13 shows the simulation results of the double-glazed window and the glass window (the window with the frame removed), along with the KS F 2278 test results discussed in the previous section. Compared to the simulation results for the glass alone, those of the double-glazed windows showed a decrease in the insulation performance of 32.6–43.1%, with an average of 36.3%. The better the insulation performance, the greater the deterioration of insulation performance. This detailed simulation showed a value that was approximately 20.5–22.4% higher than the test result; however, when corrected based on an argon gas filling rate of 95%, as shown in Figure 12, it showed an error range of 1.3–2.5%, which is the error range established after correction. These values were found to be reliable. Table 6 lists the increase in thermal transmittance as a percentage, based on the thermal transmittance when the argon gas filling ratio is 95%.
The analysis results can be summarized as follows.
  • The simulation results for each argon gas filling rate, as corrected by the experimental values of the double-glazed window, range from 1.332 W/m2·K for an argon gas filling rate of 95% to 1.513 W/m2·K for an argon gas filling rate of 0%. Furthermore, for 1.513 W/m2·K, the thermal transmittance rate increased by 0.196 W/m2·K per 10% argon gas leakage rate. The insulation performance deteriorated by up to 13.6% compared to the 95% argon gas filling rate, depending on the argon gas filling rate, which ranged from 95% to 0%. This value is slightly higher than the experimental value, which decreased by 10.9%.
  • The simulation results for each argon gas filling rate for the double-glazed window were calculated, ranging from 1.171 W/m2·K for an argon gas filling rate of 95% to 1.436 W/m2·K for an argon gas filling rate of 0%. For the 1.436-W/m2·K simulation result, the thermal transmittance rate increased by 0.260 for a 10% argon gas leakage rate. The thermal performance deteriorated by up to 22.6% compared to that for the 95% scenario, which is dependent on the argon gas filling rate from 95% to 0%. This can be attributed to the frame, which is not affected by the argon gas leakage rate.
According to an existing study [9] examining the case of an office building, when the argon gas filling rate of the windows decreased from 92.7% to 0%, the heating energy consumption of the building was found to increase by 6.3%. For a single-family house, the increase was found to be 8.7%. Based on the field measurement results of this study, there is a 33% probability that the argon gas filling rates would be less than 35% two years after installation. If the lifespan of windows is assumed to be 25 years, the economic losses are likely to be greater. Additionally, issues with the quality of the indoor living environment, such as condensation or mold due to a drop in the surface temperature of the windows, will be perceived as more significant from the residents’ perspectives.

6. Conclusions

Based on the field survey and simulation results within the scope of this study, the probability that the argon gas filling rate of double-glazed windows would be less than 65% two years after completion is approximately 92%. In this case, the insulation loss rate was approximately 4.3%. Furthermore, the performance degradation was predicted. In the same survey, the probability that the argon gas filling rate would be less than 35% was approximately 33%. In this case, a deterioration in insulation performance of ~8.6% was predicted.
The Republic of Korea plans to enforce an energy self-sufficiency rate of 20% or higher for all buildings with a total floor area of 500 m2 or more by 2030, and a 100% energy self-sufficiency rate for all buildings by 2050. Therefore, high-insulation window sets of 0.8–0.9 W/m2·K will be analyzed, tested, and applied to maximize the buildings’ outer shell insulation performance. The thermal transmittance rates of approximately 15,000 sets of windows registered as high-efficiency energy equipment in Korea w analyzed, and the products with a rating of 0.9 W/m2·K or less accounted for ~37.5%.
Among these, only 15.8% of windows were cases in which argon gas was not injected and there was no aluminum frame. Various standards specify that the argon gas leakage rate from windows must be maintained to within approximately 5% for 25 years. The adhesion between the seal and sealant must be increased to prevent filled gas loss, and improvements in the sealing method, such as increasing the compression width, are required. Furthermore, it will be necessary to develop various gas-filling technologies to minimize changes in the argon gas filling rate caused by changes over time.
This study has some limitations. For instance, the field survey was only conducted in Region 2, and the number of buildings surveyed was small. In future work, we plan to increase the number of surveyed buildings. Buildings within the four regions of Korea will be further investigated to study window insulation performance deterioration due to argon gas filling leakage.

Author Contributions

Conceptualization, K.C. and D.C.; methodology, K.C. and D.C.; software, K.C.; validation, K.C.; formal analysis, K.C.; investigation, K.C.; resources, K.C. and D.C.; data curation, K.C.; writing—original draft preparation, K.C.; writing—review and editing, K.C.; visualization, Y.Y.; supervision, K.C.; project administration, B.K.; funding acquisition, B.K. and Y.Y. All authors have read and agreed to the published version of the manuscript.

Funding

This study was conducted under the KICT Research Program (project no. 20230146-001) funded by the Ministry of Science and ICT.

Data Availability Statement

Data supporting the findings of this study are available from the corresponding author upon reasonable request. The data are not publicly available due to privacy.

Conflicts of Interest

The authors declare no conflict of interest.

References

  1. Kallio, J.; Tervonen, J.; Rasanen, P.; Makynen, R.; Koivusaari, J.; Peltola, J. Forecasting office indoor CO2 concentration using machine learning with a one-year dataset. Build. Environ. 2021, 187, 107409. [Google Scholar] [CrossRef]
  2. Jeong, S.G. Technology status of new and renewable energy applied to zero-energy buildings for realization of carbon neutrality. Rev. Arch. Build. Sci. 2023, 67, 17–20. [Google Scholar]
  3. Liu, Q.; Ren, J. Research on the building energy efficiency design strategy of Chinese universities based on green performance analysis. Energy Build. 2020, 224, 110242. [Google Scholar] [CrossRef]
  4. Rezaei, S.; Shannigrahi, S.; Ramakrishna, S. A review of conventional, advanced, and smart glazing technologies and materials for improving indoor environment. Sol. Energy Mater. Sol. Cells 2017, 159, 26–51. [Google Scholar] [CrossRef]
  5. Gustavsen, A. State-of-the-Art Highly Insulating Window Frames—Research and Market Review; SINTEF Project Report 6-2007; SINTEF Building and Infrastructure: Oslo, Norway, 2007. [Google Scholar]
  6. Lee, H.S.; Choi, G.S.; Ahn, H.S.; Kang, J.S. Development of high insulation frame to improve the insulation performance of windows. J. Korean Soc. Living Environ. Syst. 2021, 28, 362–368. [Google Scholar] [CrossRef]
  7. Cho, S. Prospect of high insulated window for zero energy building. Rev. Arch. Build. Sci. 2013, 57, 58–59. [Google Scholar]
  8. Choi, J. A Study on Performance of Argon Gas Filled Insulating Glass by Accelerated Weathering Test. Master’s Thesis, Inha University Press, Incheon, Republic of Korea, 2014. [Google Scholar]
  9. Asphaug, S.K.; Jelle, B.P.; Gullbrekken, L.; Uvsløkk, S. Accelerated ageing and durability of double-glazed sealed insulating window panes and impact on heating demand in buildings. Energy Build. 2016, 116, 395–402. [Google Scholar] [CrossRef]
  10. Lawrence Berkeley National Laboratory (LBNL). Window 7 User Manual. Available online: https://windows.lbl.gov/sites/default/files/software/WINDOW/WINDOW7UserManual.pdf (accessed on 30 August 2023).
  11. Wakili, K.G.; Rädle, W.; Krammer, A.; Uehlinger, A.; Schüler, A.; Stöckli, T. Ug-value and edge heat loss of triple glazed insulating glass units: A comparison between measured and declared values. J. Build. Eng. 2021, 44, 103031. [Google Scholar] [CrossRef]
  12. Ministry of Land, Infrastructure and Transport (MOLIT). Energy-Saving Design Standards for Buildings, MOLIT Notice No. 2023-104. Available online: https://www.law.go.kr (accessed on 30 August 2023).
  13. Garvin, S.L.; Wilson, J. Environmental conditions in window frames with double-glazing units. Constr. Build. Mater. 1998, 12, 289–302. [Google Scholar] [CrossRef]
  14. Wolf, A.T. Design and material selection factors that influence the service-life and utility value of dual-sealed insulating glass units. In Proceedings of the 9th International Conference on Durability of Materials and Components—9DBMC, Paris, France, 17–21 March 2002; pp. 1–106. [Google Scholar]
  15. Nieuwenhuijzen, E.J.; Tettoroo, J.I.A.; Vilet, M.; Melet, E. In situ detection of product age and argon concentration as measure of the re-use potential of insulating glass units in buildings. Glass Struct. Eng. 2023, 8, 211–233. [Google Scholar] [CrossRef]
  16. KS F 2278:2017; Standard Test Method for Thermal Resistance for Windows and Doors. Korean Standards Association: Seoul, Republic of Korea, 2022.
  17. Choi, W.K. High insulation, high airtightness and solar radiation blocking technology for windows. Mag. Korean Sol. Energy Soc. 2016, 14, 17–23. [Google Scholar]
  18. Selkowitz, S.E. Thermal performance of insulating window systems. In Proceedings of the ASHRAE 1979 Annual Meeting, Detroit, MI, USA, 24–28 June 1978. [Google Scholar]
  19. Billow-Hube, H. The effect of glazing type and size on annual heating and cooling demand for Swedish Offices. In Proceedings of the Renewable Energy Technologies in Cold Climates Conference, Montreal, QC, Canada, 4–6 May 1998; pp. 188–193. [Google Scholar]
  20. Zhai, Y.; Wang, Y.; Huang, Y.; Meng, X. A multi-objective optimization methodology for window design considering energy consumption, thermal environment and visual performance. Renew. Energy 2019, 134, 1190–1199. [Google Scholar] [CrossRef]
  21. Heydari, A.; Sadati, S.E.; Gharib, M.R. Effects of different window configurations on energy consumption in building: Optimization and economic analysis. J. Build. Eng. 2021, 35, 102099. [Google Scholar] [CrossRef]
  22. Yang, Q.; Liu, M.; Shu, C.; Mmereki, D.; Hossain, U.; Zhan, X. Impact analysis of window-wall ratio on heating and cooling energy consumption of residential buildings in hot summer and cold winter zone in China. J. Eng. 2015, 2015, 538254. [Google Scholar] [CrossRef]
  23. Troup, L.; Phillips, R.; Eckelman, M.J.; Fannon, D. Effect of window-to-wall ratio on measured energy consumption in US office buildings. Energy Build. 2019, 203, 109434. [Google Scholar] [CrossRef]
  24. Lee, J.W.; Jung, H.J.; Park, J.Y.; Lee, J.B.; Yoon, Y. Optimization of building window system in Asian regions by analyzing solar heat gain and daylighting elements. Renew. Energy 2013, 50, 522–531. [Google Scholar] [CrossRef]
  25. Fang, Y.; Eames, P.C.; Norton, B.; Hyde, T.J. Experimental validation of a numerical model for heat transfer in vacuum glazing. Sol. Energy 2006, 80, 564–577. [Google Scholar] [CrossRef]
  26. Cuce, E.; Cuce, P.M. Vacuum glazing for highly insulating windows: Recent developments and future prospects. Renew. Sustain. Energy Rev. 2016, 54, 1345–1357. [Google Scholar] [CrossRef]
  27. Xie, Z.; Jin, X.; Chen, G.; Xu, J.; Chen, D.; Shen, G. Integrated smart electrochromic windows for energy saving and storage applications. Chem. Commun. 2014, 50, 608–610. [Google Scholar] [CrossRef]
  28. Cannavale, A.; Ayr, U.; Fiorito, F.; Martellotta, F. Smart electrochromic windows to enhance building energy efficiency and visual comfort. Energies 2020, 13, 1449. [Google Scholar] [CrossRef]
  29. Buratti, C.; Moretti, E. Experimental performance evaluation of aerogel glazing systems. Appl. Energy 2012, 97, 430–437. [Google Scholar] [CrossRef]
  30. Buratti, C.; Belloni, E.; Merli, F.; Zinzi, M. Aerogel glazing systems for building applications: A review. Energy Build. 2012, 231, 110587. [Google Scholar] [CrossRef]
  31. Howard, N.P.; Burgess, J.; Lim, C. Comparative Service Life Assessment on Windows; Forest &Wood Products Research & Development Corporation, Australian Government: Melbourne, Australia, 2007. [Google Scholar]
  32. Lingnell, A.W.; Spetz, J. Field correlation of the performance of insulating glass units in buildings—A twenty-five year study. In Proceedings of the Thermal Performance of the Exterior Envelopes of Whole Buildings X International Conference, Clearwater, FL, USA, 1–5 December 2007. [Google Scholar]
  33. EN 675:2011; Glass in Building: Determination of Thermal Transmittance (U Value)—Heat flow Meter Method. European Standard (EU): Geneva, Switzerland, 2011.
  34. ISO 9869-1:2014; Thermal Insulation—Building Elements—In-Situ Measurement of Thermal Resistance and Thermal Transmittance—Part 1: Heat Flow Meter Method. The International Organization for Standard (ISO): Geneva, Switzerland, 2014.
  35. Mobaraki, B.; Pascual, F.J.C.; Garcia, A.M.; Mascaraque, M.A.M.; Vazques, B.F.; Alonso, C. Studying the impacts of test condition and nonoptical positioning of the sensors on the accuracy of the in-situ U-value measurement. Heliyon 2023, 9, e17282. [Google Scholar] [CrossRef] [PubMed]
  36. Mobaraki, B.; Pascual, F.J.C.; Garcia, A.M.; Lozano-Galant, F.; Lozano-Galant, J.A.; Soriano, R.P. In situ U-value measurement of building envelopes through continuous low-cost monitoring. Case Stud. Therm. Eng. 2023, 43, 102778. [Google Scholar] [CrossRef]
  37. Christensen, T. Life Expectancy of Gas Filled Units; Project Report R 00-32; Jydsk Teknologisk Institute: Arhus, Denmark, 1983. [Google Scholar]
  38. BS EN 1279-3:2018; Glass in Building—Insulating Glass Units-Long Term Test Method and Requirements for Gas Leakage Rate and for Gas Concentration Tolerances. British Standards (BSI): London, UK, 2018.
  39. Window Technology. Gas-Injected Insulating Glass Standard’ Should Be Used to Properly Maintain the Insulation Performance of Windows. 2022. Available online: http://www.windownews.co.kr/detail.php?number=3253&thread=11 (accessed on 25 May 2023).
  40. SPS-KFGIA 002-1799:2013; Gas-Injected Insulating Glass. Korea Plate Glass Window Association (KPGWA): Seoul, Republic of Korea, 2013.
  41. The National Atlas of Korea. Available online: http://nationalatlas.ngii.go.kr/us/index.php (accessed on 10 September 2023).
  42. Sparklike. Instruction Manual Sparklike Laser Handheld 3.0. Available online: https://sparklike.com/en/product/sparklike-handheld/ (accessed on 4 May 2023).
  43. Korea Energy Agency. Energy Efficiency Rating Certification of Windows. Available online: https://eep.energy.or.kr/certification/certi_list_144.aspx (accessed on 30 May 2023).
  44. ISO 15099:2003; Thermal Performance of Windows, Doors and Shading Devices—Detailed Calculations. The International Organization for Standard (ISO): Geneva, Switzerland, 2003.
Figure 1. Gas-filled insulating glass unit [10].
Buildings 13 02935 g001
Figure 2. Geographical location and zone categorization of South Korea. (a) Geographical location [41], (b) Regional division according to the building energy code.
Buildings 13 02935 g002
Figure 3. Annual minimum temperatures in the representative cities of the four regions from 2011 to 2020.
Buildings 13 02935 g003
Figure 4. Standard deviation limits of the Sparklike Handheld device, shown according to the window’s argon filling rate [42].
Buildings 13 02935 g004
Figure 5. Measurement data from the four window locations. (a) Measurement technique; (b) Window 1; (c) Window 2; (d) Window 3. Measurement point (MP); window (W).
Buildings 13 02935 g005aBuildings 13 02935 g005b
Figure 6. (a) Measurement device and (b) field measurement preview.
Buildings 13 02935 g006
Figure 7. Relationship between the window argon gas filling rate and the completion date.
Buildings 13 02935 g007
Figure 8. KS F 2278 test rig diagram. Letters A–J indicate the warm chamber, hot box, cold chamber, cold air discharge, heater, baffle plate, air circulation fan, test specimen, test specimen frame, and partition wall, respectively. Numbers 1–6 indicate the standard calibrator, temperature-measuring instrument, power meter for the heater, power meter for the air-circulation fan, power controller, and power stabilizer, respectively.
Buildings 13 02935 g008
Figure 9. Diagram of the temperature measurement points. * ~100 mm. ** ~200 mm.
Buildings 13 02935 g009
Figure 10. Window specimen for the KS F 2278 test: (a) a specimen of a technical drawing; (b) images of the window specimen and test.
Buildings 13 02935 g010
Figure 11. The KS F 2278 test results according to the argon gas filling rate.
Buildings 13 02935 g011
Figure 12. Thermal analysis model image via THERM 7.8: (a) jamb, head, and sill; (b) window structure.
Buildings 13 02935 g012
Figure 13. Thermal transmittance of the windows and glass, shown according to the argon concentration.
Buildings 13 02935 g013
Table 1. U-value standards for windows according to region [12].
Region 1
(W/m2K)
Region 2
(W/m2K)
Region 3
(W/m2K)
Region 4
(W/m2K)
When exposed directly to outdoor airResidential0.91.01.21.6
Non-residential1.31.51.82.2
When exposed indirectly to outdoor airResidential1.31.51.72.0
Non-residential1.61.92.21.8
Table 2. Technical specifications of the Sparklike Handheld™ 3.0 device.
Technical Capabilities
Min/max glass thickness2–6 mm
Min/max cavity dimension6–20 mm
Operating conditions0–35 °C
Humidity10–90% RH
Table 3. Argon gas filling rates and window specifications for the windows measured on site.
Building/Construction YearWindow Size (mm)Glass Structure (mm) (1)Frame
Material
Window 1
Ar (%)
Window 2
Ar (%)
Window 3
Ar (%)
2018a1000 × 15006 + 12a + 6AL (2)63.054.549.8
2018b2000 × 30006 + 12a + 6AL35.441.052.4
2018c1500 × 25006 + 12a + 6AL3.636.726.0
2019a1300 × 25006 + 14a + 6AL74.069.653.8
2019b1000 × 27006 + 12a + 6AL48.145.538.3
2019c1200 × 27006 + 14a + 6AL65.431.342.1
2019d1700 × 25006 + 12a + 6AL23.043.717.7
2020a1700 × 25006 + 12a + 6AL24.366.761.0
2020b2400 × 23006 + 16a + 6PVC62.261.763.0
2021a2500 × 50006 + 14a + 6AL61.449.270.3
2021b1500 × 25006 + 14a + 6AL27.024.020.3
2021c1200 × 15005 + 16a + 5AL72.64.528.4
2022a2300 × 24006 + 14a + 6PVC59.562.471.5
2022b1300 × 24006 + 16a + 6AL71.576.656.4
2022c1700 × 23006 + 16a + 6AL73.462.264.0
2023a1700 × 23006 + 16a + 6PVC80.884.781.4
(1) Glass thickness + air thickness + glass thickness. (2) Aluminum frame.
Table 4. Physical properties applied to the thermal analysis model.
NameConductivity (W/m·K)Emissivity
Aluminum1600.9
Spacer0.160.9
Polyamide 0.250.9
Polystyrene foam0.160.9
Table 5. Areas by sector.
Head (1)Sill (1)Jamb (1)
Frame area0.13310.13310.2663
Edge area0.11020.110200.2204
Glazing area3.0267
(1) All values are presented in m2.
Table 6. U-values according to the argon gas filling rate for unmounted double-layer glass and double-layer glass windows.
Argon Filling Rates Glass SimulationU-Value Increase (%) (1)Window Simulation (2)U-Value Increase (%) (1)
0%1.43622.61.51313.6
15%1.39419.11.48511.5
25%1.36716.71.46610.1
35%1.33914.31.4478.7
45%1.36716.71.4287.2
55%1.31112.01.4095.8
65%1.2839.61.3904.4
75%1.2557.21.3702.9
85%1.2274.81.3511.4
95%1.171-1.332-
(1) Increase based on the thermal transmittance of the 95% argon scenario. (2) Simulation values for the window.
Disclaimer/Publisher’s Note: The statements, opinions and data contained in all publications are solely those of the individual author(s) and contributor(s) and not of MDPI and/or the editor(s). MDPI and/or the editor(s) disclaim responsibility for any injury to people or property resulting from any ideas, methods, instructions or products referred to in the content.

