

Experimental and Numerical Study on the Flexural Behaviors of Unbonded Prestressed I-Shaped Steel Encased in Ultra-High-Performance Concrete Beams

Abstract
:1. Introduction
2. Experimental Program
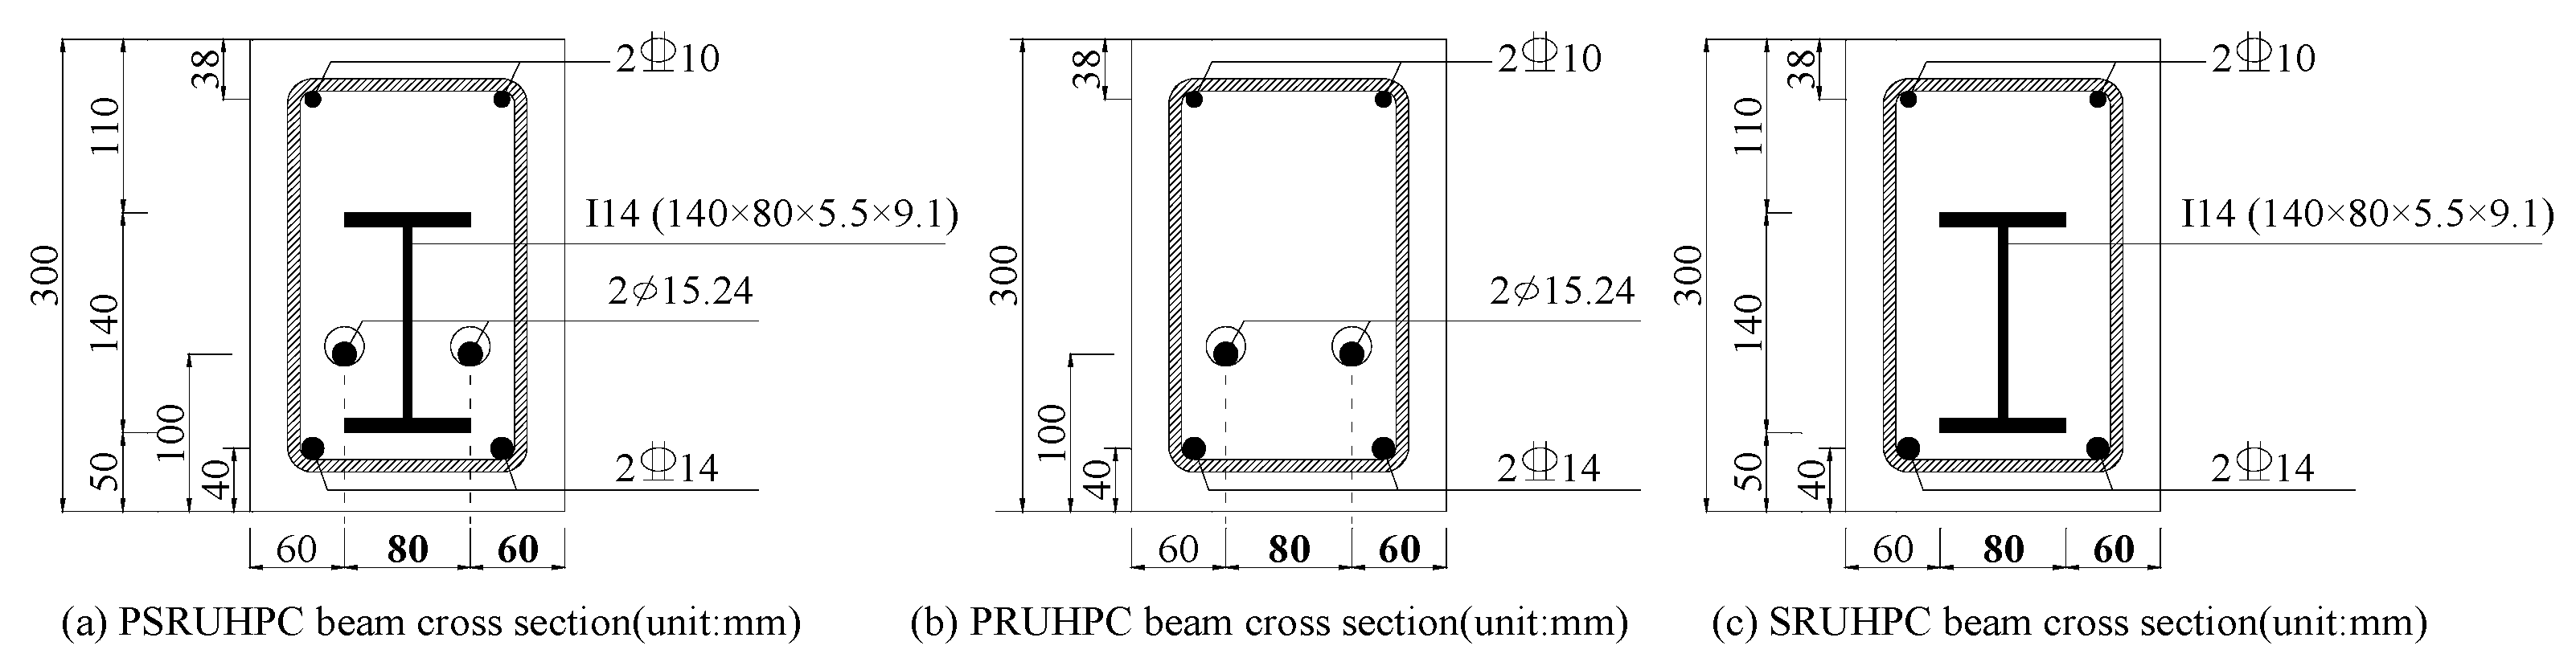
2.1. Specimen Design
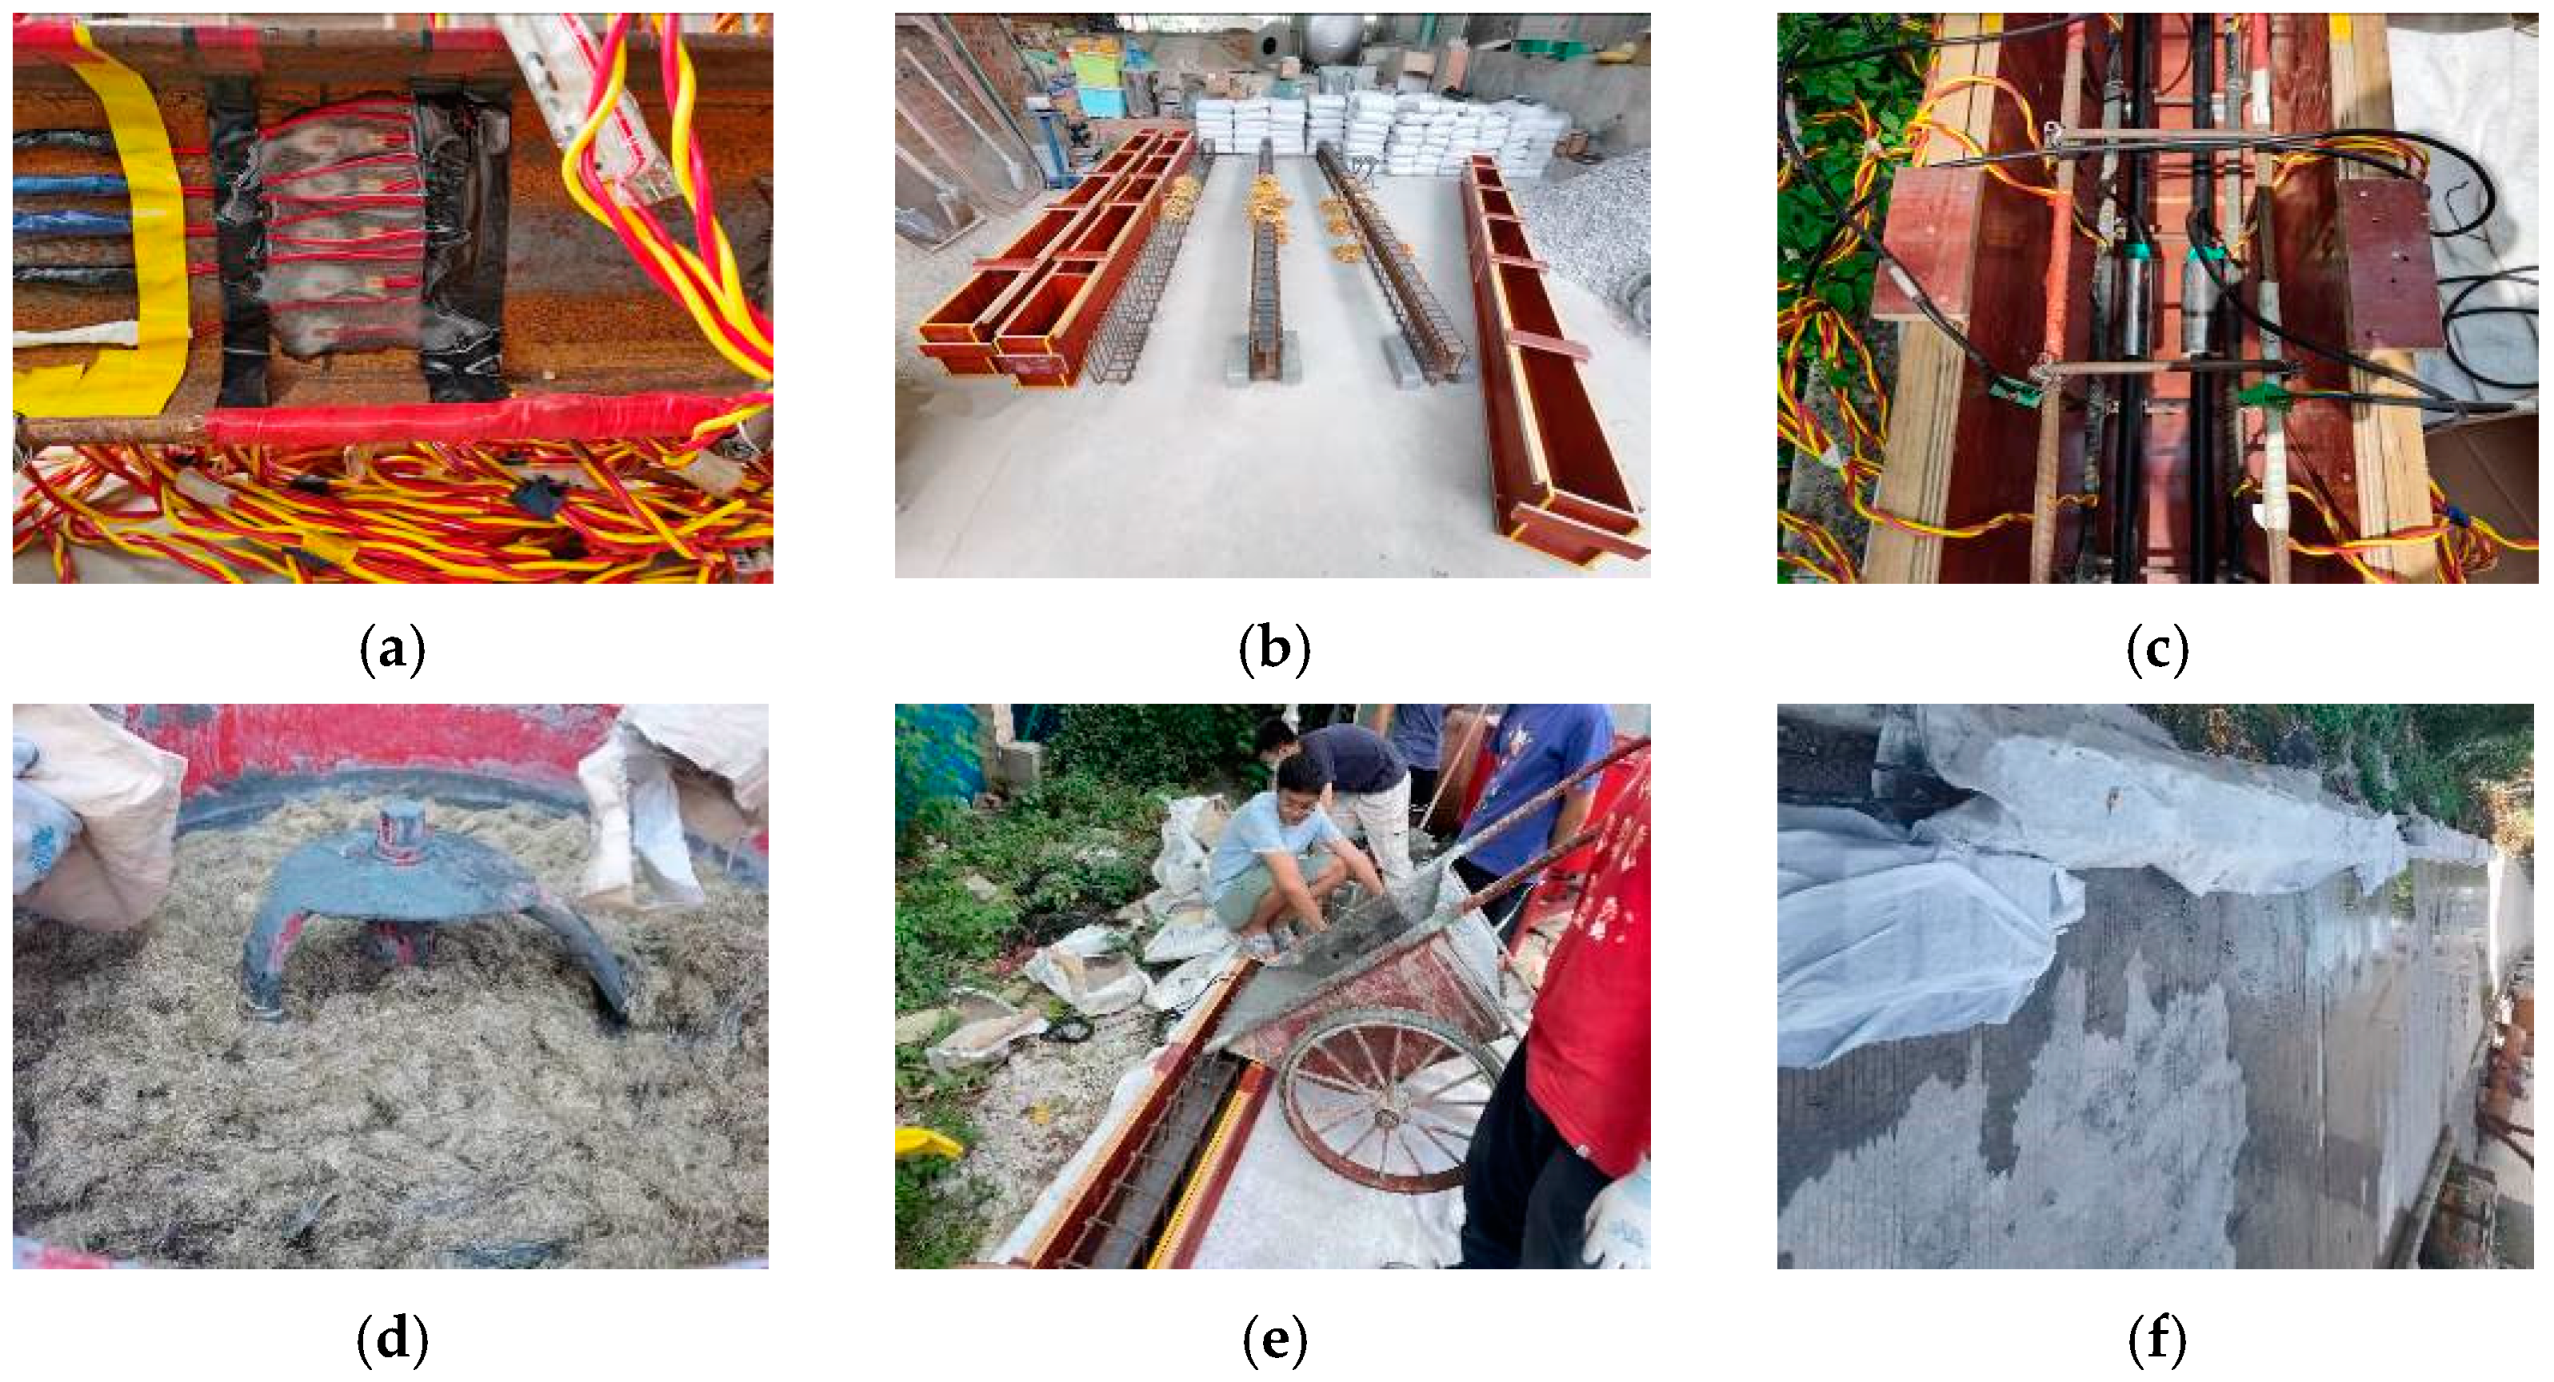
2.2. Preparation and Maintenance of Specimens
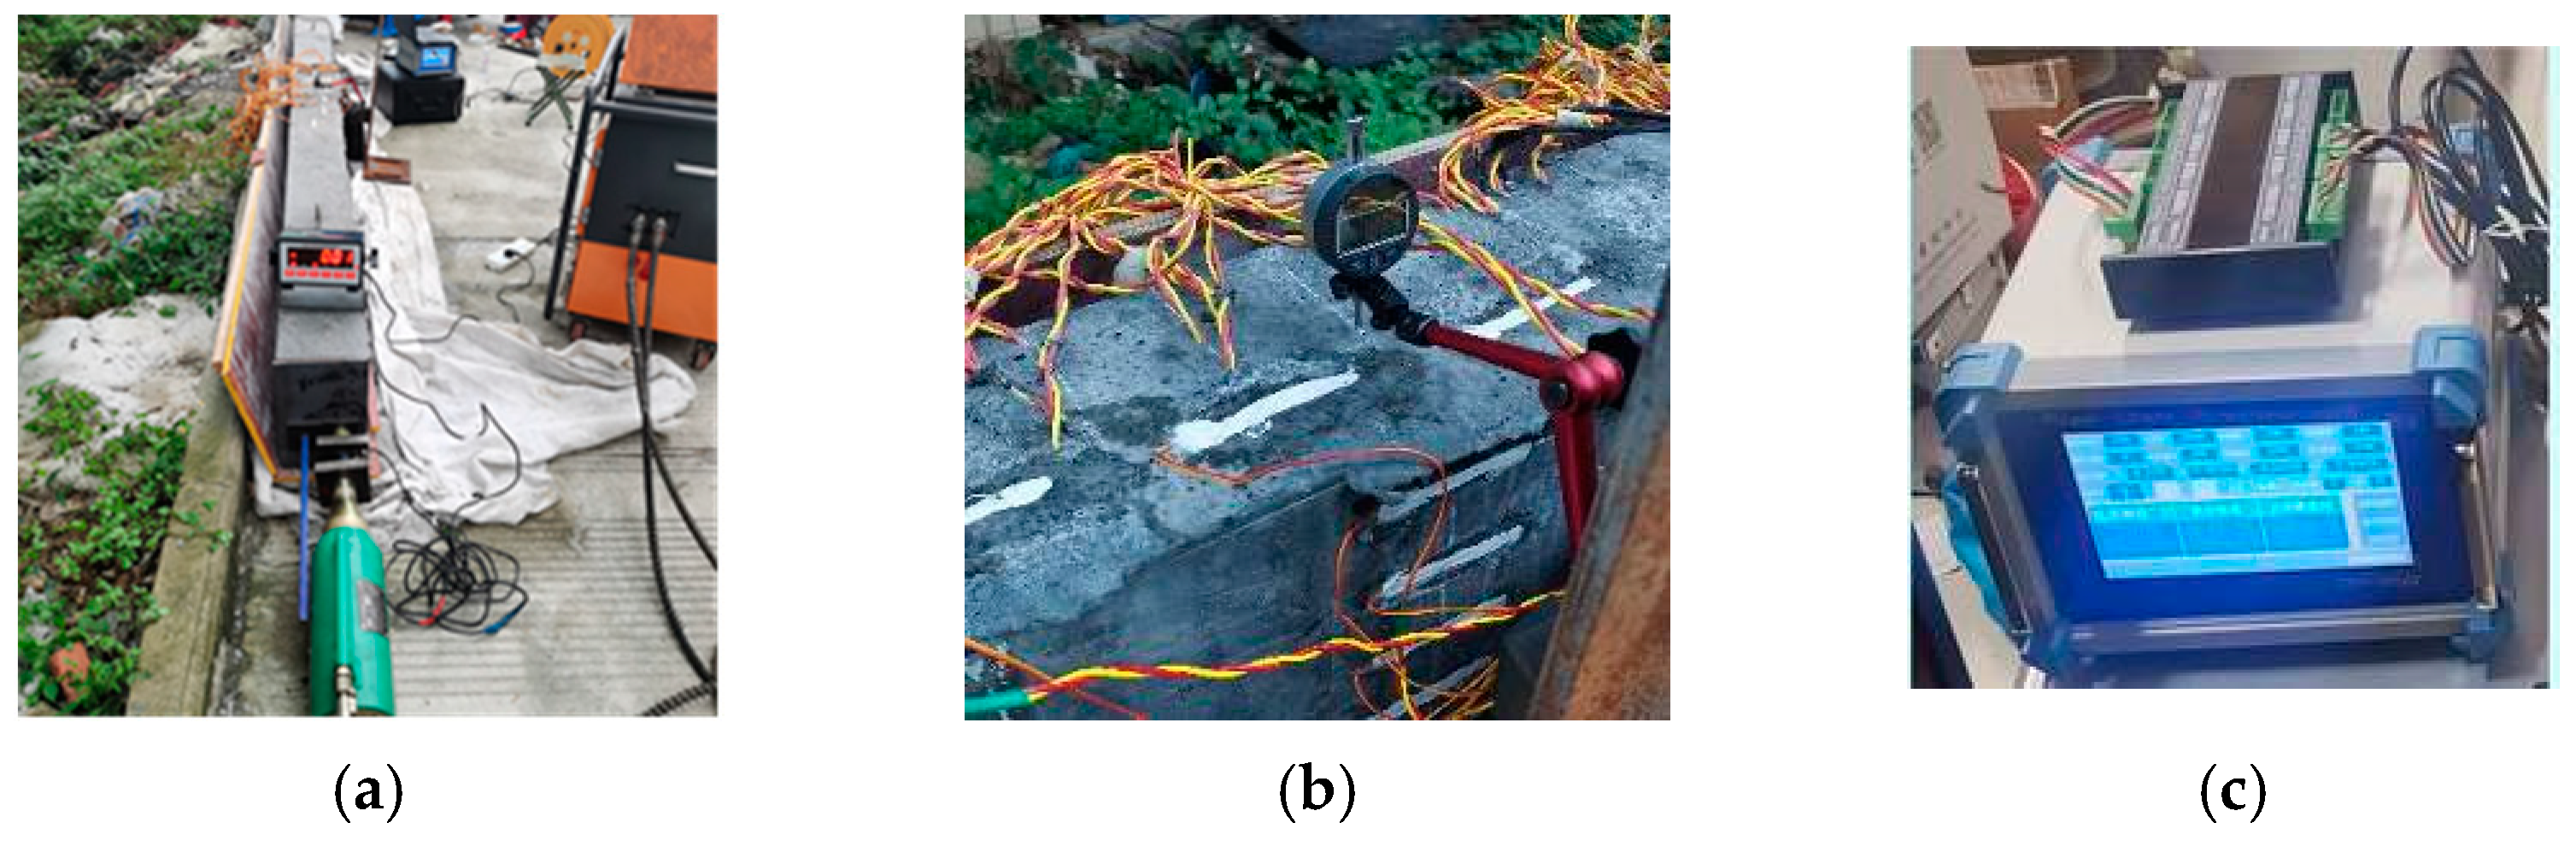
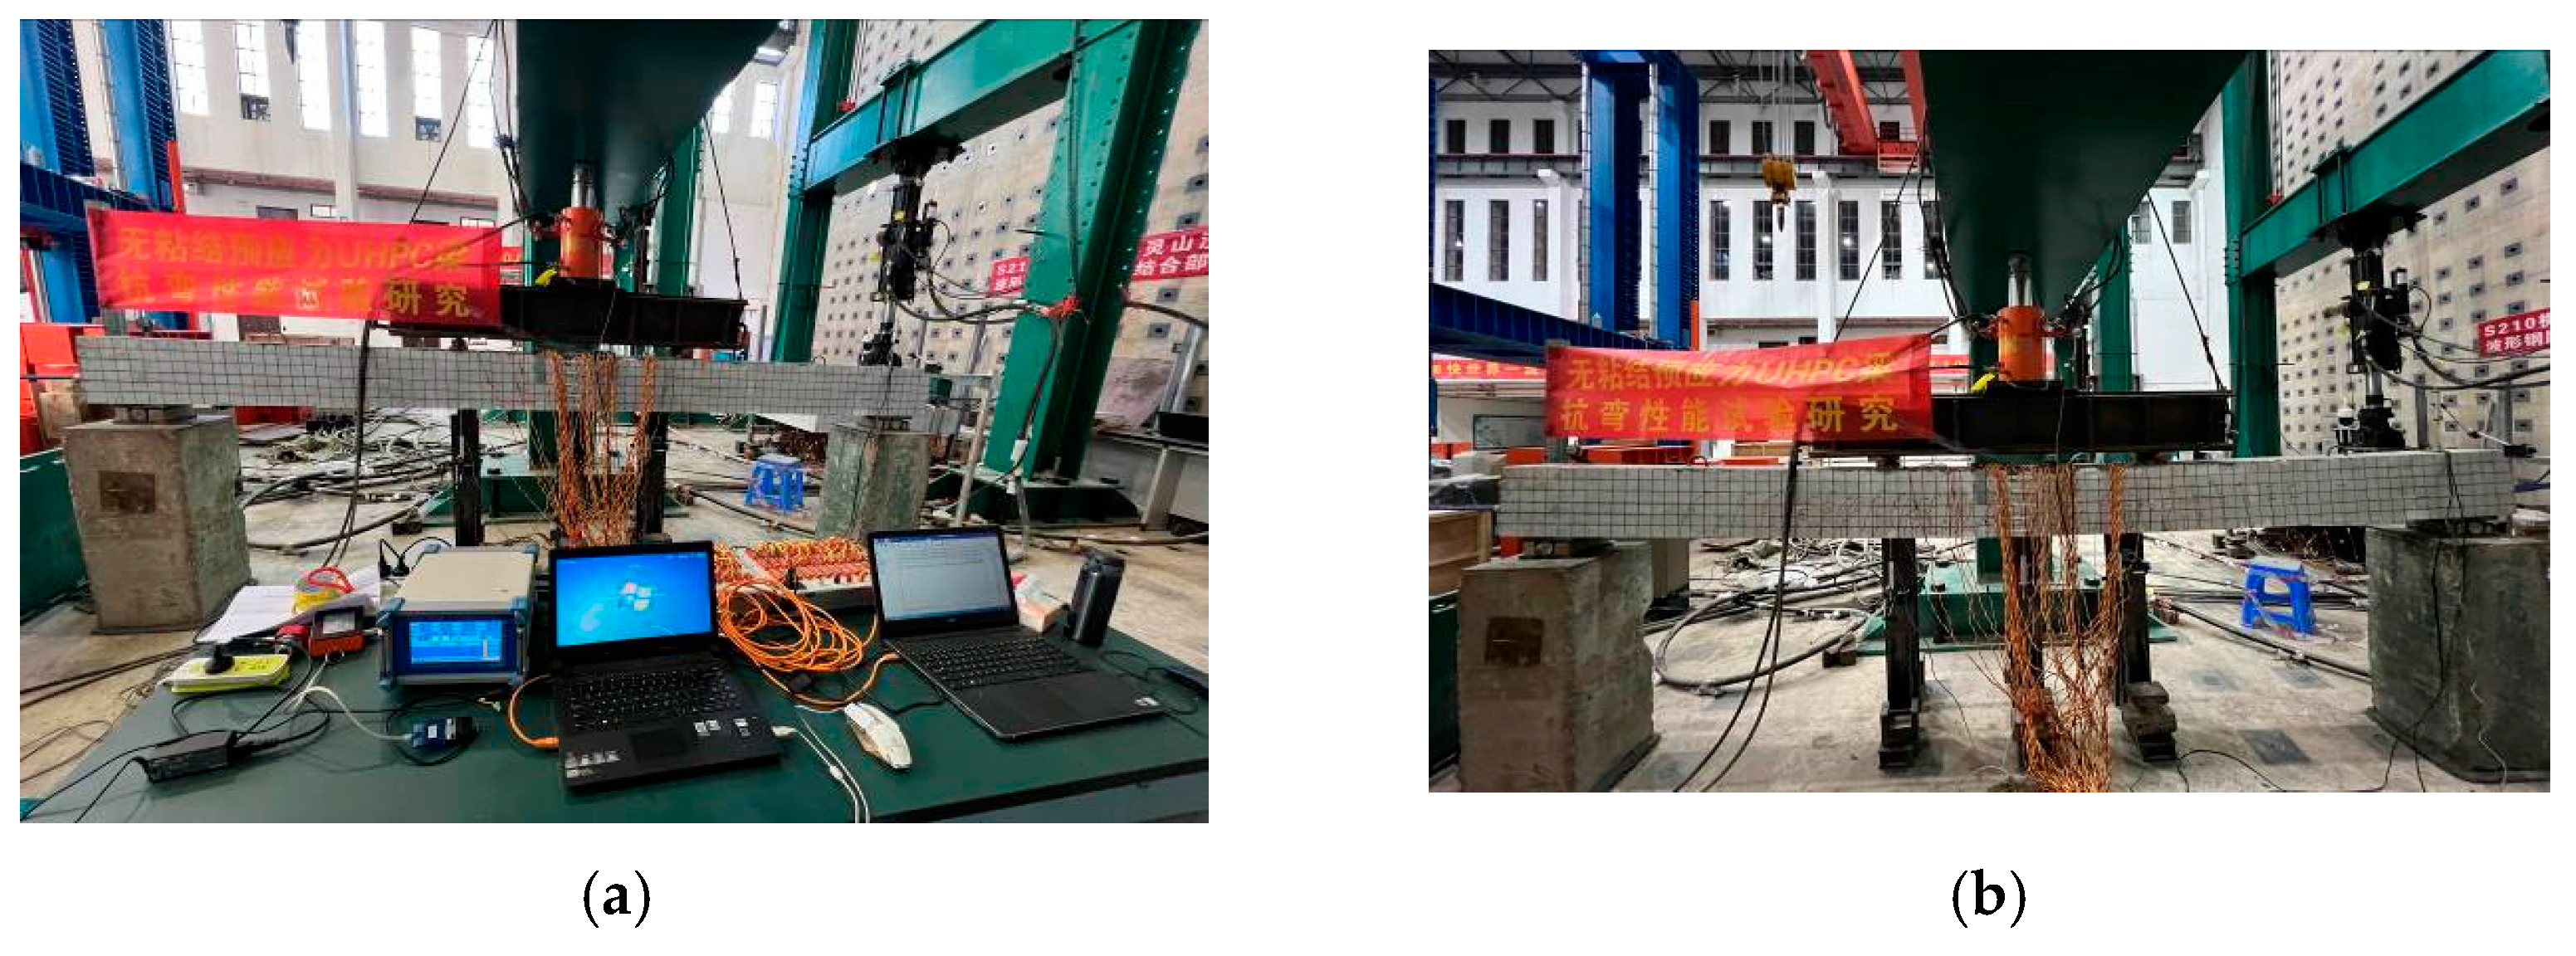
2.3. Loading Scheme and Test Content
3. Test Results
3.1. UHPC Material Properties
3.2. Test Process and Phenomenon
3.2.1. Loading the Destruction Process
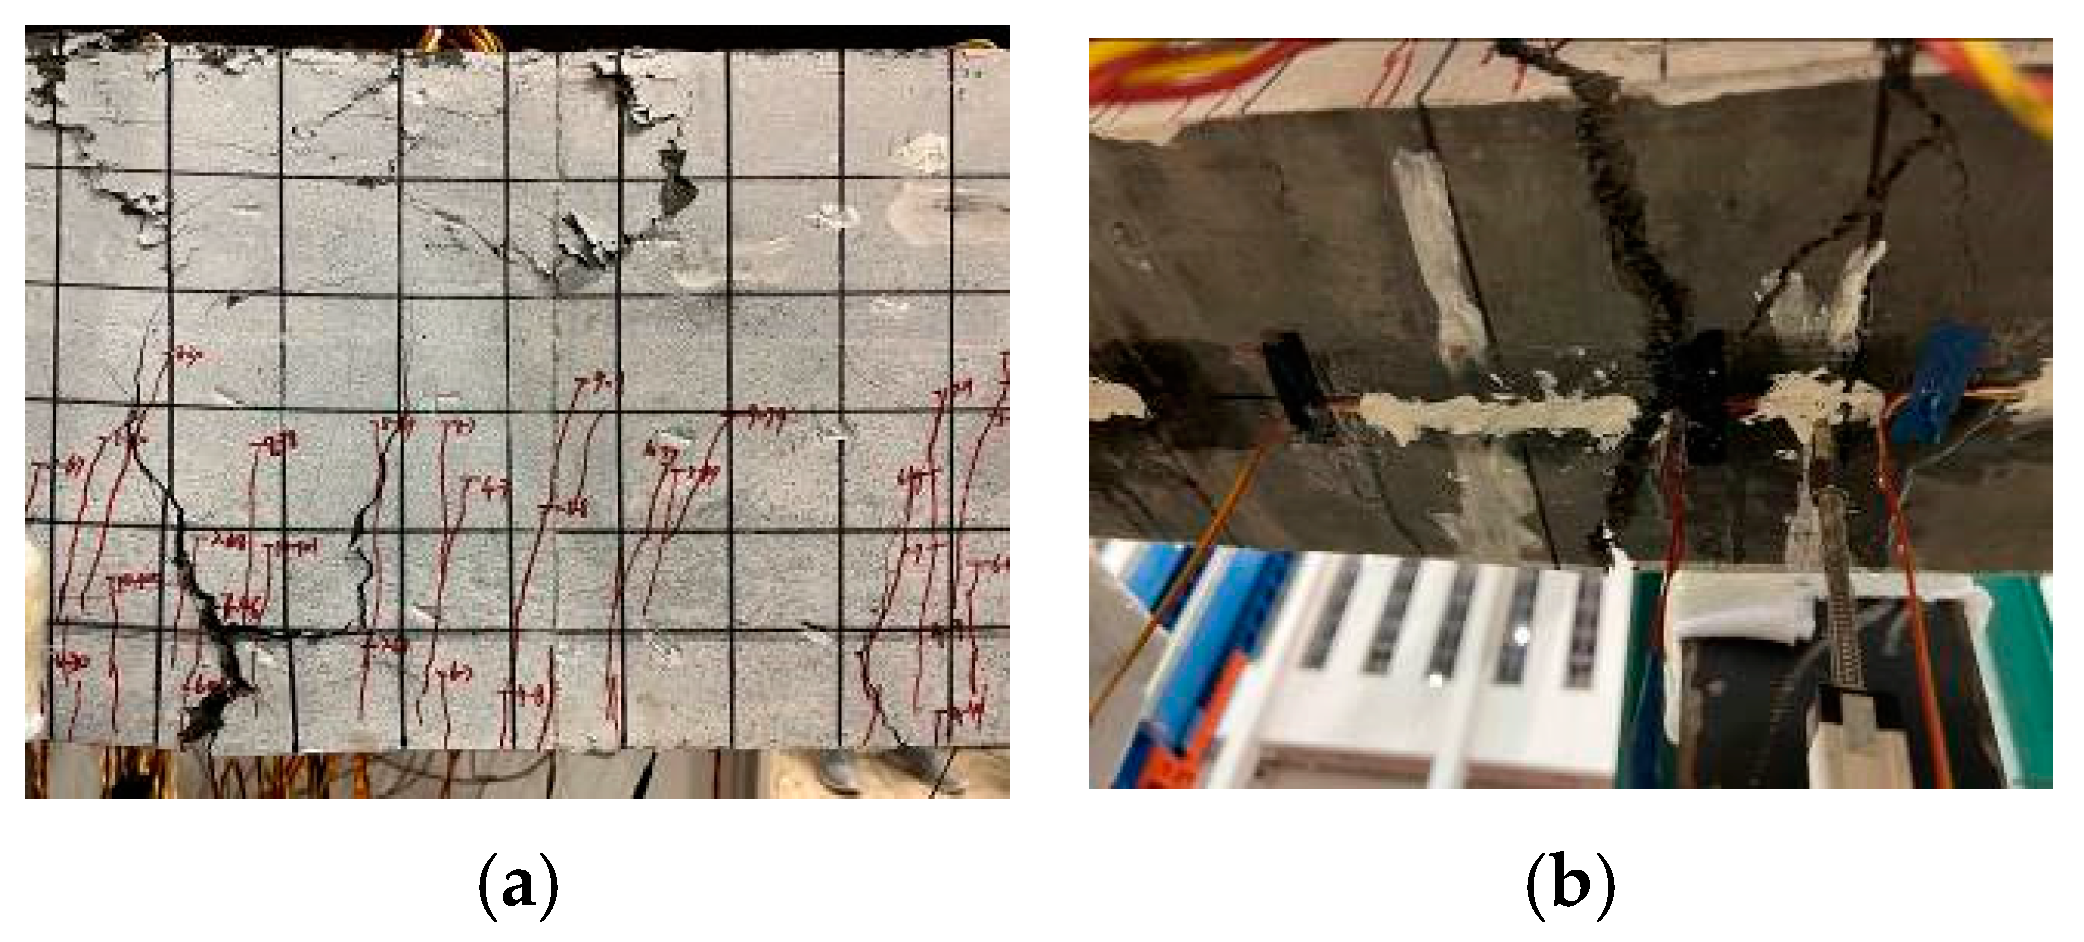
3.2.2. Damage and Fracture Distribution
3.3. Analysis of Test Results
3.3.1. Load–Deflection Analysis
3.3.2. Strain Analysis of Midspan Section
3.3.3. Crack Analysis
3.3.4. Analysis of Flexural Ductility
4. Nonlinear Finite Element Simulation Analysis
4.1. Material Properties
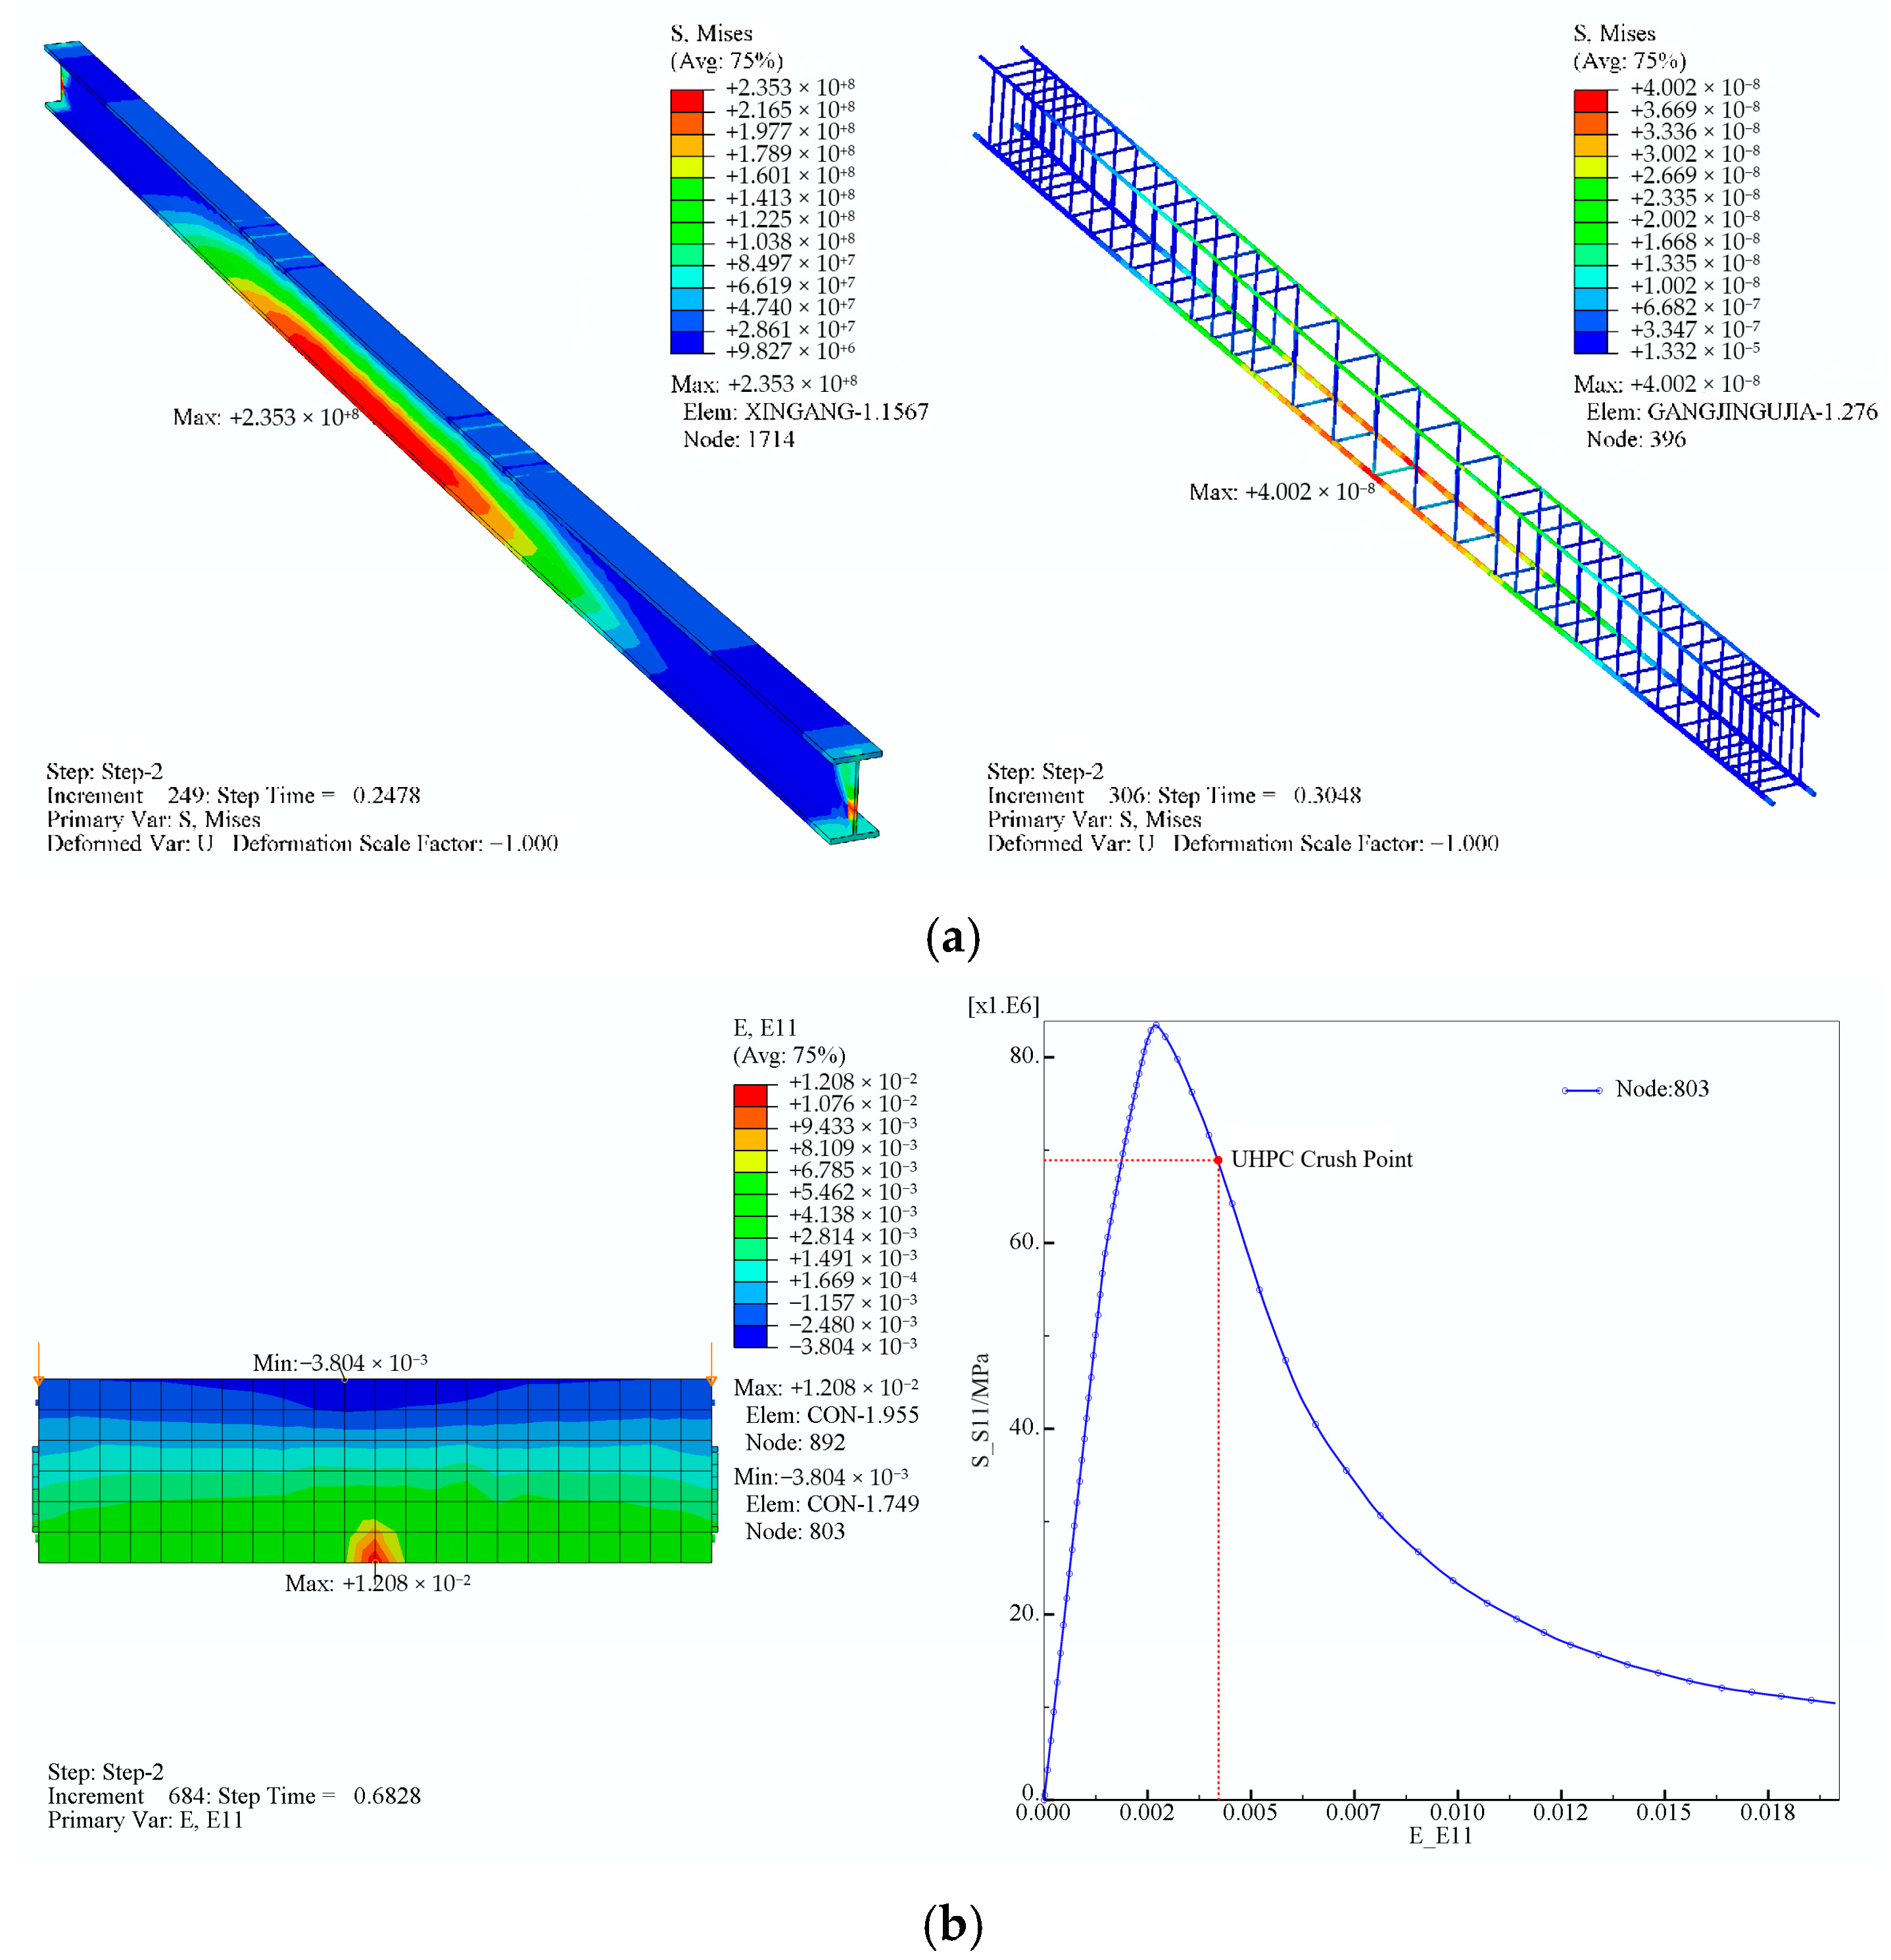
4.2. Establishment of Finite Element Model
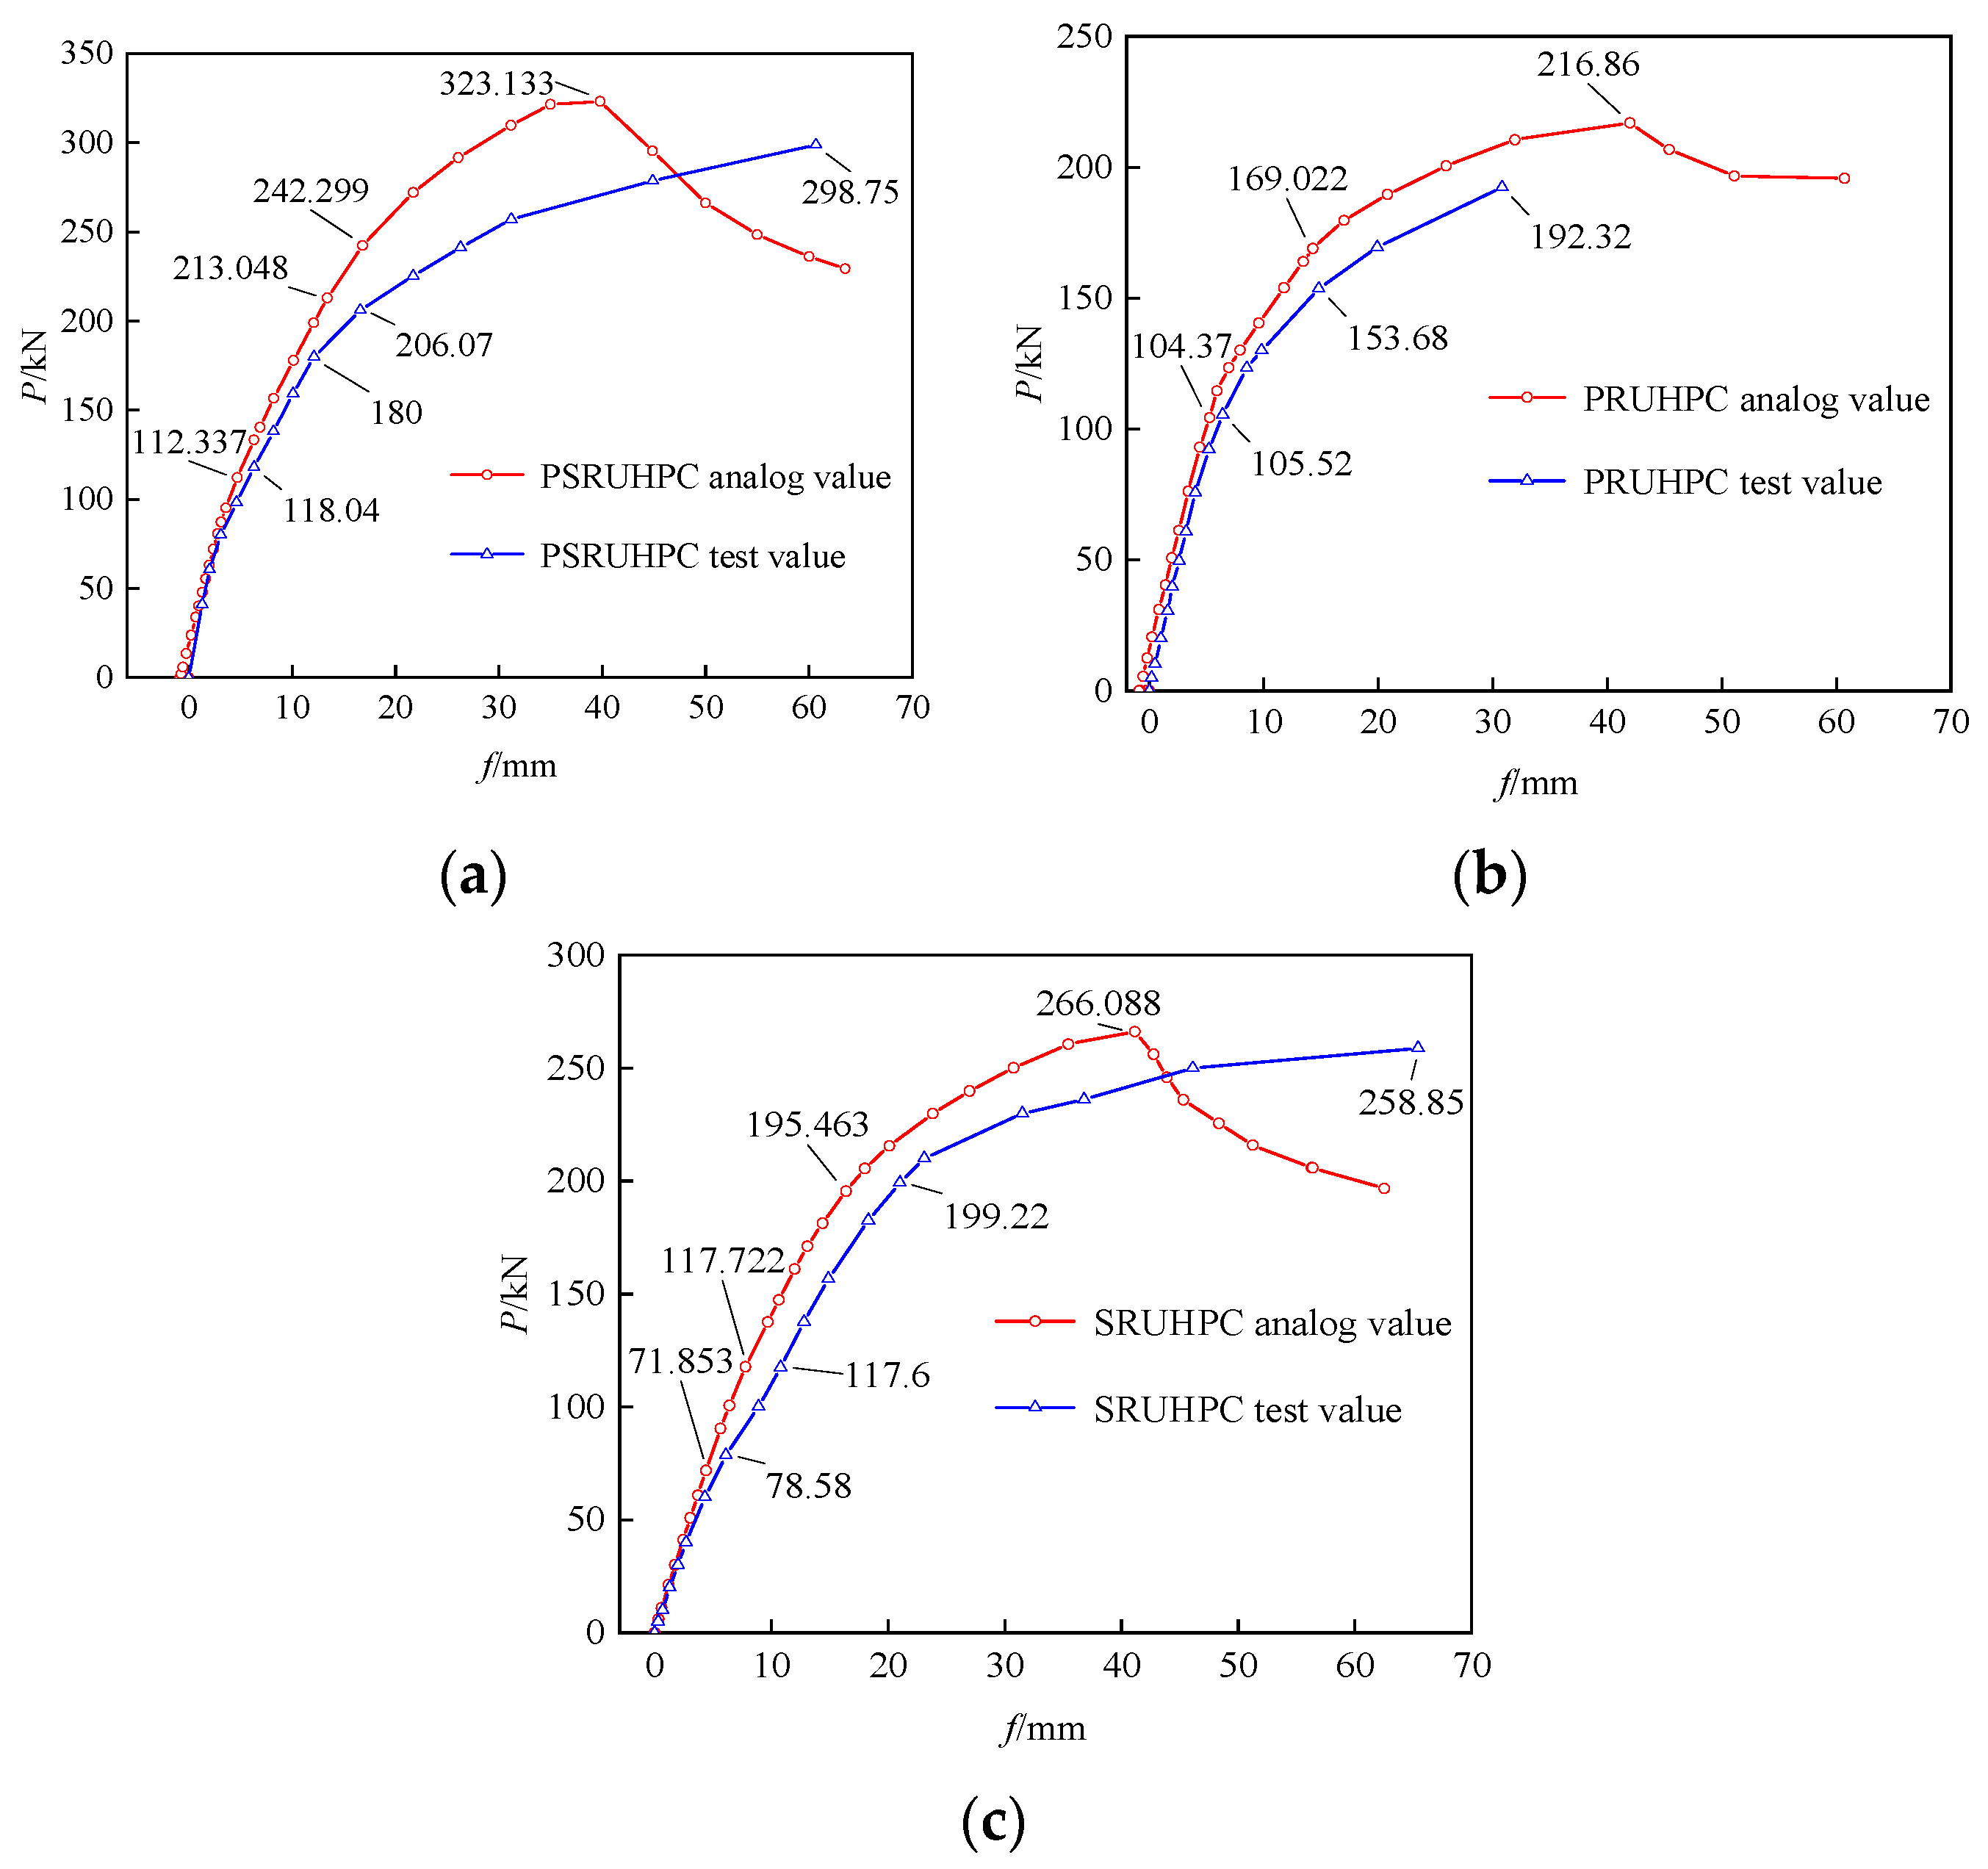
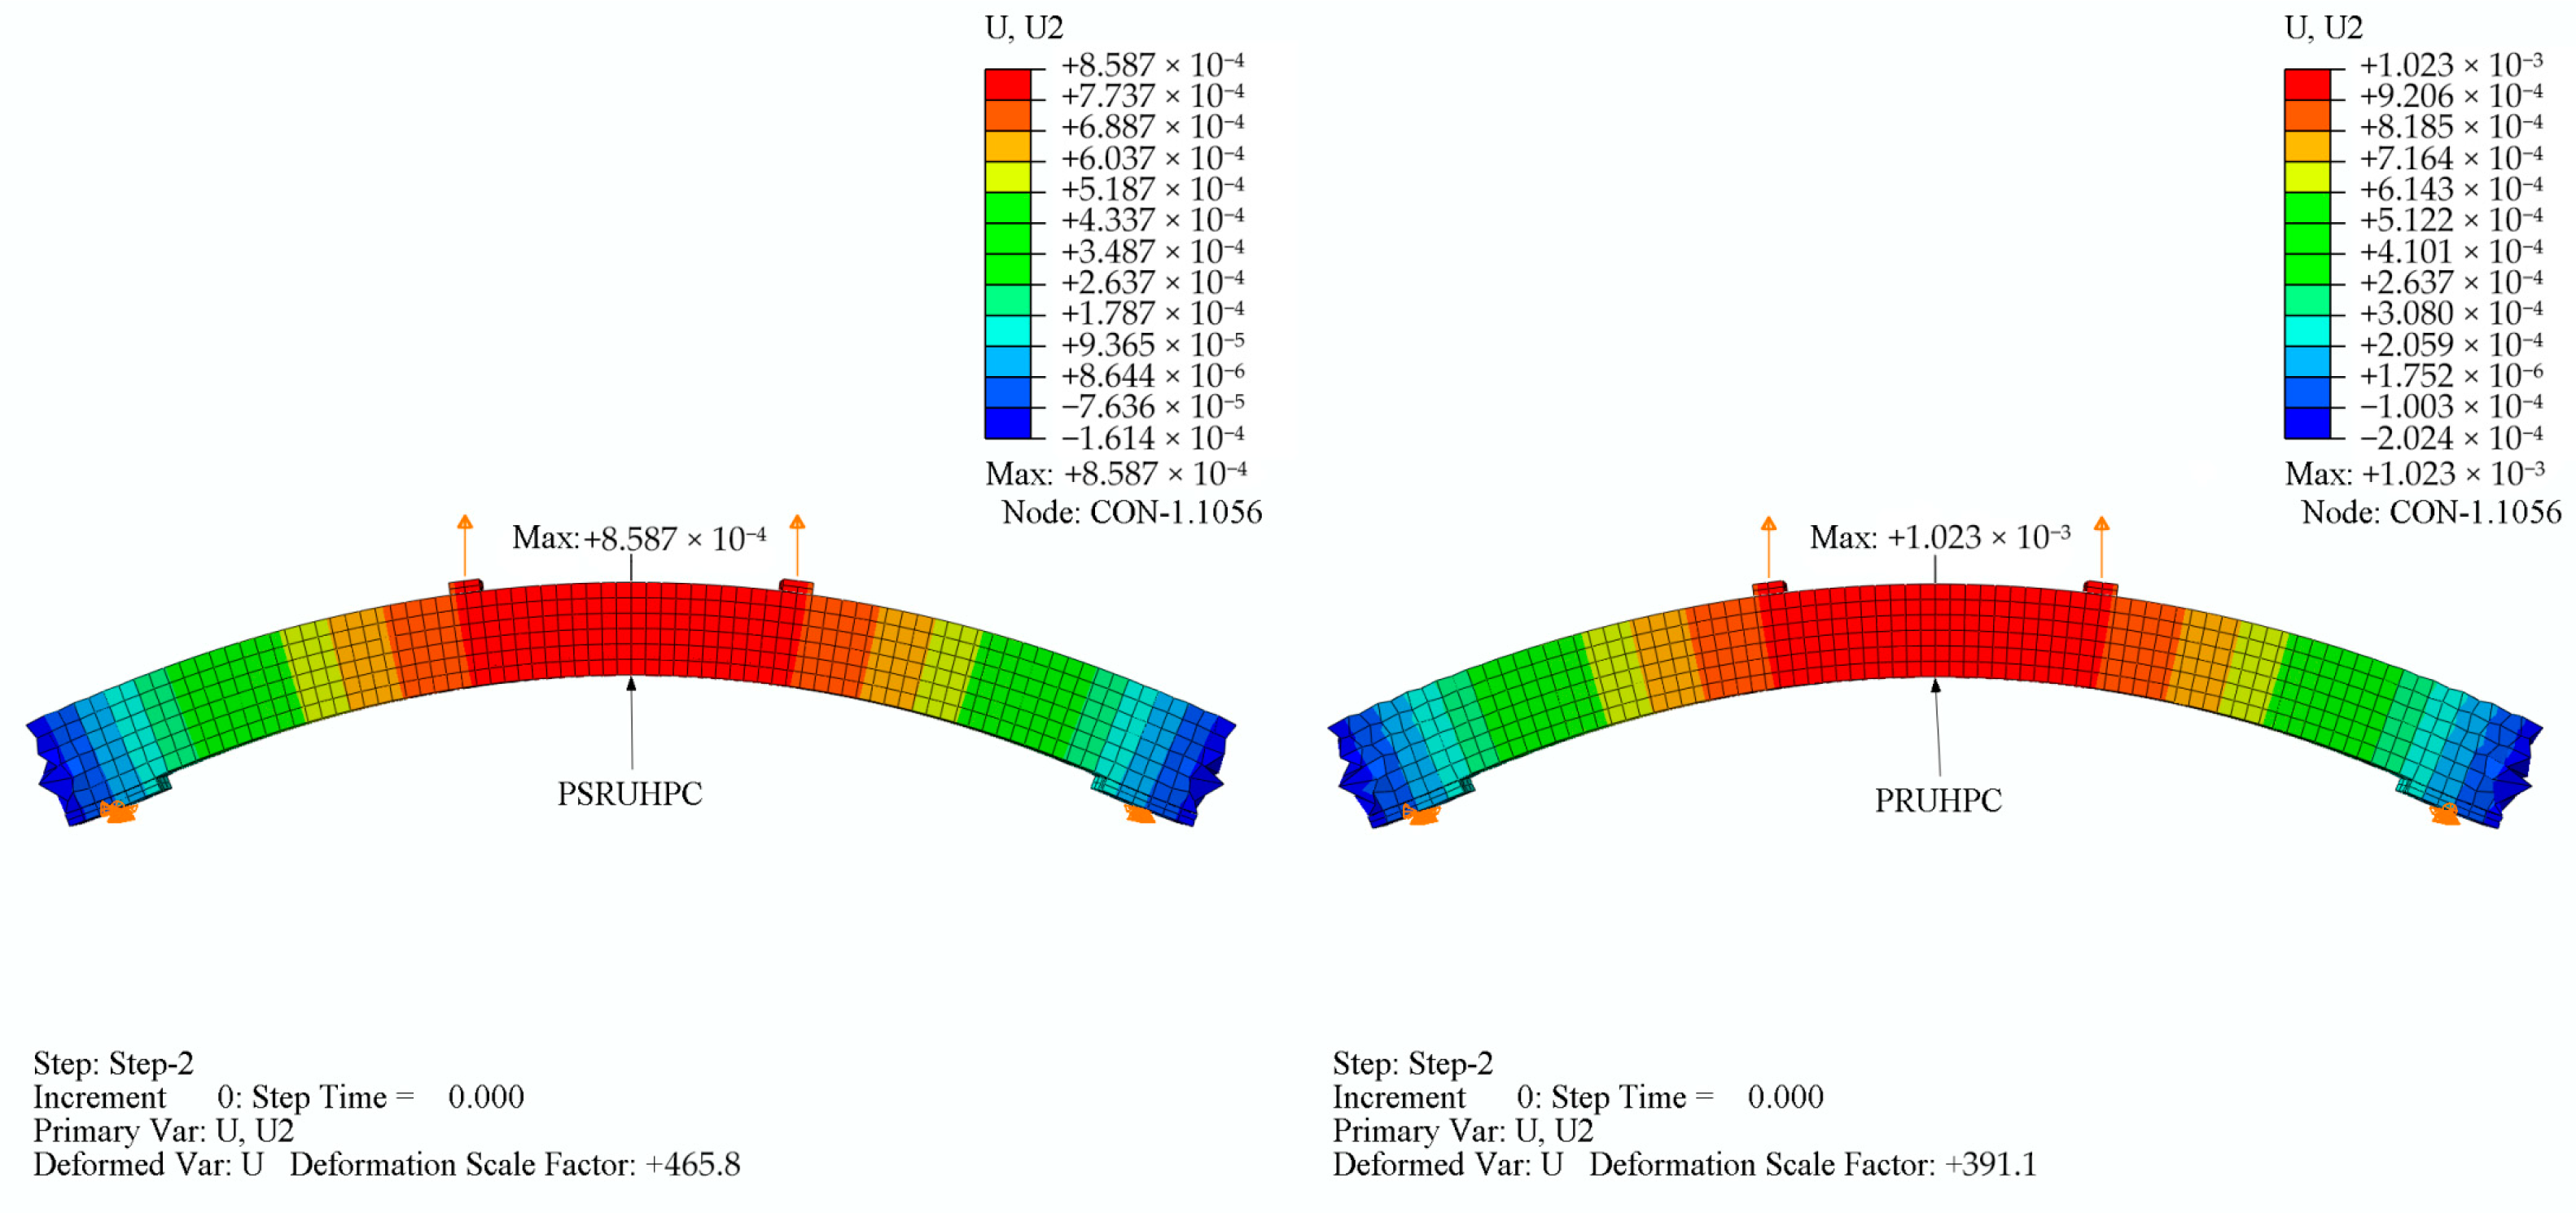
4.3. Verification of Test Results
4.4. Analysis of Other Influencing Factors
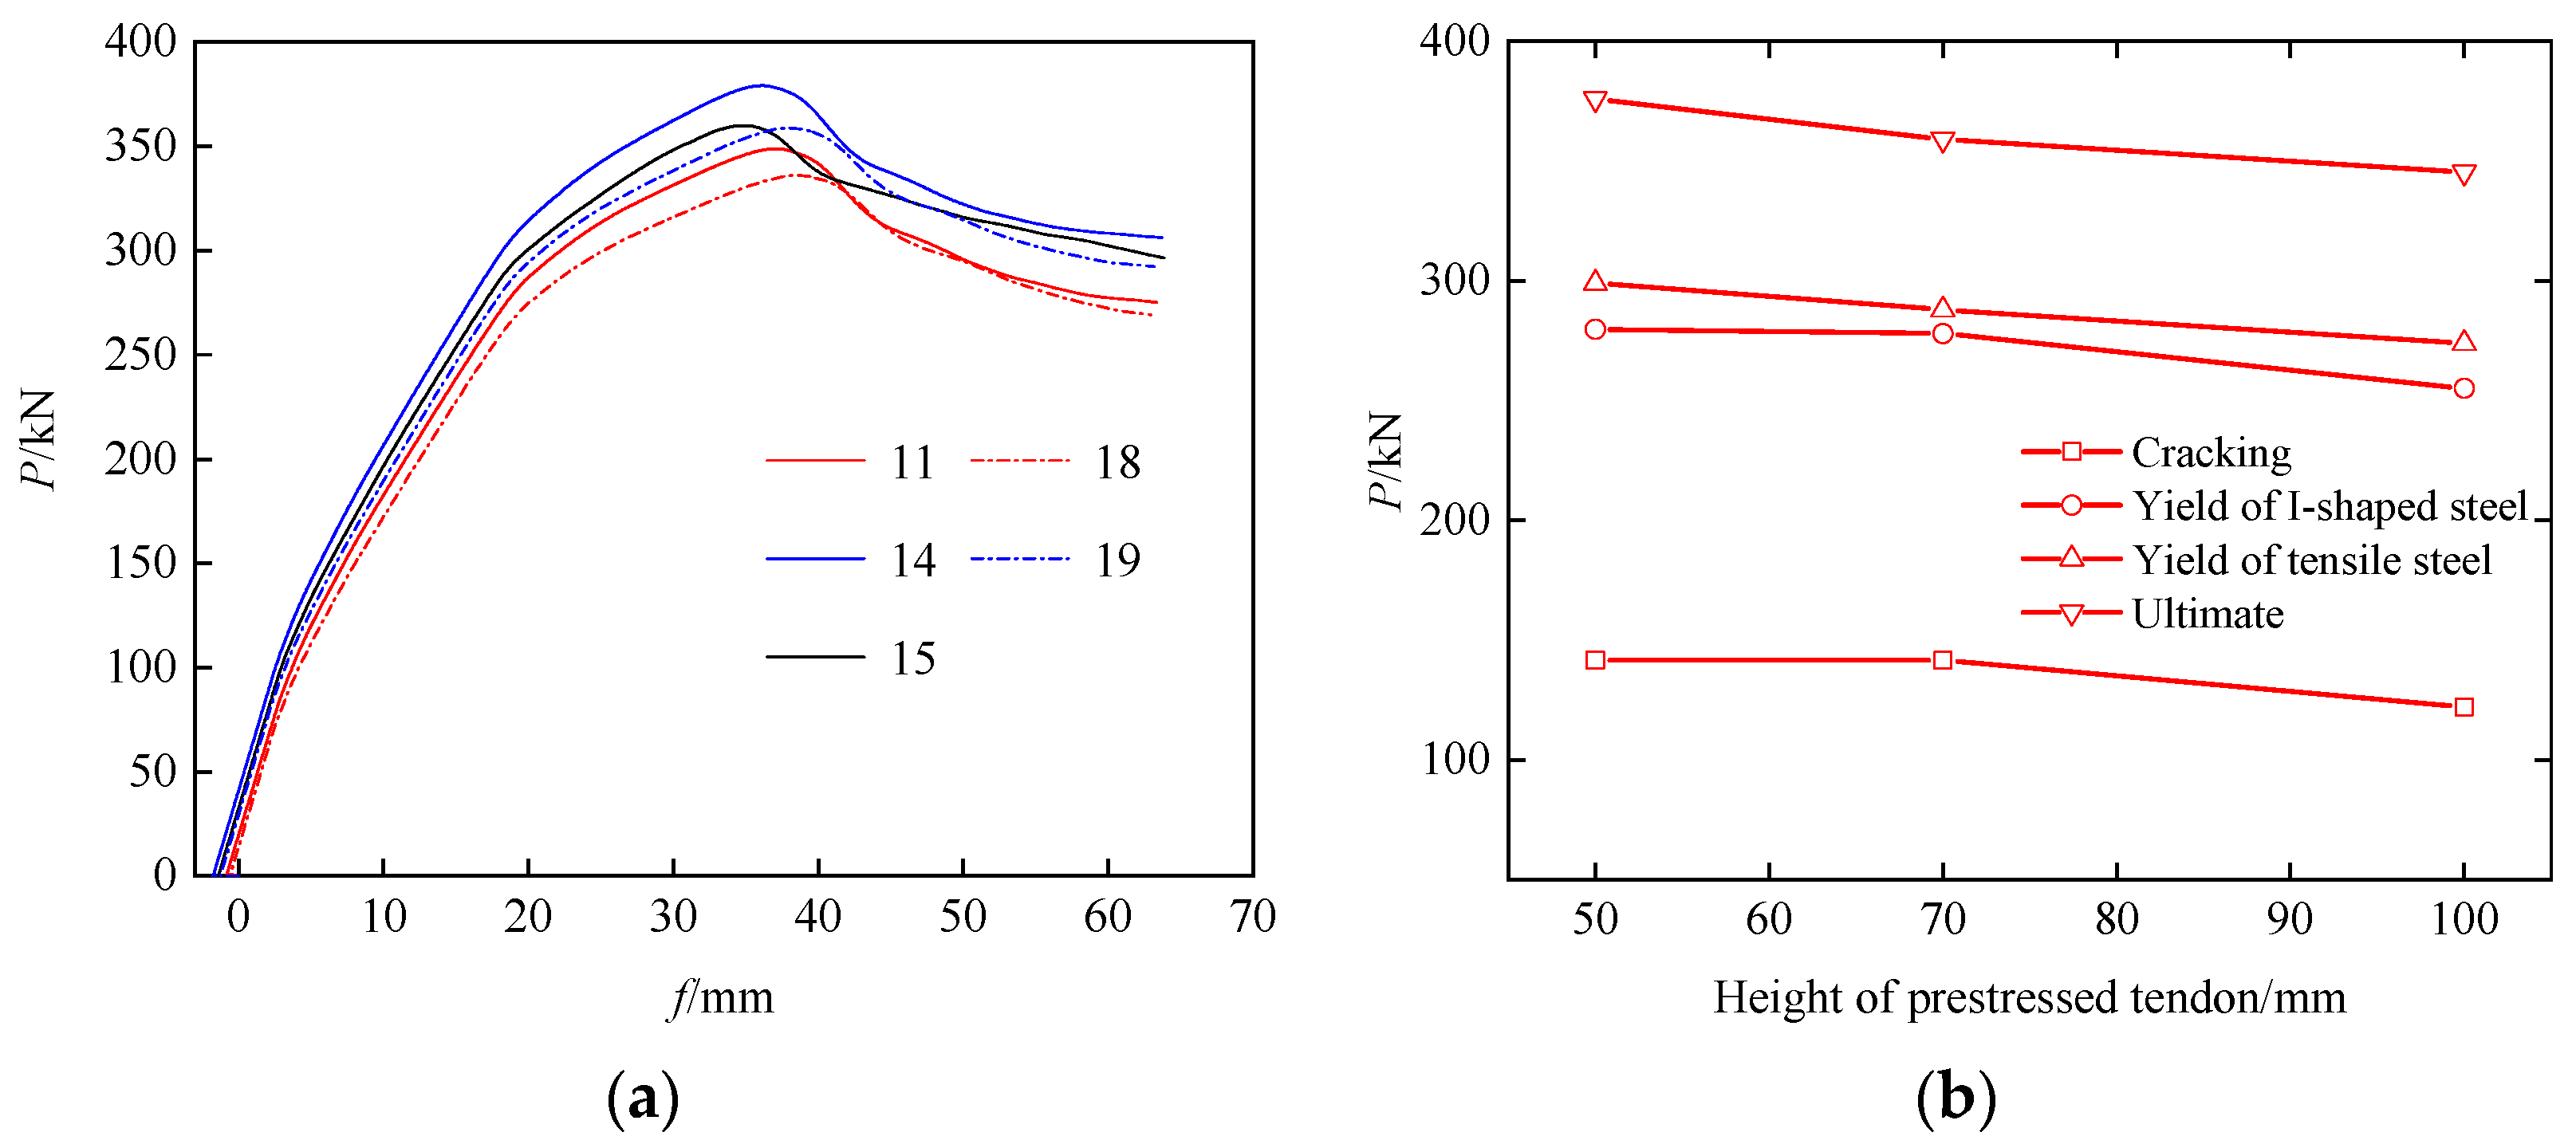
4.4.1. Impact on Flexural Capacity
- (1)
- Reinforcement ratio of ordinary reinforcement
- (2)
- Reinforcement ratio of prestressed tendons
- (3)
- Steel content of section steel
- (4)
- Effective prestress
- (5)
- Height of prestressed tendons
- (6)
- I-shaped steel position
- (7)
- I-shaped steel strength
- (8)
- With or without bonding
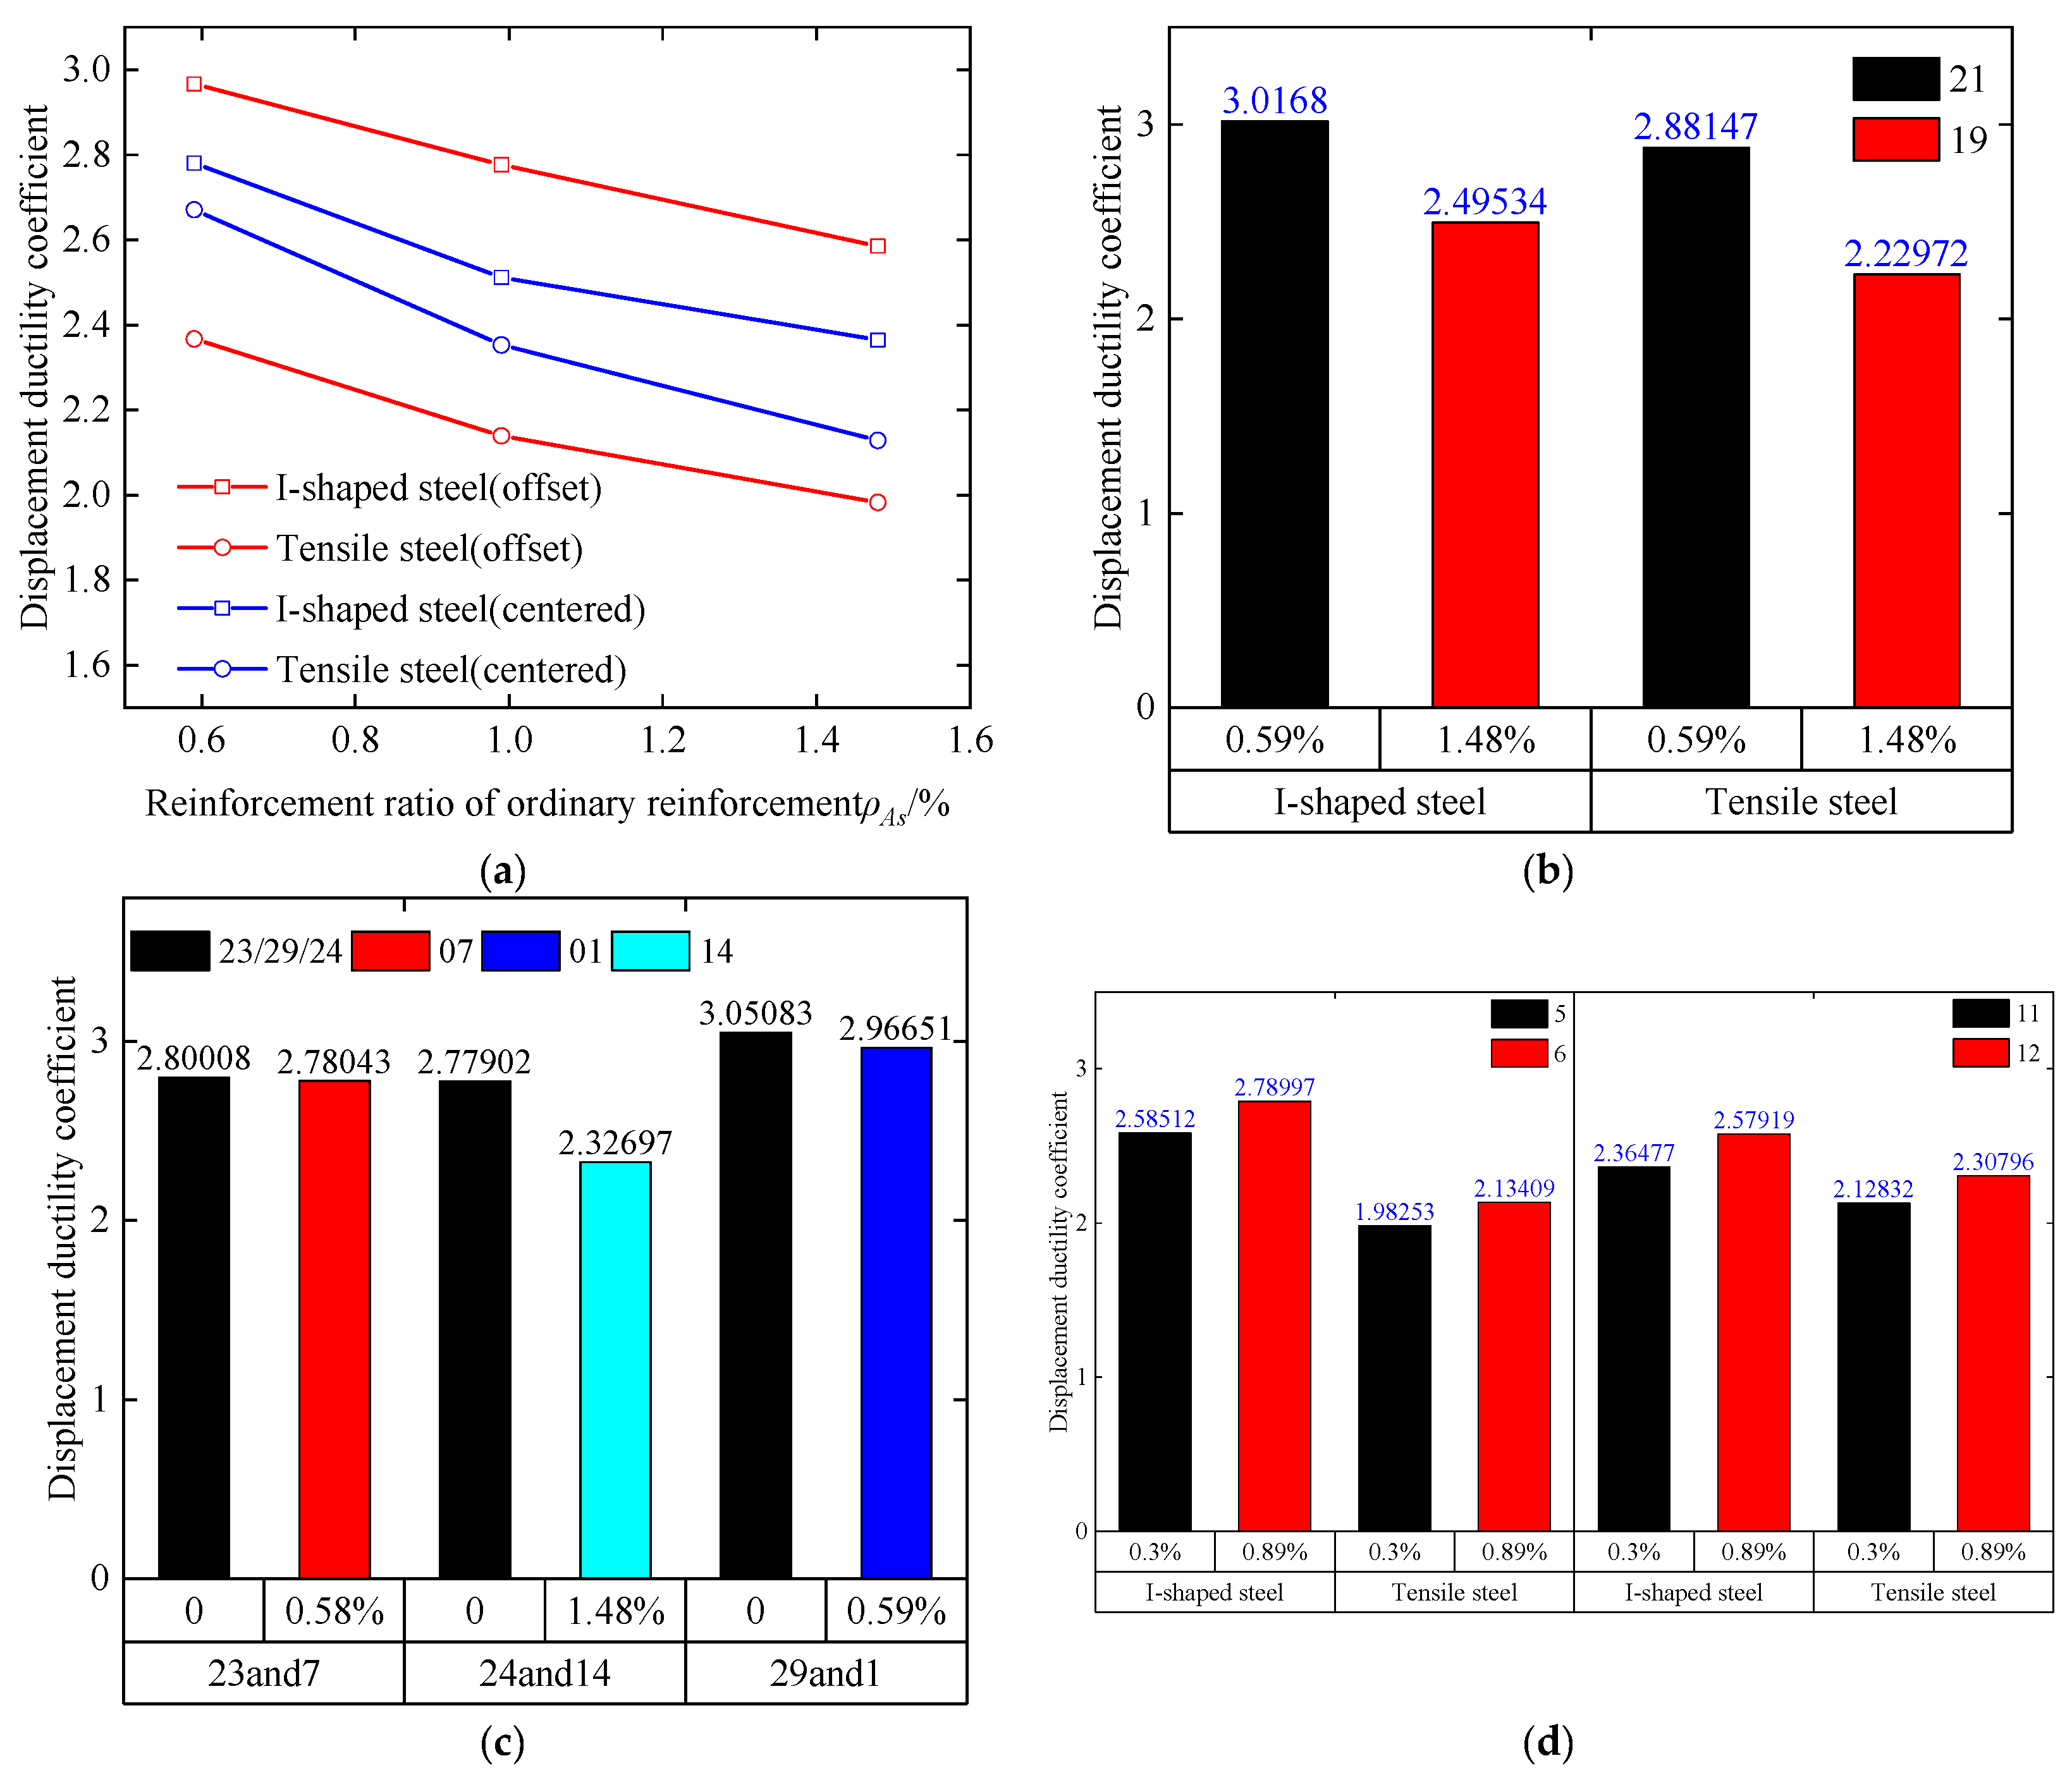
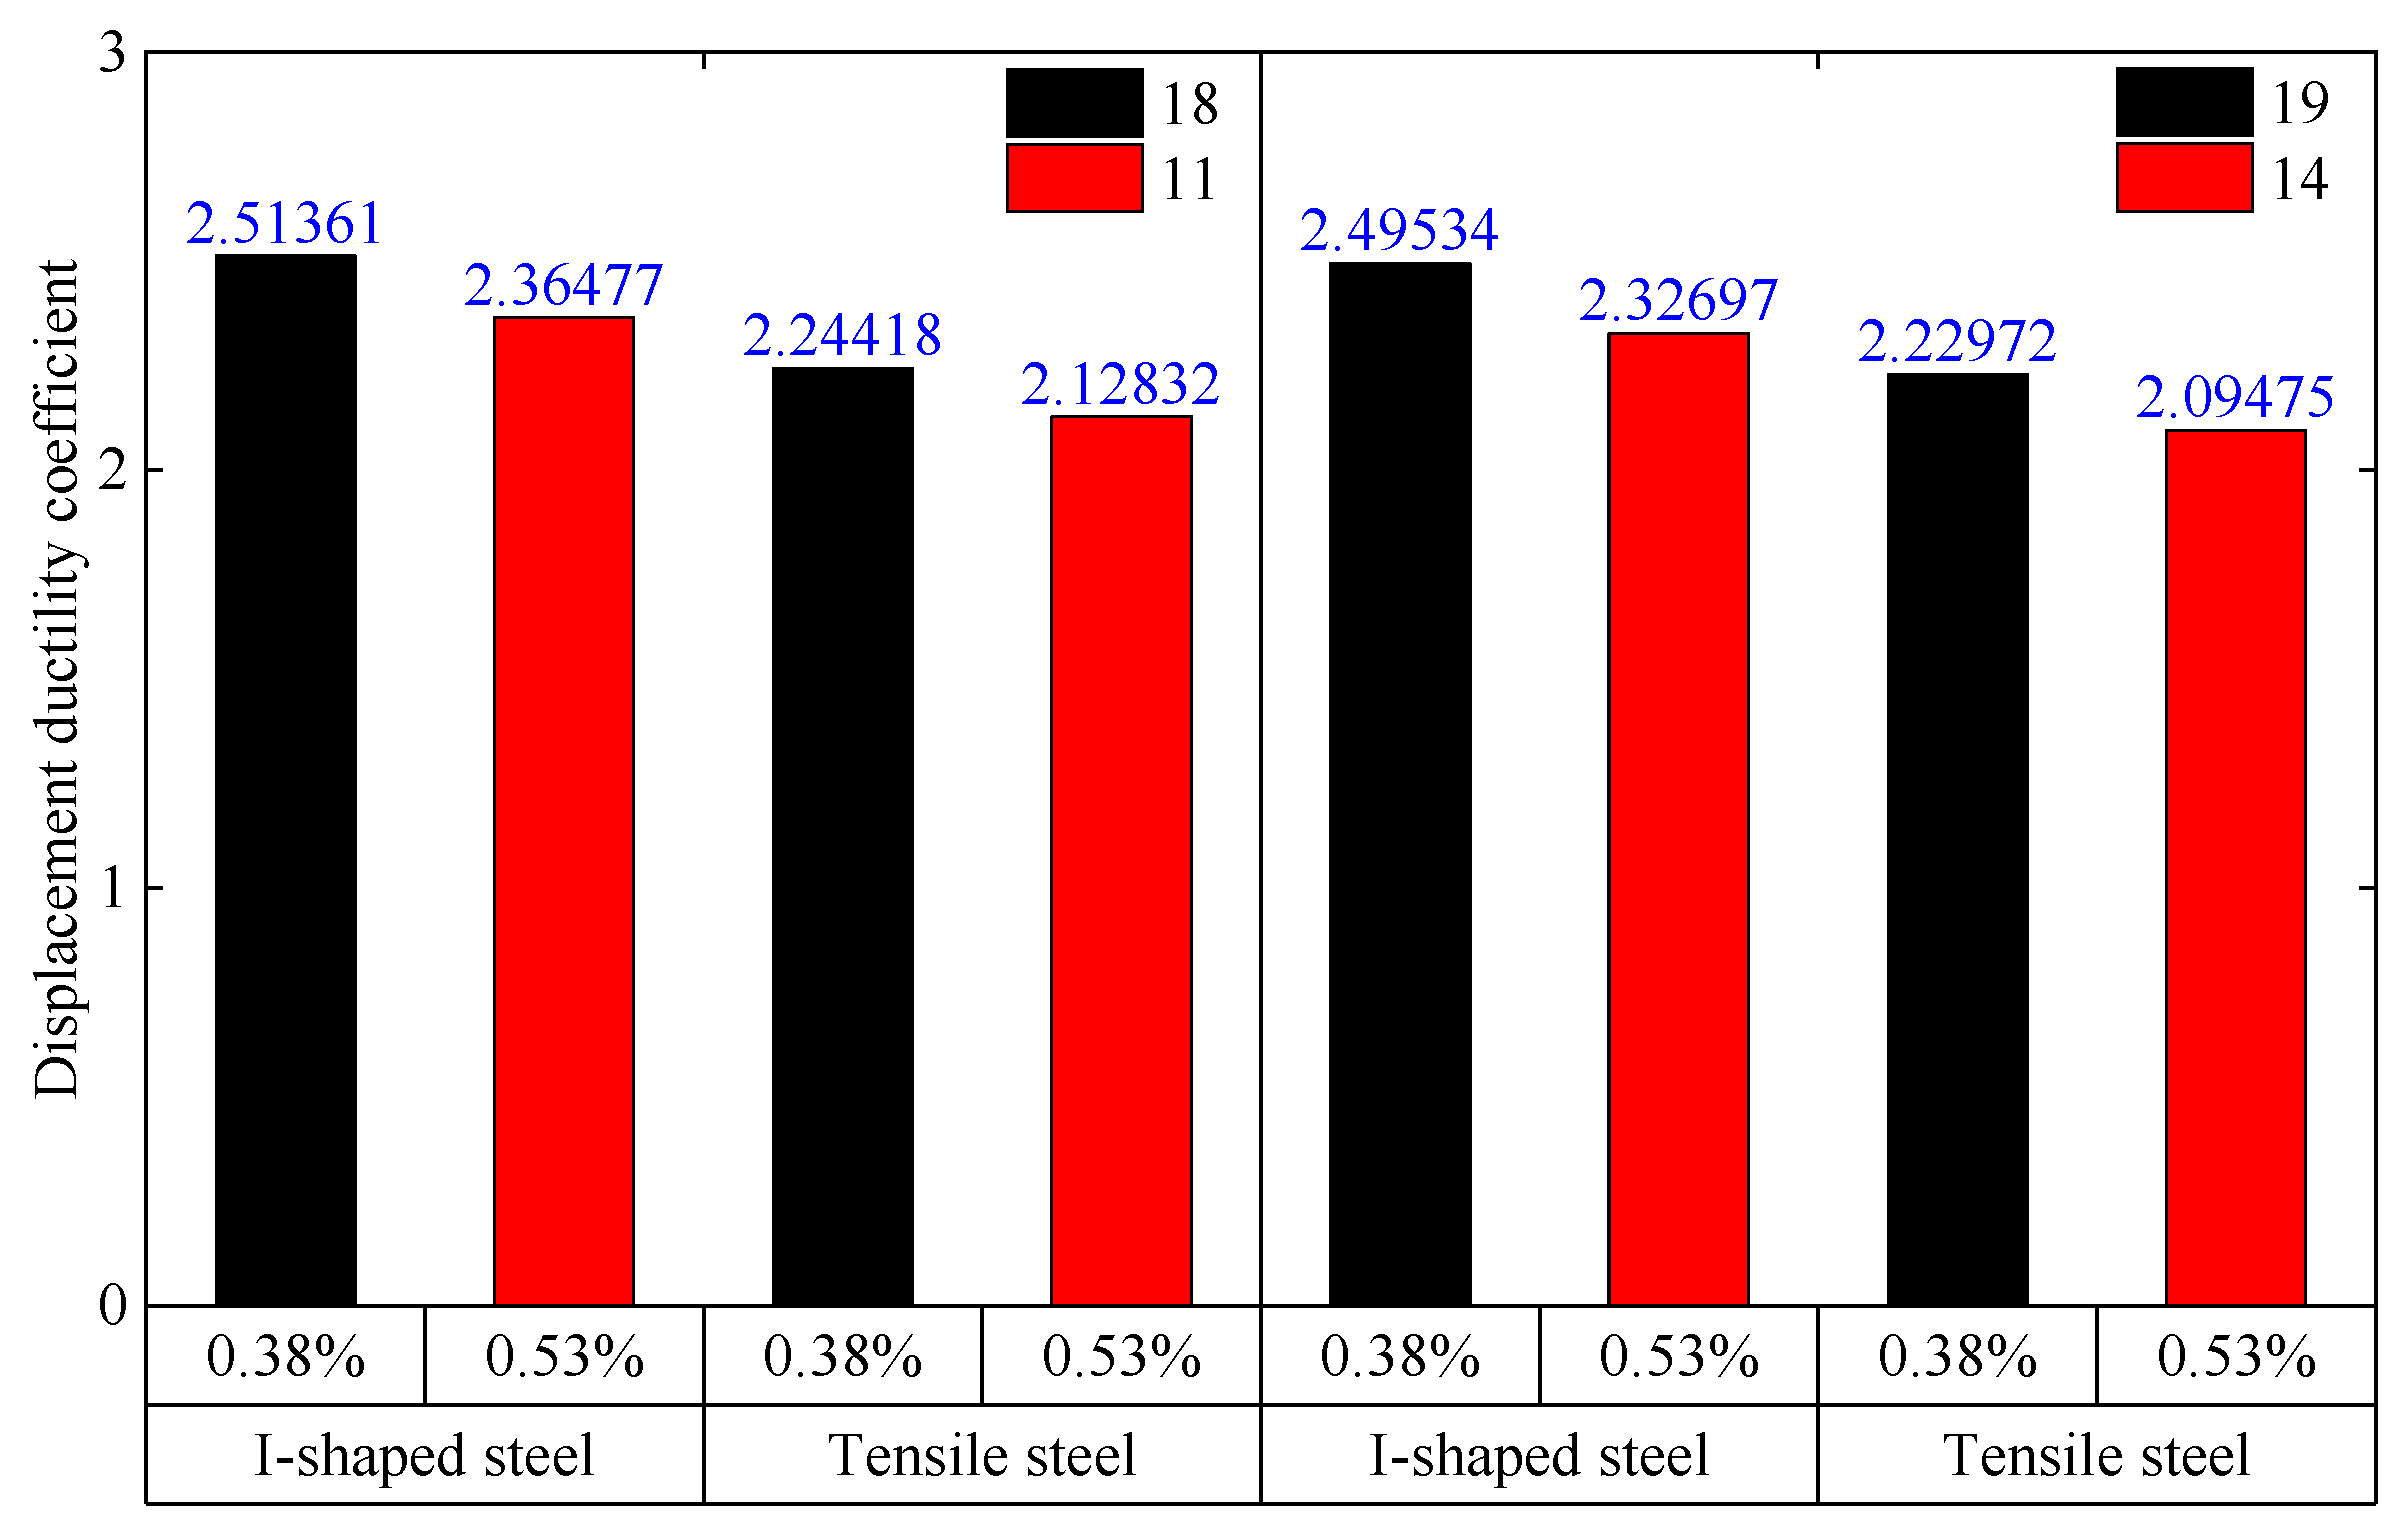
4.4.2. Influence of Resistance to Ductility
- (1)
- Reinforcement ratio of ordinary reinforcement
- (2)
- Reinforcement ratio of prestressed tendons
- (3)
- Steel content of section steel
- (4)
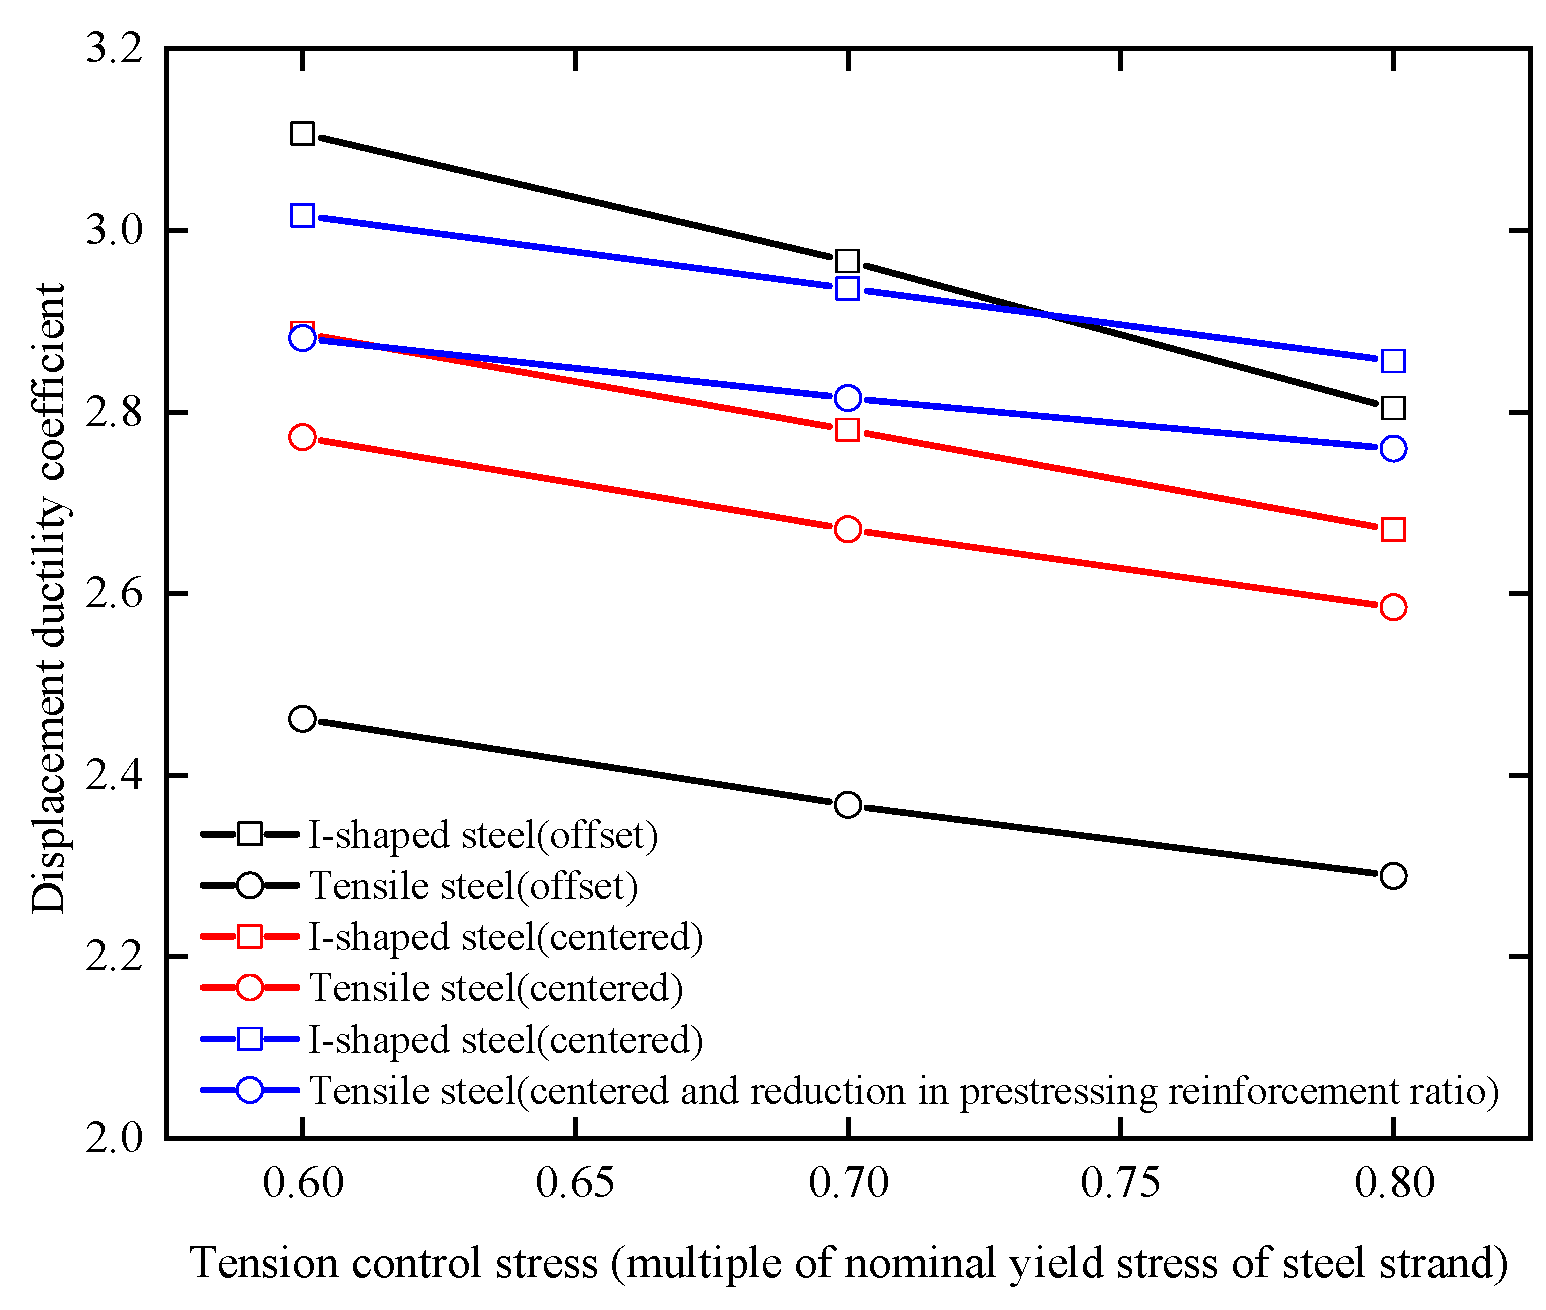
- Effective prestress
- (5)
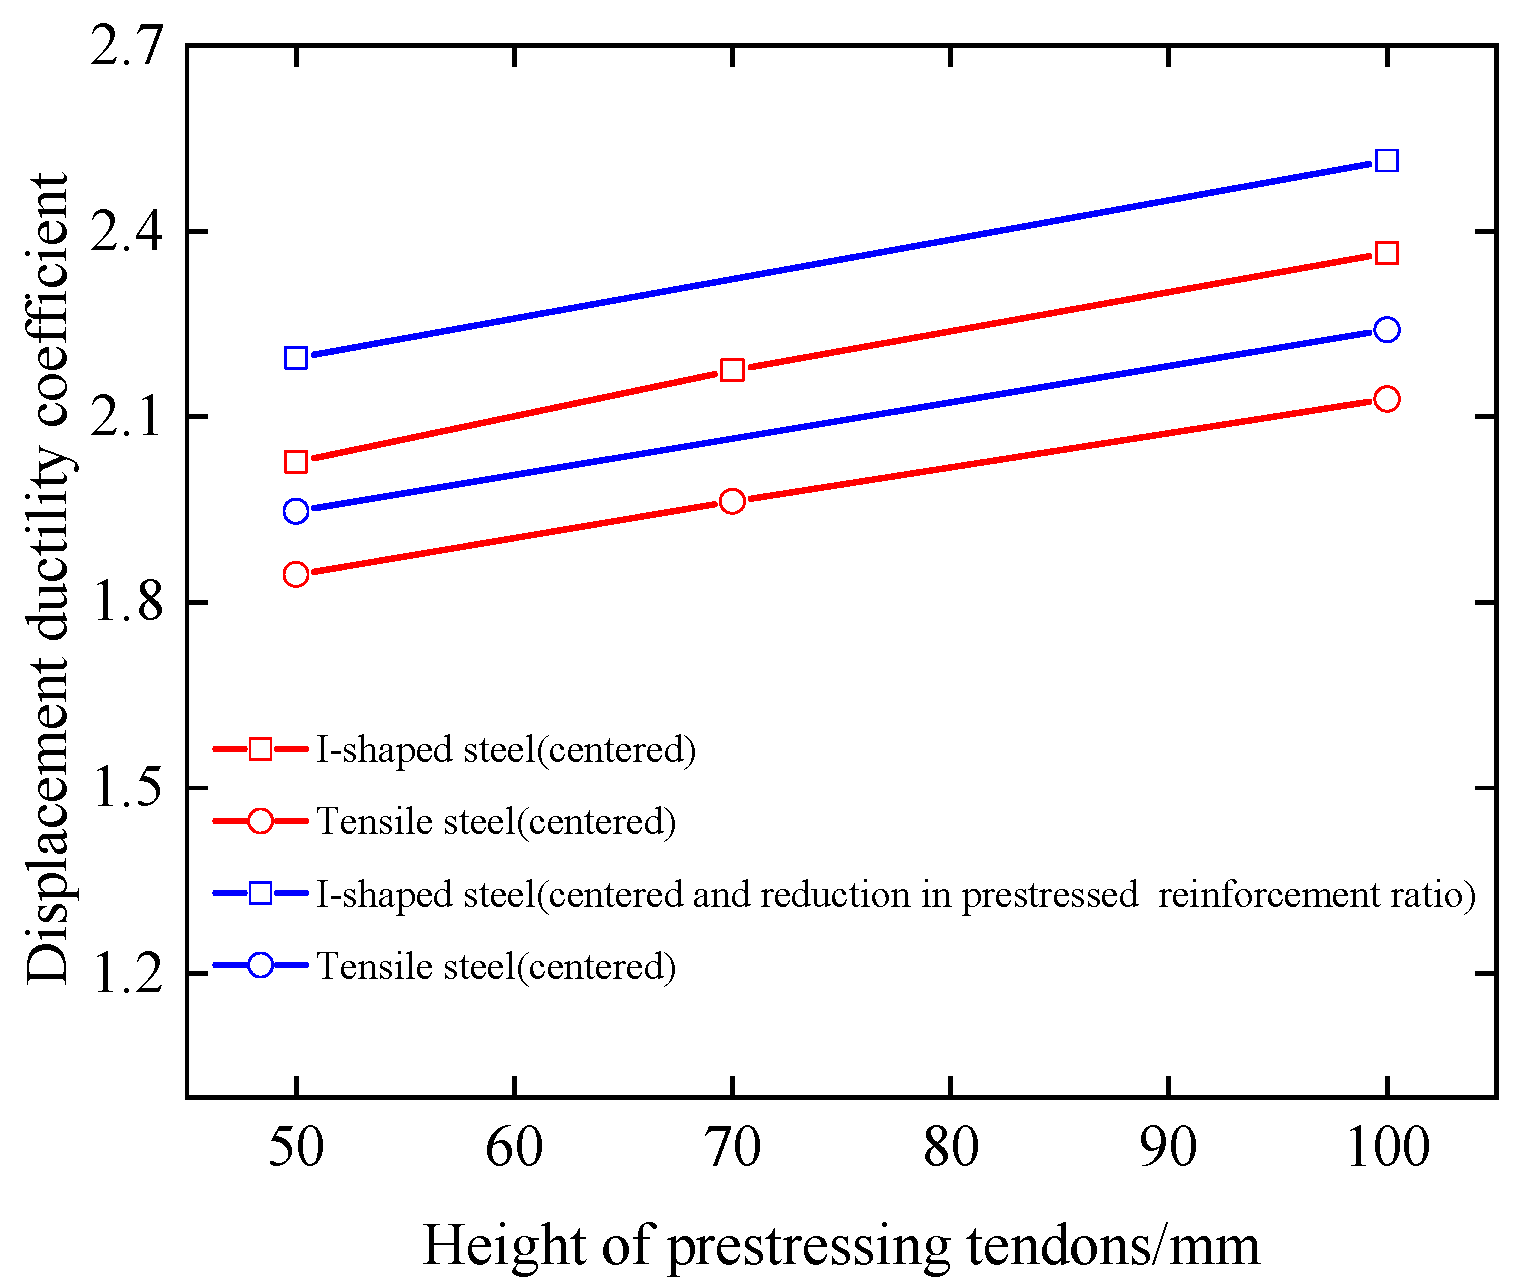
- Height of prestressed tendons
- (6)
- I-shaped steel position
- (7)
- I-shaped steel strength
- (8)
- With or without bonding
5. Conclusions
- The test results show that the bending processes of unbonded prestressed steel UHPC (PSRUHPC) beams are similar to those used for ordinary reinforced concrete beams, and UHPC crushing in the compression zone is a sign of failure. Due to the tie effect of steel fibers, the crushed concrete still maintained good integrity, and there was no fragmentation phenomenon; after cracking, the concrete in the tension zone remained functional, and the cracking inflection point of the load–deflection curve was not obvious. The presence of I-shaped steel endowed the PSRUHPC beam with good deformation performance. The application of prestress significantly improved the stiffness of the beam before cracking. The cracking loads of the three test beams accounted for each of their ultimate loads, which were higher than those seen in ordinary concrete beams, and they displayed higher bearing capacities before cracking. At the same height, the change trends of the strain in the section steel and UHPC were roughly the same. After most of the section steel had yielded under tension, the strains of the two deviated, but they were shown to generally work together.
- The PSRUHPC beam showed a significantly improved bearing capacity, and its bending ductility performance was improved. Compared with PRUHPC beams, PSRUHPC beams showed a bearing capacity increase of 55.3%, a cracking load increase of 11.9%, and a displacement ductility coefficient increase of 76.2%. Compared with SRUHPC beams, PSRUHPC beams showed a 15.4% increase in bearing capacity, a 50.2% increase in cracking load, and a 12.1% increase in displacement ductility coefficient.
- Due to the diversity in the distribution and orientation of steel fibers in the matrix at the time of pouring, together with the bridging effects of steel fibers, multiple cracking phenomena emerged when the three test beams were flexed and cracked. The cracks did not start from the bottom of the beam, and the initial cracking directions varied and were not perpendicular with the bottom edge of the beam. Using I-shaped steel resulted in finer UHPC cracks.
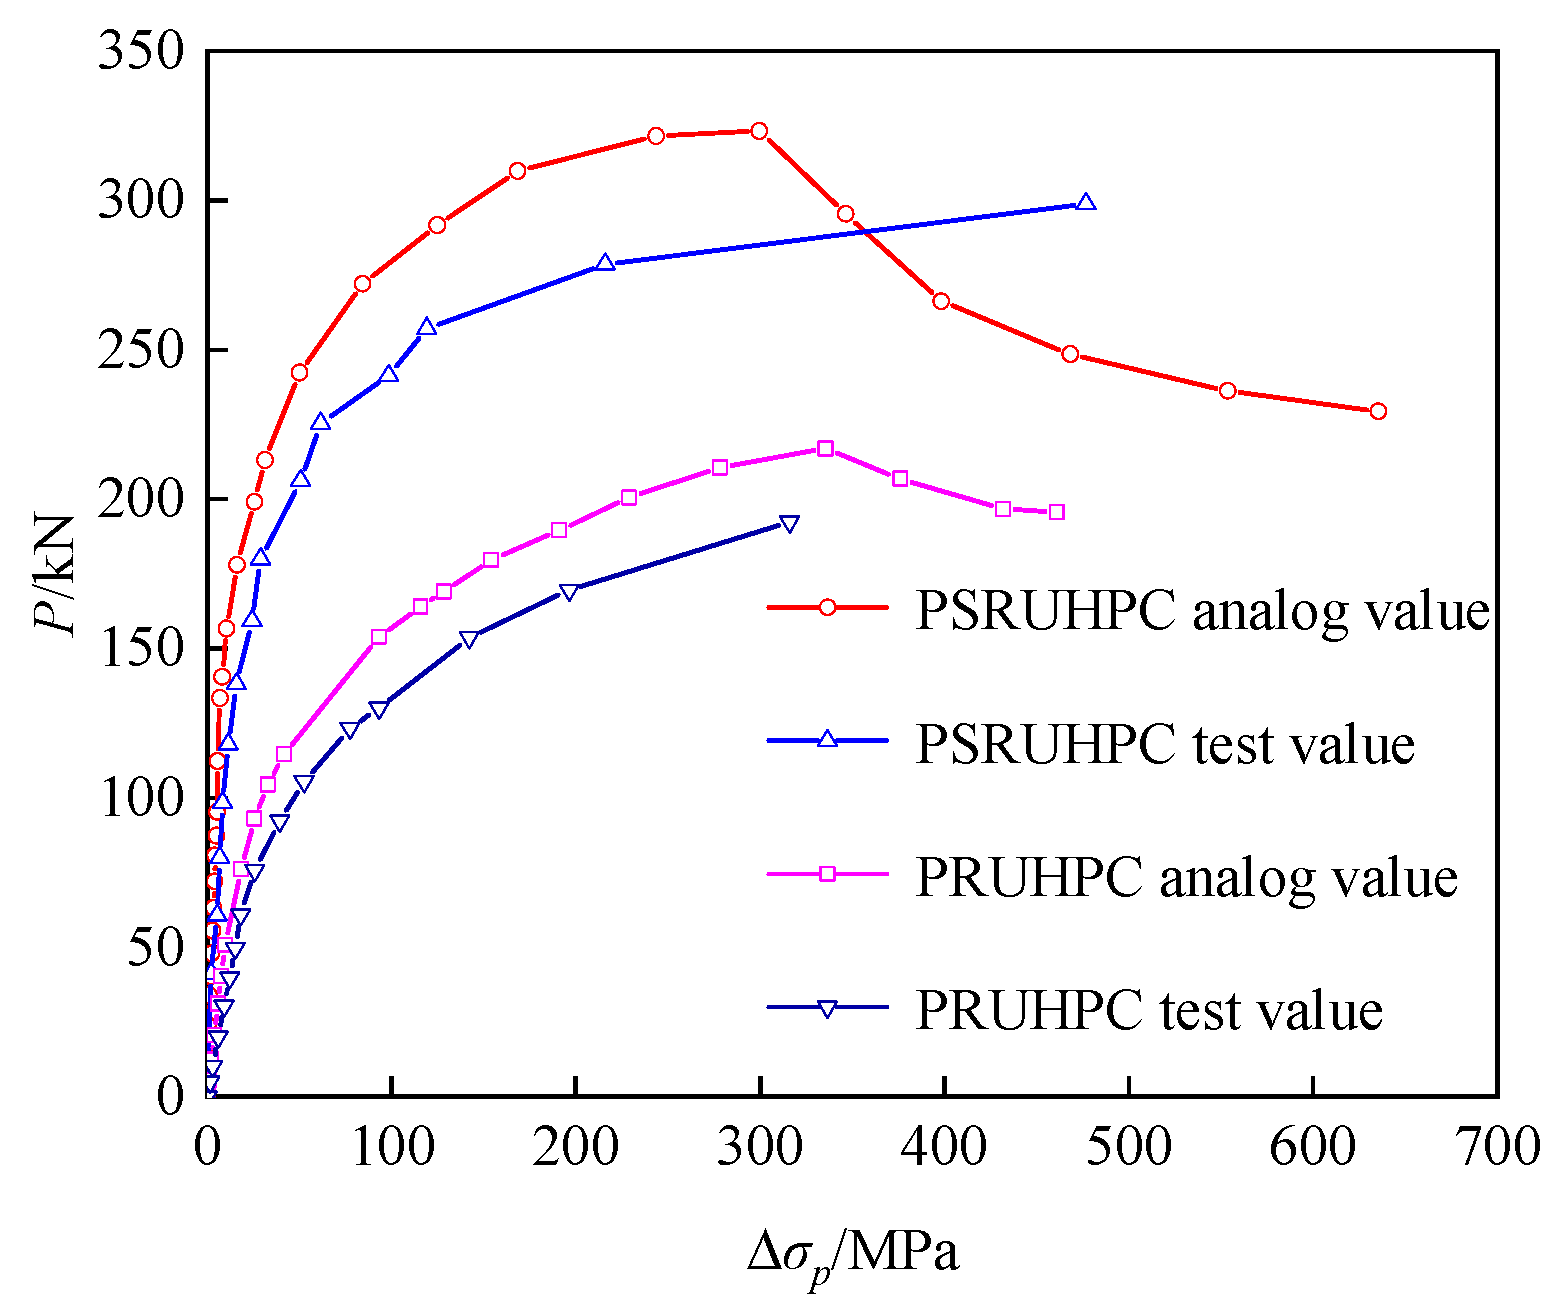
- The magnetic flux sensor cable force monitoring system was shown to more effectively monitor the strand stress increment of the unbonded prestressed steel UHPC beam; the load–strand stress increment curves were basically the same as the load–deflection curves, and the stress increment of the steel strand was positively correlated with the midspan deflection.
- The simulation results show that the reinforcement ratio and the shaped steel content ratio of an ordinary longitudinal reinforcement had a greater impact on the yield load and ultimate load, and the reinforcement ratio of the prestressed reinforcement had a greater impact on the cracking load. Increasing the effective prestress significantly decreased the bending ductility of the beam. As the section steel and the prestressed tendons in the section moved downwards, the beam’s bearing capacity increased, but its bending ductility decreased. After incorporating high-strength steel, the yield load and ultimate load were significantly increased, but the flexural ductility properties of the beam showed a nonlinear, decreasing trend.
Author Contributions
Funding
Data Availability Statement
Conflicts of Interest
References
- de Larrard, F.; Sedran, T. Optimization of ultra-high-performance concrete by the use of a packing model. Cem. Concr. Res. 1994, 24, 997–1009. [Google Scholar] [CrossRef]
- Yoo, D.-Y.; Banthia, N. Mechanical properties of ultra-high-performance fiber-reinforced concrete: A review. Cem. Concr. Compos. 2016, 73, 267–280. [Google Scholar] [CrossRef]
- Xue, J.; Briseghella, B.; Huang, F.; Nuti, C.; Tabatabai, H.; Chen, B. Review of ultra-high performance concrete and its application in bridge engineering. Constr. Build. Mater. 2020, 260, 119844. [Google Scholar] [CrossRef]
- Zhu, Y.; Zhang, Y.; Hussein, H.H.; Chen, G. Flexural strengthening of reinforced concrete beams or slabs using ultra-high performance concrete (UHPC): A state of the art review. Eng. Struct. 2020, 205, 110035. [Google Scholar] [CrossRef]
- Li, J.; Wu, Z.; Shi, C.; Yuan, Q.; Zhang, Z. Durability of ultra-high performance concrete—A review. Constr. Build. Mater. 2020, 255, 119296. [Google Scholar] [CrossRef]
- Wang, X.; Wu, D.; Zhang, J.; Yu, R.; Hou, D.; Shui, Z. Design of sustainable ultra-high performance concrete: A review. Constr. Build. Mater. 2021, 307, 124643. [Google Scholar] [CrossRef]
- Zhang, Y.; Xin, H.; Correia, J.A. Fracture evaluation of ultra-high-performance fiber reinforced concrete (UHPFRC). Eng. Fail. Anal. 2021, 120, 105076. [Google Scholar] [CrossRef]
- Hu, R.; Fang, Z.; Shi, C.; Benmokrane, B.; Su, J. A review on seismic behavior of ultra-high performance concrete members. Adv. Struct. Eng. 2020, 24, 1054–1069. [Google Scholar] [CrossRef]
- Elmorsy, M.; Hassan, W. Seismic behavior of ultra-high performance concrete elements: State-of-the-art review and test database and trends. J. Build. Eng. 2021, 40, 102572. [Google Scholar] [CrossRef]
- Liu, J.; Li, J.; Fang, J.; Su, Y.; Wu, C. Ultra-high performance concrete targets against high velocity projectile impact—A-state-of-the-art review. Int. J. Impact Eng. 2022, 160, 104080. [Google Scholar] [CrossRef]
- Nabodyuti, D.; Prakash, N. State-of-the-art review on ultra high performance concrete—Ballistic and blast perspective. Cem. Concr. Compos. 2022, 127, 104383. [Google Scholar]
- Bae, B.-I.; Choi, H.-K.; Choi, C.-S. Flexural Strength Evaluation of Reinforced Concrete Members with Ultra High Performance Concrete. Adv. Mater. Sci. Eng. 2016, 2016, 2815247. [Google Scholar] [CrossRef]
- Singh, M.; Sheikh, A.; Ali, M.M.; Visintin, P.; Griffith, M. Experimental and numerical study of the flexural behaviour of ultra-high performance fibre reinforced concrete beams. Constr. Build. Mater. 2017, 138, 12–25. [Google Scholar] [CrossRef]
- Chen, S.; Zhang, R.; Jia, L.-J.; Wang, J.-Y.; Hu, A.; Liang, X.; Yu, J.; Shi, Q.; Yang, I.-H.; Joh, C.; et al. Flexural behaviour of rebar-reinforced ultra-high-performance concrete beams. Mag. Concr. Res. 2018, 70, 997–1015. [Google Scholar] [CrossRef]
- Liu, C.; Zhang, Y.; Yao, Y.; Huang, Y. Calculation Method for Flexural Capacity of High Strain-hardening Ultra-high Performance Concrete T-beams. Struct. Concr. 2019, 20, 405–419. [Google Scholar] [CrossRef]
- Qiu, M.; Shao, X.; Wille, K.; Yan, B.; Wu, J. Experimental Investigation on Flexural Behavior of Reinforced Ultra High Performance Concrete Low-Profile T-Beams. Int. J. Concr. Struct. Mater. 2020, 14, 5. [Google Scholar] [CrossRef]
- Yoo, D.; Yoon, Y. A Review on Structural Behavior, Design, and Application of Ultra-High-Performance Fiber- Reinforced Concrete. Struct. Des. 2016, 10, 125–142. [Google Scholar] [CrossRef]
- Chen, B.; Ji, T.; Huang, Q.; Wu, H.; Ding, Q.; Zhan, Y. Review of Ultra High Performance Concrete Research. Chin. J. Build. Sci. Eng. 2014, 31, 1–24. [Google Scholar]
- Hung, C.-C.; El-Tawil, S.; Chao, S.-H. A Review of Developments and Challenges for UHPC in Structural Engineering: Behavior, Analysis, and Design. J. Struct. Eng. 2021, 147, 03121001. [Google Scholar] [CrossRef]
- Zhang, P.; Lv, X.; Liu, Y.; Zou, X.; Li, Y.; Wang, J.; Sheikh, S.A. Novel fiber reinforced polymers (FRP)-ultrahigh performance concrete (UHPC) hybrid beams with improved shear performance. Constr. Build. Mater. 2021, 286, 122720. [Google Scholar] [CrossRef]
- El-Hacha, R.; Chen, D. Behaviour of hybrid FRP–UHPC beams subjected to static flexural loading. Compos. Part B Eng. 2012, 43, 582–593. [Google Scholar] [CrossRef]
- Naaman, A.; Alkhairi, F. Stress at ultimate in unbonded post-tensioning tendons. Part 2. Proposed methodology. ACI Struct. J. 1991, 88, 683–692. [Google Scholar]
- Mohamed, H.H. Effect of Span-Depth Ratio on the Ultimate Steel Stress in Unbonded Prestressed concrete members. ACI Struct. J. 1990, 87, 305–312. [Google Scholar]
- Qin, Z.; Deng, N. Simulation Experiment and Application of Magneto-Elastic Sensor for Optimal Magnetization Model. J. Shijiazhuang Tiedao Univ. (Nat. Sci. Ed.) 2022, 35, 70–75. [Google Scholar]
- Wang, X.; Liu, H.; Ju, Y.; Wang, D. Experimental and analytical models of flexural behavior of U-shaped reactive powder concrete permanent beam formworks. Constr. Build. Mater. 2021, 300, 123670. [Google Scholar] [CrossRef]
- Turker, K.; Torun, I.B. Flexural performance of highly reinforced composite beams with ultra-high performance fiber reinforced concrete layer. Eng. Struct. 2020, 219, 110722. [Google Scholar] [CrossRef]
- Tanarslan, H.M.; Alver, N.; Jahangiri, R.; Yalçınkaya, Ç.; Yazıcı, H. Flexural strengthening of RC beams using UHPFRC laminates: Bonding techniques and rebar addition. Constr. Build. Mater. 2017, 155, 45–55. [Google Scholar] [CrossRef]
- Safdar, M.; Matsumoto, T.; Kakuma, K. Flexural behavior of reinforced concrete beams repaired with ultra-high performance fiber reinforced concrete (UHPFRC). Compos. Struct. 2016, 157, 448–460. [Google Scholar] [CrossRef]
- Noshiravani, T.; Brühwiler, E. Analytical Model for Predicting Response and Flexure-Shear Resistance of Composite Beams Combining Reinforced Ultrahigh Performance Fiber-Reinforced Concrete and Reinforced Concrete. J. Struct. Eng. 2014, 140, 04014012. [Google Scholar] [CrossRef]
- Li, S.; Zhang, L.; Guo, P.; Zhang, P.; Wang, C.; Sun, W.; Han, S. Characteristic analysis of acoustic emission monitoring parameters for crack propagation in UHPC-NC composite beam under bending test. Constr. Build. Mater. 2021, 278, 122401. [Google Scholar] [CrossRef]
- Lampropoulos, A.P.; Paschalis, S.A.; Tsioulou, O.T.; Dritsos, S.E. Strengthening of reinforced concrete beams using ultra high performance fibre reinforced concrete (UHPFRC). Eng. Struct. 2016, 106, 370–384. [Google Scholar] [CrossRef]
- Habel, K.; Denarié, E.; Brühwiler, E. Structural Response of Elements Combining Ultrahigh-Performance Fiber-Reinforced Concretes and Reinforced Concrete. J. Struct. Eng. 2006, 132, 1793–1800. [Google Scholar] [CrossRef]
- Dong, Z.; Wu, G.; Zhu, H.; Zhao, X.-L.; Wei, Y.; Qian, H. Flexural behavior of seawater sea-sand coral concrete–UHPC composite beams reinforced with BFRP bars. Constr. Build. Mater. 2020, 265, 120279. [Google Scholar] [CrossRef]
- Al-Osta, M.; Isa, M.; Baluch, M.; Rahman, M. Flexural behavior of reinforced concrete beams strengthened with ultra-high performance fiber reinforced concrete. Constr. Build. Mater. 2017, 134, 279–296. [Google Scholar] [CrossRef]
- Zhu, Y.; Zhang, Y.; Hussein, H.H.; Cai, S. Flexural Study on UHPC–Steel Composite Beams with Joints under Negative Bending Moment. J. Bridg. Eng. 2020, 25, 04020084. [Google Scholar] [CrossRef]
- Wang, Z.; Nie, X.; Fan, J.-S.; Lu, X.-Y.; Ding, R. Experimental and numerical investigation of the interfacial properties of non-steam-cured UHPC-steel composite beams. Constr. Build. Mater. 2019, 195, 323–339. [Google Scholar] [CrossRef]
- Shao, X.; Yi, D.; Huang, Z.; Zhao, H.; Chen, B.; Liu, M. Basic Performance of the Composite Deck System Composed of Orthotropic Steel Deck and Ultrathin RPC Layer. J. Bridg. Eng. 2013, 18, 417–428. [Google Scholar] [CrossRef]
- Luo, J.; Shao, X.; Cao, J.; Xiong, M.; Fan, W. Transverse bending behavior of the steel-UHPC lightweight composite deck: Orthogonal test and analysis. J. Constr. Steel Res. 2019, 162, 105708. [Google Scholar] [CrossRef]
- Liu, X.; Zhang, J.; Cheng, Z.; Ye, M. Experimental and Numerical Studies on the Negative Flexural Behavior of Steel-UHPC Composite Beams. Adv. Civ. Eng. 2021, 2021, 8828175. [Google Scholar] [CrossRef]
- Choi, W.; Choi, Y.; Yoo, S.-W. Flexural Design and Analysis of Composite Beams with Inverted-T Steel Girder with Ultrahigh Performance Concrete Slab. Adv. Civ. Eng. 2018, 2018, 1356027. [Google Scholar] [CrossRef]
- Tu, N.; Raad, M. Flexural Performance of Composite Ultra-High-Performance Concrete-Encased Steel Hollow Beams. Civ. Eng. J. 2019, 5, 1289–1304. [Google Scholar]
- Tu’ma, N.H.; Hammood, M.N.; Mohsin, R.D. Flexural Strength Estimation for Hollow Cross-Section Simply Supported UHPC Beams. Civ. Environ. Eng. 2018, 17, 476–484. [Google Scholar] [CrossRef]
- Liangtao, B.; Ding, L. Experimental study on flexural properties of steel beams with reactive powder concrete outsourcing. Chin. J. Railw. Sci. Eng. 2018, 15, 389–397. [Google Scholar]
- Bu, L.; Teng, D. Experimental of mechanical performance of shaped steel encircled with reactive powder concrete composite beams. J. Wuhan Univ. (Eng. Ed.) 2018, 51, 721–726+731. [Google Scholar]
- Bu, L.; Luo, K. Internface Bonding Performance Between Shape Steel and Reactive Powder Concrete (RPC) in Steel Reinforced RPC structures. Sci. Technol. Eng. 2018, 18, 307–312. [Google Scholar]
- Bu, L.; Tang, C. Experimental Study on Flexural Behavior of I-section Steel Ultra High Performance Concrete (UHPC) Beams. Highw. Eng. 2021, 46, 1–7+65. [Google Scholar]
- Huang, Z.; Huang, X.; Li, W. Bond-slip behaviour of H-shaped steel embedded in UHPFRC. Steel Compos. Struct. 2021, 38, 563–582. [Google Scholar]
- Wang, X. Study on Bond Slip Behavior of Section Steel and Reactive Powder Concrete at Room Temperature. Master’s Thesis, Shandong Jianzhu University, Shandong, China, 2020. [Google Scholar]
- Zhong, Z. Experimental Study on Bond Slip Behavior of Shaped Steel Reactive Powder Concrete. Master’s Thesis, Yangzhou University, Yangzhou, China, 2021. [Google Scholar]
- Shao, X.; Ying-Li, R.; Zhao, X. Experimental Study on Flexural Behavior of Joint in Negative Moment Area at Pier Top of Hot Rolled-shape steel-UHPC Composite Continuous Beam. Chin. J. Highw. Eng. 2023, 36, 34–47. [Google Scholar]
- Ye, J. Study on Calculation Method of Rigidity and Crack Width for Steel Section RPC Simply Supported Beam. Master’s Thesis, Yangzhou University, Yangzhou, China, 2021. [Google Scholar]
- Federation, C.B.M. Basic Properties and Test Methods of Ultra-High Performance Concrete; Construction Industry Press: Beijing, China, 2018. [Google Scholar]
- Committe, N.C.S.T. Reactive Powder Concrete; Construction Industry Press: Beijing, China, 2015. [Google Scholar]
- Deng, N.; Long, Y.; Sun, L.; Xia, D. Magnetic flux sensor and its application in bridge engineering. In Proceedings of the 18th National Bridge Academic Conference, Tianjing, China, 1–2 May 2008; pp. 643–648. [Google Scholar]
- Jia, J.; Meng, G.; Zhu, W. Experimental study on flexural performance and bearing capacity analysis of prestressed steel ultra-high-strength concrete composite beams. J. Build. Struct. 2014, 35, 1–10. [Google Scholar]
- Li, F. Experimental Research on Bearing Capacity of Prestressed Steel Reinforced Concrete Beams. Master’s Thesis, Chongqing University, Chongqing, China, 2007. [Google Scholar]
- Fu, C.; Li, Y.; Liang, S. Experimental study on flexural performance of prestressed steel-concrete simply supported beams. J. Build. Struct. 2007, 3, 62–73. [Google Scholar]
- Tang, C.; Zhou, K.; Zhang, B. Experimental study on flexural bearing capacity of unbonded prestressed steel-concrete beams. J. Railw. Sci. Eng. 2018, 15, 1271–1277. [Google Scholar]
- Su, J.-Z.; Ma, X.-L.; Chen, B.-C.; Sennah, K. Full-scale bending test and parametric study on a 30-m span prestressed ultra-high performance concrete box girder. Adv. Struct. Eng. 2019, 23, 1276–1289. [Google Scholar] [CrossRef]
- Lv, L.; Wang, Y.; Fu, C.; Zheng, W. Values of basic mechanical properties of reactive powder concrete. J. Harbin Inst. Technol. 2014, 46, 1–9. [Google Scholar]
- Li, H.; Guo, X.; Duan, J. Numerical Simulation of Steel-Reinforced Reactive Powder Concrete Beam Based on Bond-Slip. Materials 2021, 14, 4176. [Google Scholar] [CrossRef]
- Loi, T. Research on Finite Element Modeling and Performance Analysis of Unbonded Prestressed Beams. Master’s Thesis, Zhejiang University, Zhejiang, China, 2005. [Google Scholar]


| Beam Number | I-Shaped Steel (mm) | Prestressed Tendons (Root) | Tension Control Stress (MPa) |
|---|---|---|---|
| PSRUHPC (unbonded prestressed steel UHPC) | 140 × 80 × 5.5 × 9.1 | 2 | 0.7 fptk |
| PRUHPC (unbonded prestressed UHPC) | / | 2 | 0.7 fptk |
| SRUHPC (unbonded prestressed UHPC) | 140 × 80 × 5.5 × 9.1 | / | / |
| Specimen Number | Cracking Pcr/kN | I-Shaped Yield Psy/kN | Longitudinal Tendon Yield Pry/kN | Ultimate Load Pu/kN | Destruction Form |
|---|---|---|---|---|---|
| PSRUHPC | 118.04 | 180.00 | 206.07 | 298.75 | I-shaped steel, ordinary steel yielding, UHPC crushing in the compression zone |
| PRUHPC | 105.52 | / | 153.68 | 192.32 | Ordinary steel bar yielding, UHPC crushing in the compression zone |
| SRUHPC | 78.58 | 117.6 | 199.22 | 258.85 | I-shaped steel, ordinary steel yielding, UHPC crushing in the compression zone |
| Specimen Number | Section Steel Yield Displacement Δsy/mm | Longitudinal Bar Yield Displacement Δry/mm | Limit Displacement Δu/mm | Δu/Δsy | Δu/Δry |
|---|---|---|---|---|---|
| PSRUHPC | 12.1 | 16.6 | 60.7 | 5.0 | 3.7 |
| PRUHPC | / | 14.8 | 30.8 | / | 2.1 |
| SRUHPC | 10.8 | 21.0 | 68.4 | 6.3 | 3.3 |
| Section Steel | Steel Bars | Stirrups | Strand | SBT-UDC(II) | ||
|---|---|---|---|---|---|---|
| Yield strength | 235 | 410 | 300 | 1581 | Compressive strength | 132.05 |
| Ultimate tensile strength | 392 | 480 | 350 | 1860 | Axial compressive strength | 99 |
| Elastic modulus | 2.06 × 10⁵ | 2.0 × 10⁵ | 2.06 × 10⁵ | 1.95 × 10⁵ | Splitting strength | 10.6 |
| / | / | / | / | / | Flexural strength | 16.8 |
| Elastic modulus | 5.3 × 10⁴ | |||||
| Specimen Number | Test Value/kN | Analog Value/kN | Analog Value/Test Value | |
|---|---|---|---|---|
| PSRUHPC | Pcr | 118.04 | 112.34 | 0.95 |
| Psy | 180 | 213.05 | 1.18 | |
| Pry | 206.07 | 242.30 | 1.18 | |
| Pu | 298.75 | 323.13 | 1.08 | |
| PRUHPC | Pcr | 105.52 | 104.37 | 0.99 |
| Pry | 153.68 | 169.02 | 1.10 | |
| Pu | 192.32 | 216.86 | 1.13 | |
| SRUHPC | Pcr | 78.58 | 71.85 | 0.91 |
| Psy | 117.6 | 117.72 | 1.00 | |
| Pry | 199.22 | 195.46 | 0.98 | |
| Pu | 258.85 | 266.09 | 1.03 | |
| Specimen Number | Profile Configuration | Prestressed Tendon Configuration | Tension Longitudinal Bars | Compressed Longitudinal Bars | ||||
|---|---|---|---|---|---|---|---|---|
| a’s/mm | as/mm | Model | Ap/mm2 | hp/mm | σcon/MPa | |||
| PSRUHPC-01 | 110 | 50 | I14 | 278 | 100 | 0.7 fptk | 2C14 | 2C10 |
| PSRUHPC-02 | 110 | 50 | I14 | 278 | 100 | 0.6 fptk | 2C14 | 2C10 |
| PSRUHPC-03 | 110 | 50 | I14 | 278 | 100 | 0.8 fptk | 2C14 | 2C10 |
| PSRUHPC-04 | 110 | 50 | I14 | 278 | 100 | 0.7 fptk | 2C18 | 2C10 |
| PSRUHPC-05 | 110 | 50 | I14 | 278 | 100 | 0.7 fptk | 3C18 | 2C10 |
| PSRUHPC-06 | 110 | 50 | I14 | 278 | 100 | 0.7 fptk | 3C18 | 3C14 |
| PSRUHPC-07 | 80 | 80 | I14 | 278 | 100 | 0.7 fptk | 2C14 | 2C10 |
| PSRUHPC-08 | 80 | 80 | I14 | 278 | 100 | 0.6 fptk | 2C14 | 2C10 |
| PSRUHPC-09 | 80 | 80 | I14 | 278 | 100 | 0.8 fptk | 2C14 | 2C10 |
| PSRUHPC-10 | 80 | 80 | I14 | 278 | 100 | 0.7 fptk | 2C18 | 2C10 |
| PSRUHPC-11 | 80 | 80 | I14 | 278 | 100 | 0.7 fptk | 3C18 | 2C10 |
| PSRUHPC-12 | 80 | 80 | I14 | 278 | 100 | 0.7 fptk | 3C18 | 3C14 |
| PSRUHPC-13 | 80 | 80 | I16 | 278 | 100 | 0.7 fptk | 2C14 | 2C10 |
| PSRUHPC-14 | 80 | 80 | I14 | 278 | 50 | 0.7 fptk | 3C18 | 2C10 |
| PSRUHPC-15 | 80 | 80 | I14 | 278 | 70 | 0.7 fptk | 3C18 | 2C10 |
| PSRUHPC-16 | 80 | 80 | I14-1 | 278 | 100 | 0.7 fptk | 2C14 | 2C10 |
| PSRUHPC-17 | 80 | 80 | I14-2 | 278 | 100 | 0.7 fptk | 2C14 | 2C10 |
| PSRUHPC-18 | 80 | 80 | I14 | 197 | 100 | 0.7 fptk | 3C18 | 2C10 |
| PSRUHPC-19 | 80 | 80 | I14 | 197 | 50 | 0.7 fptk | 3C18 | 2C10 |
| PSRUHPC-20 | 80 | 80 | I14 | 197 | 50 | 0.6 fptk | 3C18 | 2C10 |
| PSRUHPC-21 | 80 | 80 | I14 | 197 | 50 | 0.7 fptk | 2C14 | 2C10 |
| PSRUHPC-22 | 80 | 80 | I14 | 197 | 50 | 0.8 fptk | 2C14 | 2C10 |
| PSRUHPC-23 | 80 | 80 | I14 | 278 | 100 | 0.7 fptk | / | / |
| PSRUHPC-24 | 80 | 80 | I14 | 278 | 50 | 0.7 fptk | / | / |
| PSRUHPC-25 | 110 | 50 | I14-3 | 278 | 100 | 0.7 fptk | 2C14 | 2C10 |
| PSRUHPC-26 | 110 | 50 | I14-4 | 278 | 100 | 0.7 fptk | 2C14 | 2C10 |
| PSRUHPC-27 | 80 | 80 | I14-3 | 278 | 100 | 0.7 fptk | 2C14 | 2C10 |
| PSRUHPC-28 | 80 | 80 | I14-4 | 278 | 100 | 0.7 fptk | 2C14 | 2C10 |
| PSRUHPC-29 | 110 | 50 | I14 | 278 | 100 | 0.7 fptk | / | / |
| PSRUHPC-30 | 110 | 50 | I14 | Same as 1, no bonding | 2C14 | 2C10 | ||
Disclaimer/Publisher’s Note: The statements, opinions and data contained in all publications are solely those of the individual author(s) and contributor(s) and not of MDPI and/or the editor(s). MDPI and/or the editor(s) disclaim responsibility for any injury to people or property resulting from any ideas, methods, instructions or products referred to in the content. |
© 2023 by the authors. Licensee MDPI, Basel, Switzerland. This article is an open access article distributed under the terms and conditions of the Creative Commons Attribution (CC BY) license (https://creativecommons.org/licenses/by/4.0/).
Share and Cite
Deng, N.; Deng, Y.; Duan, J.; Xue, W. Experimental and Numerical Study on the Flexural Behaviors of Unbonded Prestressed I-Shaped Steel Encased in Ultra-High-Performance Concrete Beams. Buildings 2023, 13, 2901. https://doi.org/10.3390/buildings13122901
Deng N, Deng Y, Duan J, Xue W. Experimental and Numerical Study on the Flexural Behaviors of Unbonded Prestressed I-Shaped Steel Encased in Ultra-High-Performance Concrete Beams. Buildings. 2023; 13(12):2901. https://doi.org/10.3390/buildings13122901
Chicago/Turabian StyleDeng, Nianchun, Yanfeng Deng, Jiqiang Duan, and Wenhao Xue. 2023. "Experimental and Numerical Study on the Flexural Behaviors of Unbonded Prestressed I-Shaped Steel Encased in Ultra-High-Performance Concrete Beams" Buildings 13, no. 12: 2901. https://doi.org/10.3390/buildings13122901