
Anomaly Detection Based on LSTM Learning in IoT-Based Dormitory for Indoor Environment Control
Abstract
:1. Introduction
- What data should be collected and what methods should be used to develop technology that comfortably controls the indoor environment?
- Based on big data corresponding to the eight environmental variables collected at one-minute intervals from 20 bedrooms and 20 study rooms in a dormitory between February 2022 and September 2023, we developed an LSTM-AD model for use in indoor environment control. The model was validated based on the measured performance metrics.
- To augment the performance of the developed LSTM-AD model for anomaly detection, we estimated the optimal threshold by comparing multiple thresholds derived through trial and error with the optimal threshold suggested by Noh (2023) [17]. Additionally, we produced graphical representations to compare predicted values against actual values in the test dataset, facilitating a thorough examination of the model’s performance for anomaly detection. To reinforce the model’s validation through visual representations of adequate anomaly detection, we have generated graphs illustrating the anomaly score and the anomaly domain indicated by predicted values. Importantly, the source code for this novel model is openly accessible in the public domain, facilitating its integration into indoor environment control systems.
2. Materials and Methods
2.1. Data
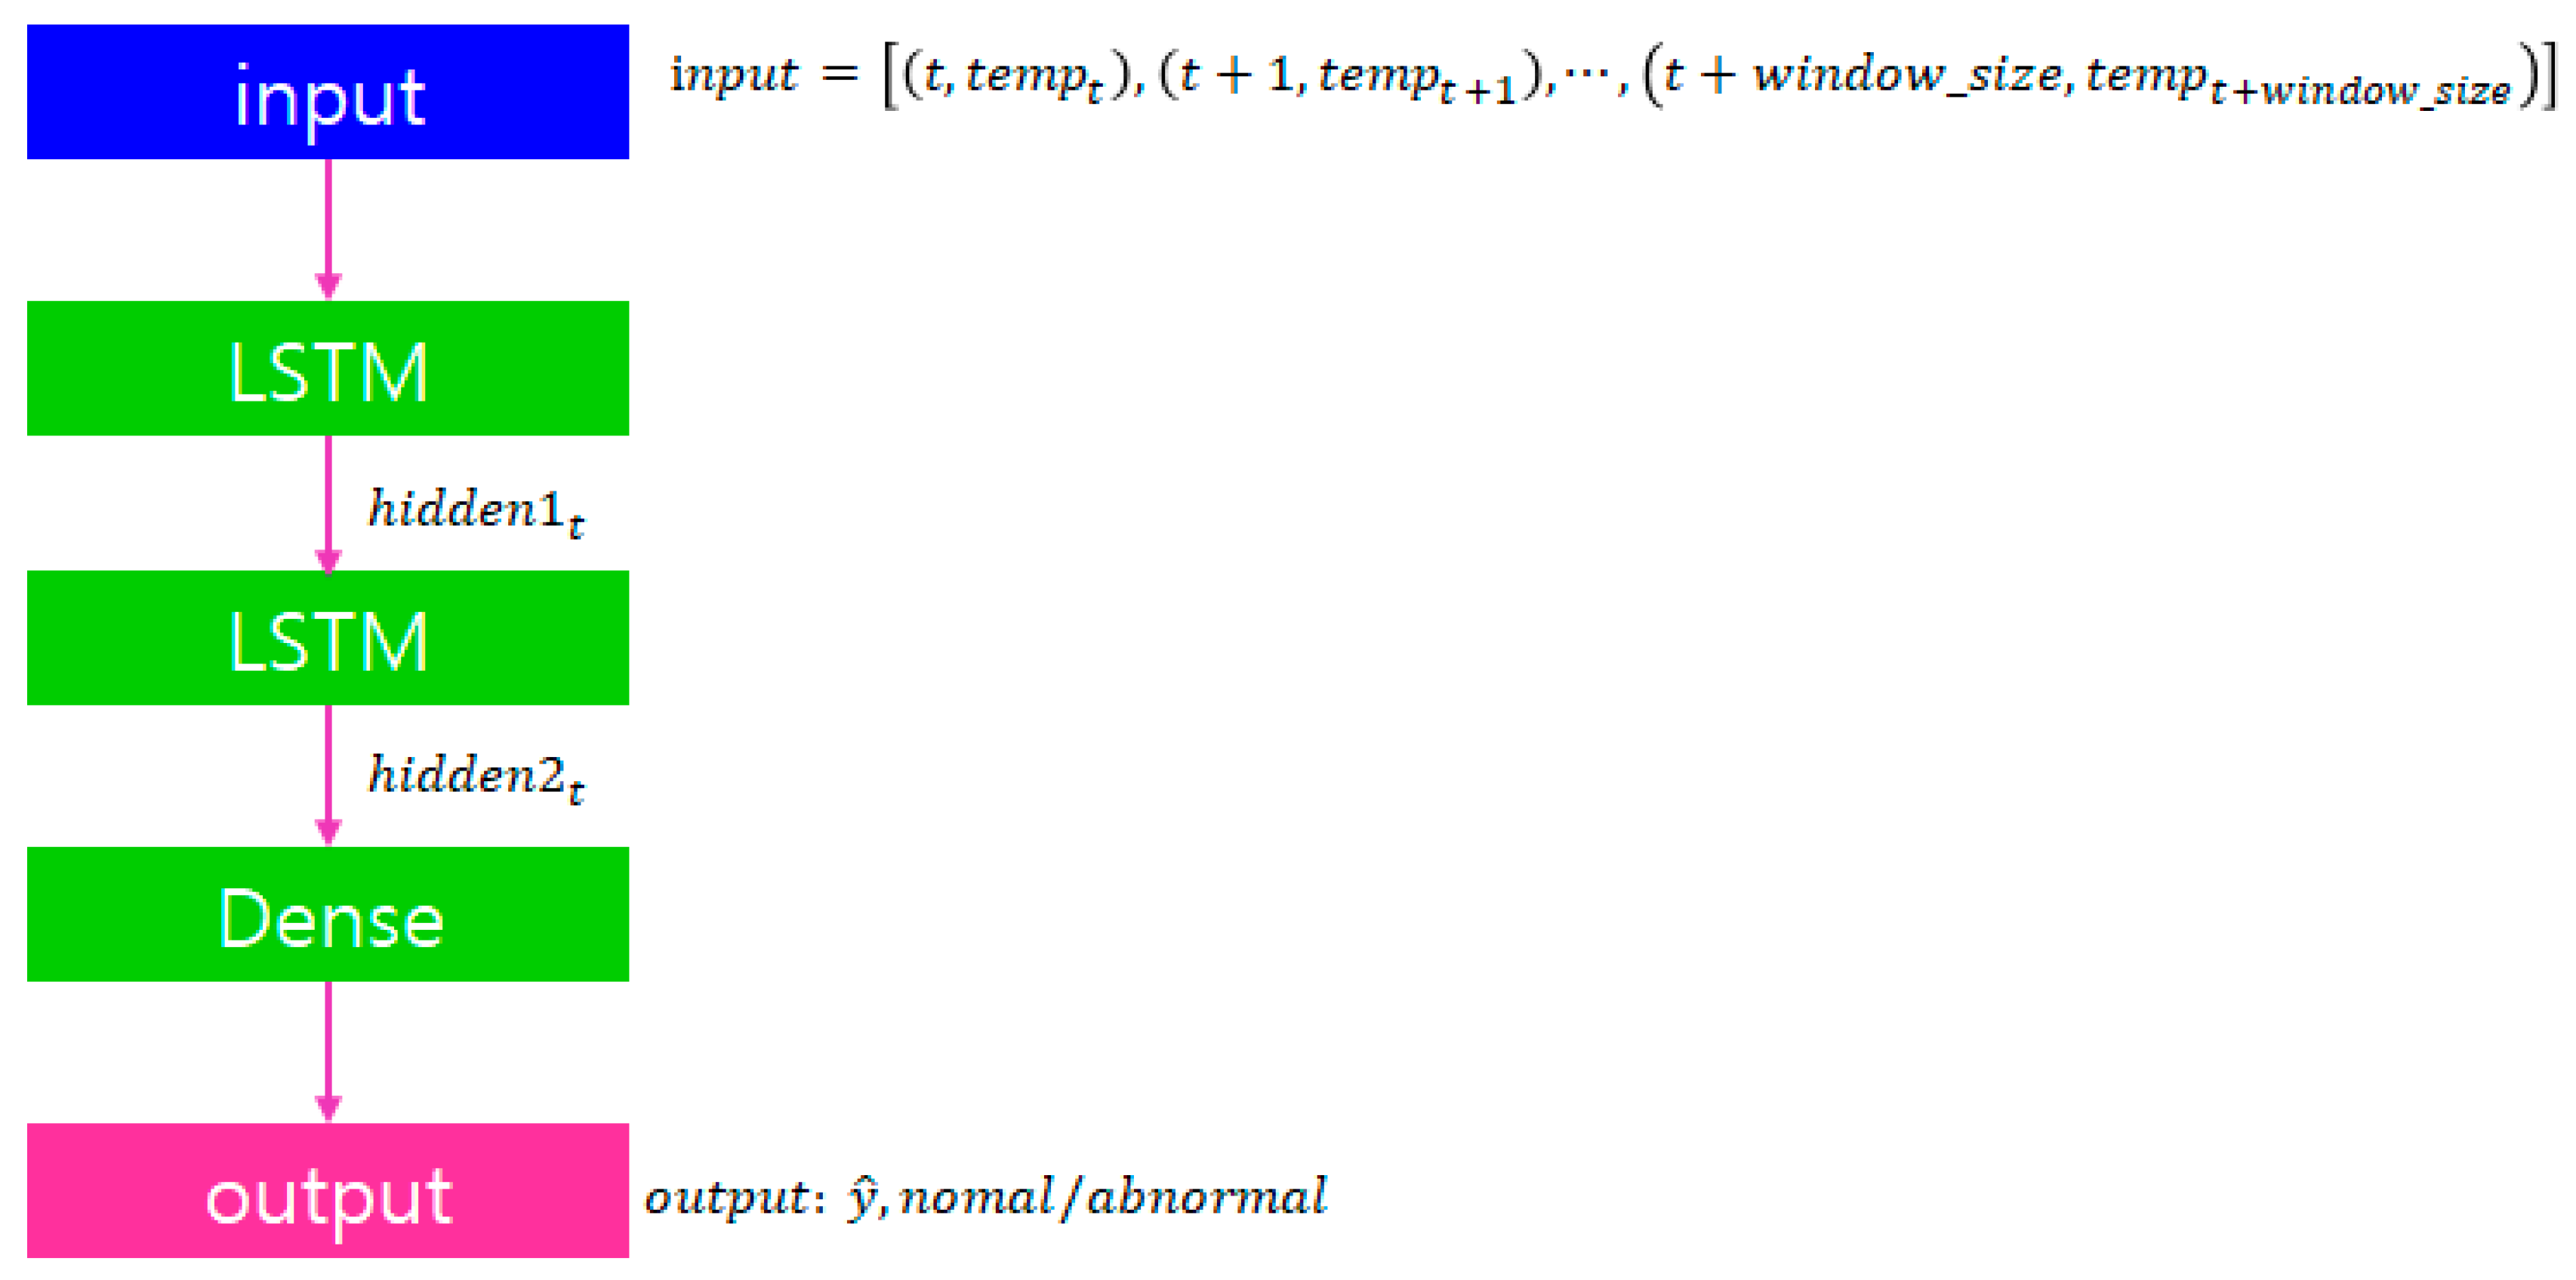
2.2. Model
3. Performance Results
4. Discussion
5. Conclusions
Supplementary Materials
Author Contributions
Funding
Data Availability Statement
Conflicts of Interest
References
- Liu, Y.; Pang, Z.; Karlsson, M.; Gong, S. Anomaly detection based on machine learning in IoT-based vertical plant wall for indoor climate control. Build. Environ. 2020, 183, 107212. [Google Scholar] [CrossRef]
- Kim, J.; Kong, M.; Hong, T.; Jeong, K.; Lee, M. Physiological response of building occupants based on their activity and the indoor environmental quality condition changes. Build. Environ. 2018, 145, 96–103. [Google Scholar] [CrossRef]
- Kim, J.; Hong, T.; Jeong, J.; Koo, C.; Kong, M. An integrated psychological response score of the occupants based on their activities and the indoor environmental quality condition changes. Build. Environ. 2017, 123, 66–77. [Google Scholar] [CrossRef]
- Kim, J.; Hong, T.; Kong, M.; Jeong, K. Building occupants’ psychophysiological response to indoor climate and CO2 concentration changes in office buildings. Build. Environ. 2020, 169, 106596. [Google Scholar] [CrossRef]
- IoT Analytics. Predictive Maintenance Report 2019–2024; IoT Analytics: Hamburg, Germany, 2019; Available online: https://iot-analytics.com/product/predictive-maintenance-report-2019-2024/ (accessed on 30 September 2023).
- Dai, X.; Liu, J.; Zhang, X. A review of studies applying machine learning models to predict occupancy and window-opening behaviors in smart buildings. Energy Build. 2020, 223, 110159. [Google Scholar] [CrossRef]
- Mason, K.; Grijalva, S. A review of reinforcement learning for autonomous building energy management. Comput. Electr. Eng. 2019, 78, 300–312. [Google Scholar] [CrossRef]
- Liu, X.; Nielsen, P.S. Scalable prediction-based online anomaly detection for smart meter data. Inf. Syst. 2018, 77, 34–47. [Google Scholar] [CrossRef]
- Wang, Z.; Parkinson, T.; Li, P.; Lin, B.; Hong, T. The Squeaky wheel: Machine learning for anomaly detection in subjective thermal comfort votes. Build. Environ. 2019, 151, 219–227. [Google Scholar] [CrossRef]
- Shi, X.; Lu, W.; Zhao, Y.; Qin, P. Prediction of indoor temperature and relative humidity based on cloud database by using an improved BP neural network in Chongqing. IEEE Access 2018, 6, 30559–30566. [Google Scholar] [CrossRef]
- Kim, C.; Lee, J.; Kim, R.; Park, Y.; Kang, J. DeepNAP: Deep neural anomaly pre-detection in a semiconductor fab. Inform. Sci. 2018, 457–458, 1–11. [Google Scholar] [CrossRef]
- Xu, R.; Cheng, Y.; Liu, Z.; Xie, Y.; Yang, Y. Improved Long Short-Term Memory based anomaly detection with concept drift adaptive method for supporting IoT services. Future Gener. Comput. Syst. 2020, 112, 228–242. [Google Scholar] [CrossRef]
- Taylor, A.; Leblanc, S.; Japkowicz, N. Anomaly detection in automobile control network data with long short-term memory networks. In Proceedings of the 2016 IEEE International Conference on Data Science and Advanced Analytics, DSAA, Montreal, QC, Canada, 17–19 October 2016; pp. 130–139. [Google Scholar]
- Han, J.; Lin, H.; Qin, Z. Prediction and Comparison of In-Vehicle CO2 Concentration Based on ARIMA and LSTM Models. Appl. Sci. 2023, 13, 10858. [Google Scholar] [CrossRef]
- Ji, Z.; Gan, H.; Liu, B. A Deep Learning-Based Fault Warning Model for Exhaust Temperature Prediction and Fault Warning of Marine Diesel Engine. Mar. Sci. Eng. 2023, 11, 1509. [Google Scholar] [CrossRef]
- Malhotra, P.; Vig, L.; Shroff, G.; Agarwal, P. Long Short Term Memory Networks for Anomaly Detection in Time Series. In Proceedings of the European Symposium on Artificial Neural Networks, Bruges, Belgium, 22–23 April 2015; pp. 89–94. [Google Scholar]
- Noh, S.-H. Comparing the Performance of Corporate Bankruptcy Prediction Models Based on Imbalanced Financial Data. Sustainability 2023, 15, 4794. [Google Scholar] [CrossRef]
- Noh, S.-H. Analysis of Gradient Vanishing of RNNs and Performance Comparison. Information 2022, 12, 442. [Google Scholar] [CrossRef]


| Variable | Definition and Unit |
|---|---|
| Temperature | ) |
| Relative Humidity | Relative humidity (%) |
| CO2 | Carbon dioxide concentration (ppm) |
| Dust_pm_0.1 | ) |
| Dust_pm_1.0 | ) |
| Dust_pm_2.5 | ) |
| Illuminance | Illuminance (lux) |
| TVOC | Total Volatile Organic Compounds level (ppb) |
| Bedroom No. | Variable | Mean | Standard Deviation | 95% Confidence Interval |
| #303 | Temperature | 24.3909 | 2.7604 | [18.9801, 29.8012] |
| Humidity | 54.7534 | 15.1651 | [25.0305, 84.4764] | |
| CO2 | 845.1237 | 704.019 | [0, 2224.9760] | |
| Dust_pm_0.1 | 10.7271 | 10.5005 | [0, 31.3077] | |
| Dust_pm_1.0 | 11.1798 | 11.2659 | [0, 33.2606] | |
| Dust_pm_2.5 | 10.7981 | 10.6723 | [0, 31.7155] | |
| Illuminance | 34.0503 | 49.4213 | [0, 130.9143] | |
| TVOC | 440.3392 | 1022.464 | [0, 2444.332] | |
| Study Room No. | Variable | Mean | Standard Deviation | 95% Confidence Interval |
| #303 | Temperature | 22.7116 | 2.2795 | [18.2437, 27.1794] |
| Humidity | 51.4847 | 17.2598 | [17.6561, 85.3132] | |
| CO2 | 739.9548 | 310.6303 | [131.1307, 1348.7790] | |
| Dust_pm_0.1 | 12.4174 | 14.5863 | [0, 41.0060] | |
| Dust_pm_1.0 | 12.771 | 23.0179 | [0, 57.8853] | |
| Dust_pm_2.5 | 12.5012 | 16.598 | [0, 45.0327] | |
| Illuminance | 5.8397 | 5.5818 | [0, 16.7799] | |
| TVOC | 591.1457 | 2074.741 | [0, 4657.5630] |
| Location | Variable | Mean | Standard Deviation | 95% Confidence Interval |
|---|---|---|---|---|
| 20 bedrooms on average | Temperature | 24.4377 | 3.40808 | [17.7579, 31.1174] |
| Humidity | 59.07272 | 17.38868 | [24.9916, 93.1539] | |
| CO2 | 958.64188 | 886.38118 | [0, 2695.9170] | |
| Dust_pm_0.1 | 24.43332 | 120.88044 | [0, 261.3546] | |
| Dust_pm_1.0 | 24.85702 | 121.24792 | [0, 262.4986] | |
| Dust_pm_2.5 | 24.50702 | 120.96248 | [0, 261.5891] | |
| Illuminance | 50.68842 | 61.80158 | [0, 171.8173] | |
| TVOC | 613.73264 | 1390.1088 | [0, 3338.295] | |
| 20 study rooms on average | Temperature | 23.5726 | 7.16634 | [9.5285, 37.6184] |
| Humidity | 52.02044 | 19.97088 | [12.8782, 91.1626] | |
| CO2 | 758.34338 | 541.98324 | [64.9457, 1820.6110] | |
| Dust_pm_0.1 | 10.41324 | 12.14486 | [0,34.2167] | |
| Dust_pm_1.0 | 10.65804 | 14.25156 | [0, 38.5906] | |
| Dust_pm_2.5 | 10.45922 | 12.63612 | [0, 35.2256] | |
| Illuminance | 10.4937 | 11.41642 | [0, 33.1015] | |
| TVOC | 576.94022 | 1651.17796 | [0, 3813.1890] |
| Prediction Outcome | |||
|---|---|---|---|
| Normal State | Abnormal State | ||
| Actual outcome | Normal state | True positive (TP) | False negative (FN) |
| Abnormal state | False positive (FP) | True negative (TN) | |
| Precision | Recall | F1 Score | AUC | |
|---|---|---|---|---|
| Temperature | 0.95 | 0.36 | 0.52 | 0.1789 |
| Humidity | 0.89 | 0.43 | 0.58 | 0.2156 |
| CO2 | 0.96 | 0.99 | 0.98 | 0.7850 |
| Dust_pm_0.1 | 0.96 | 1.0 | 0.98 | 0.5 |
| Dust_pm_1.0 | 0.96 | 1.0 | 0.98 | 0.5 |
| Dust_pm_2.5 | 0.96 | 1.0 | 0.98 | 0.5 |
| Illuminance | 0.99 | 0.99 | 0.99 | 0.84 |
| TVOC | 0.94 | 1.0 | 0.97 | 0.5 |
Disclaimer/Publisher’s Note: The statements, opinions and data contained in all publications are solely those of the individual author(s) and contributor(s) and not of MDPI and/or the editor(s). MDPI and/or the editor(s) disclaim responsibility for any injury to people or property resulting from any ideas, methods, instructions or products referred to in the content. |
© 2023 by the authors. Licensee MDPI, Basel, Switzerland. This article is an open access article distributed under the terms and conditions of the Creative Commons Attribution (CC BY) license (https://creativecommons.org/licenses/by/4.0/).
Share and Cite
Noh, S.-H.; Moon, H.J. Anomaly Detection Based on LSTM Learning in IoT-Based Dormitory for Indoor Environment Control. Buildings 2023, 13, 2886. https://doi.org/10.3390/buildings13112886
Noh S-H, Moon HJ. Anomaly Detection Based on LSTM Learning in IoT-Based Dormitory for Indoor Environment Control. Buildings. 2023; 13(11):2886. https://doi.org/10.3390/buildings13112886
Chicago/Turabian StyleNoh, Seol-Hyun, and Hyeun Jun Moon. 2023. "Anomaly Detection Based on LSTM Learning in IoT-Based Dormitory for Indoor Environment Control" Buildings 13, no. 11: 2886. https://doi.org/10.3390/buildings13112886