Article

Fragility Analysis of the Main Building–Coal Conveyor Trestle Interaction System of a Thermal Power Plant

1
Key Laboratory of Earthquake Engineering and Engineering Vibration, Institute of Earthquake Mechanics, China Earthquake Administration, Harbin 150080, China
2
China Energy Engineering Group Liaoning Electric Power Survey & Design Co., Ltd., Shenyang 110170, China
*
Author to whom correspondence should be addressed.
Buildings 2023, 13(11), 2864; https://doi.org/10.3390/buildings13112864
Submission received: 19 October 2023 / Revised: 13 November 2023 / Accepted: 14 November 2023 / Published: 16 November 2023
(This article belongs to the Special Issue Seismic Resistance of Buildings and Urban Systems)

Abstract

:
Thermal power plants play a crucial role in the power system as critical lifeline infrastructure. In order to meet the production process requirements, the main building of a thermal power plant is often connected to a coal conveyor trestle. This study focuses on investigating the seismic interaction between the common three-row reinforced concrete frame-bent main building and the steel trestle in a circulating fluidized bed (CFB) unit. The objective is to assess the influence of the trestle on the main building and understand the failure mode of the trestle structure. The seismic interaction is analyzed through fragility analysis based on Incremental Dynamic Analysis (IDA). The results indicate that the trestle has minimal influence on the main building, except during the large deformation stage. The study identifies the failure mode of the coal conveyor trestle as excessive relative displacement along the longitudinal direction at the connection points, leading to collisions or falls. A seismic demand model based on longitudinal relative displacement is developed to obtain the fragility curve for the trestle structure. These findings offer valuable insights for assessing the seismic performance of thermal power plants.

1. Introduction

Thermal power generation plays a significant role in China’s power production, and power plant structures are crucial industrial buildings that form an integral part of lifeline engineering.
To meet the demands of production technology, the central main building of a thermal power plant is designed as a spacious system, incorporating both multi-story and single-story sections. Typically, a reinforced concrete frame-bent structure system is employed, resulting in irregularities in structural arrangement and load distribution [1]. The main building is typically arranged in a sequential order, consisting of the steam turbine room, deoxygenation room, coal bunker room (or combined deoxygenation and coal bunker room), and boiler room. However, the adoption of a combined deoxygenation and coal bunker room results in a single-span frame-bent structure, which poses challenges for earthquake resistance. In coal-fired power plants, the transportation of coal to the coal bunker layer of the coal bunker room requires the use of belt conveyors. Consequently, the main building of coal-fired power plants needs to be connected to the coal conveyor trestle. To minimize the impact of the trestle on the main building’s structure, it is common practice to establish a longitudinal sliding connection between the main building and the trestle, while also implementing horizontal constraints. Coal conveyor trestles in coal-fired power plants often employ concrete or steel supports with steel truss structures. These trestle supports are highly flexible structures with significant sway, exhibiting weak longitudinal stiffness and experiencing considerable longitudinal displacement during earthquake excitation [2,3,4]. During an earthquake, the join between the trestle and the main building is susceptible to collision or detachment due to excessive relative displacement along the longitudinal direction of the trestle. This has emerged as the primary type of earthquake damage observed in coal conveyor trestles.
The investigation of the interaction between the irregular single frame-bent structure and the trestle structure is of great practical importance in understanding the seismic response of both structures. Currently, research on the main building structure and coal conveyor trestle in thermal power plants primarily focuses on nonlinear analysis, optimal design, and the seismic performance of individual structures. However, there is a lack of consideration for the interaction between the main building and the coal conveyor trestle, as well as the fragility analysis of this structural system.
The fragility analysis of a structure refers to the probability of the structure reaching or exceeding a certain limit state under various earthquake intensities. It represents the overall seismic performance of the structure in a probabilistic sense and holds significant application value for seismic design, reinforcement, and maintenance decision-making. Conducting a fragility analysis on the main building structure and the connected coal conveyor trestle in thermal power plants is crucial for evaluating the earthquake resilience of the structure itself and even of the entire power plant.
This paper focuses on a common three-row reinforced concrete frame-bent main building structure and the steel support–steel truss structure of the coal conveyor trestle. It considers the interaction between the trestle and the main building structure, aiming to provide a foundation for the seismic resilience evaluation of thermal power plants.

2. Finite Element Modeling and Modal Analysis

The prototype for this study is the reinforced concrete frame-bent main building of a circulating fluidized bed (CFB) unit that is currently in operation. The main building consists of three rows (designated as A, B, and C axes), with the coal bunker room and deoxygenating room merged into a single-span frame structure. The steam turbine room and combined deoxygenating coal bunker room are arranged sequentially, as illustrated in Figure 1. The transverse structural system of the main building comprises the frame-bent structure, which includes the outer column of the steam turbine room, the roof of the steam turbine room, and the frame of the combined deoxygenating coal bunker room. The longitudinal structural system of the steam turbine room and combined deoxygenating coal bunker room adopts a cast-in-place reinforced concrete frame structure.
The combined deoxygenating coal bunker room incorporates cast-in-place reinforced concrete beams and slabs on each floor. The roof of the steam turbine room is constructed using a trapezoidal steel roof truss with a lightweight insulation board.
The project site area is categorized as Class II, with seismic precautionary intensity 7 and a design basic acceleration of ground motion set at 0.15 g. Based on the Standard for Classification of Seismic Protection of Building Constructions (GB50223-2008) [5], Code for Seismic Design of Buildings (GB 50011-2010) (2016 version) [6], and Technical Code for the Design of Civil Structure of Fossil-fired Power Plant (DL5022-2012) [7], the seismic fortification category for this project is standard fortification (Class C). Both the main building and the coal conveyor trestle have a seismic fortification category of Class C, and the earthquake action is calculated based on intensity 7 (0.15 g). Seismic measures are implemented accordingly for intensity 7.
This study examines the interaction between the coal conveyor trestle and the main building through the establishment of two models. Model A represents an independent frame-bent structure of the main building, where the influence of the trestle on the main building is considered through applied loads. Model B consists of a frame-bent structure of the main building connected to a four-span steel truss-steel support coal conveyor trestle. The lower end of the trestle is fixed to the ground, while the upper end is connected to the main building through longitudinally sliding transversely limited supports.
In this paper, the model is established using structural analysis software SAP2000 V22. Beams, columns, trusses, and bracing members are modeled using beam elements, and floors and roofs are simulated using shell elements. The steel roof trusses and roof braces of the main building roof system are modeled according to the actual situation. The three-dimensional numerical models A and B are shown in Figure 2. The nonlinearity of concrete beam-column materials is simulated by plastic hinges, which describe the relationship between the overall force and the displacement of the frame section. Moment hinges are added at both ends of the frame beam, and P-M2-M3 hinges are added at both ends of the frame column, and the properties of plastic hinges are determined by the reinforcement of the beam or column section. The damping used in the model is Rayleigh classical damping, with a value of 0.05.
Modal analysis was performed on both models and the first three mode shapes were obtained for each model, as shown in Figure 3 and Figure 4.

3. Fragility Analysis

3.1. Incremental Dynamic Analysis

Incremental dynamic analysis (IDA) [8] involves conducting a large number of nonlinear response history analyses using ground motions that are systematically scaled to increasing earthquake intensities until collapse occurs. This approach provides a distribution of results at different intensities, which can be used to generate a collapse fragility curve.
The uncertainty in seismic ground motions is an important factor in the reliability of Incremental Dynamic Analysis (IDA) results [9]. Therefore, selecting an adequate number of ground motion records with a rich spectrum is crucial for conducting IDA and accurately assessing the seismic performance of structures.
Recently, a number of research studies related to the properties of earthquake ground motions that affect geotechnical and structural systems have been actively conducted [10,11,12]. In this paper, the ground motions are selected from the ground motion sets developed by Jack W. Baker (2011) [10] from the PEER ground motion database, which is used for lifeline engineering. The ground motions used are all three-dimensional ground motions, and there are 40 ground motions, which are selected from four sets, namely Set #1A, Set #1B, Set #2, and Set #3. Each set contains 10 three-dimensional ground motions. The four sets of ground motions represent four different site features. Set #1A represents the broadband ground motion of the soil site with high magnitude and close fault distance (MW = 7, R = 10 km, soil site); Set #1B represents the broadband ground motion of the soil site with far fault distance (MW = 6, R = 25 km, soil site); Set #2 represents the broadband ground motion based on the rock site (MW = 7, R = 10 km, rock site); and Set #3 consists of the ground motions containing strong velocity pulses of varying periods in their strike-normal components. The term “soil site” refers to seismic ground motions with Vs30 values between 200 m/s and 400 m/s, and the term “rock site” refers to seismic ground motions with Vs30 > 625 m/s.
Acceleration response spectra were generated for 5% of critical damping. The ground motions from each set were normalized, and the acceleration response spectra generated for 5% of critical damping are drawn in Figure 5. The response spectrum curves also include the response spectrum mean of each set of ground motion, as well as the response spectrum mean plus/minus standard deviation. Additionally, the diagram depicts the normalized design spectrum curves of the prototype power plant.
A total of 40 strong earthquake records were input in three directions along the two main axes of the structure: horizontal and vertical. The amplitude ratio of the three components of each ground motion was maintained consistently, and the three components were uniformly amplitude-modulated using the HUNT&FILL algorithm [13]. The amplitude modulation step was set at 0.1 g with a step increment of 0.05 g. The results of the Incremental Dynamic Analysis (IDA) analysis were connected using finite discrete points, and a complete IDA curve was obtained through interpolation to reduce computational costs.
To study the seismic performance of the main building structure, the maximum inter-story drift ratio was selected as the demand parameter (DP). For the trestle structure, the maximum relative displacement at the sliding bearing of the connection point between the main building structure and the trestle structure was chosen as the demand parameter (DP). The peak acceleration of the ground motion was selected as the intensity measure (IM).
The decision to utilize Peak Ground Acceleration (PGA) as the seismic intensity measure in this study was based on several factors. Firstly, PGA is widely employed as a seismic intensity measure in Chinese seismic design codes and regulations. Secondly, PGA provides a simple and intuitive measure of seismic intensity, offering a clear indication of the severity of ground motion. Lastly, this study forms part of the vulnerability and resilience assessment of the entire thermal power plant system, encompassing various structures and equipment. Selecting PGA as the seismic intensity measure ensures better uniformity and consistency within the context of the entire power plant system. Considering these factors, PGA was deemed the most appropriate seismic intensity measure for our research objectives.
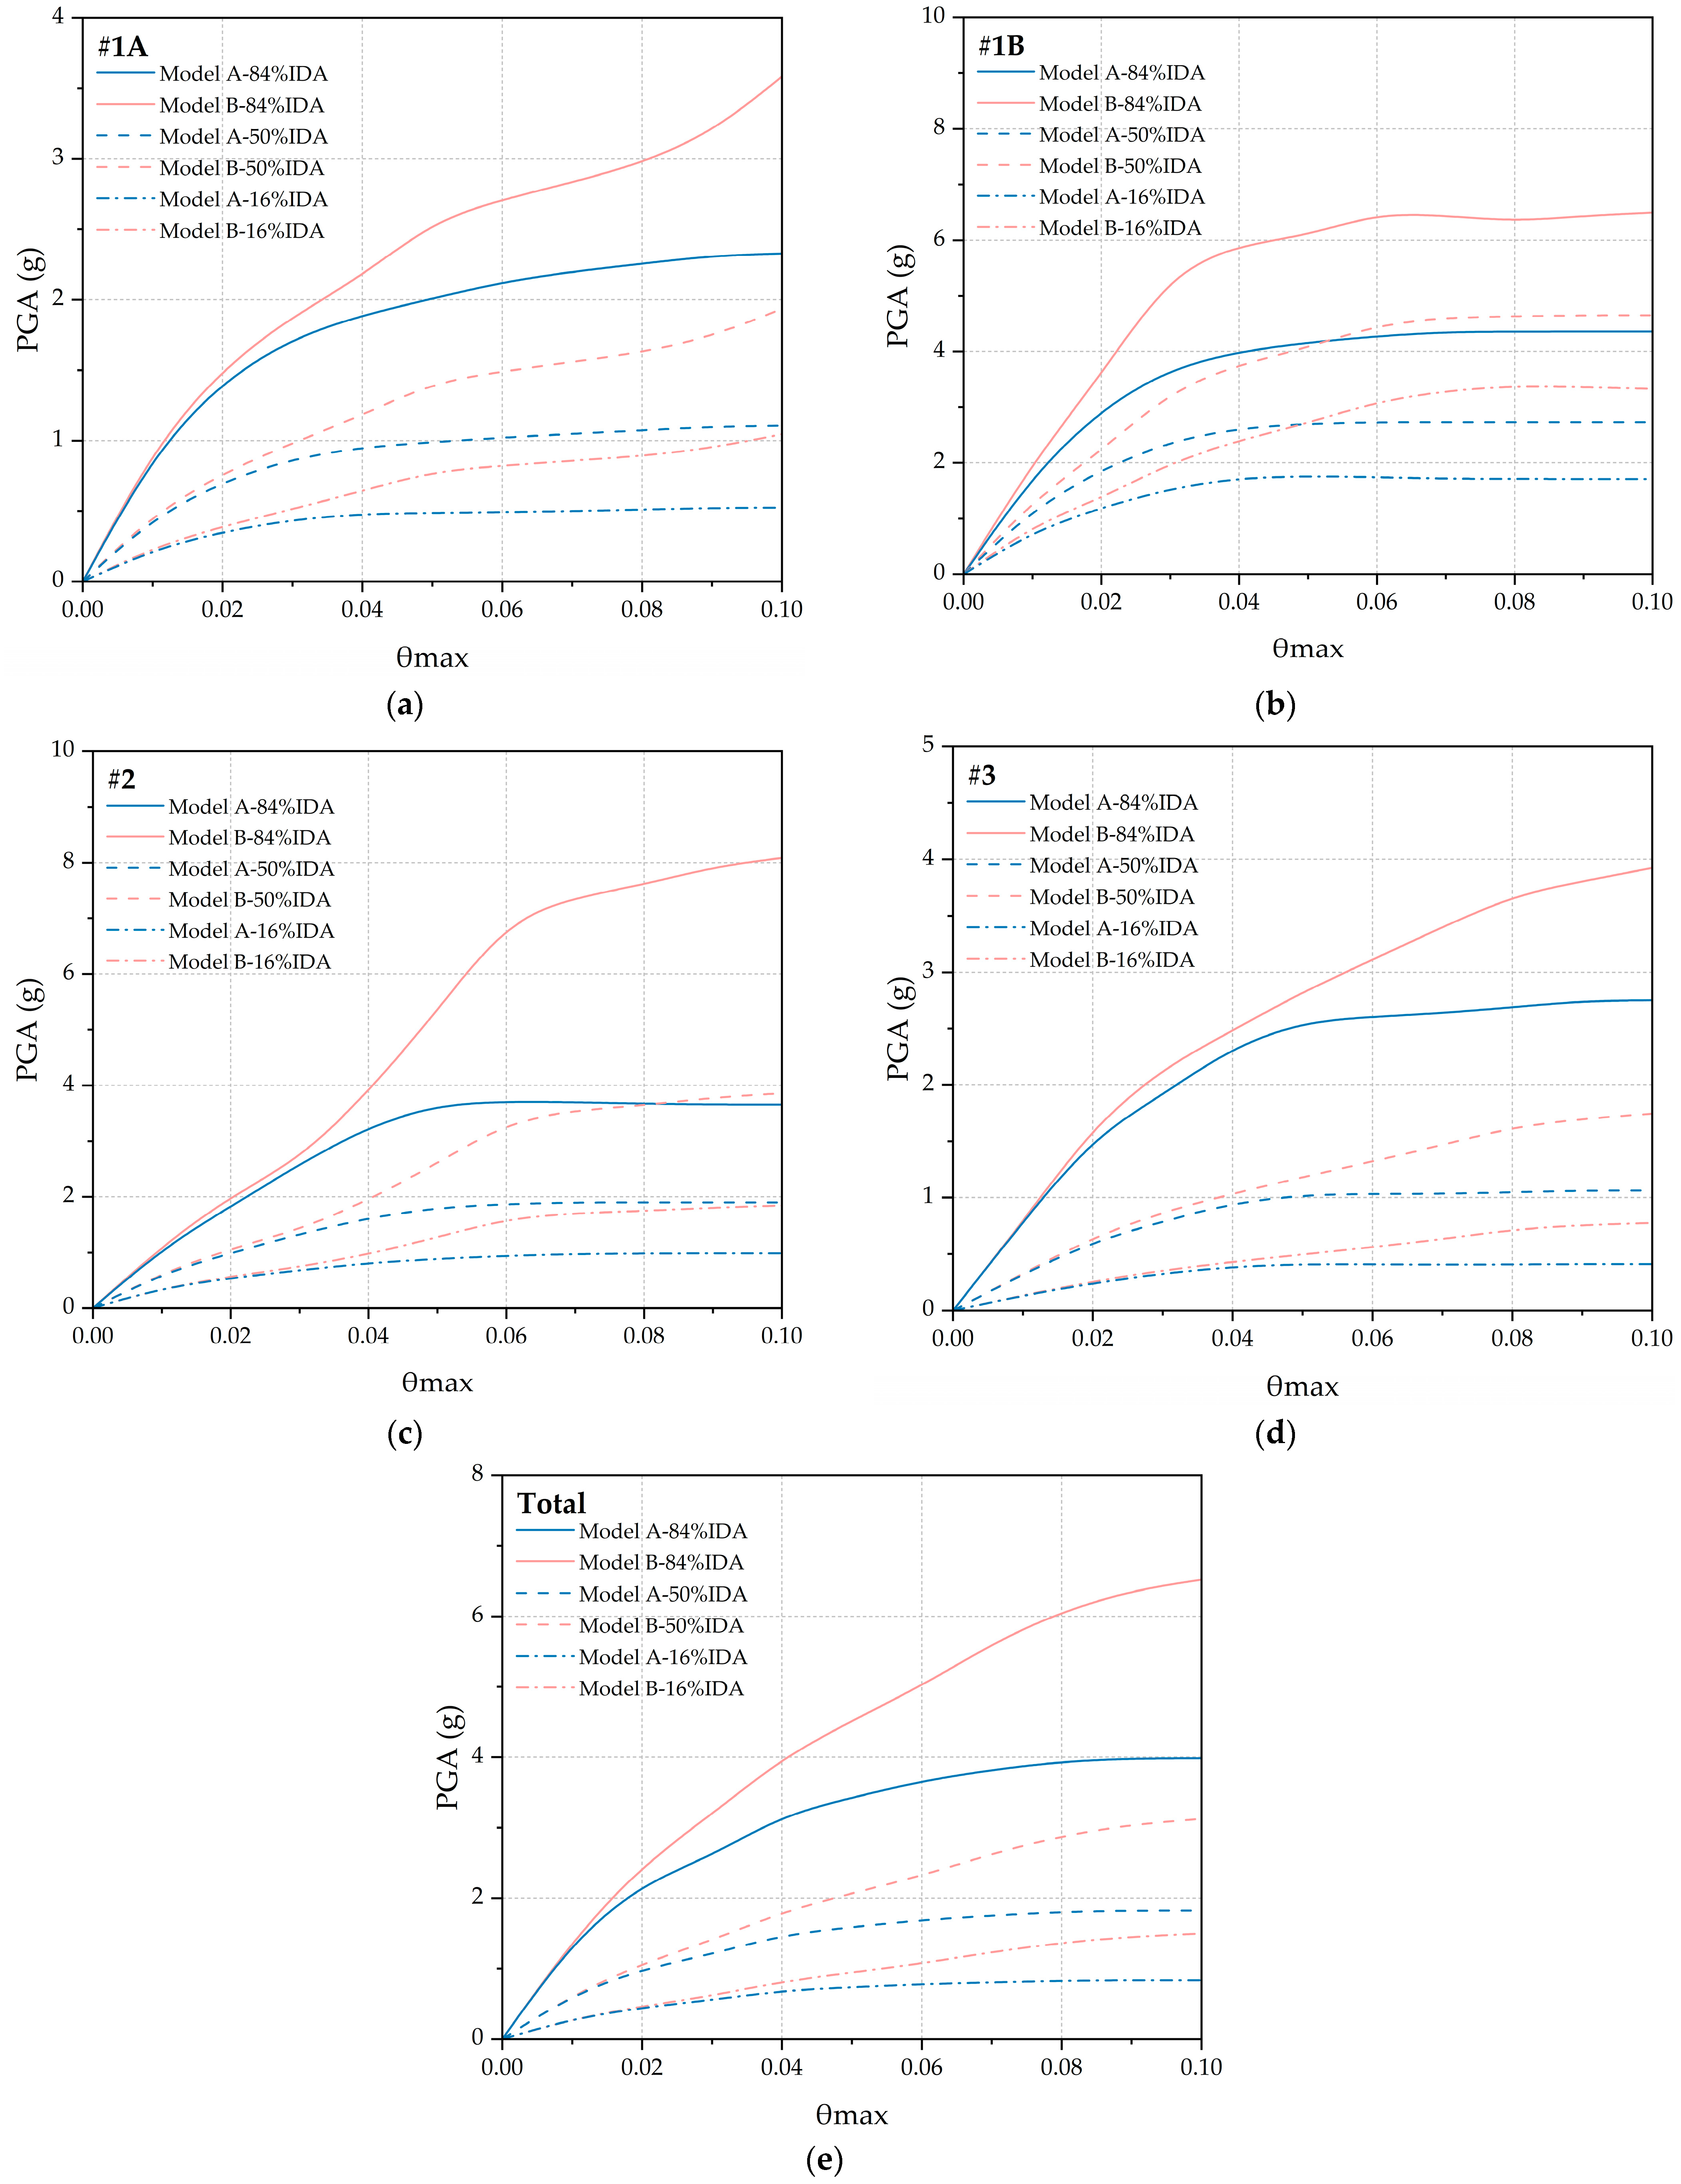
A large number of IDA curves were obtained through the IDA analysis of two models using 40 seismic records. Statistical analysis of the IDA data allowed us to derive the 16%, 50%, and 84% quantile curves, which characterize the average level and variability of all IDA curves. To investigate the influence of the trestle on the main building structure, we plotted the 16th, 50th, and 84th percentile IDA curves of Model A and Model B, using the maximum inter-story drift ratio as the demand parameter (DM) and peak ground acceleration (PGA) as the intensity measure (IM). This graphical representation facilitates comparative analysis.
Figure 6 displays the IDA curves of the maximum inter-story displacement angle for the main building structure of Model A and Model B under four sets of ground motions. Under the ground motions of Set #1A and Set #3, the structure experiences the most rapid increase in the maximum inter-story drift ratio with an increase in PGA. For the ground motions of Set #1B, the increase in the maximum inter-story drift ratio is relatively slower. Under the ground motions of Set #2, the increase falls between the rates observed for Sets #1A/#3 and Set #1B.
When the maximum inter-story drift ratio is less than or equal to 0.02, the IDA curves for Model A and Model B almost overlap. This indicates that the trestle has minimal impact on the main building structure under the seismic actions of Set #1A, Set #2, and Set #3 in the small deformation range. However, as the PGA increases and the maximum inter-story drift ratio reaches 0.02, Model A, which does not consider the influence of trestle, experiences a rapid decrease in stiffness. In contrast, Model B, which considers the influence of the trestle, exhibits a slower decrease in stiffness, maintaining better ductility.

3.2. Damage States

The seismic demand of a structure or component refers to the minimum capacity required for the structure to maintain safety and functionality during an earthquake, representing the maximum response induced by seismic forces on the structure. The maximum inter-story drift ratio is an effective measure to assess the main failure mechanisms and performance level of a structure under nonlinear conditions. Its concept is straightforward and easy to apply. Therefore, the maximum inter-story drift ratio of the main building structure is selected as the seismic demand parameter of the main building structure.
According to “Classification of Earthquake Damage to Buildings and Special Structures” (GB/T24335-2009) [14], the damage of a building is divided into five levels: essentially intact, slight damage, moderate damage, severe damage, and collapse.
The FEMA 356 [15] defines three limit states: Immediate Occupancy (IO), Life Safety (LS), and Collapse Prevention (CP).
The draft version of the “Technical Code for the Design of Civil Structure of Fossil-fired Power Plants” (unpublished, used for revising DL5022-2012) introduces the seismic performance-based design of the main building of power plants for the first time, and provides minimum performance objectives. Under frequent seismic events, the structure should remain intact and operational. Under design-level seismic events, the structure may experience moderate damage but can still be used after repair or reinforcement. Under rare seismic events, the structure may experience severe damage but can continue to be used after major repairs. The draft also specifies the maximum inter-story drift ratio limits for the main powerhouse structure under frequent, design-level, and rare seismic events, as in 1/550, 1/110, and 1/55, respectively. Furthermore, Reference [16] provides performance levels and corresponding structural performance indicators for the frame-bent structures in power plants.
Reference [16] provides performance levels for frame-bent structures in thermal power plants, which are categorized into four damage states along with their corresponding demand parameters for the main building structure, as presented in Table 1.
Coal conveyor trestle structures are commonly found in coal mines and power plants. Based on existing seismic damage investigation and research, it is generally observed that the steel support-truss structure of the coal conveyor trestle is less prone to self-destruction during earthquakes. However, seismic damage is often concentrated at the connection points between the trestle and adjacent buildings, where excessive relative displacements can lead to collisions or collapses. Therefore, the maximum relative displacement at the sliding bearing connection between the main building and the coal conveyor trestle structure is selected as the seismic demand parameter for the coal conveyor trestle structure.
According to the “Technical Code for the Design of Civil Structure of Fossil-fired Power Plants” (DL5022-2012) [7], for coal conveying trestles with intensity 6 or 7, or those located at Class I and Class II sites with intensity 8, sliding supports placed on adjacent buildings can be used to ensure longitudinal free displacement and meet the requirements of seismic joints. In this project, based on the “Code for Seismic Design of Buildings” (GB50011-2010) (2016 version) [6], a 220 mm seismic joint is required between the trestle and the main powerhouse. The sliding support at the connection between the trestle and the main building is designed to withstand relative displacements along the longitudinal direction of the trestle that do not exceed 220 mm.
Therefore, when the relative displacement between the trestle and the main building structure exceeds 220 mm, it can be considered that this section of the trestle is damaged, either by one end of the trestle falling or by a collision with the main building.

3.3. Fragility Curves

Based on the results of Incremental Dynamic Analysis (IDA) and predefined damage states, a Probabilistic Seismic Fragility Analysis (PSFA) was conducted. The IDA provided the responses of the structure, including the maximum inter-story drift ratio (θmax) and the maximum relative displacement (dmax), to a series of ground motions. This analysis was referenced from [17].
Following the IDA results, a Probabilistic Seismic Demand Model (PSDM) was obtained by performing regression analysis using the computed responses. This model is illustrated in Figure 7, Figure 8 and Figure 9. The PSDM establishes the relationship between the demand parameter (DP) of the considered structure, which includes θmax and dmax, and the intensity measure (IM) of the ground motion. In the present investigation, PSDM was estimated via a typical power function:
S D = a ( I M ) b
which can be rewritten as Equation (2) in the logarithmically transformed space after taking logarithms
ln ( S D ) = ln ( a ) + b ln ( I M )
where SD represents the conditional median of the DP given the IM, and a and b are the parameters of the regression which can be obtained through linear regression in the logarithmic space. In addition to the median values, the demand model’s uncertainty was defined using a lognormal distribution, with the conditional logarithmic standard deviation, β D I M , calculated using the demand data:
β D I M i = 1 M ln d i ln a I M b 2 M 2
where M is the number of numerical simulation analyses and di is the peak demand quantity calculated for the ith numerical simulation analysis. The probabilistic seismic demand analysis (PSDA) results are presented in Figure 7, Figure 8 and Figure 9. In these figures, the coefficient of determination R2 is shown, indicating the robustness of the regression analysis. The seismic fragility can be simply defined as the conditional probability that the seismic demand (D) exceeds its capacity (C) for a given IM level. The exceedance probability that the demand would be larger than the capacity was computed as Equation (4), which can be rewritten as Equation (5) by substituting the demand median, SD, from Equation (2):
P D C I M = Φ ln S D / S C β D I M 2 + β C 2
P D C I M = Φ ln I M ln S C ln a / b β D I M 2 + β C 2 / b
where SC and βC represent the median and logarithmic standard deviations used to define the fragility model. By using Equation (5), the fragility curve for the considered structure can be obtained. In this study, fragility curves are presented as plots of the maximum inter-story drift ratio, θmax, versus peak ground acceleration (PGA) for the main building in Figure 10. Similarly, the fragility curves are presented as plots of the maximum relative displacement, dmax, versus PGA for the coal conveyor trestle in Figure 11 [17,18,19,20].
The x-axis in the graphs represents the intensity of seismic motion, while the y-axis represents the probability of the structure exceeding various damage states in response to seismic activity. Comparing the fragility curves in Figure 10 for the four sets of ground motions, it can be observed that when the seismic intensity (peak ground acceleration) is the same, the probabilities of the main building structure reaching different levels of damage decrease in the following order: Sets #3, #1a, #2, and #1b ground motions.
Similarly, comparing the fragility curves in Figure 11 for the four sets of ground motions, it is evident that when the seismic intensity is constant, the probability of damage occurring in the coal conveyor trestle varies. Under Set #3 ground motions, the trestle has the highest probability of experiencing damage, while under Set #1b ground motions, it has the lowest probability. The probabilities of damage under Sets #1a and #2 ground motions are similar and fall between these extremes, indicating a moderate fragility of the trestle to these seismic actions.
Furthermore, Figure 10 compares the fragility curves of the main building structure, considering and not considering the interaction with the coal conveyor trestle. It can be observed that considering the interaction only had a modestly impact under Set #1b seismic actions, resulting in a lower exceedance probability of the damage state for the main building structure. However, under other set seismic motions, the influence of considering or not considering the interaction between the main building and the coal conveyor trestle on the exceedance probability of the performance level is negligible.

4. Conclusions

This paper establishes separate calculation models for the independent main building structure and the coal conveyor trestle–main building structure of a thermal power plant. The seismic responses of both models are analyzed. It is found that given the conditions of the coal conveyor trestle connecting to the main building longitudinally along the trestle sliding transversely limited supports, the trestle only has a slight reduction effect on the dynamic characteristics of the main building structure under the ground motions of Set #1b, and almost no effect under other site-specific seismic actions when the maximum inter-story drift ratio of the main building is less than or equal to 0.02. However, when the maximum inter-story drift ratio of the main building exceeds 0.02, the maximum inter-story drift ratio of model B, which considers the main building–coal conveyor trestle interaction, is significantly smaller than that of model A under the same seismic intensity. This indicates that the presence of the coal conveyor trestle, which has a sufficiently flexible structure, can allow more seismic energy to be absorbed and provide better ductility for the main building structure during large deformation stages. Nevertheless, in conventional thermal power plant design, the deformation of the main building structure does not exceed the maximum inter-story drift ratio of 0.02. Therefore, it is reasonable and acceptable to not consider the main building–coal conveyor trestle interaction in engineering design.
In this study, the inter-story drift ratio is adopted as the seismic demand parameter to determine the damage state and seismic performance of the main building structure of the thermal power plant. Corresponding seismic demand models are established, and the seismic fragility curve of the main building structure is obtained. Since the maximum inter-story drift ratios of the main building structure corresponding to the four proposed damage states were all less than 0.02, the seismic fragility curves of the main building structure with or without considering the main building–coal conveyor trestle interaction showed little difference.
The paper points out that the failure mode of the coal conveyor trestle in the thermal power plant is mainly caused by excessive relative displacement along the longitudinal direction at the connection points, leading to collisions or falls. The longitudinal relative displacement at the trestle–main building connection is used as the seismic demand parameter, and the corresponding seismic demand model is established to obtain the seismic fragility curve of the coal conveyor trestle structure.
When the peak ground acceleration of the ground motion experienced by the thermal power plant is known, the seismic fragility curves of various structures and equipment can be used to assess the seismic performance level of the entire power plant. This provides a theoretical basis for the pre-disaster prediction and reinforcement and post-disaster evaluation of the thermal power plant.

Author Contributions

Conceptualization, Y.H. and J.D.; methodology, W.B.; software, Y.H.; validation, Y.H., W.B. and J.D.; formal analysis, Y.H.; investigation, Y.H.; resources, Y.H.; data curation, Y.H.; writing—original draft preparation, Y.H.; writing—review and editing, Q.L.; visualization, Q.L.; supervision, W.B.; project administration, W.B.; funding acquisition, J.D. All authors have read and agreed to the published version of the manuscript.

Funding

This work is supported by the Yunnan Provincial and Municipal Integration Project (202202AH210004) and the National Natural Science Foundation of China (52378542, 52008382).

Data Availability Statement

Data are contained within the article.

Conflicts of Interest

The authors declare no conflict of interest.

References

  1. Chen, D.; Jia, L. The Effect of Roof Systems on Seismic Performance of Reinforced Concrete Frame-Bent Main Building of Large-Scale Thermal Power Plant: Seismic Performance for RC frame-bent main building. Struct. Des. Tall Spec. Build. 2015, 24, 198–209. [Google Scholar] [CrossRef]
  2. Design Management Bureau of Ministry of Coal Industry. Selection of Special Summary of the Design Battle for Restoring Kailuan Coal Mine II-Earthquake Damage of Buildings and Structures; Design Management Bureau of Ministry of Coal Industry: Beijing, China, 1980. [Google Scholar]
  3. Liu, H.X. Damage of Tangshan Earthquake, Volume II; Seismological Press: Beijing, China, 1986. [Google Scholar]
  4. Wei, L.; Xie, J.F. The Forty Years’ Seismic Research of China Engineering 1949–1989; Seismological Press: Beijing, China, 1989. [Google Scholar]
  5. GB50223-2008; Standard for Classification of Seismic Protection of Building Constructions. China Architecture & Building Press: Beijing, China, 2008.
  6. GB50011-2010; Code for Seismic Design of Buildings (2016 Edition). China Architecture & Building Press: Beijing, China, 2016.
  7. DL5022-2012; Technical Code for the Design of Civil Structure of Fossil-Fired Power Plant. China Planning Press: Beijing, China, 2012.
  8. Vamvatsikos, D.; Cornell, C.A. Incremental Dynamic Analysis. Earthq. Eng. Struct. Dyn. 2002, 31, 491–514. [Google Scholar] [CrossRef]
  9. Huang, Q.; Gardoni, P.; Hurlebaus, S. Probabilistic Seismic Demand Models and Fragility Estimates for Reinforced Concrete Highway Bridges with One Single-Column Bent. J. Eng. Mech. 2010, 136, 1340–1353. [Google Scholar] [CrossRef]
  10. Baker, J.W.; Lin, T.; Shahi, S.K.; Jayaram, N. New Ground Motion Selection Procedures and Selected Motions for the PEER Transportation Research Program; Pacific Earthquake Engineering Research Center, University of California Berkeley: Berkeley, CA, USA, 2011. [Google Scholar]
  11. Hosseini, R.; Rashidi, M.; Bulajić, B.Đ.; Arani, K.K. Multi-Objective Optimization of Three Different SMA-LRBs for Seismic Protection of a Benchmark Highway Bridge against Real and Synthetic Ground Motions. Appl. Sci. 2020, 10, 4076. [Google Scholar] [CrossRef]
  12. Bulajic, B.D.; Hadzima-Nyarko, M.; Pavic, G. PGA estimates for deep soils atop deep geological sediments—An example of Osijek, Croatia. Geomech. Eng. 2021, 30, 233–246. [Google Scholar] [CrossRef]
  13. Vamvatsikos, D.; Cornell, C.A. Tracing and Post-Processing of IDA Curves: Theory and Software Implementation; Report No. RMS-44, RMS Program; Stanford University: Stanford, CA, USA, 2001. [Google Scholar]
  14. GB/T 24335-2009; Classification of Earthquake Damage to Buildings and Special Structures. Standards Press of China: Beijing, China, 2009.
  15. ASCE. FEMA 356-Prestandard and Commentary for the Seismic Rehabilitation of Buildings. 2000. Available online: http://www.degenkolb.com/0_0_Misc/0_1_FEMADocuments/fema356/ps-fema356.html (accessed on 8 June 2021).
  16. Yin, L.X. Research on Multi-Dimensional Seismic Response and Performance-Based Seismic Design Method of Frame-Bent Structure for Thermal Power Plant. Ph.D. Thesis, Xi’an University of Architecture and Technology, Xi’an, China, 2013. [Google Scholar]
  17. Shang, Q.; Wang, T.; Li, J. A Quantitative Framework to Evaluate the Seismic Resilience of Hospital Systems. J. Earthq. Eng. 2022, 26, 3364–3388. [Google Scholar] [CrossRef]
  18. Dimova, S.L.; Negro, P. Seismic Assessment of an Industrial Frame Structure Designed According to Eurocodes. Part 2: Capacity and Vulnerability. Eng. Struct. 2005, 27, 724–735. [Google Scholar] [CrossRef]
  19. Li, Q.; Ellingwood, B.R. Performance Evaluation and Damage Assessment of Steel Frame Buildings under Main Shock-Aftershock Earthquake Sequences. Earthq. Eng. Struct. Dyn. 2007, 36, 405–427. [Google Scholar] [CrossRef]
  20. Li, Q.; Ellingwood, B.R. Damage Inspection and Vulnerability Analysis of Existing Buildings with Steel Moment-Resisting Frames. Eng. Struct. 2008, 30, 338–351. [Google Scholar] [CrossRef]
Figure 1. Layout of the main building and coal conveyor trestle: (a) main plant structure plan column grid; (b) elevation layout of axes 1 and 2; (c) elevation layout of axis 3; (d) elevation layout of axes 4~8.
Buildings 13 02864 g001aBuildings 13 02864 g001b
Figure 2. Three-dimensional FEM models: (a) Model A; (b) Model B.
Buildings 13 02864 g002
Figure 3. Mode shape of Model A: (a) 1st mode shape (T = 2.17677 s); (b) 2nd mode shape (T = 1.44105 s); (c) 3rd mode shape (T = 1.30877 s).
Buildings 13 02864 g003
Figure 4. Mode shape of Model B: (a) 1st mode shape (T = 2.13485 s); (b) 2nd mode shape (T = 1.42635 s); (c) 3rd mode shape (T = 1.30296 s).
Buildings 13 02864 g004
Figure 5. Response spectra for selected records of (a) Set #1A; (b) Set #1B; (c) Set #2; (d) Set #3.
Buildings 13 02864 g005
Figure 6. IDA results for Model A and Model B under the ground motions of (a) Set #1A; (b) Set #1B; (c) Set #2; (d) Set #3; (e) total.
Buildings 13 02864 g006
Figure 7. Regressive analysis of θmax for Model A under the ground motions of (a) Set #1A; (b) Set #1B; (c) Set #2; (d) Set #3; (e) total.
Buildings 13 02864 g007aBuildings 13 02864 g007b
Figure 8. Regressive analysis of θmax for Model B under the ground motions of (a) Set #1A; (b) Set #1B; (c) Set #2; (d) Set #3; (e) total.
Buildings 13 02864 g008aBuildings 13 02864 g008b
Figure 9. Regressive analysis of dmax under the ground motions of (a) Set #1A; (b) Set #1B; (c) Set #2; (d) Set #3; (e) total.
Buildings 13 02864 g009
Figure 10. Seismic fragility curves of the main building of Model A and Model B under the ground motions of (a) Set #1A; (b) Set #1B; (c) Set #2; (d) Set #3; (e) total.
Buildings 13 02864 g010
Figure 11. Seismic fragility curves of coal conveyor trestle under the ground motions of (a) Set #1A; (b) Set #1B; (c) Set #2; (d) Set #3; (e) total.
Buildings 13 02864 g011
Table 1. Damage states of the main building structure.
Damage StateS1
Normal
Occupancy
S2
Immediate
Occupancy
S3
Occupancy
after Repair
S4
Available
after Overhaul
The maximum inter-story drift ratio1/5501/3001/1101/55
Disclaimer/Publisher’s Note: The statements, opinions and data contained in all publications are solely those of the individual author(s) and contributor(s) and not of MDPI and/or the editor(s). MDPI and/or the editor(s) disclaim responsibility for any injury to people or property resulting from any ideas, methods, instructions or products referred to in the content.

