Article

Numerical Investigation of the Ultimate Load-Carrying Capacity of Square Concrete-Filled Steel Tube Columns Considering Initial Stresses Generated during Construction

1
Key Laboratory of Building Structural Retrofitting and Underground Space Engineering, Shandong Jianzhu University, Ministry of Education, Jinan 250101, China
2
Engineering Research Institute of Appraisal and Strengthening of Shandong Jianzhu University Co., Ltd., Jinan 250013, China
3
School of Civil Engineering, Shandong Jianzhu University, Jinan 250101, China
*
Author to whom correspondence should be addressed.
Buildings 2023, 13(11), 2830; https://doi.org/10.3390/buildings13112830
Submission received: 9 October 2023 / Revised: 1 November 2023 / Accepted: 9 November 2023 / Published: 11 November 2023
(This article belongs to the Special Issue Steel-Concrete Composite Structures: Design and Construction)

Abstract

:
During construction, newly cast concrete exerts lateral pressure on the steel plates of concrete-filled steel tube (CFST) columns, resulting in non-negligible initial circumferential stresses. Finite element analysis, in which lateral pressure is applied using a user-defined load subroutine, was conducted to comprehensively investigate the effects of initial stresses, including circumferential stresses, on the structural behaviors of a square CFST column under the action of compressive load. This study also provides guidance for the numerical simulation of CFST columns under complicated construction scenarios. The analysis revealed that the steel tube plates were more sensitive to lateral pressure, which should be limited during construction, compared with gravity loads. Under the action of compressive load, the presence of initial stresses altered the failure modes of the square CFST columns and reduced their ultimate load-carrying capacities (ULCCs). For columns with slenderness ratios of 18 and 37, the ULCCs were essentially inversely proportional to the initial stress ratio β, ranging from 0.1 to 0.5. However, for columns with a larger slenderness ratio of 55, the initial stress level did not influence their ULCCs. Finally, a simple method for calculating the ULCCs of square CFST columns considering initial stresses is proposed for design purposes.

1. Introduction

Concrete-filled steel tube (CFST) columns, manufactured by casting concrete into steel tubes to create a composite structural member and making full use of the mechanical advantages of both steel and concrete materials, have extensive applications in high-rise buildings [1,2,3]. On the one hand, under axial loads, the outer steel tube provides lateral confinement to the inner core concrete, placing it in a triaxial compression state and greatly enhancing both the axial load-carrying capacity (LCC) and ductility of the column [4]. On the other hand, the core concrete supports the thin-walled steel tube, effectively preventing potential failure due to localized buckling [5]. Compared with normal reinforced concrete or bare steel tube columns, such a composite interaction between two materials surely brings CFST columns various advantages in both design and construction aspects, which are listed in Table 1, together with a few less prominent drawbacks.
In the construction of CFST structures, it is common practice that steel columns are first erected and connected by horizontal structural components, including steel beams and a steel slab deck, to form a three-dimensional skeleton before concrete casting [13]. Therefore, before the development of the above cowork mechanism that the steel and concrete materials jointly share loads, there already exists axial initial stresses and strains in the steel tubes due to gravity loads. Previous studies have confirmed the influences of axial initial stresses on the structural behaviors of CFST columns, and a few analytical, experimental, and numerical research efforts have been taken to evaluate such influences [1,3,13,14,15,16,17,18]. Huang et al. [14] theoretically established a force–deformation response model of CFST columns with axial initial stresses by considering the stress–strain relationships of steel and concrete and their composite actions. Experiments were conducted to further validate the model, and a stability coefficient considering axial initial stresses was proposed. Zhang et al. [18] conducted experimental research showing that the presence of initial axial stresses reduced the stiffness of eccentrically loaded CFST columns and had a more prominent negative impact on the ultimate load-carrying capacity (ULCC) of slender columns. Based on experimental data and numerical computations, researchers [1,3] examined the influences of various design parameters, including initial stress ratio (initial stress divided by yield strength of steel), slenderness ratio, fraction of steel in cross-section, load eccentricity, and material strengths, on the ULCC of CFST columns under the action of compressive load and proposed axial capacity calculation methods for practical use. Another axial capacity calculation procedure including the preload effect was given by Liew et al. [13], who adopted the principles of the Eurocode for composite steel and concrete structures design [19]. Although several ULCC calculation methods have been put forward, no relevant clauses considering the initial stresses have been included in the international standards, e.g., EN 1994-1-1 [19] and ANSI/AISC 360 [20]. The Chinese standard GB 50936 [21] and technical specification CECS 159 [22] state that such initial stresses during construction shall be considered with a stress limit set as 60% of the compressive strength of the steel tube, yet no specific design approach is given.
To accelerate the construction progress, the so-called “pumping-up” concrete casting method [23] is often used for CFST structures. In this method, pressurized flowing concrete is pumped up from the bottom of the column and, thus, exerts lateral pressure on the steel pipes. Considering that the column height for each concrete pouring operation can span multiple stories, significant circumferential stresses and deformations can be developed at the bottom of the steel tube [2]. Additionally, if the concrete pumping is not smooth and blockages occur inside the steel tube (such as at the location of internal stiffeners), the pumping pressure can be indirectly applied to the steel tube through the wet concrete. In the worst scenarios, the excessive lateral pressure may cause plastic deformations or even welding joint failure in the steel tube (see Figure 1).
Due to the limitations of equipment and space in the laboratory, CFST column specimens in existing experimental studies [1,3,13,14,18] were commonly scaled, in which the small circumferential initial stress in the steel tube could not represent the real-world case that the wet concrete might be accumulated for a multiple-story height. Although without physical limitations, previous numerical studies [3,13,15,17] focused only on structural influences on CFST columns due to the axial initial stress without considering the circumferential initial stress. In the current design and construction procedures of CFST columns, the influence of circumferential initial stress has not been considered, and relevant studies are very rare [2]. To fill such a knowledge gap, a finite element modeling technique was developed in this study to simulate the complete structural behaviors of square CFST columns from the construction stage to the normal loading stage until failure, in which both axial and circumferential initial stresses in the steel tube were replicated. Through a further parametric study, the effects of the initial stresses on the structural performance of square CFST columns under the action of compressive load were evaluated, and ultimately, a simple calculation method for the ULCC considering initial stresses was proposed.

2. Validation of Finite Element Model

Due to the aforementioned limitations of experiments, the finite element method, which has been extensively used in structural engineering for solving nonlinear [24] and complex problems [25,26], was adopted in this study. In order to handle potential high contact and material nonlinearities, explicit simulations of CFST columns under multistep loading schemes were carried out. As the static LCC of the models was of interest, the loading rate was set in a quasistatic manner such that no rate-dependent effects [27] were considered.
To validate the accuracy of the finite element model developed in this study, an experiment of a slender square CFST column with initial axial stresses (LP-1 specimen) under eccentric loading in the literature [1] was simulated, and the numerical results were compared against the experimental counterparts. In the experiment, the steel tube was first prestressed by two steel end plates and four bolts, and the concrete was poured into the steel tube subsequently. After curing, the LP-1 specimen, being pinned at two ends, was eccentrically loaded. The design parameters of the LP-1 specimen are given in Table 2.
A general-purpose finite element analysis software LS-DYNA R9.3.0 [28] was used to develop the numerical model of LP-1 (see Figure 2). The steel rollers, steel end plates, and core concrete were modeled using eight-node solid elements with a reduced integration formulation, whereas the square steel tube was created using four-node Belytschko–Tsay shell elements. Based on a mesh sensitivity analysis in a previous study [26], in which specimens with a similar scale were simulated using the same modeling procedures, a characteristic element size (square root of the area for shell elements and cubic root of the volume for solid elements) of about 13 mm was set for the LP-1 model. Multiple modeling measures were taken to consider the interactions between these components: (1) The nodes at two ends of the steel tube were constrained to the corresponding end plates using the keyword *CONTACT_TIED_SHELL_EDGE_TO_SOLID_BEAM_OFFSET. (2) A perfect bond between the steel tube and the core concrete was assumed to ensure their cowork in the normal loading stage without considering slippage failures, which was realized through applying a tied-type contact (*CONTACT_AUTOMATIC_SURFACE_TO_SURFACE_TIEBREAK) between them. (3) General contacts (*CONTACT_AUTOMATIC_SURFACE_TO_SURFACE) were added between the steel rollers and corresponding steel end plates to transfer loads. (4) Finally, the core concrete elements shared common nodes with the elements of two end plates.
As for materials, a bilinear kinematic hardening plasticity model (*MAT_003/*MAT_PLASTIC_KINEMATIC) was used to simulate the behavior of steel, and relevant material parameters for the Q340 strength grade steel are given in Table 3. The concrete was simulated by the continuous surface cap model (*MAT_159/*MAT_CSCM), which featured a smooth and closed yield surface combining a shear yield surface under low to moderate levels of hydrostatic pressure and a cap yield surface under high hydrostatic pressure. Additionally, the yield surface parameters were obtained through fitting with triaxial test data [29] and could effectively simulate the failure of concrete under different levels of confining pressure.
To include the initial axial stress in the simulation, a two-stage loading scheme was performed. In the first loading stage (initial stress stage), a vertical compressive force of 194 kN in total was applied to the top nodes of the steel tube. Note that, in this stage, the restraints to the top nodes of the steel tube provided by the top steel end plate and the tied-type contact between the steel tube and the core concrete were not activated. At the end of the first loading stage, the contour of the axial stress (z stress) of the steel tube is depicted in Figure 3a. Except for the local region at the bottom of the steel tube, which was constrained by the bottom steel end plate, the axial stresses were about 156 MPa for all other regions, i.e., the steel tube being compressed with an initial stress ratio β = σ0/fy = 0.459. These stress states of steel tube elements were saved as a Dynain ASCII formatted file [30], which would be introduced into the second loading stage (normal loading stage) computation as the initial stress states of the steel tube through the keyword *INITIAL_STRESS_SHELL. In the second normal loading stage, while maintaining the aforementioned vertical force, gradually increased downward displacement was imposed on the top steel roller until the column transverse deflection at the midsection wm reached the corresponding quantity in the literature [1]. Also, note that all interactions between the components in the numerical model were activated in this loading stage. The contour of the resultant displacement of the CFST column after loading is shown in Figure 3b, indicating that the global lateral buckling of the column caused the final failure, as observed in the experiment. The relationships between the applied load N and the lateral deflection at the column midsection wm obtained from the experiment and simulation are compared in Figure 3c. It is demonstrated that the numerical model could effectively simulate the overall structural behavior of the LP-1 specimen with initial steel tube axial stresses when subjected to eccentric compression. The ULCC of LP-1 obtained in the simulation was 535.8 kN, which exhibited a 4.3% difference compared with the experimental value of 560 kN. Such a small difference validated the feasibility of using the finite element method to analyze the structural behaviors of CFST columns with initial stresses.

3. Steel Tube Behaviors during Construction

3.1. Finite Element Model

To illustrate the necessity of considering circumferential initial stresses in the construction stage, a square CFST column in a real-world project was modeled, after which the initial stresses within the steel tube after concrete casting were replicated and analyzed. The cross-section dimensions of the column were 600 mm × 600 mm, with its steel tube manufactured by welding four 16 mm thick steel plates. The internal steel stiffeners, having a 250 mm diameter hole in the center to allow concrete to pass through, were welded to the inner side of the steel tube at certain spacings. The column height for each concrete pouring was 9600 mm, which spans three stories. The construction drawing of the square steel tube is shown in Figure 4. The materials for the square steel tube, internal steel stiffeners, and steel beam end plates were all of the Q345 strength grade with a yield strength fy = 345 MPa.
Taking advantage of the symmetry in the column section, the finite element model of a quarter steel tube was established, as shown in Figure 5. The steel tube plates, internal stiffeners, and beam end plates were all modeled by four-node Belytschko–Tsay shell elements, and the same steel material model as used in Section 2 was also adopted. Mesh sensitivity analysis was conducted with characteristic element sizes of about 25 mm, 50 mm, 100 mm, and 200 mm, which showed that the mesh dependency of results was not prominent when the element size was less than or equal to about 100 mm. A 50 mm element size was chosen to better display numerical results in local regions and have a reasonable computation time.
No special modeling treatment was given for the welding joints between the steel tube plates and stiffeners, as well as the ones between the steel tube plates and beam end plates that the corresponding elements at these connections shared common nodes. In contrast, to mimic the potential failure of the welding joint between the steel plates of the tube, the corresponding nodes along the edges of two plates were assigned into two groups, which were further constrained by each other using the *CONSTRAINED_TIE-BREAK keyword. In addition, a failure strain of 1.0 × 10⁻³ was set for the effective plastic strain in this constraint, i.e., when the effective plastic strains in the shell elements adjacent to the welding joint reached this value, the constraints between the shell element nodes would be released. Setting this failure effective plastic strain accounted for the fact that the quality Grade-1 welding joint between the steel plates had a strength similar to the base material but with a lower ductility.
After imposing the vertical restraints for the bottom nodes of the steel tube as well as restraints for the nodes at its symmetric planes, the simulation of the loading scenarios during construction was realized by a three-stage loading scheme. In the first loading stage, the gravity loads were applied, which included the self-weight of the steel tube, the weight of three floors (120 mm thick reinforced concrete composite slabs) as well as steel beams (I-section 500 mm × 250 mm × 12 mm × 16 mm) within the load tributary area (7.2 m × 4.5 m) of the column. In the second loading stage, the lateral pressure due to the flowing concrete against the steel tube after concrete pouring was applied. The magnitude of this lateral pressure was inversely proportional to the vertical position of the steel shell elements (with a proportionality factor equal to the unit weight of concrete γc = 2.4 × 10⁻⁵ N/mm3), which was implemented using a user-defined load subroutine loadsetud(). In the third loading stage, an evenly distributed lateral pressure on the steel tube was gradually increased to examine its load-carrying capacity under a continuous loading condition if the tube was fully filled or clogged during concrete casting.

3.2. Simulation Results

After performing computations, at the end of the first loading stage under self-weight and floor dead loads, the contour of effective stress in the steel tube with the model mirrored twice is shown in Figure 6a. Under this loading scenario, the maximum effective stress was 34.4 MPa, caused by stress concentration [31] near the connections to the beam end plates. The average axial (z-direction) stress at the bottom of the steel tube was only −8.44 MPa, resulting in an initial stress ratio β = 0.024. This suggested that the axial initial stresses caused by the floor dead loads during construction in the real world were relatively small.
At the end of the second loading stage, two total horizontal reaction forces in the x and y directions increased by 3.3 × 10⁵ N, respectively, which matched the resultant force due to the triangularly distributed lateral pressure and validated the user-defined load subroutine. The contour of effective stress in the steel tube at this moment is shown in Figure 6b, showing that the maximum value of 70.3 MPa occurred at the connection of two steel plates of the tube. This value was approximately twice the maximum effective stress generated by gravity loads in the previous loading stage and should not be neglected in the construction design. Under the element local coordinate system, the distributions of circumferential (x-stress) and axial stresses (y-stress) are compared in Figure 7, which shows that the circumferential stresses were about twice the axial stresses at the same locations in the steel tube.
During the third loading stage, due to stress concentration, the connection of two steel plates at the lower region of the tube consistently bore the highest stress and yielded, which resulted in a failure of the welding joint (as seen in Figure 6c). By comparing Figure 1 and Figure 6c, it is advised that the numerical model could effectively simulate a potential welding joint failure of the steel tube during construction. When the steel tube plates yielded, the applied lateral pressure was 0.87 MPa. In reference to the applied loads in the previous two loading stages, it was evident that the steel tube was more sensitive to lateral pressures compared with the gravity loads during construction. Referring to relevant standards [21,22] that the allowable initial axial stress of the steel tube is up to 60% of its yield strength, a lateral pressure of 0.42 MPa would generate an effective stress reaching such limit. This value could be considered the maximum allowable pumping pressure for concrete casting in this project.

4. Structural Behaviors of CFST Columns Considering Initial Stresses

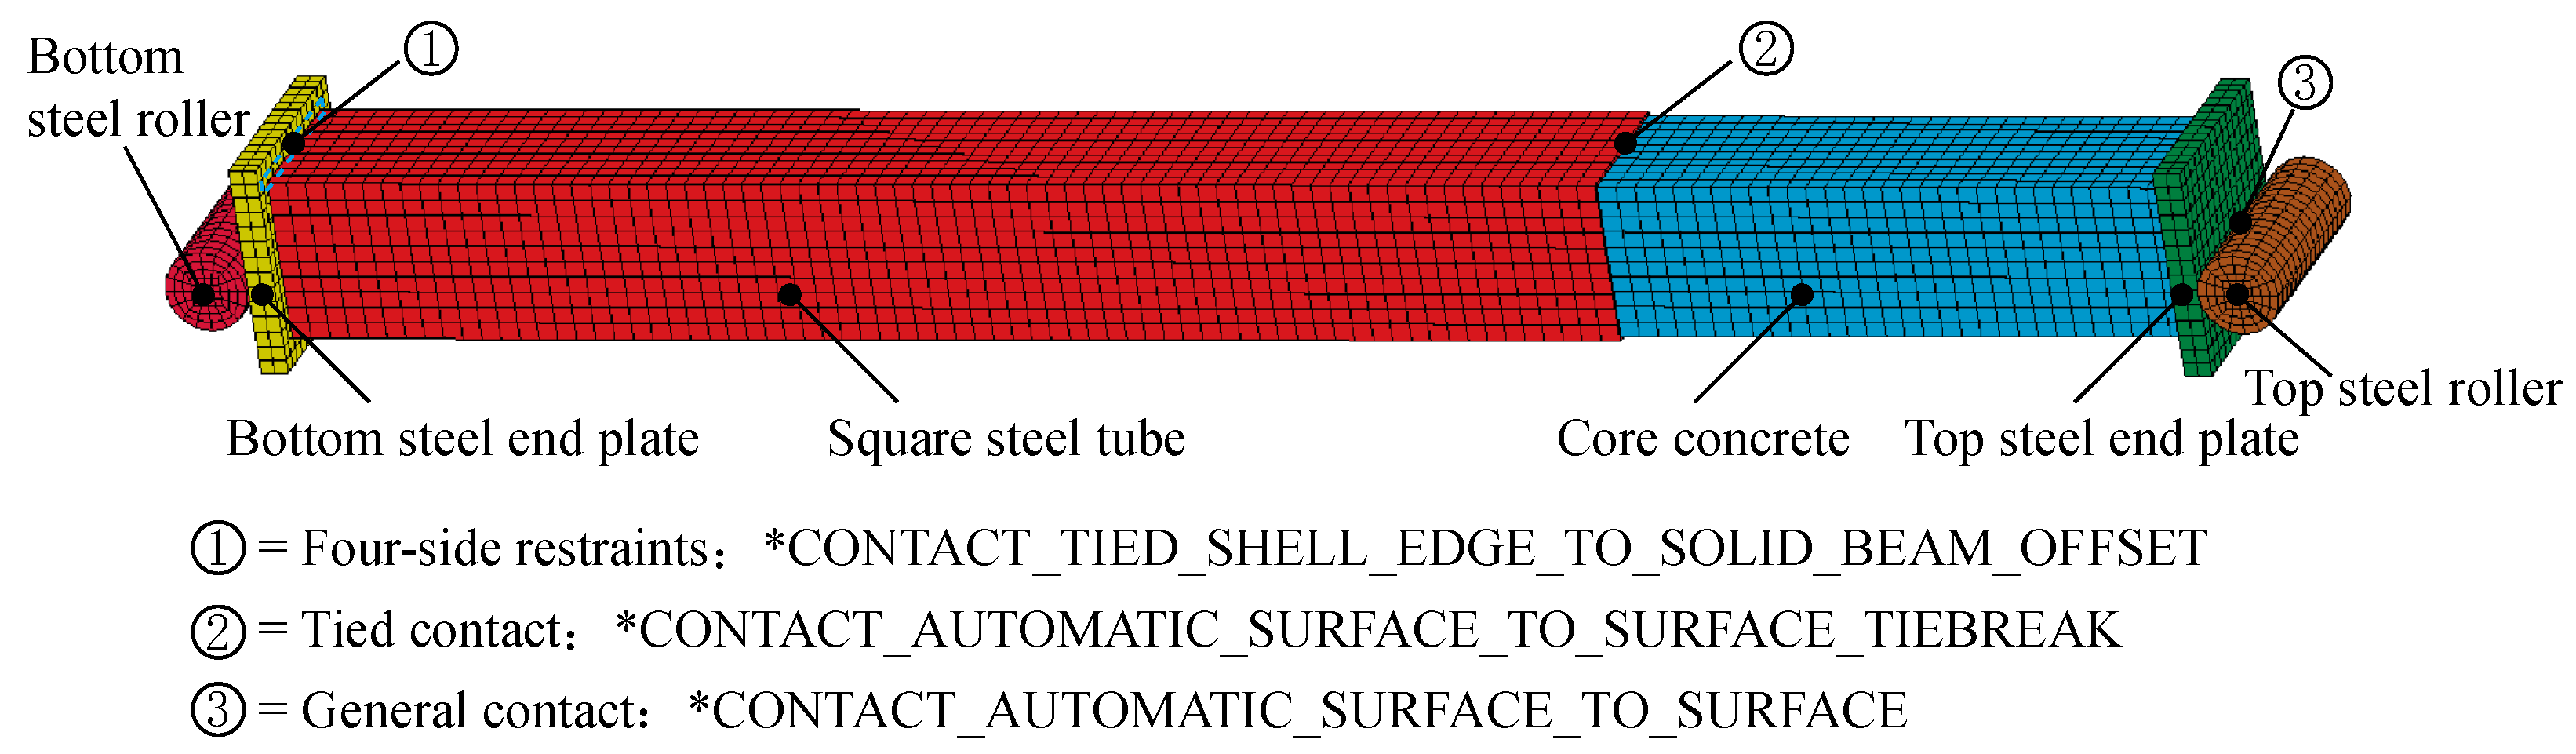
4.1. Finite Element Model

To investigate the effects of the steel tube initial stresses, including circumferential stress, on the structural behaviors of a CFST column under the action of compressive load, a finite element model named S-M-6.4-0.1 containing core concrete was established, as discussed later in Section 4.2 and detailed in Table 4. The model took the same cross-section and material properties from the real-world case from the previous section, viz., cross-section dimension B = 600 mm, steel tube plate thickness t = 16 mm, and steel strength grade Q345. In addition, the column length (height) was set as l = 6,400 mm, and the core concrete strength grade was C40 with a cubic compressive strength fcu = 40 MPa. It is suggested that an initial eccentricity e0 = l/1000 = 6.4 mm could be adopted to account for material and geometric imperfections in real columns when using the finite element method to analyze its uniaxial compression behaviors [32]. A loading scheme containing multiple steps was also implemented to include the initial stresses in the simulation. Specifically, the initial stress ratio β was taken as 0.1, and the axial stress was first introduced by adding vertical downward forces to the top nodes of the steel tube (refer to Section 2 and Section 3.1). Subsequently, the circumferential stress was created by applying lateral pressure to the steel tube elements according to their vertical positions through the user-defined load subroutine (refer to Section 3.1). Finally, a displacement-controlled loading method, the same as the normal loading procedure for LP-1, was conducted on S-M-6.4-0.1.

4.2. Stress and Deformation Responses

The load N variation against the increased transverse deflection at the midsection wm (N-wm curve) of the S-M-6.4-0.1 column, together with the axial stress contour when wm = 140 mm, is shown in Figure 8. The stress developments of the steel tube elements at the column midsection (SE-3847 and SE-5382 with positions in reference to Figure 8) are shown in Figure 9, while the axial stress and strain developments of concrete elements (CE-15433 and CE-15432 with positions in reference to Figure 8) are shown in Figure 10. According to Figure 8, three distinct structural behavior stages could be identified: the elastic stage OA, the elasto-plastic stage AB, and the plastic softening stage BC. In the OA elastic stage, the applied load escalated in a linear pattern as the deflection increased with an initial stiffness K0 = 1.05 × 10⁴ kN/mm. It is noted that the stresses of steel elements at two sides of the column in the bending direction were identically developed. The same observation also went to the concrete elements, which confirmed that the axial compressive action was dominant. After the deflection reached wm,e = 1.6 mm (point A), the stiffness drastically decreased, and the curves of the development of axial compressive stresses of the steel tube elements bifurcated (solid lines in Figure 9), which indicated that the second-order bending action due to the lateral deflection of the column began to stand out. As deformation continued to increase, the axial compressive stress of the steel tube on the compression side (SE-5382) of the bending action consistently grew and yielded. In contrast, the steel tube on the tension side of the bending action (SE-3847) had its compressive stress slightly increased in the elasto-plastic stage and started to decrease around point B (wm,p = 13.5 mm). This declining trend persisted and eventually turned into an increase in the tensile stress with a transition at wm ≈ 92 mm, which indicated that the neutral axis was located at the edge of the column and about to move into the column section. Furthermore, the effective stress curves in Figure 9 clearly illustrate that the presence of initial stresses reduced the reserve of elastic strength in the steel tube [9]. The early yielding of the steel tube would reduce its lateral confinement to the core concrete, which led to a reduced deformation corresponding to the ULCC of the CFST column under the action of compressive load.
As for concrete, Figure 10a shows that the stress level gradually decreased on the tension side (CE-15433) of the bending action after entering the plastic softening stage. In comparison, on the compression side (CE-15432) of the bending action, the axial strain increased almost linearly and reached uniaxial compressive failure strain (about 0.0033) at wm ≈ 24 mm. However, due to the confinement provided by the steel tube as well as the surrounding concrete, a high stress level could be maintained throughout the simulation.

4.3. Influences of Initial Stresses

The influence of initial stresses, including the circumferential stress, on the ULCCs of square CFST columns with varied slenderness ratios and eccentricities was further investigated through a series of numerical models (listed in Table 4) established based on S-M-6.4-0.1. As for the naming rule for the models, the second letter (S = stub, M = intermediate, and L = long) stands for the length of the column and the number in the third position signifies the load eccentricity, whereas the last number indicates the initial stress ratio. The cross-sectional dimensions and the materials of the columns remained unchanged, and the primary variations involved (1) the column length l to simulate the initial stresses generated by concrete casting for different column heights (1 to 3-story heights) each time, (2) the axial initial stress ratio β, and (3) the eccentricity e.
Table 4. Parameters of square CFST column models.
No.Modell (mm)λe (mm)βFailure modeNu (kN)
1S-M-6.4-0.0640037.06.40.0Sectional failure2.18 × 104
2S-M-6.4-0.1640037.06.40.1Elasto-plastic buckling1.87 × 104
3S-M-6.4-0.3640037.06.40.3Elasto-plastic buckling1.61 × 104
4S-M-6.4-0.5640037.06.40.5Elasto-plastic buckling1.34 × 104
5S-M-20-0.0640037.0200.0Sectional failure2.08 × 104
6S-M-20-0.1640037.0200.1Elasto-plastic buckling1.75 × 104
7S-M-20-0.3640037.0200.3Elasto-plastic buckling1.50 × 104
8S-M-20-0.5640037.0200.5Elasto-plastic buckling1.24 × 104
9S-M-120-0.0640037.01200.0Elasto-plastic buckling1.63 × 104
10S-M-120-0.1640037.01200.1Elasto-plastic buckling1.22 × 104
11S-M-120-0.3640037.01200.3Elasto-plastic buckling9.99 × 103
12S-M-120-0.5640037.01200.5Elasto-plastic buckling7.68 × 103
13S-M-240-0.0640037.02400.0Elasto-plastic buckling1.18 × 104
14S-M-240-0.1640037.02400.1Elasto-plastic buckling8.99 × 103
15S-M-240-0.3640037.02400.3Elasto-plastic buckling6.90 × 103
16S-M-240-0.5640037.02400.5Elasto-plastic buckling4.75 × 103
17S-M-360-0.0640037.03600.0Elasto-plastic buckling9.08 × 103
18S-M-360-0.1640037.03600.1Elasto-plastic buckling6.98 × 103
19S-M-360-0.3640037.03600.3Elasto-plastic buckling4.95 × 103
20S-M-360-0.5640037.03600.5Elasto-plastic buckling2.84 × 103
21S-S-3.2-0.0320018.53.20.0Sectional failure2.20 × 104
22S-S-3.2-0.1320018.53.20.1Elasto-plastic buckling1.90 × 104
23S-S-3.2-0.3320018.53.20.3Elasto-plastic buckling1.64 × 104
24S-S-3.2-0.5320018.53.20.5Elasto-plastic buckling1.38 × 104
25S-S-20-0.0320018.5200.0Sectional failure2.08 × 104
26S-S-20-0.1320018.5200.1Elasto-plastic buckling1.73 × 104
27S-S-20-0.3320018.5200.3Elasto-plastic buckling1.49 × 104
28S-S-20-0.5320018.5200.5Elasto-plastic buckling1.24 × 104
29S-S-120-0.0320018.51200.0Sectional failure1.64 × 104
30S-S-120-0.1320018.51200.1Elasto-plastic buckling1.24 × 104
31S-S-120-0.3320018.51200.3Elasto-plastic buckling1.01 × 104
32S-S-120-0.5320018.51200.5Elasto-plastic buckling7.87 × 103
33S-S-240-0.0320018.52400.0Elasto-plastic buckling1.22 × 104
34S-S-240-0.1320018.52400.1Elasto-plastic buckling9.01 × 103
35S-S-240-0.3320018.52400.3Elasto-plastic buckling6.69 × 103
36S-S-240-0.5320018.52400.5Elasto-plastic buckling4.55 × 103
37S-S-360-0.0320018.53600.0Elasto-plastic buckling9.37 × 103
38S-S-360-0.1320018.53600.1Elasto-plastic buckling6.79 × 103
39S-S-360-0.3320018.53600.3Elasto-plastic buckling4.72 × 103
40S-S-360-0.5320018.53600.5Elasto-plastic buckling2.32 × 103
41S-L-9.6-0.0960055.49.60.0Sectional failure2.14 × 104
42S-L-9.6-0.1960055.49.60.1Elasto-plastic buckling1.85 × 104
43S-L-9.6-0.3960055.49.60.3Elasto-plastic buckling1.85 × 104
44S-L-9.6-0.5960055.49.60.5Elasto-plastic buckling1.85 × 104
45S-L-20-0.0960055.4200.0Sectional failure2.08 × 104
46S-L-20-0.1960055.4200.1Elasto-plastic buckling1.77 × 104
47S-L-20-0.3960055.4200.3Elasto-plastic buckling1.77 × 104
48S-L-20-0.5960055.4200.5Elasto-plastic buckling1.77 × 104
49S-L-120-0.0960055.41200.0Elasto-plastic buckling1.64 × 104
50S-L-120-0.1960055.41200.1Elasto-plastic buckling1.24 × 104
51S-L-120-0.3960055.41200.3Elasto-plastic buckling1.24 × 104
52S-L-120-0.5960055.41200.5Elasto-plastic buckling1.23 × 104
53S-L-240-0.0960055.42400.0Elasto-plastic buckling1.17 × 104
54S-L-240-0.1960055.42400.1Elasto-plastic buckling8.78 × 103
55S-L-240-0.3960055.42400.3Elasto-plastic buckling8.70 × 103
56S-L-240-0.5960055.42400.5Elasto-plastic buckling8.61 × 103
It is seen that some CFST column models without steel tube initial stresses exhibited a sectional failure that was different from the elasto-plastic buckling discussed before in the S-M-6.4-0.1 model. Taking the S-M-6.4-0.0 model as an example (see Figure 11), the steel tube at the top of the column yielded and could not effectively restrain the lateral deformation of the core concrete. Consequently, at the time of failure, the concrete at this section experienced severe damage, as shown in the subfigure in Figure 11, where damage index D = 0 represents no damage and D = 1 represents complete damage. Correlating such failure mode with the one of S-M-6.4-0.1, it indicated that the existence of initial stresses could alter the failure mode of the CFST columns.
The load–deflection responses (N-wm curves) of 6400 mm, 3200 mm, and 9600 mm square CFST column models are given in Figure 12, Figure 13 and Figure 14, respectively. It is observed that having initial stresses in the steel tube had a negligible effect on the initial stiffness of the square CFST columns, yet it significantly reduced their load-bearing capacities. The ULCC for each model is listed in Table 4. It is noted that for the S-S series of CSFT column models that did not exhibit a descending softening stage in their load–deflection curves after steel yielding, the ULCC was determined as the applied load corresponding to a state that the axial strain of the CFST column reached the “yielding strain” εscy = 3.323 × 10⁻³ as per Equation (1) [33]:
ε scy = 1300 + 12.5 f c + ( 570 + 31.7 f c ) ξ 0.2
where εscy is calculated in με, f c is the concrete cylinder compressive strength (N/mm2), and ξ is the coefficient of confinement calculated, and as per Equation (2):
ξ = A s f y A c f ck
where As is the cross-section area of steel tube (mm2), Ac is the cross-section area of core concrete (mm2), fy is the yielding strength of steel (N/mm2), and fck is the characteristic concrete compressive strength (N/mm2).
To investigate the influences of the initial stress level on the ULCC of the square CFST columns, a nondimensional strength factor can be first defined as:
ϕ β = N u N u , β = 0.0
where Nu,β=0.0 is the ULCCs of the square CFST columns having corresponding eccentricities yet without considering the initial stresses. Figure 15 demonstrates the influences of the initial stress level on strength factor ϕβ. For the S-M and S-S series columns, within a range of β = 0.1 to 0.5, the ULCC essentially exhibited a linear inverse relationship with the initial stress ratio. In contrast, for the S-L series columns with a larger slenderness ratio, the initial stress level has virtually no effect on their ULCCs.
In the case of the S-M and S-S series columns, the initial stress level had varying degrees of influence on the strength factor of the ULCC for different load eccentricities. The slopes of the respective influence trend lines for different load eccentricities, denoted as “k” with a subscript signifying the eccentricity, were obtained and given in the legends of Figure 15a,b. By taking the average of the slope values for the two series of models and relating them to the eccentricity ratio e/B, the slope of the influencing trend lines can be obtained for strength factor ϕβ of the ULCC considering the eccentricity (see Figure 16a):
k = { 0.60 e B 0.129 1.1859 ( e B ) 0.4471 e B > 0.129
With this slope of the influencing trend lines and strength factor (ϕβ=0.1) for an initial stress ratio of 0.1, the ULCC of a CFST column with an arbitrary initial stress ratio greater than 0.1 can be calculated through its strength factor ϕβ and the ULCC without considering the initial stresses Nu, β=0.0.
To obtain Nu, β=0.0, first define the strength factor ϕβ=0.1 as Nu, β=0.1/Nu, β=0.0, which represents the ratio of the ULCC of a CFST column with an initial stress ratio of β = 0.1 to the one without considering initial stresses. This ϕβ=0.1 factor is also related to the load eccentricity, and by performing the same average operation on the data for two series of models, a piecewise function can be obtained (see Figure 16b):
ϕ β = 0.1 = { 0.5304 ( e B ) + 0.8578 0.0 e B 0.2 0.0132 ( e B ) + 0.7551 e B > 0.2
With the above equations acquired and conservatively taking the LCC of the square CFST column with an initial stress ratio β = 0.1 as an upper limit, the influence of initial stresses can be considered in the design. That is,
(1)
Firstly, calculating the Nu,β=0.0 according to the current national standards or technical regulations, e.g., as per [21,22], or using the simplified ULCC calculation equation (Equation (6)) given below to consider the influences of eccentricity. Another strength factor ϕe for the eccentricity effect is defined as:
ϕ e = N u , β = 0 . 0 N u , sec
where Nu,sec is their cross-sectional compressive strength:
N u , sec = A s f y + A c f c
and where all the notations represent identical meanings of the quantities given in Equation (2). With Nu,sec calculated as 2.257 × 10⁴ kN for all CFST columns in Table 4, the relationship between the strength factor ϕe and the eccentricity ratio e/B can be found (see Figure 17):
ϕ e = 0.9646 ( e B ) + 0.9442
(2)
Then, calculate the strength factor ϕβ=0.1 based on Equation (5) and ϕβ with a specific initial stress level using Equation (4).
(3)
Finally, calculate the targeted Nu of the CFST columns considering initial stresses with the help of Nu,β=0.0 and ϕβ. It should be noted that Nu is taken as Nu,β=0.1 for the CFST column having a large slenderness ratio (e.g., S-L series).
The ULCCs of square CFST column specimens with initial stresses in the literature [1] are calculated using the proposed method and compared with the experimental results in Table 5. It is seen that accurate predictions of the ULCCs are achieved with a mean calculation-to-experiment ratio of 0.959 with a coefficient of variation of 4.1%.

5. Future Work

It is suggested that more experimental studies with full-scale square CFST column specimens with varied lengths should be conducted in the future, which may reasonably reflect loading scenarios in reality, reveal the true structural behaviors of the member, and expand the experimental result database.
It is also remarked that the ULCC of CFST columns is influenced by numerous factors, including but not limited to the cross-sectional dimensions and length, the mechanical properties of the steel tube and core concrete, eccentricity of the load, steel tube initial stresses, imperfection of the column (existing of predamage, initial deflection, improper compaction of the core concrete), and constructional defects (misalignment between structural members). Consequently, predicting the ULCC considering multiple factors collectively is rather complicated and challenging. With the advancement of computer and data science [34,35,36,37], machine learning (ML), as one of the artificial intelligence techniques, is becoming a promising research method in the structural engineering field. Some pioneer research works on CFST columns [38,39,40] have highlighted the possibility that an accurate and reliable ULCC prediction model employing ML can be developed to holistically consider the abovementioned factors.

6. Conclusions

The complete structural behaviors of square CFST columns in both construction and normal loading stages were simulated using validated finite element models. The steel tube circumferential initial stress, caused by the lateral pressure of flowing concrete during construction, was incorporated into the simulation through a user-defined load subroutine. By analyzing the overall load–deflection responses of the CFST columns, examining the stress and strain developments at critical cross-sections, and conducting parametric studies, the following conclusions were obtained:
(1)
During construction, the steel tube plates were more sensitive to lateral pressure, which should be limited during construction, compared with gravity loads;
(2)
Under the action of compressive load, the presence of initial stresses changed the failure modes of square CFST columns and reduced their ULCCs;
(3)
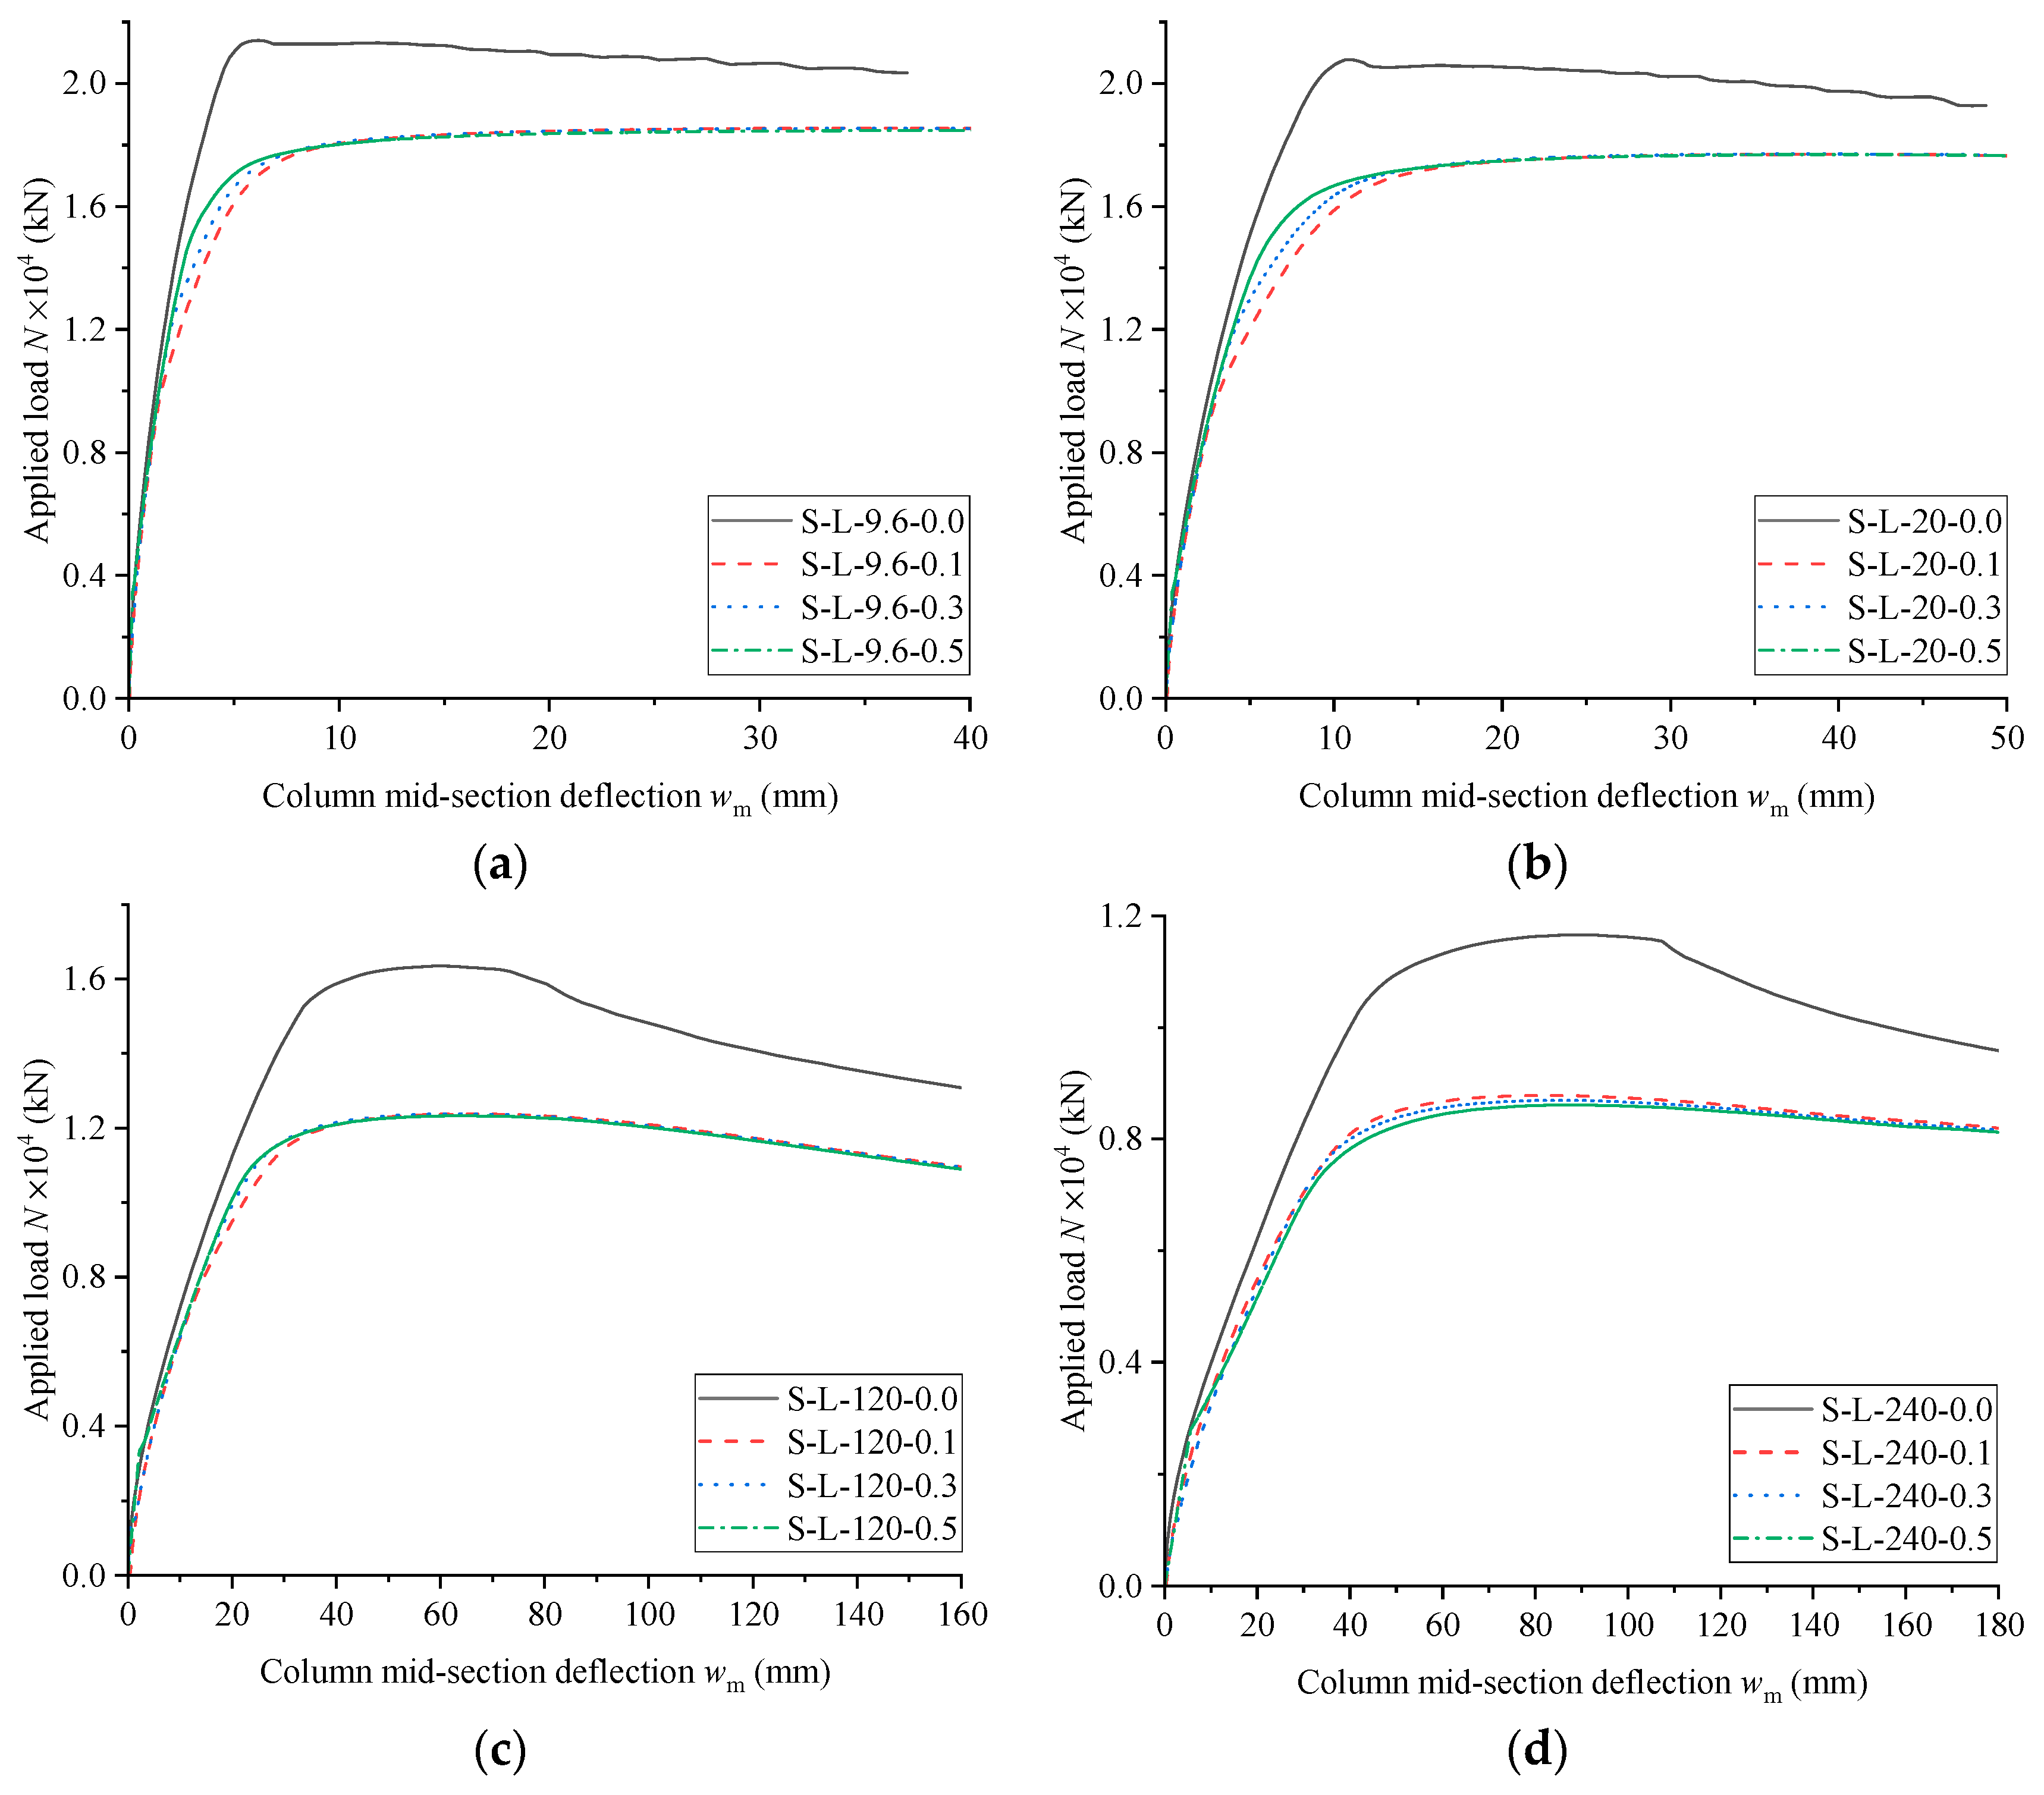
For columns with slenderness ratios of 18 and 37, the ULCC was essentially inversely proportional to the initial stress ratio in the range of 0.1 to 0.5. However, for columns with a larger slenderness ratio of 55, the initial stress level did not influence their ULCCs;
(4)
Finally, a simple method for calculating the ULCCs of square CFST columns considering initial stresses was proposed for design purposes.

Author Contributions

Conceptualization, H.X. and K.Z.; formal analysis, H.X.; writing—original draft preparation, H.X.; writing—review and editing, F.X., G.W. and A.S.; methodology, K.Z. and F.X.; supervision, K.Z.; validation, G.W. and A.S. All authors have read and agreed to the published version of the manuscript.

Funding

This research received no external funding.

Data Availability Statement

Data are contained within the article.

Conflicts of Interest

Author Guangyi Wang was employed by the company Engineering Research Institute of Appraisal and Strengthening of Shandong Jianzhu University Co., Ltd. The remaining authors declare that the research was conducted in the absence of any commercial or financial relationships that could be construed as a potential conflict of interest.

References

  1. Han, L.H.; Yao, G.H. Behaviour of Concrete-Filled Hollow Structural Steel (HSS) Columns with Pre-Load on The Steel Tubes. J. Constr. Steel Res. 2003, 59, 1455–1475. [Google Scholar] [CrossRef]
  2. Uy, B.; Das, S. Wet Concrete Loading of Thin-Walled Steel Box Columns during the Construction of a Tall Building. J. Constr. Steel Res. 1997, 42, 95–119. [Google Scholar] [CrossRef]
  3. Huang, F.; Yu, X.; Chen, B.; Li, J. Study on Preloading Reduction of Ultimate Load of Circular Concrete-Filled Steel Tubular Columns. Thin-Walled Struct. 2016, 98, 454–464. [Google Scholar] [CrossRef]
  4. Han, L.H. Tests on Stub Columns of Concrete-Filled RHS Sections. J. Constr. Steel Res. 2002, 58, 353–372. [Google Scholar] [CrossRef]
  5. Bradford, M.A.; Loh, H.Y.; Uy, B. Slenderness Limits for Filled Circular Steel Tubes. J. Constr. Steel Res. 2002, 58, 243–252. [Google Scholar] [CrossRef]
  6. Zhao, X.-L.; Grzebieta, R. Void-Filled SHS Beams Subjected to Large Deformation Cyclic Bending. J. Struct. Eng. 1999, 125, 943–1082. [Google Scholar] [CrossRef]
  7. Han, L.-H.; Li, W.; Bjorhovde, R. Developments and Advanced Applications of Concrete-Filled Steel Tubular (CFST) Structures: Members. J. Constr. Steel Res. 2014, 100, 211–228. [Google Scholar] [CrossRef]
  8. Goto, Y.; Kumar, G.P.; Kawanishi, N. Nonlinear Finite-Element Analysis for Hysteretic Behavior of Thin-Walled Circular Steel Columns with In-Filled Concrete. J. Struct. Eng. 2010, 136, 1327–1469. [Google Scholar] [CrossRef]
  9. Kodur, V.K.R.; MacKinnon, D.H. Simplified Design of Concrete-Filled Hollow Structural Steel Columns for Fire Endurance. J. Constr. Steel Res. 1998, 46, 298. [Google Scholar] [CrossRef]
  10. Ji, S.-H.; Wang, W.-D.; Xian, W. Lateral Impact Behaviour of Square CFST Columns under Fire Condition. J. Constr. Steel Res. 2022, 196, 107367. [Google Scholar] [CrossRef]
  11. Bambach, M.R.; Jama, H.; Zhao, X.L.; Grzebieta, R.H. Hollow and Concrete Filled Steel Hollow Sections under Transverse Impact Loads. Eng. Struct. 2008, 30, 2859–2870. [Google Scholar] [CrossRef]
  12. Dong, H.; Qin, J.; Cao, W.; Zhao, L. Seismic Behavior of Circular CFST Columns with Different Internal Constructions. Eng. Struct. 2022, 260, 114262. [Google Scholar] [CrossRef]
  13. Liew, J.Y.R.; Xiong, D.X. Effect of Preload on the Axial Capacity of Concrete-Filled Composite Columns. J. Constr. Steel Res. 2009, 65, 709–722. [Google Scholar] [CrossRef]
  14. Huang, S.J.; Zhong, S.T.; Yan, S.Z.; Cao, H.L. Experimental Research of Pre-Stress Effect on Bearing Capacity of Concrete Filled Steel Tubular Axial Compressive Members. J. Harbin Univ. Archit. Eng. 1996, 29, 44–50. [Google Scholar]
  15. Xiong, D.-X.; Zha, X.-X. A Numerical Investigation on the Behaviour of Concrete-Filled Steel Tubular Columns under Initial Stresses. J. Constr. Steel Res. 2007, 63, 599–611. [Google Scholar] [CrossRef]
  16. Zha, X.; Zhong, S. The Behavior Effect on Concrete Filled Steel Tubular Members subjected to Compression under the Initial Stress of Steel Tube Based on the Finite Element Method. J. Harbin Univ. Civ. Eng. Archit. 1997, 30, 41–49. [Google Scholar]
  17. Patel, V.I.; Liang, Q.Q.; Hadi, M.N.S. Numerical Analysis of Circular Concrete-Filled Steel Tubular Slender Beam-Columns with Preload Effects. Int. J. Struct. Stab. Dyn. 2013, 13, 1250065. [Google Scholar] [CrossRef]
  18. Zhang, X.; Zhong, S.; Yan, S.; Lin, W.; Cao, H. Experimental Study about the Effect of Initial Stress on Bearing Capacity of Concrete Filled Steel Tubular Members Under Eccentric Compression. J. Harbin Univ. Civ. Eng. Archit. 1997, 30, 50–56. [Google Scholar]
  19. EN 1994-1-1: 2004; Eurocode 4: Design of Composite Steel and Concrete Stru—Ctures–Part 1-1: General Rules and Rules for Buildings. European Committee for Standardization: Brussels, Belgium, 2004.
  20. ANSI/AISC 360-22 2022; Specification for Structural Steel Buildings. American Institute of Steel Construction: Chicago, IL, USA, 2022.
  21. GB 50936-2014; Technical Code for Concrete Filled Steel Tubular Structures. Ministry of Housing and Urban-Rural Development of the People’s Republic of China: Beijing, China, 2014.
  22. CECS 159: 2004; Technical Specification for Structures with Concrete-Filled Rectangular Steel Tube Members. China Association for Engineering Construction Standardization: Beijing, China, 2004.
  23. DB 11/T 1628-2019; Technical Specification for Construction of Concrete Filled Steel Tube with Pumping-Up Casting Method. Beijing Municipal Commission of Housing and Urban-Rural Development: Beijing, China, 2019.
  24. Angelis, F.D.; L.Taylor, R. A Nonlinear Finite Element Plasticity Formulation without Matrix Inversions. Finite Elem. Anal. Des. 2016, 112, 11–25. [Google Scholar] [CrossRef]
  25. Xue, H.; Guan, H.; Gilbert, B.P.; Lu, X.; Li, Y. Comparative and Parametric Studies on Behaviour of RC Flat Plates subjected to Interior Column Loss. J. Struct. Eng. 2020, 146, 04020183. [Google Scholar] [CrossRef]
  26. Xue, H.; Guan, H.; Gilbert, B.P.; Lu, X.; Li, Y. Simulation of Punching and Post-Punching Shear Behaviours of RC Slab-Column Connections. Mag. Concr. Res. 2021, 73, 1135–1150. [Google Scholar] [CrossRef]
  27. Angelis, F.D. On the Structural Response of Elasto/Viscoplastic Materials Subject to Time-Dependent Loadings. Struct. Durab. Health Monit. 2012, 8, 341–358. [Google Scholar] [CrossRef]
  28. LSTC. LS-DYNA Keyword User’s Manual Volume I; Livermore Software Technology Corporation: Livermore, CA, USA, 2016. [Google Scholar]
  29. Murray, Y.D. Users Manual for LS-DYNA Concrete Material Model 159; FHWA-HRT-05-062; U.S. Department of Transportation: McLean, VA, USA, 2007.
  30. Schwer, L.E. Modeling Pre and Post Tensioned Concrete. In Proceedings of the 14th International LS-DYNA Users Conference, Detroit, MI, USA, 12–14 June 2016. [Google Scholar]
  31. Cicco, S.D.; Angelis, F.D. A Plane Strain Problem in the Theory of Elastic Materials with Voids. Math. Mech. Solids 2020, 25, 46–59. [Google Scholar] [CrossRef]
  32. Tao, Z.; Wang, Z.-B.; Yu, Q. Finite Element Modelling of Concrete-Filled Steel Stub Columns under Axial Compression. J. Constr. Steel Res. 2013, 89, 121–131. [Google Scholar] [CrossRef]
  33. Han, L.H.; Yao, G.H.; Zhao, X.L. Tests and Calculations for Hollow Structural Steel (HSS) Stub Columns Filled with Self-Consolidating Concrete (SCC). J. Constr. Steel Res. 2005, 61, 1241–1269. [Google Scholar] [CrossRef]
  34. Chen, J.; Yu, S.; Wei, W.; Ma, Y. Matrix-Based Method for Solving Decision Domains of Neighbourhood Multigranulation Decision-Theoretic Rough Sets. CAAI Trans. Intell. Technol. 2021, 7, 313–327. [Google Scholar] [CrossRef]
  35. Zhao, H.; Ma, L. Several Rough Set Models in Quotient Space. CAAI Trans. Intell. Technol. 2021, 7, 69–80. [Google Scholar] [CrossRef]
  36. Du, H.; Du, S.; Li, W. Probabilistic Time Series Forecasting with Deep Non-Linear State Space Models. CAAI Trans. Intell. Technol. 2022, 8, 3–13. [Google Scholar] [CrossRef]
  37. Hu, X.; Kuang, Q.; Cai, Q.; Xue, Y.; Zhou, W.; Ying, L. A Coherent Pattern Mining Algorithm Based on All Contiguous Column Bicluster. J. Artif. Intell. Technol. 2022, 2, 80–92. [Google Scholar] [CrossRef]
  38. Vu, Q.-V.; Truong, V.-H.; Thai, H.-T. Machine Learning-Based Prediction of CFST Columns Using Gradient Tree Boosting Algorithm. Compos. Struct. 2021, 259, 113505. [Google Scholar] [CrossRef]
  39. Le, T.-T. Practical Machine Learning-Based Prediction Model for Axial Capacity of Square CFST Columns. Mech. Adv. Mater. Struct. 2022, 29, 1782–1797. [Google Scholar] [CrossRef]
  40. Moradi, M.J.; Daneshvar, K.; Ghazi-nader, D.; Hajiloo, H. The Prediction of Fire Performance of Concrete-Filled Steel Tubes (CFST) Using Artificial Neural Network. Thin-Walled Struct. 2021, 161, 107499. [Google Scholar] [CrossRef]
Figure 1. Welding joint failure of CFST column during concrete casting.
Buildings 13 02830 g001
Figure 2. Finite element model of LP-1.
Buildings 13 02830 g002
Figure 3. Simulation results of LP-1: (a) contour of axial stress of steel tube; (b) contour of resultant displacement; (c) comparison of load–deflection responses.
Buildings 13 02830 g003
Figure 4. Construction drawing of the square steel tube.
Buildings 13 02830 g004
Figure 5. Finite element model of 1/4 of the square steel tube.
Buildings 13 02830 g005
Figure 6. Contours of effective stress in steel tube with the model mirrored twice at different loading scenarios: (a) gravity load only; (b) gravity load and lateral pressure; (c) final failure.
Buildings 13 02830 g006
Figure 7. Comparison of the circumferential and axial stresses of the tube after concrete casting under the element local coordinate system.
Buildings 13 02830 g007
Figure 8. Load–deflection curve and axial stress contour (um = 140 mm) of S-M-6.4-0.1 under the action of compressive load.
Buildings 13 02830 g008
Figure 9. Stress developments of steel tube elements at the column midsection.
Buildings 13 02830 g009
Figure 10. Results for concrete elements at the column midsection: (a) axial stress developments; (b) axial strain developments.
Buildings 13 02830 g010
Figure 11. Failure mode of S-M-6.4-0.0.
Buildings 13 02830 g011
Figure 12. Load–deflection responses of S-M series models: (a) e = 6.4 mm; (b) e = 20 mm; (c) e = 120 mm; (d) e = 240 mm.
Buildings 13 02830 g012
Figure 13. Load–deflection responses of S-S series models: (a) e = 3.2 mm; (b) e = 20 mm; (c) e = 120 mm; (d) e = 240 mm.
Buildings 13 02830 g013
Figure 14. Load–deflection responses of S-L series models: (a) e = 9.6 mm; (b) e = 20 mm; (c) e = 120 mm; (d) e = 240 mm.
Buildings 13 02830 g014
Figure 15. Influences of initial stress ratio β on the ultimate load-bearing capacities of (a) S-M series columns, (b) S-S series columns, and (c) S-L series columns.
Buildings 13 02830 g015
Figure 16. Influences of the eccentricity ratio on (a) slope of influencing trend lines for the ULCC and (b) ϕ0.1 coefficient.
Buildings 13 02830 g016
Figure 17. Influences of eccentricity ratio e/B on ULCC of square CFST columns.
Buildings 13 02830 g017
Table 1. Advantages and disadvantages of CFST columns.
AspectAdvantageDisadvantage
DesignHigher LCC [6,7,8]Limited design standards and guidelines
Increased ductility [6,7,8]
Superior fire resistance [9,10]
Larger energy absorption capacity for resisting impact [10,11] and earthquake [8,12] loads
ConstructionSteel tube functioning as permanent shuttering for concrete, saving considerable amount of formwork materials and accelerating the construction processHigher requirements for construction expertise
Difficulty in strengthening and retrofitting existing structures
Table 2. Design parameters of LP-1.
B (mm)t (mm)l (mm)λe (mm)βfy (MPa)fcu (MPa)
1202.65140040140.534036.0
Note: B = cross-section dimension of the square CFST column; t = thickness of the steel tube; l = column height; λ = slenderness ratio; e = eccentricity of loading; β = initial stress ratio; fy = yield strength of steel; fcu = cubic compressive strength of concrete.
Table 3. Q340 steel material parameters.
ρ (ton/mm3)E (MPa)νfy (MPa)Etan (MPa)
7.85 × 10−92.07 × 1050.2673404.00 × 103
Note: ρ = density; E = elastic modulus; ν = Poisson’s ratio; fy = yield strength; Etan = tangent modulus.
Table 5. Comparison of the calculated ULCCs against test results in literature.
SpecimenD (mm)t (mm)l (mm)e (mm)βNu,exp (kN)Nu,cal (kN)Nu,cal/Nu,exp
LP-11202.651400140.55605350.956
LP-21202.65140000.57306550.897
LP-31202.651400140.75525350.969
LP-41202.651400310.54524220.934
LP-61202.651400310.33973930.989
LP-71202.651400310.73903931.007
Mean0.959
COV0.041
Note: Nu,exp = ULCCs from experiments; Nu,cal = ULCCs calculated using the proposed method.
Disclaimer/Publisher’s Note: The statements, opinions and data contained in all publications are solely those of the individual author(s) and contributor(s) and not of MDPI and/or the editor(s). MDPI and/or the editor(s) disclaim responsibility for any injury to people or property resulting from any ideas, methods, instructions or products referred to in the content.

