Article

Investigating the Sorption Isotherms and Hysteresis of a Round Perforated Brick Using Newly Developed Models

by
Intissar Ferrak
1,
Rami K. Suleiman
2,*,
Mahfoud Kadja
1,
Mohammad Mizanur Rahman
2,
Lina Boumediene
1,
Fadi A. Al-Badour
2,3,
Tawfik A. Saleh
2,4 and
Mohammed Hadj Meliani
5
1
Laboratory of Applied Energetics and Pollution (LAEP), Department of Mechanical Engineering, University of Brothers Mentouri 1, Constantine 25000, Algeria
2
Interdisciplinary Research Center for Advanced Materials, King Fahd University of Petroleum and Minerals (KFUPM), Dhahran 31261, Saudi Arabia
3
Mechanical Engineering Department, King Fahd University of Petroleum and Minerals (KFUPM), Dhahran 31261, Saudi Arabia
4
Chemistry Department, King Fahd University of Petroleum and Minerals (KFUPM), Dhahran 31261, Saudi Arabia
5
Laboratory of Theoretical Physics and Materials, Hassiba Benbouali University of Chlef, P.O. Box 151, Hay Salem, Chlef 02000, Algeria
*
Author to whom correspondence should be addressed.
Buildings 2023, 13(11), 2804; https://doi.org/10.3390/buildings13112804
Submission received: 1 October 2023 / Revised: 1 November 2023 / Accepted: 6 November 2023 / Published: 8 November 2023
(This article belongs to the Topic Building Energy Efficiency)

Abstract

:
This article deals with the hygrothermal behavior of round perforated brick including hysteresis effects. It aims at examining the effect of temperature on sorption isotherms and hysteresis of this product, reducing the energy consumption of the buildings, reinforcing the constructional economy and the inhabitant’s comfort as well as offering a hygrothermal description of this product that has never been previously investigated. To achieve this, we have carried out an experimental study to determine the sorption isotherms and the hysteresis in five different temperatures (10, 23, 30, 40, and 50 °C). Twelve equations have been tested against the experimental isotherms in order to find the optimal one. After that, three models were tested in order to develop a personal model; the latter explains the real effect of the hysteresis phenomenon on hygrothermal behavior of the studied product. To validate the mathematical model, two methods were applied to calculate the isosteric heat. The obtained results revealed a significant influence of the increase in temperature on the hygrothermal behavior in which a decrease in the equivalent water content was found. Moreover, the developed experimental model is based on Oswin’s model describing the dependence of temperature on the sorption characteristics of round perforated bricks. Furthermore, the Huang model was found to be the best compared with the other models with a regression factor (R2) of 0.990. The validation of the results using the isosteric heat parameter has confirmed that the suggested models demonstrated a perfect presentation of the sorption isotherms and the hysteresis phenomenon of the round perforated brick.

1. Introduction

The worldwide building sector needs 36% of the world’s final energy consumed each year [1]. According to an assessment done by the Office of the Commissioner for Renewable Energy and Energy Efficiency (CEREFE) [2], national energy consumption increased by 59% between 2010 and 2019. The energy consumption in the building sector is 41% according to a study conducted by the Agency for the Promotion and Rationalization of Energy Use (APRUE) [3]. To reduce energy consumption, it is preferable to use intelligent walls that ensure a building’s thermal comfort; the innovation is in choosing a high-performance envelope that can be ensured by the careful selection of the construction materials to be used. In the Algerian Sahara, the climate is dry and temperatures vary from day to night and from summer to winter, in which it can reach 50 °C on summer days and below 0 °C on winter nights. Using high hygroscopic materials can, based on previously published studies in the literature, help in regulating the humidity level in buildings. Several researchers [4,5,6] reported that these materials are suitable for humidity and temperature regulators. They can also contribute to energy consumption and ensure thermal comfort during winter and summer days. This latter is one of the targeted aims to achieve sustainable development [4,5]. The drying process is an essential step in construction materials production which needs a sorption isotherms’ determination (kindly see Refs. [4,7,8] for more details).
Internal and external environmental conditions are among the factors that influence the adsorption and desorption profiles [6,7]. The origin of the effect of temperature on the evolution of the water content of the round perforated brick is the objective of the present study. Furthermore, one of the aims of the current experimental study is to provide a hygrothermal description of the product that is used heavily in masonry structures, due to the fact that this description of the round perforated bricks has never been reported previously in the literature. Moreover, this constructional product is highly demanded in Algeria. Sormoli and Martınez [8,9] have studied the impact of temperature on food products. Zhang inserted the effect of temperature on the sorption isotherm for wood materials [10], as well as construction products such as hemp concrete, rapeseed concrete [11], and polystyrene concrete [12]. The gravimetric method has been applied in our experimental tests. It is based on the EN ISO 12571 standard [13] and is most commonly used for sorption isotherms. It consists of placing the samples examined in desiccators or jars containing saturated saline solutions to maintain desired humidity at controlled temperatures [14,15]. This method aims at calculating the product′s water capacity at a hygroscopic equilibrium. Several studies of the sorption isotherms of building products have discussed the desorption and adsorption curves at constant temperatures [16,17,18,19]. However, others were focused on the effect of temperature on the evolution of equilibrium water content of hygroscopic materials [11,15,20]. Sorption isotherms describe only adsorption and desorption from dry or saturated products. The main curves, therefore, do not describe the actual evolution of the water content. The research studies on the effects of temperature on the phenomenon of hysteresis is noticeably increasing; nevertheless, it remains less-treated in the literature because of its complexity [10] for hemp concrete and [12] for polystyrene concrete. In the literature, some studies have shown that this phenomenon does not occur in materials having a porous structure that is composed of closed pores on one side [21,22]. Surprisingly, recent studies have reported an opposite behavior [23,24]. The phenomenon of hysteresis was taken into consideration in this work in order to identify the influence of temperature and hysteresis on the real evolution of the moisture content in the round perforated bricks at temperatures ranging from 10 to 50 °C. “Hysteresis” can be defined as the energy lost after repeated loadings. The experimental data were generated from the tests carried out at the Laboratory of Structural Mechanics, Tahri Mohammed University Bechar—Algeria. The adopted method to study this phenomenon is based on the gravimetric method. Several models describing the structure of water at the surface and inside materials can be found in the literature to correlate and adjust the experimental data. In 1930, Haines studied the relationship between water content and capillary pressure. He showed that the filling and emptying of pores did not occur in the same way [25]. Several researchers identified hysteresis as linking capillary pressure to water. The existing models in the literature can be empirical models based on experimental results and physics-based domain models [26]. Poulovassilis [27] examined a model of independent domains in his works on water transport in porous environments. Pores, where water exists in the adsorption phase, have a radius higher than in the desorption phase [27]. Due to the uncertainty in the obtained results from the experiments, new models [28,29] for porous materials were developed. Kool and Parker [30] have developed a mathematical model in which the intermediate curves have a similar shape to the main curves. The model reflects the hysteretic behavior considering the trapped air inside the pores. The mathematical model of Kool and Parker is not the only hysteretic model in the literature. Two other models were also reported for building materials, such as hemp concrete and polystyrene concrete brick, which are the empirical (Pederson 1990) and physical (Mualem, Carmeliet) models, respectively.
The objective of the current study is to investigate the effect of temperature on the sorption isotherms and hysteresis of round perforated bricks, instead of full bricks, as a solution to reduce the energy consumption of the buildings. Twelve models were used to fit the experimental data of the sorption curves. To evaluate the real effect of hysteresis on the material’s thermo-hydric behavior, three models (empirical, physical, and mathematical) were tested. Algerian Red Medjana is a clay used for the first time in the manufacture of red products. The walls built with this product are smart walls, thanks to the brick perforation that ensures energy control. The developed models for the sorption isotherms and hysteresis phenomenon offer a hygrothermal characterization of the product under study, in particular its water capacity at various temperatures. This article is based on a microscopic hygrothermal study of round perforated bricks to improve the energy and environmental performance of buildings.

2. Materials and Method

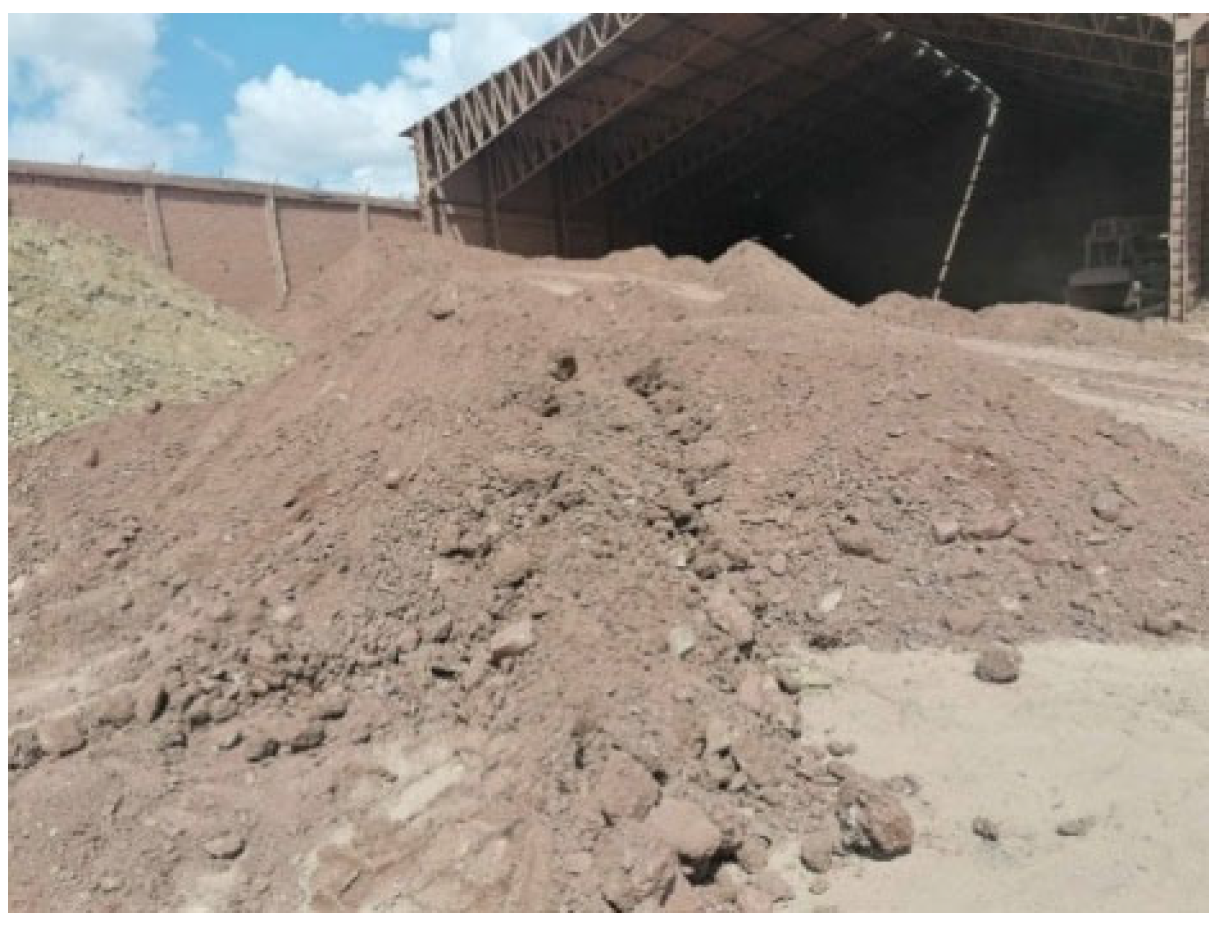
2.1. Materials Description

The product used in this work was acquired from the production line at the BORAS (Setif, Algeria) brick works. Figure 1 depicts a digital photograph of the product. The characterization results of this product are shown in Table 1.
In this investigation, the round perforated bricks are made of 100% natural Red Medjana clay (see Figure 2). A geotechnical study has been done on the clay, which was extracted from a depth of 40–50 m, in the Eastern Public Works Laboratory, Constantine (LTPE). The methods used are based on European standards and the obtained results are summarized in Table 2. The NF EN 1097-5 was used to determine the actual water content and the latter can be calculated using the following equation:
W = M w M S × 100
where, M w is the mass of water in the soil and M S is the mass of solid particles in the soil. The NF P 94-054 was used to determine the density of solid soil particles in the water pycnometer the test was carried out by boiling as long as the material used was insensitive to heat (clay). Mathematically, the density of solid particles translates into the following relationship:
ρ s = ρ w m 2 m 1 m 4 + m 2 m 1 m 3
where, m 1 is the mass of the empty pycnometer, m 2 is the mass of the pycnometer containing the test sample, m 3 is the mass of the soil and water pycnometer, m 4 is the mass of the pycnometer is full of water, and ρ w is the water density. The NF P 94-051 stands for the relationship between soil water content and soil behavior. Figure 3 shows the results of the Atterberg limits of Red Medjana clay. The three states of soil (Atterberg limits) are distinguished as follows: (i) liquid limit WL: water content of a reworked soil at the point of transition between the liquid and plastic states, (ii) plasticity limit WP: water content of a reworked soil at the point of transition between the plastic and solid states, and (iii) plasticity index IP: the difference between the two limits (plasticity and liquidity).
I P = W L W P
W: is the water content of the soil in its natural state.
NF P 94-056 and NF P 94-057 for the measurement of the particle size from soil and sediments using sedimentation and Granulometric analysis. There are two types of particle size analysis: (i) dry sieving (for grain sizes greater than 80 µm) in which the different particle sizes are determined by their ability to pass through different mesh sieves, and (ii) sedimentation (for grain sizes below 80 µm). Soil grain sizes are determined by their sedimentation rate in water. The granulometric curve (shown in Figure 4) is made up of several classes, notably pebbles, gravel, sand, silt, and clay. These classes are the zones in which the sizes occur.

2.2. Sample Preparation

To study the hygrothermal behavior of the round perforated brick based on the sorption isotherms on the brick, our product has been cut into small pieces of 2 × 2 × 2 cm3 dimensions (see Figure 5). This dimension was chosen according to EN ISO 12571 [13].

2.3. Experimental Method

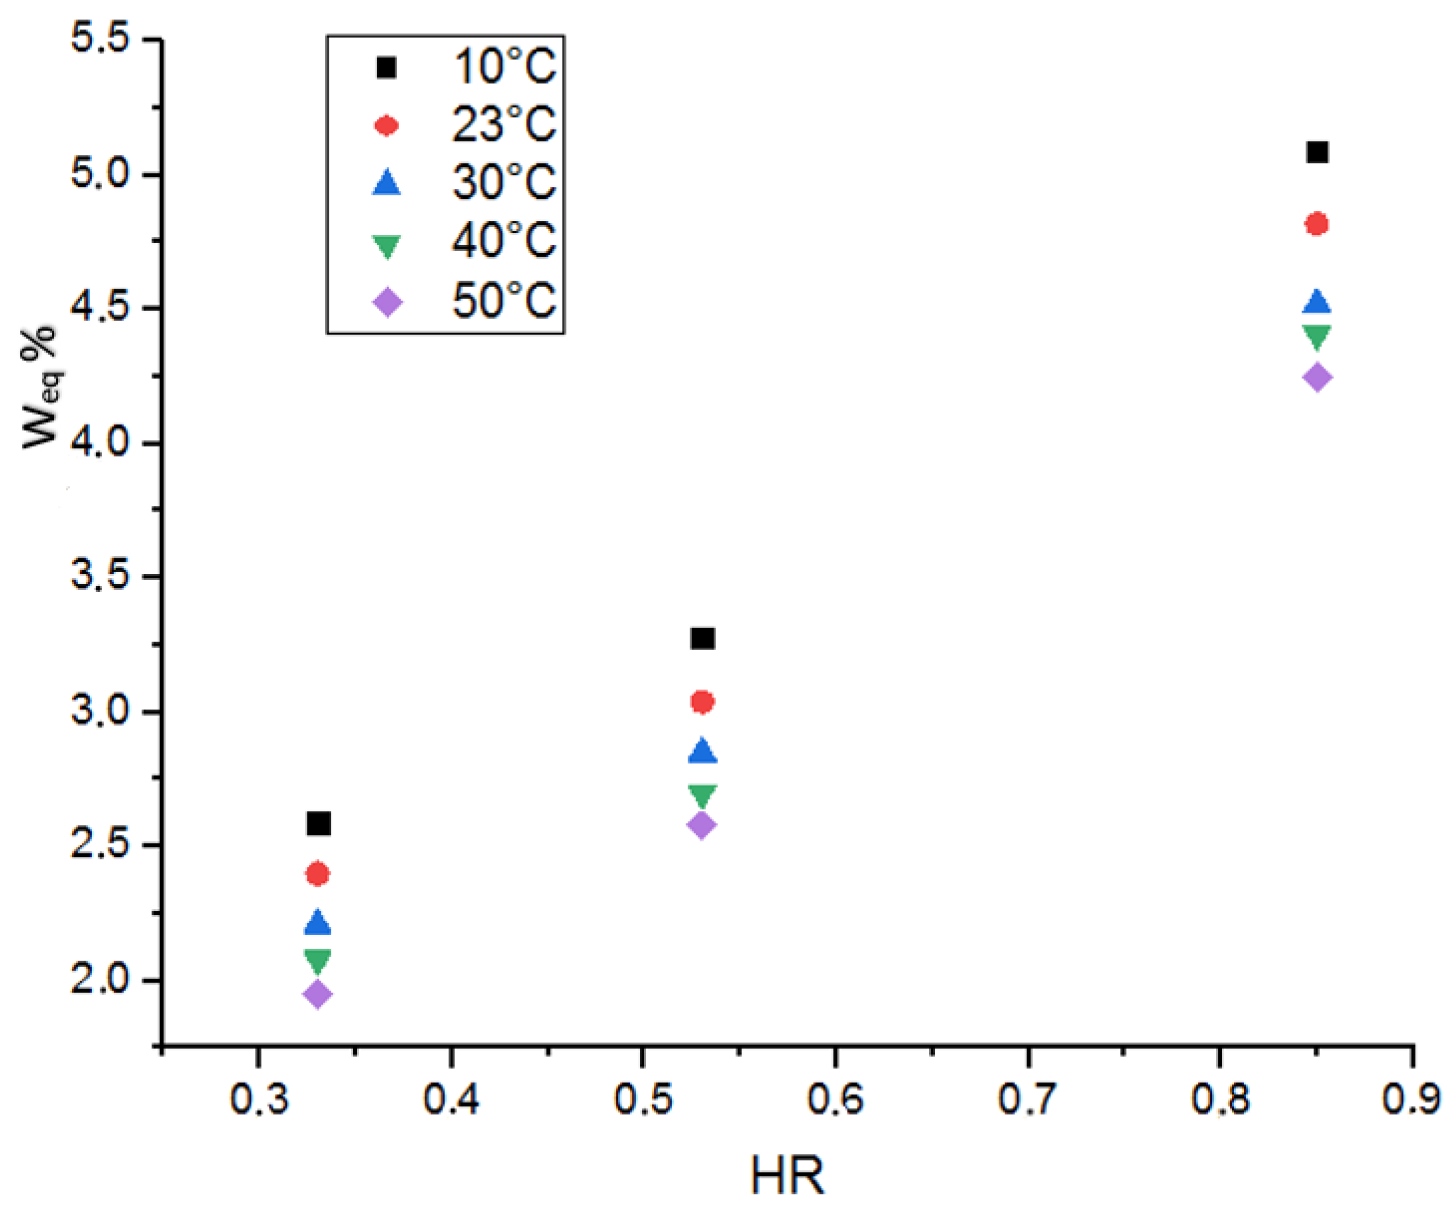
Temperature Effect on Water Capacity of the Round Perforated Brick

The present tests are based on the gravimetric method [29]. It is described in the European and American standards ISO-12571, 2000 and ASTM C1498, 2010, respectively [13,36]. This method measures the hygroscopic equilibrium water content of the product studied according to the relative humidity at five different temperatures. According to [37,38], the natural diffusion of water vapor ensures the hygroscopic equilibrium between the product and the surrounding environment. Six jars were used for these experiments, and each jar had three samples located on a sample holder and a quarter of different saline solutions (KOH, MgCl2.6H2O, K2CO3, NaNO3, KCl, and distilled water) to ensure constant relative humidity, respectively (9, 33, 44, 74, 85, and 99%) [10], as shown in Table 3. The jars containing the different solutions were placed in a ±1 °C controlled-temperature room.
Reaching 100% dry brick samples is necessary to start the adsorption experiment. To ensure this condition, the 18 samples were dried in an oven at 105 °C for 24 h. After that, all the jars were placed in a conditioned room at five constant temperatures (10, 23, 30, 40, and 50 °C). The pieces were weighed every 24 h with an electronic precision scale of 0.001 g, until they reached a hygroscopic equilibrium with the surrounding environment. The hygroscopic equilibrium is confirmed when the mass of the samples stays constant in three successive weightings [13]. The achievement of this equilibrium required around 27, 24, 22, 20, and 20 days for the 10, 23, 30, 40, and 50 °C temperatures, respectively. The equilibrium water content of each jar was calculated according to the equation below:
W eq = m h m s m s
where Weq is the equilibrium water content [kg/kg], mh is the wet mass [kg], and ms is the dry mass [kg]. Before starting the desorption experiment, a relative humidity of 99% was targeted for the samples. To achieve this, the desorption samples (18 samples) were placed in jars that are full of distilled water for 15 days (the required time to obtain a complete water saturation of the product). All the pieces were divided into six jars. In thermal-stability rooms, every three saturated samples were in a jar with a saline solution under the five studied temperatures. The samples were weighed every 24 h, similar to the followed methodology in the adsorption experiments. The moisture content is expressed in Equation (1) as a function of relative humidity. After 30 days of the experiment, the samples were placed in an oven at 105 °C for the determination of their dry masses. On the other hand, the determination method of the hysteresis was similar to that of the sorption isotherms. The distinction between the two methods can be attributed to two key factors. Firstly, the initial step of the experiment necessitates the desorption of bricks that were saturated at 85% HR for the first method, and 53% HR for the second method. Secondly, the same bricks employed in the desorption process are subsequently used in the adsorption phase. This condition cannot be verified in the sorption isotherms method.

2.4. Appropriate Models

2.4.1. Sorption Isotherms

Twelve models were selected to describe the sorption isotherms in the five temperatures, namely (GAB, Halsey, Henderson, Oswin, Modified Chung–Pfost, Halkings, Langmuire, Peleg, Smith, Caurie, Hailwood–Horrobin (HH), BET) as presented in Table 4. Fitting of the experimental data was made by the Curve Expert Professional software (version 2.6.5). The correlation coefficient (R2) is the first criterion for evaluating the quality of fitting in our study. In addition to R2, two other criteria were adopted to evaluate the goodness of fit of each model: the relative mean error (MRE) and the residuals sum of squares of (RSS). These statistical parameters are defined as follows (all coefficient parameters depicted in Equations (5)–(7) are explained in detail in Refs. [13,15]).
  • Coefficient of determination:
R 2 = i = 1 n M i , e x p M m , e x p M i , m o d M m , m o d 2 i = 1 n M i , e x p M m , e x p 2 M i , m o d M m , m o d 2
  • The relative mean error:
M R E = i = 1 n M i , e x p M i , m o d M i , e x p
  • The residual sum of squares:
R S S = i = 1 n M i , e x p M i , m o d 2

2.4.2. Hysteresis Phenomenon
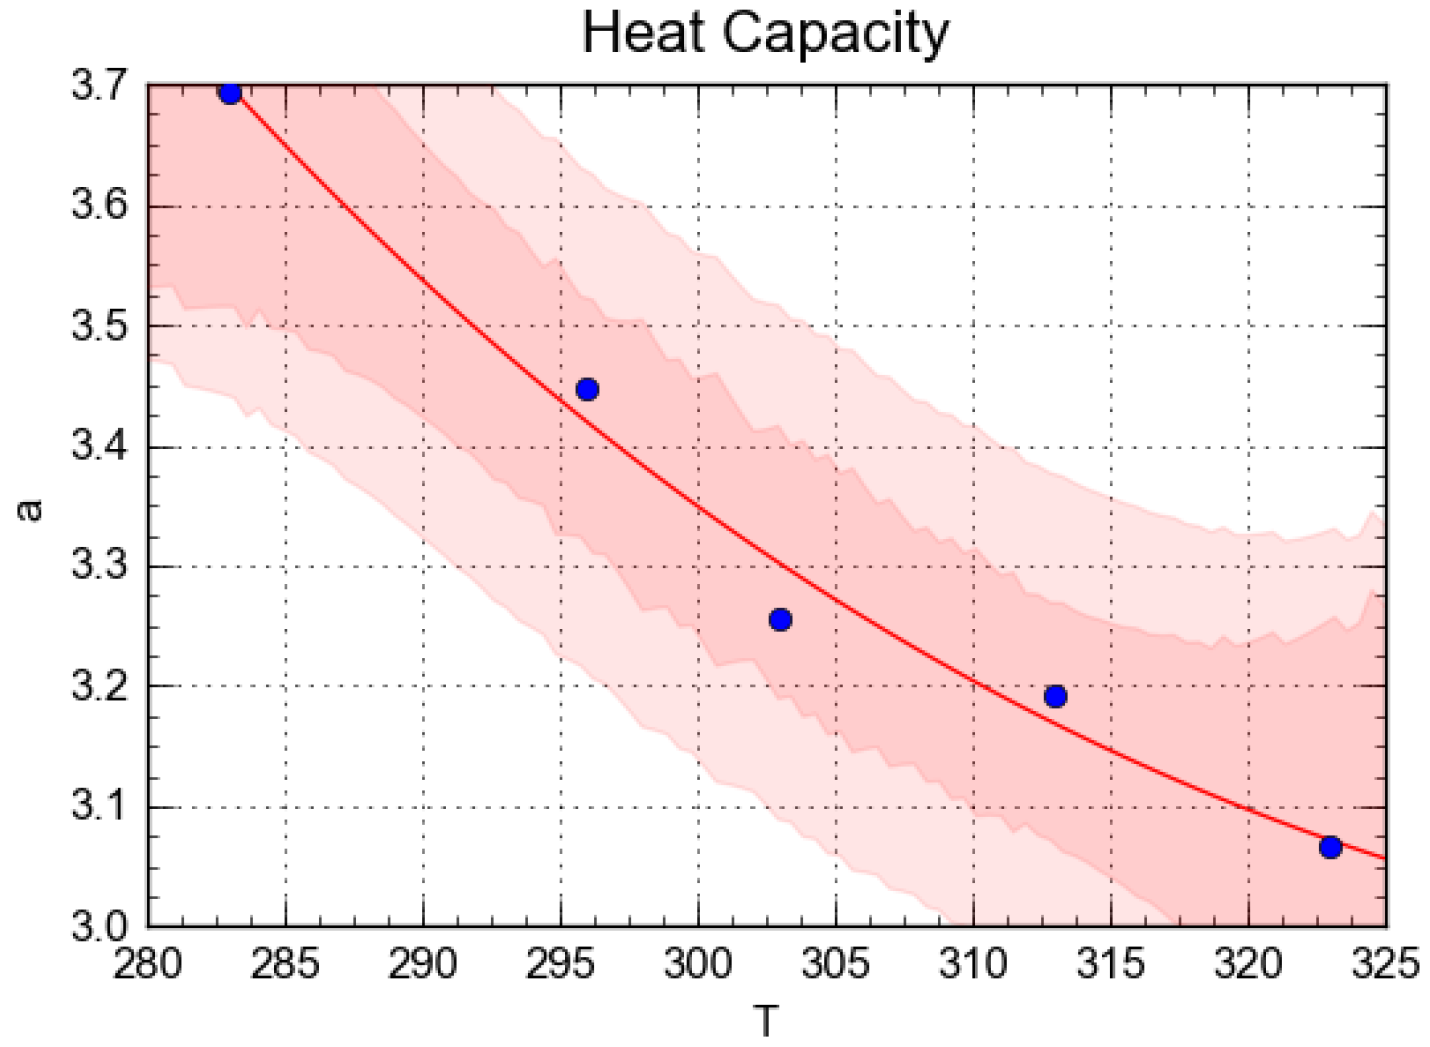
The hysteresis phenomenon can be described using three mathematical models, including the Huang 2005 based on the model Kool & Parker 1987 [44], the Physical model Carmeliet 2005 [45] based on the model Mualem 1974 [46], and the Empirical model Pedersen 1990 [15,47,48]. The three models are described in Table 5.

2.5. Isosteric Heat

The energy released by a product’s adsorption or desorption during its contact with a mole of water particles is called the isosteric heat. It is determined by the Clausius-Clapeyron equation presented by [ln(aw)] (logarithm of water activity), Equation (8) as a function of the inverse of temperature at a fixed relative humidity.
ln a w = q s t R 1 T
where qst: Isosteric heat [J/mol], R = 8.314 Ideal gas constant [J/mol.K], T: temperature [K], −(qst/R) the slope of the curve obtained, aw: water activity.

3. Results and Discussion

3.1. Sorption Isotherms (Adsorption/Desorption)

The curves of the sorption isotherms exhibit the evolution of the equilibrium water content in the material as a function of the relative humidity at a fixed temperature. The hygroscopic equilibrium took a relatively long time to be attained. Due to this, jars were used instead of the desiccator (see Figure 6). The equilibrium water content of each jar was calculated using Equation (1).
The results of measuring the adsorption and desorption isotherms on a sample of round perforated bricks at five different temperatures are shown in Figure 7 for the (a) adsorption and (b) desorption.
The equilibrium water content was found to increase gradually according to the relative humidity and becomes essential at high values when the relative humidity reaches 12.03% at 23 °C (at a reference temperature). According to the International Union of Pure and Applied Chemistry (IUPAC), the sorption isotherms of the round perforated bricks had a sigmoidal form and are classified in the isotherms’ group type II; this sigmodal form is generally found in the hygroscopic construction materials [49]. The sorption isotherms of the round perforated bricks at T = 23 °C are similar to those reported previously in the literature. The present sorption isotherms results are similar to those of Miloudi et al. [15], who studied the hygrothermal behavior of Compressed Earth Brick Stabilized (CEBS) by the effect of five different temperatures on the sorption isotherms. The equilibrium water content reported by Miloudi at 23 °C equals 5.8% [15]. Remki investigated two types of Algerian clay brick stabilized at 25 °C [50] in which the equilibrium water contents were found equal to 4.5% and 2.8%. Cagnon studied the hygrothermal behavior of five different earth bricks [51], and the water content of the studied bricks was found in the range of 4–5%. However, this value reached 13.5% in the case of cement paste [51]. Saidi has studied the hygric behavior of four types of Tunisian earth bricks at 25 °C and found that maximum water content of about 5.69% at 97% RH [19]. Another study reported the equilibrium water content of the polystyrene concrete to be 10% at 23 °C [52]. In a very high degree of humidity, the bricks and building materials studied in the literature have less water capacity than the current product; this latter is the most hygroscopic product. This difference lies in the morphology of the round perforated brick. The studied environment is completely thin and no longer contains grains, so it is 100% porous. Hence, it can stagnate water particles more than other building products. This can be justified by the increase in the required duration of adsorption and desorption of water by brick compared to construction products such as CEBS [15] and hemp concrete [20]. It is obvious that the time needed to reach the hygroscopic equilibrium is diminished when the temperature increases. This observation was validated by the results presented in the work of Si-Yang Yi who demonstrated that the increase in the diffusion of water vapor can be attributed to the increase in the temperature [47]. Figure 6 illustrates the variation of the moisture content in different temperatures at a relative humidity HR of 99% for the adsorption and desorption isotherms of round perforated bricks. The results show that the equilibrium water contents are 12.32, 12.03, 11.87, 11.7, and 11.58% for temperatures of 10, 23, 30, 40, and 50 °C, respectively. In a fixed relative humidity, either during adsorption or desorption, the equilibrium water content for a low temperature is greater than that for high temperatures. So, water condensation in round perforated brick walls in the winter is abundant compared to the condensation in the summer (see Figure 8).

Analytical Modeling

Twelve models were chosen for the sorption isotherms modeling. It was found that Oswin’s model gave the best results compared to the other models for five studied temperatures. The choice was made under the conditions of obtaining a very high R2 value and a low RSS and MRE [10]. The Oswin′s general formula is shown below:
W e q = a H R 1 H R b
The equilibrium water content is a function of relative humidity and “a” and “b” are coefficients that vary with the increase in the temperature either for desorption or adsorption. This explains the reason the proposition of a model of sorption isotherms that is based on Oswin’s model as a function of relative humidity and temperature for our analyses (see Table 6).
The temperature term is not shown in the Oswin’s model. Hence, coefficients “a” and “b” were modeled and found to vary as a function of temperature. These formulas were integrated into Oswin’s equation instead of the constant values “a” and “b”. This modeling method cannot be followed if the model is not the same for all the temperatures. Figure 9, Figure 10, Figure 11 and Figure 12 present the evolution of “a” and “b” according to temperatures for the adsorption and desorption using the Curve Expert Professional software.
The relationship between “a” and T is reversal, while the relationship between “b” and T is co-positive. Using the Curve Expert professional software, a modeling has been conducted to extract the formula of “a” and “b” in relation to T (see Table 7). These relations are based on the heat capacity and Reciprocal Quadratic models as shown below:
Heat   capacity   y = a + b x + c x 2
Reciprocal   Quadratic   y = 1 ° + b x + c x 2
The obtained relationships need to be integrated into Oswin’s formula. The general model of the water content evolution within the brick as a function of humidity and temperature is presented in Table 8.
The previous method is applied when the fit model of the experimental result of each temperature was not the same although it is not applicable if different adjustment models were obtained. This model was found to be valid under the two conditions: HR [9–99%] and T [10–50 °C]. In order to find the real effect of temperature on the hygrothermal behavior of the round perforated brick, the hysteresis phenomenon should be taken into consideration.

3.2. Hysteresis Phenomenon

Hysteresis is related to the behavior of water within the poral product. The water outlet in the desorption phase is more difficult than the inlet (adsorption). This delay is mainly due to the morphology of poral networks (the Ink Bottle effect) and the contact angle of the liquid/solid interface. To study the hysteresis of the round perforated brick at different ambient temperatures (10, 23, 30, 40, and 50 °C), two paths were imposed on drawing the intermediate curves from their main adsorption and desorption curves: (i) primary desorption (decreasing HR) 81–53–33% and 53–20% and (ii) secondary adsorption (increasing HR) 33–53–81% and 20–53% for pathways 1 and 2, respectively. Hysteretic experimental results of the desorption and adsorption of bricks in paths 1 and 2 are presented in Figure 13, Figure 14, Figure 15 and Figure 16, respectively.
The construction of these intermediate curves reveals that the hysteresis phenomenon influences the equilibrium water content evolution within the brick. The evolution of the equilibrium water content in relation to humidity either for the first path or for the second takes the form of the main sorption curves but with different values. At 23 °C, the equilibrium water contents were 4.82% and 2.84% for the humidity of 85% and 53% for Paths 1 and 2, respectively. The moisture content at HR = 85% and 23 °C in sorption isotherms is equal to 5.59%. Since sorption isotherms no longer give the actual values of the equilibrium water content, the joining of the hysteresis phenomenon is very important. The point (HR = 53%) can be chosen to compare the water content of the presently used material and other materials studied in the literature for a reference temperature of 23 °C. The first path Weq is equal to 3.05% for desorption and 3.0% for adsorption, which are almost equivalent to those of Hemp concrete in Ait Oumezian work [20]. This remark is the same for the second path. Under the same comparison conditions, the moisture content in the desorption equivalent to the humidity of 53% in the first path is greater than that in the second path. This can be explained by the difference in the amount of water found in the wet material studied for the first path, which is wetter than the one used for the second path.

Analytical Modeling

Three models were tested at 23 °C to check the appropriate one for the hysteresis description. The results of the coefficients of determination and the models′ formulas at 23 °C (reference temperature) are presented in Table 9.
The two models Carmeliet and Huang can be compared; however, the other model “Pederson” requires a particular analysis for its empirical nature [20]. For the method in which the coefficient B is set at 2, coefficients A and C can be determined from the experimental results in the secondary adsorption and primary desorption, respectively. The coefficient of determination is based on the experimental results in the desorption phase following the water path of 85–33% HR is C = 0.27, whereas coefficient A = −0.67 was obtained from the experimental results in the adsorption phase following a water path of 33–85% RH. Therefore, Pedersen’s model is clearly unsuited to the description of the hysteretic behavior of the round perforated brick. Concerning the physical model of Carmeliet, it was not considered as a mathematical model for our study since the results obtained using this model were very far from the experimental results. The mathematical model of Huang is, therefore, the optimal one that allows the reproduction of the water content evolution of the brick studied in the most realistic way for both adsorption and desorption cases. The equation′s coefficients of water content for the two paths are presented in Table 10 as follows:
W H R , 1 = A + B H R 1 H R b
The obtained hysteretic models of the water contents of the brick are based on relative humidity. The coefficients A, B, and b were modeled to find their formulas with respect to temperature. These formulas were integrated into the general model of the water content as a function of the relative humidity and temperature. The obtained values for the coefficients A and B are plotted in Figure 17.
The general model for the first path is valid for the whole moisture interval of this path from 33% to 85% and for the five ambient temperatures. The general model of the second path is valid for the whole relative interval humidity from 20% to 53% and for all five studied ambient temperatures. The general models are presented in Equation (13) and Table 11:
W H R , 1 = X + Y H R 1 H R b
The main “desorption and adsorption curves” noted by Wdes and Wads, respectively, and “the intermediate primary and secondary desorption and adsorption curves” presented by H1ads, H1des, H2ads, and H2des, respectively, are shown in Figure 18. The obtained curves have the same trend but with different values.
In the present experimental study of the hysteresis phenomenon, the intermediate curves obtained were identical to those obtained by Ait Oumezian [20], who investigated the effect of the hysteresis phenomenon on the hygrothermal behavior of hemp concrete. For water path 1, the moisture content in the desorption phase is higher than in the adsorption phase for a given relative humidity. Ramirez investigated the hygrothermal behavior of four different products (B, LM, CM, and LMJ), and the hysteresis phenomenon was found only for the CM cement mortar and LMJ masonry joints [53]. Laroussi showed that there was a difference in the angle of contacts when comparing the material with the desorption and the adsorption phases [54]. The nail formed on the rough surface (the product in the adsorption phase) was larger than that in the case of a smooth surface (the product in the desorption phase) [15]. The primary desorption and secondary adsorption water contents in the second path were almost identical. A humidity degree of 53% can be considered a point of comparison because it is a common point for both paths. The appearance of hysteresis in the first path was more vivid than the second one, where the delay tends toward zero in the latter. This can be justified by the difference in the water content in the samples of the first and second paths. Hence, this phenomenon is directly related to the water capacity at the beginning of the primary desorption.

3.3. Isosteric Heat

In this experiment, isosteric heat was used to validate our proposed hysteretic model. The determination of this parameter necessarily involves the determination of the water content for all the studied temperatures. Two methods of calculation were used. The first technique was conducted to find the slope (−(qst)/R) using the model of adjustment of each temperature, while the second one was based on the general hysteretic model by using the formula of Clausius-Clapeyron Equation (5). The isosteric heat curves was plotted for the adsorption and desorption phases and shown in Figure 19.
The absolute values of the slopes of the isosteric curves (−(qst)/R) found to decrease when the equilibrium water content increases until they converge to zero. A good agreement between the values calculated by the hysteretic general model and those of the model of each separate temperature was observed. Moreover, it can be reported that the present hysteretic model based on determining the moisture content according to relative humidity and temperature was valid for the entire humidity range under all the studied temperatures. According to [15]; the isosteric heat of a poral medium takes its maximum value when the material is in the state of mono-molecular adsorption. Thus, in the case of the study of the hygrothermal behavior of a poral environment in the entire humidity range [0–100%]. The beginning and the end of the mono-molecular phase of a material can be specified using the isosteric heat. Based on the above, we found that in the case of hysteresis, the same conclusion is not valid.

4. Conclusions

In the present study, the hygrothermal behavior of the round perforated bricks was treated at five different temperatures with relative humidity ranging from 0% to 99%. The increase in the temperature led to a decrease in the water capacity of the product either during adsorption or desorption. In another way, the water content increased gradually according to the HR until it reached 12.3% for HR = 99% at 23 °C. When comparing the round perforated brick to other products, the sample found to be the most hygroscopic one. The experimental adsorption and desorption results were modeled using the modified Oswin’s model to confirm the evolution of the water content as a function of the relative humidity and temperature. In order to determine this parameter, the phenomenon of hysteresis was taken into consideration and found to affect directly the Weq evolution. This can be explained by the difference between Weq (HR = 85%, T = 23 °C), in the case of sorption isotherms and hysteresis equal to 5.59% and 4.82%, respectively. A mathematical model was developed based on the Huang model using experimental data obtained at the same ambient temperatures and for two relative humidity paths ranging from 20% to 85%.
The proposed model was validated through the utilization of two methods, including the calculation of isosteric heat via the Clausius–Clapeyron equation. This calculation allows for an estimation of the actual moisture storage capacity of the round perforated brick, taking into account the presence of the hysteresis phenomenon. It is concluded that the decrease in the quantity of water within the material led to a reduction in the occurrence of hysteresis. Opposite to this, when the equilibrium water content in the sample was low, the hysteresis tends to approach zero. The confirmation of these findings through the isosteric heat parameter supports the efficacy of the proposed models in accurately describing the sorption isotherms and the hysteresis phenomenon observed in the round perforated brick.

Author Contributions

Conceptualization, I.F. and M.H.M.; methodology, M.K. and L.B.; formal analysis, R.K.S., M.K. and T.A.S.; investigation, M.H.M., I.F., L.B., F.A.A.-B. and M.M.R.; data curation, M.M.R. and T.A.S.; writing—original draft preparation, I.F.; writing—review and editing, R.K.S., M.K., L.B., F.A.A.-B., L.B., M.M.R. and M.H.M.; supervision, M.H.M.; funding acquisition, M.M.R. All authors have read and agreed to the published version of the manuscript.

Funding

This research received no external funding.

Data Availability Statement

The data presented in this study are available on request from the corresponding author.

Acknowledgments

The support provided by the Interdisciplinary Research Center for Advanced Materials (IRC-AM), at King Fahd University of Petroleum & Minerals (KFUPM) is acknowledged.

Conflicts of Interest

The authors declare no conflict of interest.

Abbreviations

CEREFEThe Office of the Commissioner for Renewable Energy and Energy Efficiency
APRUEThe Agency for the Promotion and Rationalization of Energy Use
IUPACThe International Union of Pure And Applied Chemistry
LTPEEastern Public Works laboratory, Constantine
R2The correlation coefficient
MREThe relative mean error
CEBSCompressed earth brick stabilized
RSSThe residuals sum of squares
adsAdsorption
desDesorption
satSaturation
WdesDesorption main curve
WadsAdsorption main curve
H1adsAdsorption intermediate curve (path 1)
H1desDesorption intermediate curve (path 1)
H2adsAdsorption intermediate curve (path 2)
H2desDesorption intermediate curve (path 2)

References

  1. Dulac, J.; Abergel, T. Énergie et bâtiments: Regards sur le reste du monde. In Annales des Mines-Responsabilité et Environnement; Cairn/Softwin: Lyon, France, 2018; Volume 90, pp. 17–21. [Google Scholar] [CrossRef]
  2. Commissariat aux Energies Renouvelables et à l’Efficacité Energétique (CEREFE). Transition Energétique en Algérie. 2020. Available online: https://www.cerefe.gov.dz/wp-content/uploads/2022/02/Rapport_CEREFE_TE-2020-4.pdf (accessed on 5 November 2023).
  3. Anisse, C.; Mohammed, B.; Sofiane, A. en Algérie: Analyse et Recommandations. p. 112. Available online: https://www.asjp.cerist.dz/en/downArticle/13/9/3/174257 (accessed on 5 November 2023).
  4. Simonson, C.J.; Salonvaara, M.; Ojanen, T. The effect of structures on indoor humidity-Possibility to improve comfort and perceived air quality: Effect of structures on indoor humidity. Indoor Air 2002, 12, 243–251. [Google Scholar] [CrossRef] [PubMed]
  5. Raji, S. Caractérisation Hygro Thermique, par une Approche Multi échelle, de Constructions en Bois Massif en vue D’amélioration énergétique et de Valorisation Environnementale. Ph.D. Thesis, Université Bordeaux, Bordeaux, France, 2006; p. 226. [Google Scholar]
  6. Al-Muhtaseb, A.; McMinn, W.; Magee, T. Moisture Sorption Isotherm Characteristics of Food Products: A Review. Food Bioprod. Process. 2002, 80, 118–128. [Google Scholar] [CrossRef]
  7. Feng, C.; Janssen, H.; Wu, C.; Feng, Y.; Meng, Q. Validating various measures to accelerate the static gravimetric sorption isotherm determination. Build. Environ. 2013, 69, 64–71. [Google Scholar] [CrossRef]
  8. Sormoli, M.E.; Langrish, T.A. Moisture sorption isotherms and net isosteric heat of sorption for spray-dried pure orange juice powder. LWT-Food Sci. Technol. 2015, 62, 875–882. [Google Scholar] [CrossRef]
  9. Martínez-Ibernón, A.; Aparicio-Fernández, C.; Royo-Pastor, R.; Vivancos, J.-L. Temperature and humidity transient simulation and validation in a measured house without a HVAC system. Energy Build. 2016, 131, 54–62. [Google Scholar] [CrossRef]
  10. Zhang, X.; Zillig, W.; Künzel, H.M.; Zhang, X.; Mitterer, C. Evaluation of moisture sorption models and modified Mualem model for prediction of desorption isotherm for wood materials. Build. Environ. 2015, 92, 387–395. [Google Scholar] [CrossRef]
  11. Promis, G.; Dutra, L.F.; Douzane, O.; Le, A.T.; Langlet, T. Temperature-dependent sorption models for mass transfer throughout bio-based building materials. Constr. Build. Mater. 2019, 197, 513–525. [Google Scholar] [CrossRef]
  12. Maaroufi, M.; Abahri, K.; El Hachem, C.; Belarbi, R. Characterization of EPS lightweight concrete microstructure by X-ray tomography with consideration of thermal variations. Constr. Build. Mater. 2018, 178, 339–348. [Google Scholar] [CrossRef]
  13. ISO 12571; Hydrothermal Performance of Building Materials and Products—Determination of Hygroscopic Sorption Properties. ISO: Geneva, Switzerland, 2000.
  14. Bui, R.; Labat, M.; Aubert, J.-E. Comparison of the Saturated Salt Solution and the Dynamic Vapor Sorption techniques based on the measured sorption isotherm of barley straw. Constr. Build. Mater. 2017, 141, 140–151. [Google Scholar] [CrossRef]
  15. Miloudi, Y.; Fezzioui, N.; Labbaci, B.; Benidir, A.; Roulet, C.-A.; Oumeziane, Y.A. Hygrothermal Characterization of Compressed and Cement Stabilized Earth Blocks. Int. Rev. Civ. Eng. IRECE 2019, 10, 177. [Google Scholar] [CrossRef]
  16. Feng, C.; Janssen, H. Hygric properties of porous building materials (II): Analysis of temperature influence. Build. Environ. 2016, 99, 107–118. [Google Scholar] [CrossRef]
  17. Haba, B.; Agoudjil, B.; Boudenne, A.; Benzarti, K. Hygric properties and thermal conductivity of a new insulation material for building based on date palm concrete. Constr. Build. Mater. 2017, 154, 963–971. [Google Scholar] [CrossRef]
  18. Touré, P.M.; Sambou, V.; Faye, M.; Thiam, A.; Adj, M.; Azilinon, D. Mechanical and hygrothermal properties of compressed stabilized earth bricks (CSEB). J. Build. Eng. 2017, 13, 266–271. [Google Scholar] [CrossRef]
  19. Saidi, M.; Cherif, A.S.; Zeghmati, B.; Sediki, E. Stabilization effects on the thermal conductivity and sorption behavior of earth bricks. Constr. Build. Mater. 2018, 167, 566–577. [Google Scholar] [CrossRef]
  20. Oumeziane, Y.A. Evaluation des Performances Hygrothermiquesd’uneparoi par Simulation Numérique: Application aux Paroisen Béton de Chanvre. Ph.D. Thesis, INSA de Rennes, Rennes, France, 2013; p. 354. [Google Scholar]
  21. Sarkisov, L.; Monson, P.A. Modeling of Adsorption and Desorption in Pores of Simple Geometry Using Molecular Dynamics. Langmuir 2001, 17, 7600–7604. [Google Scholar] [CrossRef]
  22. Bruschi, L.; Mistura, G.; Liu, L.; Lee, W.; Gösele, U.; Coasne, B. Capillary Condensation and Evaporation in Alumina Nanopores with Controlled Modulations. Langmuir 2010, 26, 11894–11898. [Google Scholar] [CrossRef] [PubMed]
  23. Ancilotto, F.; Da Re, M.; Grubišić, S.; Hernando, A.; Silvestrelli, P.; Toigo, F. Grand Canonical Monte Carlo study of argon adsorption in aluminium nanopores. Mol. Phys. 2011, 109, 2787–2796. [Google Scholar] [CrossRef]
  24. Fan, C.; Do, D.; Nicholson, D. On the existence of a hysteresis loop in open and closed end pores. Mol. Simul. 2015, 41, 245–255. [Google Scholar] [CrossRef]
  25. Haines, W.B. Studies in the physical properties of soil. V. The hysteresis effect in capillary properties, and the modes of moisture distribution associated therewith. J. Agric. Sci. 1930, 20, 97–116. [Google Scholar] [CrossRef]
  26. Pham, H.Q.; Fredlund, D.G.; Barbour, S.L. A study of hysteresis models for soil-water characteristic curves. Can. Geotech. J. 2005, 42, 1548–1568. [Google Scholar] [CrossRef]
  27. Poulovassilis, A. The Effect of Hysteresis of Pore-Water on the Hydraulic Conductivity. Eur. J. Soil Sci. 1969, 20, 52–56. [Google Scholar] [CrossRef]
  28. Everett, D.H. A general approach to hysteresis. Part 3—A formal treatment of the independent domain model of hysteresis. Trans. Faraday Soc. 1954, 50, 1077–1096. [Google Scholar] [CrossRef]
  29. Fabbri, A.; Al Haffar, N.; McGregor, F. Measurement of the relative air permeability of compacted earth in the hygroscopic regime of saturation. Comptes Rendus Mec. 2019, 347, 912–919. [Google Scholar] [CrossRef]
  30. Kool, J.B.; Parker, J.C. Development and evaluation of closed-form expressions for hysteretic soil hydraulic properties. Water Resour. Res. 1987, 23, 105–114. [Google Scholar] [CrossRef]
  31. NF EN 1097-5; Essais pour Déterminer les Caractéristiques Mécaniques et Physiques des Granulats—Partie 5: Détermination de la Teneur en Eau par Séchage en Etuve Ventilée. Association Française de Normalisation (AFNOR): Saint-Denis, France, 2008.
  32. NF P 94–054; Sols: Reconnaissance et Essais. Détermination De La Masse Volumique Des Sols Fins En Laboratoire. Méthode du Pycnomètre à Eau. AFNOR: Paris, France, 1991.
  33. NF P94-056; Sols: Reconnaissance Et Essais-Analyse Granulométrique-Méthode Par Tamisage A Sec Après Lavage. Décision Du Directeur Général De L’afnor Le 5 Février 1996 Pour Prendre Effet Le 5 Mars 1996. Association Française de Normalisation (AFNOR): Saint-Denis, France, 1996.
  34. NF P94-057; Sols: Reconnaissance et Essais-Analyse Granulométrique Des Sols-Méthode Par Sédimentation. AFNOR: Paris, France, 1992.
  35. NF P 94–051; Sols: Reconnaissance Et Essais. Détermination Des Limites d’Atterberg. Limite De Liquiditéà La Coupelle–Limite De Plasticité Au Rouleau. AFNOR: Paris, France, 1993.
  36. ASTM C1498; C16 Committee, «Test Method for Hygroscopic Sorption Isotherms of Building Materials». ASTM International: West Conshohocken, PA, USA, 2010. [CrossRef]
  37. Belghit, A.; Kouhila, M.; Boutaleb, B. Experimental study of drying kinetics by forced convection of aromatic plants. Energy Convers. Manag. 2000, 41, 1303–1321. [Google Scholar] [CrossRef]
  38. Young, J.F. Humidity control in the laboratory using salt solutions-a review. J. Appl. Chem. 2010, 17, 241–245. [Google Scholar] [CrossRef]
  39. Oswin, C.R. The kinetics of package life. III. The isotherm. J. Soc. Chem. Ind. 1946, 65, 419–421. [Google Scholar] [CrossRef]
  40. Halsey, G. Physical Adsorption on Non-Uniform Surfaces. J. Chem. Phys. 1948, 16, 931–937. [Google Scholar] [CrossRef]
  41. van den Berg, C.; Bruin, S. Water activity and its estimation in food systems: Theoretical aspects. In Water Activity: Influences on Food Quality; Elsevier: Amsterdam, The Netherlands, 1981; pp. 1–61. [Google Scholar] [CrossRef]
  42. Peleg, M. Assessment of a Semi-Empirical Four Parameter General Model for Sigmoid Moisture Sorption Isotherms. J. Food Process. Eng. 1993, 16, 21–37. [Google Scholar] [CrossRef]
  43. Caurie, M. A new model equation for predicting safe storage moisture levels for optimum stability of dehydrated foods. Int. J. Food Sci. Technol. 2007, 5, 301–307. [Google Scholar] [CrossRef]
  44. Huang, H.-C.; Tan, Y.-C.; Liu, C.-W.; Chen, C.-H. A novel hysteresis model in unsaturated soil. Hydrol. Process. 2005, 19, 1653–1665. [Google Scholar] [CrossRef]
  45. Carmeliet, J.; De Wit, M.; Janssen, H. Hysteresis and moisture buffering of wood. In Proceedings of the Symposium of Building Physics in the Nordic Countries, Reykjavik, Iceland, 13–15 June 2005. [Google Scholar]
  46. Mualem, Y. A conceptual model of hysteresis. Water Resour. Res. 1974, 10, 514–520. [Google Scholar] [CrossRef]
  47. Schiller, P.; Wahab, M.; Bier, T.; Waida, S.; Mögel, H. Capillary Forces and Sorption Hysteresis of Cement Pastes with Small Slit Pores. Procedia Mater. Sci. 2015, 11, 649–654. [Google Scholar] [CrossRef]
  48. Pedersen, C.R. Transient calculation on moisture migration using a simplified description of hysteresis in sorption isotherms. In Proceedings of the 2nd Symposion on Building Physics in the Nordic Countries, Trondheim, Norway, 20–22 August 1990. [Google Scholar]
  49. Hansen, K.K. Sorption Isotherms—A Catalogues; Technical University of Denmark: Kgs: Lyngby, Denmark, 1986. [Google Scholar]
  50. Remki, B.; Abahri, K.; Belarbi, R.; Bensaibi, M. Hydric and structural approaches for earth based materials characterization. Energy Procedia 2017, 139, 417–423. [Google Scholar] [CrossRef]
  51. Cagnon, H.; Aubert, J.; Coutand, M.; Magniont, C. Hygrothermal properties of earth bricks. Energy Build. 2014, 80, 208–217. [Google Scholar] [CrossRef]
  52. Orosz, M.; Nagy, B.; Tóth, E. Hygrothermal behavior of ultra-lightweight polystyrene concrete. Pollack Period. 2017, 12, 53–66. [Google Scholar] [CrossRef]
  53. Ramirez, R.; Ghiassi, B.; Pineda, P.; Lourenço, P. Experimental characterization of moisture transport in brick masonry with natural hydraulic lime mortar. Build. Environ. 2021, 205, 108256. [Google Scholar] [CrossRef]
  54. Laroussi, C. Analyse de L’interactionespaceporeux-fluide dans les Problèmesd’écoulementen Milieux non Saturés. Ph.D. Thesis, Université Paul Sabatier de Toulouse, Toulouse, France, 1972. [Google Scholar]
Figure 1. The round perforated bricks.
Buildings 13 02804 g001
Figure 2. Red Medjana clay.
Buildings 13 02804 g002
Figure 3. Atterberg limit test report.
Buildings 13 02804 g003
Figure 4. The granulometric curve.
Buildings 13 02804 g004
Figure 5. Sample preparation.
Buildings 13 02804 g005
Figure 6. Jars of the sorption isotherms.
Buildings 13 02804 g006
Figure 7. The (a) adsorption and (b) desorption isotherms of the brick parts stored under five different temperatures.
Buildings 13 02804 g007
Figure 8. The evolution of the equilibrium water content in the five temperatures at HR = 99%.
Buildings 13 02804 g008
Figure 9. Evolution of coefficient “a” as a function of T for adsorption.
Buildings 13 02804 g009
Figure 10. Evolution of coefficient “b” as a function of T for adsorption.
Buildings 13 02804 g010
Figure 11. Evolution of coefficient “a” as a function of T for desorption.
Buildings 13 02804 g011
Figure 12. Evolution of coefficient “b” as a function of T for desorption.
Buildings 13 02804 g012
Figure 13. Intermediate desorption curve of path 1 brick (33–53–85%).
Buildings 13 02804 g013
Figure 14. Intermediate adsorption curve of path 1 brick (33–53–85%).
Buildings 13 02804 g014
Figure 15. Intermediate desorption curve of path 2 brick (20–53%).
Buildings 13 02804 g015
Figure 16. Intermediate adsorption curve of path 2 brick (20–53%).
Buildings 13 02804 g016
Figure 17. Coefficients A and B as a function of their relation with temperature for both paths.
Buildings 13 02804 g017aBuildings 13 02804 g017b
Figure 18. Main and intermediate adsorption and desorption curves (Paths 1 and 2) at 23 °C.
Buildings 13 02804 g018
Figure 19. Isosteric heat of clay brick blocks: (a) for adsorption. (b) for desorption.
Buildings 13 02804 g019
Table 1. Characteristics of the Round Perforated Brick.
The clay usedRed Medjana 100%
The dimensions(5.5 × 9.5 × 21.0) cm
Compaction pressure−7 bars (to reduce the pore’s volume)
Breaking strength10.7 MPa
Forming pressure17 bar
Weight1850–1980 g
Table 2. The clay’s Characteristics.
PropertiesValueNormes Reference
The actual water content24.802%NF EN 1097-5[31]
The volumetric mass2689.9 kg/m3NF P 94-054 [32]
The granulometric analysis and sedimentation process.clayey loam with little sandy soilNF P 94-056
NF P 94-057
[33]
[34]
Atterberg′s limitsWL = 41.051%NF P 94-051[35]
WP = 21.170%
IP = 19.881%
Ground typeLittle plastic//
Ground natureLoam//
Table 3. Moisture corresponding to the used saline solutions.
JarMineral SaltRH%
(T = 10 °C)
RH%
(T = 23 °C)
RH%
(T = 30 °C)
RH%
(T = 40 °C)
RH%
(T = 50 °C)
01KOH119765
02MgCl2.6H2O3333333130
03K2CO34343434241
04NaNO37674727169
05KCl8785848281
06Distilled water9999999999
Table 4. Sorption isotherm’s models.
ModelFormulaRef.
Oswin W e q = a H R 1 H R b [39]
Halsey W e q = a l n H R 1 b [40]
Henderson W e q = ln 1 H R a T + b 1 c [14]
Modified Chung-Pfost W e q = a + b · ln ln H R [19]
GAB W e q = a · b · c · H R   1 a · H R 1 a · H R + a · b · H R [41]
Halkings W e q = a b · ln H R 1 2 [14]
Langmuire W e q = a · c · H R 1 + c · H R [14]
Peleg W e q = a · H R b + c · H R d [42]
Smith W e q = b n · l n ( 1 H R ) [14]
Caurie W e q = exp a + b · H R [43]
Hailwood Horrobin (HH) W e q = 1800 c a · b · H R 100 + a · b · c + 1800 c b · H R 100 b · H R [14]
BET W e q = l n a l b + T + l n H R c [14]
Table 5. Hysteresis phenomenon’s models.
ModelTypeFormula (Adsorption/Desorption)Ref.
HuangMathematical W H R , i = U i f H R i 1 U i 1 f H R i f H R i 1 f H R i + U i 1 U i f H R i 1 f H R i f H R
f H R = a U s a t H R 1 H R b = U a d s d e s U s a t
[44]
CarmelietPhysicalAds:   W H R . i = U i 1 + 1 A H R i 1 U a d s H R U a d s H R i 1
Des: W H R . i = U i 1 1 A H R i 1 U a d s H R i 1 U a d s H R
A H R = U d e s F H R U s a t F H R / F H R = U a d s
[45]
Pedersen empirical θ a d s   h y s = A W a d s   h y s W a d s B θ d e s + W a d s   h y s W d e s B θ a d s W d e s W a d s B [48]
θ d e s   h y s = W d e s   h y s W a d s B θ d e s + C W d e s   h y s W d e s B θ a d s W d e s W a d s B
Table 6. Optimized coefficients of the Oswin’s model for the five temperatures (Ads) and (Des).
Ads
T (K)ModelabR2MRERSS
283Oswin2.886060.3162230.994510.5490.671
296Oswin2.738130.3231320.994490.5350.776
303Oswin2.636510.3286460.9945040.5260.927
313Oswin2.461950.3405650.994960.4791.170
323Oswin2.363940.3471840.994300.5361.520
Des
T (K)ModelabR2MRERSS
283Oswin3.6935860.26424460.989151.0650.639
296Oswin3.4487790.27388950.992090.7450.609
303Oswin3.2569900.28326970.992930.6630.688
313Oswin3.1934060.28486600.991680.7570.776
323Oswin3.0661960.29126040.992790.6460.868
Table 7. Formulas “a” and “b” in the case of desorption and adsorption.
Formula aFormula b
Ads a = 1 1.02 0.0062 T + 0.000013 T 2 b = 0.49 + 0.002 T + 17,525.51 T 2
Des a = 11 + 0.02638 T + 579,453.18 T 2 b = 0.7985 0.00092 T 21,944.33 T 2
Table 8. Oswin’s Model Formula for the adsorption and desorption.
Oswin’s Model FormulaR2MRERSS
Ads W e q = 1 1.02 0.0062 T + 0.000013 T 2 H R 1 H R 0.49 + 0.002 T + 17,525.51 T 2 0.9945.0662.626
Des W e q = 11 + 0.02638 T + 579,453.18 T 2 H R 1 H R 0.7985 0.00092 T 21,944.33 T 2 0.9913.5833.878
Table 9. The correlation coefficients determined by Carmeliet and Huang models at 23 °C.
Des
ModelFormulaR2
Carmeliet W H R , 1 = 0.41904 + 2.4555029 H R 1 H R 0.3231320 0.9430
Huang W H R , 1 = 0.1409 + 3.0848 H R 1 H R 0.273889 0.9889
Ads
ModelFormulaR2
Carmeliet W H R , 1 = 0.408 + 2.554 H R 1 H R 0.3231320 0.9430
Huang W H R , 1 = 0.3866 + 2.5311 H R 1 H R 0.323132 0.9907
Table 10. The equations’ coefficients of water content are formulated for the two paths.
Path 1
T (°C)AdsDes
ABbABb
100.444252.68430.316223−0.16653.32380.264244
230.38662.53110.323132−0.14093.08480.273889
300.33472.36670.328646−0.10542.82980.283269
400.28452.28510.340566−0.17752.79880.284866
500.22742.20270.347184−0.26792.72590.291260
Path 2
T (°C)AdsDes
ABbABb
10−0.03372.99700.316223−0.43153.36300.264244
230.16742.57080.323132−0.22622.97660.273889
300.16902.46170.328646−0.20522.86600.283260
400.19282.27220.340566−0.25722.74180.284866
500.20102.16660.347184−0.25112.63720.291260
Table 11. The general models’ coefficients.
DesPath 1Path 2
X 21.59 0.048 T 639,011.244 T 2 T 37,453.97 225.03 T + 0.319 T 2
Y 22.29 0.0505 T + 907,611.965 T 2 4.84 + 0.032 T + 726,725.97 T 2
b 0.798 0.00092 T 21,944.33 T 2 0.798 0.00092 T 21,944.33 T 2
AdsPath 1Path 2
X 1 73.22 0.517 T + 0.00094 T 2 167,758.47 + 591.14 T 1 2192.08 T + 7.919 T 2
Y 4.082 + 0.01018 T + 311,811.506 T 2 23.88 + + 0.0512 T + 990,228.939 T 2
b 0.492 + 0.00208 T + 17,525.51 T 2 0.492 + 0.00208 T + 17,525.51 T 2
Disclaimer/Publisher’s Note: The statements, opinions and data contained in all publications are solely those of the individual author(s) and contributor(s) and not of MDPI and/or the editor(s). MDPI and/or the editor(s) disclaim responsibility for any injury to people or property resulting from any ideas, methods, instructions or products referred to in the content.

