Article

Systematic Mix Design Study on Geopolymers—Prediction of Compressive Strength

Institute of Building Material Research, RWTH Aachen University, 52062 Aachen, Germany
*
Author to whom correspondence should be addressed.
Buildings 2023, 13(10), 2617; https://doi.org/10.3390/buildings13102617
Submission received: 4 September 2023 / Revised: 11 October 2023 / Accepted: 13 October 2023 / Published: 17 October 2023
(This article belongs to the Special Issue Research on the Performance of Non-metallic Reinforced Concrete)

Abstract

:
Due to the demand for decarbonization of the construction sector, research on alkali-activated binders and material-minimized carbon-reinforced structures has gained momentum in recent years. Most of the research into alkali-activated binders is focused on developing market-ready alternatives, mainly using a trial-and-error approach. In this study, an attempt is made to identify and quantify the factors influencing compressive strength development. Due to their worldwide availability, investigations are being carried out into binders based on calcined clays and natural pozzolans. The goal is to develop a method to produce tailor-made AAB for continuous manufacturing methods to combine carbon reinforcement and alkali-activated materials. For this purpose, an experimental matrix with 20 variation parameters was set up, in which the activator solution and the precursor composition varied. The design of the experiments was used to minimize the number of experiments. It was shown that no single factor is responsible for the development of compressive strength but instead involves several interacting factors. It was possible to find empirical formulas for predicting the compressive strength after 2, 7, and 28 days.

1. Introduction

Currently, worldwide research activities aim to develop alternative binders for concrete to reduce the CO2 footprint of this most widely used building material. One of these alternatives is geopolymers. These are produced from one or more aluminosilicate precursors in highly alkaline conditions. The calcium content of these binders is low; König et al. suggested a limit of <10 wt % CaO in order to differentiate between high-calcium alkali-activated binders, which mainly form C-A-S-H phases as reaction products, and geopolymers, which form (Na,K)-A-S(-H) phases [1]. The reaction process of the precursor(s) with the alkaline activator is complex. However, it is often simplified as the dissolution of the reactive components from the precursors, the gelation of the ions, and the subsequent polymerization and polycondensation [2,3,4,5]. The main reaction product is a three-dimensional networked alkali-alumina-silicate gel, where silicon and aluminum are tetrahedrally coordinated [6,7]. The gel resembles zeolites in terms of its chemical properties but has no crystalline long-range order [8]. In addition to the amorphous (Na,K)-A-S(-H), crystalline zeolites have also been identified [3]. In contrast to cementitious systems, the water is not chemically bound but is instead adsorbed on the internal surfaces to a relatively small extent [3]. The low level of water binding impacts the pore system since most of the mixing water needed for the processing remains as pore space [2].
In principle, all aluminosilicates, which are soluble at a high pH, can be used as precursors. Siliceous fly ash has been widely investigated (e.g., [2,3,9]). However, since the supply of fly ash is decreasing in some countries due to the decline in coal-fired power generation, alternative materials are receiving more and more attention. Metakaolin has also been used for many years [10,11,12], but the availability of pure kaolinite is low, and the prices are high. This study aimed to choose a set of widely available precursors and develop a fundamental understanding of the reactions occurring in combination with different common activators. The impact of chemical/mineralogical composition, physical properties, and mix design shall be identified and quantified.
Concerning the precursors, this research focuses on calcined clays made up of lower-grade clays, which are widely available and also inexpensive. In order to design binders from these materials, it should be borne in mind that clay minerals differ in their mineralogical structure. The essential structural elements of clay minerals are SiO4 tetrahedrons (T) and Al(OH/O)6 octahedrons (O). For example, Al3+ or Fe3+ can replace Si4+ in the tetrahedrons, and Fe3+, Fe2+, or Mg2+ can be substituted for Al3+ in the octahedrons. Furthermore, OH can replace F or Cl [13]. The overall structure can comprise one tetrahedral and one octahedral layer (T-O) or two tetrahedral layers with one octahedral layer in between (T-O-T). The optimal calcination conditions strongly depend on the structure of the clay. Since the water demand for calcined clays is high, it makes sense to combine them with other precursors to improve workability.
Therefore, besides the calcined clays, natural pozzolans are used. These rocks are of volcanic origin and can also be found worldwide. For example, even Germany, although without any active volcanoes, has more than 100 inactive or extinct volcanos [14]. Vulcanites are categorized, based on their SiO2 content, as basic (<50 M. % SiO2) and felsic (>50 M. % SiO2). High SiO2 contents lead to a higher viscosity of the liquid rock. If felsic, gassy, molten rock erupts, the pressure decreases to the earth’s surface, leading to an explosive outburst because the gas is expanding, but the melt is too viscous to release the gas. These eruptions produce ashes, which can be ejected into the atmosphere up to a height of several kilometers. Finally, the ashes are deposited in the surroundings as tuff. The chemical composition is variable and depends on the local rock melt. The glass content of tuff is higher than 50 wt % [15].
Basaltic rock melts are alkaline and less viscous; therefore, they usually erupt in liquid form. However, the amorphous content can be similar to tuff because the lava often spills into seawater, resulting in fast cooling. Also, for basalt, the composition is variable; the most abundant minerals are pyroxenes, feldspars, and olivines. According to the authors of [16], the average composition is 50 wt % of SiO2, 20 wt % of Al2O3, and about 10 wt % of Fe2O3, CaO, and MgO, respectively. Na2O and K2O are present as minor components [16].
This study’s last solid precursor component is silica fume (SF). Surprisingly, Wetzel et al. found that adding silica fume in small dosages significantly decreases viscosity [17]. The proposed reason is that SF dissolves quickly and forms siliceous complexes, preventing particle agglomeration.
Sodium, potassium hydroxide, and silicates were used in various combinations as activators.
The systematic design of the experiments is explained in Section 2.4. In this part of our study, compressive strength is the investigated characteristic. Further parts on workability and setting time will follow. The overall goal is to develop an approach for a target-oriented mix design of geopolymers for use in the context of the CRC/Transregio 280 “Design Strategies for Material Minimized Carbon Reinforced Concrete Structures”, for use in different production technologies, including extrusion and 3D printing.

2. Materials and Methods

2.1. Selection of Raw Materials and Calcination of the Clays

Two clays were selected for the parameter study: an illitic clay and a kaolinitic clay. Illitic clays are weathering products from smectites and mica. They have a T-O-T layer sequence. The general chemical formula is (K,H3O)Al2(Si3Al)O10(H2O,OH)2. Illite is a widespread clay mineral in Europe [18].
Kaolinite is a weathering product of magmatites, e.g., granite. The general formula is Al2Si2O5(OH)4. The layer sequence of this mineral is T-O. Kaolinite is also quite common, but usually not in a pure form.
Calcination is necessary to destroy the crystal structure of clays and transform them into an amorphous form. Amorphous materials have a higher surface area and a more significant number of active sites that facilitate chemical reactions. In the calcination process, pores are formed; these pores serve as micro-reaction centers and increase the contact area between the calcined clay and other reactants, accelerating reactions. Furthermore, the chemical composition of the material is changed. While kaolinite consists mainly of aluminosilicate and water, metakaolin contains free silicon oxides and aluminum oxides. These additional components increase the reactivity of metakaolin and other calcined clays [19].
Calcination is complete if no further mass loss is detected after heating. In order to determine the optimum calcination conditions, the raw clays were analyzed via TGA. The results are shown in Figure 1.
After TGA measurement, a calcination temperature of 750 °C was chosen for both clays for a duration of one hour. The temperature was higher than necessary. It was chosen because of the high mass of clay being calcinated in one batch (50 kg).
For the natural pozzolan, a tuff from the Eifel mountains (Germany), also called “Rheinischer Trass” [20], was selected. This material is already in use as a cement component. The silica fume conforms to [21].

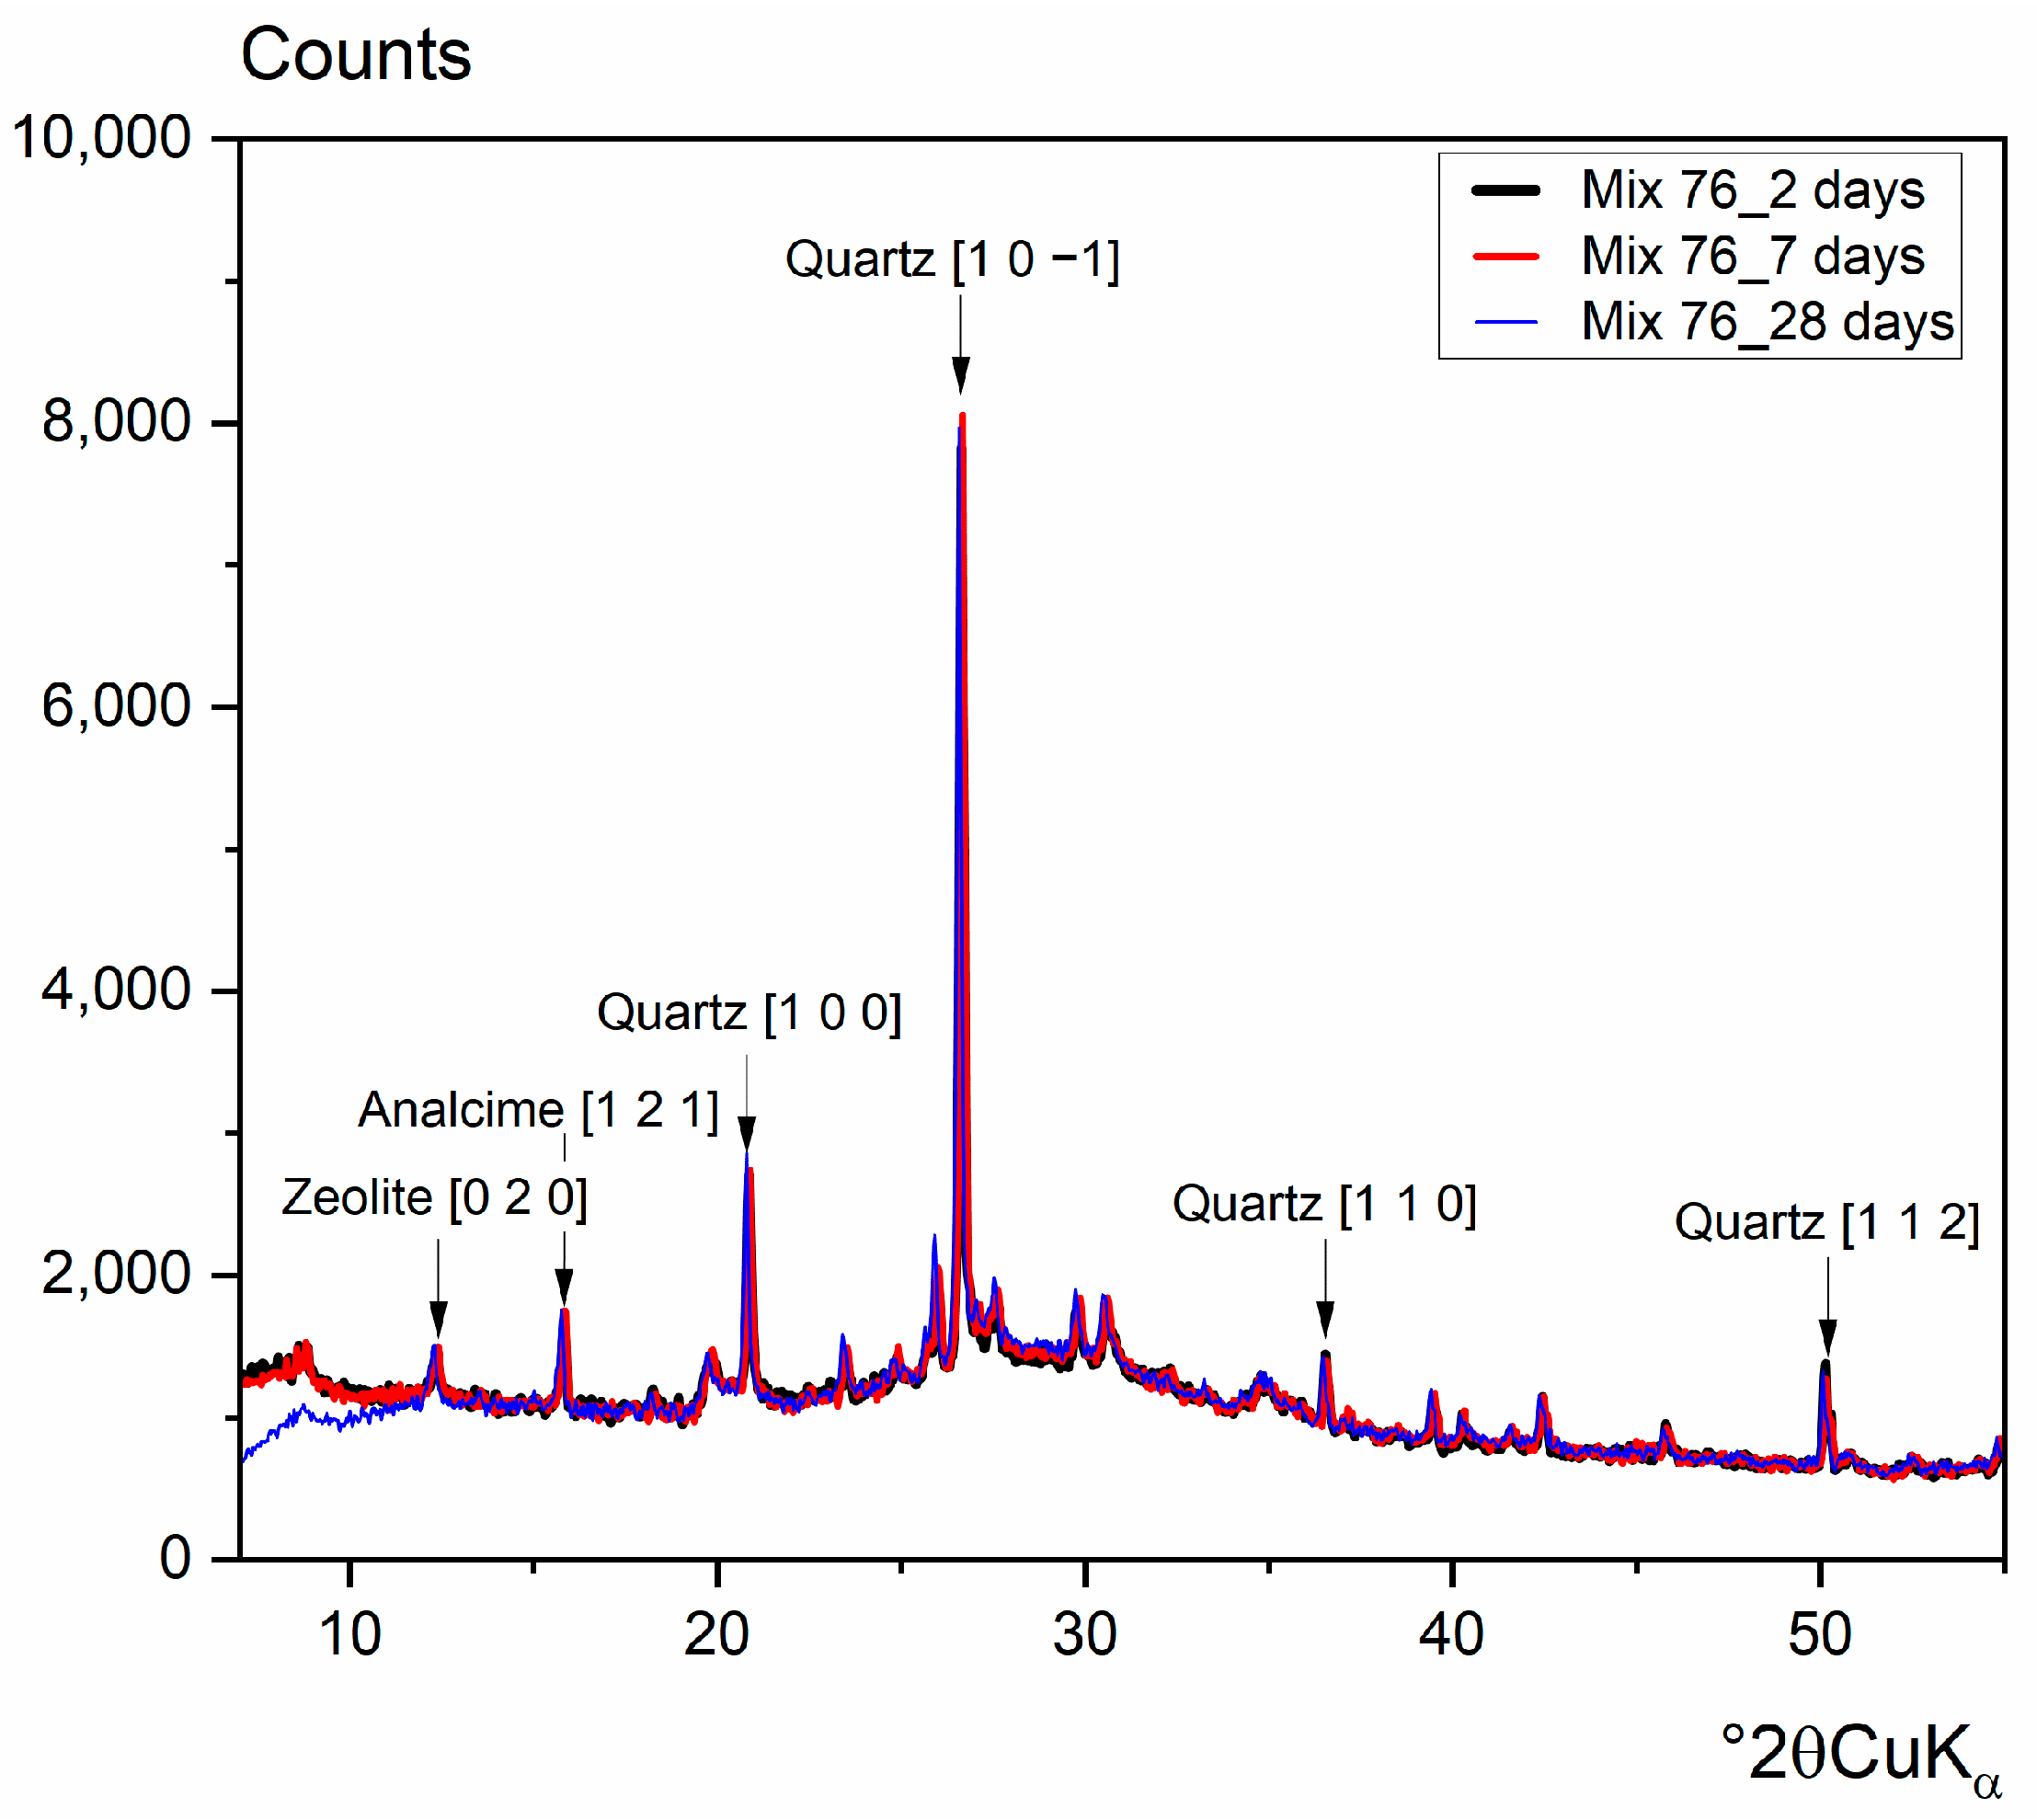
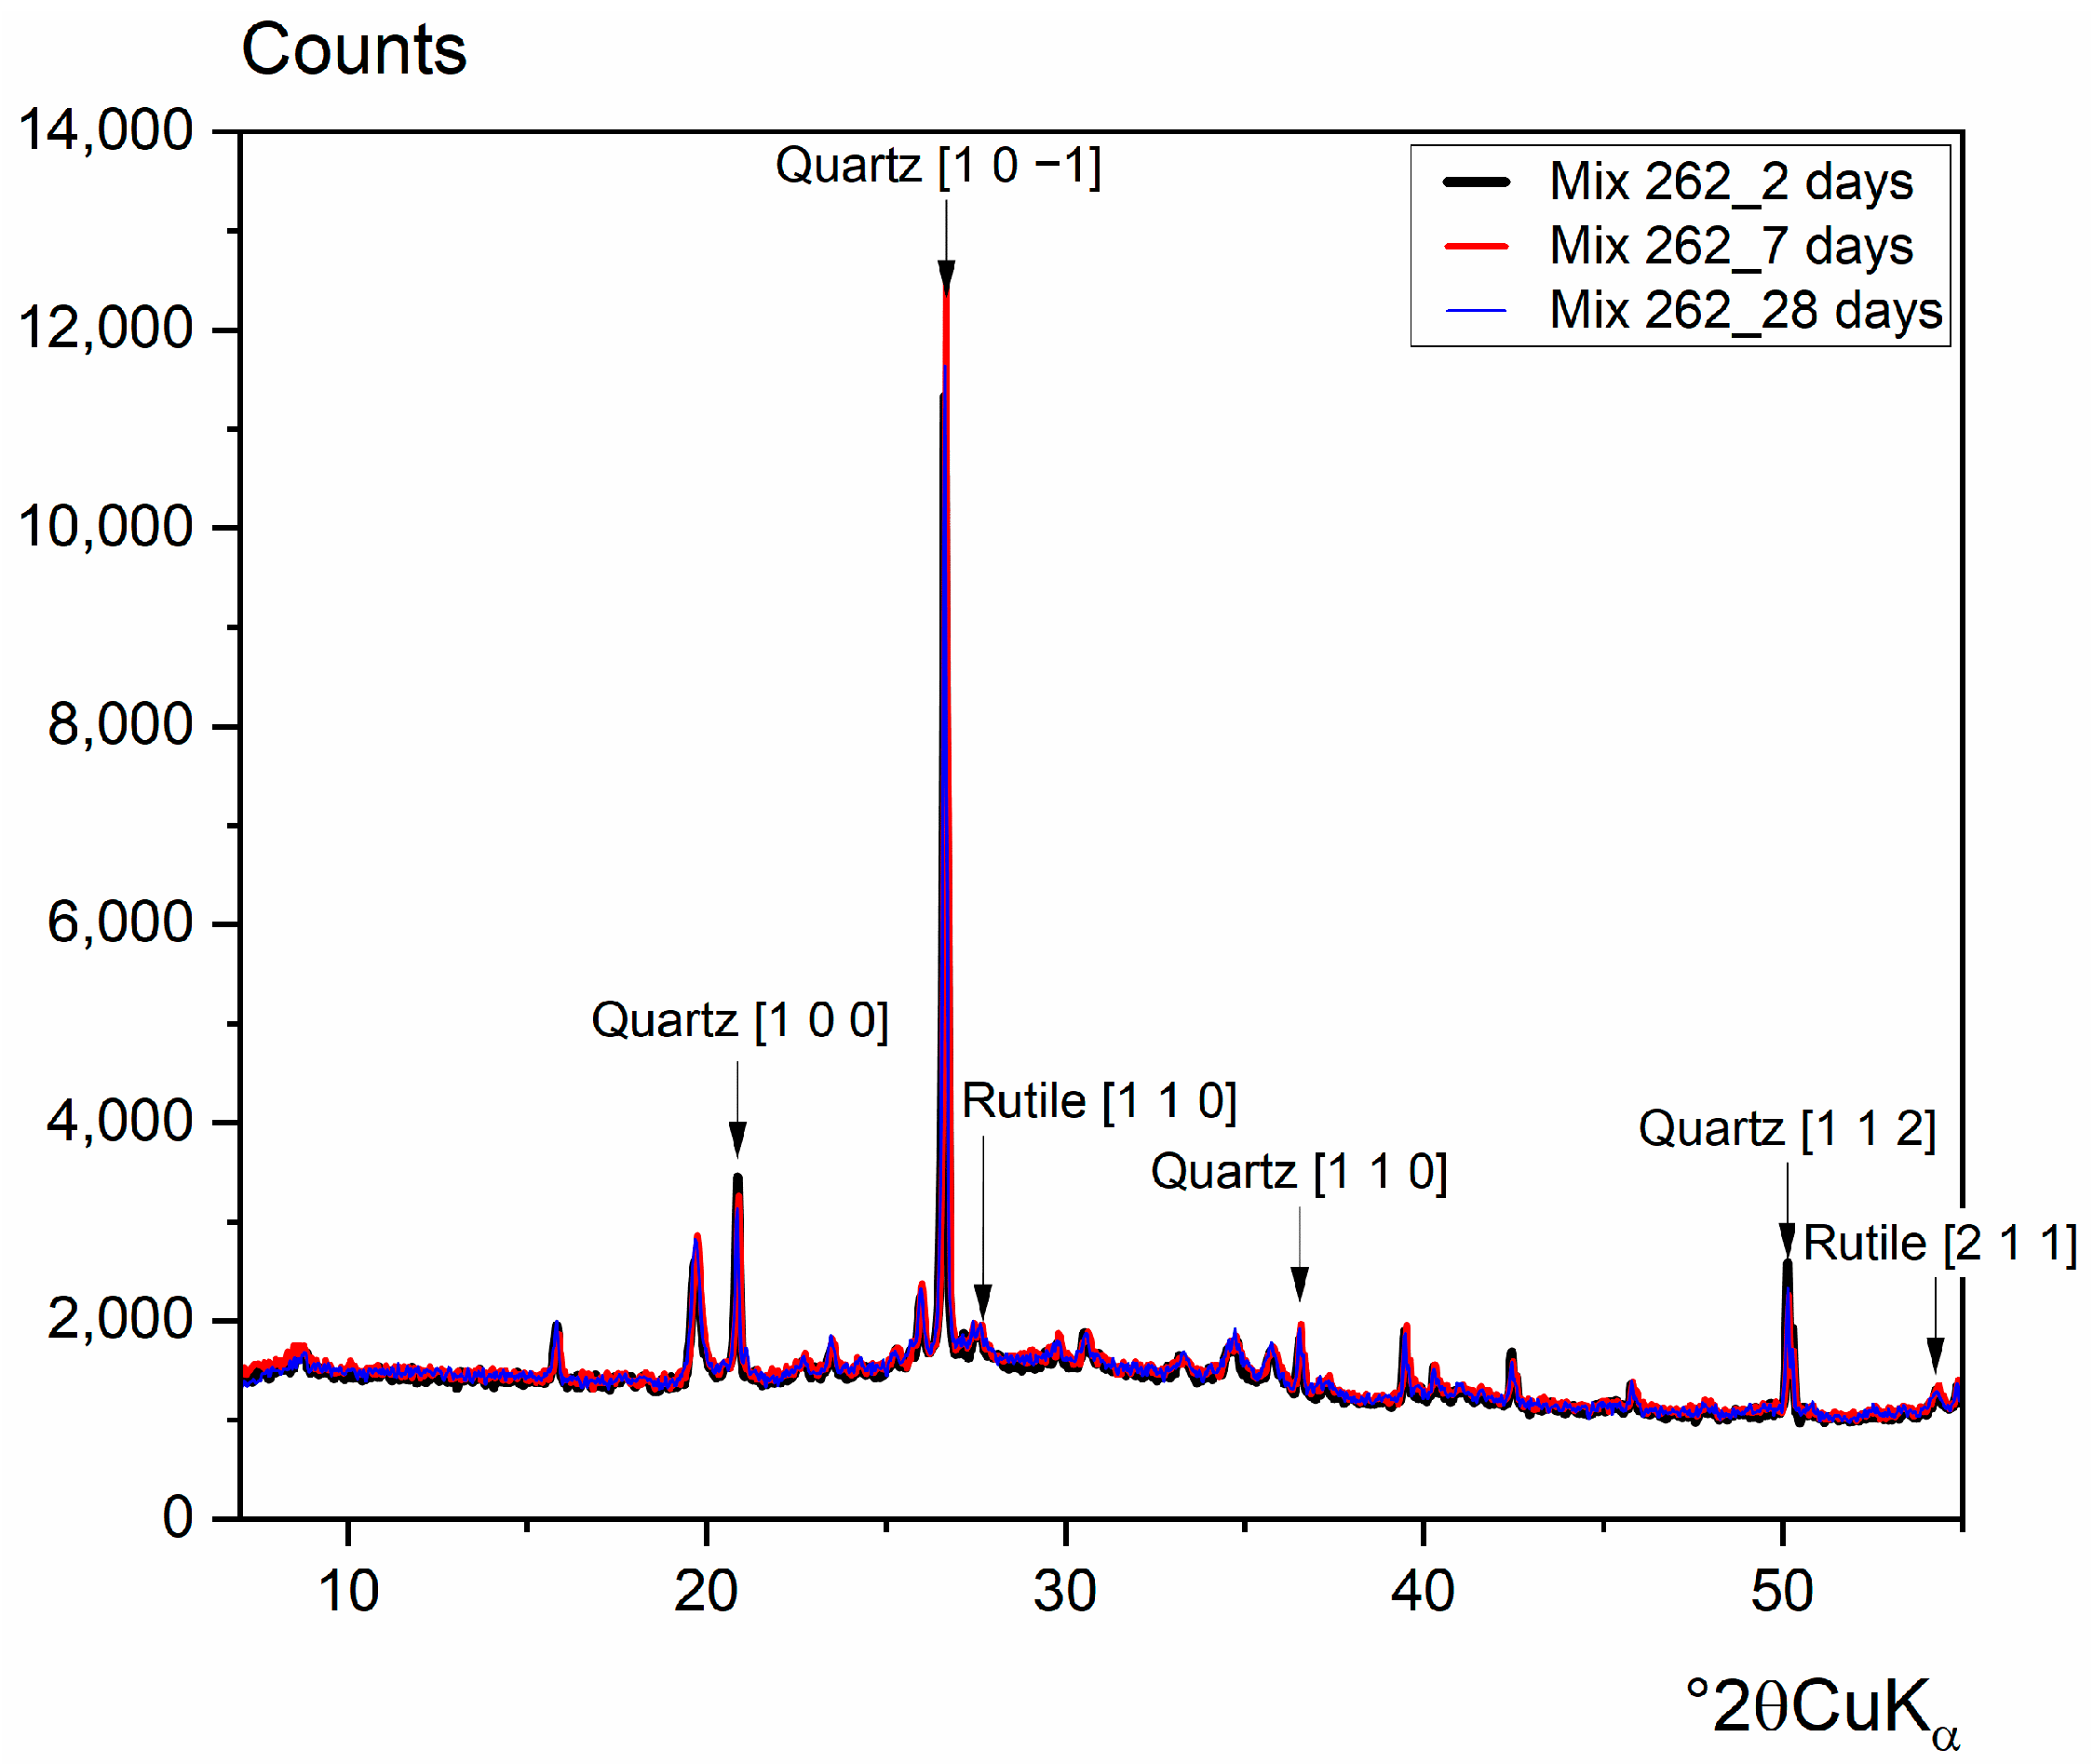
2.2. Chemical and Mineralogical Characterisation of the Materials

The chemical composition of the materials was determined according to [22] via X-ray fluorescence, the chloride content was determined by titration with silver nitrate solution, and the SO3 content was determined with a carbon sulfur analyzer (ELTRA CS 2000 Carbon Sulfur Determinator (Haan, Germany)). The results are shown in Table 1. To determine the mineralogical composition shown in Table 2, a Malvern PANalytical X’Pert Pro X-ray diffractometer (Enchede, The Netherlands) (XRD) was used. The amorphous content was evaluated using rutile as an internal standard, at a replacement level of 20 wt %.
To determine if the crystalline mineral phases participated in the reaction, 2-, 7-, and 28-day ex situ XRD storage paste specimens were produced and cast in silicone molds. Using the silicone molds, it was possible to produce cylindrical specimens with a diameter of 25 mm. The paste samples were rotated in an overhead shaker at 5 rpm for 2 days to counteract sedimentation and segregation.
After storage, the specimens were cut into 1-millimeter-thick slices. A Buehler IsoMet® 5000 (Leinfelden-Echterdingen, Germany) linear precision saw was used for this purpose. The top and bottom 1 cm were removed and discarded to ensure that the investigated surface did not interact with the atmosphere, which could potentially bias the results. In order to eliminate any surface irregularities caused by the sawing process, the discs were smoothed using P1200 grinding paper from Buehler (Leinfelden-Echterdingen, Germany).
Figure 2 and Figure 3 show an example of a mixture with the clay sample cK (Mix 76) as precursor 1 and a mixture with the clay sample cI (Mix 262) as precursor 1.
As expected, the results show that phases such as quartz and rutile can be considered inert in this milieu. In addition, it can be seen that the remaining crystalline phases also do not react. Thus, these phases are evaluated as non-reactive and are considered fine aggregates. Based on the general chemical composition of these minerals, the chemical composition of the amorphous phase of each precursor was calculated and is shown in Table 3.

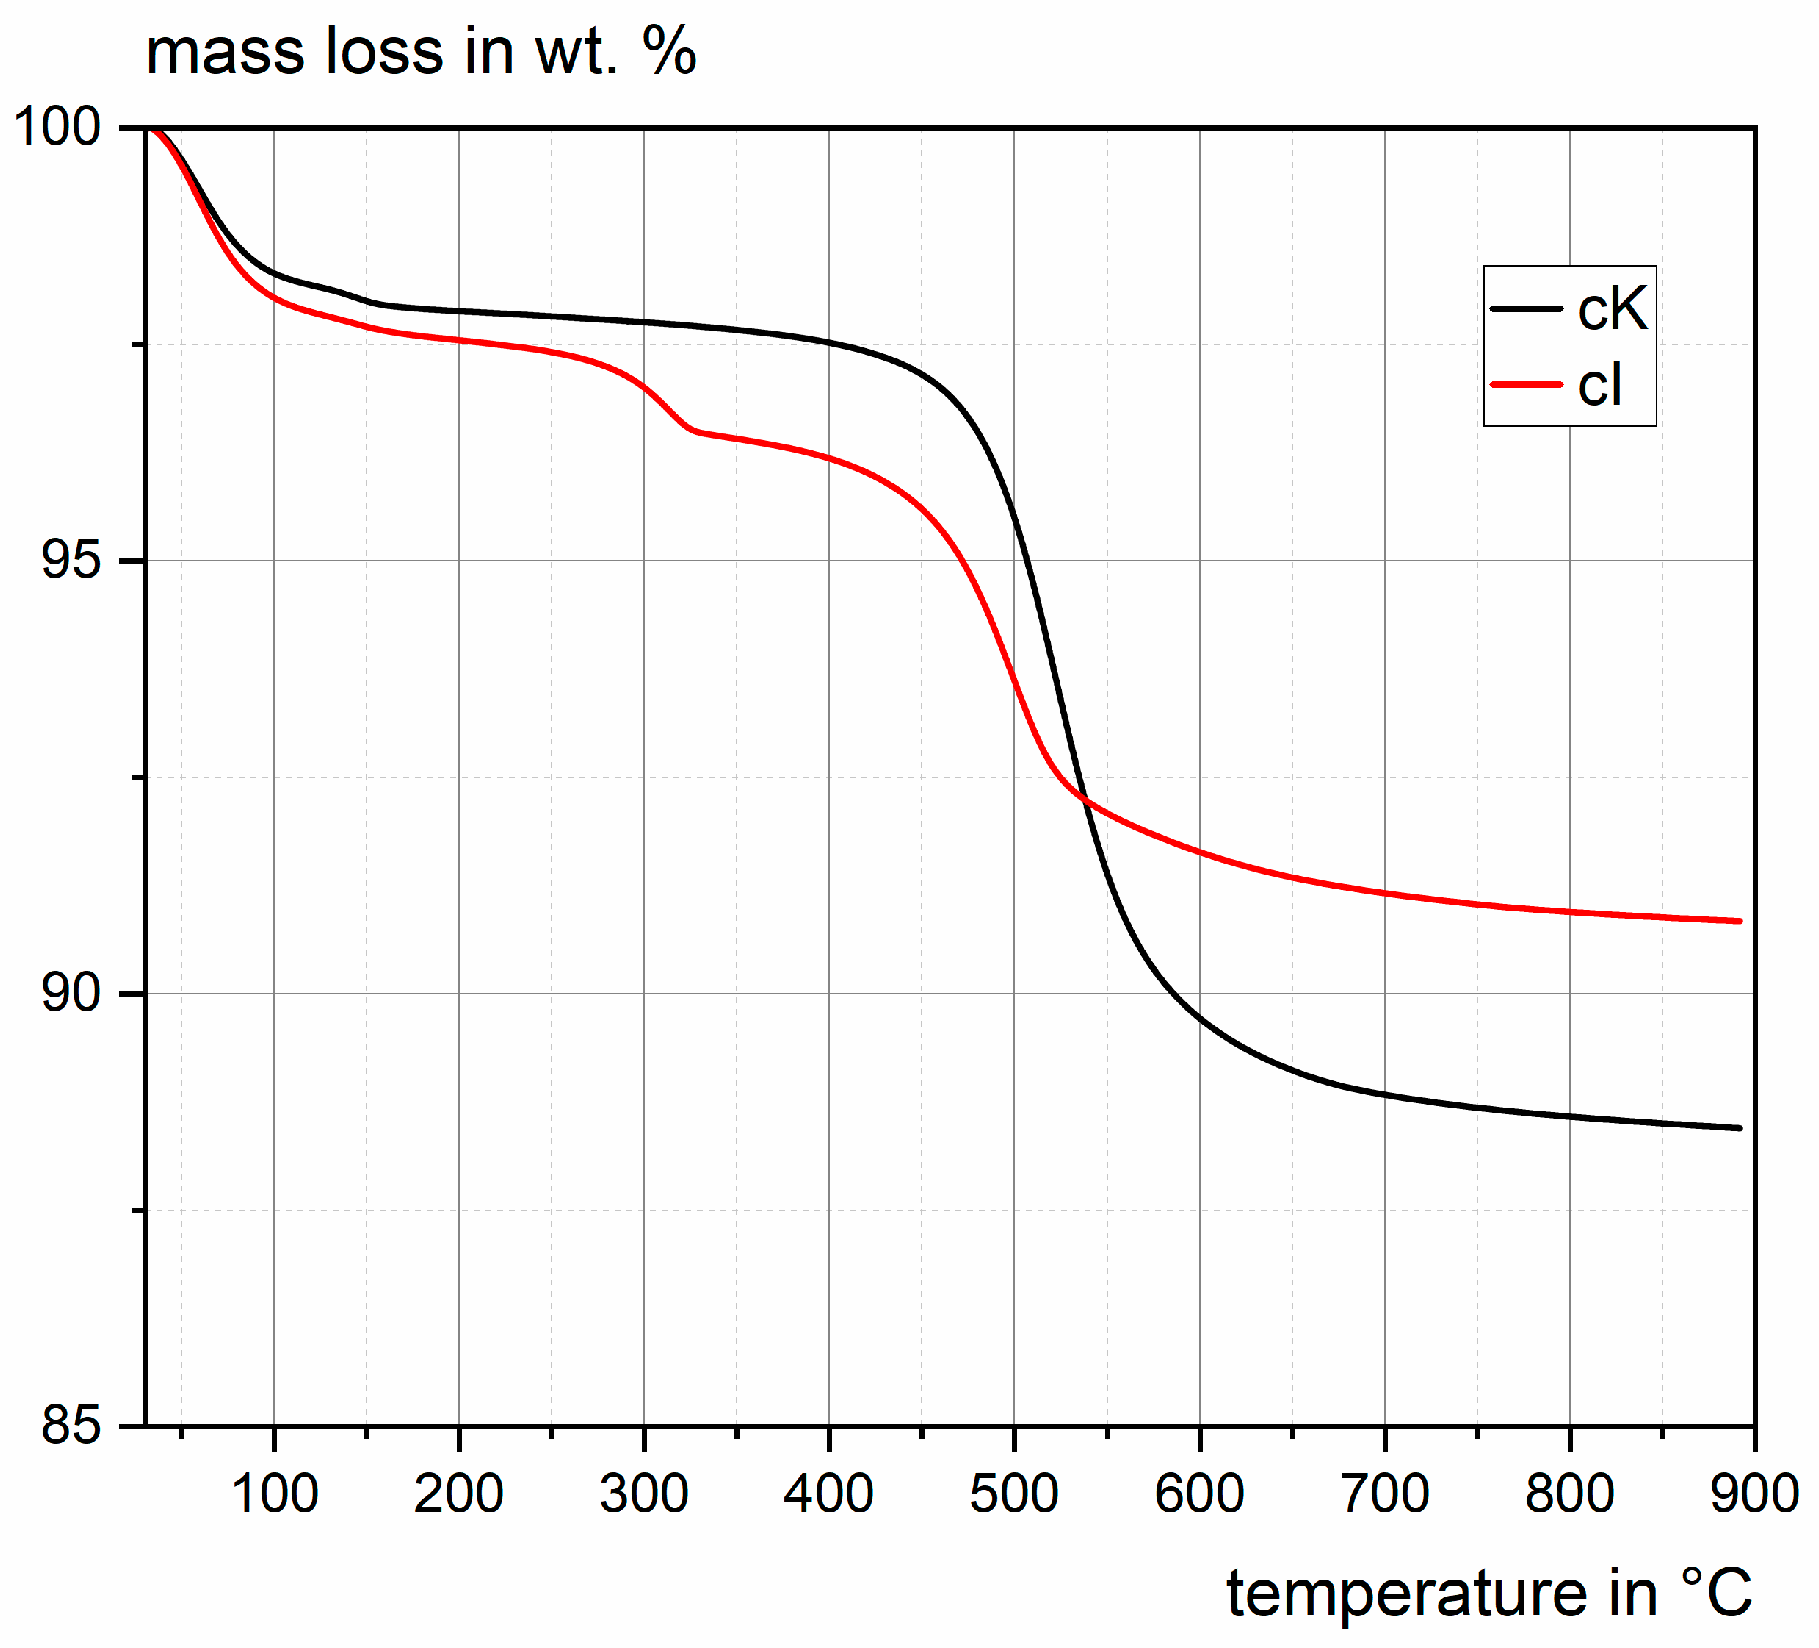
2.3. Physical Characterization of the Materials

The particle size distribution of the precursors was determined with a laser granulometer, the Bettersizer S3 Plus from 3P Instruments (Odelzhausen, Germany) (Figure 4). Furthermore, the density was determined with a helium pycnometer, the AccuPyc 1330 from Micromeritics GmbH (Norcross, GA, USA), and the specific surface area was determined via the 5-point BET method with a 3P sync 210 from 3P Instruments, using N2 as the measuring gas. The Blaine fineness was determined according to [23]. The results are summarized in Table 4.

2.4. Design of Experiments

In this study, several parameters were varied that are known to influence the reactivity and processability of alkali-activated binders. On the precursor side, the combination of raw materials and the composition ratios were varied. For the activators, the cation in the activator solution, the molar ratio of silicon to potassium and/or sodium, and the base strength were varied. Finally, the water-to-binder ratio (w/b) was varied. To calculate the w/b ratio, all anhydrous components of the activator (namely, Na2O, K2O, and SiO2) were considered to be part of the binder. The chemically bound water (according to the following equation: 2 N a O H N a 2 O + H 2 O , or potassium, respectively) is added to the mixing water.
An overview of the variation parameters can be seen in Table 5.
The selection of the variations was based on the following considerations.
The proportion of the different precursors was varied to achieve mixes of different chemical and mineralogical compositions. In general, silicon and aluminum oxide act as network builders, whereas alkali metals such as potassium and sodium act as network converters. By varying the composition of the precursor and the activator solution, a large variety of network-builder to network-converter ratios (SiO2 + Al2O3/Na2O + K2O) can be achieved, and it is then possible to see how this affects the compressive strength.
Sodium and potassium behave differently when in solution. Potassium is a cation that hydrates relatively weakly, so it does not restrict water motion. This behavior leads to a lower viscosity than sodium, which has a larger hydrate sheath. The cation was varied to investigate the influence of the mobility of water and ions on compressive strength development.
The ability of a base to dissolve ions from a material structure increases with alkalinity. Conversely, very high alkalinity can lead to the efflorescence of alkali carbonates and increase both the price of the binder and the environmental impact. The base strength variation helps to establish the optimal quantity of hydroxides needed for structural build-up.
If all the combinations of Table 5 were tested in a full factorial test matrix, this would result in 648 mixtures. Therefore, it was decided to reduce the number of mixtures by a statistical design to reduce the experimental workload. The statistical design of experiments aims to perform experiments efficiently and meaningfully to gain information about a process or system. A reduction according to D-optimality was chosen to reduce the number of combinations to 1/3. This approach was based on the design matrix, in which the different settings of the experimental factors are organized in a matrix structure. Each row of the design matrix represents a single experimental condition, and the columns represent the different factors and their settings. The statistical design of experiments according to D-optimality reduces the mixtures so that the influencing parameters (see Table 4) are equally represented in the new matrix after the reduction. For example, 89 mixtures with Na in the activator solution, 86 mixtures with a SiO2/(Na,K)2O ratio of 1.5 in the activator solution, and 88 mixtures with a SiO2/(Na,K)2O ratio of 1 are represented in the new experimental matrix. This paper summarizes the preliminary results; currently, 1/3 of the examinations have been performed. The following tests will be used to verify the findings.
The mixtures selected using the statistical design of experiments were analyzed to identify and quantify the various influencing factors. That is, correlations of the properties resulting from the mixes and the results of the fresh and hardened mortar tests were made through the evaluation of tests. The compressive strength was analyzed in order to be able to calculate the influences on these properties.
With all the variations in precursor combination and activator solution composition, the range of compressive strengths is extensive (if the correct parameters are chosen). This variety helps to identify which parameters have the most substantial influence on the structural build-up and helps to elucidate this kind of system.
Another crucial factor is the temperature. It is known from the literature that some precursors (e.g., fly ash) require heat treatment in order to develop sufficient strength within practicable durations [2]. However, due to the high experimental effort, including the temperature, in the mix design study, this is not feasible. Therefore, a follow-up paper will investigate the temperature effect on selected mixes.

2.5. Preparation of the Activator Solutions

KOH (dry), K-silicates (dry), and distilled water were used for the potassium water glasses. The solutions were prepared in a two-step procedure. First, the potassium silicate was weighed and dissolved in the appropriate amount of water overnight in an overhead shaker at 5 rpm. Afterward, the mix displayed a gel-like consistency, in which the potassium silicate was dispersed in the water. Depending on the water content, this gel is liquid or solid. Then, the KOH was added, and the water that was bound in the gel was dissolved due to the strong hygroscopic properties of the hydroxide. This reaction is strongly exothermic. The solution was cooled down in a water bath and, after cooling, was again kept in motion overnight at 5 rpm in the overhead shaker. The result was a homogeneous activator solution.
NaOH (dry), an aqueous sodium silicate solution, amorphous SiO2 (dry), and distilled water were used for the sodium water glasses. The procedure was analogous to that for the potassium water glasses.
For the 50:50 potassium/sodium water glass mixtures, the density was determined from the respective water glasses, and the respective pairs were mixed in the same volume. For example, a potassium water glass with a molar SiO2/K2O ratio of 1 and a hydroxide ion concentration of 5 mol/L was mixed with a sodium water glass with a SiO2/Na2O ratio of 1 and a hydroxide ion concentration of 5 mol/L to obtain a new solution.
All in all, 27 activator solutions with different ratios and properties were produced in this way.

2.6. Mortar Production and Testing of Compressive Strength

In the mortar tests, different water-to-binder values were considered. The mortar mixtures were prepared in a standard mortar mixer, according to [24]. The paste content was set at 675 g. First, the precursor and the activator mix were blended for 1 minute at 140 rpm. Then, the CEN-standard sand (1350 g) was added and mixed for another minute at 140 rpm. In the next step, any particles on the edge of the mixing bowl were scraped off and mixed in. In the final step, mixing occurred at 285 rpm until a homogeneous, compactable mixture was obtained. Since the rheology of the mixes was very variable, the mixing time was adjusted. Overall, the mixing time ranged from 5 min to 8 min. After mixing, the spread was determined according to [25]. Standard mortar prisms (40 × 40 × 160 mm3) were prepared using variable compaction times on the vibration table. Despite the effort to reach a similar level of compaction, the achieved air content varied between 3.5 and 19.7 vol.-%. This variation will influence compressive strength; therefore, the air content must be considered in the data analysis.
The filled molds were covered and stored at 20 °C until sufficiently hardened (from 1 to 8 d). After demolding, the prisms were weighed, measured, and wrapped in PE foil to prevent evaporation. The wrapped specimens were stored at 20 °C/65 rH until testing.
On the day of testing, the prisms were unpacked and weighted again. Subsequently, the prisms were tested for flexural strength (0.05 N/s) and mortar compressive strength (2.4 kN/s), according to [24]. The prisms were tested after 2 d (if possible), 7 d, and 28 d.

2.7. Statistical Evaluation

A Pearson correlation of the resulting data matrix and statistics on the columns was performed using OriginLab (Version 2022b). The interpretation of correlation coefficients was not uniform and depended on the assessed data. As some value ranges were comparably low and multiple factors influenced the compressive strength, in this work, the following wording is used: R is referred to as weak for 0.2 < |R| ≤ 0.4, as moderate for 0.4 < |R| ≤ 0.6, as strong for 0.6 < |R| ≤ 0.8, and as very strong for 0.8 < |R| ≤ 1.0, to describe the strength of the correlation on a significance level α of 0.05 (p ≤ 0.05). To analyze the relationship between independent variables (chemical and physical characteristics) and a particular dependent variable (strength), we conducted multiple regressions using the Minitab® (Version 18) Statistical Software.

3. Results and Discussion

3.1. General Remarks

The results in the following chapter are preliminary. The tests are still ongoing. Nevertheless, the results already show a reliable tendency.
In order to reveal the correlations between the varying parameters and the process parameters regarding the compressive strength, a standard basis for calculation must be established in the first step. As pointed out in Section 2.1, inert phases such as quartz do not participate in the reaction and this can be attributed to the aggregate’s fine fraction rather than to the binder content. Due to the lower number of reactive precursors, the water-to-binder value was corrected accordingly (w/bcorr). Since the content of inert phases differs, the corrected water-to-binder value increases slightly differently for each mixture.
All contents were calculated on a molar basis instead of a weight basis, to better reflect the ongoing chemical reactions. Two different approaches were tested. In the first approach, the whole binder system, consisting of (potentially) reactive precursors and activator solution, was analyzed, and all components were calculated as mol/kg paste. In the second approach, the chemistry of the activator and the precursor mix were considered separately. The components were calculated as mol/kg activator solution and mol/kg precursorcorr, respectively.
The parameters of the physical characterization did not show any correlations, as they are too similar due to the choice of precursors and the mixture compositions.

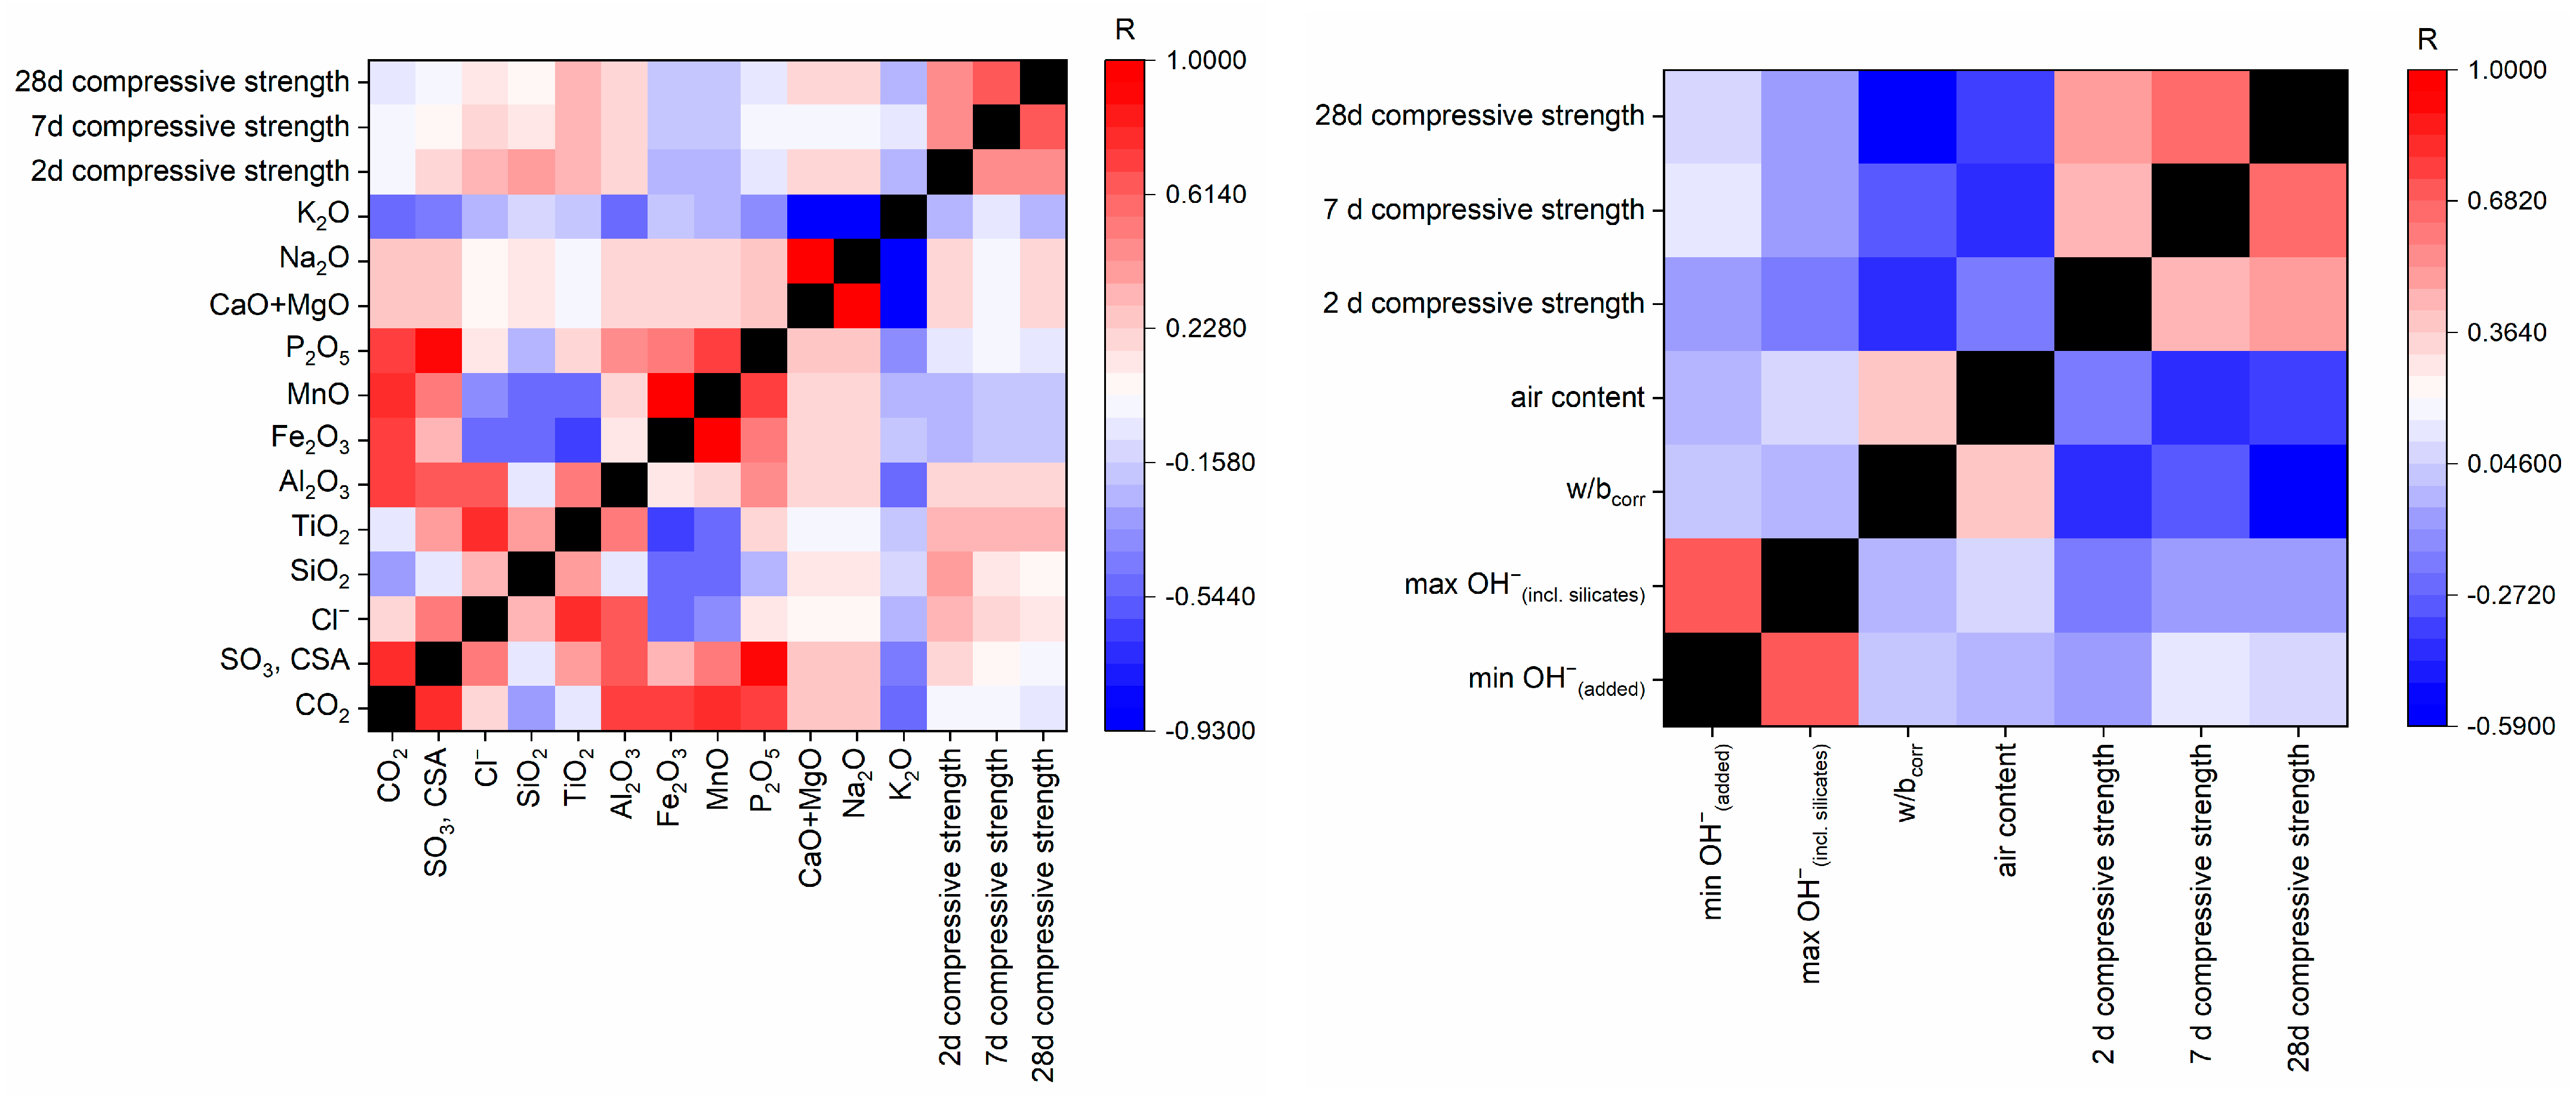
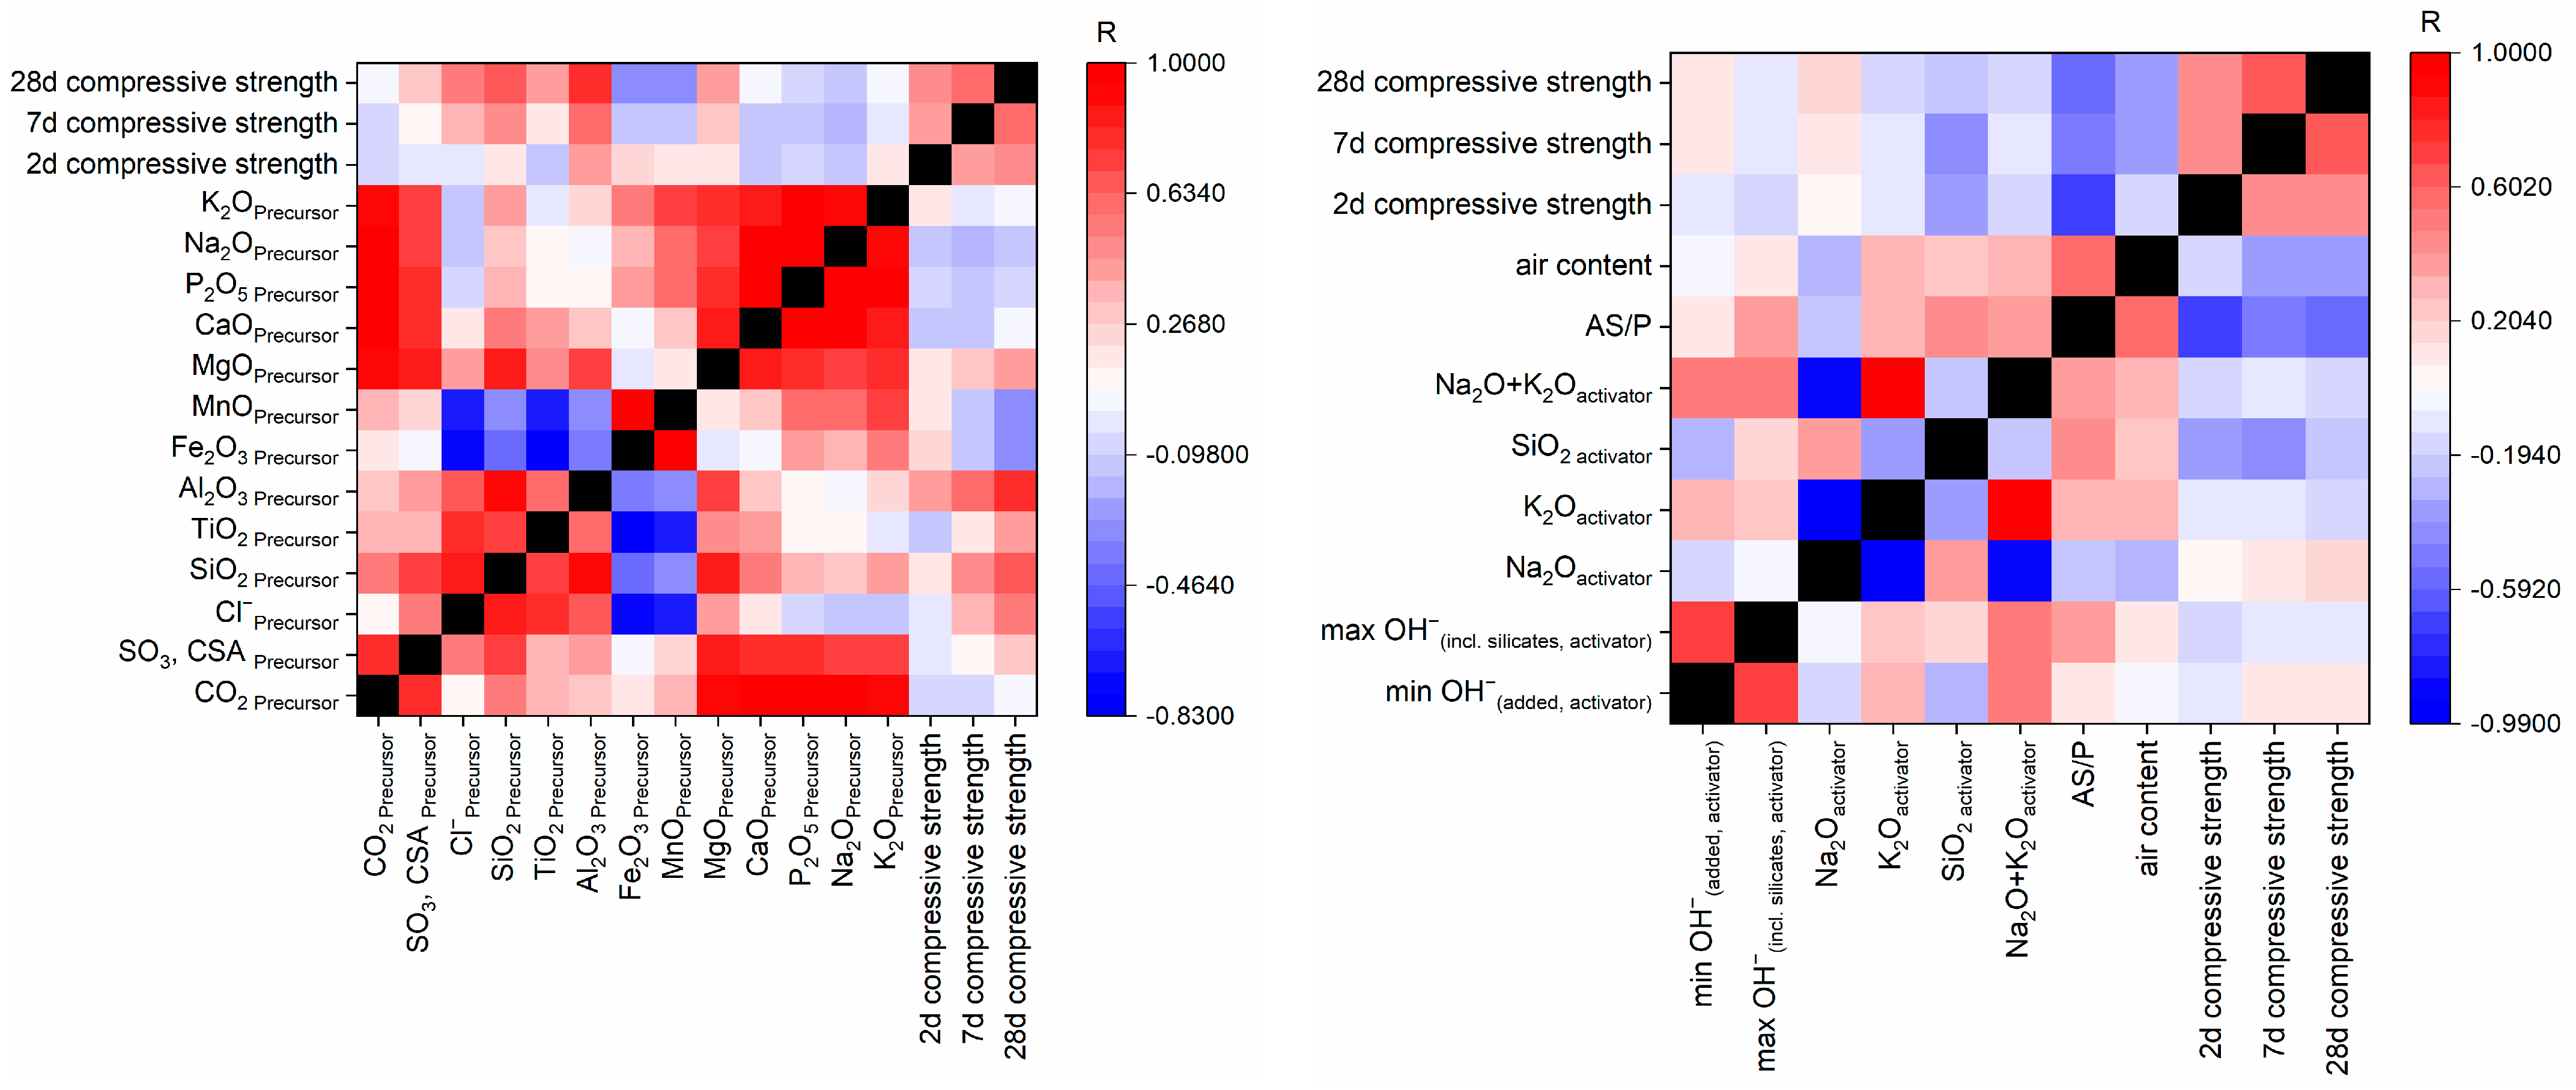
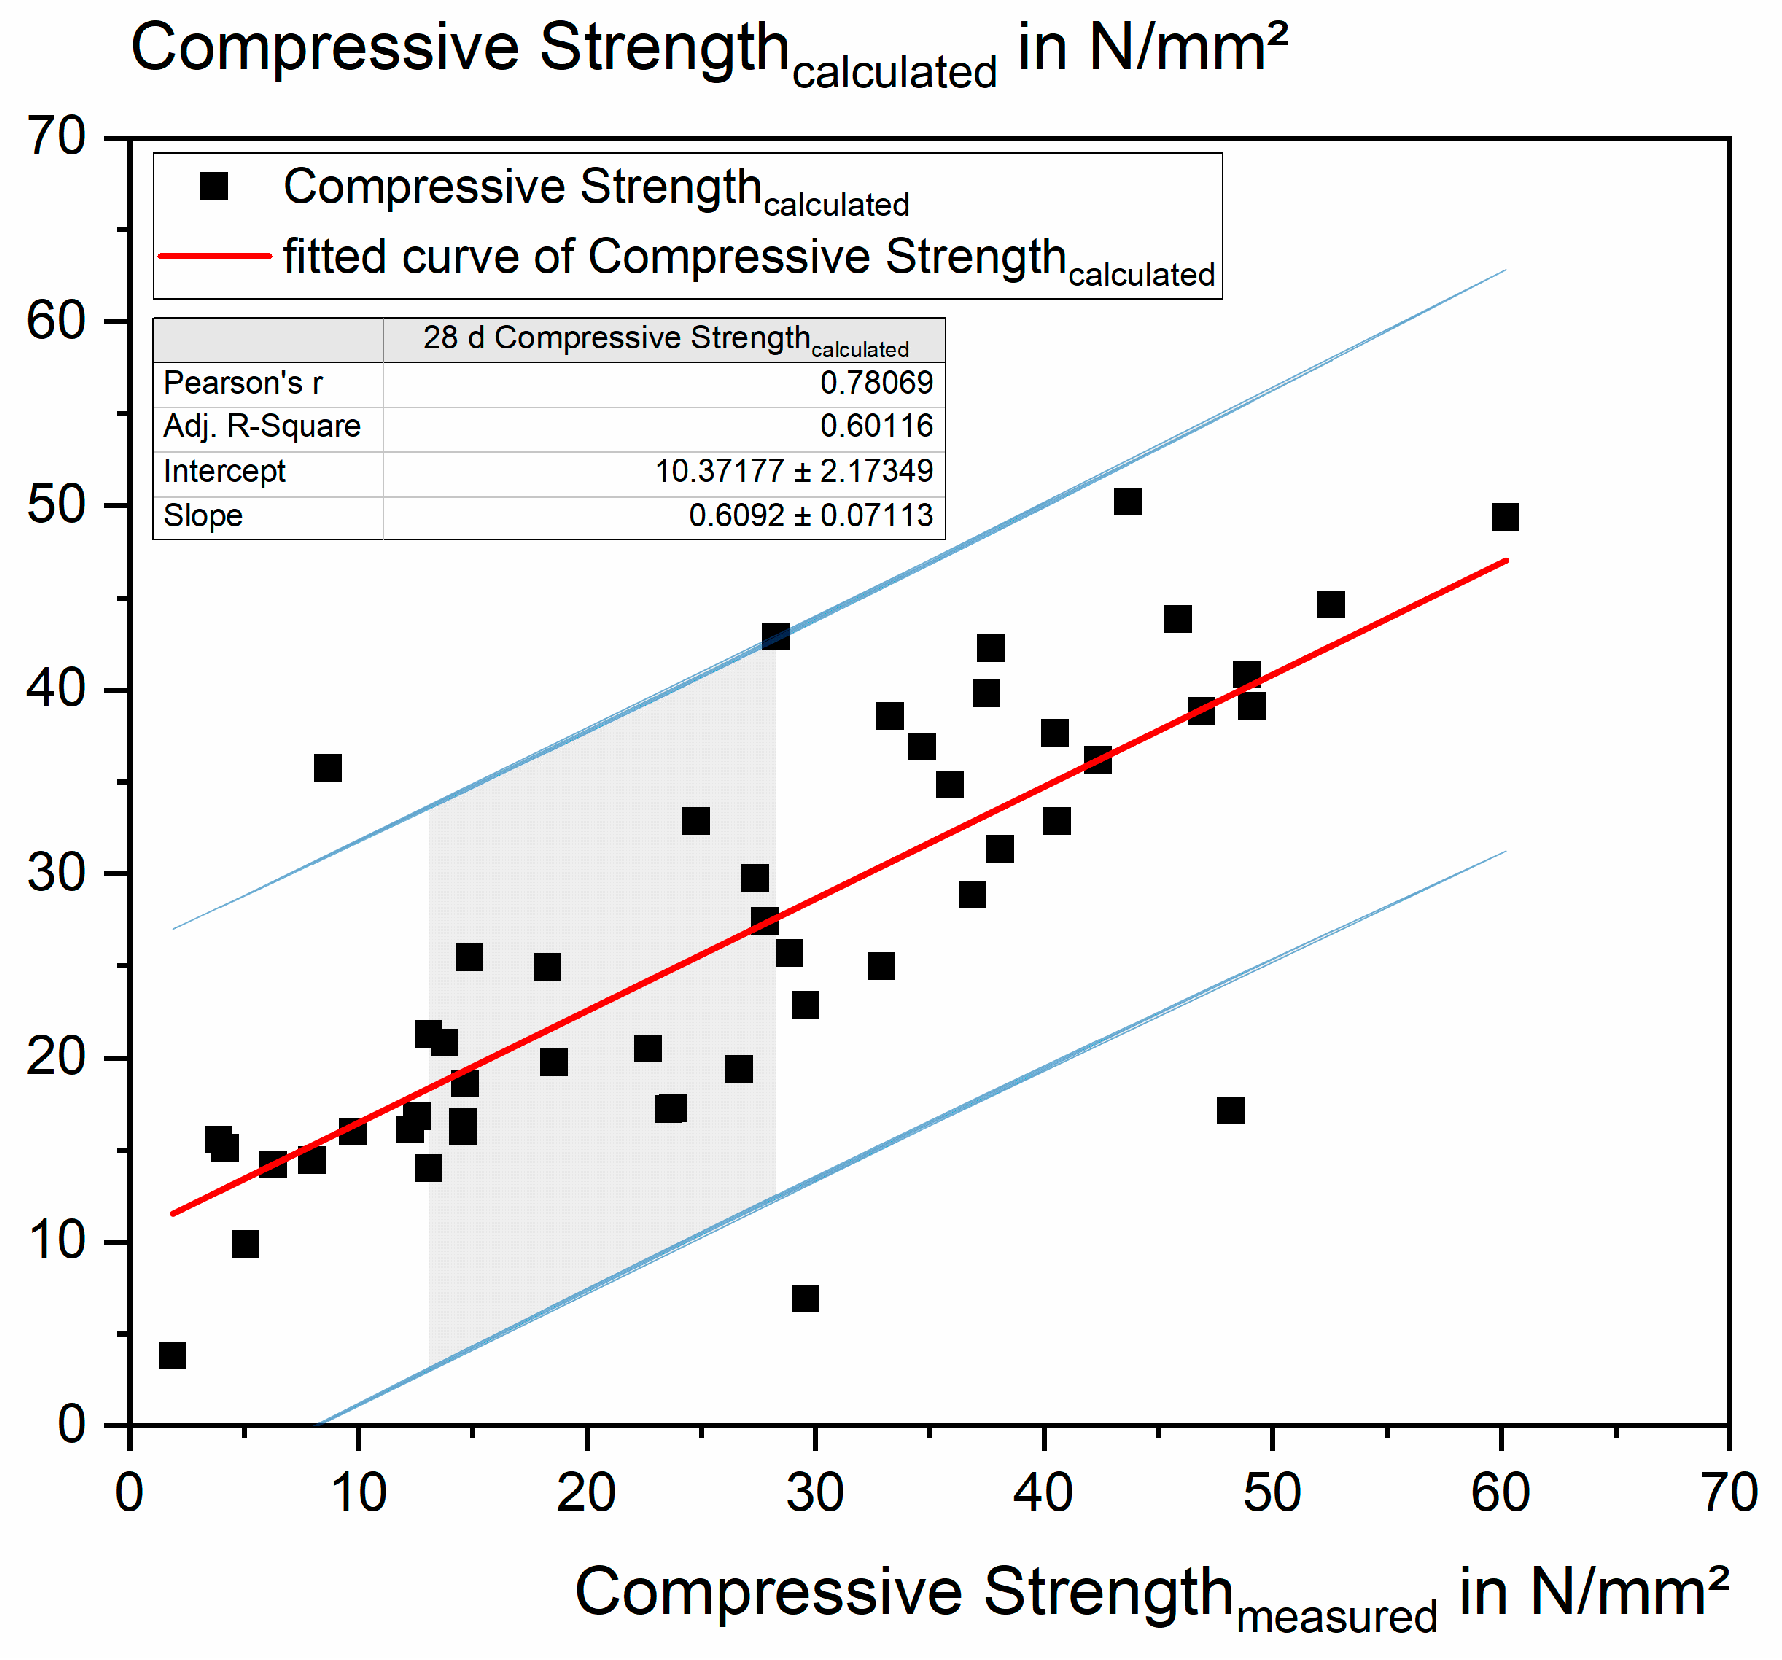
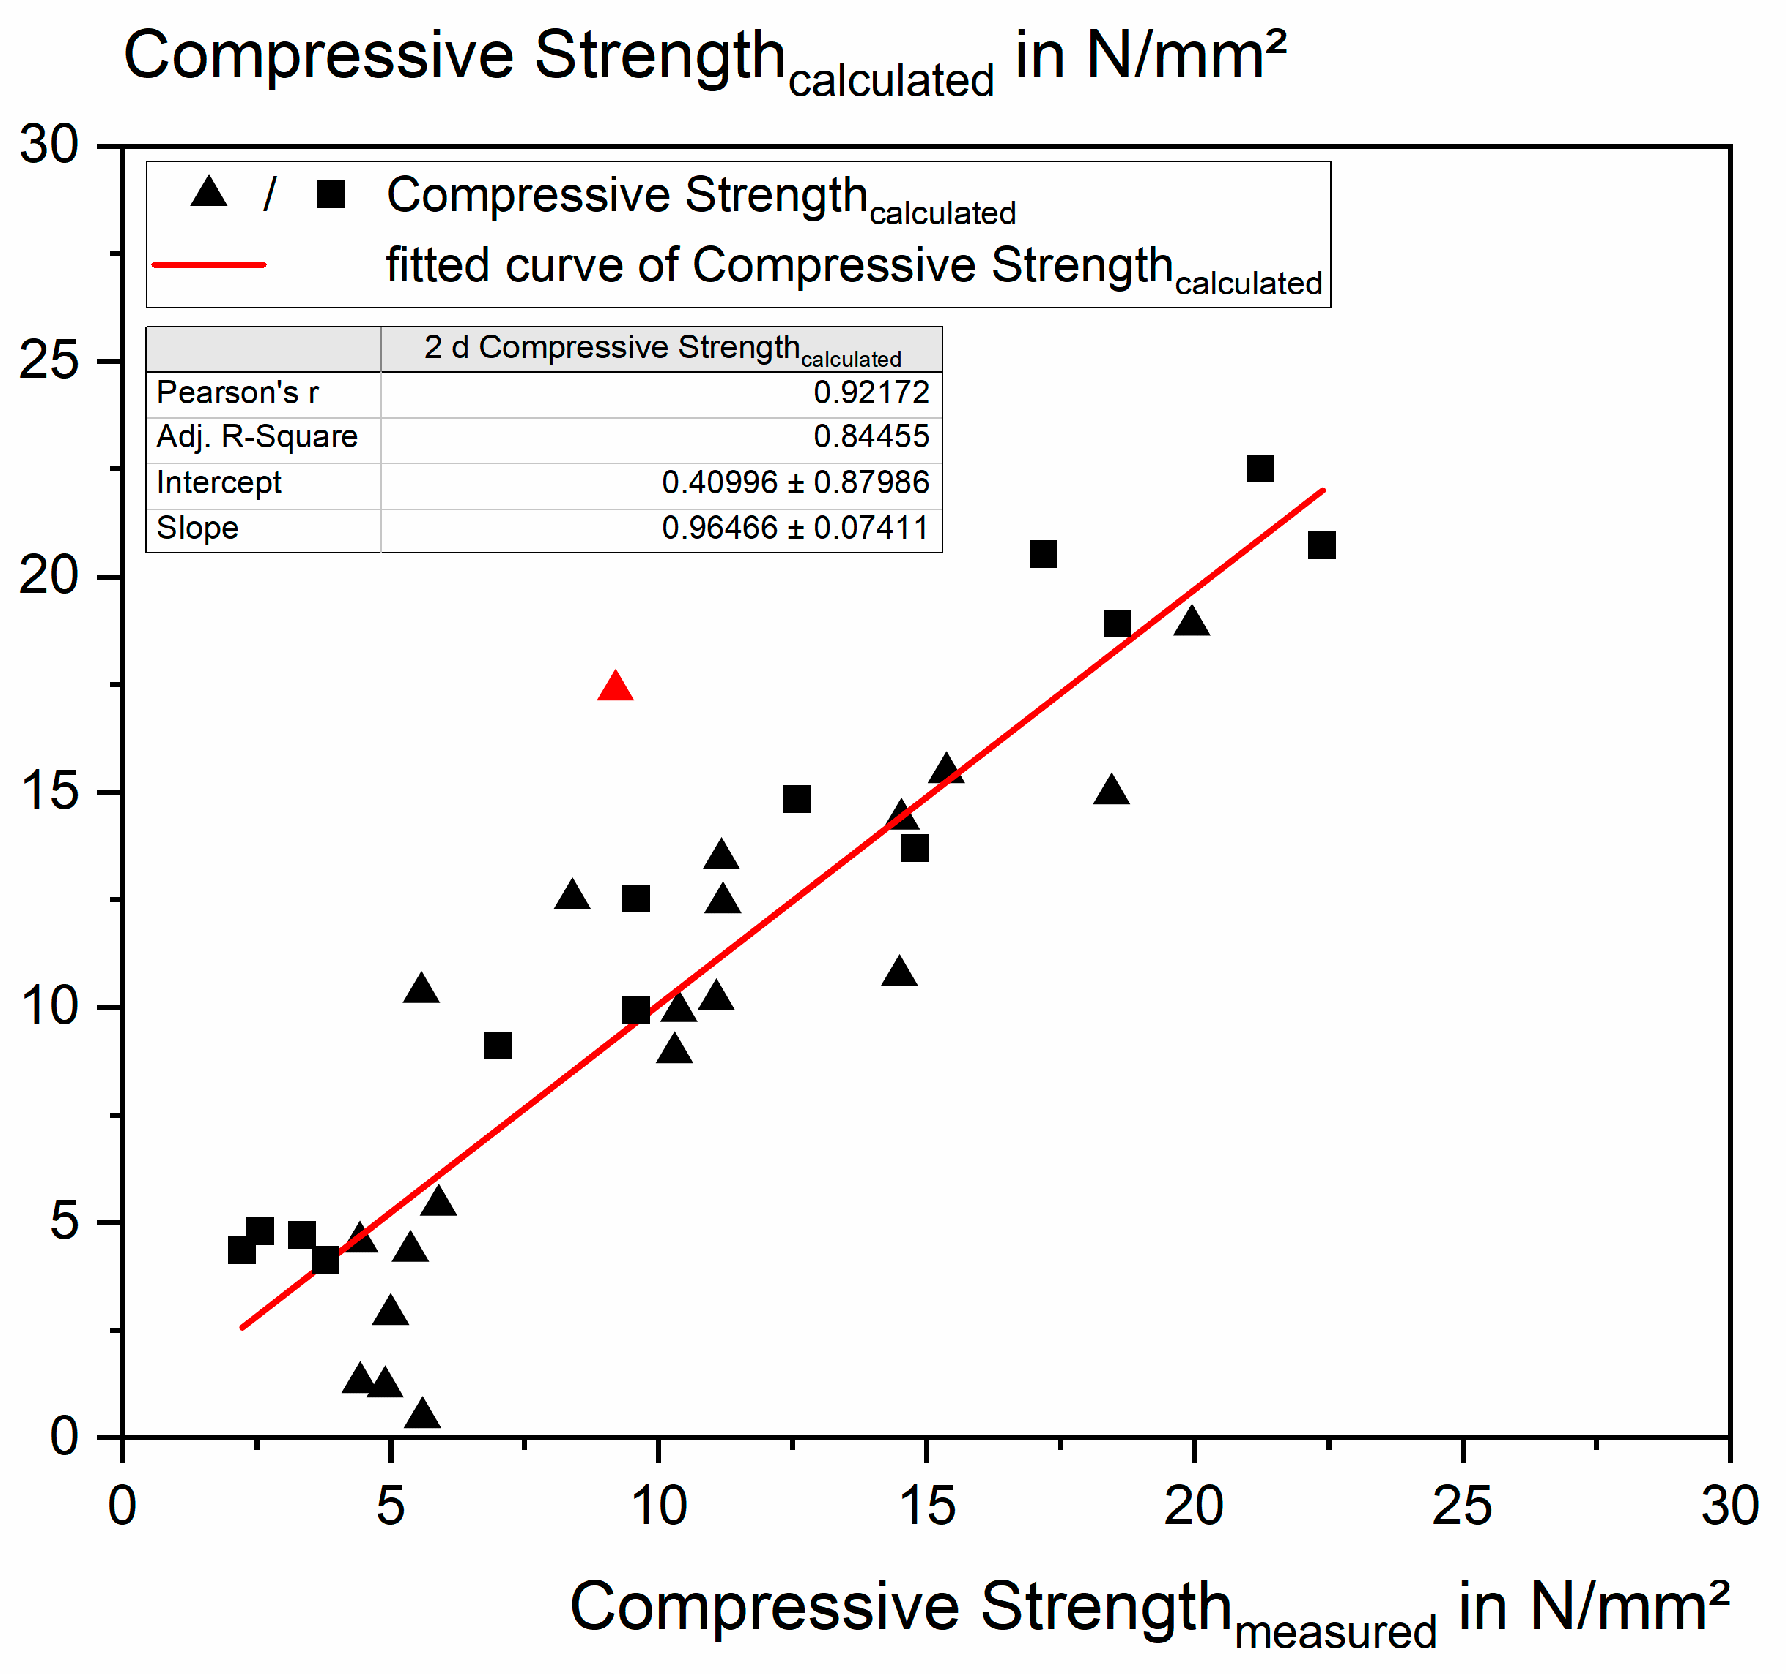
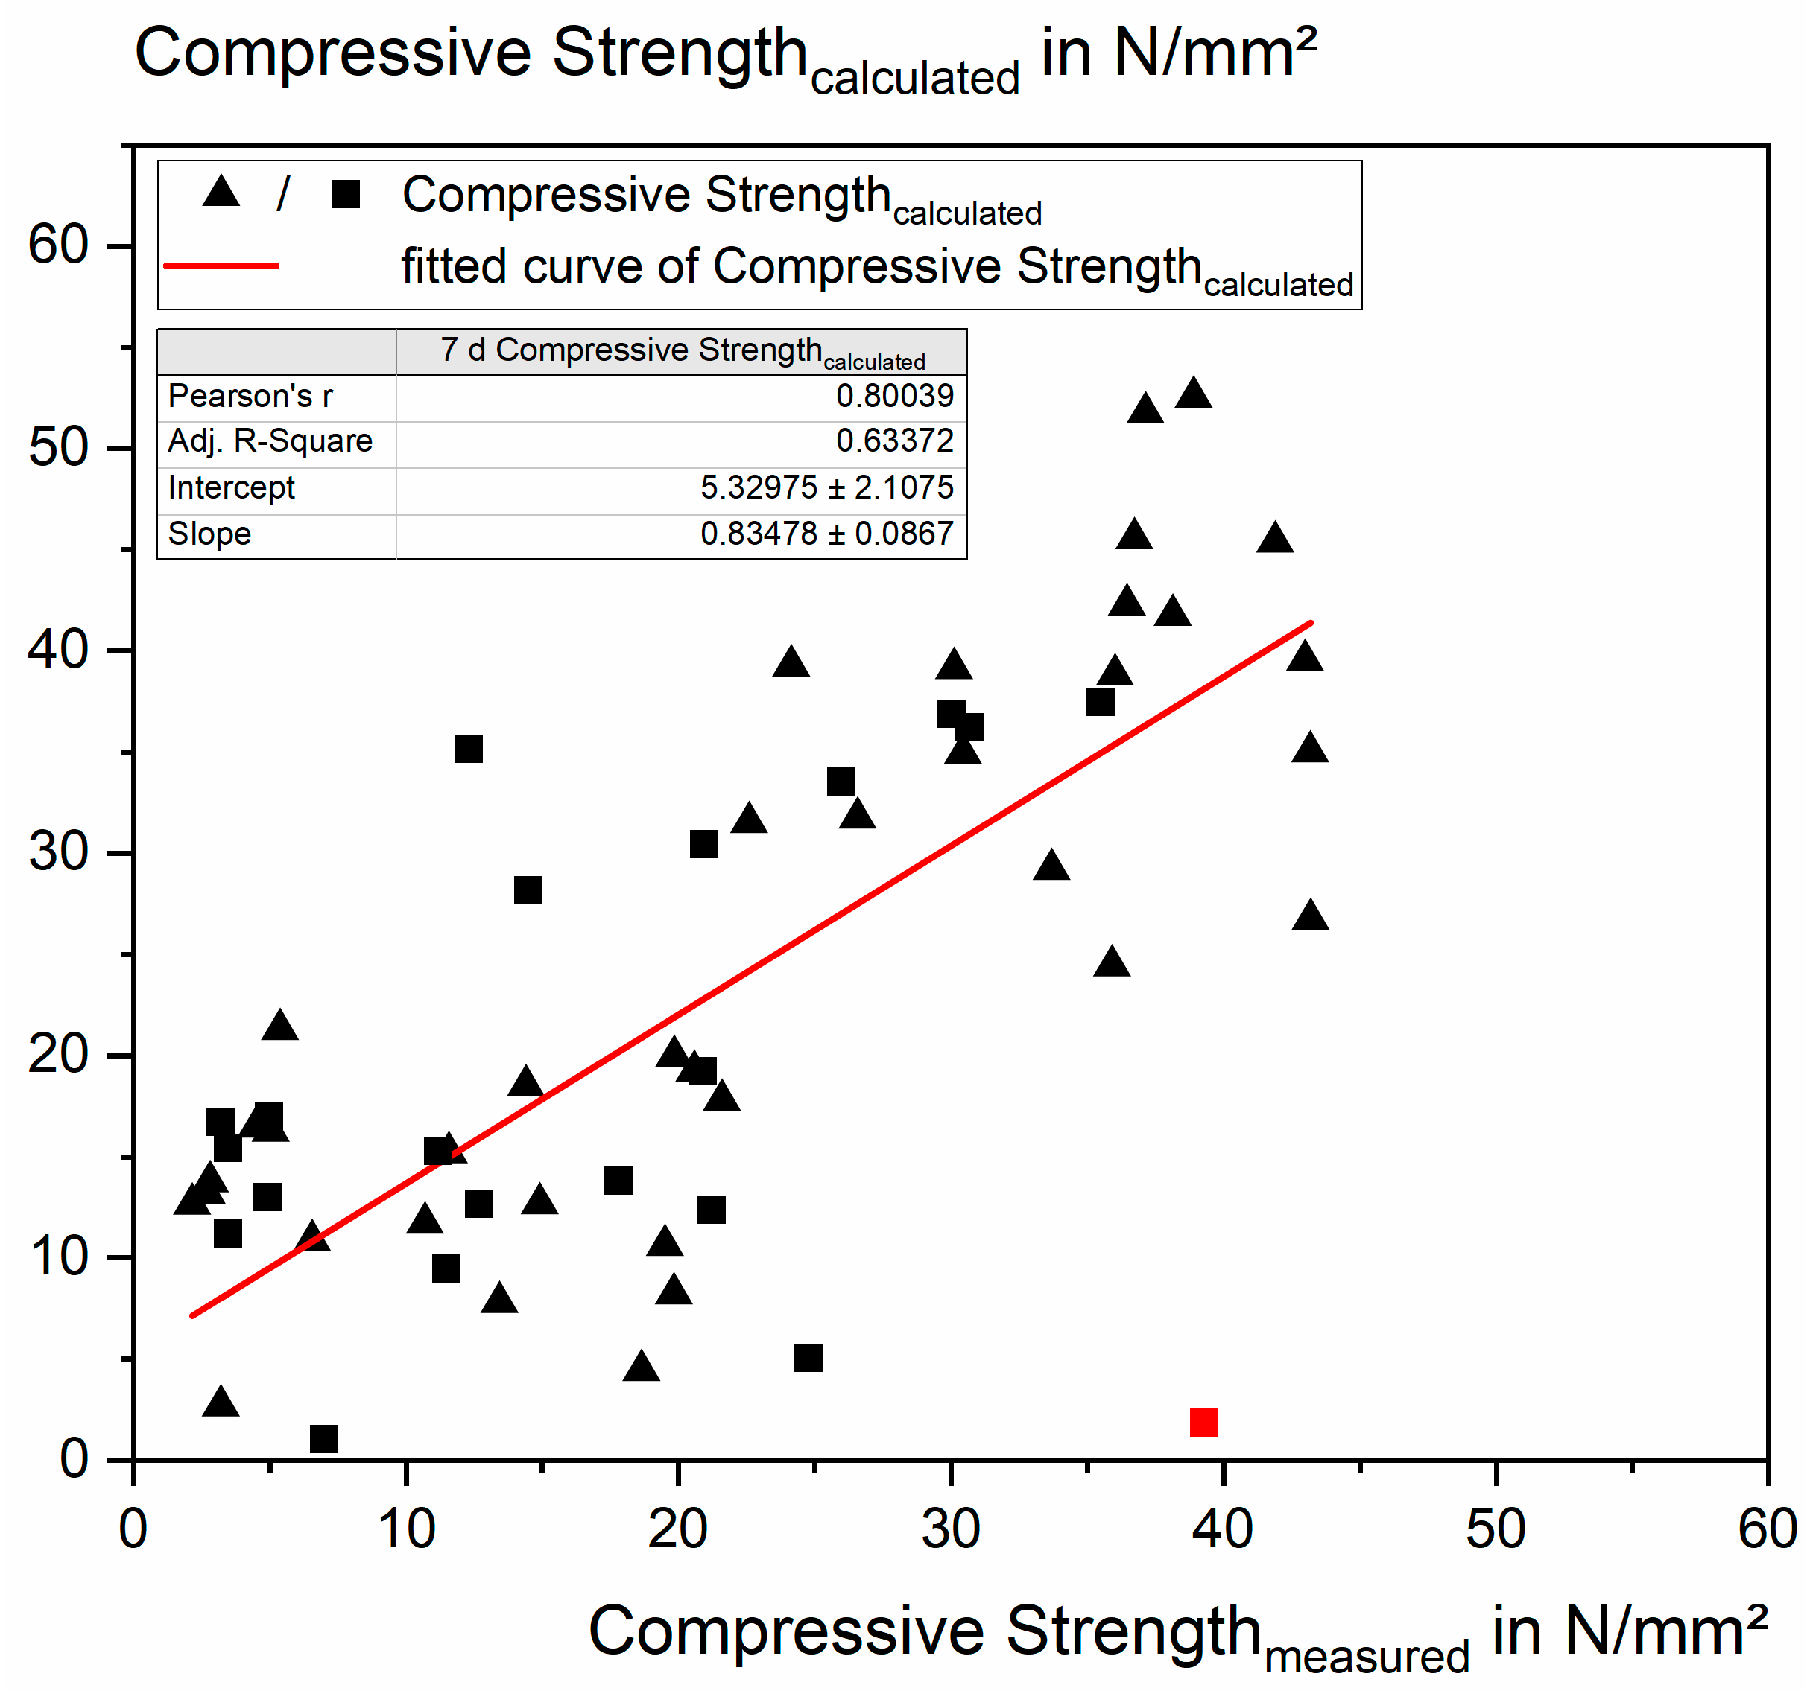
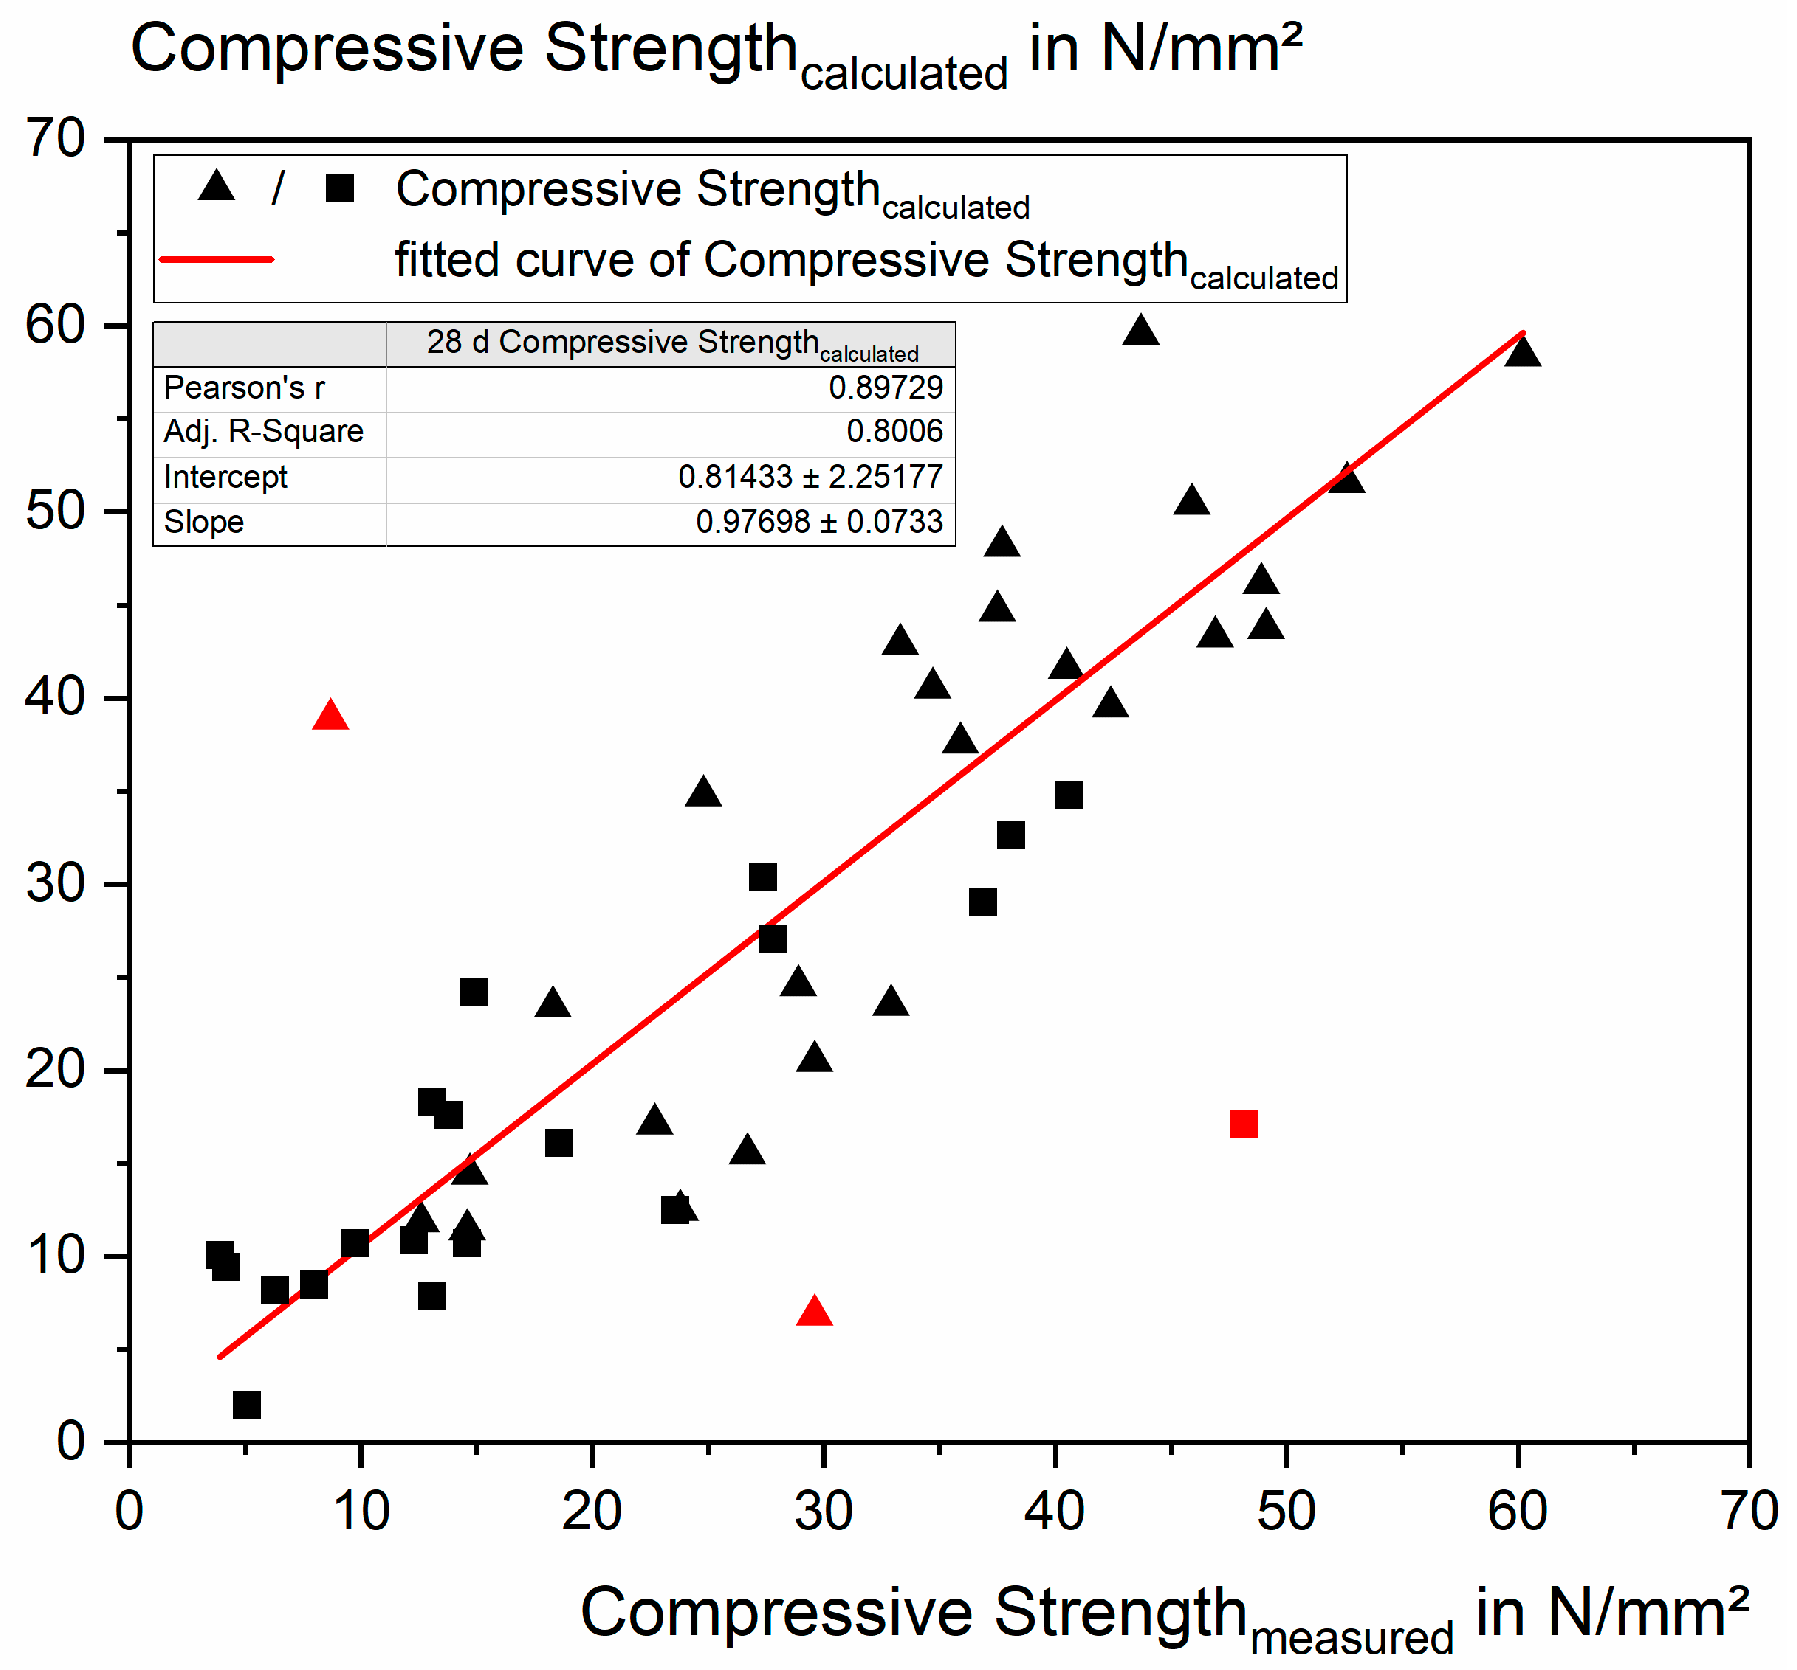
3.2. Linear Regression

Figure 5 shows a heatmap, calculated using OriginLab (Version 2022b), showing the first approach. The results represent linear relationships between the individual parameters of the total chemistry of the pastes, the corrected w/b value, the air void content, the compressive strength, and the contents of the hydroxides. Two hydroxide concentrations were calculated, namely, the minimum concentration results from the amount of either NaOH or KOH that was added. The maximum concentration was calculated under the assumption that, in addition to the hydroxides, all alkali silicates in the activator solution also dissociate entirely and that there is one hydroxide ion for every Na+ or K+ that is contained. This approach was adopted according to a previous study [26]. The blue color marks a negative correlation. A negative correlation means that when value A decreases, value B increases. The red color marks a positive correlation, i.e., when value A increases, value B also increases.
The heatmap shows some correlations between the components (e.g., iron shows a positive correlation with manganese and a negative correlation with titanium). These correlations can help to select the independent parameters for the fitting. The correlation with the compressive strength is the most crucial piece of information, but the Pearson correlation includes all data and considers only the linear correlations of the parameters. Therefore, the informative value of the heat map is limited. In this case, the map suggests that the compressive strength depends on several parameters. Furthermore, the chloride content, the hydroxide concentration, the w/b value, and the air void content show moderate linear correlations.
In the second approach, the activator solution and precursor characteristics are investigated separately (see Figure 6). In this case, the ratio of activator solution/precursorcorr (AS/P) is the most dominant factor regarding compressive strength.
Not all correlations are meaningful. Simple linear correlations are not expected since the mixes differ with respect to several parameters. Parameters such as the air void content, the water-to-binder ratio, the number of hydroxide ions, and the contents of SiO2, Al2O3, Na2O, and K2O must influence the compressive strength. Therefore, multiple relationships were calculated for these parameters using MiniTab, as shown in the next section.

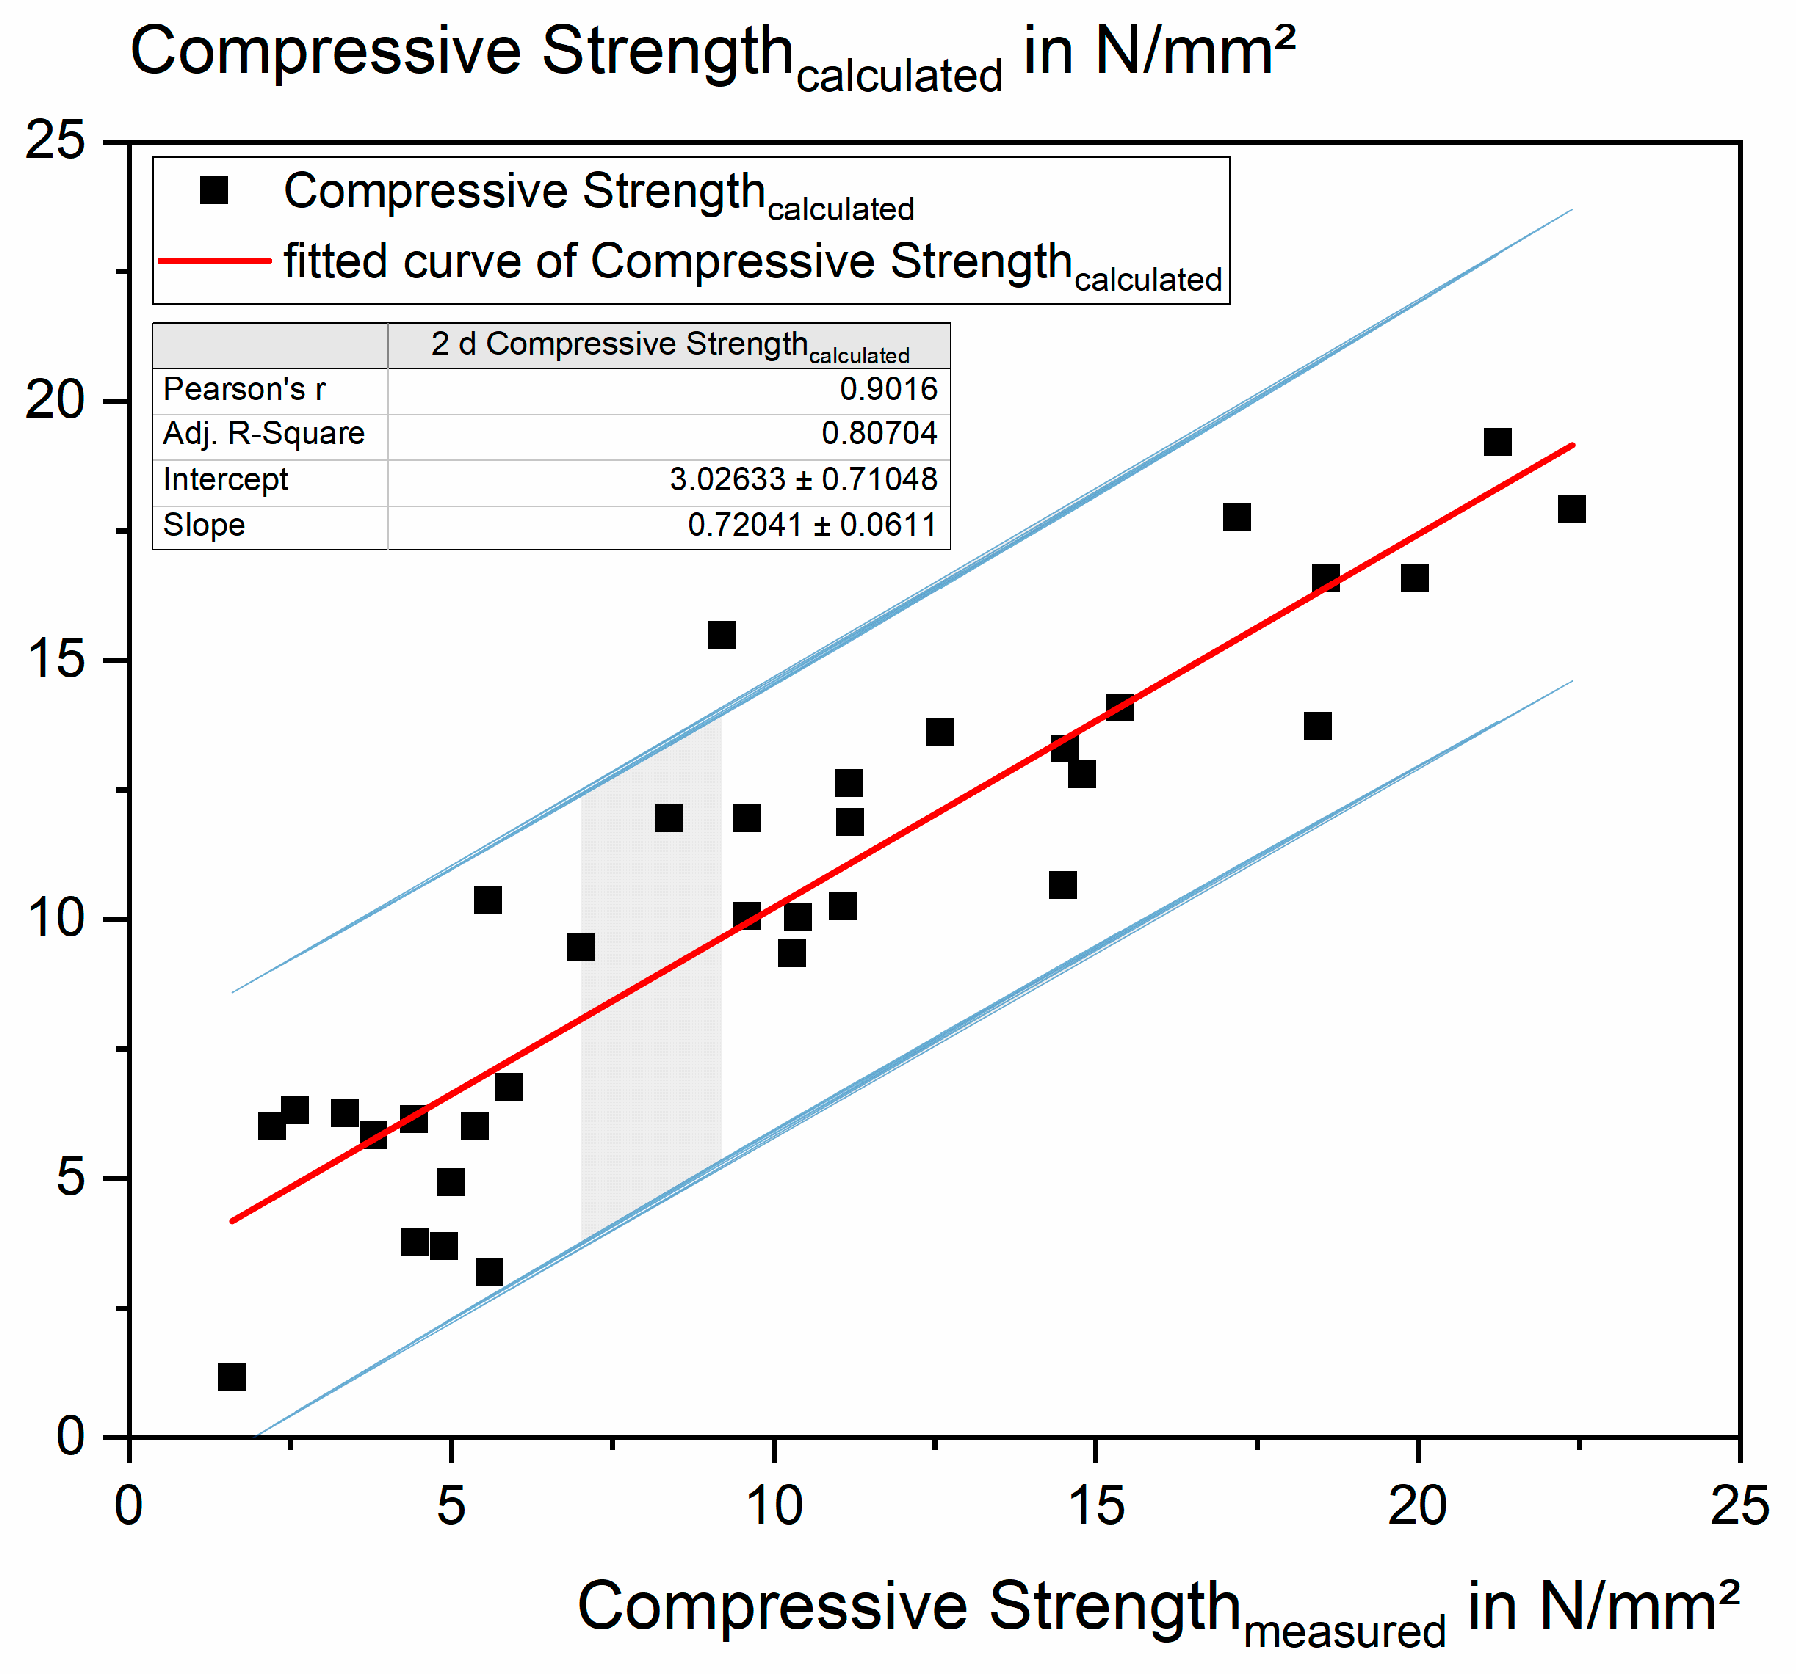
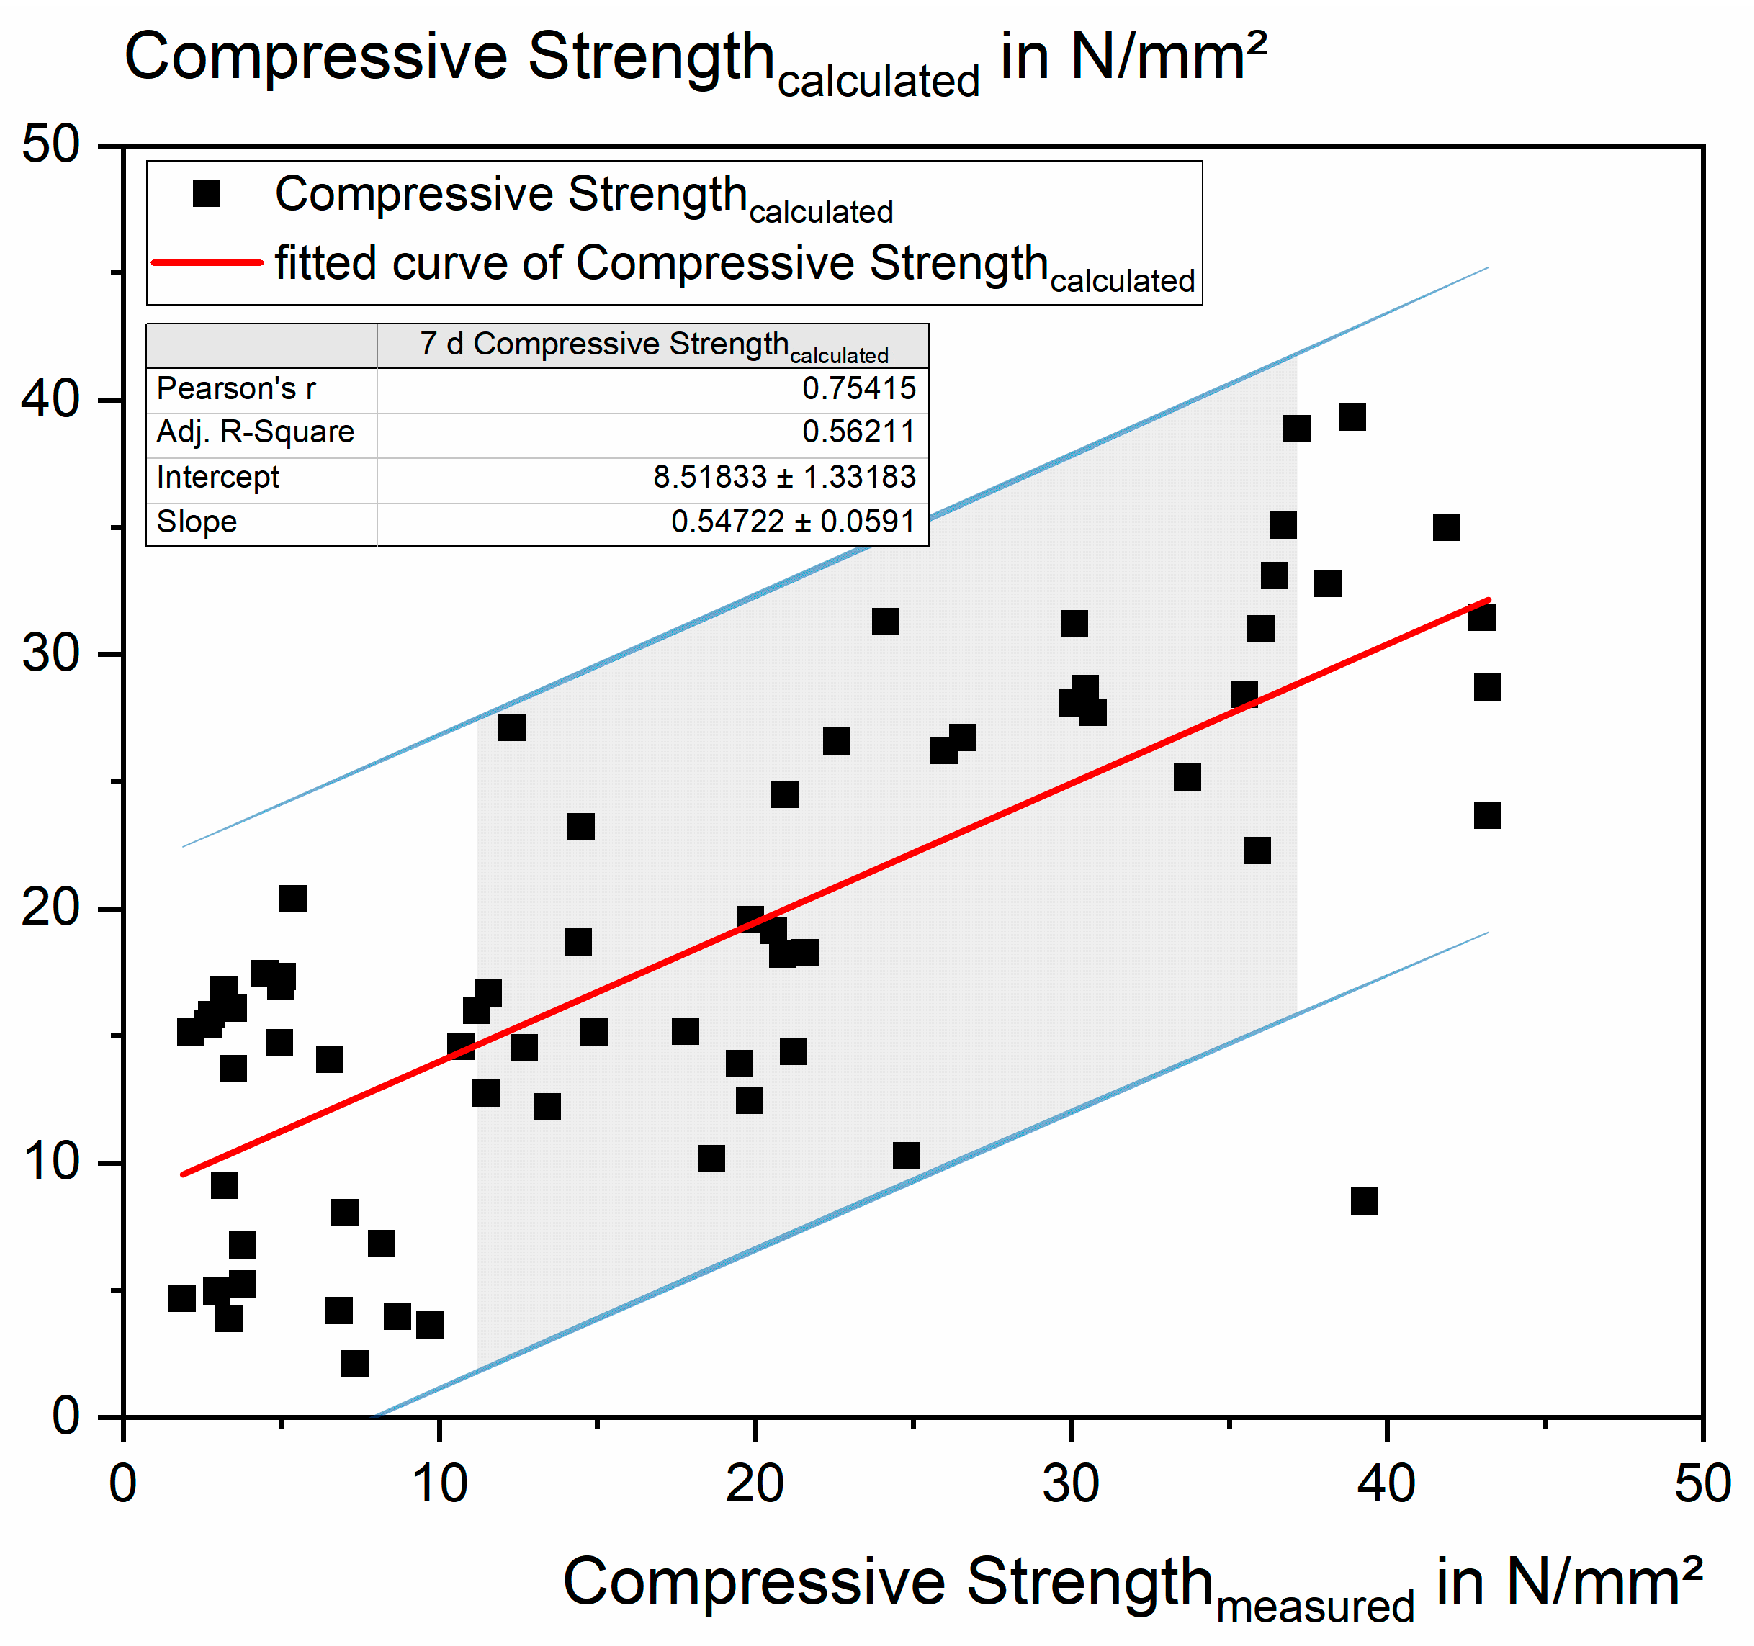
3.3. Calculating the Compressive Strength

Different combinations of parameters were used to calculate the correlations. The best results were obtained by separately calculating the factors from the activator solution and those from the corrected precursor combinations.
For the formulas, all contents with the index “a” belong to the activator solution (in mol/kg activator solution) and the contents with the index “p” belong to the precursor mix (in mol/kg precursor, corrected for the inert phases).
The empirical formula that was thus obtained was used to compare a calculated compressive strength with the measured compressive strength, in order to test the formula. For this purpose, the factors for the 2-, 7- and 28-day compressive strength values were calculated with the respective parameters since strength develops over time and individual factors can become more important or less important at different times.
The calculation formula involved various factors (Equations (1)–(3)), such as the proportion of SiO2, Al2O3, Na2O, and K2O present in the precursor mix (measured in mol/kg of precursorcorr), the number of hydroxides added, the quantity of SiO2, Na2O, and K2O present in the activator solution (measured in mol/kg of a.s.), the ratio of activator solution to the precursor, and the amount of air present.
A 95% prediction band was inserted in Figure 7, Figure 8 and Figure 9, marked with blue lines, to identify the possible statistical outliers. All data points outside this range were declared as outliers and excluded from further calculation.
The results of the two-day compressive strength tests are shown in Figure 7. The fitted formula for the calculation is given as Equation (1). The fit has a Pearson R-value of 0.9, representing a robust correlation. The values scatter slightly, and low strength is overestimated, whereas high strength is slightly underestimated.
f c , 2 d = 66.4 32.6 A S P 0.1437 S i O 2 , p + 0.116 A l 2 O 3 , p 0.738 ( N a 2 O + K 2 O ) p 0.576 S i O 2 , a + 2.98 O H a 0.182 ( N a 2 O + K 2 O ) a 0.476 A i r   c o n t e n t
The results of the seven-day compressive strength tests are shown in Figure 8; the calculation was performed using Equation (2). Here, the values are more scattered than in Figure 7. There are some statistical outliers. The fit is a Pearson R-value of 0.75. This fit can be defined as vital. In the case of the two-day strength tests, low strength is overestimated, whereas high strength is underestimated.
f c , 7 d = 45.4 21.0 A S P 0.079 S i O 2 , p + 0.441 A l 2 O 3 , p 1.277 ( N a 2 O + K 2 O ) p 0.781 S i O 2 , a + 1.78 O H a + 0.2 ( N a 2 O + K 2 O ) a 0.78 A i r   c o n t e n t
The results of the 28-day compressive strength test are shown in Figure 9 and the formula is shown in Equation (3). The values are more scattered than in Figure 7, but are less than those in Figure 8. Here, too, statistical outliers are recognizable. The Pearson R-value here is 0.78, defined as a strong correlation.
f c , 28 d = 25.7 21.5 A S P + 0.009 S i O 2 , p + 0.626 A l 2 O 3 , p 1.32 ( N a 2 O + K 2 O ) p 0.269 S i O 2 , a + 2.55 O H a 0.352 ( N a 2 O + K 2 O ) a 2.012 A i r   c o n t e n t
The scattering pattern of the results may have various causes. On the one hand, testing the compressive strength does not use a precise method. Furthermore, the prisms sometimes have a very high air void content. In addition, errors can occur due to problems during storage, for example, fluctuating temperatures. Temperature fluctuations had a more significant effect as the samples were not stored underwater.
The potential outliers have been marked in red in the following graphs. These mixtures were prepared again and were included in the model at a later time.
Furthermore, these statistical outliers were removed, and the regression degrees were recalculated. Through this correction, all Pearson R-values could be increased. For 2 days, this was only slightly, from 0.9 to 0.92. For 7 days, it was from 0.75 to 0.82, and for 28 days, it was from 0.78 to 0.9. The slope and intercept of these regression lines were then used to correct Equations (1)–(3). The values for the slope and intercept are plotted in Table 6.
In order to correct for the systematic errors of overestimation of low strength and underestimation of high strength, Equations (1)–(3) were corrected. In order to achieve this, the reciprocal value of the slope was calculated with the individual factors for each concrete age, and the quotient from the slope and intercept was inserted. New figures were created using the corrected Equations (4)–(6), with regression and color-coded outliers. The results can be seen in Figure 10, Figure 11 and Figure 12. In these figures, the calcined clay that was used (precursor 1) was additionally specified. In the mixtures where precursor 1 is of the kaolinitic clay (cK), the data points are shown as triangles, and in the blends where the illitic clay is precursor 1, the data points are displayed as squares.
f c , 2 d = 95 44.7 A S P 0.2 S i O 2 , p + 0.16 A l 2 O 3 , p 1.01 ( N a 2 O + K 2 O ) p 0.8 S i O 2 , a + 3.95 O H a 0.25 ( N a 2 O + K 2 O ) a 0.65 A i r   c o n t e n t
f c , 7 d = 62.6 34.7 A S P 0.1 S i O 2 , p + 0.7 A l 2 O 3 , p 2.1 ( N a 2 O + K 2 O ) p 1.3 S i O 2 , a + 3.1 O H a + 0.33 ( N a 2 O + K 2 O ) a 1.3 A i r   c o n t e n t
f c , 28 d = 24.7 30.7 A S P + 0.01 S i O 2 , p + 0.9 A l 2 O 3 , p 1.9 ( N a 2 O + K 2 O ) p 0.4 S i O 2 , a + 3.6 O H a 0.5 ( N a 2 O + K 2 O ) a 2.9 A i r   c o n t e n t
With these correction factors, the prediction of the compressive strength was improved. The slope of the regression degrees in Figure 10 and Figure 12 is now almost equal to 1. In Figure 11 and the corresponding Equation (5), an improvement could be achieved, but the scatter is too high to be able to make an accurate prediction. Due to these adjustments, it was possible to increase the load capacity of the models. The increase in the R2 values can be seen in Table 7.
In addition, an attempt was made to improve the formulas through higher-order factors or transformed variables. For example, the factors of the AS/P ratio and the air content were calculated as 1/x and as logarithmic and exponential since the correlation between the w/b ratio and porosity, on the one hand, and strength, on the other hand, is known to be non-linear for conventional concrete (as can be seen from the so-called Walz curve). Unfortunately, no significant improvements have been achieved as yet. However, with the complete data set, and after repeating some experiments, this approach may improve the formulas further. When the most critical factors are identified, higher weighting can be incorporated into the formula by squaring the associated factors and improving the formula. The high scatter probably prevents the improvement of such operations at the moment.
The results of the 7-day prediction are worse than those of the 2- and 28-day calculations. There may be several reasons for this. When analyzing the monitoring data of the climate chamber, the temperature and humidity during storage cannot be excluded as a reason. The deviations from the target temperature were 20 ± 4 °C. Temperature fluctuations influence the GP system more significantly than with cementitious systems. When cement mortars or concretes are stored underwater, the water acts as a buffer against temperature fluctuations due to its higher specific heat capacity and, thus, provides a more stable climate than the air in the room, which is relevant for the GP samples, which were wrapped in PE foil.
After the deviations in the seven-day storage samples were detected, all further specimens were stored in a climate chamber of the company “Weiss Technik”, with a more stable climate. After repeating the seven-day compressive strength tests, it was possible to verify whether this measure is sufficient or whether further precautions needed to be taken.
Since the GP systems were not stored underwater, we also checked whether the specimens may lose water, which can be worse at a higher temperature and lower relative humidity (65 ± 15% rH). The specimens were weighed after stripping and before the compressive strength test to detect any mass loss due to drying. The maximum mass loss was <0.3 g. Accordingly, hardly any moisture escaped from the specimens, meaning that storage in PE film is suitable for GP systems.
The formulas allow some conclusions to be drawn about the mix composition. Workability control is a fundamental factor, in order to avoid high air void contents. By minimizing this factor, the other influencing factors could be better quantified, and more precise predictions may result. Since the network is built up of aluminum oxides and silicates, the influence of these contents is undisputed. However, the results suggest an optimum value in the composition that still needs to be determined more precisely. The cation in the activator solution has only a minor influence on the compressive strength of AAB, based on calcined clays and natural pozzolans. If this finding can be confirmed, the workability could be optimized by the choice of the cation. As potassium-based systems are more flowable than sodium-based systems [3], it is possible to adjust the workability by mixing these two cations without influencing the compressive strength. The base strength of the alkalis also has an influence, but this is similar to the ratio of aluminum to silicon; there seems to be an optimum that must be further investigated.
When analyzing the results of the compressive strength tests in Figure 10, Figure 11 and Figure 12, it is noticeable that the precursor clearly influences the formation of compressive strength. It is possible to achieve compressive strengths of over 40 N/mm2 after 28 d with both systems, although calcined illite is usually considered to be less reactive. However, the potential to achieve higher compressive strengths is more likely with systems containing kaolinitic clay. Accordingly, the mineralogy and the reactivity of the starting materials are important factors. Reactivity, in this case, means the availability and solubility of Al2O3 and SiO2.
This reactivity is difficult to measure, as it depends on various factors. The authors of [27] showed that, among other things, mineralogy, calciner type, calcination temperature, and duration are the main influencing factors. Furthermore, there is no uniform test for reactivity; there are only tests that show the suitability of SCM in cementitious systems, such as the R3 test [28], or comparative tests, such as the relative compressive strength. These tests give an indication but do not make any statement about the specific reactivity found in a GP system.
In our system, the differences between the precursors are found in the amount of the amorphous portion, the accompanying minerals (Table 2), and the composition of the amorphous portion (Table 3). As described in Section 2.1, the accompanying minerals only participate to a limited extent or not at all in the reaction and can, therefore, be excluded from consideration. The amount of the amorphous fraction is, therefore, more decisive. Here, a difference of 53.1 wt % for cK to 34.1 wt % for cI can be seen. The ratio of SiO2 to Al2O3 in the amorphous portion is similar for both precursors (cf. Table 3). However, the precursor cI has an increased Fe2O3 content, which may also have an influence. Provided that all aluminum and silicon contents are soluble, the available network builders are higher with cK. Thus, the potential to obtain higher compressive strengths is also greater. However, this potential does not translate as 1:1 for the compressive strength, as the compressive strength of these systems is relatively meager and is below the compressive strength of those systems with the precursor 1 cI.
A simple correlation via the amount of the amorphous portion of the precursor formulations was impossible, as the variation due to the mixing was no longer large enough to recognize trends.
In principle, more highly concentrated alkaline solutions have a greater ability to dissolve ions from the precursors. Mixtures with highly alkaline alkalis should, therefore, also achieve the greatest compressive strength. In [29], it was shown that better values can be obtained for lower concentrations with an optimized mixture. This observation agrees with our results. In water glass-based activator systems, there seems to be more of an optimum in alkalinity, instead of a maximum.
In this study, it was shown that the cation of the activator solution has no direct influence on the compressive strength. However, this finding is not generally valid for all AAB systems. For example, it was shown in [30] that potassium-based activators in alkali-activated slag systems lead to faster setting and increased compressive strength.
In summary, each component and mix-design parameter of an AAB system is essential and influences the binder’s performance. Research is needed to elucidate how these individual parameters affect each other. A test to determine the reactivity of clays would be another way to uncover the mechanisms. The influence of the properties of the activator on the performance of the binder must be investigated using methods that allow conclusions to be drawn about the phases that then form, such as 29Si/27Al MAS NMR and FTIR analyses. Systematic investigations can clarify the influence on the structure and, thus, establish the connection.

4. Conclusions

Within the framework of this study, a test program is presented, with which it is possible to make predictions about the compressive strength of low-calcium alkali-activated binders based on calcined clays and natural pozzolans. For this purpose, the raw materials were characterized chemically, physically, and mineralogically. In the course of a parameter study, various potential influencing factors in the binder composition were varied, such as the precursor mix, the cation in the activator solution, the hydroxide addition to the activator solution (in the form of NaOH and/or KOH), the molar ratio of SiO2/(Na,K)2O in the activator solution, and the water/binder ratio in the mortar studies. The most important findings can be summarized as follows:
  • No one parameter alone is responsible for the compressive strength, but rather a combination of several parameters. Regarding the precursor, the influencing parameters were the contents of Al2O3, SiO2, and (Na,K)2O. On the side of the activator solution, the SiO2 content, the content of (Na,K)2O, and the alkalinity of the activator solution were decisive. In addition, the ratio of the activator solution to the precursor and the air void content in the mortar play a significant role.
  • An empirical formula for predicting the compressive strength could be derived for the 2-, 7- and 28-day compressive strengths.
  • The type of cation (Na- or K-based) has little influence on the compressive strength.
  • With the formulas, it was possible to identify outliers, which will be controlled by repeated testing.
  • The high water demand of calcined clays strongly impairs their workability. As a result, the air void content is, in some cases, significantly higher than in cementitious systems. This problem will remain until suitable, reliable admixtures for AAB have been developed.
  • For early strength after 2 days and strength after 28 days, more reliable predictions can be made than at 7 days. Probably, some values are incorrect, and these experiments must be repeated.

5. Outlook

Further research will focus on:
  • Optimization and completion of the model;
  • Validation of the model through targeted mixture development using new precursor materials;
  • Since workability is considered essential in preparing the materials for construction, further studies will investigate the factors influencing processability. The focus will be on the influence of the particle properties of the precursors and of the cation in the activator solution. Furthermore, the influence of the different silicate sources on workability will be studied. A model will then be developed to control the workability.

Author Contributions

Conceptualization, H.K. and A.V.; methodology, H.K.; investigation, H.K.; data curation, H.K. and A.V.; writing—original draft, H.K.; writing—review and editing, H.K. and A.V.; visualization, H.K.; supervision, A.V.; project administration, A.V. All authors have read and agreed to the published version of the manuscript.

Funding

The work underlying this article was funded by the Deutsche Forschungsgemeinschaft (DFG, German Research Foundation)–SFB/TRR 280. Projekt-ID: 417002380.

Acknowledgments

The authors would like to thank the DFG for supporting the research project.

Conflicts of Interest

The authors declare no conflict of interest.

References

  1. Koenig, A.; Herrmann, A.; Overmann, S.; Dehn, F. Resistance of alkali-activated binders to organic acid attack: Assessment of evaluation criteria and damage mechanisms. Constr. Build. Mater. 2017, 151, 405–413. [Google Scholar] [CrossRef]
  2. Davidovits, J. Geopolymer: Chemistry and Applications, 3rd ed.; Institute Geopolymere: Saint-Quentin, France, 2011. [Google Scholar]
  3. Provis, J.L.; Bernal, S.A. Geopolymers and Related Alkali-Activated Materials. Annu. Rev. Mater. Res. 2014, 44, 299–327. [Google Scholar] [CrossRef]
  4. Provis, J.L. (Ed.) Geopolymers: Structure, Processing, Properties and Industrial Applications; Woodhead Publishing Limited: Cambridge, UK; CRC Press: Oxford, UK; Boca Raton, FL, USA, 2009. [Google Scholar]
  5. Herrmann, A.; Koenig, A.; Dehn, F. Structural concrete based on alkali-activated binders: Terminology, reaction mechanisms, mix designs and performance. Struct. Concr. 2018, 19, 918–929. [Google Scholar] [CrossRef]
  6. Duxson, P.; Provis, J.L.; Lukey, G.C.; Mallicoat, S.W.; Kriven, W.M.; van Deventer, J.S. Understanding the relationship between geopolymer composition, microstructure and mechanical properties. Colloids Surf. A Physicochem. Eng. Asp. 2005, 269, 47–58. [Google Scholar] [CrossRef]
  7. Duxson, P.; Provis, J.L.; Lukey, G.C.; Separovic, F.; van Deventer, J.S.J. 29Si NMR study of structural ordering in aluminosilicate geopolymer gels. Langmuir ACS J. Surf. Colloids 2005, 21, 3028–3036. [Google Scholar] [CrossRef] [PubMed]
  8. Provis, J.L.; Lukey, G.C.; van Deventer, J.S.J. Do Geopolymers Actually Contain Nanocrystalline Zeolites? A Reexamination of Existing Results. Chem. Mater. 2005, 17, 3075–3085. [Google Scholar] [CrossRef]
  9. Zhong, J.; Zhou, G.-X.; He, P.-G.; Yang, Z.-H.; Jia, D.-C. 3D printing strong and conductive geo-polymer nanocomposite structures modified by graphene oxide. Carbon 2017, 117, 421–426. [Google Scholar] [CrossRef]
  10. Li, C.; Sun, H.; Li, L. A review: The comparison between alkali-activated slag (Si + Ca) and metakaolin (Si + Al) cements. Cem. Concr. Res. 2010, 40, 1341–1349. [Google Scholar] [CrossRef]
  11. Rahier, H.; van Mele, B.; Biesemans, M.; Wastiels, J.; Wu, X. Low-temperature synthesised aluminosilicate glasses. J. Mater. Sci. 1996, 31, 71–79. [Google Scholar] [CrossRef]
  12. Granizo, M.L.; Alonso, S.; Blanco-Varela, M.T.; Palomo, A. Alkaline Activation of Metakaolin: Effect of Calcium Hydroxide in the Products of Reaction. J. Am. Ceram. Soc. 2002, 85, 225–231. [Google Scholar] [CrossRef]
  13. Brigatti, M.F.; Galán, E.; Theng, B. Structure and Mineralogy of Clay Minerals. In Handbook of Clay Science; Elsevier: Amsterdam, The Netherlands, 2013; pp. 21–81. [Google Scholar]
  14. Schreiber, U.; Jentzsch, G. Vulkanische Gefährdung in Deutschland: Bewertung Möglicher Vulkanischer Aktivitäten der Nächsten 1 Million Jahre in Deutschland Inklusive Festlegung der Gebiete mit einer Eintrittswahrscheinlichkeit in Diesem Zeitraum; Research Report; Bundesanstalt für Endlagerung: Peine, Germany, 2021; Available online: https://www.google.com/url?sa=t&rct=j&q=&esrc=s&source=web&cd=&cad=rja&uact=8&ved=2ahUKEwic6pCDvfqBAxWtg_0HHbRGAJEQFnoECA4QAQ&url=https%3A%2F%2Fwww.bge.de%2Ffileadmin%2Fuser_upload%2FStandortsuche%2FForschung%2FBericht_-_Vulkanische_Gefaehrdung_in_Deutschland_barrierefrei.pdf&usg=AOvVaw139fdSsfQbeZd6rUD0chIs&opi=89978449 (accessed on 10 October 2023).
  15. Benedix, R. Bauchemie: Einführung in Die Chemie für Bauingenieure und Architekten, 6th ed.; Springer: Wiesbaden, Germany, 2015. [Google Scholar]
  16. Sebastian, U. Gesteinskunde; Springer: Berlin/Heidelberg, Germany, 2014. [Google Scholar]
  17. Wetzel, A.; Middendorf, B. Influence of silica fume on properties of fresh and hardened ultra-high performance concrete based on alkali-activated slag. Cem. Concr. Compos. 2019, 100, 53–59. [Google Scholar] [CrossRef]
  18. Scrivener, K.L.; Lothenbach, B.; de Belie, N.; Gruyaert, E.; Skibsted, J.; Snellings, R.; Vollpracht, A. TC 238-SCM: Hydration and microstructure of concrete with SCMs. Mater. Struct. 2015, 48, 835–862. [Google Scholar] [CrossRef]
  19. Grim, R.E. Applied Clay Mineralogy; McGraw-Hill: New York, NY, USA, 1962. [Google Scholar]
  20. Markl, G. Minerale und Gesteine: Eigenschaften, Bildung, Untersuchung, 1st ed.; Elsevier: Heidelberg, Germany, 2004. [Google Scholar]
  21. DIN EN 13263-1:2009-07; Silikastaub für Beton—Teil 1: Definitionen, Anforderungen und Konformitätskriterien. Deutsche Fassung; Beuth: Berlin, Germany, 2009.
  22. DIN EN 196-2:2013-10; Prüfverfahren für Zement—Teil 2: Chemische Analyse von Zement. Deutsche Fassung; Beuth: Berlin, Germany, 2013.
  23. DIN EN 196-6:2019-03; Prüfverfahren für Zement—Teil 6: Bestimmung der Mahlfeinheit. Deutsche Fassung; Beuth: Berlin, Germany, 2019.
  24. DIN EN 196-1:2016-11; Prüfverfahren für Zement—Teil 1: Bestimmung der Festigkeit. Deutsche Fassung; Beuth: Berlin, Germany, 2016.
  25. DIN 1015-3:2007-05; Prüfverfahren für Mörtel für Mauerwerk—Teil 3: Bestimmung der Konsistenz von Frischmörtel (mit Ausbreittisch). Deutsche Fassung; Beuth: Berlin, Germany, 2007.
  26. Gluth, G.J.G.; Ke, X.; Vollpracht, A.; Weiler, L.; Bernal, S.A.; Cyr, M.; Dombrowski-Daube, K.; Geddes, D.A.; Grengg, C.; Le Galliard, C.; et al. Carbonation rate of alkali-activated concretes and high-volume SCM concretes: A literature data analysis by RILEM TC 281-CCC. Mater. Struct. 2022, 55, 225. [Google Scholar] [CrossRef]
  27. Overmann, S.; Vollpracht, A.; Matschei, T. Einflussfaktoren hinsichtlich der Reaktivität von calcinierten Tonen—Eine Literaturrecherche. In Proceedings of the 21st International Conference on Building Materials, Weimar, Germany, 13–15 September 2023. [Google Scholar]
  28. Avet, F.; Snellings, R.; Diaz, A.A.; Haha, M.B.; Scrivener, K. Development of a new rapid, relevant and reliable (R³) test method to evaluate the pozzolanic reactivity of calcined kaolinitic clays. Cem. Concr. Res. 2016, 85, 1–11. [Google Scholar] [CrossRef]
  29. Onoue, K.; Sagawa, Y.; Atarashi, D.; Takayama, Y. Optimization of mix proportions and manufacturing conditions of fly ash-based geopolymer mortar by parameters design with dynamic characteristics. Cem. Concr. Compos. 2022, 133, 104645. [Google Scholar] [CrossRef]
  30. Tänzer, R.; Jin, Y.; Stephan, D. Alkali activated slag binder: Effect of cations from silicate activators. Mater. Struct. 2017, 50, 91. [Google Scholar] [CrossRef]
Figure 1. Calcination path of the raw clay.
Buildings 13 02617 g001
Figure 2. Ex situ XRD diffractogram of the 2-, 7- and 28-day storage samples (Mix 76).
Buildings 13 02617 g002
Figure 3. Ex situ XRD diffractogram of the 2-, 7- and 28-day storage samples (Mix 262).
Buildings 13 02617 g003
Figure 4. Particle size distribution of the precursors.
Buildings 13 02617 g004
Figure 5. Heatmap of the Pearson correlations between the parameters of the total binder chemistry (left) and the factors from the activator solution (right) to the strength measurements.
Buildings 13 02617 g005
Figure 6. Heatmap of the Pearson correlations between the separate parameters of the activator solution (left) and the precursor mix (right).
Buildings 13 02617 g006
Figure 7. Regression function and a graphical representation of the multiple regression results of the two-day compressive strength tests. Note: Area between the blue lines marks the 95%prediction band.
Buildings 13 02617 g007
Figure 8. Regression function and graphical representation of the multiple regression results of the seven-day compressive strength test. Note: Area between the blue lines marks the 95%prediction band.
Buildings 13 02617 g008
Figure 9. Regression function and graphical representation of the multiple regression results of the 28-day compressive strength test. Note: Area between the blue lines marks the 95%prediction band.
Buildings 13 02617 g009
Figure 10. Corrected regression function and graphical representation of the multiple regression results of the two-day compressive strength test, with statistical outliers highlighted in red. Note: triangles represent mixes with cK, and squares, mixes with cI.
Buildings 13 02617 g010
Figure 11. Corrected regression function and graphical representation of the multiple regression results of the seven-day compressive strength test, with statistical outliers highlighted in red. Note: triangles represent mixes with cK, and squares, mixes with cI.
Buildings 13 02617 g011
Figure 12. Corrected regression function and graphical representation of the multiple regression results of the 28-day compressive strength test, with statistical outliers highlighted in red. Remark: triangles represent mixes with cK, and squares, mixes with cI.
Buildings 13 02617 g012
Table 1. Chemical composition of the precursor components (dried sample).
Component/ParametercKcInPSF
wt %wt %wt %wt %
LOI1.811.206.372.05
Carbon as C0.020.020.130.80
as CO20.070.070.482.93
CaO0.340.303.890.34
SiO262.061.154.495.1
Al2O331.222.717.80.5
Fe2O31.169.535.160.18
MnO0.010.090.100.02
MgO0.800.671.480.55
TiO20.151.210.710.01
P2O50.020.040.190.13
K2O1.882.725.771.09
Na2O0.010.363.200.44
Na2Oeq1.242.147.001.16
Cl0.00900.0040.069
SO30.040.040.130.44
Table 2. Mineralogical composition of the precursor components.
ComponentcKcInPSF
wt %wt %wt %wt %
quartz22.035.712.60.2
orthoclase4.7---
illite/muscovite20.122.3--
plagioclase-0.9--
rutile-1.8--
hematite-5.3--
analcime--26.6-
sanidine--36.6-
phengite--10.3-
amorphous53.134.013.999.8
Table 3. Calculated chemical composition of the amorphous (reactive) part of the precursors (dried sample).
Component/ParametercKamcIamnPamSFam
wt %wt %wt %wt %
LOI1.811.206.372.05
Carbon as C0.130.192.460
as CO20.040.050.670.08
CaO0.640.0920.10.34
SiO253.740.935.295.4
Al2O341.435.11.390.47
Fe2O32.1719.926.70.18
MnO0.020.230.540.02
MgO1.491.747.660.05
TiO20.2803.660.01
P2O50.040.100.970.13
K2O0001.09
Na2O0.020.9200.44
Na2Oeq0.020.9201.29
Cl0.0200.020.69
SO30.080.440.100.44
Table 4. Results of the physical characterization.
ParameterUnitcKcInPSF
Blaine Valuecm2/g656215,634 1773340,030 1
BET Valuem2/g19.723.68.678.9
Densitykg/m32661276925652358
d10µm4.410.921.330.73
d5033.089.7312.316.32
d90103.2965.1866.2212.43
RRSB
fitting
d63.3µm49.5717.6021.377.55
n-1.20.670.731.1
1 Value outside of the device calibration.
Table 5. Examined variation parameters.
ParameterVariation
Precursor mix(cI or cK):nP = 75:25
(cI or cK):nP = 50:50
(cI or cK):nP:SF = 72.5:22.5:5
(cI or cK):nP:SF = 47.5:47.5:5
(8 variations)
Cation in the activator solutionNa, K, Na + K (50:50)
(3 variations)
Hydroxide addition to the activator solution (in the form of NaOH and/or KOH)5 mol/L; 6.25 mol/L; 7.5 mol/L
(3 variations)
Molar ratio of SiO2/(Na,K)2O in the activator solution1; 1.5; 2
(3 variations)
Water/binder ratio0.35; 0.4; 0.5
(3 variations)
Table 6. Slope and intercept of the regression line after removing the outliers.
SlopeIntercept
2-day regression0.722.80
7-day regression0.607.45
28-day regression0.708.48
Table 7. The trend of the R² values.
R² before CorrectionR² after Correction
2-day regression0.800.84
7-day regression0.560.63
28-day regression0.600.80
Disclaimer/Publisher’s Note: The statements, opinions and data contained in all publications are solely those of the individual author(s) and contributor(s) and not of MDPI and/or the editor(s). MDPI and/or the editor(s) disclaim responsibility for any injury to people or property resulting from any ideas, methods, instructions or products referred to in the content.

