Article

Study on the Influence of a Rubber-Modified Soil Isolation Layer on the Isolation Performance of Frame Structures with Different Foundation Forms

1
The Seventh Engineering Co., Ltd. of CFHEC, Zhengzhou 451450, China
2
School of Civil Engineering, Chang’an University, Xi’an 710064, China
*
Author to whom correspondence should be addressed.
Buildings 2023, 13(10), 2584; https://doi.org/10.3390/buildings13102584
Submission received: 8 September 2023 / Revised: 8 October 2023 / Accepted: 10 October 2023 / Published: 13 October 2023

Abstract

:
In order to investigate the seismic performance of a rubber-modified soil isolation layer, a three-dimensional finite element model was constructed using finite element analysis software, utilizing a two-story frame structure as the engineering background. Nonlinear dynamic time history analysis and comparisons were performed against the seismic performance of the structure. The evaluation was based on several parameters, including the contact area of the base, the thickness of the rubber-particle-modified soil isolation layer, ground motion records with varying amplitudes, and seismic frequency spectrum characteristics. The research findings indicate that the implementation of a rubber-modified soil isolation layer effectively mitigates the peak acceleration, horizontal displacement, and shear stress of the frame structure. This not only enhances the seismic performance of the structure but also enlarges the contact area of the base. Increasing the thickness of the rubber-modified soil isolation layer will effectively decrease the peak acceleration, horizontal displacement, and shear stress of the structure during seismic events. The effectiveness of the isolation provided by the rubber-modified soil layer improves as the intensity of the ground motion record increases.

1. Introduction

A significant quantity of waste rubber tires is generated every year in China, resulting in considerable environmental pollution. The rubber-modified soil, produced by recycling and crushing waste tires and blending them with loess, exhibits favorable physical and mechanical properties, and effectively addresses the issue of environmental pollution. Rubber materials have found extensive applications in the field of civil engineering. An example of this application is the amalgamation of waste rubber tires with sand to create a cost-effective and practical structural foundation, which demonstrates excellent performance. The rubber-modified soil offers several advantages, including a straightforward structure, positive environmental influence, dependable load-bearing capacity, and cost-effectiveness. This technique has the potential to significantly enhance the safety factor of rural building structures. Another approach involves mechanically breaking down waste rubber tires into fragments or particles. These fragments or particles are then combined with sand and soil in specific proportions to create a new material known as rubber sand or rubber soil mixture, which is practical for engineering applications. The blend of rubber sand and rubber soil is characterized by strong performance in terms of elastic deformation, excellent elastic recovery, a lightweight composition, a low shear modulus, and high damping properties. It has been proven that rubber material is a promising new material with commendable performance and environmental benefits.
Currently, several scholars have conducted experimental research on the mechanical properties of rubber particles when integrated into soil samples, and yielded meaningful results. For instance, Soltani et al. [1] conducted a study on the influence of fine and coarse recycled tire rubber on the expansion and shrinkage of high expansive soil mixture. Two types of rubber were blended into the soil at four distinct content levels (i.e., the mass ratio of rubber to dry soil) of 5, 10, 20, and 30%, respectively. The results demonstrated that rubber with a maximum content of 10% was deemed the most suitable option. In cases where environmental concerns take precedence and strength and stiffness are not significant issues, up to 20% of rubber content can also be deemed acceptable. Raeesi et al. [2] investigated the mechanical properties of a substantial permeable pavement test site situated in South Australia. This pavement was composed of tires and rock-derived aggregates (TDA and RDA) bonded together using a polyurethane (PUR)-based adhesive. Various TDA hybrid designs were employed, involving different RDA content, size, shape, and diverse PUR content. In total, an area spanning approximately 400 square meters was laid as part of the study. Increasing the amount of RDA aimed to enhance the interaction and friction between particles, promoting a more pliable rigid body. This in turn elevated the strength and stiffness of the pavement while concurrently limiting its susceptibility to strain during development. Akbarimehr et al. [3,4] employed three distinct forms of rubber (granular, fibrous, and flake) to assess the shear strength of waste clay infused with rubber. The results indicated that an increase in rubber particle size led to enhancements in both the strength and shear strain of the mixture. At varying ultimate stress levels, the mixture incorporating rubber dust exhibited a strength that was 10–25% higher compared to the mixture containing rubber powder. Saparudin et al. [5] incorporated 5%, 10%, and 15% of tire rubber fragments into the soil samples, and conducted tests to assess the physical properties of clay sand, including particle size distribution and plasticity index. The test results demonstrated that the tire rubber powder met the requirements for effectively stabilizing the clay sand soil in highway construction roadbeds. Sadek and El-Attar [6] incorporated tire fragments of various sizes into the mixture for producing cement bricks. A novel type of wall was created, and its mechanical properties were thoroughly investigated. The study revealed that both the size and content of rubber tire fragments significantly influenced the strength of the blocks. Chen Yong et al. [7] studied the shear mechanical properties of modified loess improved by incorporating rubber particles and EICP technology. The results demonstrated that the addition of rubber powder had a positive influence on enhancing the shear strength of the loess to a certain extent. Furthermore, when combined with EICP technology, the shear strength of the modified loess increased by nearly 50%. These studies collectively indicate that appropriate rubber particles can significantly enhance the mechanical properties of soil. The se conclusions provide valuable guidance for the treatment and utilization of rubber in various applications.
Regarding structural shock absorption, researchers have conducted various forms of research and foundation, and have successfully demonstrated that enhancing the energy absorption capacity of foundations can effectively mitigate structural vibrations. For instance, Zhou et al. [8] based on dynamic numerical analysis of nonlinear time history analysis of different types of local damping effect of shock absorption layer. Select six actual ground motions with different main frequencies and set their peak ground acceleration (PGA) to 0.2 g, 0.4 g, 0.6 g, and 0.8 g respectively. The damage index of secondary lining, total dissipated energy and equivalent plastic strain of surrounding rock are used as indexes to reflect the damping performance of local damping layer. The numerical results show that the damping performance of the double local damping layer is the best, and the damping performance of the damping layer under large earthquake is better than that of the small earthquake damping layer. Bandyopadhyay et al. [9] performed a comparative analysis between pure sand cushion and rubber sand cushion using a small-scale shaking table test. The results demonstrated that the pure sand mat was only able to isolate strong vibration inputs exceeding 0.65 g. In contrast, the rubber sand mat with 50% rubber content proved to be a cost-effective and efficient foundation isolator. Hazarika H. et al. [10] conducted structural shaking table isolation tests on rubber particles and sand isolation pads in submerged conditions. The analysis and conclusions highlighted that these isolation pads effectively reduced acceleration during earthquake events and played a significant role in shock absorption. Alhan and Gavin [11] employed frequency domain analysis and seismic time history analysis to investigate the influence of isolation damping on higher-mode effect and the interlayer displacement ratio. Due to the significance of higher-mode effect and bidirectional ground motion in the dynamic performance of these structural systems, a straightforward comparison of the isolation damping mechanism using a single degree or two degrees of freedom was not feasible. To integrate these critical aspects into the investigation of the dynamic behavior of these structures, a series of tests was conducted on eight-story prototype building models. The results demonstrated that the isolator displacement decreased with an increase in the damping. Conversely, suitable levels of isolation stiffness and damping can effectively restrict basement drift without causing a notable impact on floor acceleration and the interlayer drift ratio. D’Amato et al. [12] demonstrated isolation technology on Italian heritage sites, particularly focusing on reinforced concrete frame constructions with historical significance. A three-dimensional finite element model was employed to simulate the seismic responses of both the existing building and an enhanced isolation system, comprising an elastomer and a sliding isolator. Additionally, this paper introduces a novel method for estimating structural seismic resistance and its application.
The research method, involving structural vibration tests, has proven effective. However, it is important to note that this approach is time-consuming and expensive and offers limited working conditions for analysis. Moreover, analytical methods encounter challenges in accurately analyzing complex structural responses. Hence, numerical simulation offers convenience and efficiency for the effective analysis of the structural vibration response under complex working conditions [13,14,15]. Various numerical methods, including the boundary element method, finite difference method, and finite element method, have been employed to investigate the dynamic interaction between the soil and structure at a specific site. For instance, Cui et al. [16] studied the influence of the thickness of the damping layer on the damping effect. Taking a shallow double-arch rectangular tunnel project in a city as an example, the numerical simulation software ABAQUS 2022 was used to compare the damping effect of 50 kinds of damping layers with thickness of 50, 100 and 150 mm respectively. When the shock absorbing layer with a thickness of 4mm is applied, the convergence of the side wall decreases by 65.14%, the maximum and minimum principal stresses decrease significantly, among which the maximum and minimum principal stresses decrease by 03.6%, the maximum shear stresses decrease by 17.42%, and the minimum safety factor increases by at least 72.100%. The shock absorbing layer of 50 mm thickness is better than the shock absorbing layer of 150 mm and 100mm thickness. Li et al. [17] proposed a numerical stability analysis method based on the subsystem of a three-dimensional viscoelastic artificial boundary element explicit algorithm. This method identified the subsystem that governs the stability of the overall value system of artificial boundaries. It combined the three-dimensional viscoelastic artificial boundary element explicit integral algorithm with an analytical solution for stability conditions. Building on this foundation, the method can effectively address issues related to determining the maximum time increment for the viscoelastic artificial boundary element. Brunet et al. [18] utilized a concentrated mass model to simulate the subsoil structure system located 1–5 m behind the rubber sand cushion for nonlinear analysis. The results demonstrated that the isolation effect was more pronounced with peak values of seismic input. The recommended cushion thickness was 2–3 m and the optimal rubber sand content was found to be 35%. Quan et al. [19] established a three-dimensional numerical model of a subway station with multiple sensing seams. The research explored the seismic response of various induced joints in different positions and forms using different ground motion records by altering the frequency spectrum characteristics and acceleration peak values. Zheng et al. [20] selected a two-story brick and concrete unstructured column building in a typical village as a prototype, and designed a vibration table comparison test with a 1:2 ratio between the isolated and non-isolated layers. Firstly, the response spectrum analysis method was utilized to select three ground motion records of both isolated and non-isolated structures. Subsequently, various input scenarios were investigated using numerical analysis to record the vibration of the structure and understand the seismic response of the structure. Based on the results obtained from the numerical simulations, the sensor layout and loading scheme for the structural shaking table test were designed. Cao et al. [21] conducted simulated seismic shaking table tests on four structural models of rural buildings. Among these models, one was a sliding foundation masonry building, and another was a seismic-resistant building. The structural models tested included a special-shaped insulation block masonry house with a structural column and an ordinary insulation block masonry house. The findings indicate that the sliding foundation isolation structure is characterized by its simplicity, cost-effectiveness, and reliable performance.
The above research shows that rubber-particle-modified soil offers various advantages, including a high elastic modulus, a significant damping ratio, and good resilience. Utilizing rubber-particle-modified soil as a building foundation can enhance the energy absorption capabilities without compromising its strength of foundation. Furthermore, the cost and construction complexity associated with rubber-particle-modified loess are lower compared to traditional isolation technologies. Therefore, in this study, the modified loess containing rubber particles laid on the bottom of the foundation of the frame structure is regarded as a seismic isolation layer used to explore the influence of its energy absorption on the vibration response of the frame structure. In this paper, a numerical simulation method is employed to comprehensively study the mechanical properties of the enhanced loess, the influence of the thickness of the improved foundation, and various types of ground motion records.

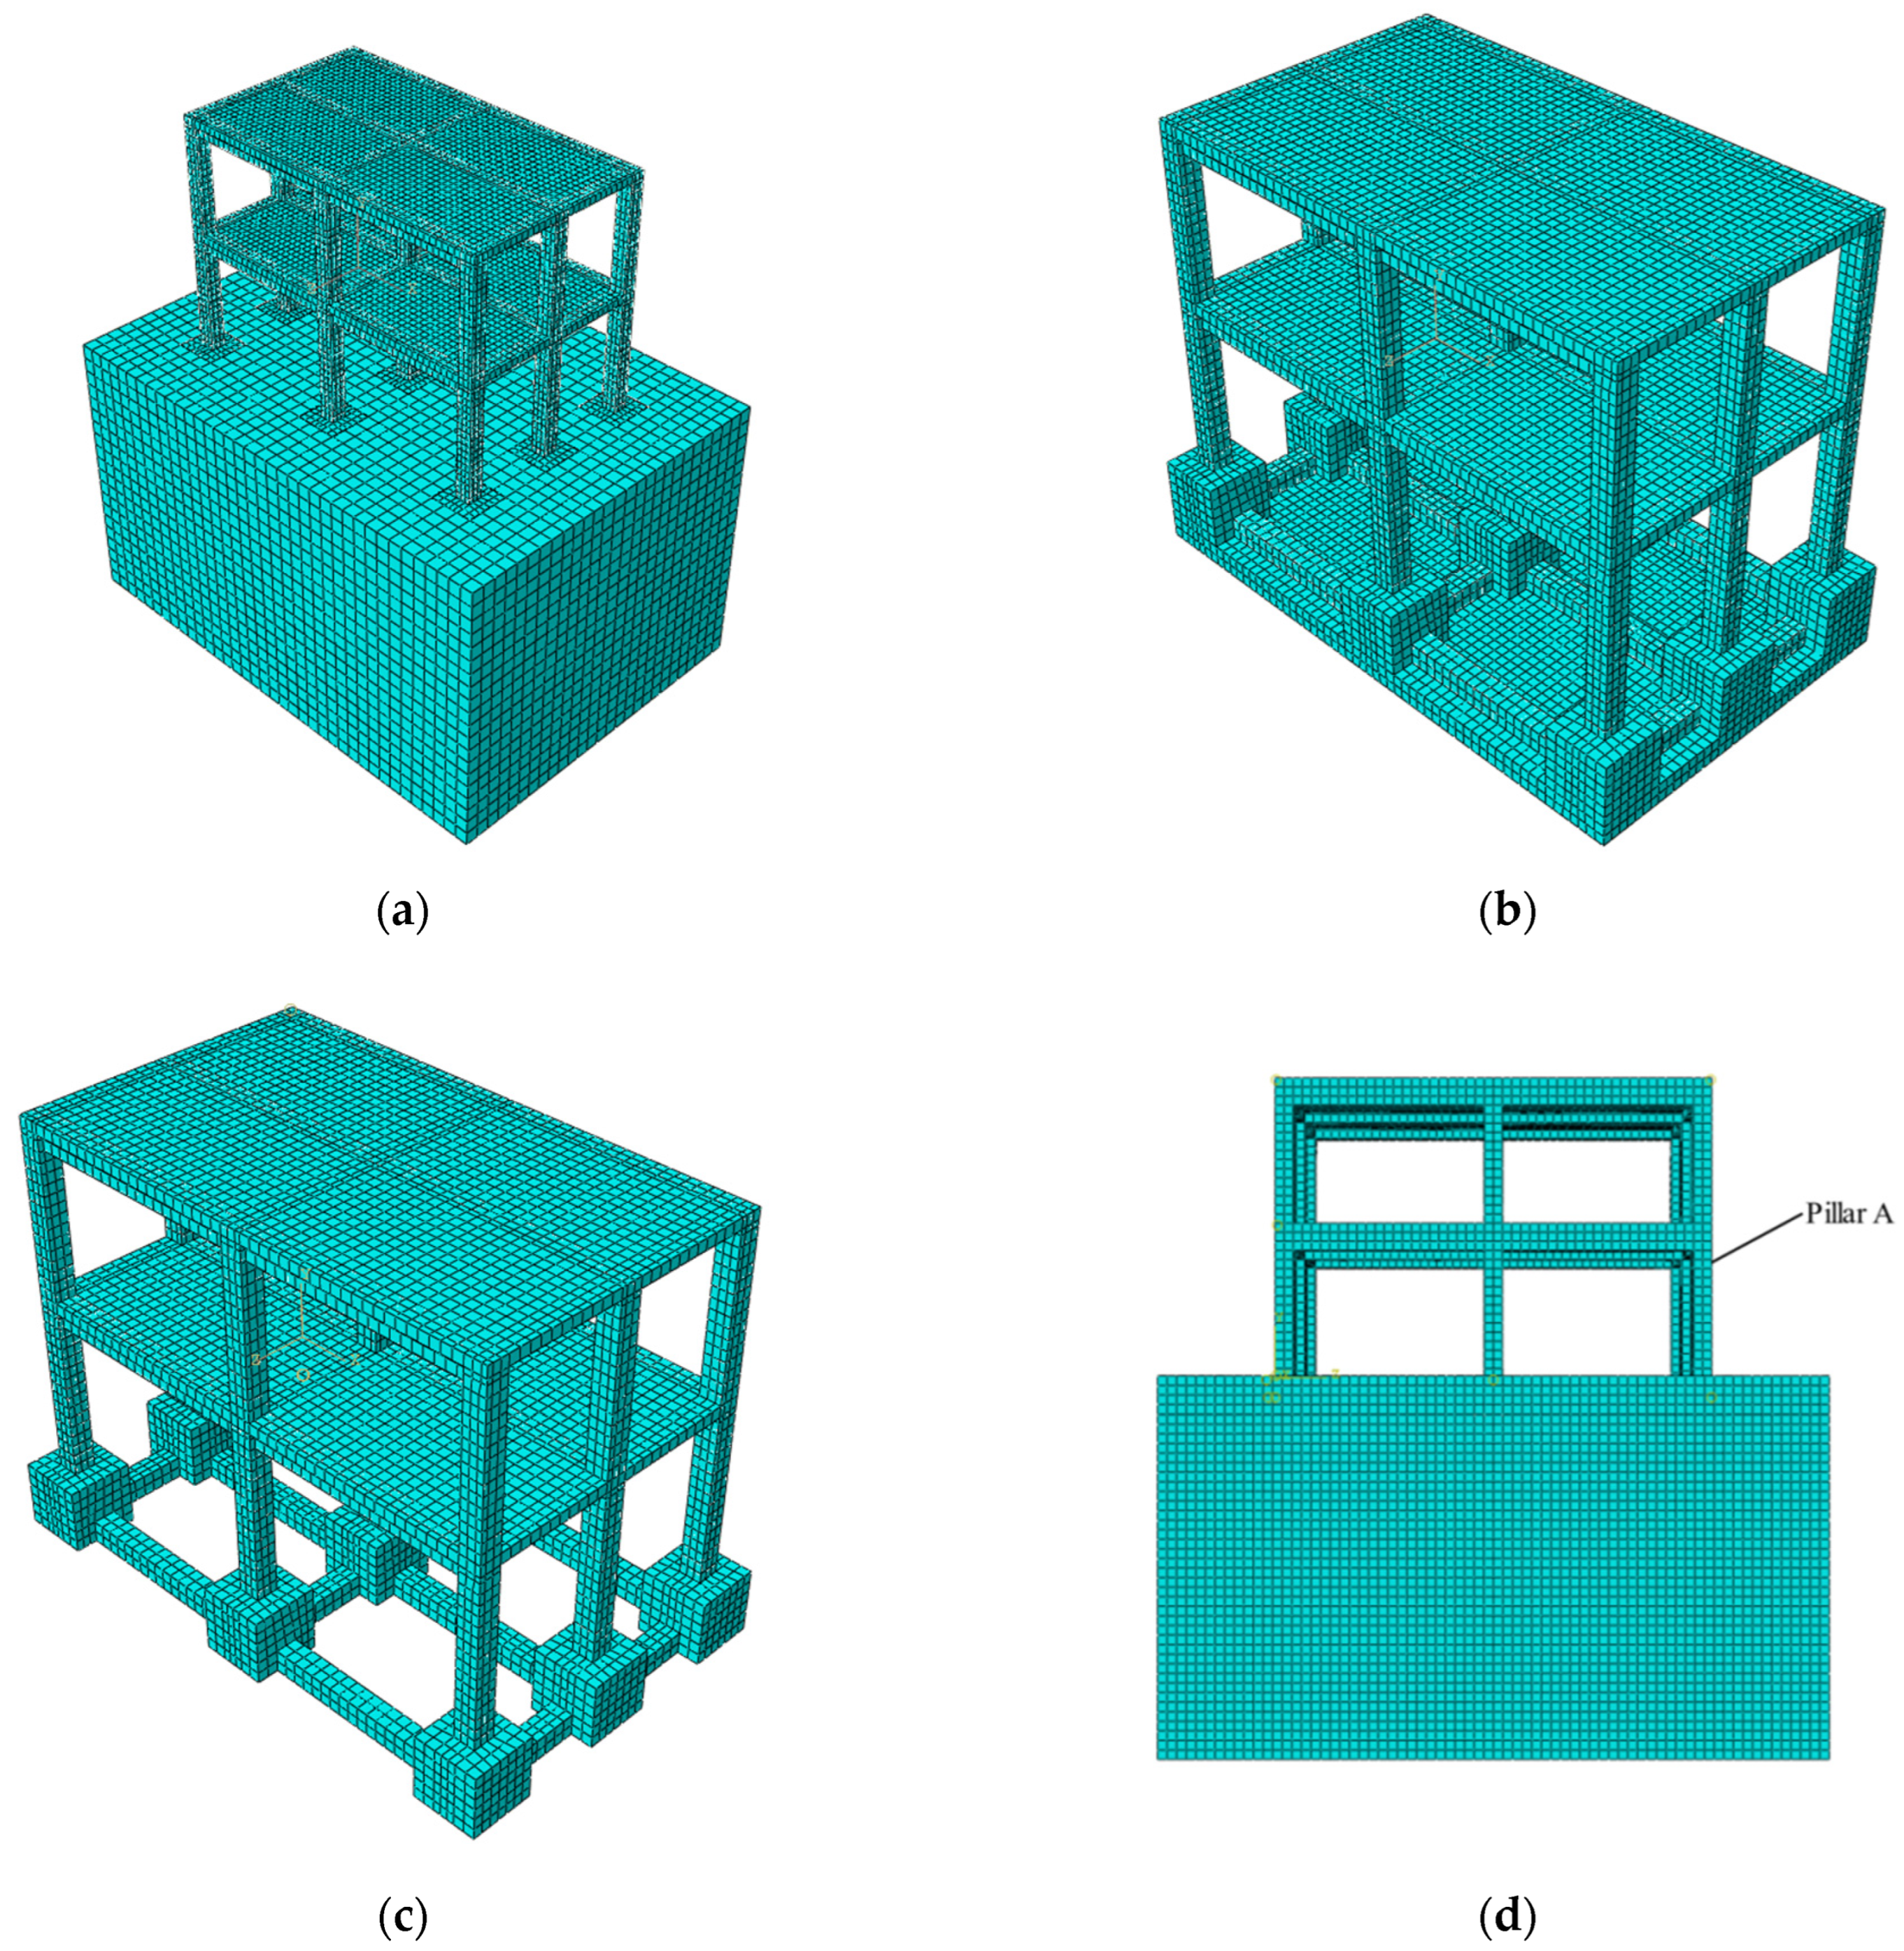
2. ABAQUS Finite Element Calculation Model

Model Construction

The model in this paper is a two-layer frame structure designed following the specifications outlined in the General Code for Concrete Structures [22]. For the columns in this model, the section size is 300 mm × 300 mm, the reinforcement comprises 6Φ12 bars, and the spacing of the stirrups is Φ8@200 mm. The beam section size in this model is 300 mm × 600 mm, the reinforcement comprises 6Φ12 bars, and the spacing of the stirrups is Φ8@200 mm. The concrete grade for both the column and beam is C40, while the steel bar grade is Q345, and the stirrup grade is HRB400. The fundamental period of the structure is set within the range of 0.016–0.2 s. The finite element model in this paper comprises four main components: the two-layer frame structure, the rubber-modified soil damping layer, and the foundation soil. The foundation forms are categorized into raft foundation and strip foundation, with a layer of rubber-modified soil placed at the base of the foundation. The analysis models for both the non-isolated and isolated structures were constructed in the finite element analysis software ABAQUS 2022. The upper structure of this structural model comprises a two-story frame structure with dimensions of 9.6 m in length, 5.6 m in width, and 3 m in height. This structural model is derived from a real engineering case, which provides the basis for the analysis and simulations conducted in this study. Given that a significant portion of rural houses in China employs this straightforward frame structure, it has been chosen as the focus of this study. By doing so, the research outcomes can be effectively utilized and applied in the subsequent promotion and application research for this common two-story structure. The dimensions of the soil area are specified as 14 m in length, 10 m in width, and 8 m in depth. Equivalent linearization treatment is implemented for the analysis. In the finite element model, an elastic–plastic constitutive model (CDP model) is used to simulate the dynamic damage evolution process of structural granular concrete. The reinforcement employs a double broken line constitutive model to simulate mechanical deformation characteristics, while the soil is modeled using a linear elastic model. The contact between the rubber-particle-modified soil isolation layer, the foundation, and the underlying soil is defined as surface-to-surface contact. Artificial viscoelastic boundaries are utilized as the boundary conditions. Reinforcements are embedded within the frame structure. The model structure employs full integral element C3D8, the model foundation utilizes a simplified integral element C3D8R, and the reinforcement is represented using a three-dimensional truss element T3D2.
In this paper, a constructed finite element model is utilized to simulate the seismic response of the two-layer frame structure, considering varying foundation forms and different thicknesses of the rubber-modified soil damping layer. Firstly, in order to investigate the influence of the base contact area on the seismic isolation effect of the structure, two foundation forms are employed in establishing the finite element model: the raft foundation and strip foundation. In order to facilitate the investigation of how the rubber-modified soil damping layer affects the displacement of the frame structure, and considering the symmetry of frame structure, one side of the column is chosen for observation. The model is illustrated in Figure 1, and the material parameters of each material are provided in Table 1.
The viscoelastic boundary condition [23] takes into account the radiation damping of the foundation and effectively simulates the absorption and dispersion of ground motion records by the modified soil layer in the semi-infinite body of the original soil layer. This contributes to more reasonable seismic results for the structure. Hence, to ensure precision and reliability in the Abaqus finite element simulation software, the viscoelastic artificial boundary [24] is adopted as the soil boundary.

3. Ground Motion Record Selection and Input

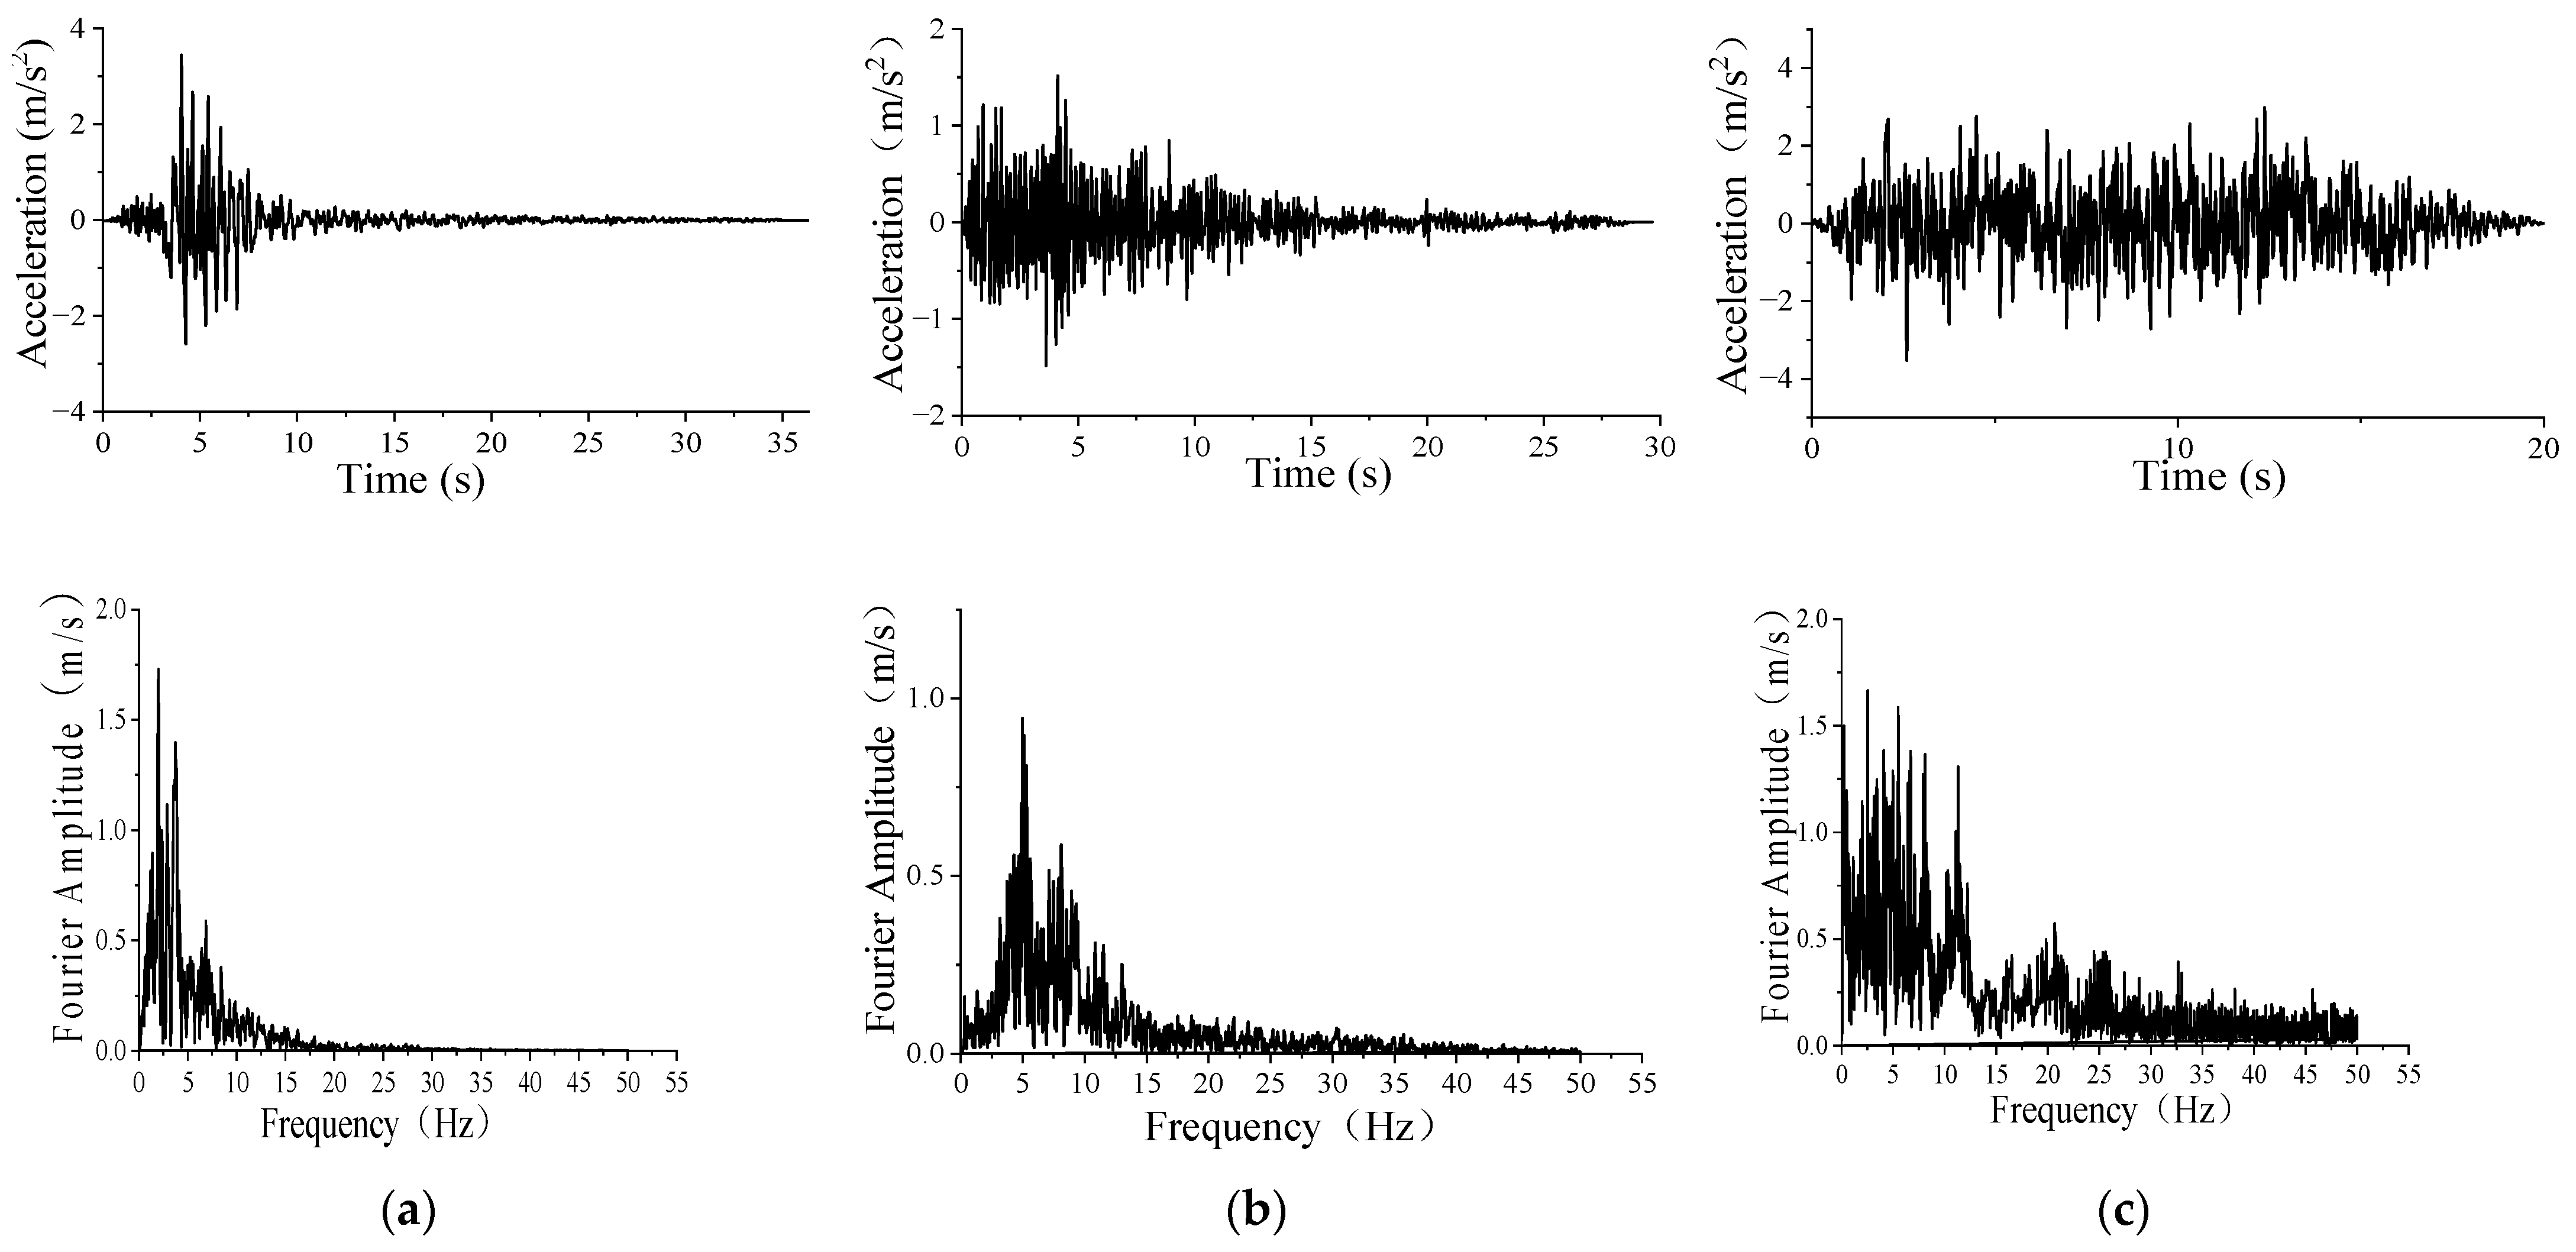
3.1. Ground Motion Record Selection

When using the time history analysis method, the acceleration–time history curve from actual strong earthquake records and artificial simulations should be carefully chosen based on the building site type and the designated earthquake design group [25]. In this paper, according to the “General Code for Seismic Design of Buildings and Municipal Engineering”, the ground motion records include natural and artificial seismic ground motion records, with natural ground motion records accounting for no less than 2/3. Given that this study is fundamental research and not engineering design, three seismic motions with different spectral compositions were selected as input motions to explore the influence of various types of seismic ground motion records on the seismic response of the model. This included two real ground motion records and one artificial ground motion record. All three ground motion records were not scaled. The two historic earthquakes included were as follows: the Friuli (Italy) earthquake of 6 May, 1976 (Mag: 6.5; Rjb: 14.97 km; Rrup: 15.82 km; Duration: 36.32 s) and the San Fernando earthquake at Santa Anita Dam, 1971, (Mag: 6.61; Rjb: 30.7 km; Rrup: 30.7 km). In order to investigate the influence of various types of ground motion on the seismic response of the model, three ground motions characterized by distinct spectra were chosen as the input ground motions. One example conformed with the standard inclusion of artificial ground motion records as part of the response spectrum. To investigate a ground motion record with the same peak acceleration, the peak acceleration of the original ground motion record was adjusted to 0.2 g and the modified input numerical model was utilized for calculation. The time history curve and Fourier spectrum of the ground motion record acceleration are presented in Figure 2.

3.2. Ground Motion Record Input

As the finite element model in this paper incorporates a viscoelastic artificial boundary, an equivalent load input method is employed for introducing ground motion. This ground motion record is in the form of a vertically propagated shear wave. The seismic input mode is the equivalent nodal force input mode. The velocity–time history and displacement–time history are determined by integrating and doubly integrating the acceleration–time history, respectively.

3.3. Calculation Scheme

To investigate the influence of the contact area between the rubber-modified soil damping layer and various foundation forms, as well as the thickness of the isolation layer, on the damping effect of the frame structure, two foundation forms—the raft foundation and strip foundation—are individually defined. The isolation layer’s thickness is set at 0 m, 0.4 m, 0.6 m, and 0.8 m. Additionally, three types of ground motion record acceleration time history curves are utilized. The seismic performance simulation was conducted for a total of 24 project scenarios, as outlined in Table 2.
The analysis explores the influence of the base contact area, rubber-particle-modified soil isolation layer, ground motion spectrum, and ground motion intensity on the structure’s isolation effect under various working conditions.

4. Calculation Results and Analysis

4.1. Influence of Base Contact Area on Isolation Effect

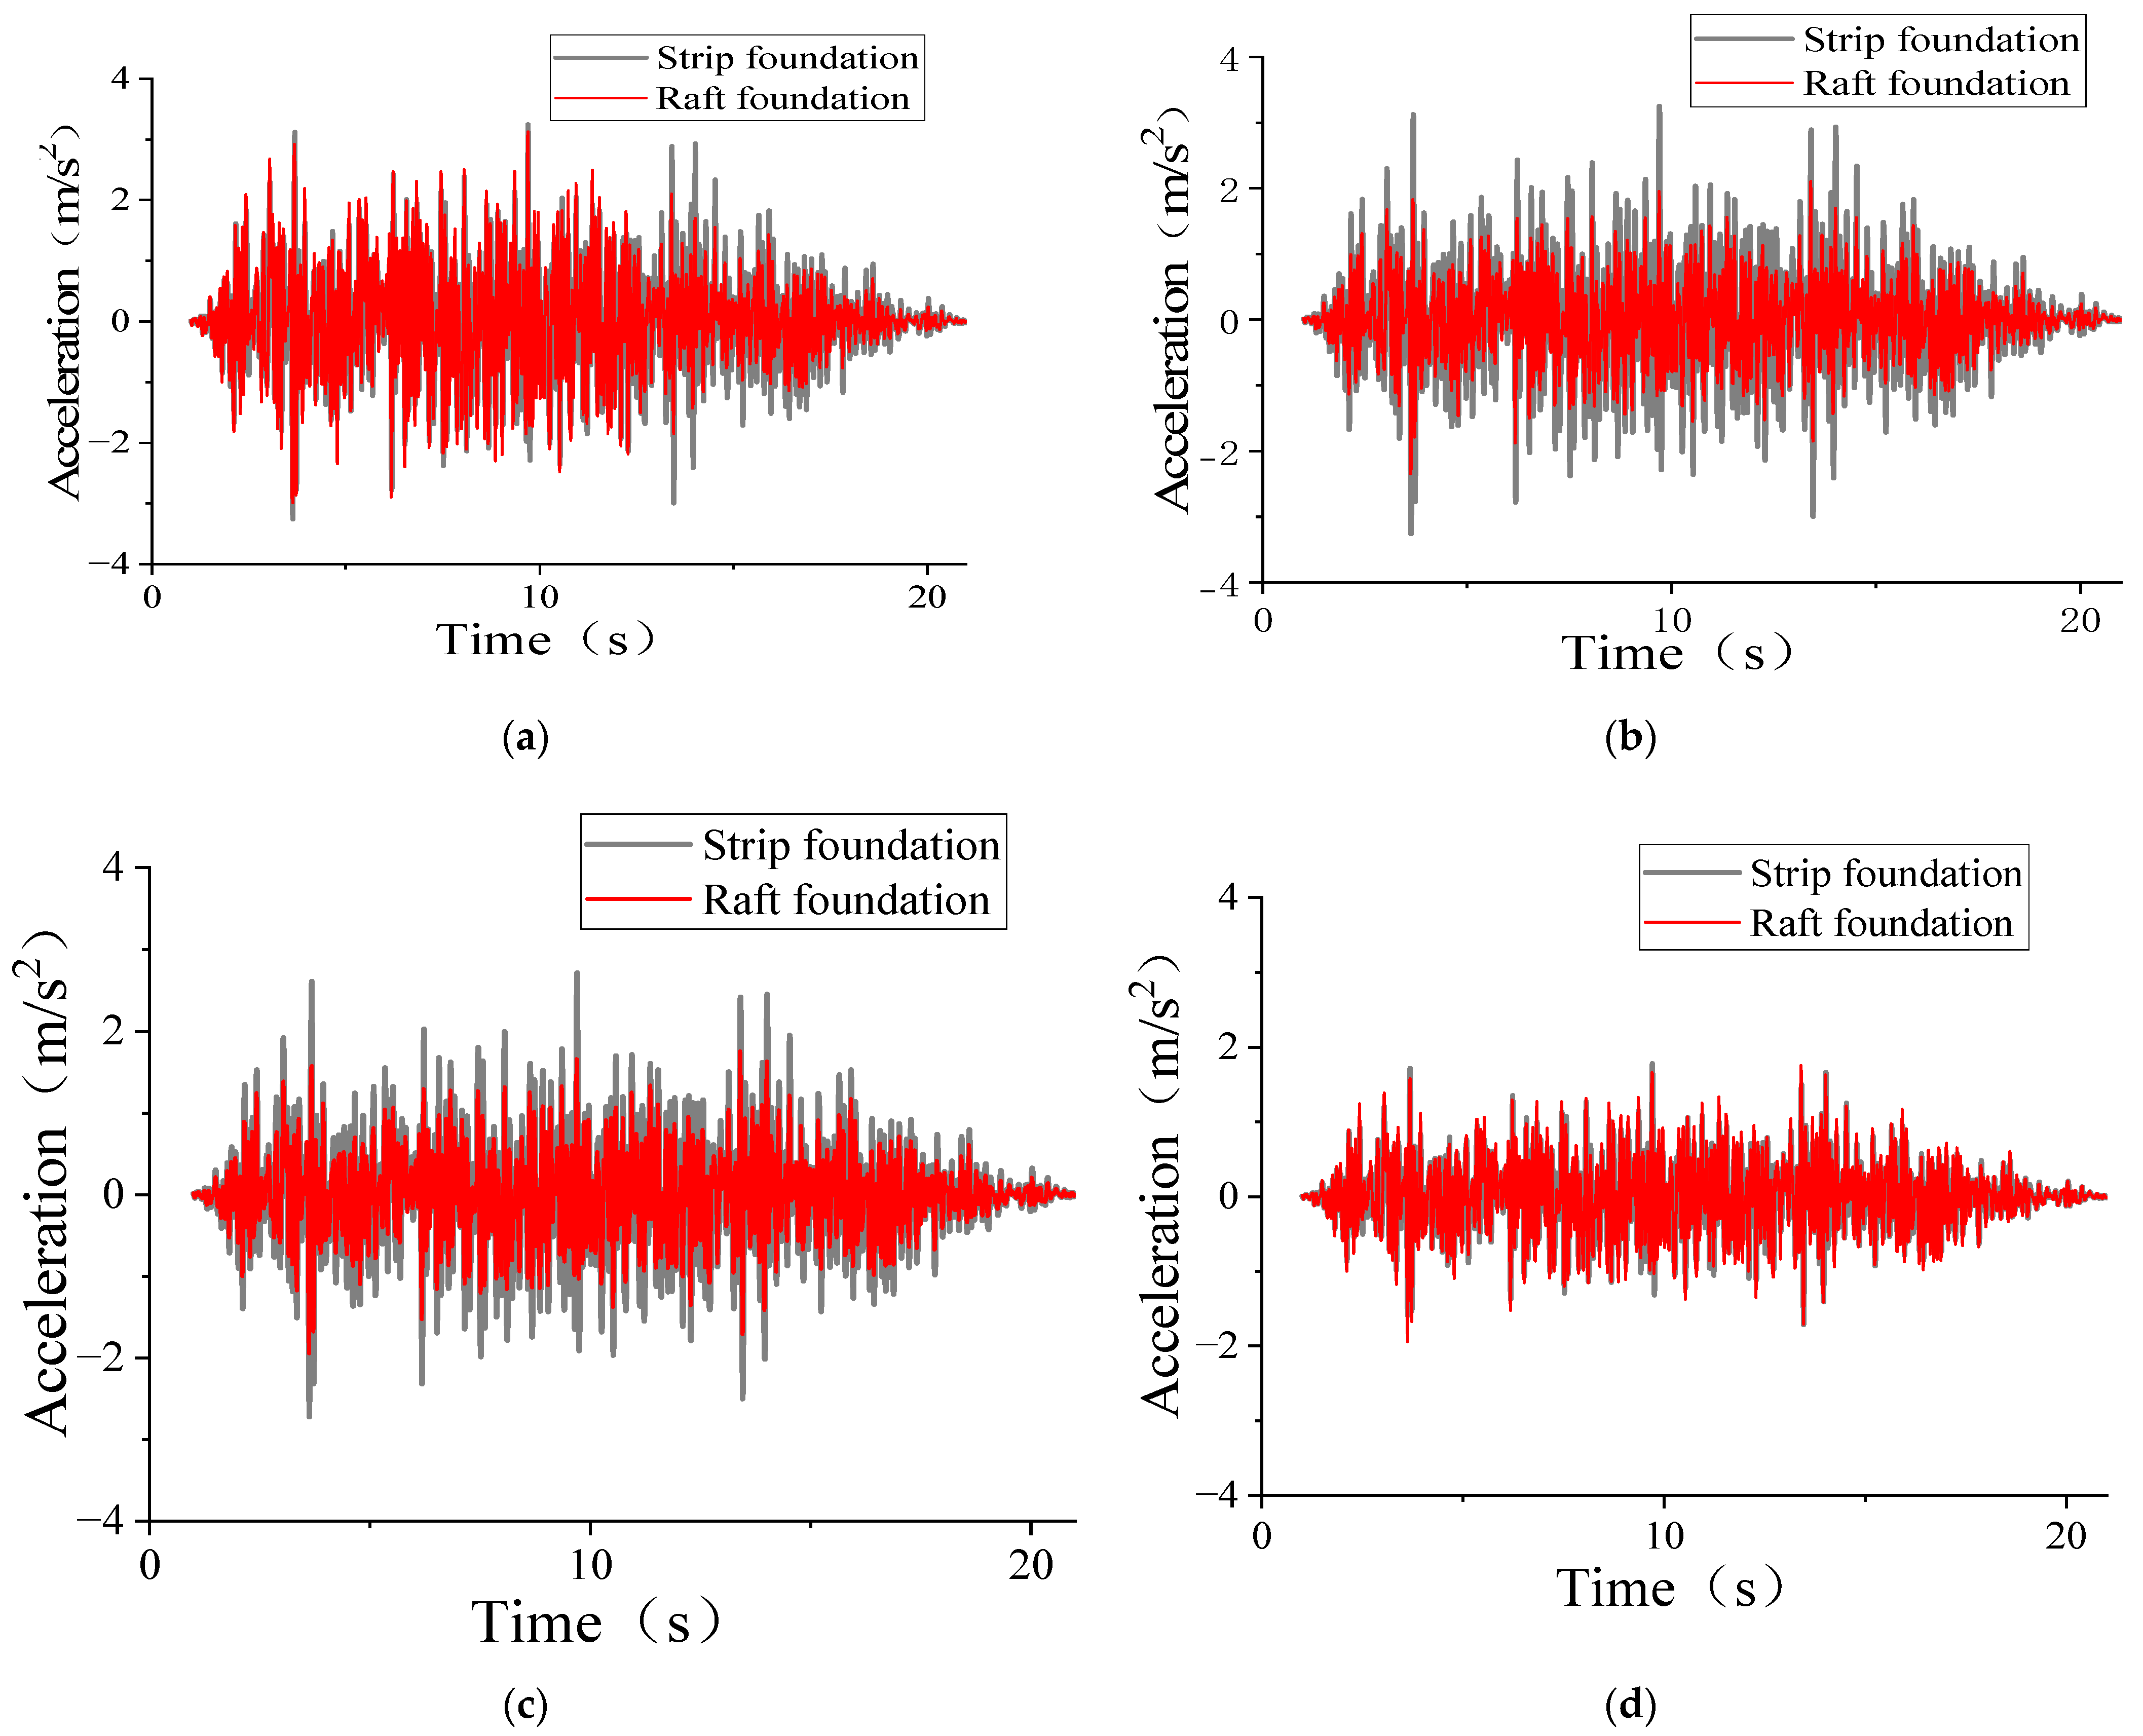
4.1.1. Acceleration Response Analysis of the Top Layer of the Structure

In this section, the finite element model is utilized to simulate the seismic response of a two-story frame structure considering varying foundation forms and different thicknesses of the rubber-modified soil damping layer. Firstly, the influence of the base contact area on the seismic isolation effect of the structure is explored. Two foundation forms, namely the raft foundation and strip foundation, are employed to establish the finite element model. An artificial ground motion record with a peak acceleration of 0.2 g is chosen as the dynamic load for the finite element model. The artificial ground motion record is a shear ground motion record propagating vertically upward. The time history curves of the vertex acceleration of the structure are illustrated in Figure 3.
The following two points can be derived from the qualitative analysis presented in Figure 3:
(1)
Common points: the shape, duration, and time of the peak acceleration curve of vertex acceleration for the two foundation forms are similar. This indicates that different foundation forms have no influence on the shape, duration, and peak time of the acceleration curve of the frame structure when the ground motion record used as input is the same.
(2)
Different points: there are notable differences in the peak value of the peak acceleration–time history curve of the structure under the varying foundation form working conditions. The peak value of the acceleration–time history curve for the structure with the raft foundation is lower compared to that with the strip foundation, implying that the structure with the raft foundation exhibits a more effective seismic mitigation effect. The findings demonstrate that increasing the contact area between the base and the rubber-particle-modified soil isolation layer enhances the damping performance of the frame structure.
Further quantitative analysis is carried out based on the data provided in Table 3:
As indicated in Table 3, with an increase in the thickness of the rubber-particle-modified soil isolation layer, the peak acceleration of the structure with the raft foundation gradually decreases compared to that with the strip foundation. Specifically, when the thickness of the rubber-particle-modified loess isolation layer is 0 m, 0.4 m, 0.6 m, and 0.8 m, the reduction in the peak acceleration for the raft foundation is 0.6%, 6.2%, 8.6%, and 10.1%, respectively, compared to that of the strip foundation. Hence, as the thickness of rubber-particle-modified soil isolation layer increases, the isolation effect on the frame structure is more pronounced when utilizing a raft foundation.

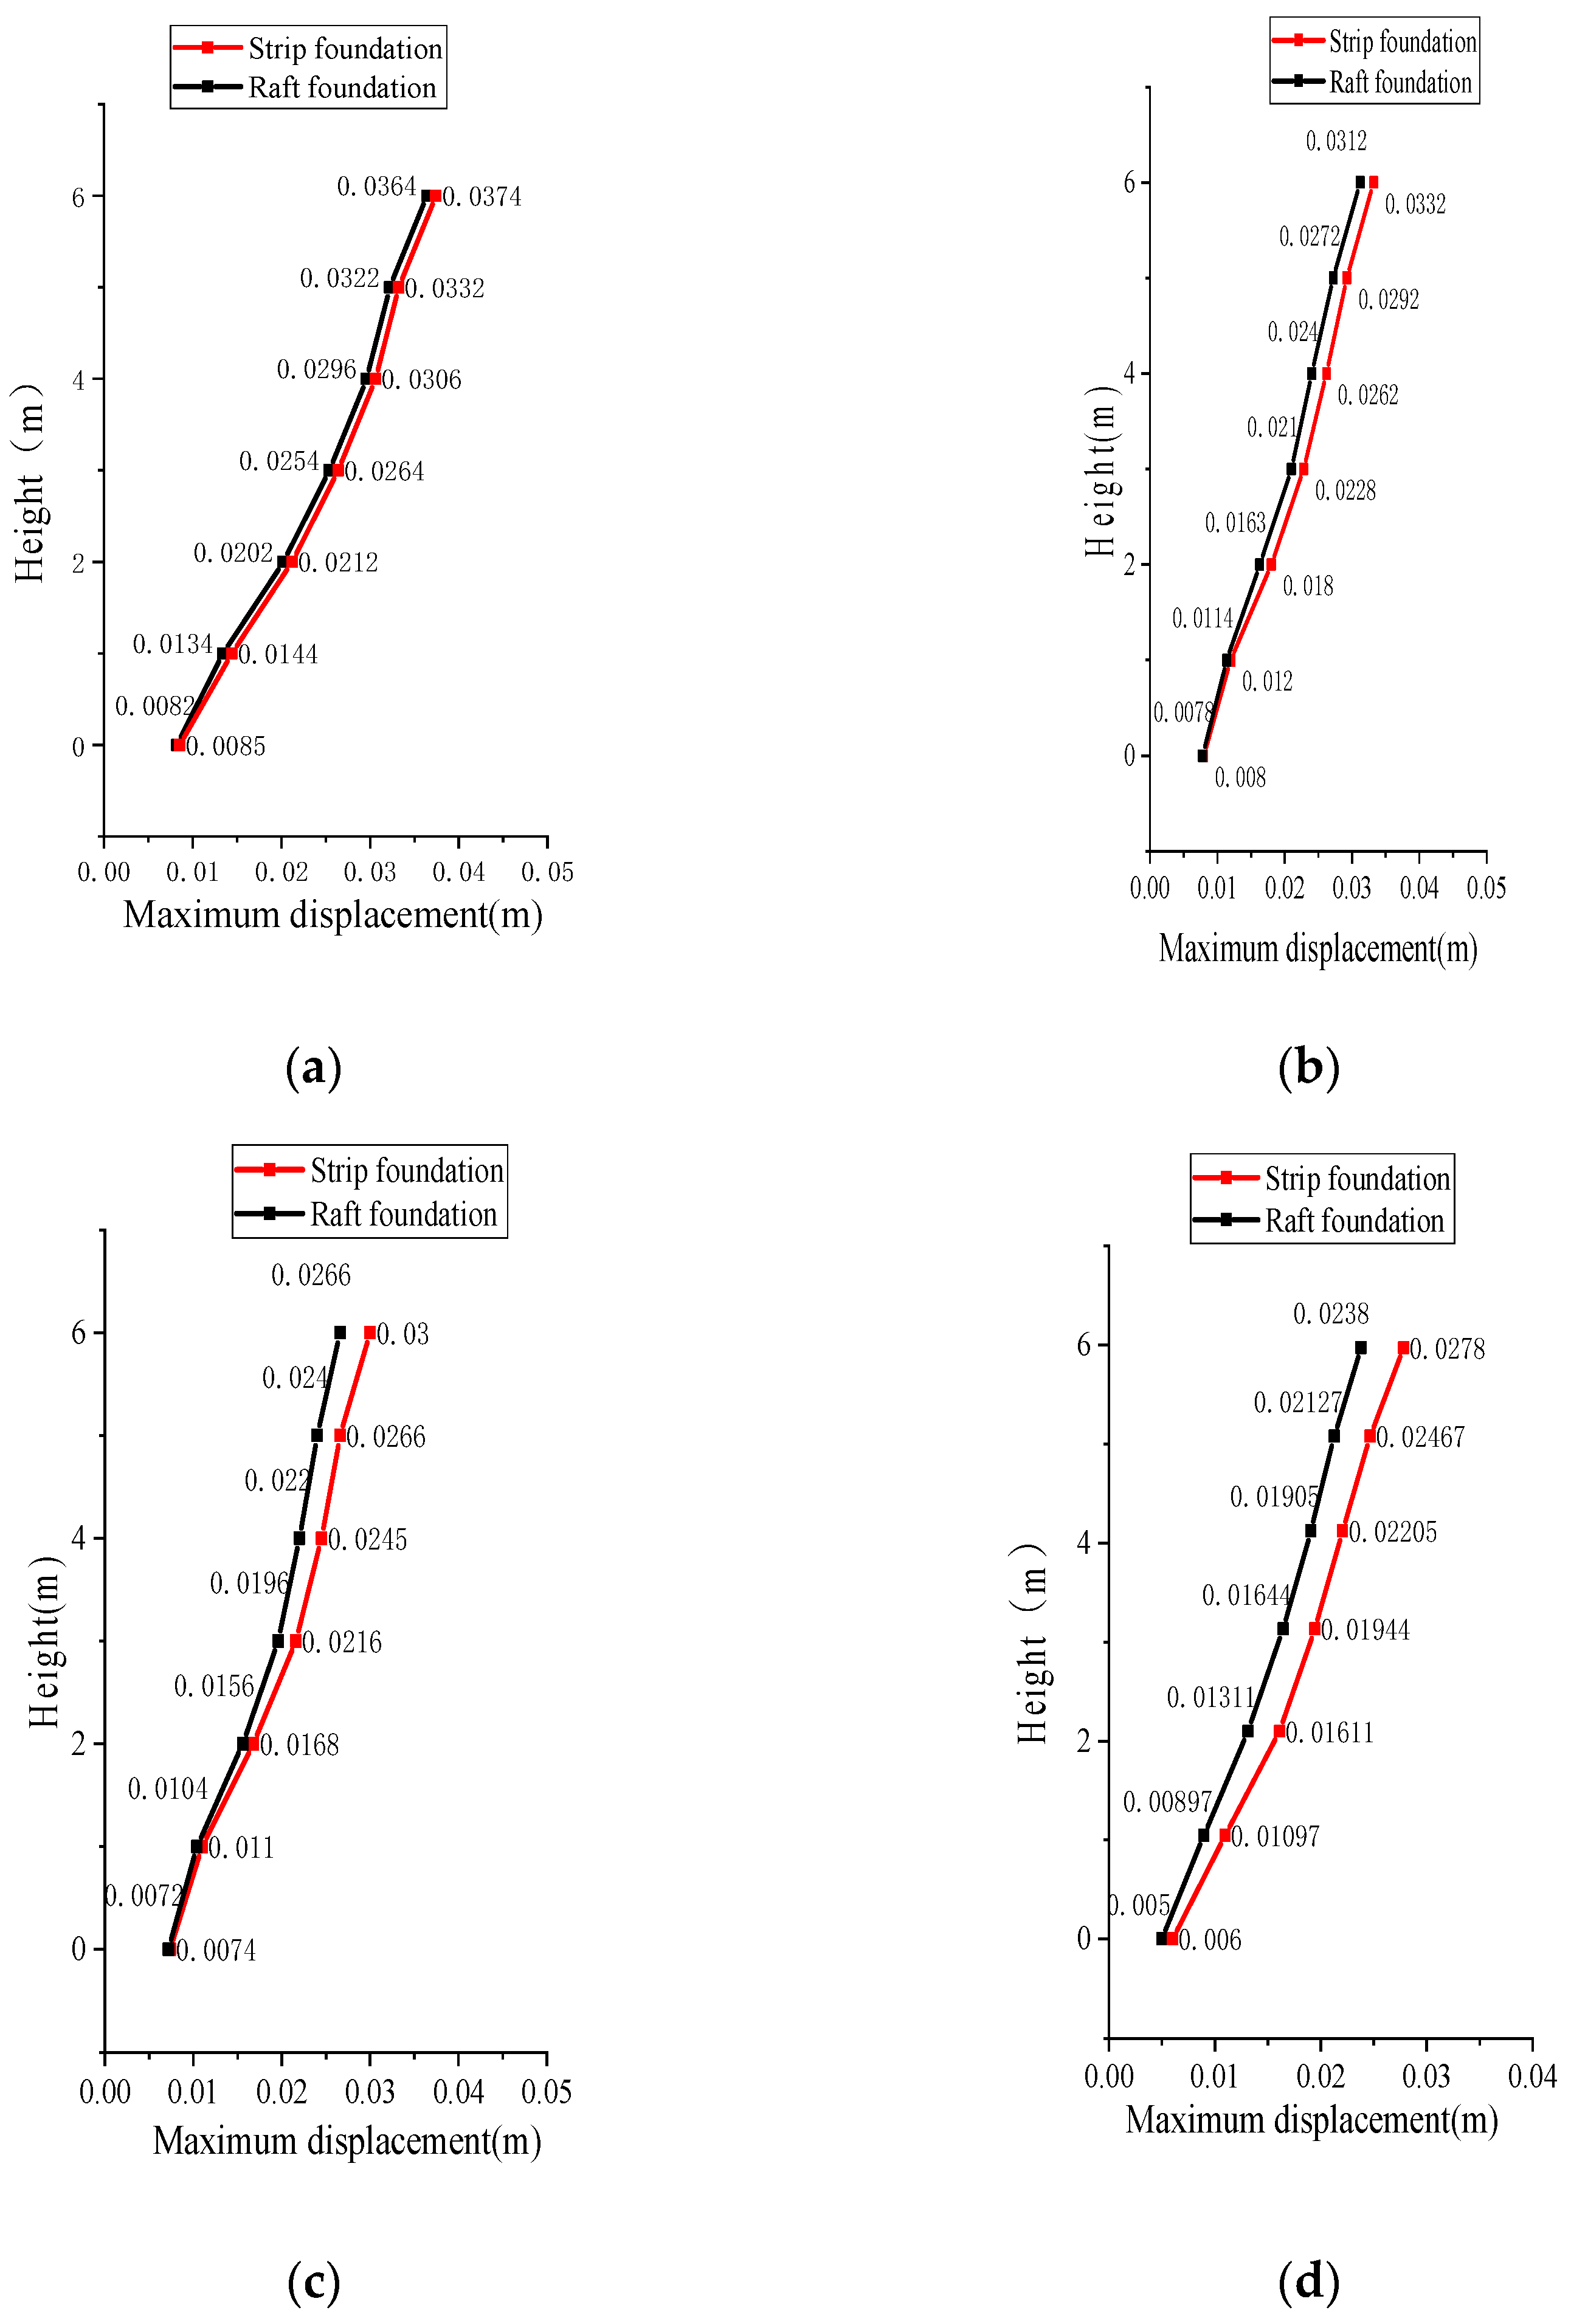
4.1.2. Comparison of the Column Height–Maximum Displacement Curve

In order to facilitate the investigation of the influence of the rubber-modified soil damping layer on the displacement of the frame structure, an observation point is designated every meter along the previously mentioned observation column. The maximum displacement of each observation point is then extracted to construct the column height–maximum displacement curve. The peak curves of column height–absolute displacement under different foundation forms are presented in Figure 4.
The following two points can be obtained from the qualitative analysis in Figure 4a–d:
(1)
Common point: the change trend of the column height–maximum displacement curve is consistent under both foundation forms, where displacement increases with a rise in column height. Additionally, the maximum displacement of the observation column decreases with an increase in the thickness of the rubber-particle-modified soil isolation layer for both foundation forms. This indicates that increasing the thickness of the rubber-particle-modified soil isolation layer is effective in reducing the maximum displacement of the frame structure.
(2)
Different points: there is a noticeable gap between the curves of column height and maximum displacement for the two foundation forms with the same thickness of the rubber-particle-improved soil layer. The maximum displacement of the frame structure with the raft foundation at the same height is smaller than that of the frame structure with the strip foundation. This observation suggests that augmenting the contact area between the base and the rubber-particle-improved soil isolation layer effectively diminishes the maximum displacement of the frame structure. Furthermore, as the thickness of the rubber-particle-modified soil isolation layer increases, the gap between the column height–maximum displacement curves for the two foundation forms widens. This highlights that the influence of the contact area between the different foundations and the rubber-particle-modified soil isolation layer on the height–maximum displacement of the frame structure columns becomes more pronounced.
Further quantitative analysis is conducted based on the data presented in Table 4:
Under the condition of an identically thick rubber-particle-modified soil isolation layer, the maximum displacement of the frame structure with the raft foundation is smaller compared to that with the strip foundation. When the thickness of the rubber-particle-modified soil isolation layer is 0 m, 0.4 m, 0.6 m, and 0.8 m, the maximum displacement difference between the two foundation forms is 0.0012 m, 0.0022 m, 0.0024 m, and 0.0026 m, respectively. As the thickness of the rubber-particle-modified soil isolation layer increases, the maximum displacement difference between the two foundation forms also increases. This indicates that increasing the thickness of the rubber-particle-modified soil isolation layer can amplify the influence of the base contact area on the isolation effect of the frame structure.

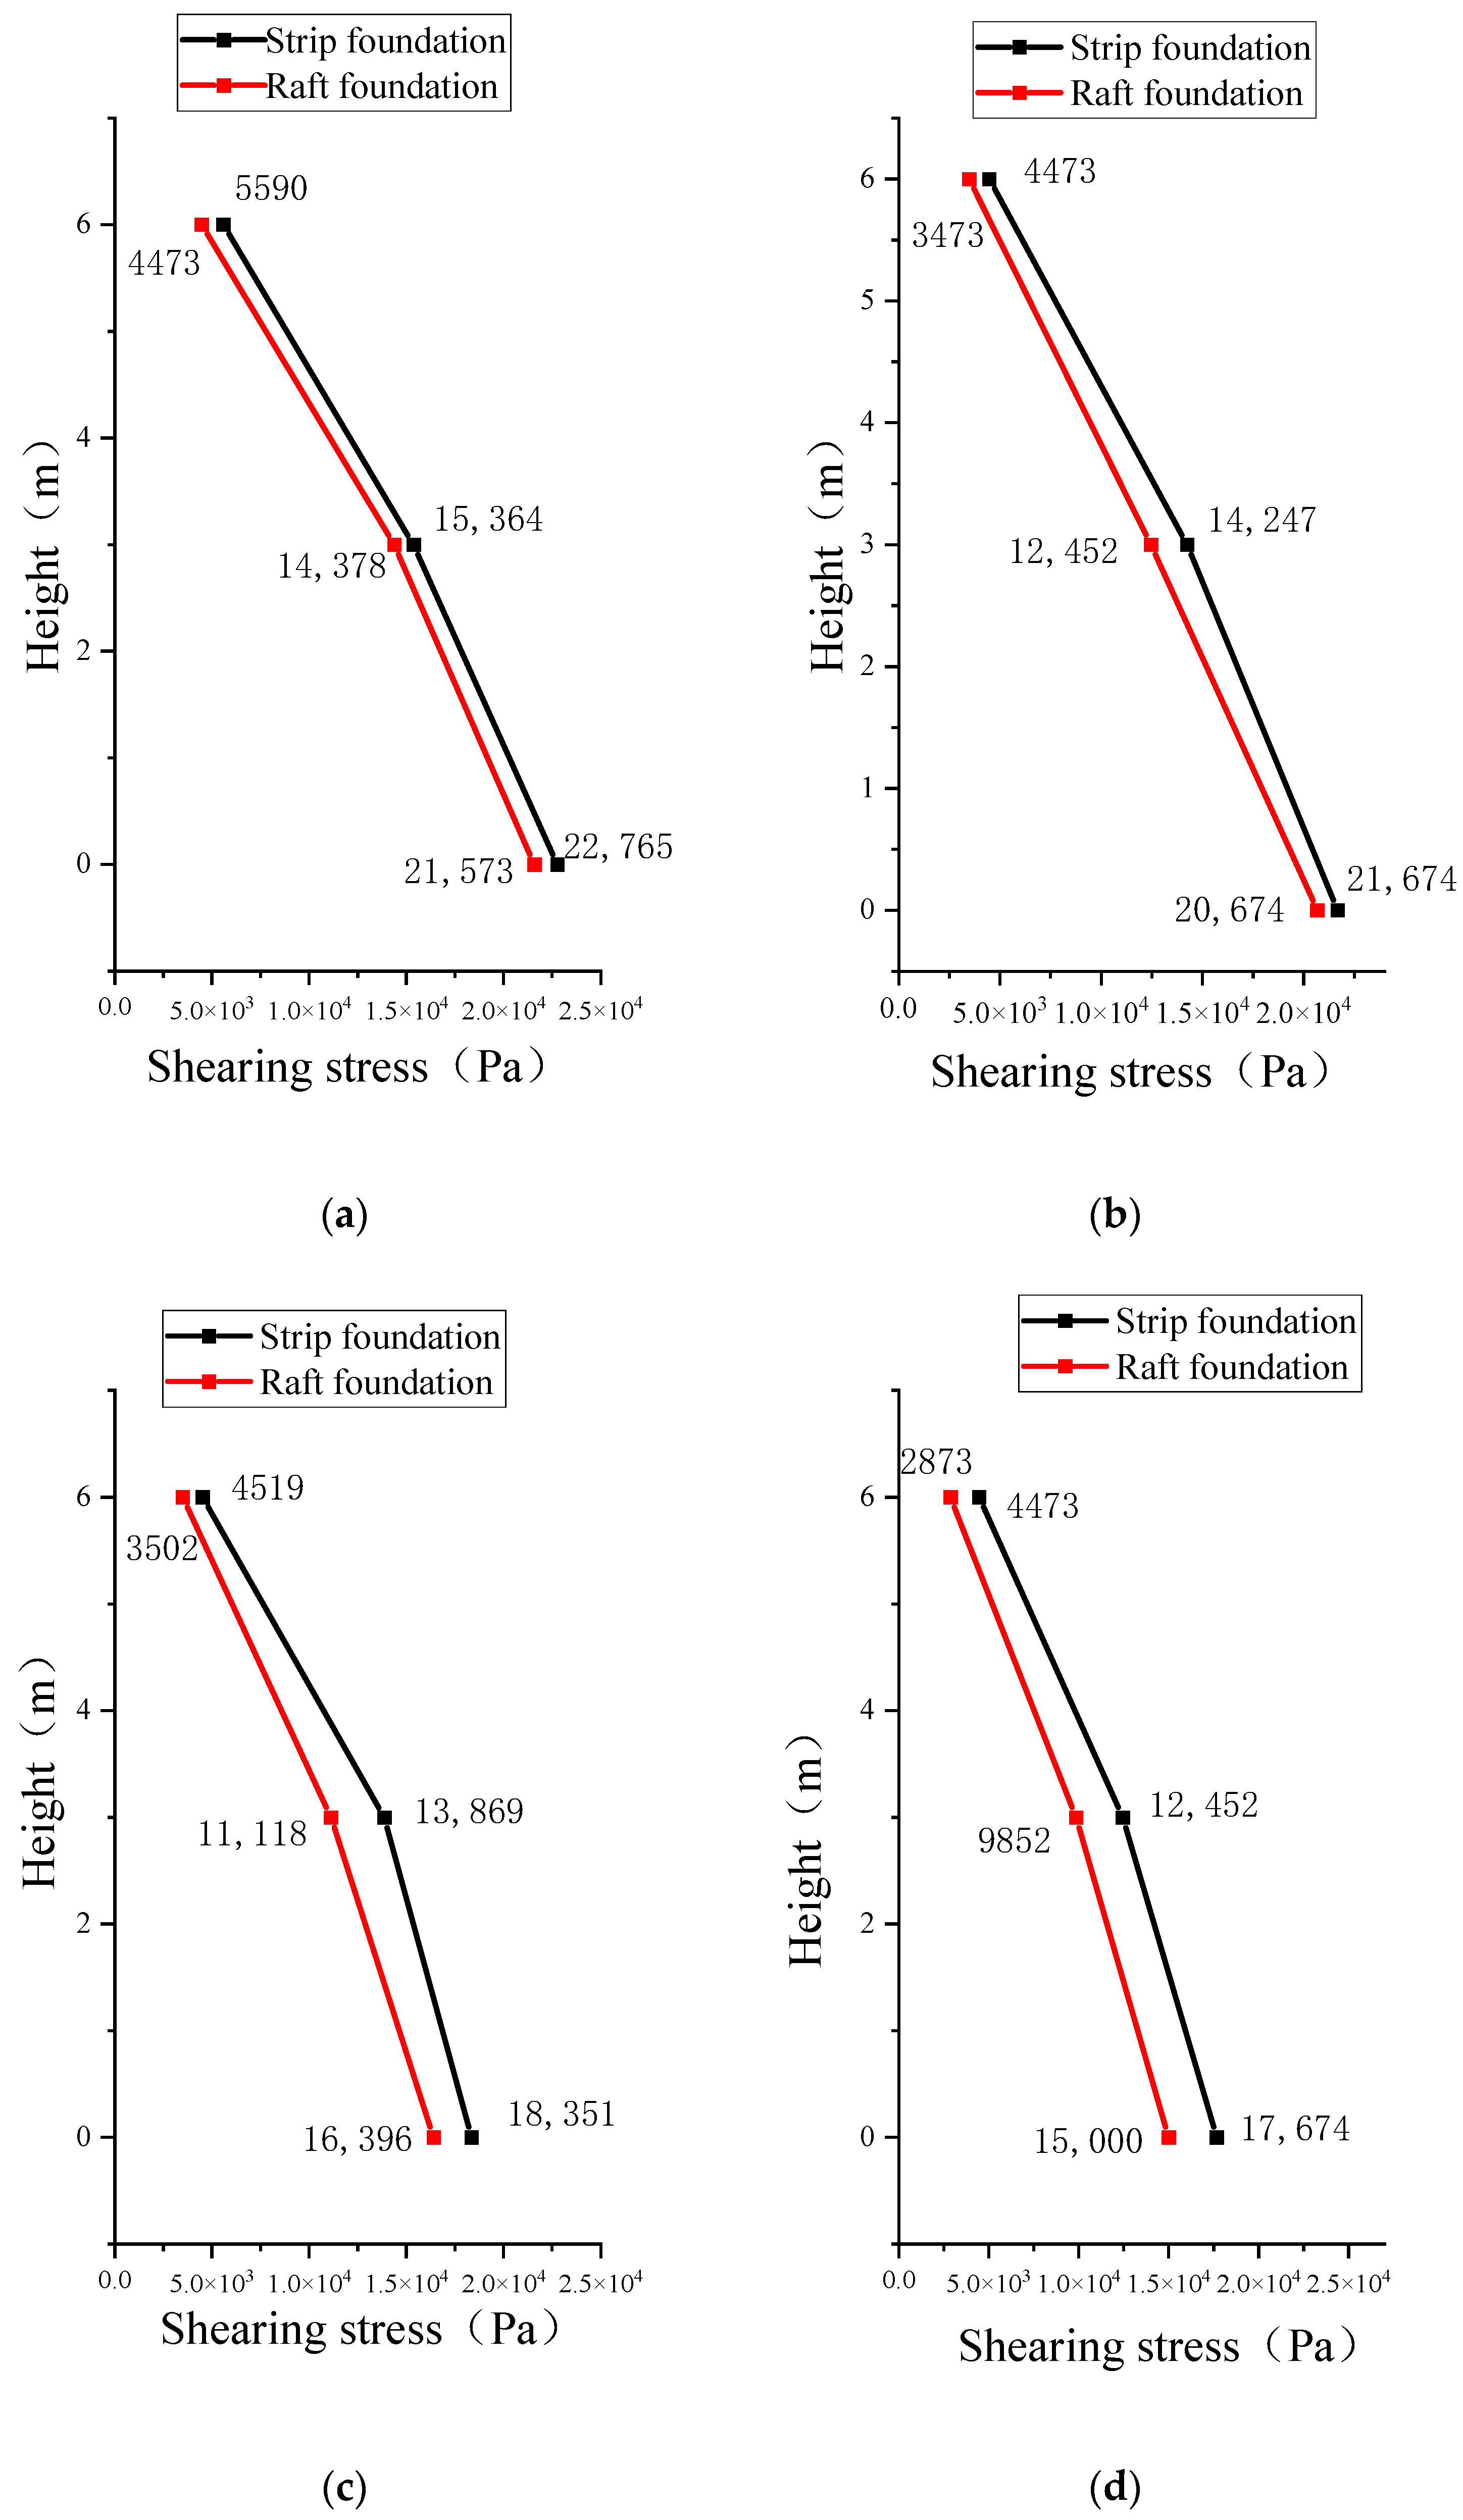
4.1.3. Column Height—Maximum Shear Stress Curve

The qualitative analysis based on Figure 5a–d reveals the following two points:
(1)
Common point: the trend in the interlayer shear curve is consistent for both foundation forms, where the maximum shear stress decreases with increasing height. Furthermore, the interlayer shear stress decreases with an increase in the thickness of the rubber-particle-modified soil isolation layer, suggesting that augmenting the thickness of the rubber-particle-modified soil layer effectively reduces the maximum shear stress of the frame structure.
(2)
Different point: in the rubber-modified soil isolation layer of the same thickness, the interlayer shear stress of the raft foundation frame structure is smaller than that of the strip foundation frame structure. This indicates that increasing the contact area between the base and the rubber-modified soil isolation layer can effectively reduce the interlayer shear stress of the frame structure. With an increase in the thickness of the rubber-modified soil isolation layer, the distance between the interlayer shear stress curves for the two foundation forms also increases. This indicates that increasing the thickness of the rubber-modified soil isolation layer can amplify the difference in contact areas between different substrates.

4.2. Influence of Isolation Layer Thickness on Isolation Effect

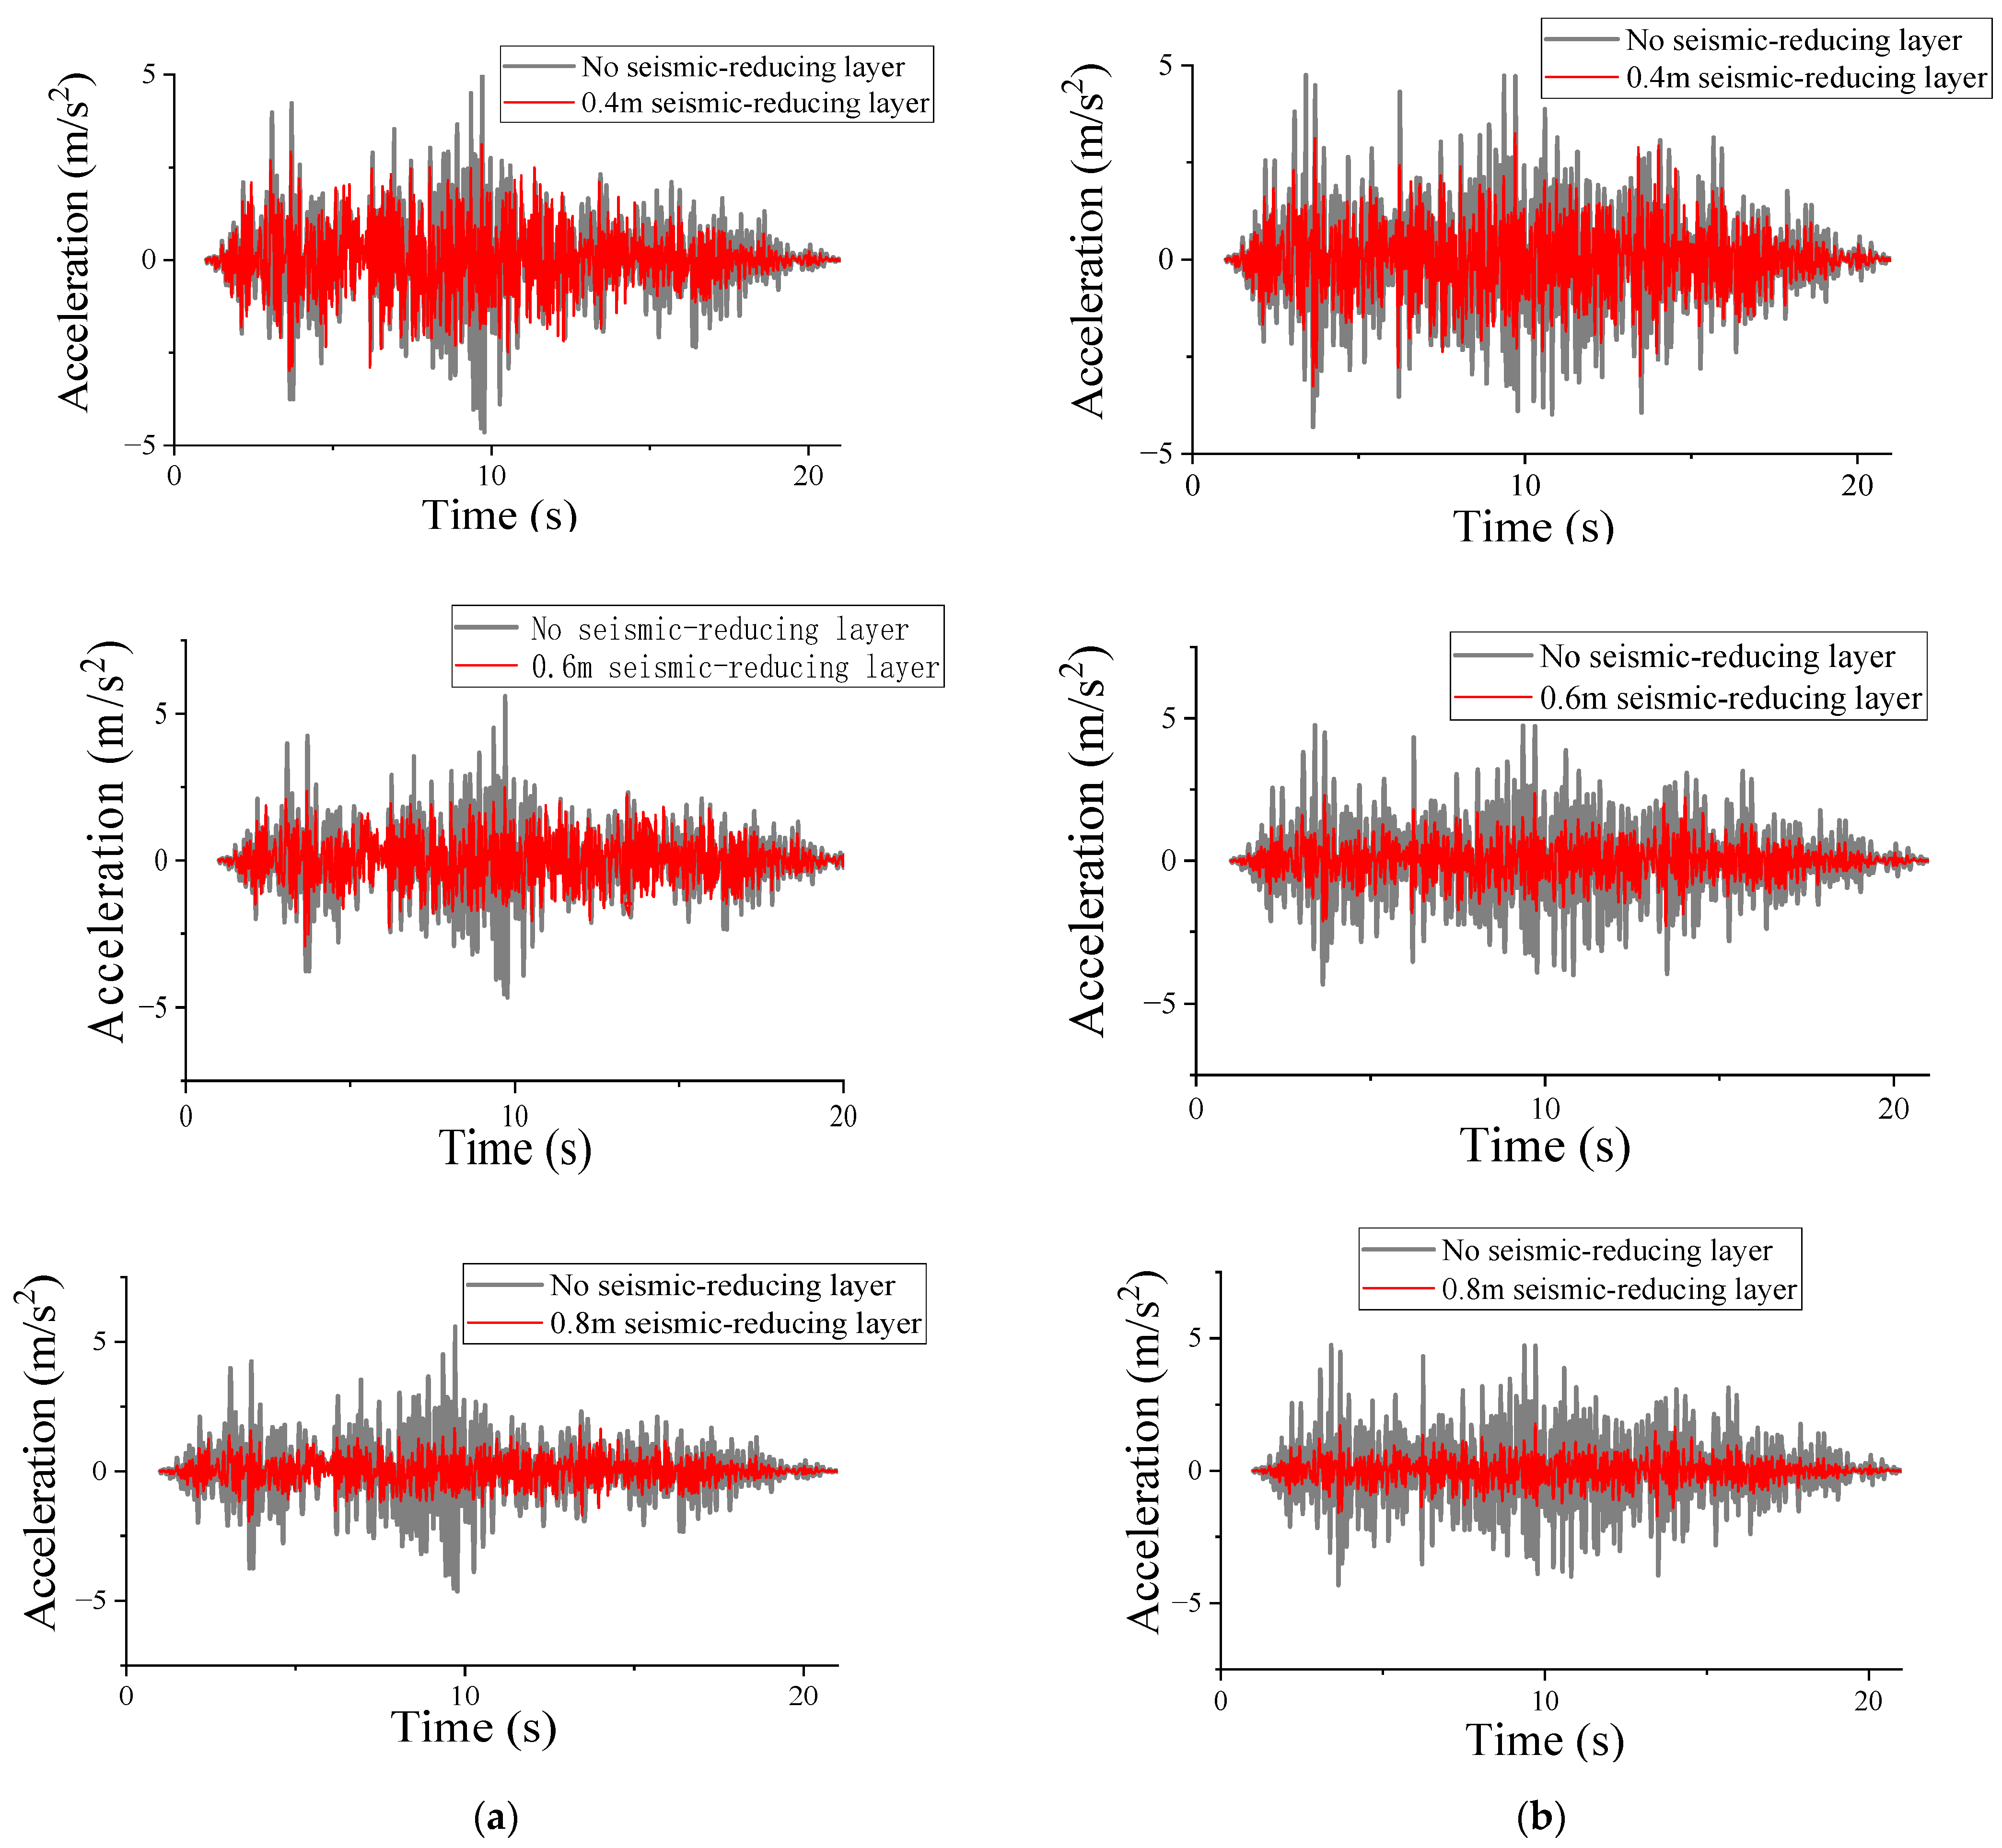
4.2.1. Acceleration Response Analysis of the Top Layer of the Structure

The comparison of the peak acceleration–time history curves for a finite element structure with an input peak value of a 0.2 g artificial ground motion record under the conditions of different thickness isolation layers is illustrated in Figure 6.
The following two points can be obtained from the qualitative analysis in Figure 6:
(1)
Common points: under both foundation forms (raft foundation and strip foundation), the shape, duration, and peak acceleration–time history curve of frame structures with varying thicknesses of the rubber-particle-modified soil isolation layer are similar. The peak acceleration–time history curve of frame structures with a rubber-particle-modified soil isolation layer is smaller than that of frame structures without a rubber-particle-modified soil isolation layer.
(2)
Different points: the peak value of the peak acceleration–time history curve of the frame structure gradually decreases with an increase in the thickness of the rubber-particle-modified soil isolation layer. This indicates that increasing the thickness of the rubber-particle-improved soil isolation layer effectively reduces the peak acceleration of the frame structure, enhancing its isolation effect. It is evident from the figure that the peak acceleration–time history curve of the frame structure with a 0.6 m and 0.8 m thick rubber-particle-modified soil isolation layer is significantly lower than that of the frame structure with a 0.4 m rubber-particle-modified soil isolation layer. However, the distinction between the peak acceleration–time history curves of the frame structures with a 0.6 m and 0.8 m thick rubber-particle-modified soil isolation layer is not pronounced.
Further quantitative analysis from Table 5 shows that as the thickness of the rubber-particle-modified soil isolation layer increases, the damping effect of a frame structure using the raft foundation improves, but the rate of improvement in the damping effect gradually decreases. The peak acceleration of the frame structures with rubber-particle-modified soil isolation layers of 0.4 m, 0.6 m, and 0.8 m thickness decreased by 46.5%, 51.65%, and 53.78%, respectively, compared to frame structures without a rubber-particle-modified soil isolation layer. Among them, the acceleration peak drop of the modified soil layer with a 0.6 m thickness increased by 5.15% compared to that with a 0.4 m thickness. Similarly, the peak acceleration reduction of the modified soil layer with a 0.8 m rubber particle layer increased by 2.13% compared to that of 0.6 m, and the reduction was not as significant as the former. In the case of the strip foundation, the damping effect of frame structure increased with an increase in the thickness of the layer. The amplitude of increase follows a similar pattern as that observed for the raft foundation. However, it is important to note that the damping effect was consistently smaller compared to the same thickness for the raft foundation.

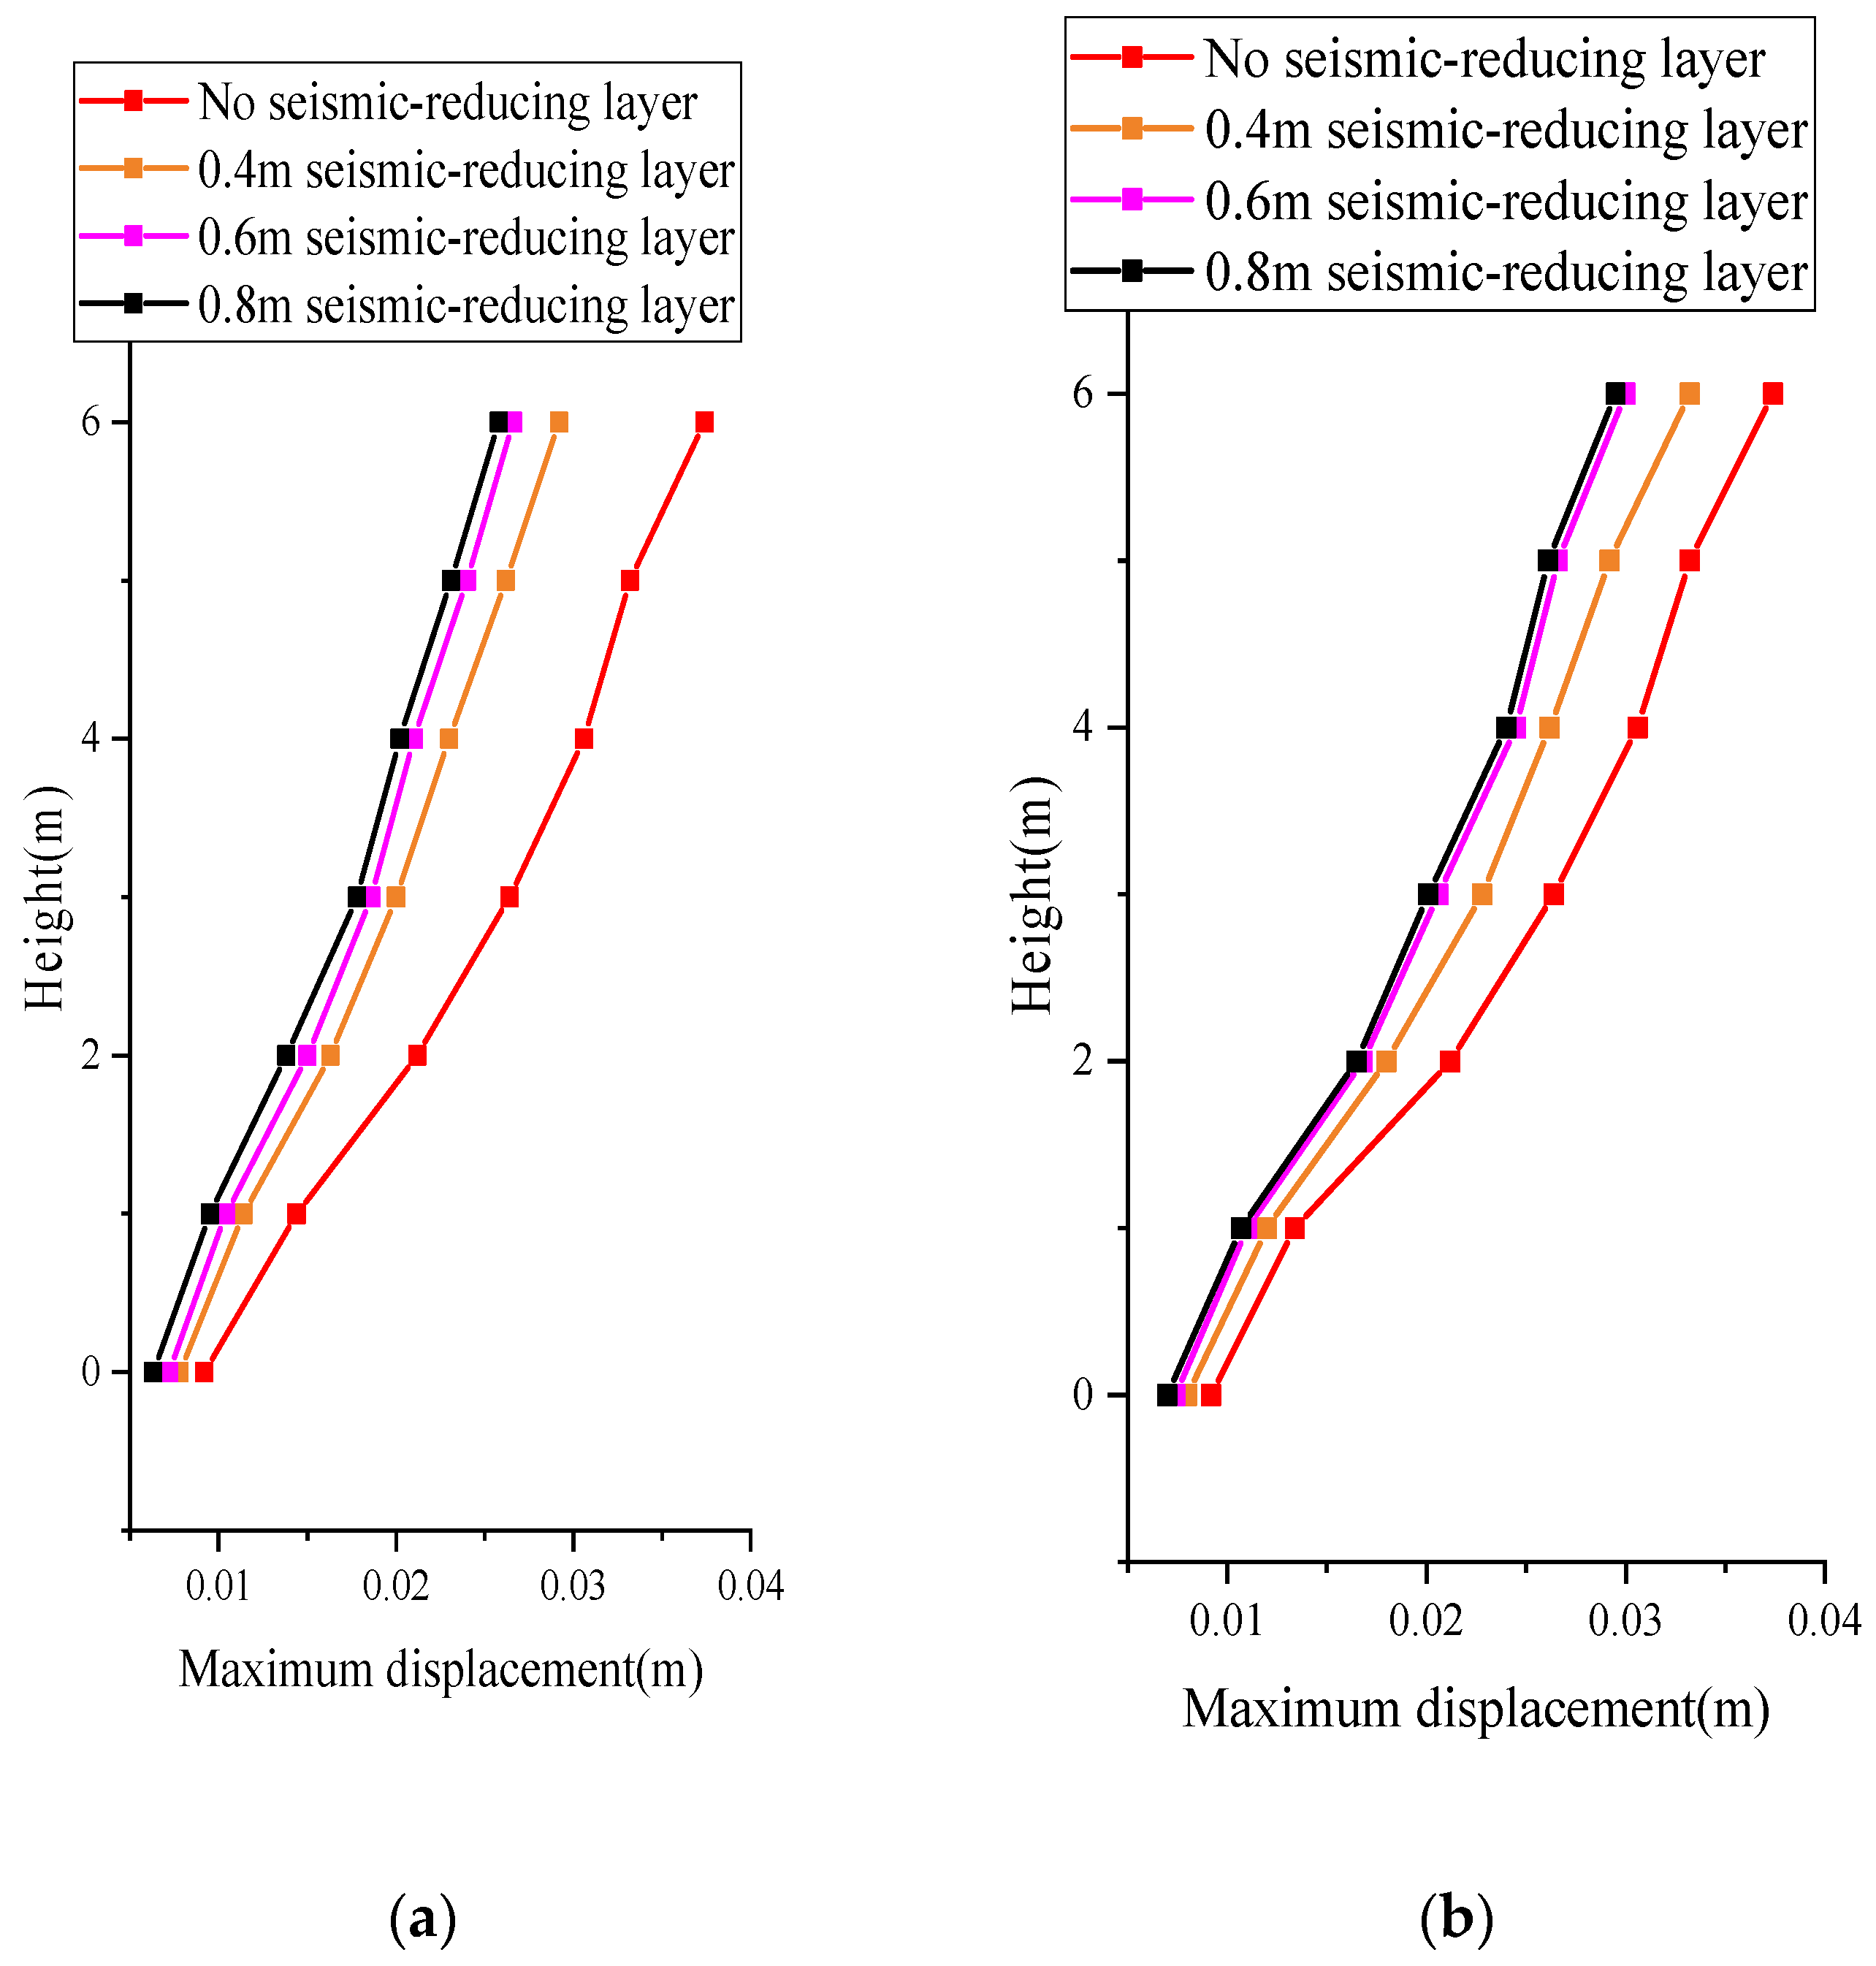
4.2.2. Comparison of Column Height–Peak Absolute Displacement

The observated column illustrated in Figure 1 is also employed to investigate the influence of the rubber-modified soil isolation layer’s thickness on the displacement of the frame structure. An observation point is designated every meter along column A, and the column height–absolute displacement peak curves of raft foundation and strip foundation frame structures with various isolation layer thicknesses are extracted under the condition that the input peak value is a 0.2 g artificial ground motion record, as shown in Figure 7.
The following two points can be obtained from the qualitative analysis in Figure 7:
(1)
Common points: the trend in the column height–maximum displacement curve for each thickness of the rubber-particle-modified soil isolation layer is consistent across both foundation types, with displacement increasing with height.
(2)
Different points: with the increase in the thickness of the rubber-particle-modified soil isolation layer, the lateral horizontal displacement at the same height gradually decreases. When the thickness of the rubber-particle-modified soil isolation layer is less than 0.6 m, the lateral horizontal displacement of the frame structure decreases significantly. However, when the thickness of the rubber-particle-modified soil isolation layer is greater than or equal to 0.6 m, the lateral horizontal displacement of the frame structure decreases slightly. The results demonstrate that increasing the thickness of the rubber-particle-modified soil isolation layer effectively reduces the lateral horizontal displacement of the frame structure. When the thickness of rubber-particle-modified soil isolation layer reaches 0.6 m, the damping effect approaches a limit, and further increasing the thickness of the rubber-particle-modified soil isolation layer only slightly reduces the lateral horizontal displacement of the frame structure.
To provide an intuitive expression of the structural displacement limit under earthquake conditions, this paper proposes the calculation of the structural displacement angle. The ultimate displacement of the structure is described by calculating the displacement angle of the columns within the structure. The calculation of the displacement angle of the column is shown in Equation (1). The maximum displacement angle of each column is presented in Table 6. It is evident from the table that the maximum displacement angle of the structure is significantly reduced under the working condition of a rubberized soil foundation.
D i s p l a c e m e n t   a n g l e   o f   t h e   s t r u c t u r e = H o r i z o n t a l   d i s p l a c e m e n t   a t   t h e   t o p   o f   t h e   s t r u c t u r e H e i g h t   o f   s t r u c t u r e   ×   100 %
By comparing the maximum displacement angle of columns under different working conditions, it can be concluded that the displacement angle of a frame structure without an isolation layer and with a 0.4 m isolation layer decreases significantly from 0.61% and 0.62% to 0.468% and 0.486%, respectively. This indicates that a rubber-modified soil isolation layer can effectively reduce the displacement angle, thus enhancing the isolation effect of the frame structure. The rubber-modified soil layer proves to be effective in mitigating the displacement response of the frame structure during earthquake events, resulting in a reduction of the frame structure’s displacement under seismic conditions. The 0.6 m and 0.8 m rubber-modified soil isolation layers also exhibit a significant effect in reducing the displacement angle. However, the difference in the reduction of the displacement angle between these two isolation layer thicknesses is relatively small. In conclusion, a 0.6 m thick rubber-particle-modified soil isolation layer appears to be the optimal choice.

4.3. Influence of Ground Motion Intensity on the Isolation Effect

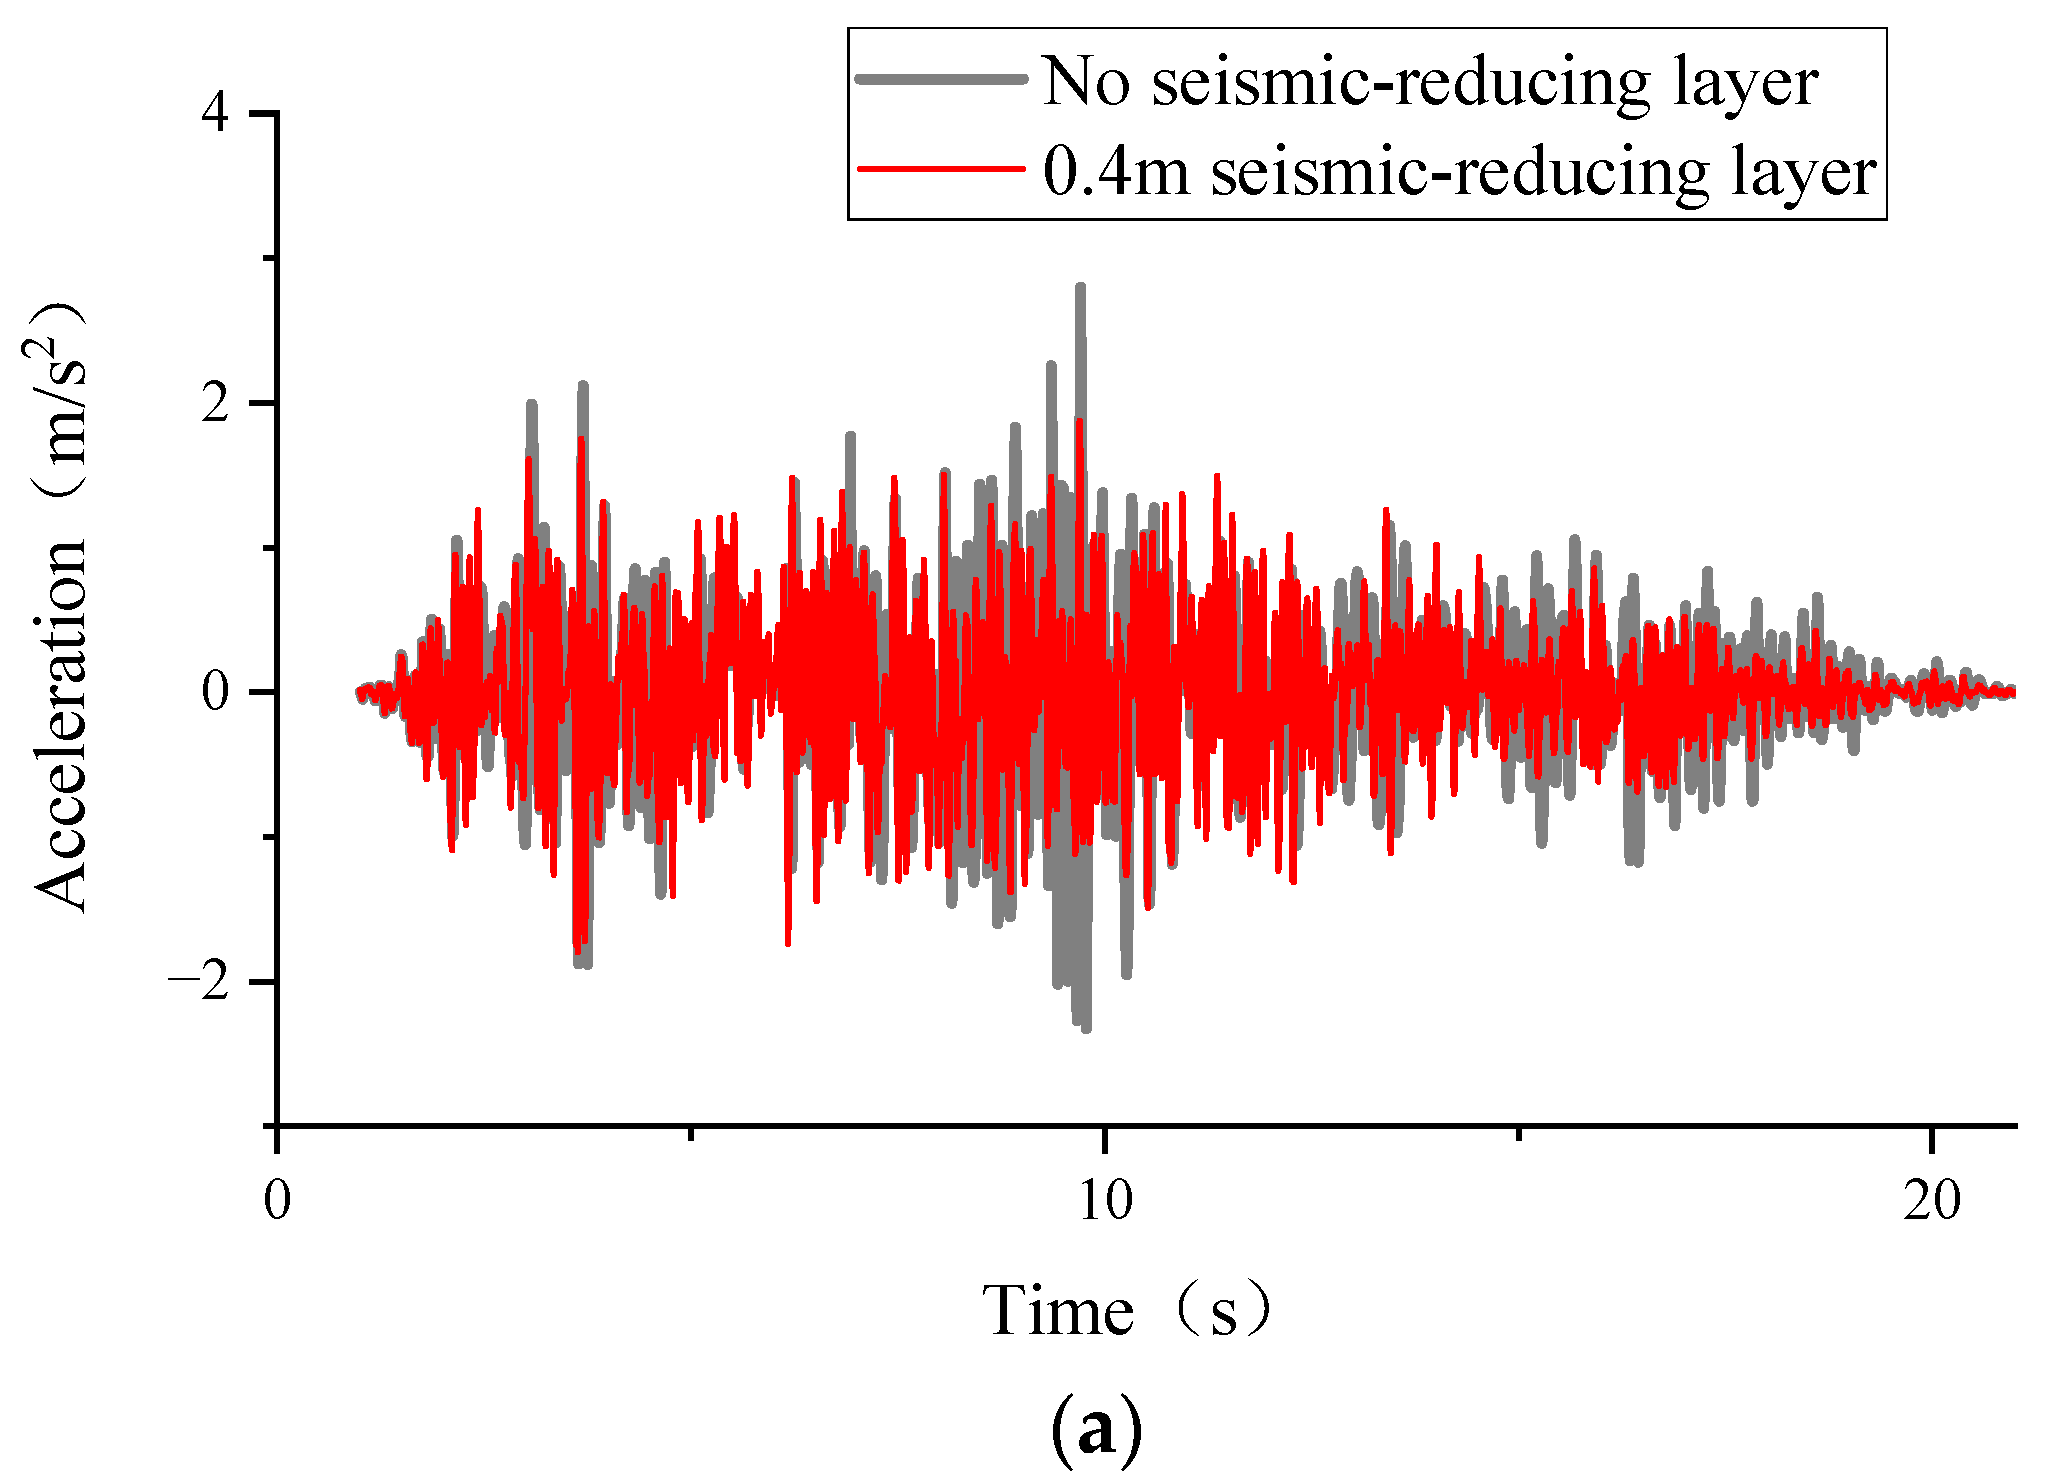
4.3.1. Acceleration Response Analysis of the Top Layer of the Structure

In this section, particle-modified soil isolation layers with thicknesses of 0 m and 0.4 m and raft foundations are selected to explore the influence of different ground motion intensities on the isolation effect of a rubber-modified soil isolation layer under the same ground motion record. The time history curves of frame structure vertex acceleration corresponding to each ground motion intensity are illustrated in Figure 8.
The following two points can be obtained from the qualitative analysis in Figure 8:
(1)
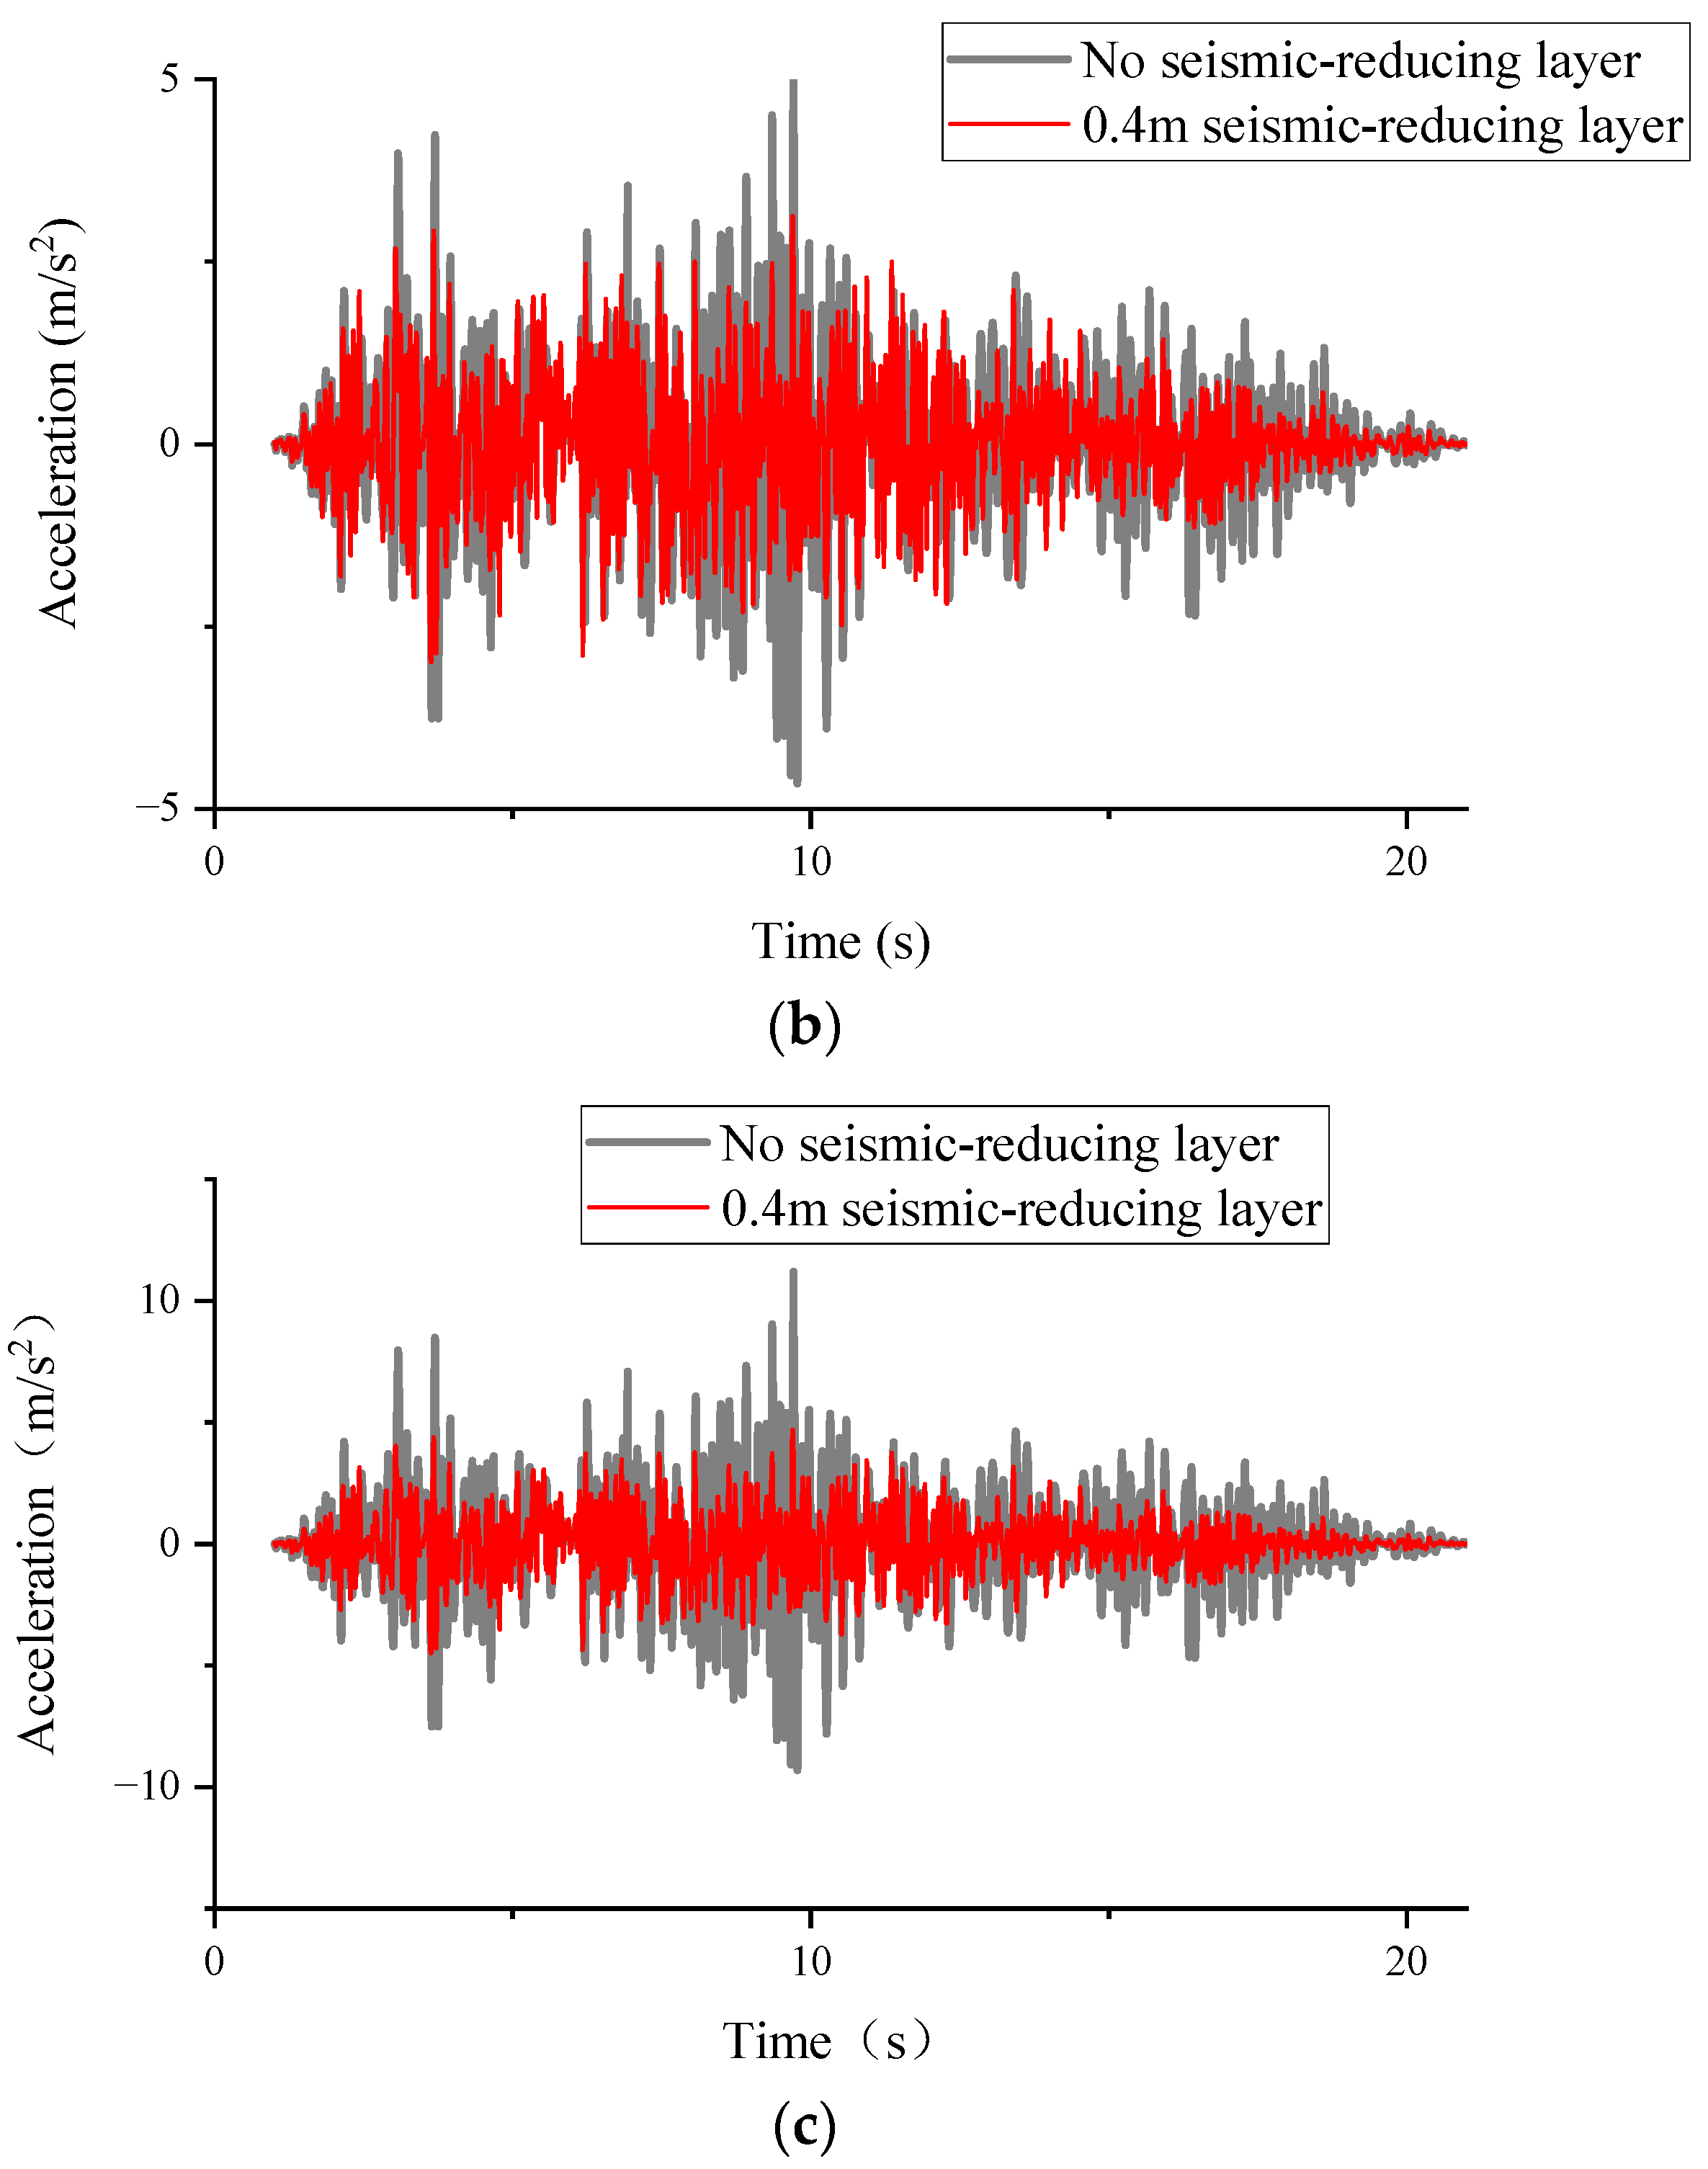
Common points: when applying ground motion records of varying intensities to the frame structure, both with and without a 0.4 m thick rubber-particle-modified soil isolation layer, the shape, duration, and time of the peak acceleration–time history curve are similar. However, the peak acceleration of the frame structure with a rubber-particle-modified soil isolation layer is consistently lower than that of the frame structure without a rubber-particle-modified soil isolation layer.
(2)
Different points: as the intensity of the input ground motion record increases, the peak acceleration of both the frame structure without the rubber-particle-modified soil isolation layer and the frame structure with the 0.4 m thick rubber-particle-modified soil isolation layer also increases. With an increase in the intensity of the input ground motion record, the frame structure with a rubber-particle-modified soil isolation layer experiences a smaller rise in peak acceleration compared to the structure without a rubber-particle-modified soil isolation layer. The disparity in vertex acceleration is most pronounced at the peak of peak acceleration. This suggests that a heightened ground motion intensity amplifies the peak acceleration of the frame structure. However, the frame structure with a rubber-particle-modified soil isolation layer exhibits lower peak acceleration and a superior damping effect.
Further quantitative analysis in Table 7 reveals that the peak acceleration of the frame structure, both without a rubber-particle-modified soil isolation layer and with a 0.4 m thick rubber-particle-modified soil isolation layer, increases with the rise in input seismic intensity. At input ground motion record intensities of 0.1 g, 0.2 g, and 0.4 g, the peak vertex acceleration of the frame structure with a 0.4 m thick rubber-particle-modified soil isolation layer decreases by 16.97%, 46.5%, and 51.03%, respectively, compared to the structure without a rubber-particle-modified soil isolation layer. The reduction in peak acceleration increases with an increase in the ground motion record intensity. The results indicate that as the ground motion record intensity increases, the frame structure with a 0.4 m thick rubber-particle-modified soil isolation layer exhibits a greater damping effect.

4.3.2. Column Height—Maximum Displacement and Maximum Shear Stress

The frame structure with a 0.4 m thick rubber-particle-modified soil isolation layer under a raft foundation is subjected to artificial ground motion records with acceleration peaks of 0.1 g, 0.2 g, and 0.4 g. The study focuses on the influence of ground motion records with varying peak acceleration on the isolation effect of the frame structure. The maximum displacement and maximum shear stress of the observed column are presented in Table 8 and Table 9.
It can be observed from Table 8 and Table 9 that, as the peak acceleration of the input ground motion record acceleration increases to 0.1 g, 0.2 g and 0.4 g, the displacement of the frame structure column with a 0.4 m thick rubber-particle-modified soil isolation layer gradually increases by 14.28%, 15.83%, and 16.9%, respectively, compared to that without the rubber-particle-modified soil isolation layer. The reduction range of the maximum shear stress of the observed column gradually increased to 4.79%, 16.28%, and 17.72%, respectively. This suggests that with an increase in the ground motion record acceleration peak, the damping effect of the frame structure with a rubber-particle-modified soil isolation layer was enhanced.

4.4. Influence of Ground Motion Spectrum Characteristics on the Isolation Effect

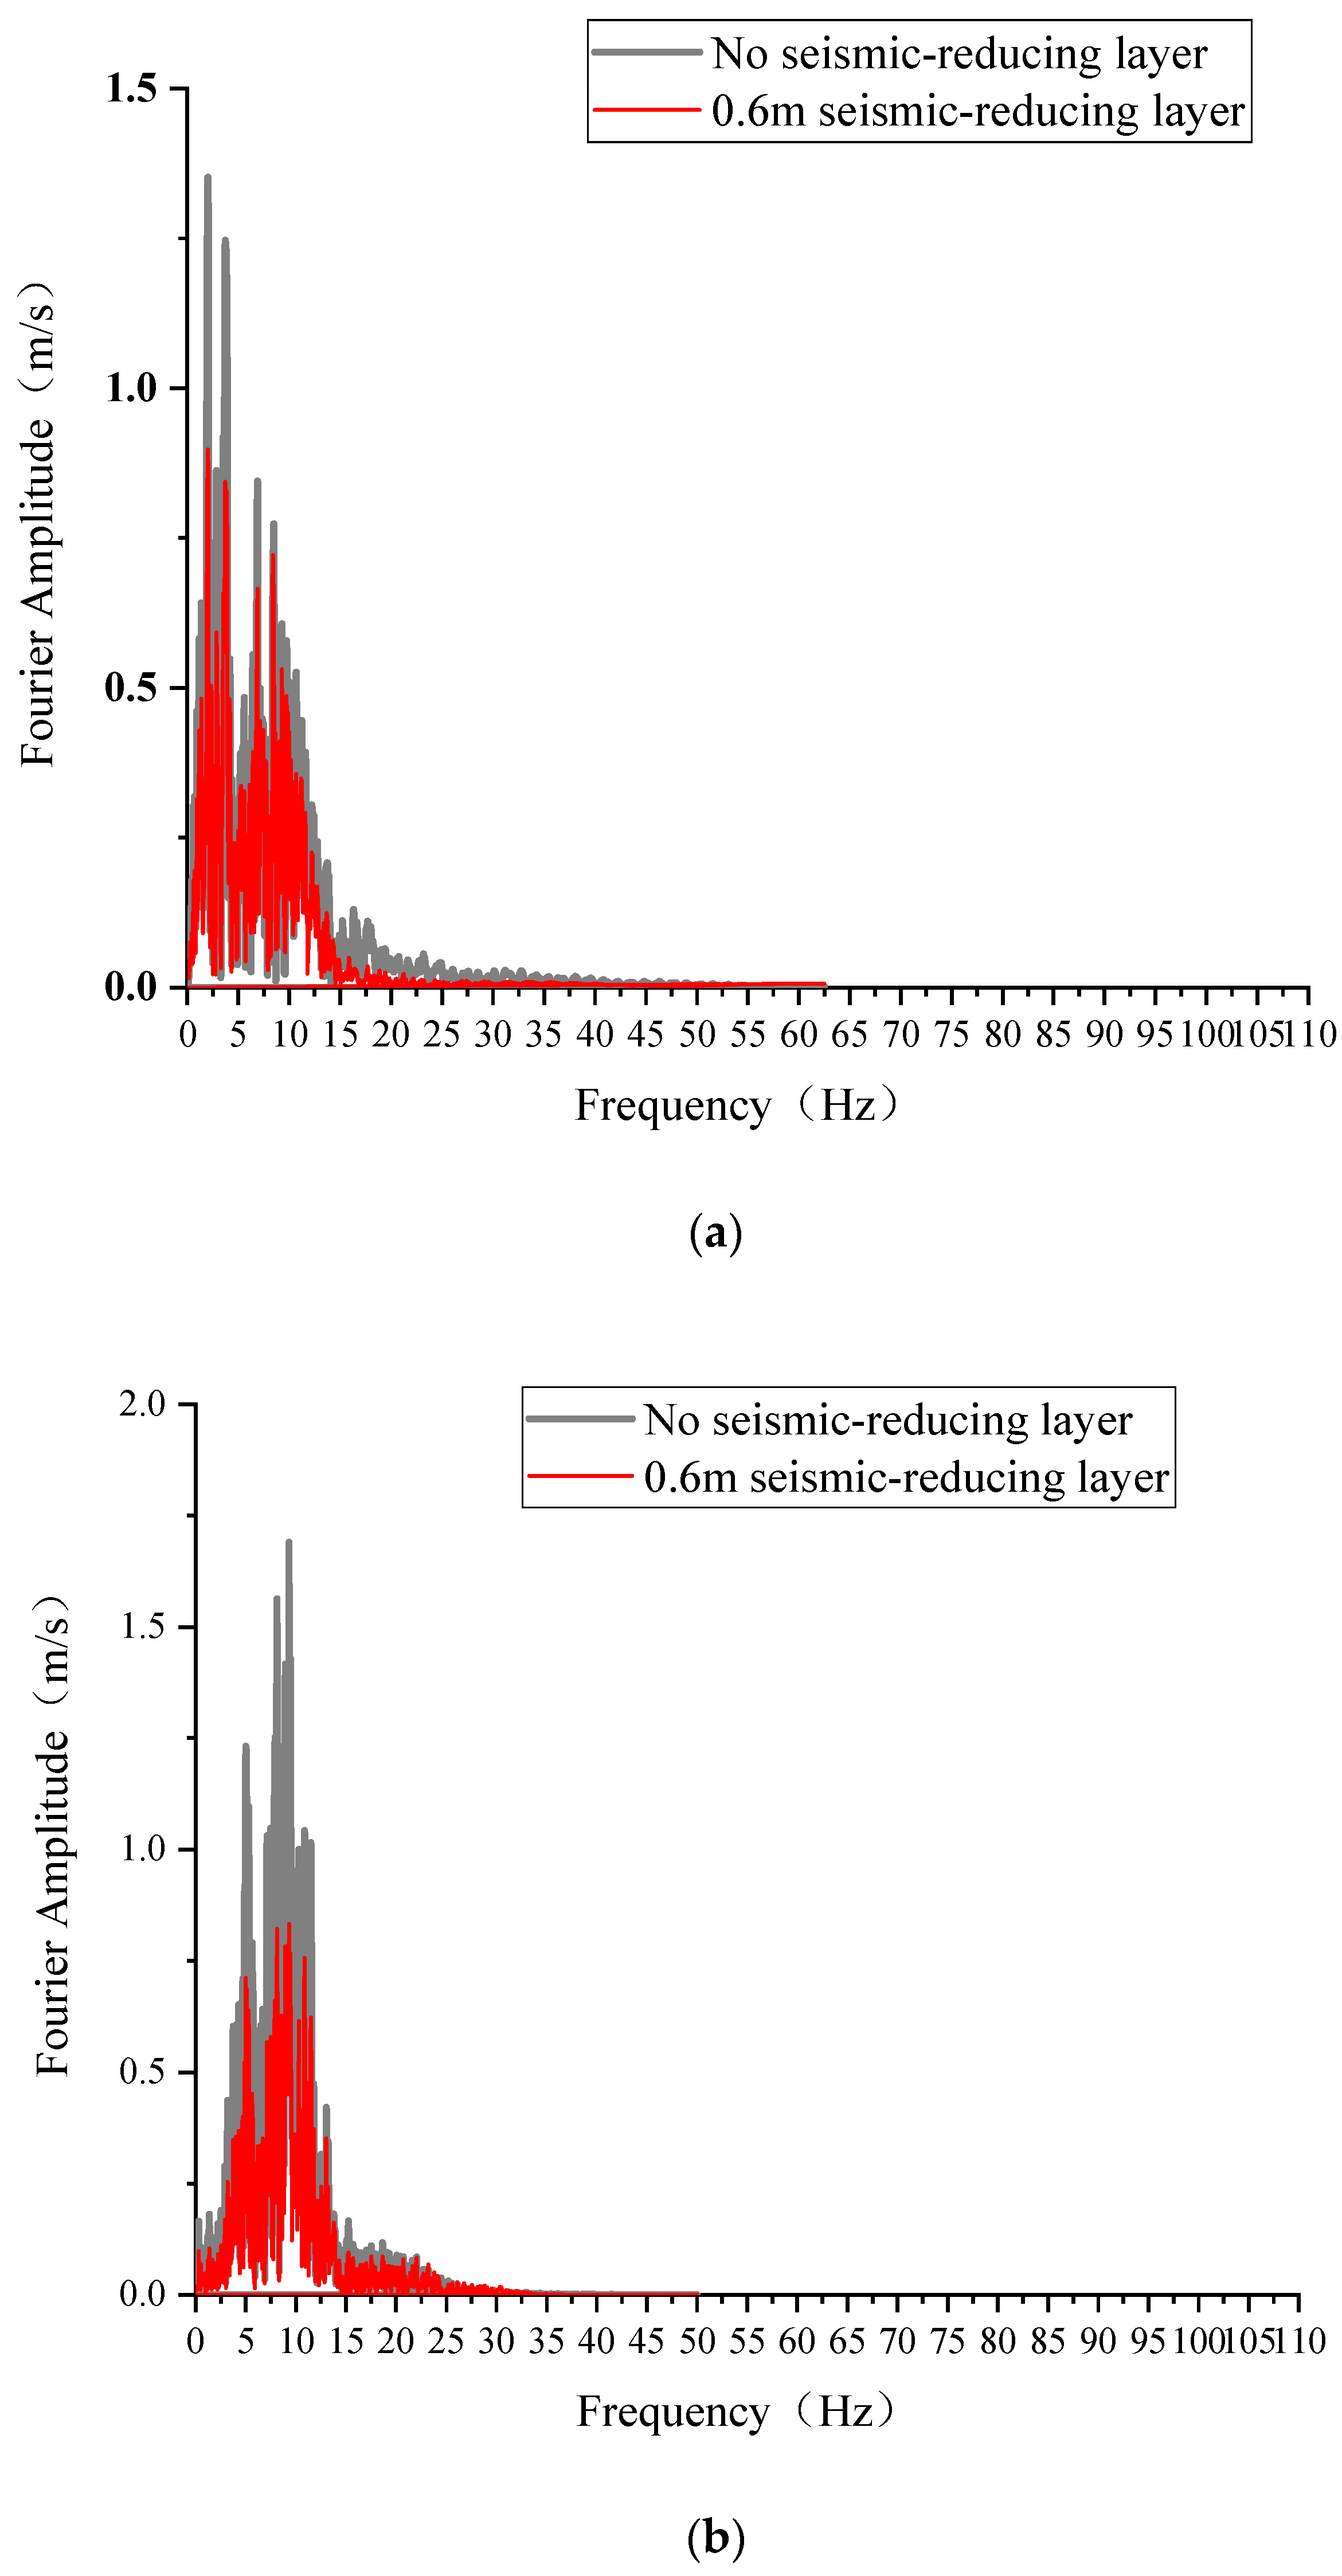
Comparison of Fourier Spectrum Curves

A frame structure with a raft foundation is employed as a model to investigate the influence of seismic spectrum characteristics on seismic isolation. Taking the three ground motion records listed above (the Friuli (Italy) earthquake of 6 May 1976, the San Fernando, 1971 earthquake at Santa Anita Dam, and the artificial ground motion record), a peak acceleration of 0.2 g is applied to the ground motion record and fed into the finite element model. The optimal configuration of a 0.6 m isolation layer thickness and a raft foundation form is chosen to investigate the influence of ground motion spectrum characteristics on the isolation effect. The structure’s peak acceleration–time history curve is extracted for each working condition and compared with the Fourier spectrum. The acceleration –time history curve and Fourier spectrum of each working condition are presented in Figure 9a–c.
The following two points can be drawn from Figure 9:
(1)
Image comparison results: the Fourier spectrum of the structural response closely aligns with that of the input ground motion. However, there is a disparity between the Fourier spectrum of the input artificial ground motion record and the structural response. The fundamental frequency in the Fourier spectrum related to the vertex acceleration–time history of the frame structure is similar for ground motion records with comparable spectral characteristics. However, there is a discernible difference in the Fourier amplitude corresponding to the fundamental frequency. Specifically, the Fourier amplitude when subjected to artificial ground motion records is higher than the corresponding amplitude under the influence of the Friuli ground motion records and San Fernando ground motion records.
(2)
The observed discrepancy may be attributed to the distinctive Fourier curve shape of the input artificial ground motion record, which diverges from the Fourier spectrum of the structural response. Due to absence of a rubber-particle-modified soil isolation layer, the frame structure experiences a heightened seismic response, accumulating internal damage and generating cracks. This, in turn, leads to a reduction in the natural frequency. Additionally, under the influence of the three ground motion records, both the Fourier spectrum of the structural response and the Fourier spectrum of the input ground motion decrease. This occurs because the presence of the rubber-particle-modified soil isolation layer creates a milder soil–structure interaction, resulting in reduced nonlinear residual deformation of the soil and a corresponding decrease in the amplitude of the fundamental frequency.

5. Conclusions

In this paper, a two-layer frame structure was utilized as an example to investigate the seismic isolation effects associated with frame structure with various foundation forms. Through dynamic time history analysis, the influences of base contact areas, the thickness of the rubber-modified soil layer, the intensity of ground motion records and the spectral characteristics of ground motion on the seismic isolation effect were compared. The primary research conclusions are as follows:
(1)
Through a comparison of the peak acceleration–time history curve and the column height–maximum displacement curve of a frame structure with a raft foundation and a strip foundation, it is concluded that a larger contact area between the foundation and the rubber-modified soil layer, especially with thicknesses of 0.4 m, 0.6 m, and 0.8 m, leads to an enhanced isolation effect of the rubber-modified soil.
(2)
In the frame structure with artificial ground motion records as input, by comparing the peak acceleration–time history curve and maximum column–displacement angle for four finite element models with rubber-particle-modified soil layers of 0 m, 0.4 m, 0.6 m, and 0.8 m thickness, it is concluded that as the thickness of the rubber-modified soil layer increases, the isolation effect of the structure improves. The increase in the isolation effect is no longer significant when the thickness exceeds 0.6 m.
(3)
Different ground motion records with varying peak accelerations were applied to the finite element model. Once comparisons were made between the peak acceleration–time history curve of the structure, the column height-maximum displacement curve, and the column height–maximum shear stress curve, it was concluded that the peak acceleration of the frame structure increased with an increased peak acceleration of the ground motion records. Laying a rubber-particle-modified soil isolation layer can reduce the amplitude of the peak acceleration of the frame structure with an increase in the intensity of the input ground motion record.
(4)
Three different types of ground motion records were utilized as inputs for the finite element models, each with the same peak acceleration. The Fourier spectrum of the frame structure’s response to these three ground motion records was then compared with the Fourier spectrum curve of the input seismic motion. It was concluded that ground motion records with abundant low frequencies resulted in an intense structural dynamic response and higher Fourier amplitude. The soil–structure interaction was smoother when rubber particles were installed, and the Fourier spectrum amplitude of the structure was lower than that of the input seismic motion.

Author Contributions

S.C.: methodology, conceptualization, data curation, validation; Y.C.: reviewing, funding acquisition; D.C.: supervision, writing; Q.C.: reviewing; W.W.: methodology; J.L.: writing, data analysis. All authors have read and agreed to the published version of the manuscript.

Funding

This research was funded by the Natural Science Basic Research Plan in Shaanxi Province, (No. 2021-JQ-243), research on the dynamic characteristics of rubber-particle-improved ground bases and the key technology of structural shock absorption (grant number KJYF-2023-7GS-CG08), and Fundamental Research Funds for the Central Universities, CHD (No. 300102282201).

Data Availability Statement

The data used to support the findings of this study are included in the article.

Conflicts of Interest

The authors declare no conflict of interest.

References

  1. Soltani, A.; Deng, A.; Taheri, A.; Sridharan, A. Swell-Shrink-Consolidation Behavior of Rubber-Reinforced Expansive Soils. Geotech. Test. J. 2019, 42, 761–788. [Google Scholar] [CrossRef]
  2. Raeesi, R.; Soltani, A.; King, R.; Disfani, M.M. Field performance monitoring of waste tire-based permeable pavements. Transp. Geotech. 2020, 24, 100384. [Google Scholar] [CrossRef]
  3. Akbarimehr, D.; Eslami, A.; Esmail, A. Geotechnical behaviour of clay soil mixed with rubber waste. J. Clean. Prod. 2020, 271, 122632. [Google Scholar] [CrossRef]
  4. Akbarimehr, D.; Rahai, A.; Eslami, A.; Karakouzian, M. Deformation Characteristics of Rubber Waste Powder-Clay Mixtures. Sustainability 2023, 15, 12384. [Google Scholar] [CrossRef]
  5. Saparudin, N.A.; Kasim, N.; Abu Taib, K.; Azahar, W.N.I.W.; Kasim, N.A.; Ali, M. Improvement of Problematic Soil Using Crumb Rubber Tyre. IIUM Eng. J. 2022, 23, 72–84. [Google Scholar] [CrossRef]
  6. Sadek, D.M.; El-Attar, M.M. Structural behavior of rubberized masonry walls. J. Clean. Prod. 2015, 89, 174–186. [Google Scholar] [CrossRef]
  7. Chen, Y.; Chai, S.Q.; Cai, D.B.; Wang, W.; Li, X.P.; Liu, J.H. Experimental study on shear mechanical properties of improved loess based on rubber particle incorporation and EICP technology. Front. Earth Sci. 2023, 11, 127012. [Google Scholar] [CrossRef]
  8. Zhou, T.L.; Dong, C.S.; Fu, Z.P.; Li, S. Study on Seismic Response and Damping Performance of Tunnels with Double Shock Absorption Layer. KSCE J. Civ. Eng. 2022, 26, 2490–2508. [Google Scholar] [CrossRef]
  9. Srijit, B.; Aniruddha, S.; Reddy, G.R. Performance of sand and shredded rubber tire mixture as a natural base isolator for earthquake protection. Earthq. Eng. Eng. Vib. 2015, 14, 683–693. [Google Scholar]
  10. Hazarika, H.; Kohama, E.; Sugano, T. Underwater Shake Table Tests on Waterfront Structures Protected with Tire Chips Cushion. J. Geotech. Geoenviron. Eng. 2008, 134, 1706–1719. [Google Scholar] [CrossRef]
  11. Alhan, C.; Gavin, H. A parametric study of linear and non-linear passively damped seismic isolation systems for buildings. Eng. Struct. 2004, 26, 485–497. [Google Scholar] [CrossRef]
  12. D’Amato, M.; Gigliotti, R.; Laguardia, R. Seismic isolation for protecting historical buildings: A case study. Front. Built Environ. 2019, 5, 87. [Google Scholar] [CrossRef]
  13. Amorosi, A.; Boldini, R.; Elia, R. Parametric study on seismic ground response by finite element modelling. Comput. Geotech. 2010, 37, 515–528. [Google Scholar] [CrossRef]
  14. Schanze, E.; Schanze, E.; Gomez, M.; Lopez, A. Numerical study of the seismic response of an instrumented building with underground stories. Appl. Sci. 2021, 11, 3190. [Google Scholar] [CrossRef]
  15. Adampira, M.; Derakhshandi, M.; Ghalandarzadeh, A. Experimental study on seismic response characteristics of liquefiable soil layers. J. Earthq. Eng. 2021, 25, 1287–1315. [Google Scholar] [CrossRef]
  16. Cui, G.Y.; Wei, H.H.; Ning, M.Q.; Zhang, J.J. Analysis on influence of thickness of shock absorption layer on shock absorption effect of urban shallow-buried rectangular tunnel. J. Saf. Sci. Technol. 2020, 16, 137–142. [Google Scholar]
  17. Li, S.T.; Bao, X.; Liu, J.B.; Wang, F.; Wang, D. Improvement research on the stability of explicit integration algorithms with 3D viscoelastic artificial boundary elements. Eng. Comput. 2023, 40, 494–513. [Google Scholar] [CrossRef]
  18. Brunet, S.; Llera, D.L.C.J.; Kausel, E. Non-linear modeling of seismic isolation systems made of recycled tire-rubber. Soil. Dyn. Earthq. Eng. 2016, 85, 134–145. [Google Scholar] [CrossRef]
  19. Quan, D.Z.; Chai, S.B.; Wang, Y.L.; Fan, Z.S.; Bu, Y.H. 3-D Numerical Simulation of Seismic Response of the Induced Joint of a Subway Station. Buildings 2023, 13, 1244. [Google Scholar] [CrossRef]
  20. Zheng, Y.; Shi, X.L.; Wang, Y.H.; Zhang, Y.C.; Jin, N. Experiment Scheme Design for Rural Isolation Masonry Structure with Shaking Table. Technol. Earthq. Disaster Prev. 2016, 11, 297–305. [Google Scholar]
  21. Cao, W.L.; Zhou, Z.Y.; Wang, Q.; Dong, H.Y.; Zhang, J.W. Experimental study on base vibration isolation and anti-seismic masonry structure in rural areas by shaking table test. J. Vib. Shock 2011, 30, 209–213. [Google Scholar]
  22. GB 55008-2021; General Code for Concrete Structures. China Planning Publishing House: Beijing, China, 2021.
  23. Du, X.L.; Zhao, M.; Wang, J.T. Artificial stress boundary conditions for near field wave simulation. J. Mech. 2006, 1, 49–56. [Google Scholar]
  24. Du, X.L.; Zhao, M. Seismic response analysis method of arch dam based on viscoelastic boundary. J. Water Conserv. 2006, 9, 1063–1069. [Google Scholar]
  25. Zhao, M.; Gao, Z.D.; Du, X.L.; Wang, J.J.; Zhong, Z.L. Response spectrum method for seismic soil-structure interaction analysis of underground structure. Bull. Earthq. Eng. 2019, 17, 5339–5363. [Google Scholar] [CrossRef]
Figure 1. Model diagram: (a) whole model figure; (b) raft foundation; (c) strip foundation; (d) position diagram of observation pillar A.
Buildings 13 02584 g001
Figure 2. Time history curve of ground motion record acceleration: (a) Friuli; (b) San Fernando; (c) artificial ground motion record.
Buildings 13 02584 g002
Figure 3. Improved soil thickness under the different foundation forms with the same acceleration–time history curve of contrast: (a) 0 m seismic isolation layer thickness; (b) 0.4 m seismic isolation layer thickness; (c) 0.6 m seismic isolation layer thickness; (d) 0.8 m seismic isolation layer thickness.
Buildings 13 02584 g003
Figure 4. The same thickness of the damping layer between different foundation forms under the column height—maximum displacement curve: (a) 0 m seismic isolation layer thickness; (b) 0.4 m seismic isolation layer thickness; (c) 0.6 m seismic isolation layer thickness; (d) 0.8 m seismic isolation layer thickness.
Buildings 13 02584 g004
Figure 5. Comparison diagram of the maximum shear stress curves between columns of different foundation forms under an isolation layer of the same thickness: (a) 0 m seismic isolation layer thickness; (b) 0.4 m seismic isolation layer thickness; (c) 0.6 m seismic isolation layer thickness; (d) 0.8 m seismic isolation layer thickness.
Buildings 13 02584 g005
Figure 6. Peak acceleration–time history curve of an artificial ground motion record frame structure: (a) raft foundation and (b) strip foundation.
Buildings 13 02584 g006
Figure 7. Column height–peak curve of absolute displacement: (a) raft foundation and (b) strip foundation.
Buildings 13 02584 g007
Figure 8. Comparison of the time history curve of frame structure vertex acceleration using an artificial ground motion record with different acceleration peaks: (a) 0.1 g; (b) 0.2 g; (c) 0.4 g.
Buildings 13 02584 g008aBuildings 13 02584 g008b
Figure 9. Fourier spectrum comparison of different types of ground motion records: (a) Friuli (Italy); (b) San Fernando; (c) artificial ground motion record.
Buildings 13 02584 g009aBuildings 13 02584 g009b
Table 1. Material parameters.
MaterialDensity (kg/m3)Modulus of Elasticity (MPa)Poisson’s RatioDamping Ratio
Concrete250032,5000.20.05
Foundation soil1960109.870.260.05
Rubber-modified soil1460500.490.3
Steel reinforcement bar7850206,0000.30.04
Table 2. Project status table.
Project StatusType of
Foundation
Ground Motion RecordSeismic
Isolation Layer Thickness
Project
Status
Type of
Foundation
Ground
Motion Record
Seismic Isolation Layer Thickness
1Raft foundationFriuli0 m13Strip foundationFriuli0 m
2Raft foundationFriuli0.4 m14Strip foundationFriuli0.4 m
3Raft foundationFriuli0.6 m15Strip foundationFriuli0.6 m
4Raft foundationFriuli0.8 m16Strip foundationFriuli0.8 m
5Raft foundationSan Fernando0 m17Strip foundationSan Fernando0 m
6Raft foundationSan Fernando0.4 m18Strip foundationSan Fernando0.4 m
7Raft foundationSan Fernando0.6 m19Strip foundationSan Fernando0.6 m
8Raft foundationSan Fernando0.8 m20Strip foundationSan Fernando0.8 m
9Raft foundationArtificial ground motion record0 m21Strip foundationArtificial ground motion record0 m
10Raft foundationArtificial ground motion record 0.4 m22Strip foundationArtificial ground motion record0.4 m
11Raft foundationArtificial ground motion record0.6 m23Strip foundationArtificial ground motion record 0.6 m
12Raft foundationArtificial ground motion record0.8 m24Strip foundationArtificial ground motion record0.8 m
Table 3. Peak acceleration difference under the same isolation layer thickness and different foundation forms.
Seismic Isolation Layer ThicknessPeak Acceleration of Strip
Foundation (m/s2)
Peak Acceleration of Raft Foundation (m/s2)Reduction of Peak
Acceleration (%)
0 m3.263.240.6
0.4 m2.872.696.2
0.6 m2.542.328.6
0.8 m2.262.0310.1
Table 4. Maximum displacement difference between columns of different foundation forms with an isolation layer of the same thickness.
Seismic Isolation Layer ThicknessMaximum Displacement of Strip Foundation (m)Maximum Displacement of Raft Foundation (m)Maximum Displacement Difference (m)
0 m0.03740.03640.0010
0.4 m0.03320.03120.0020
0.6 m0.030.02660.0034
0.8 m0.02780.02380.0040
Table 5. Comparison of peak acceleration of the structure vertex.
Type of
Foundation
Peak Acceleration (m/s2)Reduction (%)Peak Acceleration (m/s2)Reduction (%)Peak Acceleration (m/s2)Reduction (%)
No Seismic Isolation Layer Thickness0.4 m
Seismic Isolation Layer Thickness
No Seismic Isolation Layer Thickness0.6 m
Seismic Isolation Layer Thickness
No Seismic
Isolation Layer Thickness
0.8 m
Seismic
Isolation Layer Thickness
Raft foundation4.87722.608946.54.87722.357751.654.87722.25453.78
Strip foundation4.92332.70745.014.92332.471249.84.92332.36751.92
Table 6. Maximum displacement angle of the observed column.
Displacement Angle of the Structure (%)
Type of FoundationNo Seismic Isolation Layer Thickness0.4 m Seismic
Isolation Layer Thickness
0.6 m Seismic
Isolation Layer Thickness
0.8 m Seismic
Isolation Layer Thickness
Raft foundation 0.610.4680.4230.415
Strip foundation0.620.4860.4340.428
Table 7. Comparison of peak acceleration of frame structures under different ground motion intensities.
Ground Motion Record IntensityPeak Acceleration of No Seismic
Isolation Layer Thickness (m/s2)
Peak Acceleration of 0.4 m Seismic
Isolation Layer Thickness (m/s2)
Reduction (%)
0.1 g3.242.6916.97
0.2 g4.87722.608946.5
0.4 g10.134.9651.03
Table 8. Maximum displacement of observation column.
Peak Acceleration of Ground Motion RecordMaximum Displacement of
Observation Columns in Structures without Isolation Layers (m)
Maximum Displacement of Observation Column for 0.4 m Isolation Layer Structure (m)Reduction (%)
0.1 g0.03640.031214.28
0.2 g0.04230.035615.83
0.4 g0.04850.040316.9
Table 9. Maximum shear stress of the observed column.
Peak Acceleration of Ground Motion Record Maximum Shear Stress of
Observed Column in Structures without Isolation Layers (Pa)
Maximum Shear Stress of
Observed Column with 0.4 m Isolation Layer Structure (Pa)
Reduction (%)
0.1 g22765216744.79
0.2 g266942234816.28
0.4 g322672654917.72
Disclaimer/Publisher’s Note: The statements, opinions and data contained in all publications are solely those of the individual author(s) and contributor(s) and not of MDPI and/or the editor(s). MDPI and/or the editor(s) disclaim responsibility for any injury to people or property resulting from any ideas, methods, instructions or products referred to in the content.

