Article

Verification of a Modeling Toolkit for the Design of Building Electrical Distribution Systems

by
Anay Waghale
*,
Shat Pratoomratana
,
Tianna-Kaye Woodstock
,
Karthikeya Devaprasad
and
Michael Poplawski
Pacific Northwest National Laboratory, 902 Battelle Boulevard, Richland, WA 99354, USA
*
Author to whom correspondence should be addressed.
Buildings 2023, 13(10), 2520; https://doi.org/10.3390/buildings13102520
Submission received: 2 September 2023 / Revised: 28 September 2023 / Accepted: 3 October 2023 / Published: 5 October 2023
(This article belongs to the Special Issue Building Performance Simulation)

Abstract

:
DC electrical distribution systems offer many potential advantages over their AC counterparts. They can facilitate easier integration with distributed energy resources, improve system energy efficiency by eliminating AC/DC converters at end-use devices (e.g., laptop chargers), and reduce installation material, time, and cost. However, DC electrical distribution systems present additional design considerations, largely resulting from potentially greater magnitude and variation in cable losses. Modeling and simulation are rarely used to design such systems. However, the greater dependency of DC system energy efficiency on design choices such as distribution voltages, architecture, and integration of PV and BESS suggests that modeling and simulation may be required. Such system performance analysis is currently not a standard practice, in part due to limited availability and validation of capable software tools. This paper characterizes the accuracy of a Modelica-based Building Electrical Efficiency Analysis Model (BEEAM) toolkit, as a precursor for validating its use to perform system performance analysis and inform design decisions. The study builds upon previous verification research by characterizing complete systems comprised of commercially available equipment, and providing a more detailed analysis of simulation results. Five lighting systems with varying electrical distribution architectures were designed using market-available equipment, installed in a laboratory environment, modeled using BEEAM, and simulated using three Modelica integrated development environments (IDEs). Simulated and measured results were compared to characterize toolkit accuracy. Initial results revealed that simulated performance was mostly within ±5% of measured system-level and device-level performance. While simulation results were not found to be dependent on the IDE, some Modelica compiler interoperability issues were identified. Although the BEEAM toolkit showed promise for the targeted use case, further work is needed to determine whether the demonstrated 5% accuracy is sufficient for making real-world design decisions, and for BEEAM to advance from an interesting research tool to one that can impact real-world building projects.

1. Introduction

Electricity generation has changed significantly due to the proliferation of renewable sources and distributed energy resources (DERs) [1]. While DERs can create new value and opportunities, they can also pose challenges when integrating with existing infrastructure. For example, electrical distribution in buildings today is mainly designed for alternating current (AC) service [2]. Therefore, the integration of DC-based DERs such as rooftop photovoltaic (PV) and battery energy storage systems (BESS) requires one or more inverters. On the other hand, the number of miscellaneous electrical loads (MELs) found in buildings—most of which fundamentally run on DC power—tends to increase every year [3]. Powering these DC loads has traditionally required AC/DC conversions at each end-use device [4], but with the integration of PV and BESS, these loads can be directly fed DC power [5]. DC distribution technologies can eliminate the need for AC/DC conversions, enabling simpler and potentially more energy-efficient systems. Examples of emerging “digital” DC distribution technologies that integrate DC power at different voltages and some form of data into a single cable include: multiple versions of Power over Ethernet (PoE) (one of which can deliver up to ~90 W at a max 57 VDC and network communication over a single cable) [6], multiple versions of Universal Serial Bus (USB) (one of which can deliver up to 240 W at 48 VDC and network communication over a single cable) [7], and emerging class 4 or “fault managed” DC technologies (e.g., Voltserver Digital Electricity), which can deliver up to 2 kW at 450 V [8]. However, deployment of these technologies in buildings’ electrical distribution systems remains limited to date.
AC distribution systems are typically not designed, but rather just installed with a focus on meeting safety codes. While there are a limited number of digital tools and workflows available for designing and analyzing the performance of electrical distribution systems, they are often focused on research needs and do not support DC distribution. Such tools are often ignored by existing practitioners, as the energy efficiency impacts of design considerations are minimized by rules of thumb and experience. However, the greater dependency of DC system energy efficiency on design choices (e.g., distribution architecture and voltage) suggests that modeling and simulation may be required to decide how to best meet design goals and owner/operator needs.
This paper explores the accuracy of one such tool, the Building Electrical Efficiency Analysis Model (BEEAM) toolkit [9], as a precursor for validating its use to perform system performance analysis and inform design decisions. This study builds upon previously published verification studies [10,11] in at least four ways: (a) it characterizes a realistic installation of commercially available end-use equipment, as opposed to equipment sub-components installed in a bench-top environment, and describes the verification test setup and method in sufficient detail for reproducing experimental results; (b) it characterizes end-use equipment that uses PoE technology, which continues to see growing market interest; (c) it analyzes simulation accuracy at the device level, in addition to the whole-system level; and (d) it analyzes simulation accuracy at varying load levels. Developed by the National Renewable Energy Laboratory (NREL) for the U.S. Department of Energy (DOE), BEEAM enables the modeling of electrical distribution systems for simulation in Modelica Integrated Development Environments (IDEs). This paper provides preliminary answers to the following research questions:
  • Do designers of hybrid AC/DC electrical distribution systems for buildings need a software tool to make design decisions that affect energy use and electrification?
  • What are the requirements for such a software tool?
  • Can the DOE/NREL BEEAM toolkit serve as the foundation for such a software tool?
  • How accurate are simulations of PoE lighting systems that use this toolkit, and is the accuracy suitable for expected design decisions?

2. Background

2.1. DC Distribution

Growing electric grid decarbonization and building electrification efforts have increased interest in DC technologies like PV, BESS, and electric vehicles (EVs), but the use of such systems in buildings remains limited [1]. It is possible that the advantages of integrating these inherently DC technologies with a building DC distribution system may lead to more deployment and impact [12]. DC distribution technologies and standards continue to increase power limits and support more types of building systems (e.g., LED lighting). Traditional AC distribution requires AC/DC converters for building equipment and MELs (e.g., phone chargers, laptop chargers, LED drivers), often leading to power losses [10,13,14,15]. A single AC to DC conversion stage can exhibit losses ranging from 4% to 15% of the input power [3]. Therefore, any elimination of an AC/DC conversion or replacement with a more efficient DC/DC conversion can have a significant effect on the energy efficiency of the overall system (i.e., the whole building). Integration of PV (which produces DC power) into an AC system requires conversion from DC to AC, distribution through the building AC distribution system, and finally conversion from AC back to DC at the end-use device. In contrast, implementing a DC distribution system in a building facilitates a direct connection between DC generation sources and DC loads, and either the complete elimination of some conversions, or the replacement of AC/DC conversions with typically more efficient DC/DC conversions. DC/DC converters that are required to scale the DC distribution voltage up or down to targeted DC load voltages typically have a power conversion efficiency in the range of 95% [5,16,17]. Numerous studies have explored the energy savings potential of DC distribution systems in laboratory or simulation environments [18,19] as well as commercial buildings [20,21,22,23]. However, reported savings vary significantly—ranging from 2% to 18% in the cited studies—highlighting the importance of design considerations. DC distribution has perhaps been most broadly adopted in data centers, where reported savings range from 7% to 28% for 380 VDC distribution voltages. The choice of DC distribution voltage is a significant design consideration and can have energy-efficiency impacts. For example, while high-voltage 380 VDC systems are currently common in data centers, low-voltage options like PoE, that distribute power at voltages between 44 VDC–57 VDC, are more common and possibly preferred in commercial buildings.

2.2. Power over Ethernet

Power over Ethernet (PoE) is perhaps the most prevalent “digital” DC technology that integrates the delivery of power and data over a single cable. It has many advantages over other technologies, including global standardization, inherent energy management, and device control. PoE standards published by IEEE describing maximum allowable power per port have gone through revisions from 2003 to 2018, increasing the limit from 15.4 W per port in IEEE 802.3af-2003 to the latest 90 W per port in IEEE 802.3bt-2018 [6,24,25]. In addition, guidance for limiting cable energy losses to 5% in PoE lighting applications has been standardized in ANSI C137.3-2017 and validated in previous research [26,27,28,29], which has enabled high power devices to be powered and networked using PoE. As a wired network communication technology, PoE offers high bandwidth, low latency, scalability, and robust communication to support any sensor type including audio and video. As PoE voltages are <60 VDC, PoE is categorized as class 2 power and typically does not require installation by a certified electrician or cables to be run in electrical conduit. Also, due to the plug and play nature of PoE combined with industry standard definitions of power levels, systems are relatively easy to reconfigure. For example, a PoE switch from any manufacturer can be used to power any PoE device, and an Ethernet cable plug can be removed from an AC-powered PoE switch and inserted into a BESS-powered PoE switch with no additional modifications or reconfigurations. Some industries have engaged and invested significantly in PoE, creating a market of more PoE powered devices (e.g., wireless access points, security devices, lighting).
PoE systems can be designed using various architectures (e.g., distributed, centralized, hybrid), with impacts to both system performance and cost. Nonetheless, despite its many features, PoE may not be the best technology for all buildings. Many building systems do not require the high performance that PoE offers, and it can be difficult to install and therefore expensive in retrofit applications. An energy consumption analysis and cost analysis may be required to determine the right architecture for the building.

2.3. System Architectures

Hybrid AC/DC electrical distribution systems can be designed in numerous ways [11]. Each design has its own pros and cons, and performance may vary based on the use case. This section describes three examples of distinct architectures—conventional AC, high-voltage DC, and low-voltage DC—and highlights different approaches to system architecture and their potential impacts on performance.

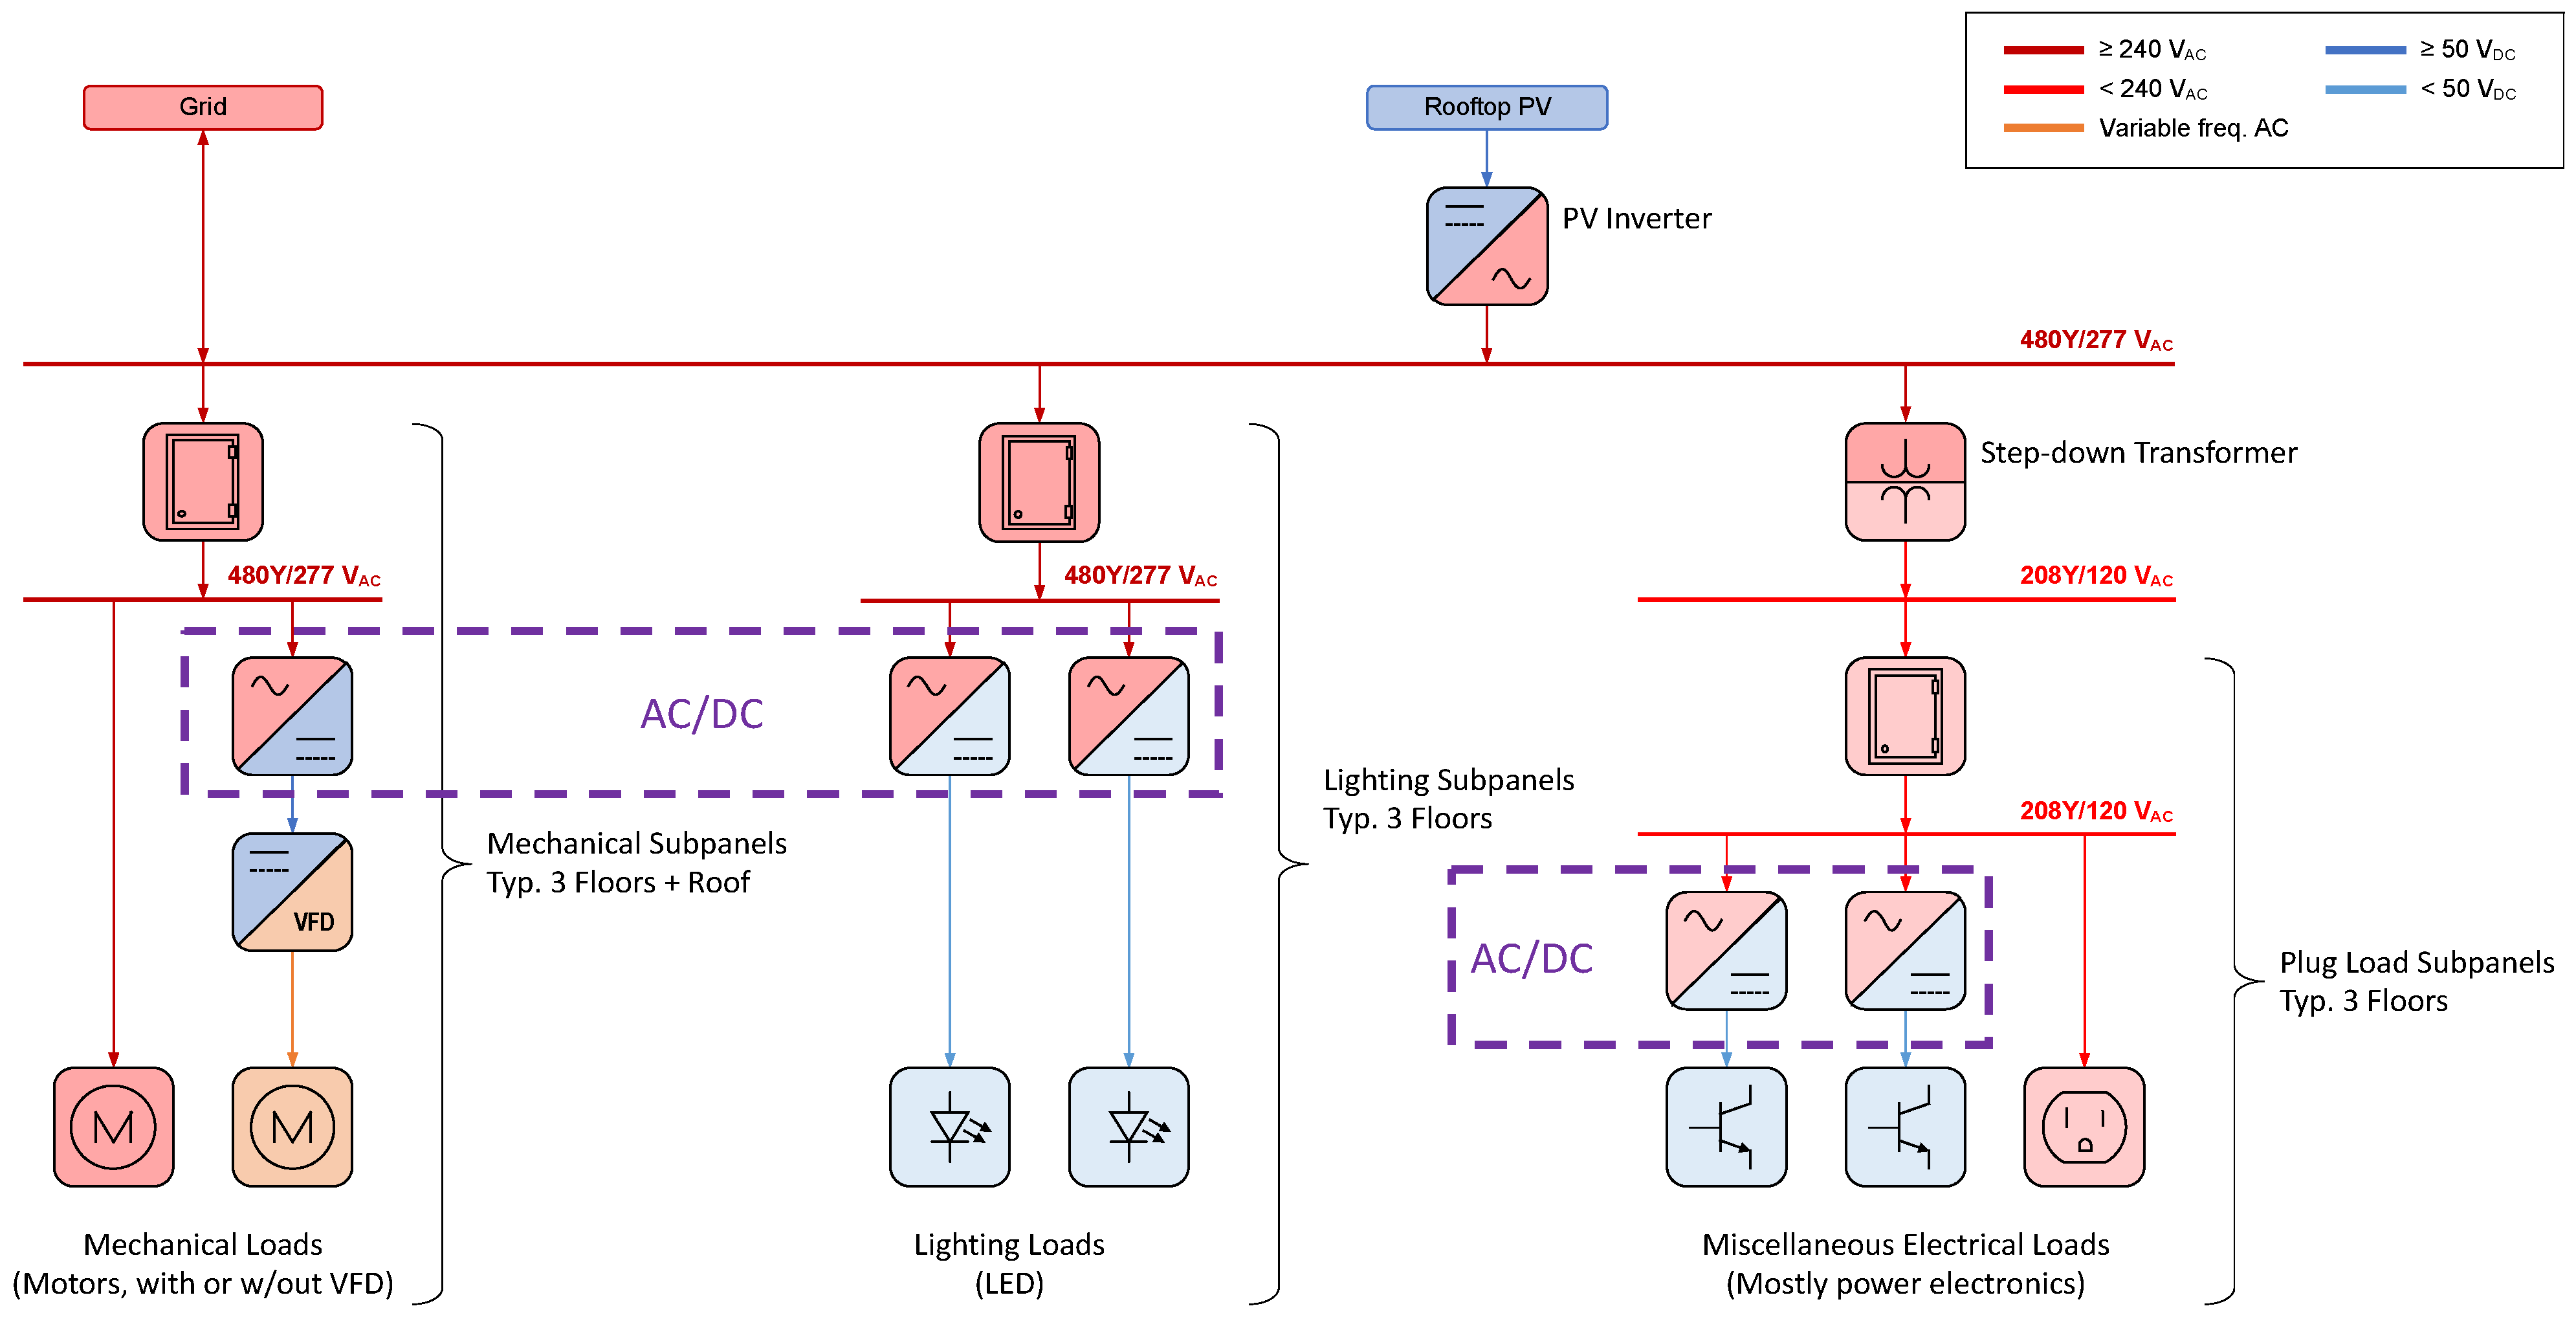
2.3.1. Conventional AC

Electrical power in buildings is mostly distributed as AC, as shown in Figure 1. The building receives conventional AC power (e.g., 480 VAC) from the electric grid at its service entrance. This AC power is either stepped down by a transformer to lower voltages (e.g., 120 VAC or 277 VAC), to power loads like LED lighting and MELs, or supplied directly to mechanical loads (e.g., motors). Integrating PV in this system requires a grid-tie inverter that converts DC power generated by the PV array to AC power.

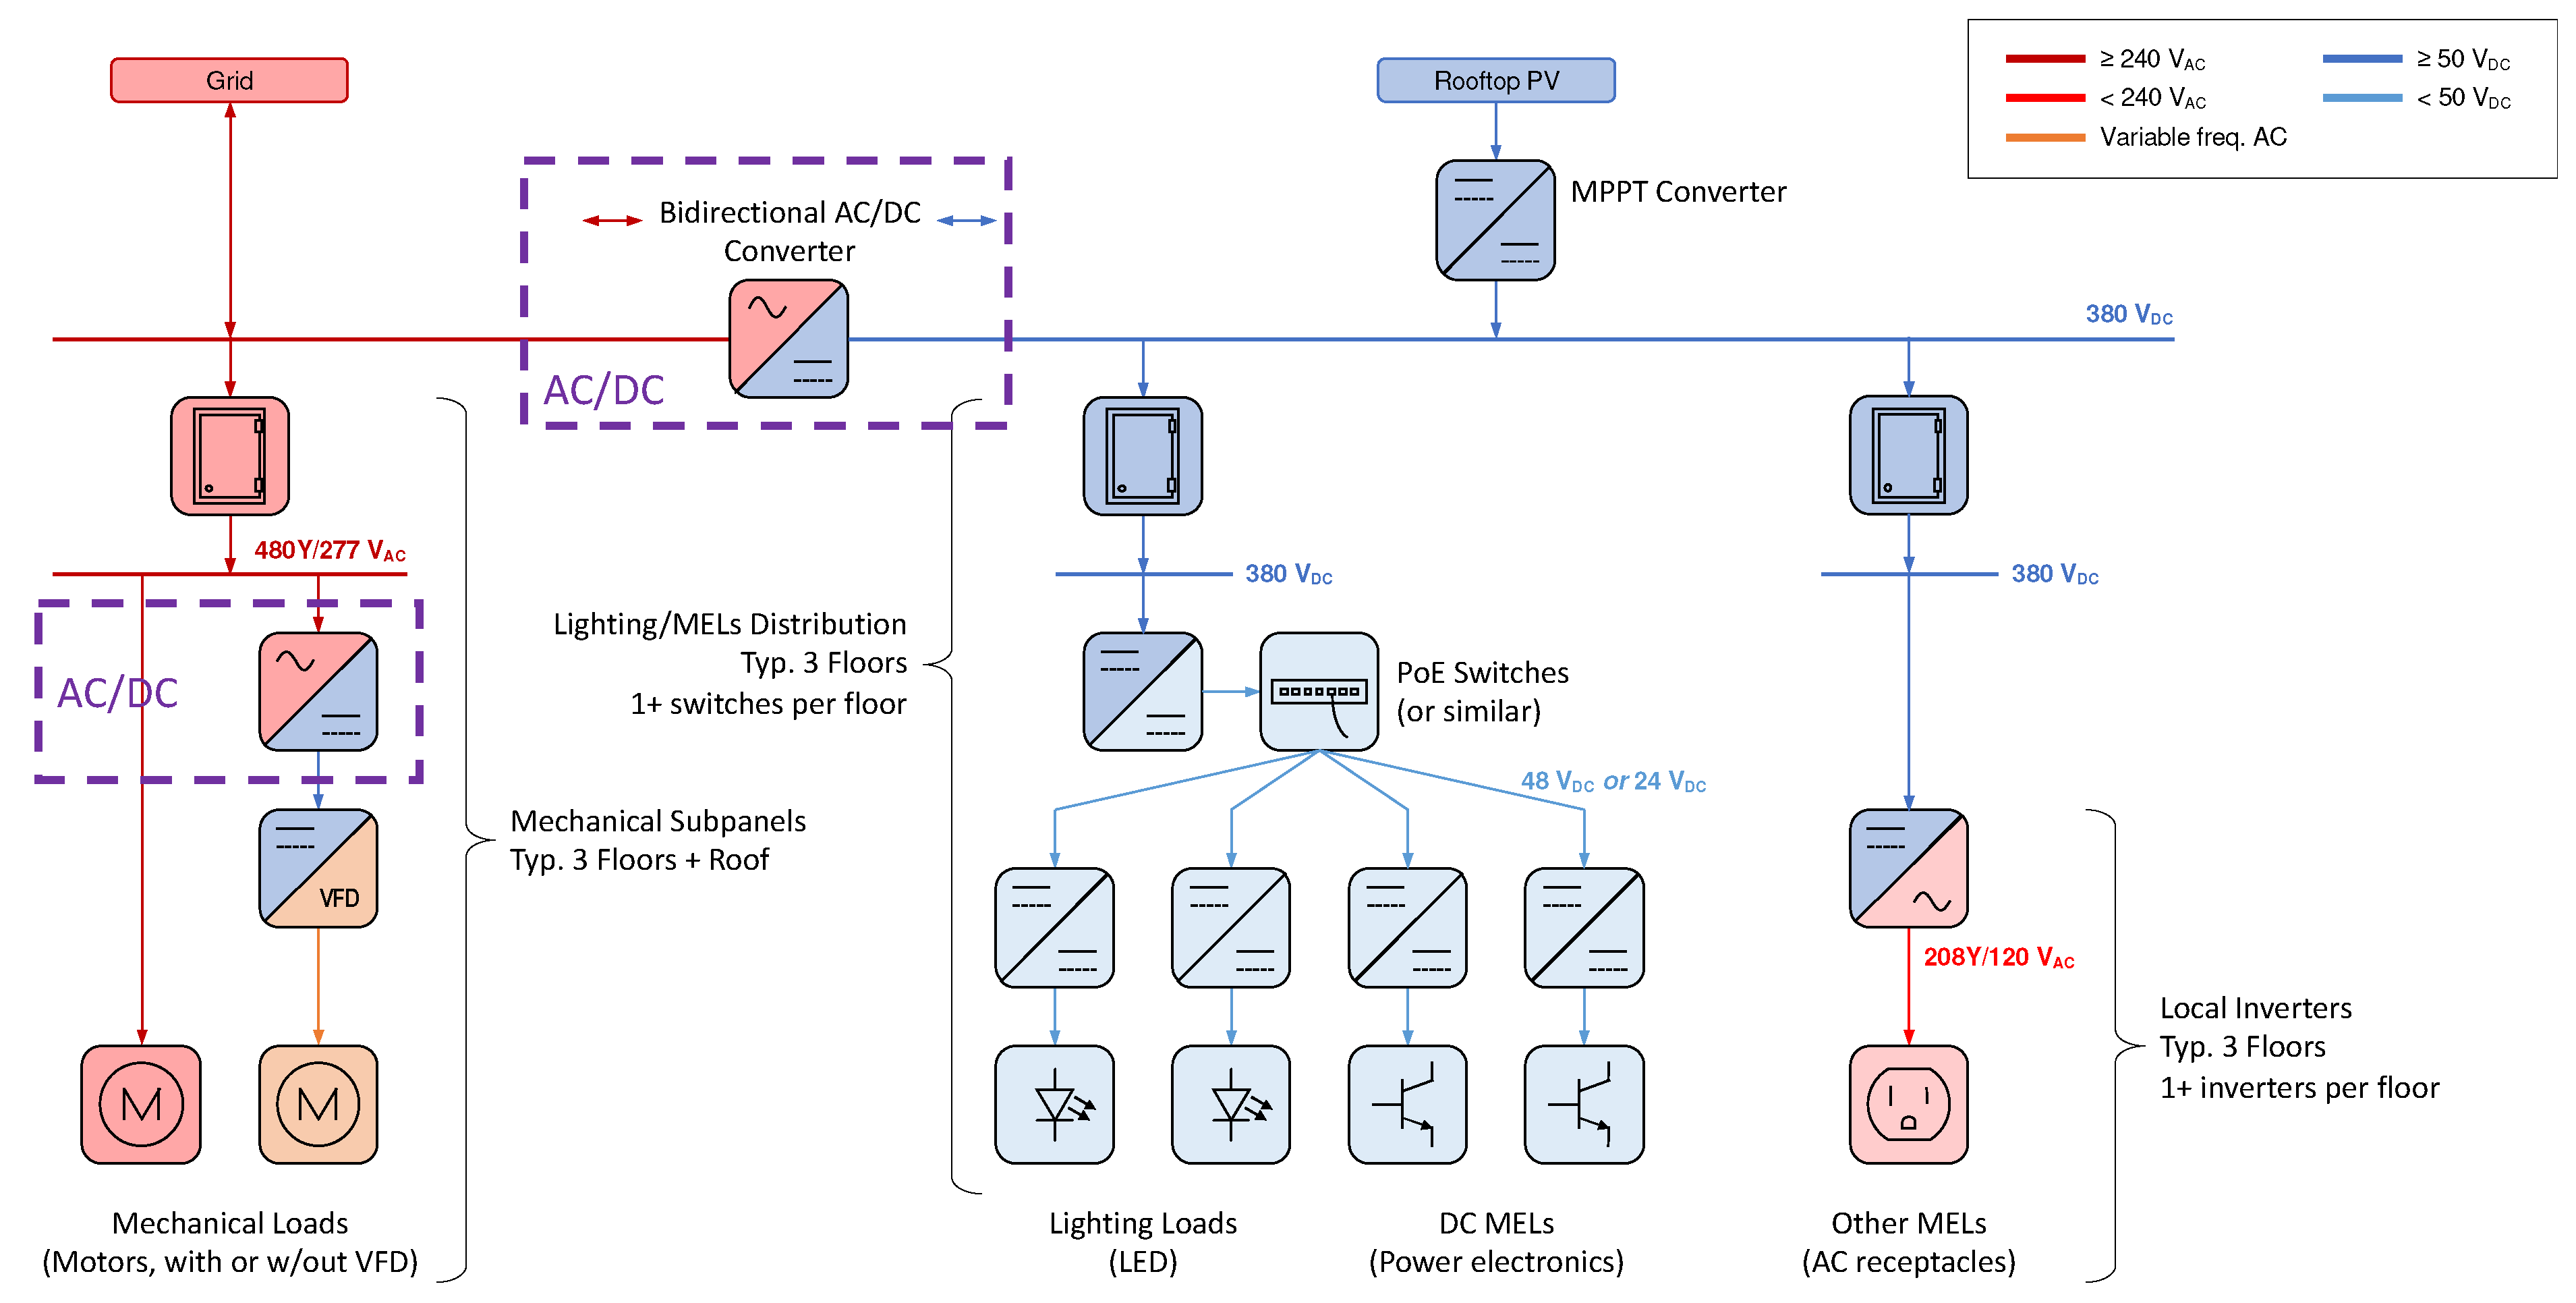
2.3.2. High-Voltage DC

A high-voltage DC (HVDC) distribution system replaces portions of the AC system with a DC distribution system by installing AC/DC converters that generate DC distribution buses in the building in a centralized manner. Typically, the converters are installed in a common location, perhaps one per building floor or zone (Figure 2). Each converter accepts the conventional AC (e.g., 480 VAC) from the electric grid and converts it into HVDC (e.g., 380 VDC). A DC/DC converter maybe required to step down the voltage based on end-use device requirements. Integrating PV in this system becomes easier and potentially more energy efficient by using a maximum power point tracking (MPPT) DC/DC converter instead of a grid-tie inverter. However, some inverters may still be required to convert the HVDC into 120 VAC to power MELs that only accept AC power.

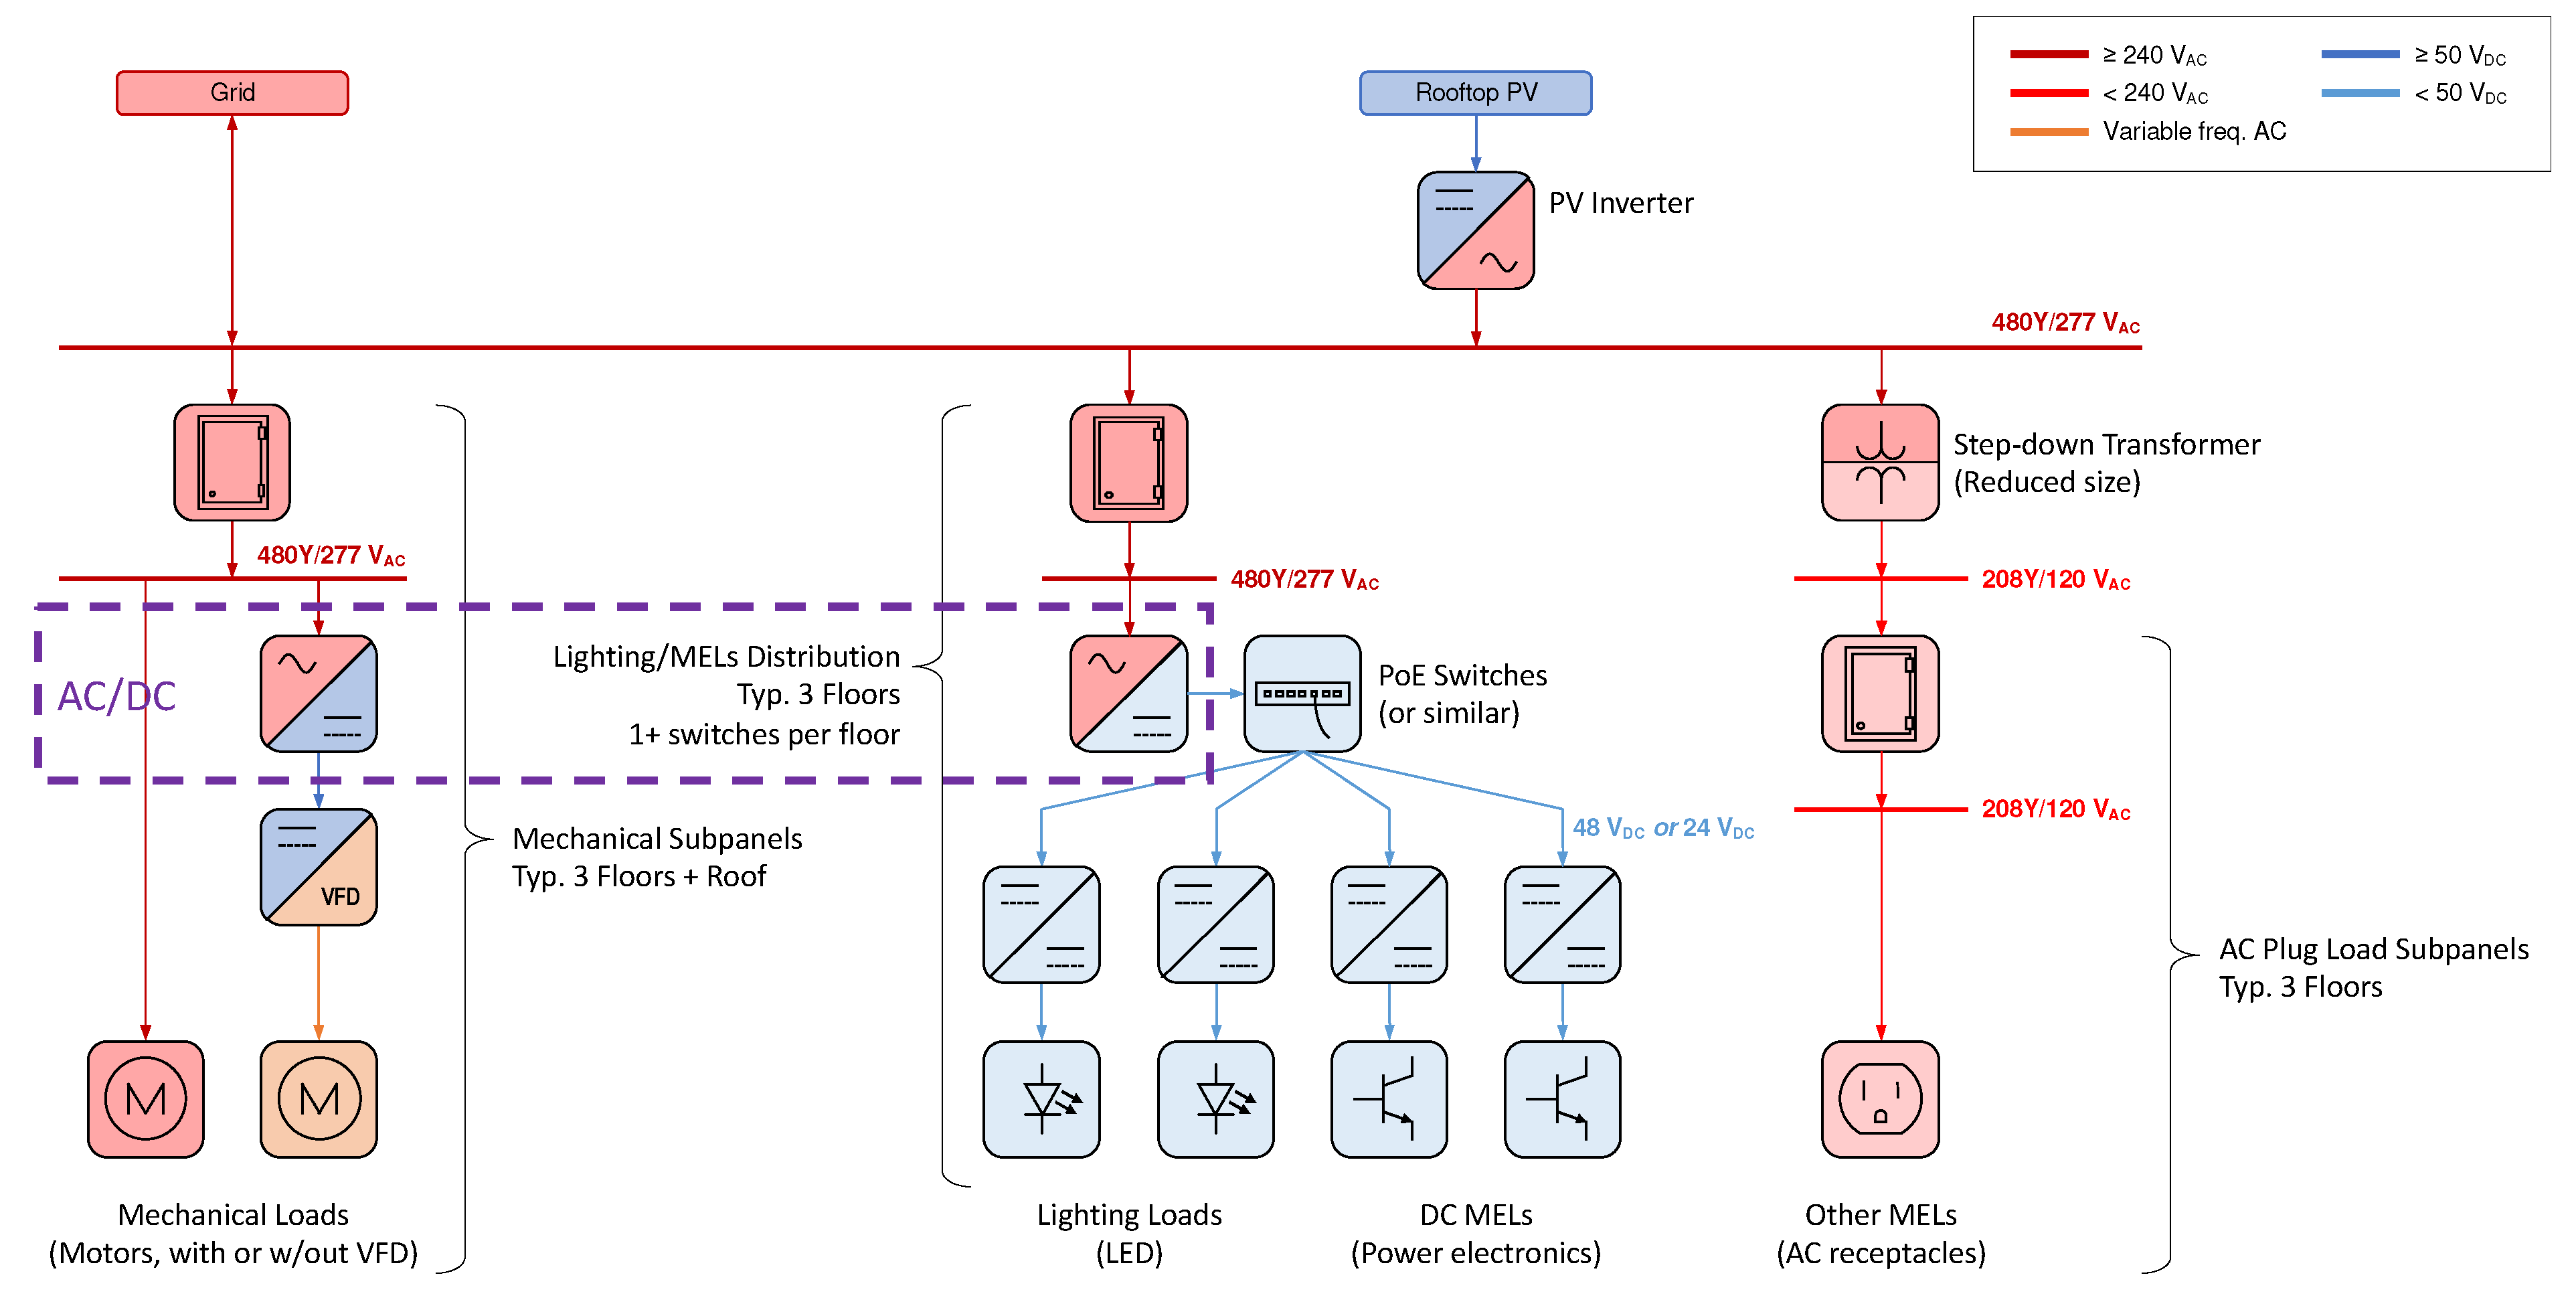
2.3.3. Low-Voltage DC

A low-voltage DC (LVDC) distribution system replaces portions of the AC system by installing AC/DC converters throughout the building in a distributed manner, which results in a greater number of lower-power converters (as compared to the high-voltage DC architecture) that are installed closer to the loads (Figure 3). These converters accept the conventional AC (e.g., 480 VAC) from the electric grid and convert it into LVDC (e.g., 50 VDC). As this architecture does not result in the creation of DC buses, the integration of PV still requires a grid-tie inverter that converts DC power generated by the PV array to AC power, to then be distributed to the AC/DC converters.

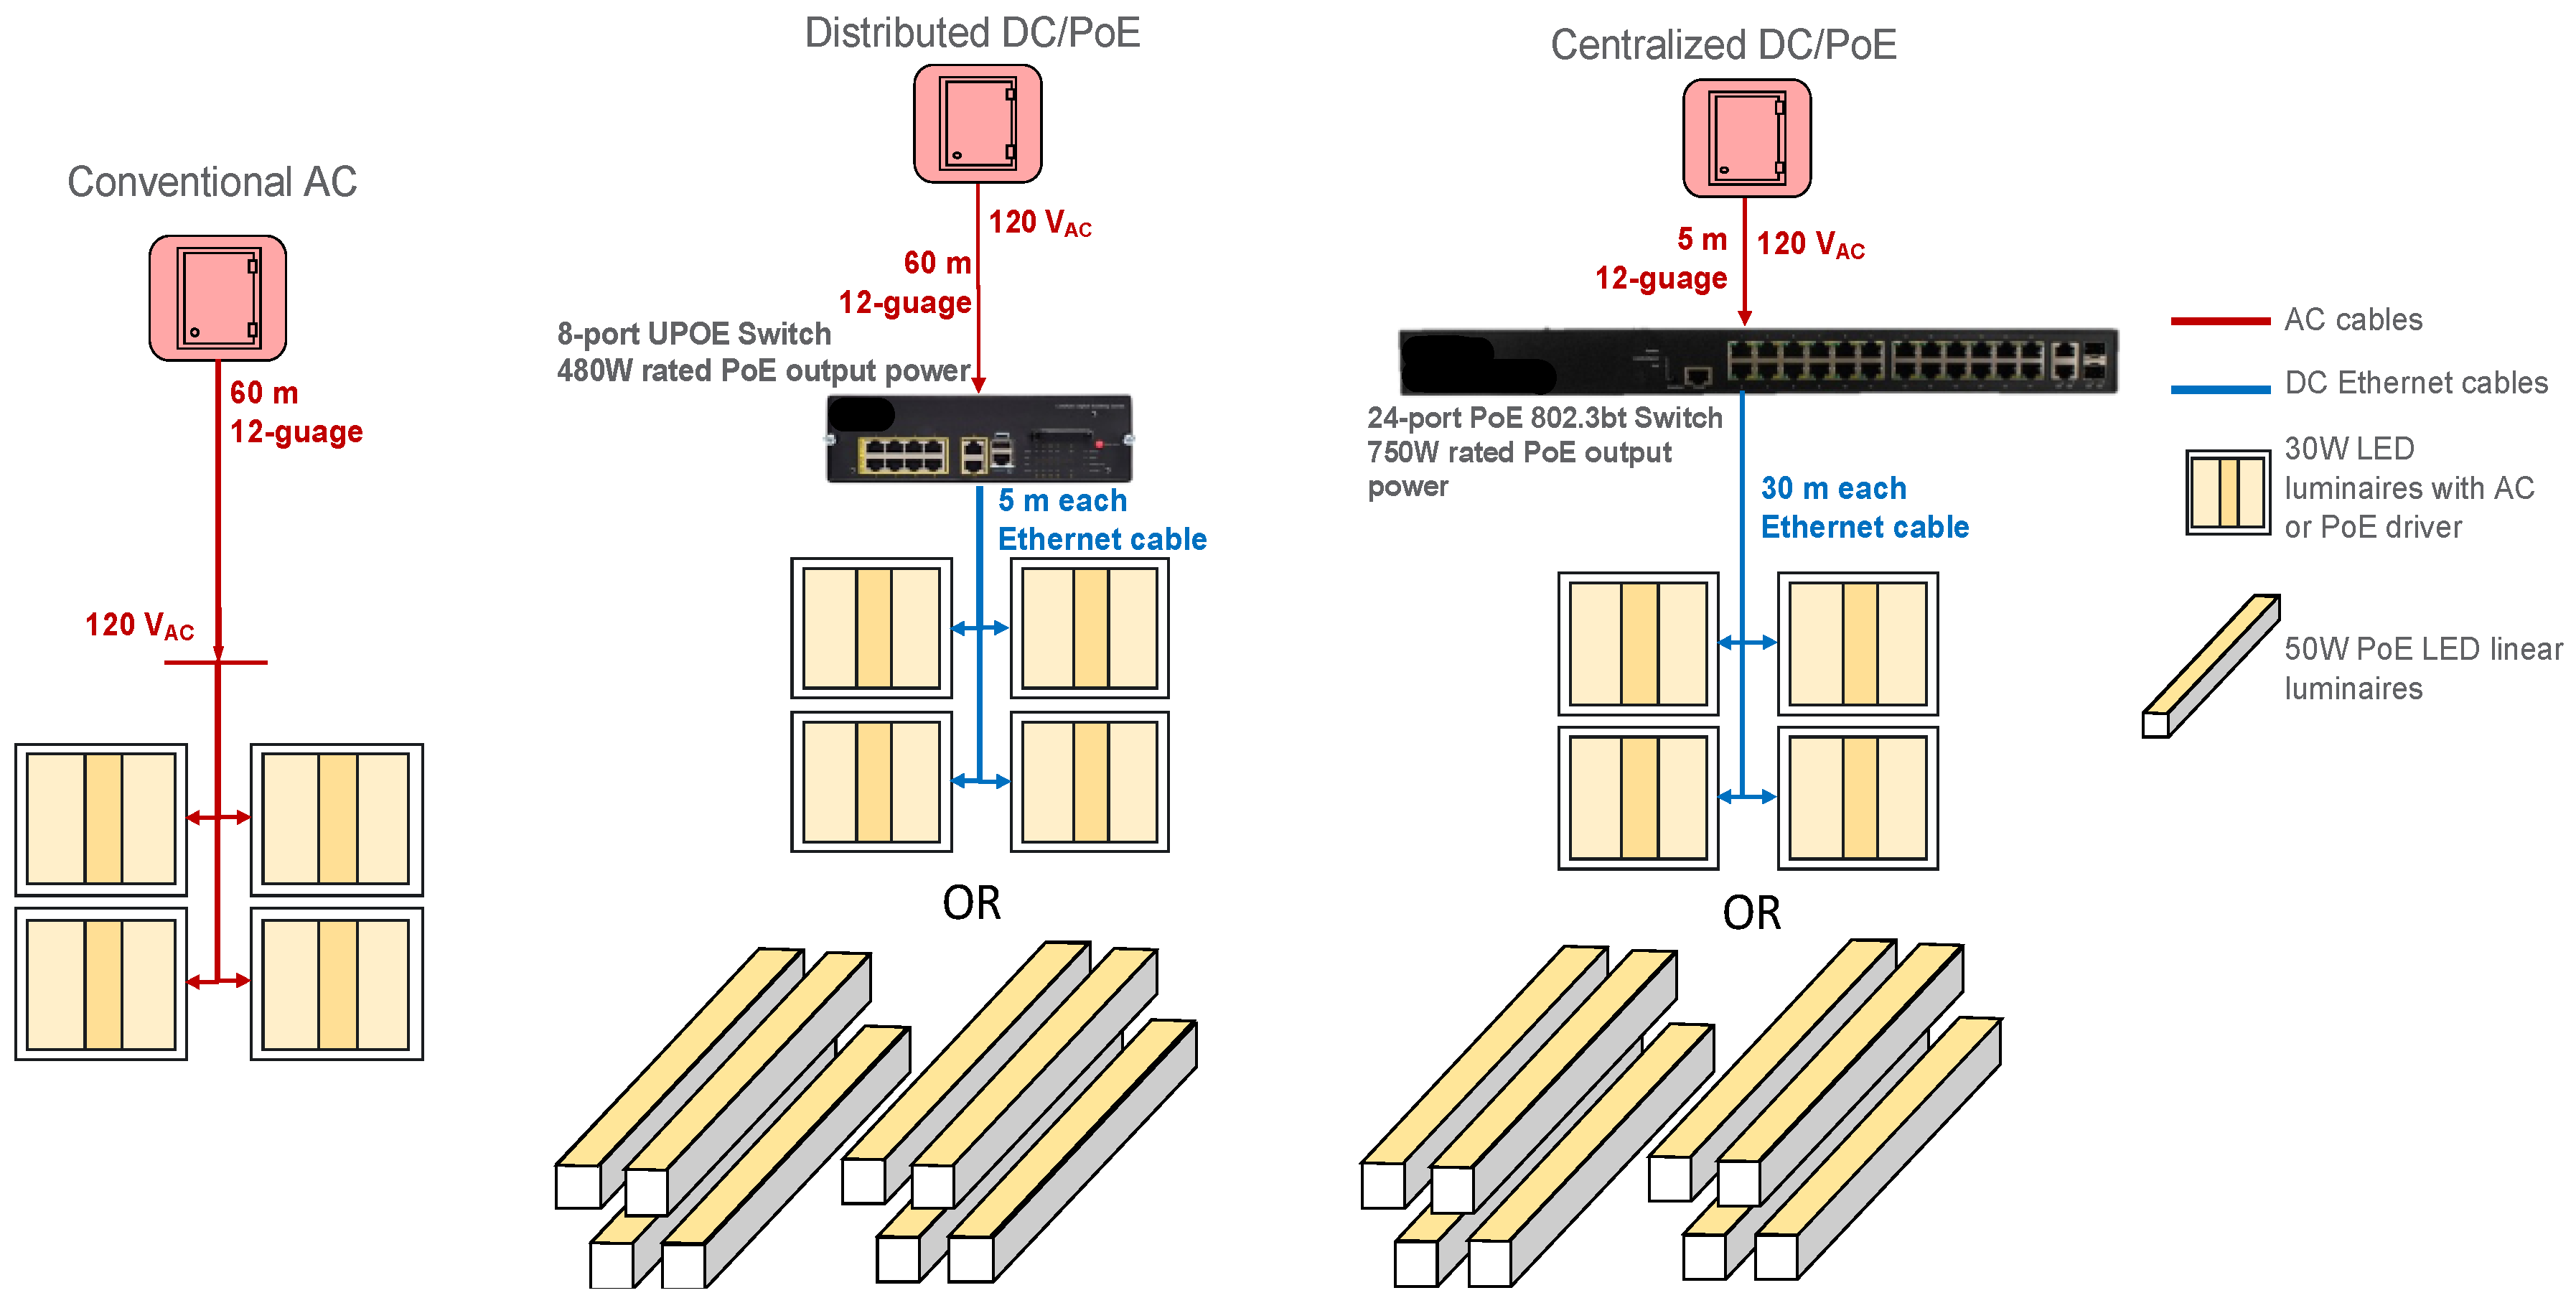
2.3.4. System Distribution Comparisons

Numerous research efforts have focused on simulating AC, DC, and hybrid AC/DC electrical distribution systems. These efforts have employed various approaches to load modeling, including energy balance methods, harmonic power flow methods, and time-domain methods. Energy balance methods model all equipment using simple efficiency curves, and track power from source to load by determining output power and power loss at each power conversion stage as a function of its input. One example of prior work that used this approach compared the energy impact of using AC vs. DC distribution to power DC (only) loads in residential buildings, and concluded (perhaps not surprisingly) that energy savings were sensitive to system architecture and AC/DC or DC/DC conversion efficiencies [15]. Another study that used an energy balance method modeled and simulated all equipment in Modelica, and concluded that a medium size office building using DC distribution used 12–18% less energy than a comparable AC building, and that DC distribution is most advantageous when a high DC distribution voltage is combined with large PV and battery systems [23]. Time-domain methods have also been used previously to simulate power flows and electromagnetic transients in building power electronic devices and systems [30,31]. While time-domain modeling often results in higher accuracy and can simulate transient effects, it also requires identification of a larger number of model parameters and longer simulation times [11]. Harmonic power flow analysis models electrical networks in the frequency domain as a linear network at each frequency of interest, and provides some of the higher-accuracy benefits of time-domain methods without the additional complexity required to accurately simulate transient effects. A study that explored the performance of all three modeling approaches reported the error in simulated system losses to be 2–7% for energy balance (efficiency curve) approaches, 4–8% for harmonic power flow approaches, and 1–6% for time-domain approaches. It also reported that the average computation time for simulating a model was 0.1 s for energy balance (efficiency curve) approaches, 0.4 s for harmonic power flow approaches, and 5.6 s for time-domain approaches [11].

2.4. BEEAM

In 2020, NREL developed the Building Electrical Efficiency Analysis Model (BEEAM), a Modelica toolkit that facilitates the modeling of building electrical systems in a graphical environment, and the simulation of their energy use via harmonic power flow analysis [10]. The harmonic power flow method was chosen to strike a reasonable balance between accuracy, computational time, and model development time for whole-building simulations [10] and allows for predicting harmonic content, simulation of highly unbalanced loading conditions, and scalability for simulating large networks [32,33]. The BEEAM toolkit comprises many families of models, each representing a specific type of equipment that is commonly found in building electrical systems. For example, there are model families for AC/DC converters, DC/DC converters, and transformers. Each model family has multiple instances that represent how that equipment might perform when used in a specific type of real-world device. For example, the AC/DC converter model family contains a unique model for an LED driver, and another model for a laptop power supply. Further, these toolkit models can be extended to more accurately simulate the performance of specific make/model equipment by performing laboratory measurements and using a model-creation script to convert the measured results into model parameters. Currently, the BEEAM toolkit can be used to model a wide variety of building electrical distribution topologies, including three-phase and single-phase AC systems, unipolar (2-wire) and bipolar (3-wire) DC systems, and hybrid AC/DC systems. BEEAM can provide granular estimates of power electronic converter losses even at partial loading conditions, and supports both balanced and unbalanced load conditions. In addition, BEEAM-based models may be paired with other standard Modelica libraries to develop more complex models or packaged up into a functional mockup unit (FMU) to enable co-simulation with other models. The ability of the BEEAM toolkit to model lighting systems powered by different electrical distribution architectures has been demonstrated in previous work [34]. The accuracy of the BEEAM toolkit has thus far not been extensively verified. The developers of the toolkit performed an uncertainty analysis that estimated that the maximum simulation error for system efficiency across different system architectures was 3% [10]. Notably, that analysis, as well as the initial modeling approach comparison study, reported errors only at the system level and not at the more granular device level.

3. Scope, Test Setup, and Method

This study extends the existing BEEAM verification efforts by characterizing a realistic installation of commercially available end-use PoE equipment, and analyzes simulation accuracy at the device level, and under varying device loading conditions. Three 4-luminaire and two 8-luminaire lighting systems comprising market-available products were designed, modeled using BEEAM, and simulated in multiple Modelica IDEs (Figure 4). The systems were also installed in a Pacific Northwest National Laboratory facility and characterized using laboratory instrumentation. The three 4-luminaire systems consisted of 30 W, 2′ × 2′ LED luminaires powered in three different architectures: conventional AC, distributed DC/PoE, and centralized DC/PoE. The two 8-luminaire systems consisted of 50 W, 8′ LED linear pendant luminaires powered in distributed DC/PoE and centralized DC/PoE architectures. Luminaires in the conventional AC system were powered by 120 VAC. In the distributed DC/PoE system, devices were powered from an 8-port proprietary UPOE switch installed close to the luminaires, via 5-m long ethernet cables. In the centralized DC/PoE system, devices were powered from a 24-port IEEE 802.3bt PoE switch installed in the IT closet, via 30-m long ethernet cables. The following subsections provide details about the test setup and method for (a) converter model creation and simulation, and (b) laboratory characterization.

3.1. Power Converter Models and Simulation

Models for the five lighting systems were created by configuring BEEAM toolkit elements to represent each of the lighting system components (i.e., PoE switch, AC LED driver, PoE LED driver, Ethernet cable). These component-specific models were created using harmonic power flow data generated by characterizing the input power requirements of the component over a range of load levels. The characterization data were processed using a model generation script in the BEEAM library. The test setup for generating the harmonic power flow data consisted of a calibrated AC power analyzer, DC power meter, programmable PoE power sourcing equipment (PSE), a programmable PoE powered device (PD), and an Ethernet cable tester. A Python script was written to control and monitor the programmable PSE (source), programmable PD (load), and calibrated AC power analyzer. Table 1 provides specifications for each piece of equipment.
To create BEEAM models for the PoE switches, input parameters (i.e., AC input voltage, current, and power) at different harmonics were monitored by the AC power analyzer at different load levels set by the PoE programmable PD. A Python script was used to communicate with the programmable PD and power analyzer to establish specific test conditions. Eight ports on both PoE switches were tested to fully load the power supply of the switch at 100% load condition. Characterization data were collected for 21 test conditions by varying the load on all ports under test in 10% increments from 0% to 100% and back to 0%. The same 21 conditions were also applied to a single port to get characterization data at low power supply loading levels. According to the PoE switch manufacturer literature, a given PoE port is considered fully loaded at 60 W in the case of the 8-port UPOE switch, and 90 W in the case of the 24-port 802.3bt compliant switch.
To create a BEEAM model for the PoE LED driver, input parameters (i.e., DC voltage, current, and power) were monitored by the PoE programmable PD and output parameters (i.e., DC voltage, current, and power) were monitored by the DC meter. A 30 W, 2′ × 2′ LED luminaire was used as the LED driver load, and characterization data were collected over the same 21 load conditions.
To create a BEEAM model for the AC LED driver, input parameters (i.e., AC input voltage, current, and power) at different harmonics were monitored by the AC power analyzer and output parameters (i.e., DC voltage, current, and power) were monitored by the DC meter. The same 30 W, 2′ × 2′ LED luminaire was used as the LED driver load, and characterization data were collected over the same 21 load conditions.
Cables were modeled simply by their electrical resistance. The resistance of the two PoE cable lengths (5 m and 30 m) was measured using an Ethernet cable tester.
The five lighting systems that were modeled using the BEEAM toolkit were simulated in Modelica IDEs. The system equations used to describe the various components are in a steady-state form, with no separate equations for transient operation. This makes them compatible with most Modelica IDEs including Dymola [35], Modelon Impact [36], and OpenModelica [37]. Each lighting system model was simulated in these three Modelica IDEs for 24 h using a fixed lighting schedule (Figure 5) and device-level and system-level power losses were extracted from the simulation results.

3.2. Laboratory Characterization
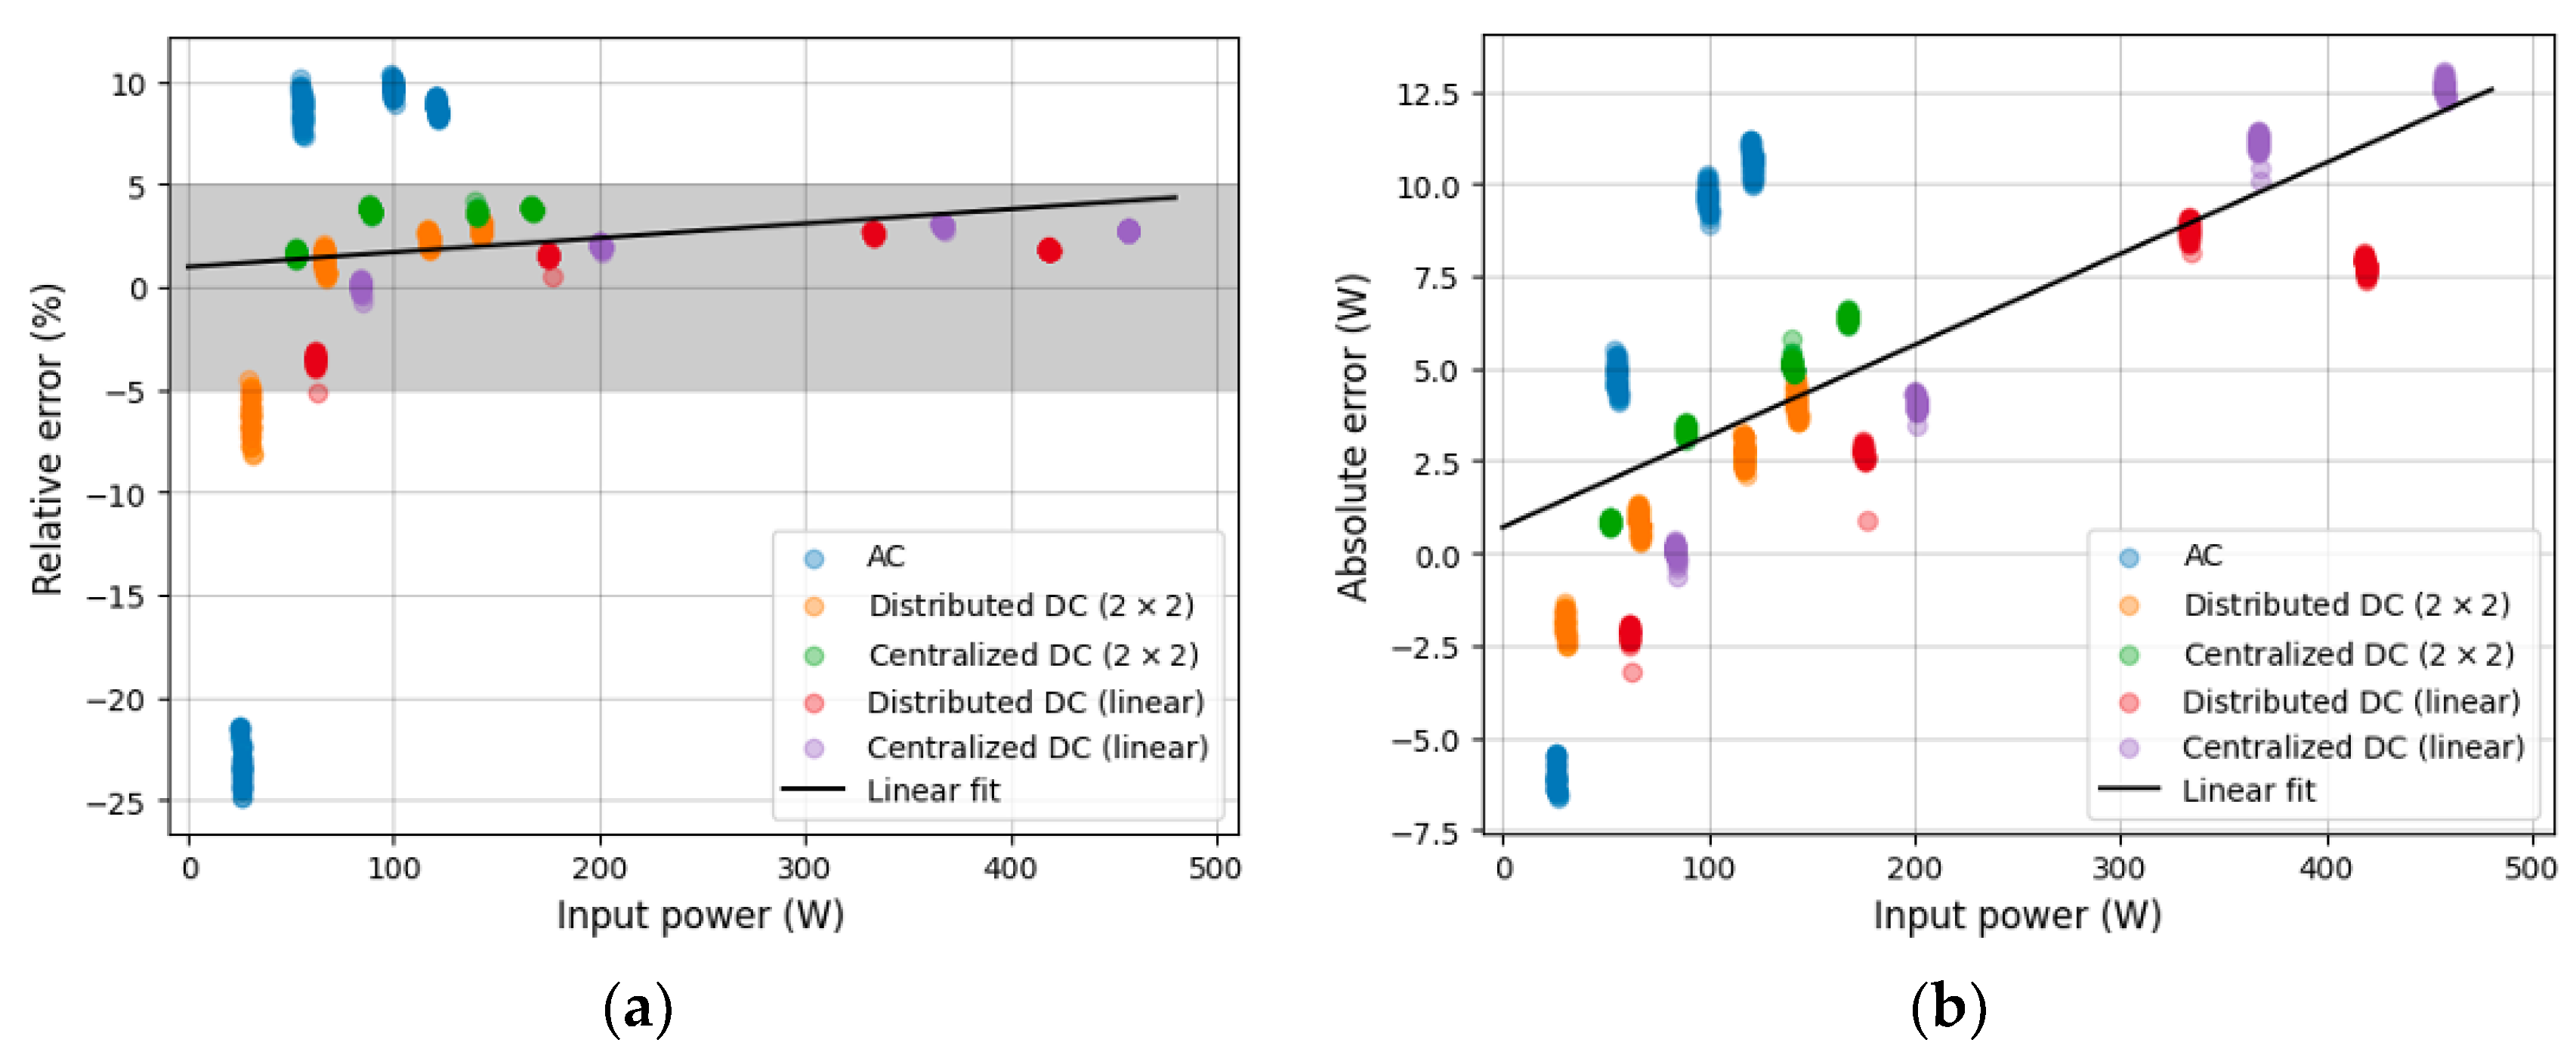
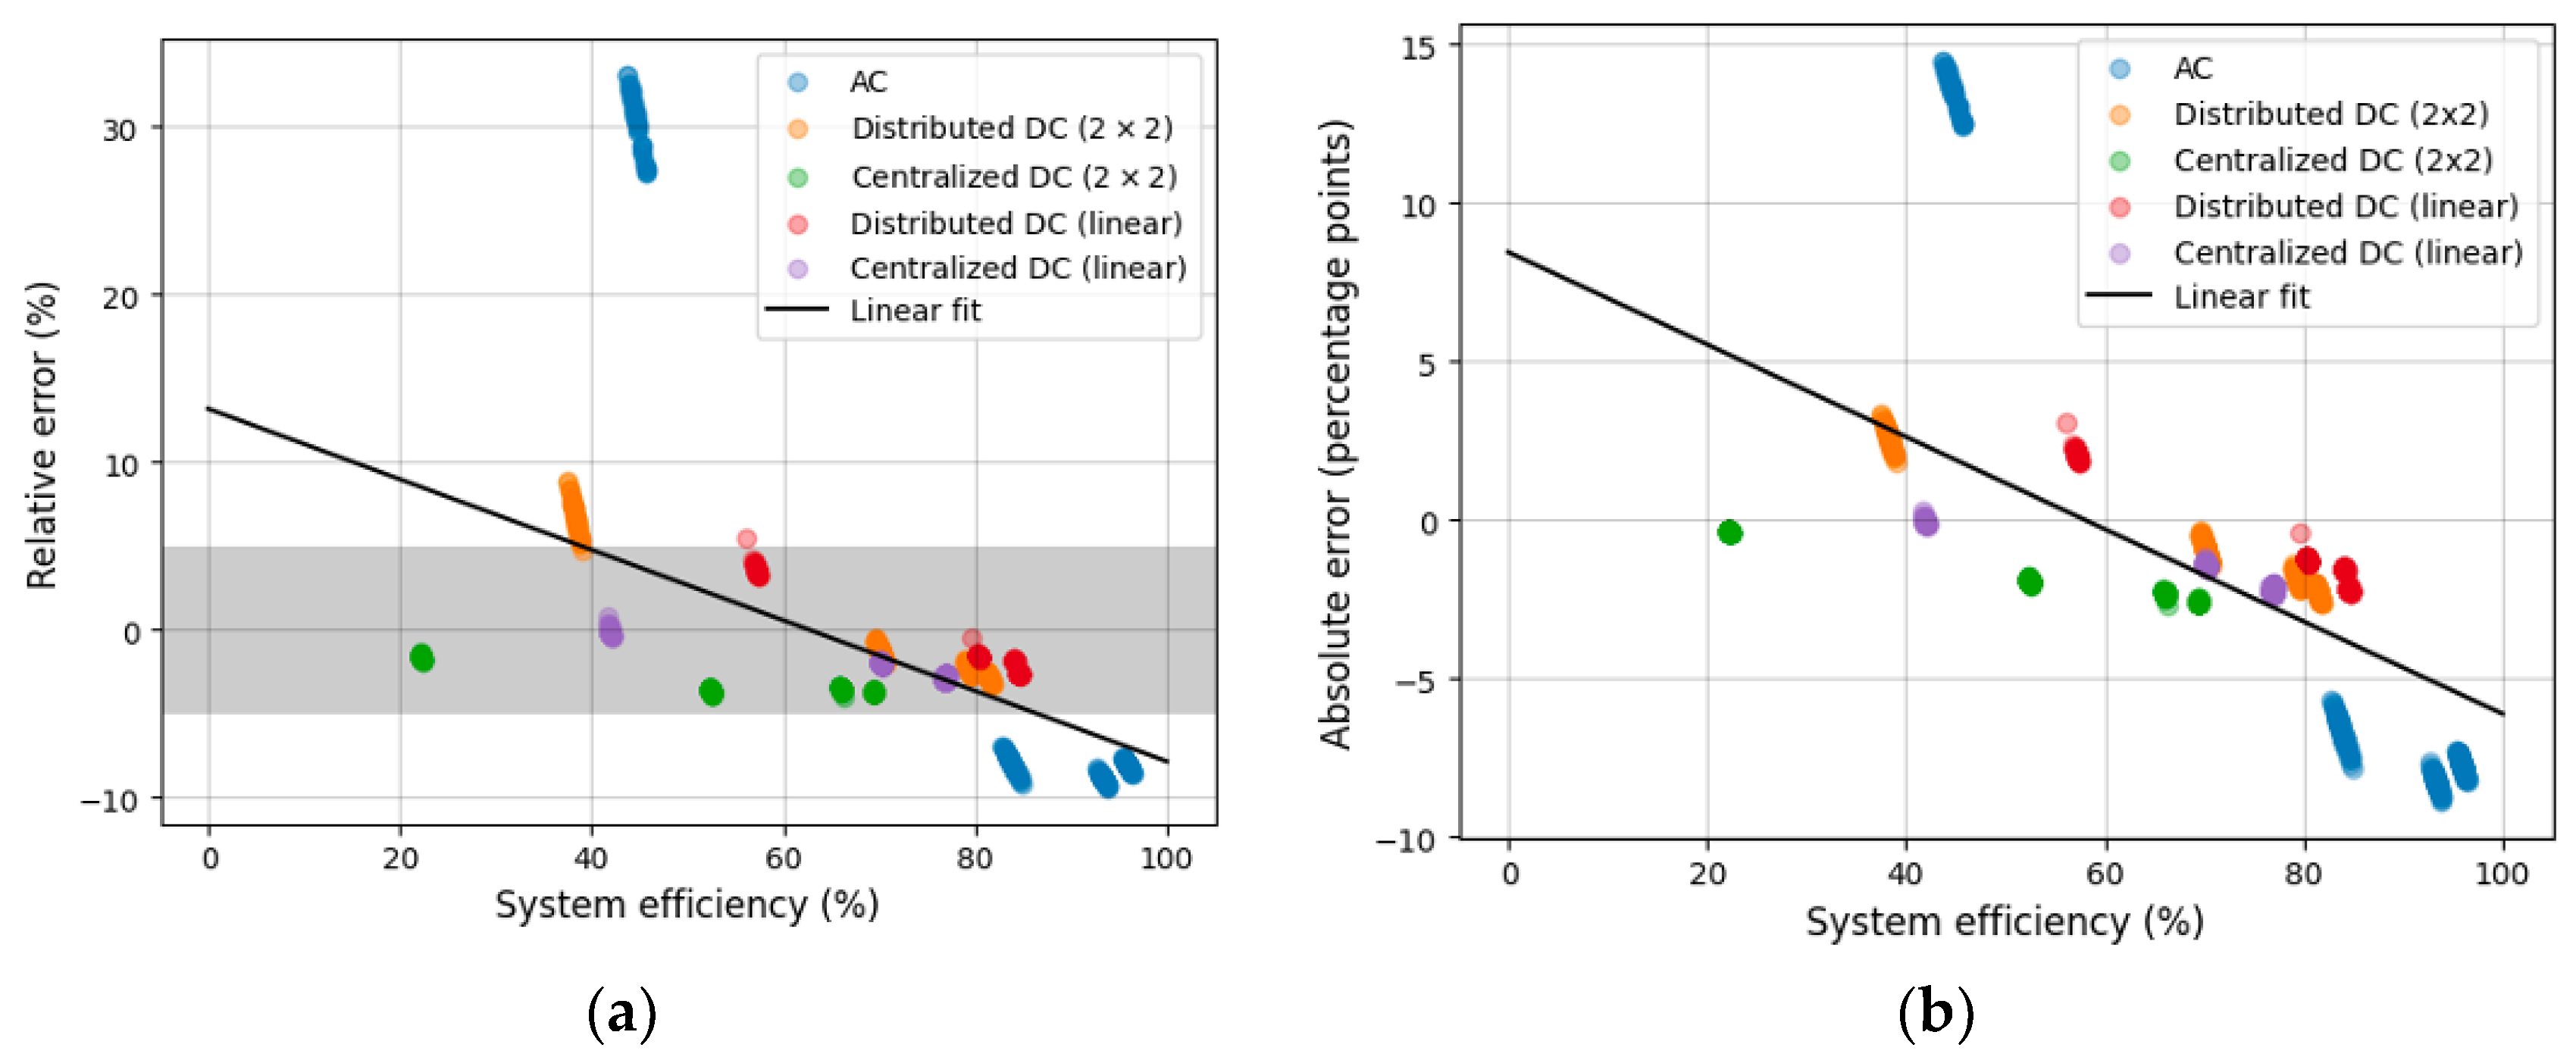
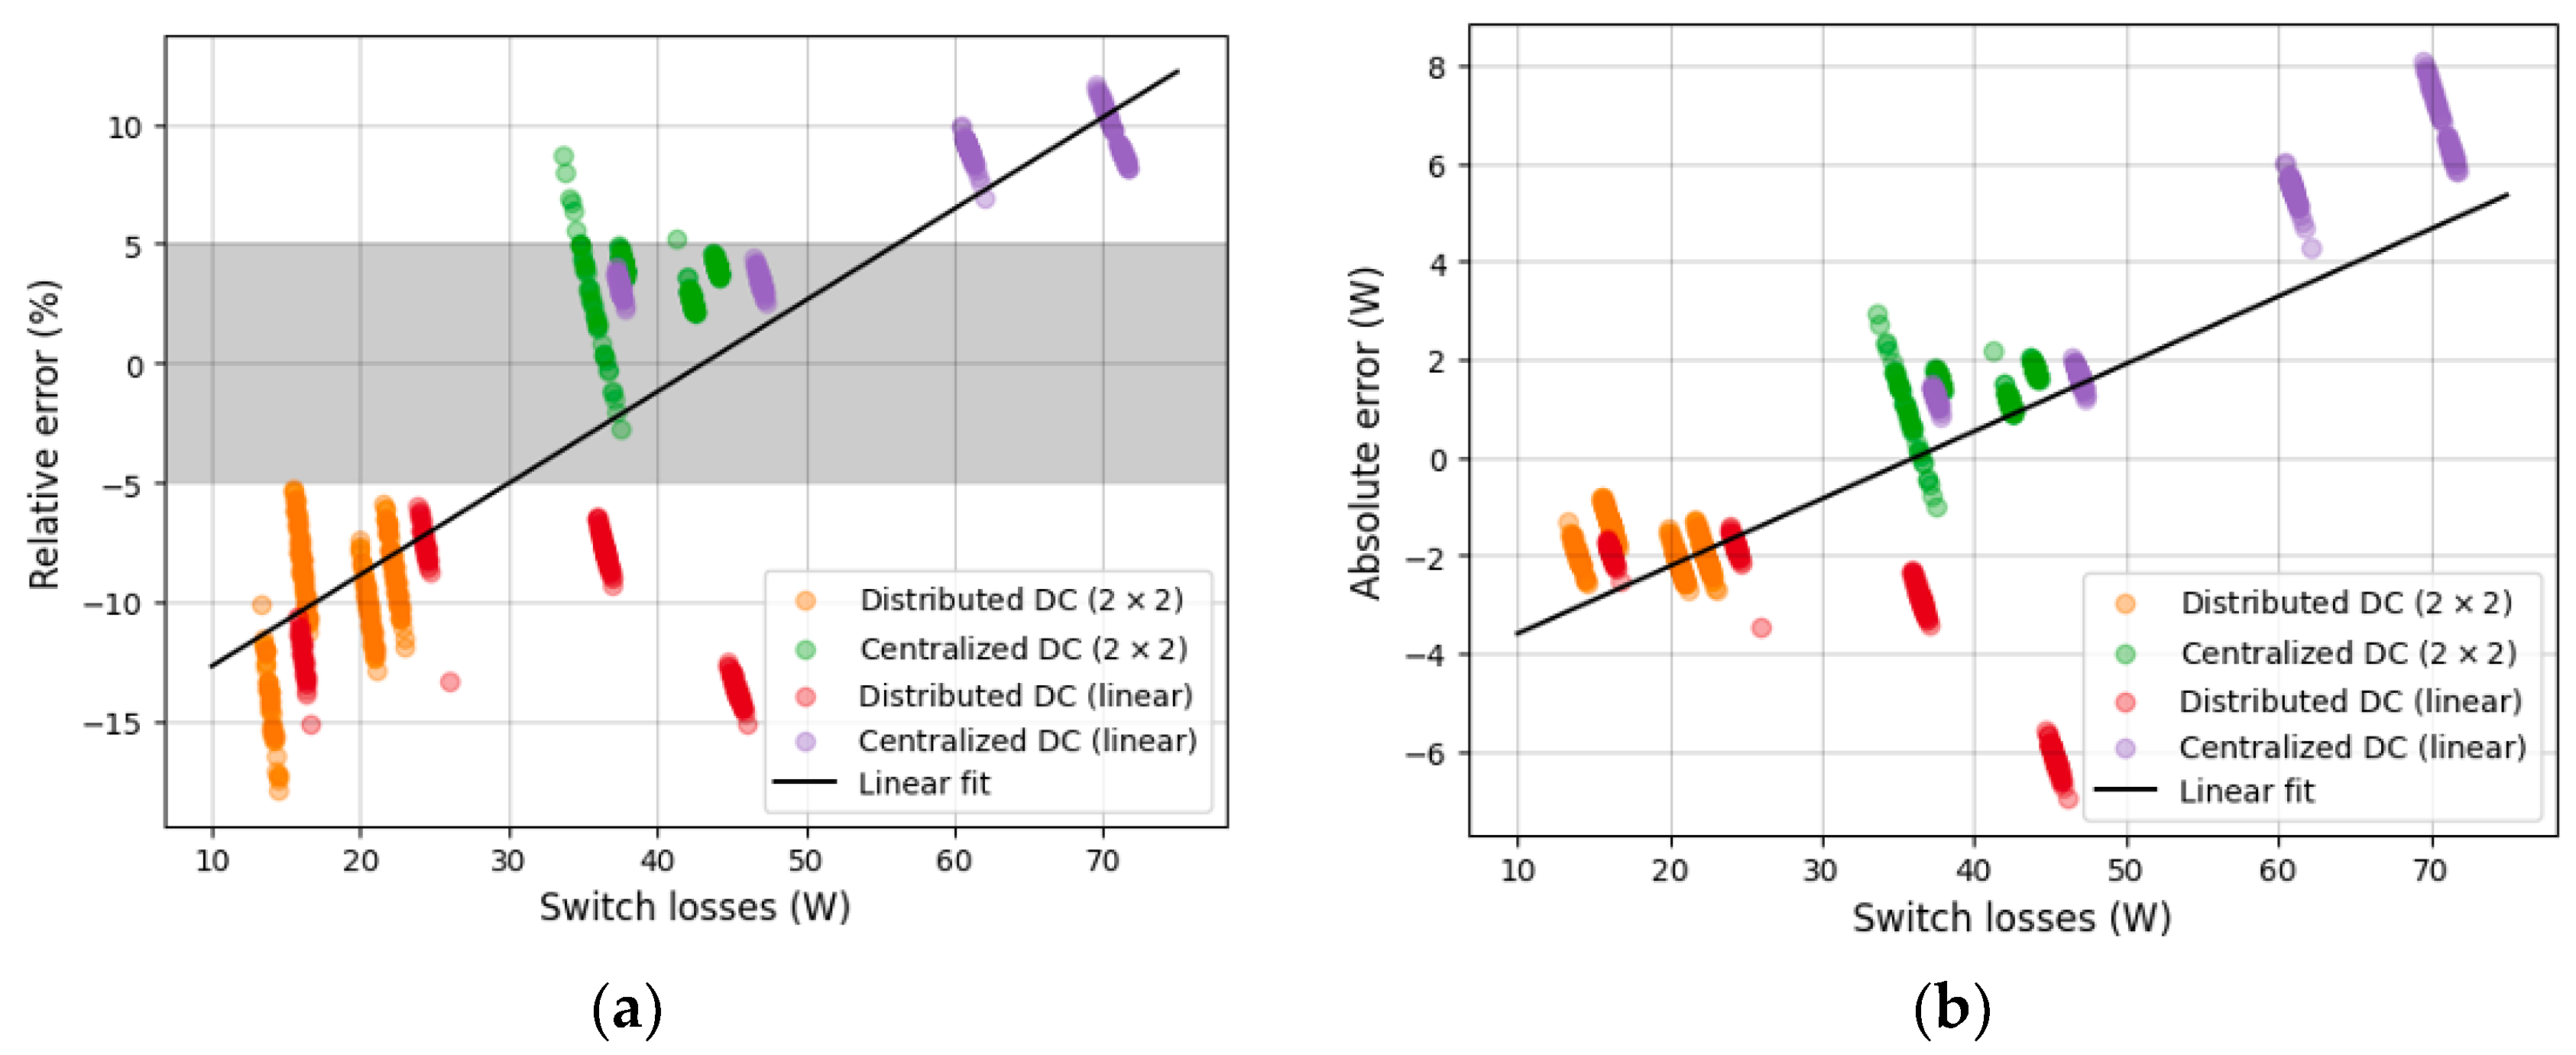
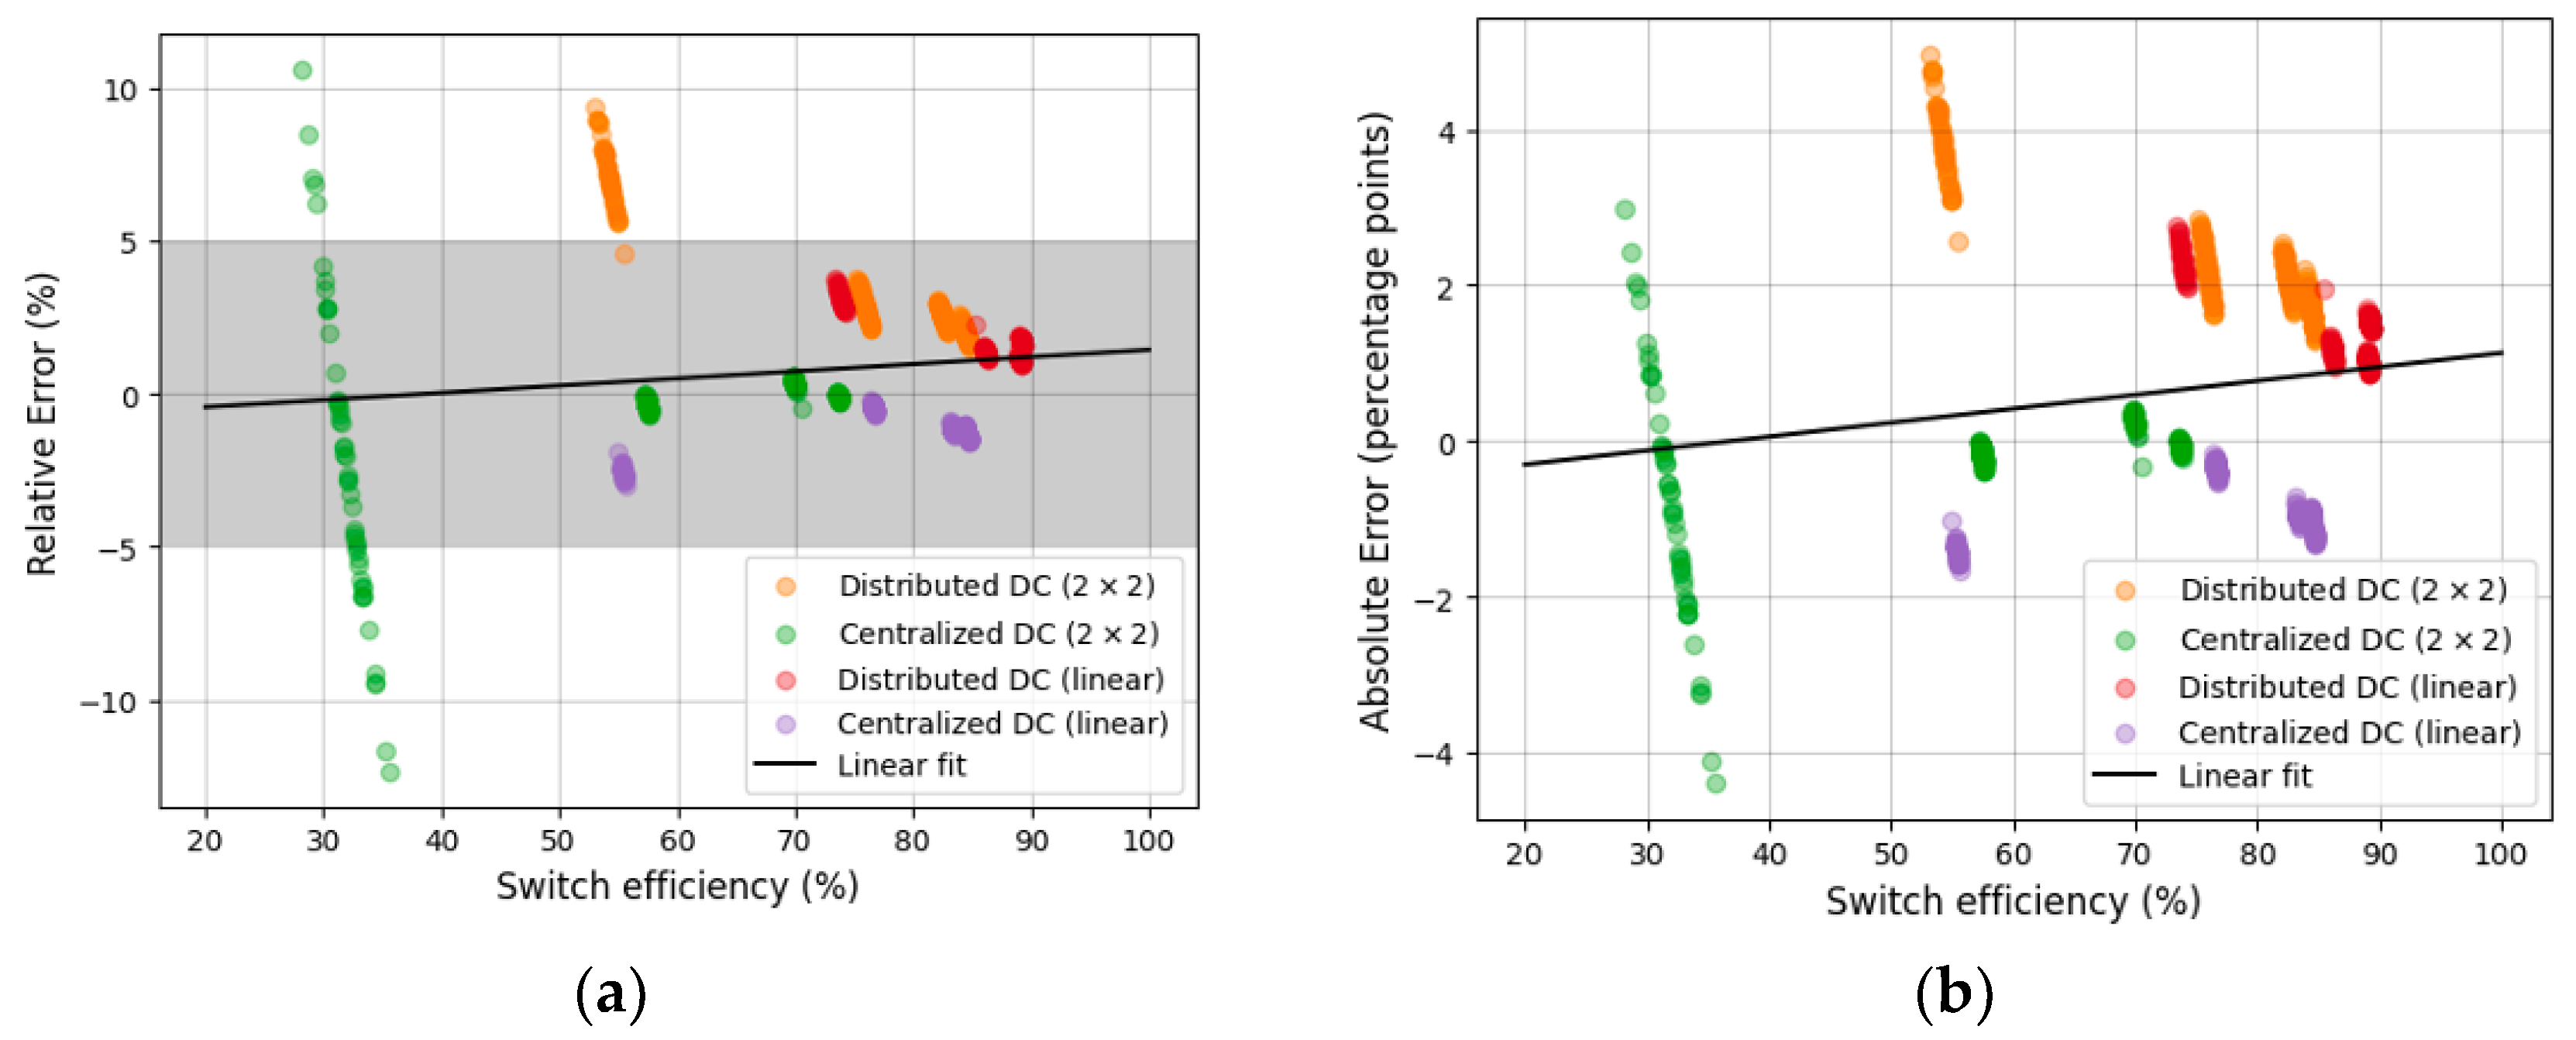
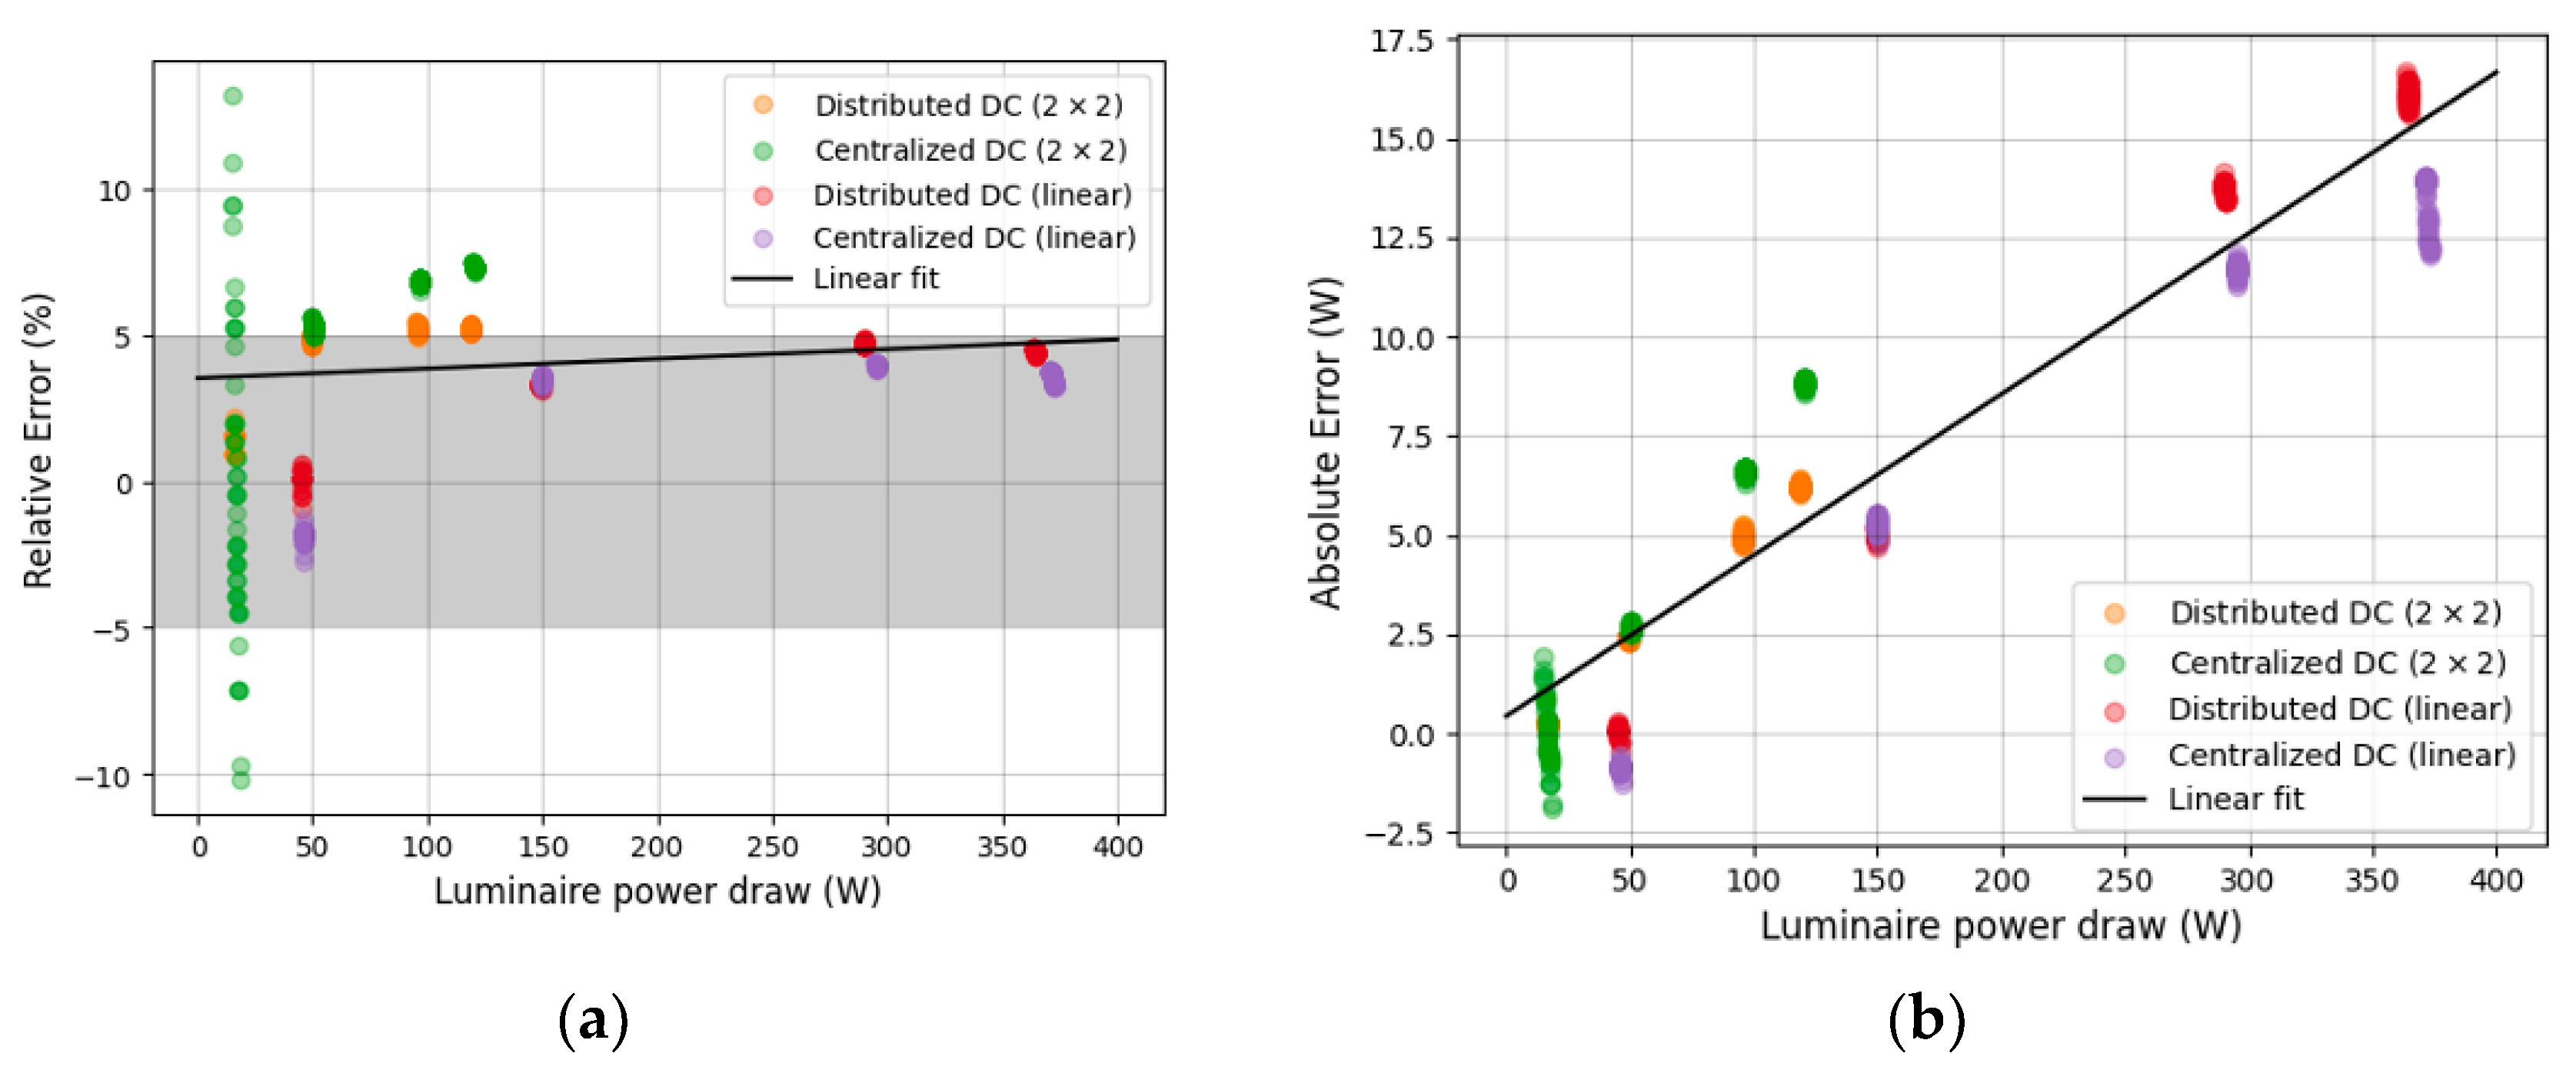
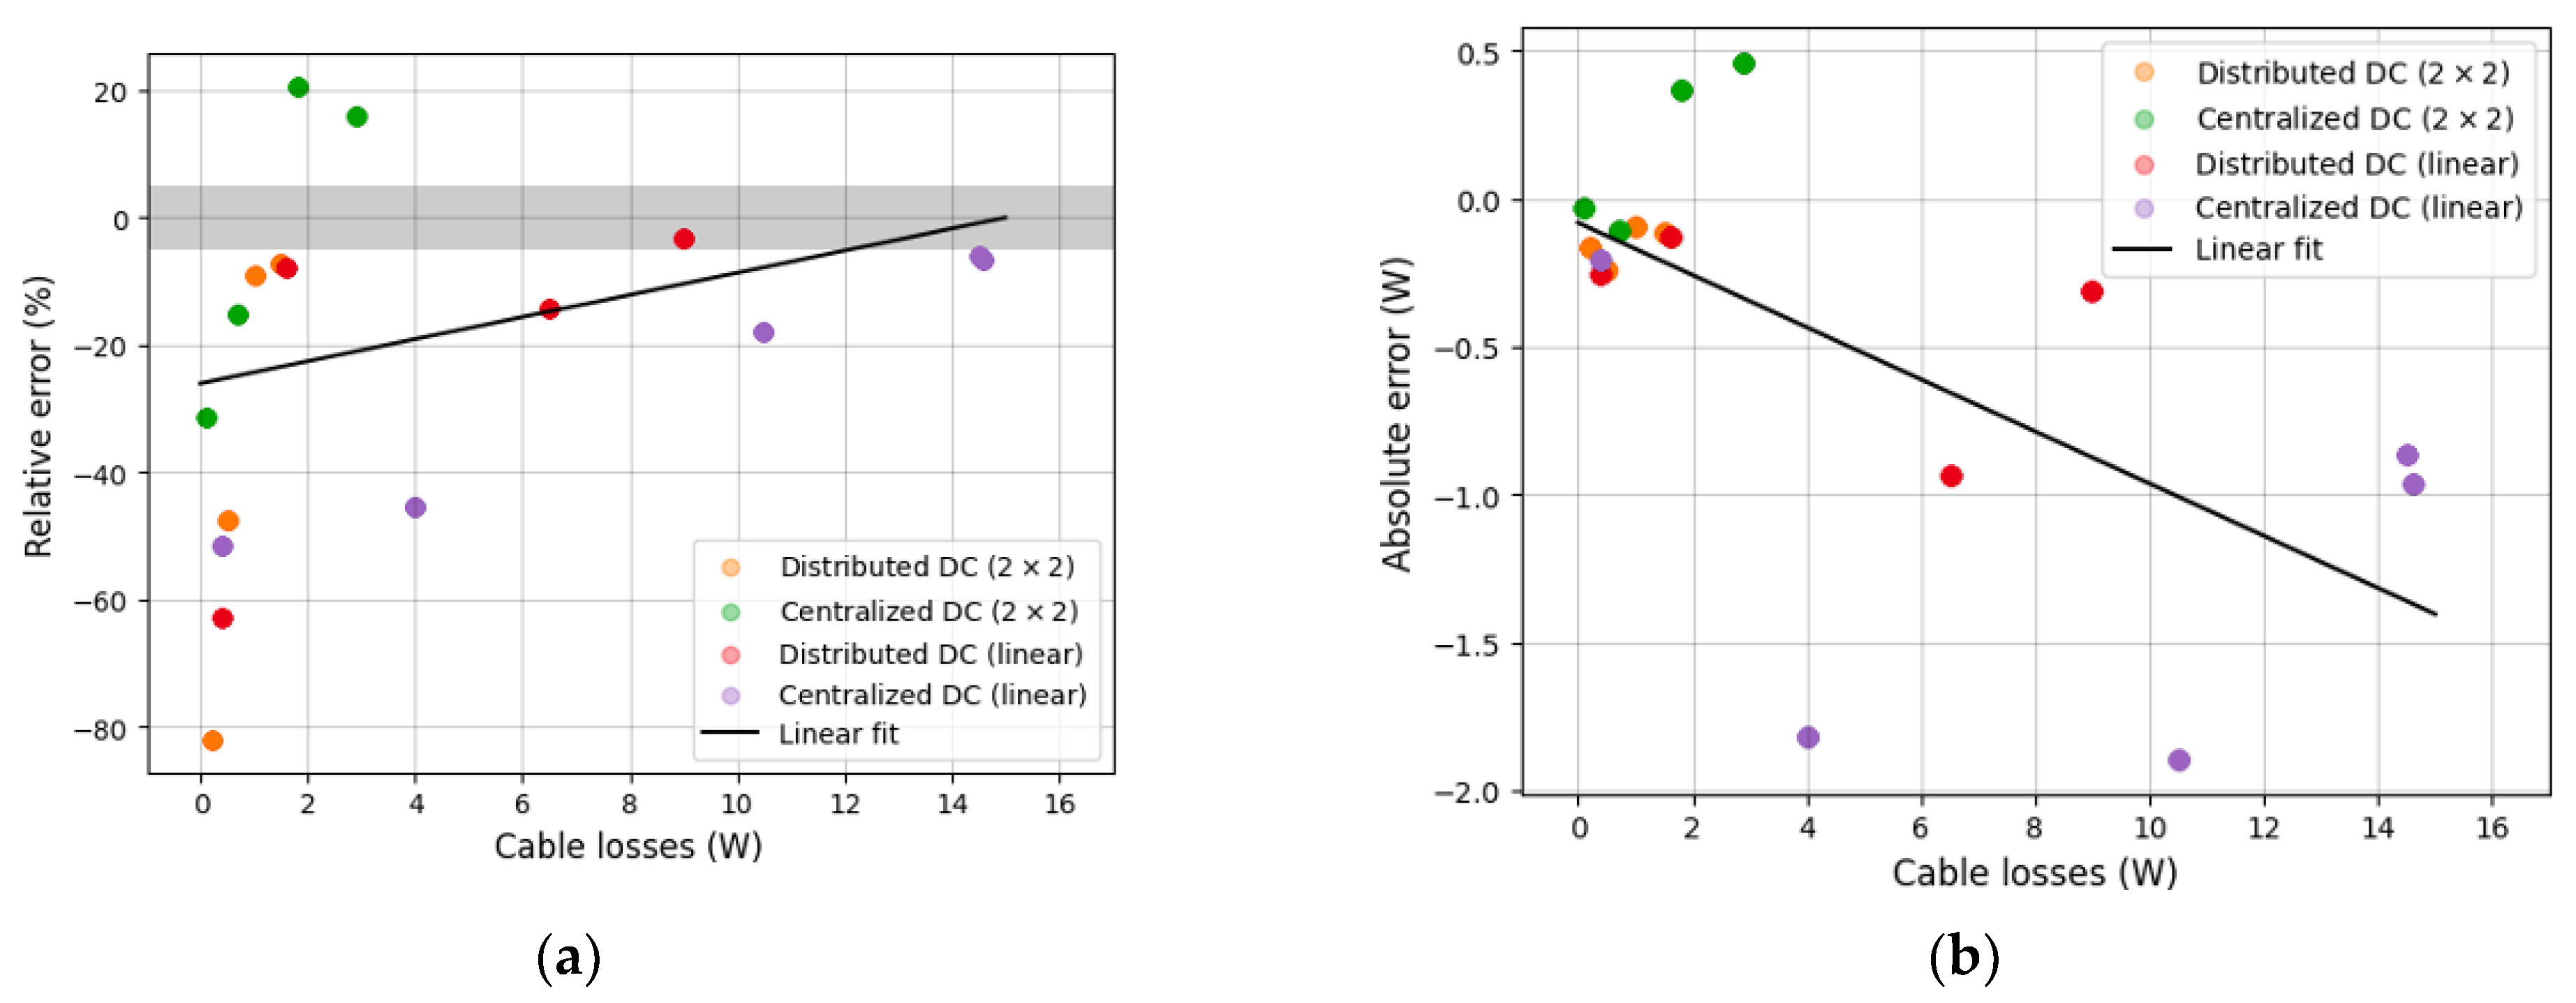
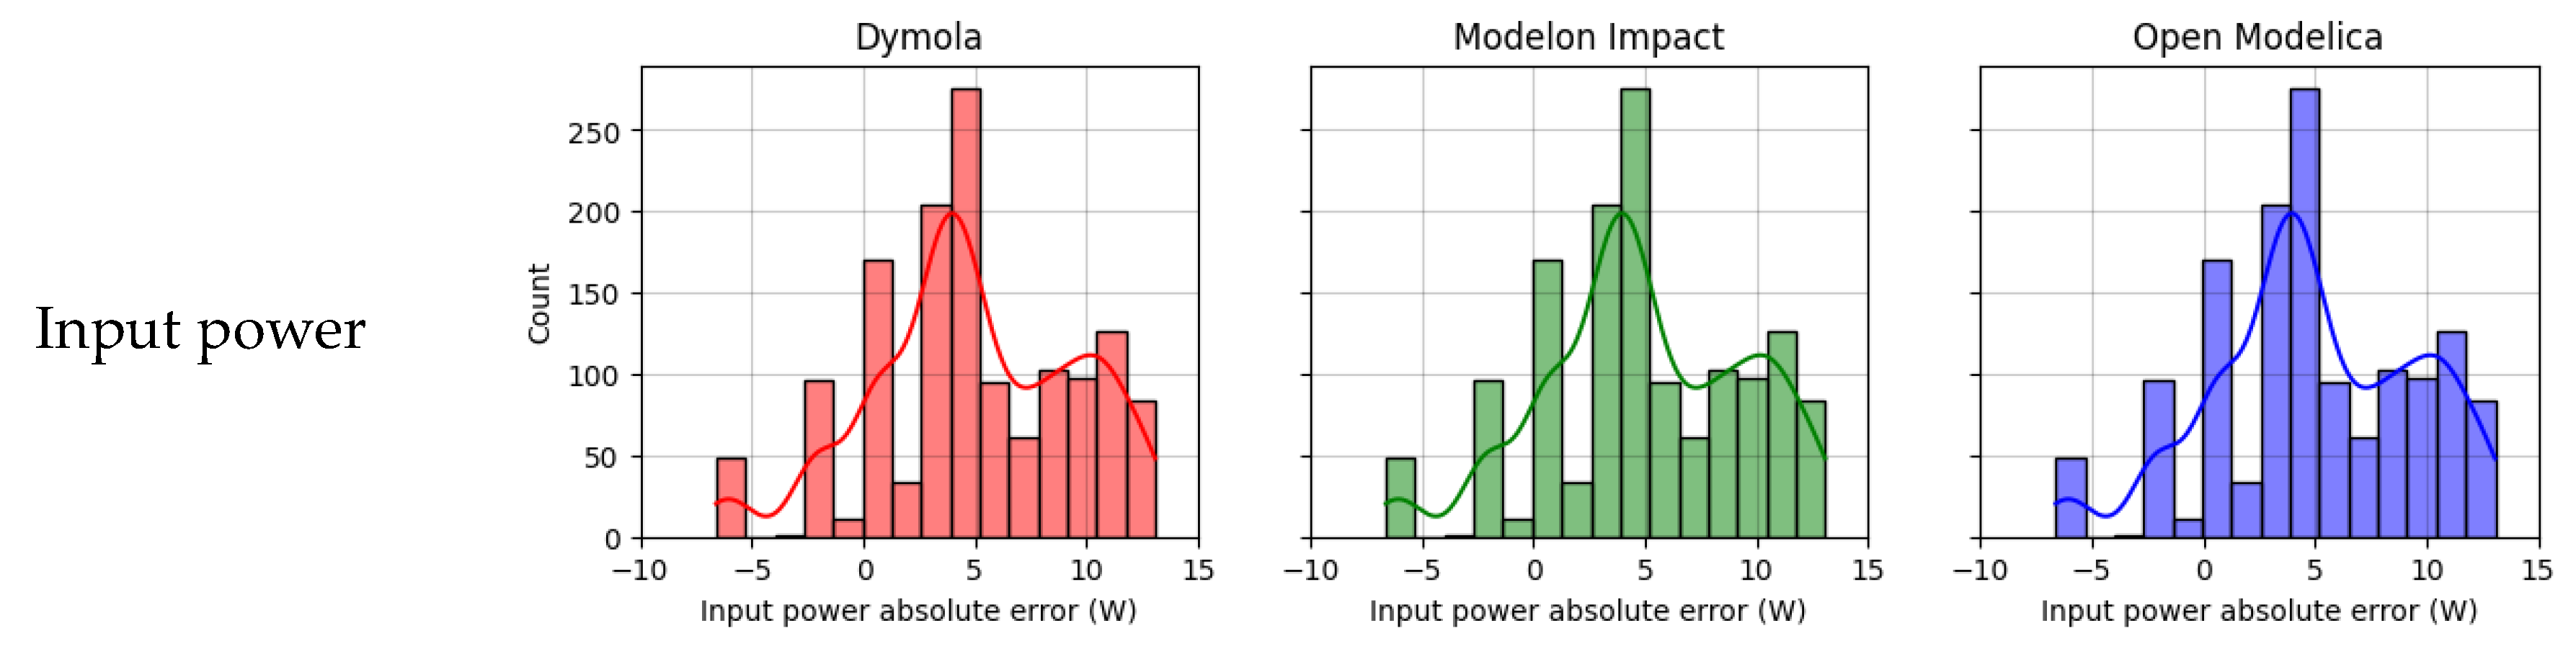
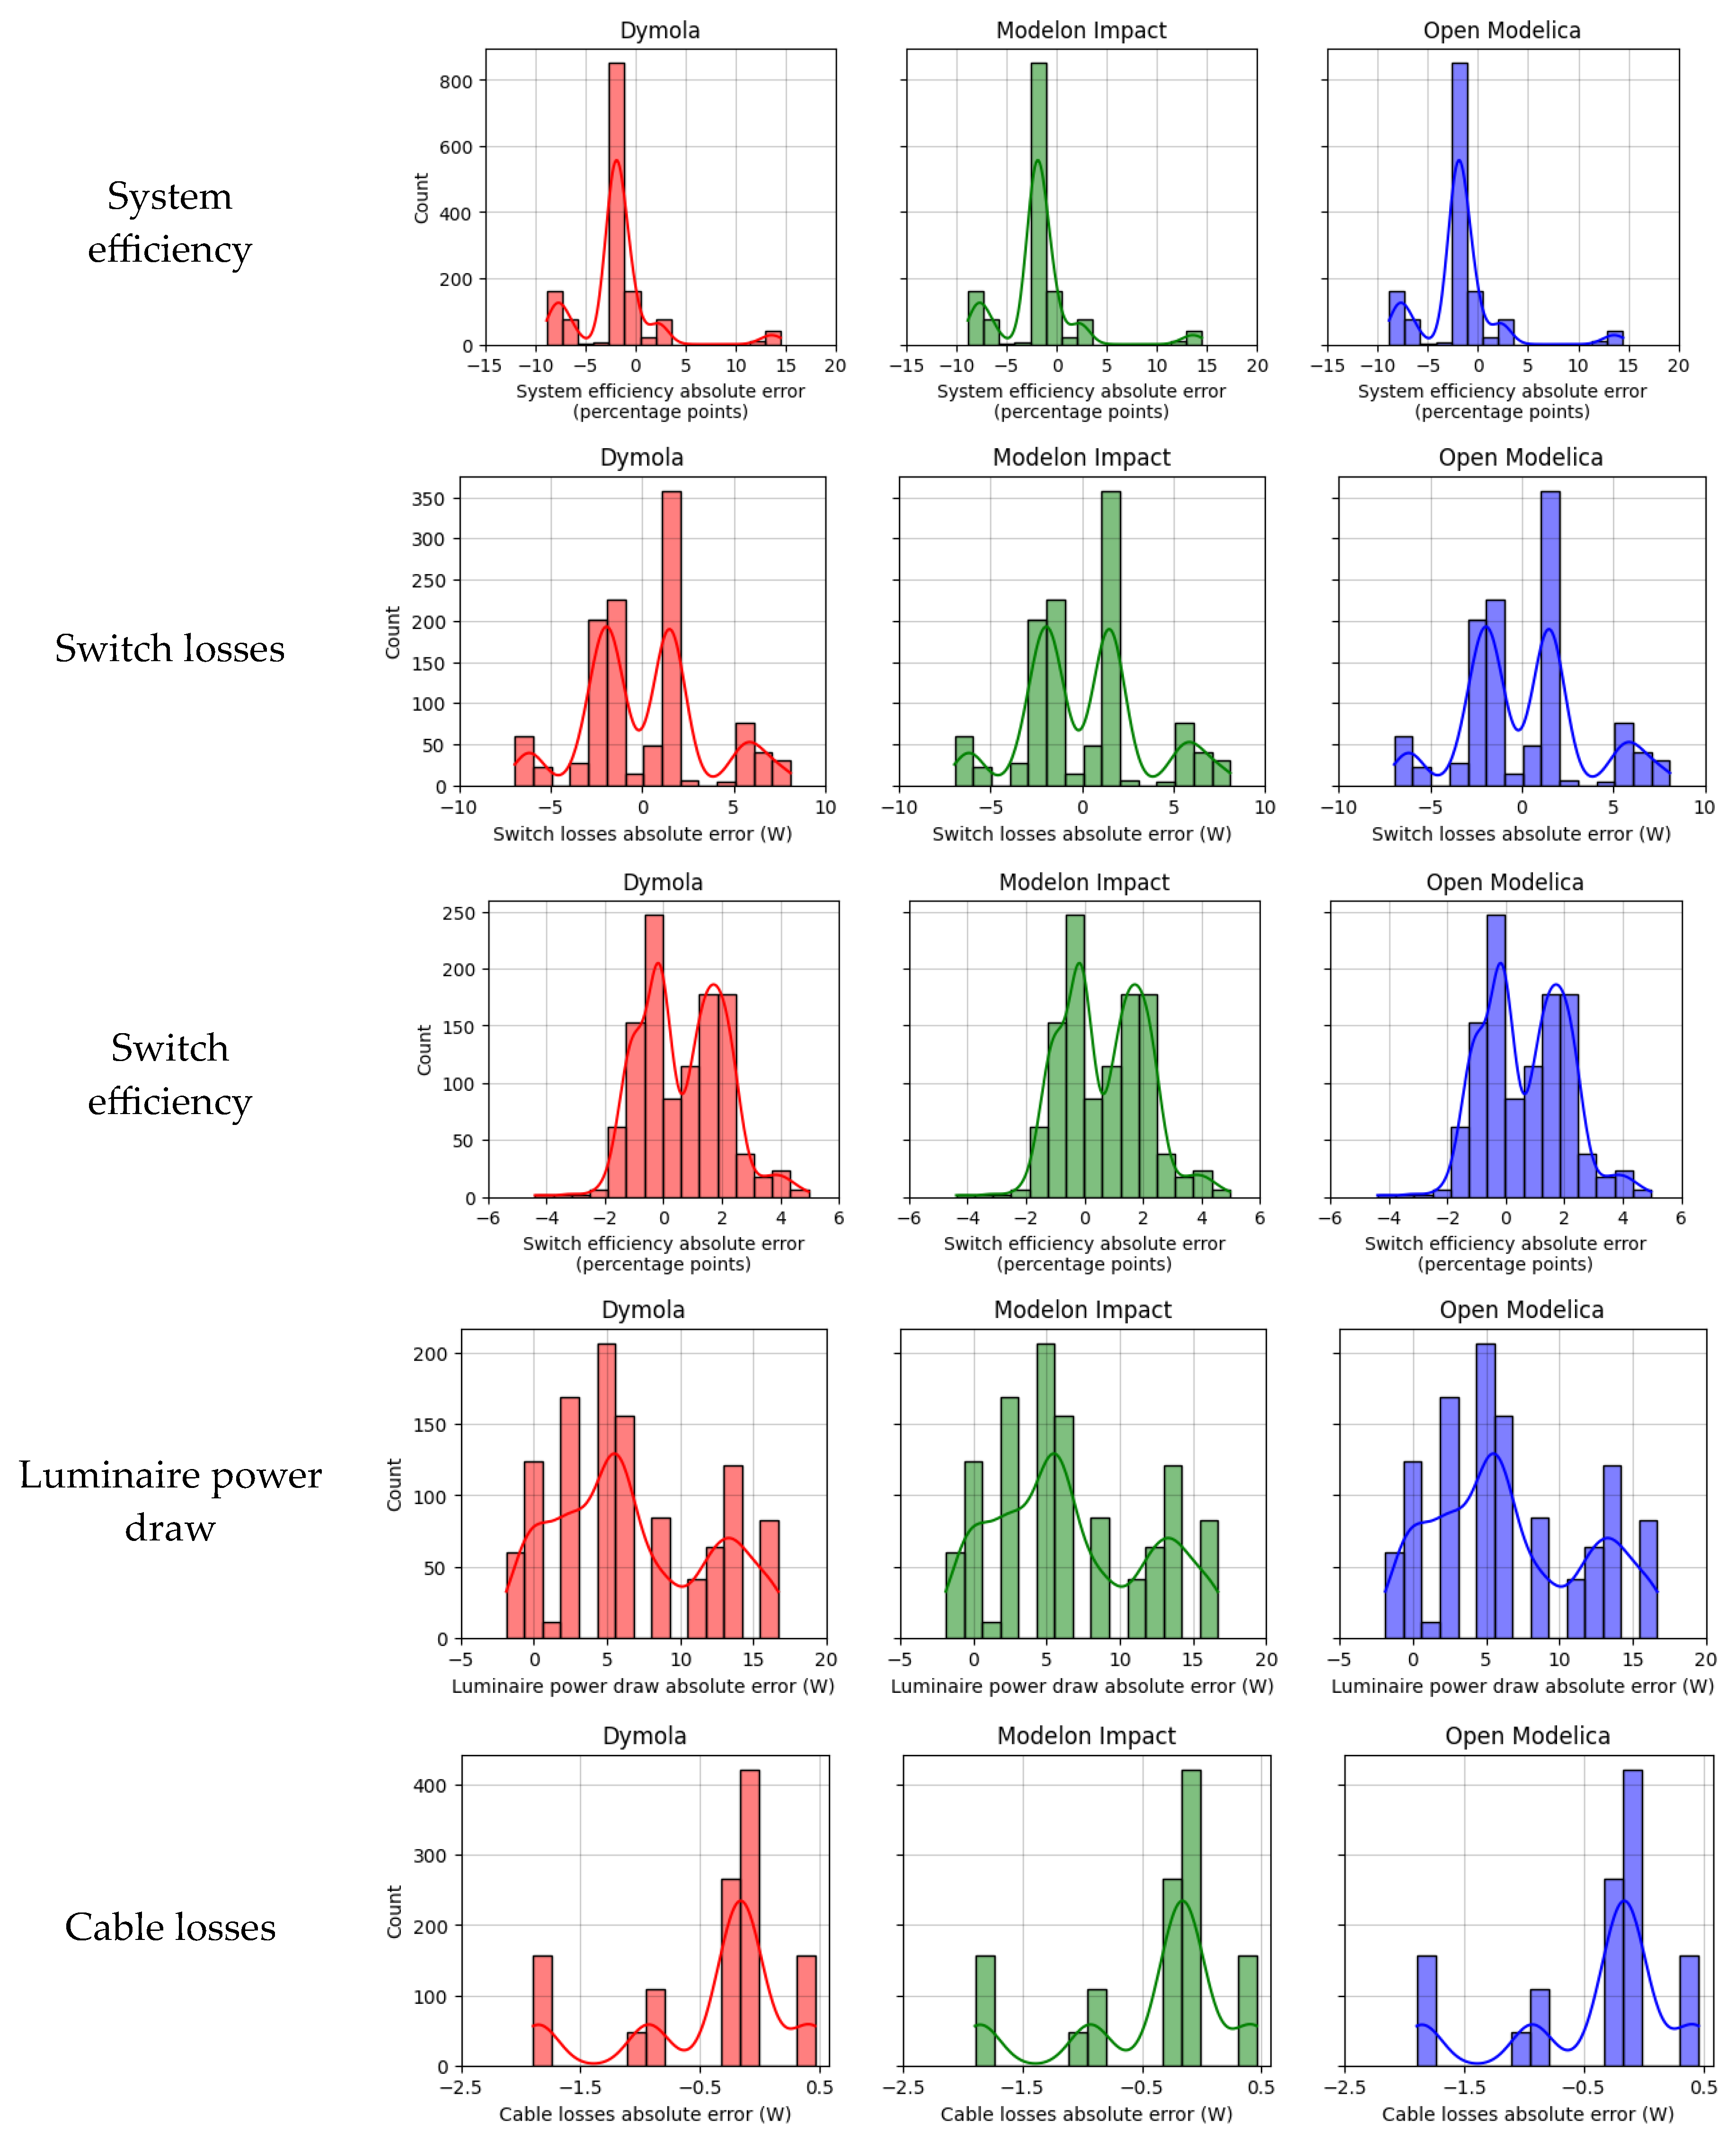
The test setup used to characterize the five lighting systems in a laboratory environment consisted of the equipment shown in Table 1. As most commercially available lighting systems do not have sub-component level power monitoring (i.e., at both the LED driver and LED array input or output), the only measurement point for the AC architecture was at the input electrical panel (i.e., circuit-level metering). Power was monitored for both DC/PoE architectures at the input electrical panel (i.e., circuit-level metering) and the PoE switch output (i.e., port-level monitoring).
AC cable losses were assumed to have negligible impact on AC LED driver performance and output. However, based on previous experience, the same assumption did not apply to DC cable losses and DC LED drivers [27,28]. To measure the Ethernet cable losses at different PoE load levels, the programmable PD was connected in place of the PoE luminaires and load levels were set according to the lighting schedule. Line-side power measurements were taken from the PoE switch, load-side power measurements were taken from the programmable PD (Figure 6), and the difference was calculated to determine cable loss at different load levels for both 5 m and 30 m cable lengths.
When powering PoE luminaires over long cable lengths, voltage drop along the cable may result in a change in their power draw, depending on how the PoE driver is designed. The PoE driver used in all luminaires was characterized by configuring the programmable PSE to vary driver input voltage and using the DC meter to measure driver output power. Test results showed negligible dependency of power draw on input voltage (Figure 7), thereby eliminating the need to account for cable length and voltage drop during system testing.
Finally, all five lighting systems were configured according the 24-h lighting schedule, and total system input power data for all systems was logged by the circuit-level meter and retrieved as a CSV file. Output power data for all PoE systems was logged by automating the PoE switch power query CLI commands in TeraTerm.

4. Results

Detailed simulation results are presented in this section for Modelon Impact only, followed by a comparison of results across all three Modelica IDEs. Simulated input power draw was higher than the laboratory measurements for all five systems at all input power levels except for the lowest power level, as shown in Figure 8. It should be noted that the AC and Centralized DC (2 × 2) had the biggest difference in power draw between simulated and measured values compared to the other cases. Insignificant data gaps in the measured results of the Distributed and Centralized DC (linear fixture) systems were the result of an undiagnosed metering issue.
The accuracy of the BEEAM toolkit was calculated at the system level by comparing simulated system input power draw and system efficiency against laboratory measurements. Toolkit accuracy was also calculated at the device level by comparing the simulated PoE switch losses, PoE switch efficiency, luminaire power draw, and cable losses against laboratory measurements.
Absolute and relative system-level simulation error was calculated for all five systems, and the error values were fit to a linear regression model as a simple characterization of error dependency on input power (Figure 9). Most of the relative errors for the four DC systems were within a ±5% band, depicted as a gray area in all relative error (a) figures. The ±5% band should not be confused with confidence interval as it is centered about zero, rather than being centered about the fitted line. The AC system showed higher relative error—especially at lower load levels—which was thought to be due to inaccuracies in the AC driver model caused by limited test data at lower load levels. Simulation errors for all systems were negative at lower input power levels and transitioned towards positive errors as the input power increased, except for the Centralized DC (2 × 2) system, which had positive errors at all input power levels. The error for all systems was dependent on input power, as shown by the positive slope of the linear fit.
System efficiency was calculated from simulated and measured data by dividing total output by total input. The relative error for all four DC systems again fell mostly within a ±5% error band (Figure 10). Simulation errors for the AC system were substantially higher than for the DC systems, as seen in the input power analysis, which is again believed to be caused by inaccuracies in the AC driver model caused by limited test data at lower load levels. All systems except the AC and the Centralized DC (2 × 2) systems fit the regression line well. Errors for all systems were mostly negative, and were dependent on system efficiency, as shown by the negative slope of the linear fit.
Looking at the device-level results, shown in Figure 11, Figure 12, Figure 13 and Figure 14, relative simulation errors for PoE switch loss in the two centralized DC systems were positive and only partially within the ±5% error band (Figure 11a). Relative error for the two distributed systems was negative, and completely outside the ±5% error band. It is important to note that even though the relative error in the case of the two distributed systems appeared substantial (~10%), the corresponding absolute error was not substantial (Figure 11b). Simulation errors for all four DC systems showed some dependence on switch losses. Errors for three of the four systems transitioned from negative to zero or from zero to positive as switch losses increased, as shown by the positive slope of the linear fit. Error for the Distributed DC (linear) system initially transitioned from negative to zero as switch losses increased, but then moved in the opposite direction at higher switch loss levels. A linear fit just for the Distributed DC (linear) system (not shown in the figure) has a negative slope.
Relative simulation errors for PoE switch efficiency were mostly within the ±5% error band (Figure 12). The long streaks of data points representing the Centralized DC (2 × 2) system (green) in both plots (a and b) were due to measurement noise. Again, the apparently substantial variation in relative error was not as substantial when looking at absolute error. Errors for all four systems showed dependency on switch efficiency. Errors in the two Centralized DC systems transitioned from negative to zero as switch efficiency increased, whereas the errors in the two Distributed DC systems moved in opposite direction from positive towards zero.
Due to the current laboratory measurement setup, it was not possible to isolate the PoE driver losses. Hence, instead of PoE driver losses, power comparison was done at the luminaire level. Luminaire power was separated from the measured data by subtracting cable losses from PoE switch port output power measurements. Relative simulation error for luminaire power draw was slightly outside the ±5% error band for the Centralized DC (2 × 2) system, but within the error band for other three PoE systems (Figure 13). The long streaks of Centralized DC (2 × 2) data were again due to measurement noise. Errors for all four systems were dependent on luminaire power draw, as shown by the positive slope of the linear fit.
Relative simulation errors for cable loss varied substantially across the four DC systems and was outside the ±5% error band (Figure 14). This was likely the result of the simple cable modeling approach based on measured resistance. Although cable losses were measured during laboratory characterization, those measurements were not used in the creation of the simulation models for the cables. Even though the relative errors appear substantial, with some higher than 80%, the corresponding absolute errors are negligible (less than 1 W).
To verify the performance of BEEAM across different Modelica platforms, a comparison of the simulation results of the five lighting systems from three Modelica IDEs (Dymola, Modelon Impact, and OpenModelica) was performed (Figure 15). The simulation results appeared to be consistent across the three tools for the tested scenarios, likely due to the steady-state nature of the models and the use of the same solver (CVODE).

5. Discussion

The BEEAM toolkit verification presented here suggests that most system-level and device-level efficiencies and losses can be predicted within ±5% of their laboratory-measured values. Whether or not ±5% accuracy is good enough depends on the design decisions that the simulations are intended to inform. For example, a decision to select the most energy-efficient system configuration between AC and Distributed DC (2 × 2 fixture) might be made by comparing simulated energy use of the two systems. Simulated energy use of the AC system was 2.1 kWh, while that of the Distributed DC (2 × 2 fixture) system was 2.3 kWh over a 24-h period. But considering the ±5% accuracy of the toolkit, the actual energy use for the AC system would be 1.9–2.2 kWh, while that of the Distributed DC (2 × 2 fixture) system would be 2.1–2.4 kWh. Because the two ranges overlap, ±5% accuracy might not be sufficient to make a decision with 100% confidence. In contrast, if the same decision had to be made between the Distributed DC (2 × 2 fixture) and Centralized DC (2 × 2 fixture) systems, ±5% would be sufficient because the 2.7–3.0 kWh of energy use of the Centralized DC (2 × 2 fixture) system would exceed the 2.1–2.4 kWh of energy used by the Distributed DC (2 × 2 fixture) system. Notably, these validation conclusions cannot necessarily be generalized, and might be different for larger or more complicated lighting and electrical systems.
Some substantial differences between simulated and actual efficiencies were observed. The source of these deviations was not definitively identified as part of this work, but they might be caused by a limited number of low-load test points in the method used to generate simulation models. This hypothesis can be easily evaluated in future work. Several Modelica interoperability issues were identified across the multiple IDEs and their varying compilers. These issues initially affected the ability to initialize and compile the simulation, but (once the issues were resolved) did not affect simulation results. The BEEAM developers are currently modifying the model code to incorporate Modelica functions that are supported across commonly used IDEs. A detailed description of these issues and implemented solutions will be published separately.

6. Conclusions

This paper builds upon previous BEEAM verification research by characterizing complete systems comprising commercially available AC and DC (PoE) equipment, and providing a more detailed analysis of simulation results. As a result, the accuracy performance demonstrated here should build confidence that the BEEAM toolkit might be suited for use in real-world building projects. Verifying accuracy at the device level helped identify error dependency on different device parameters (e.g., switch losses, cable losses, load level) as well as potential issues with the utilized device models. However, additional work is likely required in order to take BEEAM from an interesting research tool to something that can impact real-world building projects. The component model generation method could be improved, and the toolkit could be expanded to enable the modeling of leading-edge buildings that incorporate renewable generation, BESS, and electric vehicle chargers, to form building-scale microgrids. For example, the toolkit does not presently contain model families for inverters or BESS. Effective and efficient use of the toolkit requires Modelica expertise and experience with the Modelica IDE used to perform simulations. Further, some design decisions that BEEAM might be used for require the development of whole-building models, and doing so from scratch within a Modelica IDE is a time-consuming process that can only be made more efficient with significant IDE and software development expertise. Such expertise is not common among building system designers, and the toolkit will likely need to be incorporated into more user-friendly software in order to see broad adoption. The toolkit could benefit from additional verification to demonstrate accuracy and reliability, and validation that it can be used to make design decisions for real-world building projects.

Author Contributions

Conceptualization, M.P. and A.W.; methodology, A.W.; software, A.W. and K.D.; formal analysis, A.W.; investigation, A.W., S.P. and T.-K.W.; resources, M.P.; data curation, A.W.; writing—original draft preparation, A.W.; writing—review and editing, A.W., S.P., T.-K.W., K.D. and M.P.; visualization, A.W.; supervision, A.W.; project administration, M.P.; funding acquisition, M.P. All authors have read and agreed to the published version of the manuscript.

Funding

This research was funded by the Assistant Secretary for Energy Efficiency and Renewable Energy, Building Technologies Office, of the US Department of Energy under Contract DE-AC05-76RL01830.

Data Availability Statement

The BEEAM toolkit is available at https://github.com/NREL/BEEAM (accessed on 4 October 2023).

Acknowledgments

The authors wish to thank NREL researchers Jiazhen Ling, Omkar Ghatpande, and Stephen Frank for assistance with model development and providing the graphics (Figure 1, Figure 2 and Figure 3).

Conflicts of Interest

The authors declare no conflict of interest.

References

  1. Mackay, L.; Van Der Blij, N.H.; Ramirez-Elizondo, L.; Bauer, P. Toward the universal DC distribution system. Electr. Power Compon. Syst. 2017, 45, 1032–1042. [Google Scholar] [CrossRef]
  2. Nazir, M.; Ghatpande, O.; Heredia, W.B.; Wierzbanowski, C.; Gerber, D.; Saha, A. Standardizing Performance Metrics for Building-Level Electrical Distribution Systems. Energies 2021, 15, 136. [Google Scholar] [CrossRef]
  3. Prabhala, V.A.; Baddipadiga, B.P.; Fajri, P.; Ferdowsi, M. An Overview of Direct Current Distribution System Architectures & Benefits. Energies 2018, 11, 2463. [Google Scholar] [CrossRef]
  4. Garbesi, K.; Vossos, V.; Shen, H. Catalog of DC Appliances and Power Systems; Berkeley Lab: Berkeley, CA, USA, 2012. [Google Scholar]
  5. Shenai, K.; Shah, K. Smart DC micro-grid for efficient utilization of distributed renewable energy. In Proceedings of the IEEE 2011 EnergyTech, Cleveland, OH, USA, 25–26 May 2011; pp. 1–6. [Google Scholar]
  6. 802.3bt-2018; IEEE Standard for Ethernet Amendment 2: Physical Layer and Management Parameters for Power over Ethernet over 4 Pairs. IEEE: Piscataway Township, NJ, USA, 2019.
  7. Universal Serial Bus Power Delivery Specification Revision 3.1, Version 1.8. USB Implementers Forum: Beaverton, OR, USA. 2023. Available online: https://www.usb.org/document-library/usb-power-delivery (accessed on 4 October 2023).
  8. NFPA 70 National Electric Code; N. F. P. Association: New York, NY, USA, 2023.
  9. Building Electrical Efficiency Analysis Model (BEEAM) (version 0.1.0). ((2019) 2021). National Renewable Energy Laboratory. Available online: https://github.com/NREL/BEEAM (accessed on 4 October 2023).
  10. Othee, A.; Cale, J.; Santos, A.; Frank, S.; Zimmerle, D.; Ghatpande, O.; Duggan, G.; Gerber, D. A Modeling Toolkit for Comparing AC and DC Electrical Distribution Efficiency in Buildings. Energies 2023, 16, 3001. [Google Scholar] [CrossRef]
  11. Santos, A.; Cale, J.; Singh, A.; Gerber, D.; Frank, S.; Duggan, G.; Zimmerle, D.; Brown, R. Comparison of Load Models for Estimating Electrical Efficiency in DC Microgrids. In Proceedings of the 2019 IEEE Third International Conference on DC Microgrids (ICDCM), Matsue, Japan, 20–23 May 2019; pp. 1–9. [Google Scholar]
  12. Thomas, B.A.; Azevedo, I.L.; Morgan, G. Edison Revisited: Should we use DC circuits for lighting in commercial buildings? Energy Policy 2012, 45, 399–411. [Google Scholar] [CrossRef]
  13. Engelen, K.; Shun, E.L.; Vermeyen, P.; Pardon, I.; D’Hulst, R.; Driesen, J.; Belmans, R. The feasibility of small-scale residential DC distribution systems. In Proceedings of the IECON 2006—32nd Annual Conference on IEEE Industrial Electronics, Paris, France, 6–10 November 2006; pp. 2618–2623. [Google Scholar]
  14. Boroyevich, D.; Cvetković, I.; Dong, D.; Burgos, R.; Wang, F.; Lee, F. Future electronic power distribution systems a contemplative view. In Proceedings of the 2010 12th International Conference on Optimization of Electrical and Electronic Equipment, Brasov, Romania, 20–22 May 2010; pp. 1369–1380. [Google Scholar]
  15. Vossos, V.; Garbesi, K.; Shen, H. Energy savings from direct-DC in U.S. residential buildings. Energy Build. 2014, 68, 223–231. [Google Scholar] [CrossRef]
  16. Starke, M.; Tolbert, L.M.; Ozpineci, B. AC vs. DC distribution: A loss comparison. In Proceedings of the 2008 IEEE/PES Transmission and Distribution Conference and Exposition, Chicago, IL, USA, 21–24 April 2008; pp. 1–7. [Google Scholar]
  17. Dastgeer, F.; Kalam, A. Efficiency comparison of DC and AC distribution systems for distributed generation. In Proceedings of the 2009 Australasian Universities Power Engineering Conference, Adelaide, SA, Australia, 27–30 September 2009; pp. 1–5. [Google Scholar]
  18. Hammerstrom, D.J. AC versus DC distribution systemsdid we get it right? In Proceedings of the 2007 IEEE Power Engineering Society General Meeting, Tampa, FL, USA, 24–28 June 2007; pp. 1–5. [Google Scholar]
  19. Barros, J.; de Apráiz, M.; Diego, R.I. Power Quality in DC Distribution Networks. Energies 2019, 12, 848. [Google Scholar] [CrossRef]
  20. Sannino, A.; Postiglione, G.; Bollen, M. Feasibility of a DC network for commercial facilities. IEEE Trans. Ind. Appl. 2003, 39, 1499–1507. [Google Scholar] [CrossRef]
  21. AlLee, G.; Tschudi, W. Edison Redux: 380 Vdc Brings Reliability and Efficiency to Sustainable Data Centers. IEEE Power Energy Mag. 2012, 10, 50–59. [Google Scholar] [CrossRef]
  22. Weiss, R.; Ott, L.; Boeke, U. Energy efficient low-voltage DC-grids for commercial buildings. In Proceedings of the 2015 IEEE First International Conference on DC Microgrids (ICDCM), Atlanta, GA, USA, 7–10 June 2015. [Google Scholar]
  23. Gerber, D.L.; Vossos, V.; Feng, W.; Marnay, C.; Nordman, B.; Brown, R. A simulation-based efficiency comparison of AC and DC power distribution networks in commercial buildings. Appl. Energy 2017, 210, 1167–1187. [Google Scholar] [CrossRef]
  24. 802.3at-2009; IEEE Standard for Information Technology—Local and Metropolitan Area Networks—Specific Requirements—Part 3: CSMA/CD Access Method and Physical Layer Specifications Amendment 3: Data Terminal Equipment (DTE) Power via the Media Dependent Interface (MDI) Enhancements. 2009. Available online: https://ieeexplore.ieee.org/document/5306743/ (accessed on 4 October 2023).
  25. 802.3af-2003; IEEE Standard for Information Technology—Telecommunications and Information Exchange Between Systems—Local and Metropolitan Area Networks—Specific Requirements—Part 3: Carrier Sense Multiple Access with Collision Detection (CSMA/CD) Access Method and Physical Layer Specifications—Data Terminal Equipment (DTE) Power Via Media Dependent Interface (MDI). 2003. Available online: https://ieeexplore.ieee.org/document/1213877 (accessed on 4 October 2023).
  26. American National Standard for Lighting Systems—Minimum Requirements for Installation of Energy Efficient Power over Ethernet (PoE) Lighting Systems; American National Standard Institute: Rosslyn, VA, USA, 2017.
  27. Tuenge, J.; Kelly, K.; Chen, Y.; Waghale, A.; Poplawski, M. Connected Lighting Systems Efficiency Study: PoE Cable Energy Losses, Part 2, United States. 2018. Available online: https://www.osti.gov/biblio/1512365 (accessed on 4 October 2023).
  28. Tuenge, J.; Kelly, K.; Poplawski, M. Connected Lighting Systems Efficiency Study: PoE Cable Energy Losses, Part 1, United States. 2017. Available online: https://www.osti.gov/biblio/1418428 (accessed on 4 October 2023).
  29. Tuenge, J.R.; Poplawski, M.E. PoE Lighting System Energy Reporting Study, Part 1, United States. 2017. Available online: https://www.osti.gov/biblio/1618835 (accessed on 4 October 2023).
  30. Mohan, N.; Undeland, T.M.; Robbins, W.P. Power Electronics: Converters, Applications, and Design; John Wiley & Sons: Hoboken, NJ, USA, 2003. [Google Scholar]
  31. Krause, P.C.; Wasynczuk, O.; Sudhoff, S.D.; Pekarek, S. Analysis of Electric Machinery and Drive Systems; Wiley Online Library; John Wiley & Sons: Hoboken, NJ, USA, 2002. [Google Scholar]
  32. Xia, D.; Heydt, G.T. Harmonic Power Flow Studies—Part II Implementation and Practical Application. IEEE Trans. Power Appar. Syst. 1982, PAS-101, 1266–1270. [Google Scholar] [CrossRef]
  33. Xia, D.; Heydt, G.T. Harmonic Power Flow Studies Part I—Formulation and Solution. IEEE Trans. Power Appar. Syst. 1982, PAS-101, 1257–1265. [Google Scholar] [CrossRef]
  34. Anay, W.; Shat, P.; Michael, P. Demonstration of a modeling toolkit for the design of building electrical distribution systems. In Proceedings of the 9th ACM International Conference on Systems for Energy-Efficient Buildings, Cities, and Transportation, Boston, MA, USA, 9–10 November 2022; Association for Computing Machinery: Boston, MA, USA, 2022; pp. 246–249. [Google Scholar]
  35. Dymola Systems Engineering. Available online: https://www.3ds.com/products-services/catia/products/dymola/ (accessed on 4 October 2023).
  36. Modelon Impact. Available online: https://modelon.com/modelon-impact/ (accessed on 4 October 2023).
  37. Fritzson, P.; Pop, A.; Abdelhak, K.; Ashgar, A.; Bachmann, B.; Braun, W.; Bouskela, D.; Braun, R.; Buffoni, L.; Casella, F.; et al. The OpenModelica Integrated Environment for Modeling, Simulation, and Model-Based Development. Model. Identif. Control. A Nor. Res. Bull. 2020, 41, 241–295. [Google Scholar] [CrossRef]
Figure 1. Typical AC electrical distribution in a building with AC/DC converters at most end-use devices.
Buildings 13 02520 g001
Figure 2. HVDC electrical distribution architecture with AC/DC converters installed in a centralized configuration distributing 380 VDC throughout the building.
Buildings 13 02520 g002
Figure 3. LVDC electrical distribution architecture with AC/DC converters installed in a distributed configuration near loads distributing <60 VDC throughout the building.
Buildings 13 02520 g003
Figure 4. The five different lighting systems modeled using BEEAM, simulated in a Modelica IDE, and characterized in a laboratory environment.
Buildings 13 02520 g004
Figure 5. The 24-h lighting schedule designed to set varying load levels during simulation and laboratory characterization.
Buildings 13 02520 g005
Figure 6. Different metering points in test setup used to determine cable losses in laboratory characterization.
Buildings 13 02520 g006
Figure 7. Output power of the PoE driver over the range of PoE input voltages (48 VDC–57 VDC) at four different relative luminaire load levels (10%, 40%, 80%, 100%).
Buildings 13 02520 g007
Figure 8. A comparison of the simulated (in Modelon Impact) vs. measured total input power for all five systems. (a) AC, (b) Distributed DC (2 × 2 fixture), (c) Centralized DC (2 × 2 fixture), (d) Distributed DC (linear fixture), (e) Centralized DC (linear fixture).
Buildings 13 02520 g008
Figure 9. The relative (a) and absolute (b) error in simulating total input power in Modelon Impact for all five systems. Both plots include a linear fit, and a ±5% error band is shown for (a).
Buildings 13 02520 g009
Figure 10. The relative (a) and absolute (b) error in simulating system efficiency in Modelon Impact for all five systems. Both plots include a linear fit, and a ±5% error band is shown for (a).
Buildings 13 02520 g010
Figure 11. The relative (a) and absolute (b) error in simulating PoE switch loss in Modelon Impact for four DC systems. Both plots include a linear fit, and a ±5% error band is shown for (a).
Buildings 13 02520 g011
Figure 12. The relative (a) and absolute (b) error in simulating PoE switch efficiency in Modelon Impact for four DC systems, with a linear fit and ±5% error bands.
Buildings 13 02520 g012
Figure 13. The relative (a) and absolute (b) error in simulating PoE luminaire power draw in Modelon Impact for four DC systems. Both plots include a linear fit, and a ±5% error band is shown for (a).
Buildings 13 02520 g013
Figure 14. The relative (a) and absolute (b) error in simulating PoE cable losses in Modelon Impact for four DC systems. Both plots include a linear fit, and a ±5% error band is shown for (a).
Buildings 13 02520 g014
Figure 15. Comparison of BEEAM simulation performance across Dymola, Modelon Impact, and Open Modelica.
Buildings 13 02520 g015aBuildings 13 02520 g015b
Table 1. Equipment used to characterize the laboratory implementation of the lighting systems.
EquipmentNameSpecification
Buildings 13 02520 i001Yokogawa WT500
Power Analyzer
(Reference Meter)
Voltage range: 0–1 kV
Current range: 0–40 A
Sample rate: 100 kS/s
Power accuracy at (50–70 Hz): 0.2% of reading + 0.2% of range
Power integration accuracy:
+0.02% of apparent power amount
Buildings 13 02520 i002DC Power MeterVoltage measurement accuracy: Typ: ±1%, Max: ±2%
Current measurement accuracy: Typ: ±2%, Max: ±3%
Power measurement accuracy:
Typ: ±2%, Max: ±3%
Buildings 13 02520 i003Sifos PSA
Programmable PD
Voltage measurement accuracy at >30 VDC: ±1.5%
Current measurement accuracy: ±0.5%
Buildings 13 02520 i004Sifos PDA
Programmable PSE
Power measurement accuracy:
± (2.0% + 0.1 W) per pairset,
± (2.0% + 0.2 W) 4-pair
Port voltage accuracy:
± (0.75% + 100 mV) per pairset,
± (0.75% + 200 mV) 4-pair
Buildings 13 02520 i005CCS Wattnode ModbusVoltage measurement accuracy:
Typ: ±0.3%, Max: ±0.5%
Current measurement accuracy: Typ: ±0.25%, Max: ±0.5%
Power measurement accuracy:
Typ: ±0.3%, Max: ±0.5%
Buildings 13 02520 i006AEM Network Service Assistant Cable TesterDC resistance measurement range:
0 to 50 Ω
(Pair-to-pair and within pair resistance unbalance measurement meets TIA 1152A specs)
Disclaimer/Publisher’s Note: The statements, opinions and data contained in all publications are solely those of the individual author(s) and contributor(s) and not of MDPI and/or the editor(s). MDPI and/or the editor(s) disclaim responsibility for any injury to people or property resulting from any ideas, methods, instructions or products referred to in the content.

