
Research on the Public’s Support for Emergency Infrastructure Projects Based on K-Nearest Neighbors Machine Learning Algorithm

Abstract
:1. Introduction
2. Methods
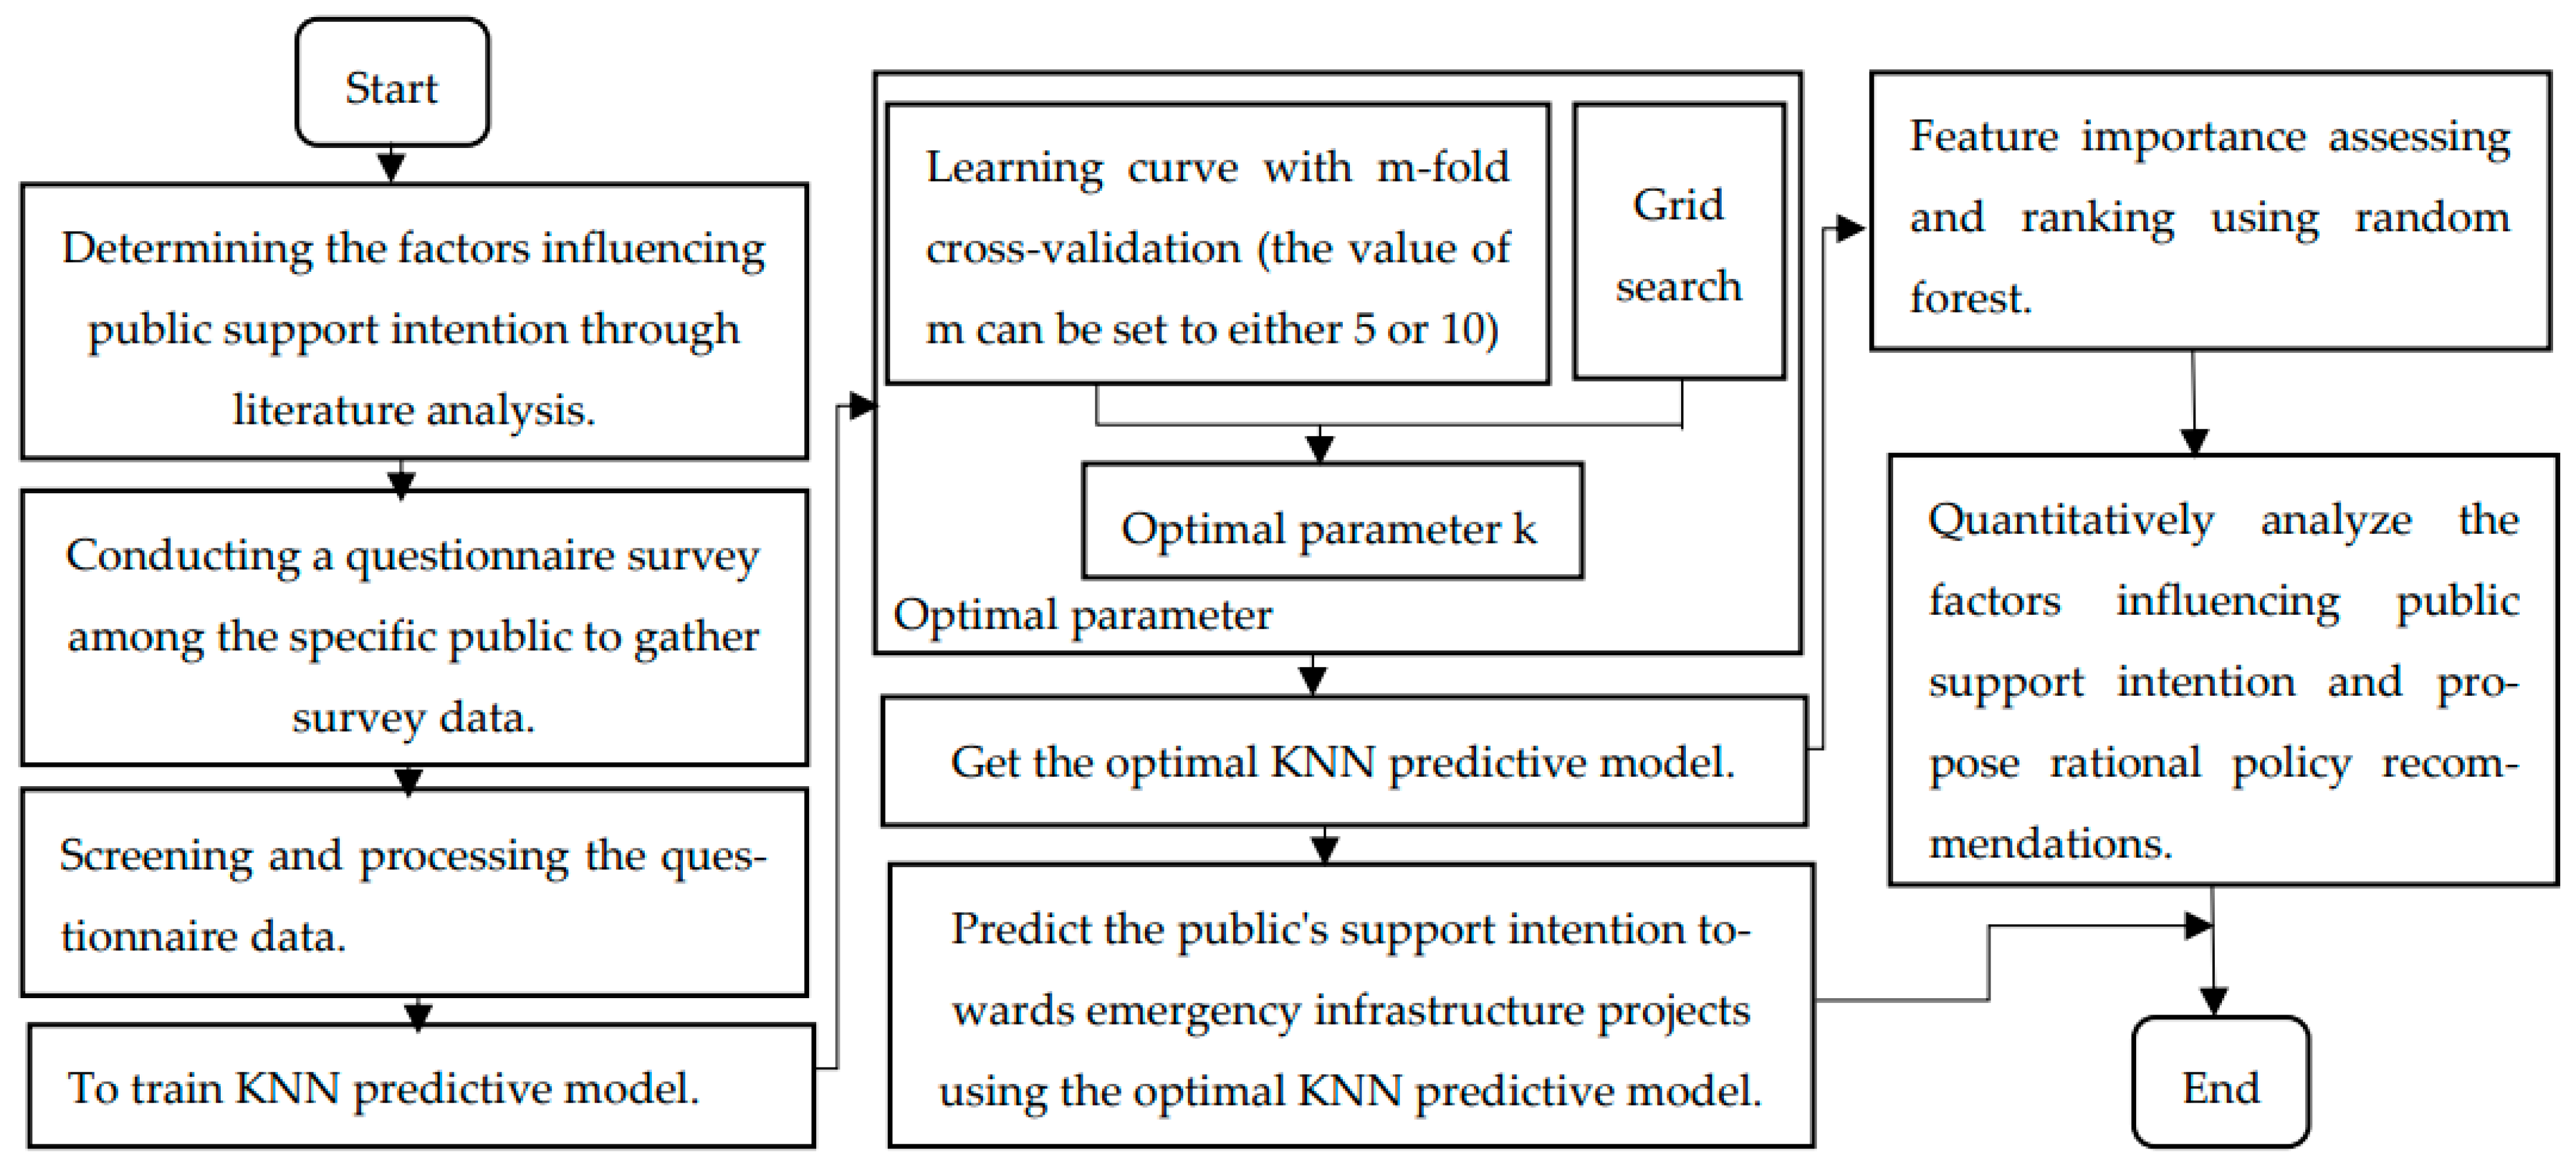
2.1. Framework
2.2. Divide the Research Stage
2.3. Stage 1: Data Collection and Processing
2.4. Stage 2: Construct an Optimized KNN Prediction Model
2.5. Stage 3: Quantitative Analysis
3. Research Designs
3.1. Questionnaire Design
3.2. Sample and Data Collection
4. Results and Discussion
4.1. Initial Validation of Data
4.2. Predictive Model for Public’s Support for Emergency Infrastructure Projects Based on KNN
- (1)
- Firstly, the historical data from the questionnaire survey were carefully preprocessed, and incomplete, insincere, or inconsistent responses were excluded from the dataset, ensuring that the final dataset contained only reliable and valid information.
- (2)
- Next, the relationship between the factors influencing the public’s support and the corresponding public support was established as a set called W within the entire dataset. Set W contained i samples, where each sample comprised p influencing factors of public support and one public’s support denoted as Q. In this study, the value of p was 16, which included the seven background information items mentioned in Table 2 and the nine measurement items listed in Table 3 (excluding ‘support’). The value of Q was either 0 or 1, representing the two different categories of public support in the questionnaire. This relationship can be mathematically represented as shown in Equation (6):
- (3)
- Finally, the factors (X) influencing public support were defined as the target sample for prediction. In the KNN classification predictive algorithm in this study, the process begins with traversing the entire sample set W and computing the distances between the target sample and each sample in set W. These distances were then sorted in ascending order to identify the top k-nearest neighbors. Subsequently, the corresponding public support set, Q = [Q1, Q2, …, Qk], of these k-nearest neighbors was obtained. Ultimately, voting was performed on set Q. In this step, each public support in set Q equaled one vote. The public’s support Qk with the highest number of votes was then assigned as the public’s support for the target sample. In this study, the Euclidean distance metric was used for this purpose. Euclidean distance is mathematically represented as shown in Equation (7):
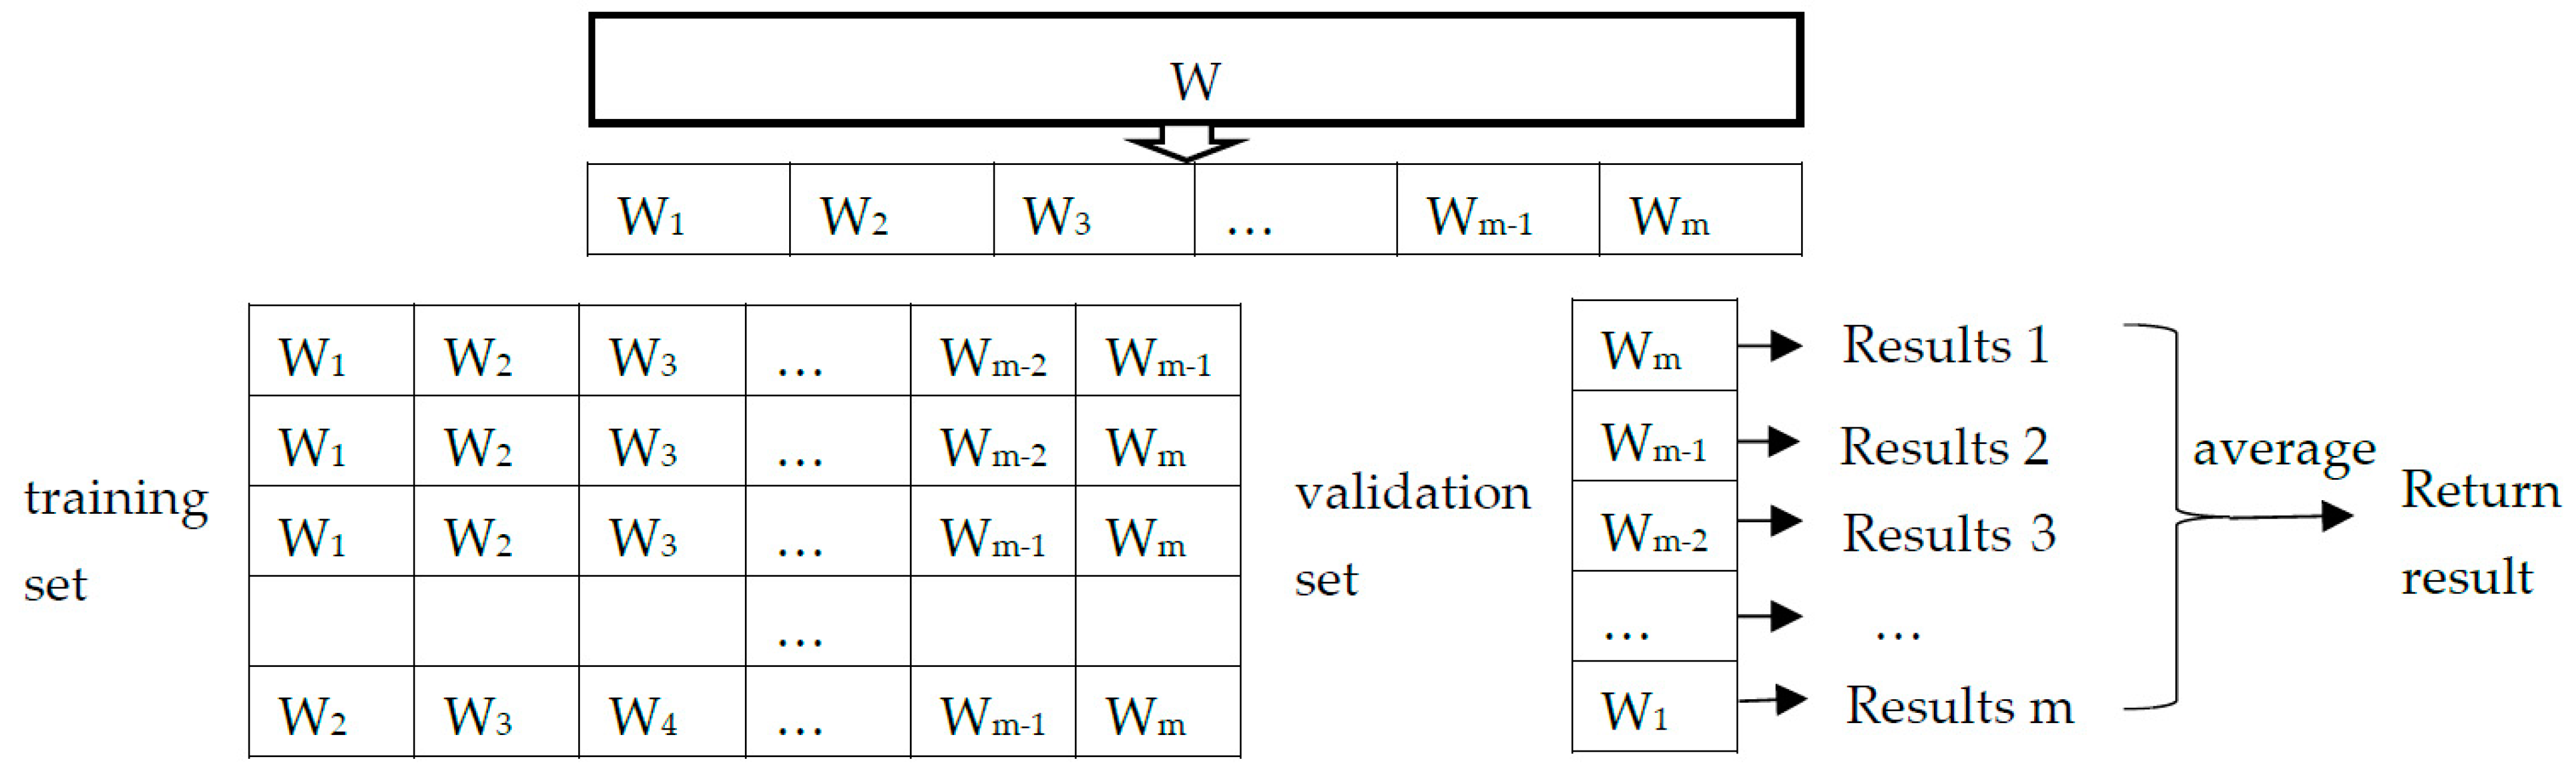
4.2.1. Learning Curve with m-Fold Cross-Validation Results
4.2.2. Grid Search Results
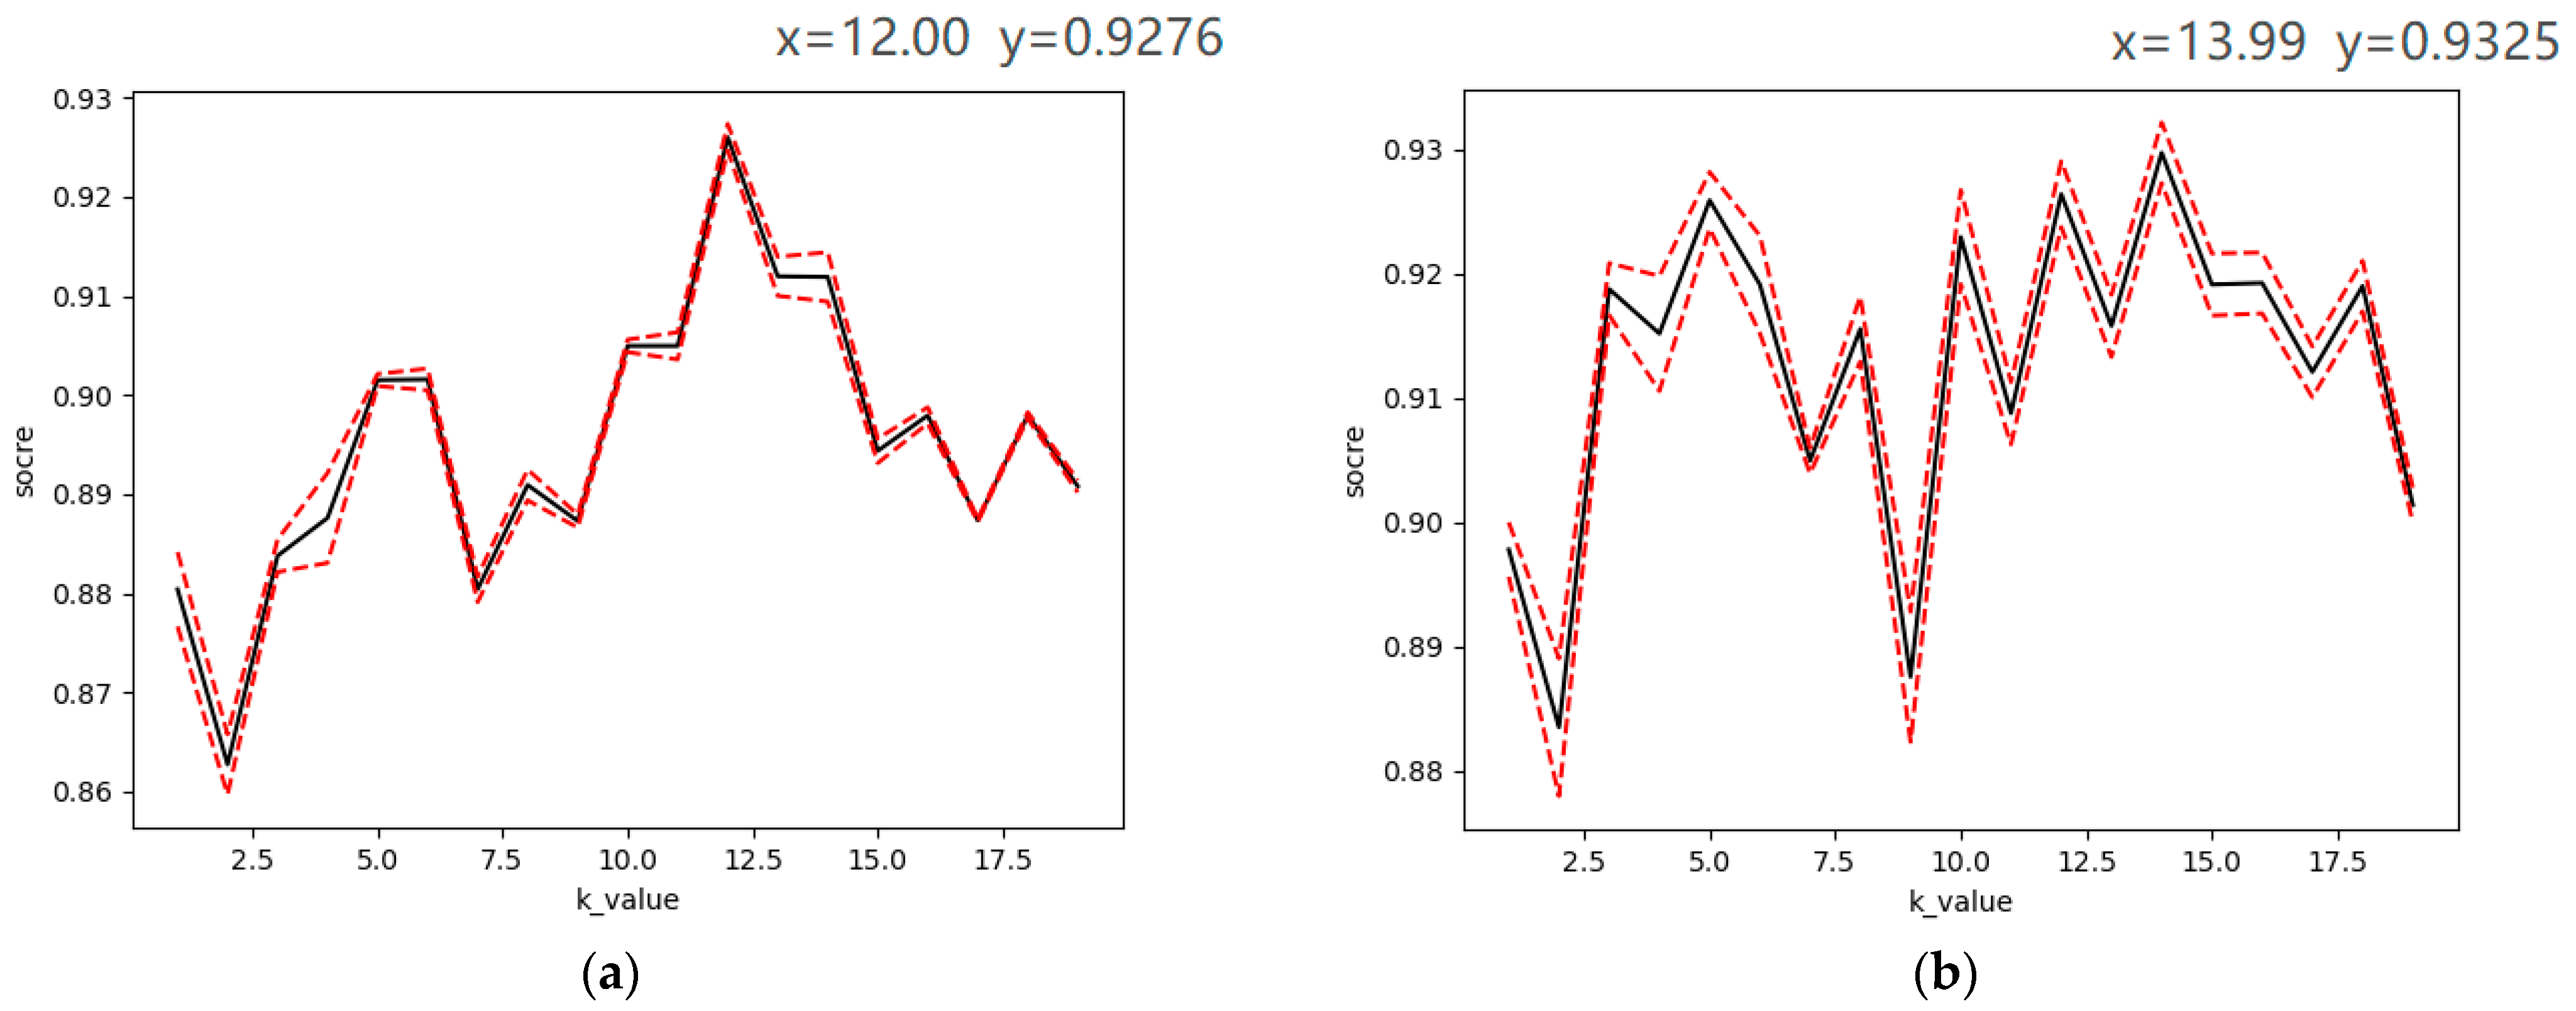
4.2.3. KNN Model Performance with Different k Values
4.2.4. Validation of Model Prediction Performance
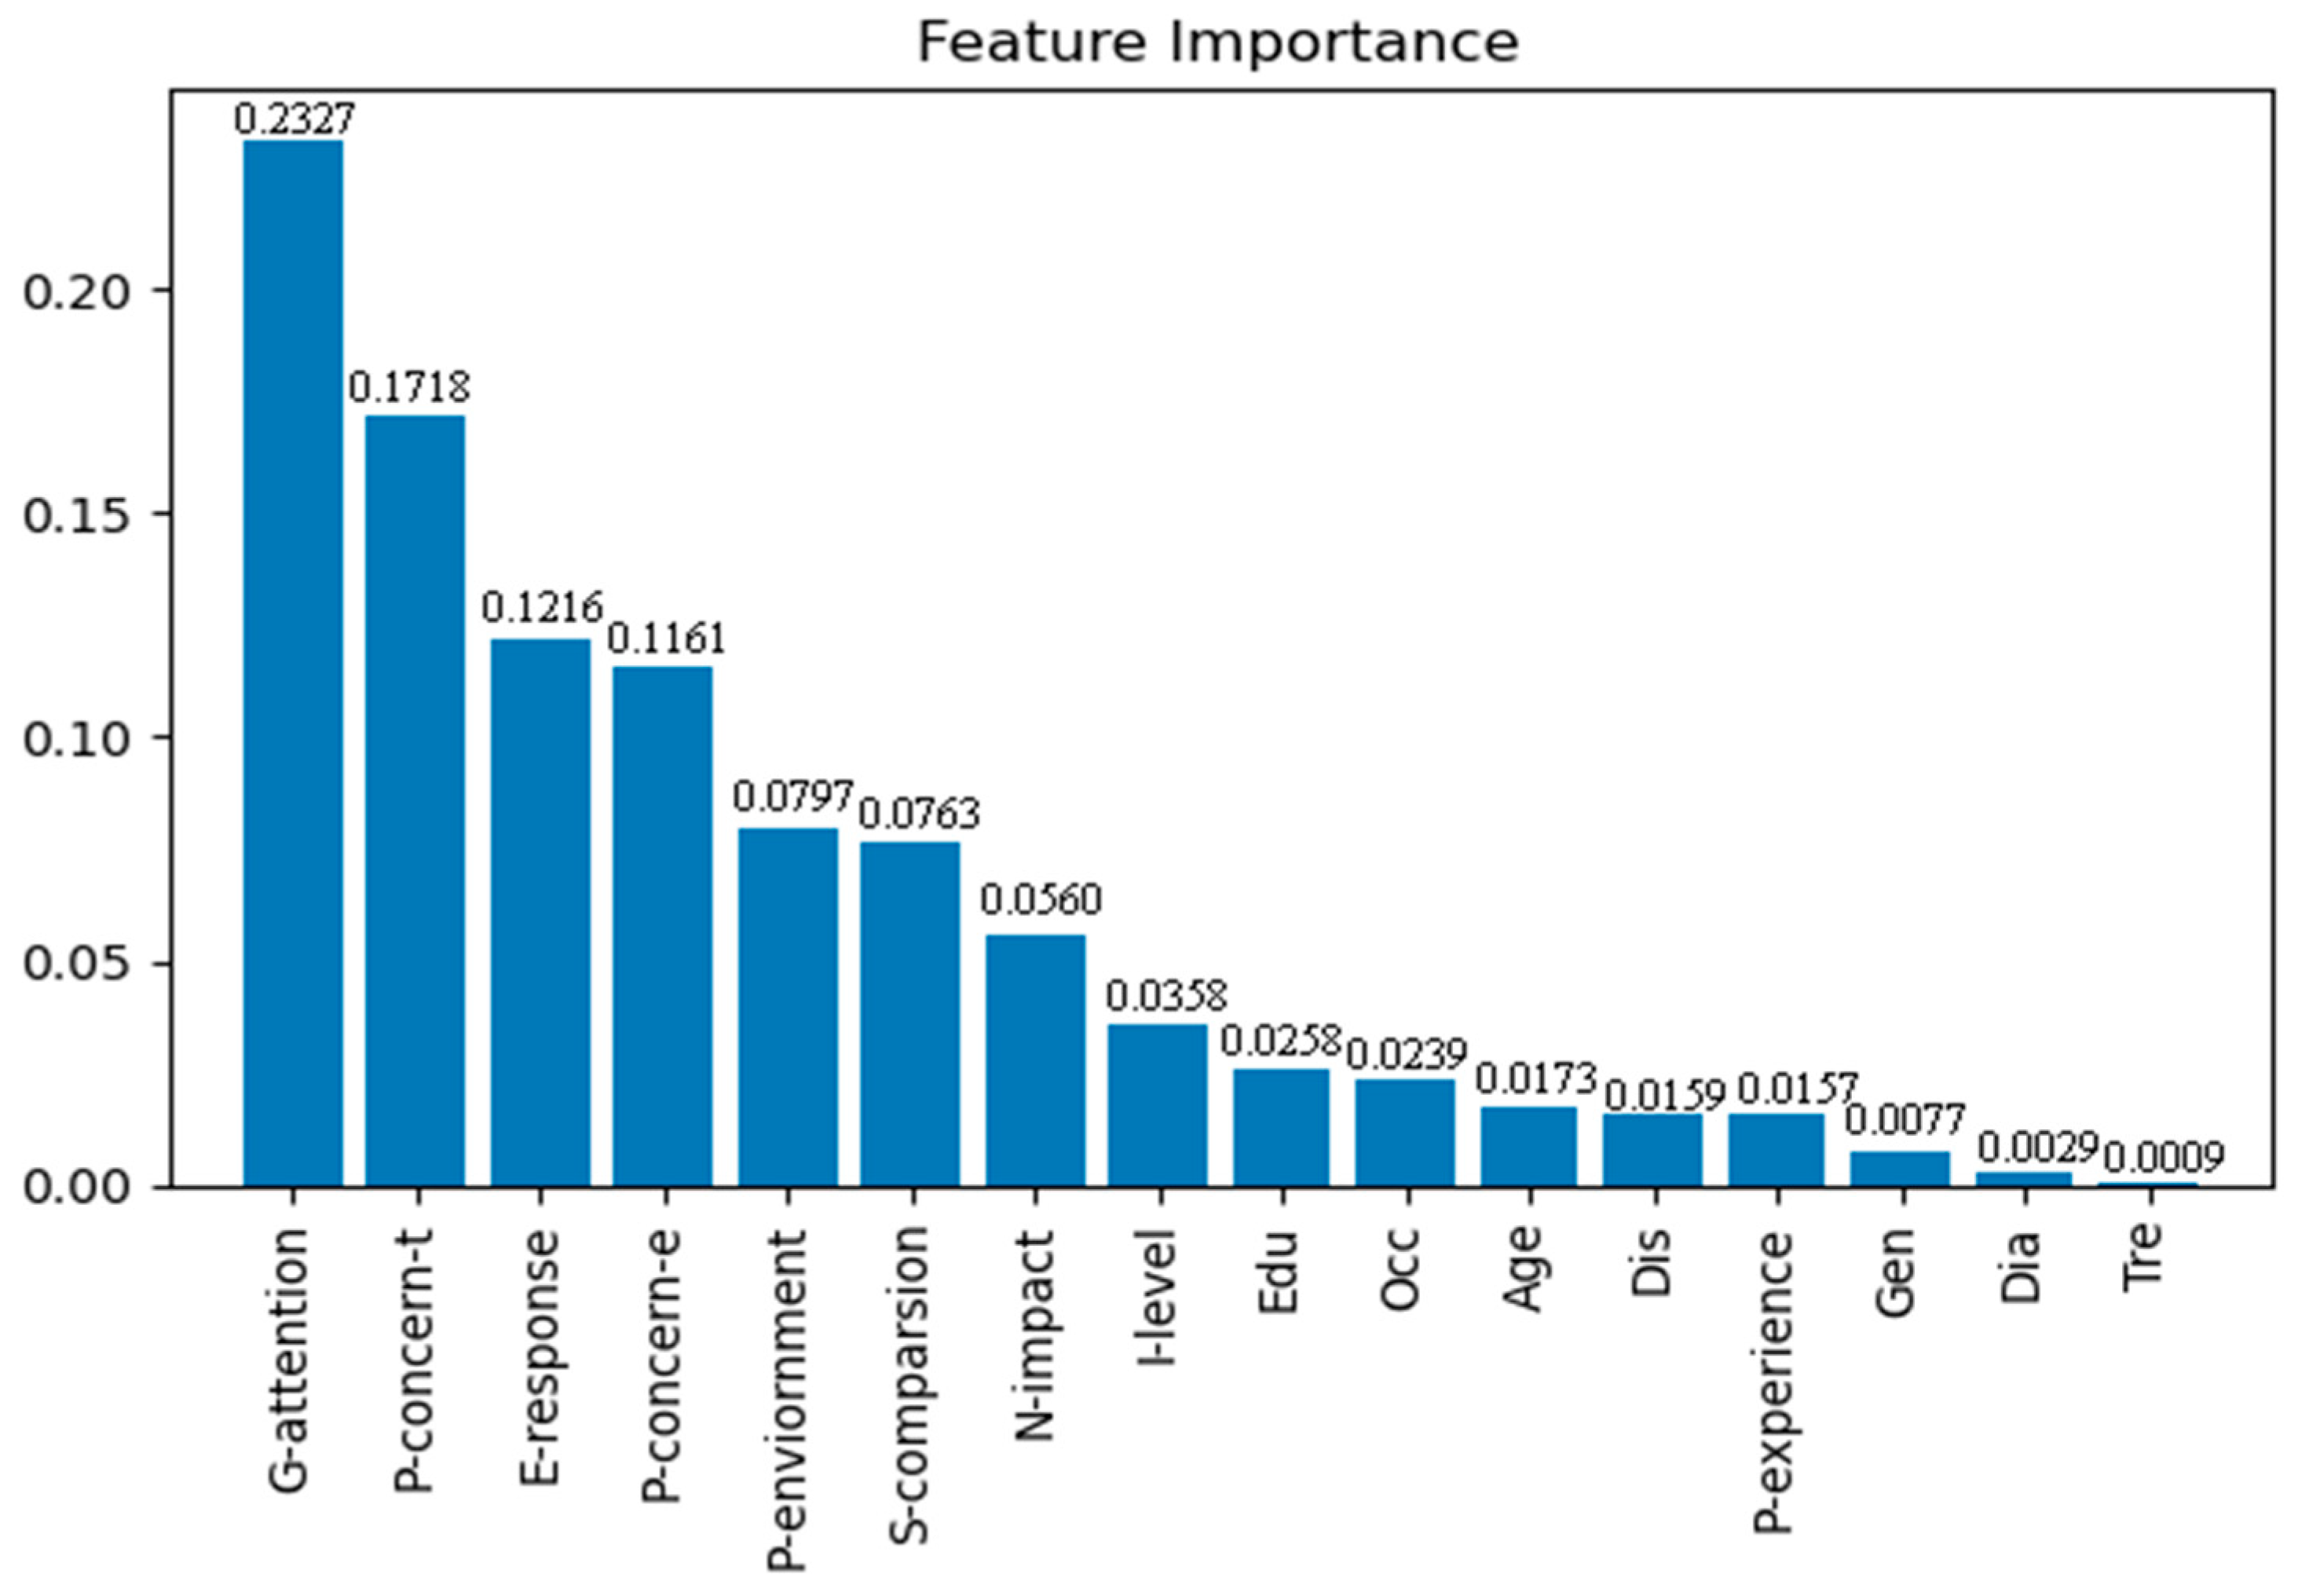
4.3. Feature Importance Assessment and Ranking Results
4.4. Discussion
4.5. Practical Implications
- (1)
- For the government, it is crucial to value and respect the expression of public opinions. This will help government departments identify issues and make corrections, thus enhancing public satisfaction with the government. Additionally, the government should pay close attention to public concerns. This can contribute to establishing a positive government image and foster trust and support from the public. Furthermore, regular education and guidance should be provided to enhance the public’s psychological coping ability and response capabilities during emergencies. This can help eliminate negative emotional responses.
- (2)
- Online media should prioritize timely and accurate reporting of social hot topics through official channels. Avoiding the dissemination of false information that could lead to social panic is crucial. Providing reliable and factual information fosters a positive social atmosphere and satisfaction with the government.
- (3)
- It is essential for the public to approach emergencies with a scientific and proactive mindset. Analyzing and resolving problems in a rational manner helps avoid excessive panic and suspicion. This strengthens individual feelings of security and contributes to preventing negative emotional responses.
5. Conclusions
Author Contributions
Funding
Data Availability Statement
Conflicts of Interest
References
- Wearne, S.H. Management of urgent emergency engineering projects. Proc. Inst. Civ. Eng. Munic. Eng. 2002, 151, 255–263. [Google Scholar] [CrossRef]
- Bouckaert, G. Comparing measures of citizen trust and user satisfaction as indicators of ‘good governance’: Difficulties in linking trust and satisfaction indicators. Int. Rev. Adm. Sci. 2003, 69, 329–343. [Google Scholar]
- Bearth, A.; Siegrist, M. Are risk or benefit perceptions more important for public acceptance of innovative food technologies: A meta-analysis. Trends Food Sci. Technol. 2016, 49, 14–23. [Google Scholar] [CrossRef]
- Roe, E.; Schulman, P.R. Comparing Emergency Response Infrastructure to Other Critical Infrastructures in the California Bay-Delta of the United States: A Research Note on Inter-Infrastructural Differences in Reliability Management. J. Contingencies Crisis Manag. 2015, 23, 193–200. [Google Scholar] [CrossRef]
- Liu, Y.; Dong, F.; Li, G.; Pan, Y.; Qin, C.; Yang, S.; Li, J. Exploring the factors influencing public support willingness for banning gasoline vehicle sales policy: A grounded theory approach. Energy 2023, 283, 128448. [Google Scholar] [CrossRef]
- Yao, Q.; Chang, C.; Joshi, P.; McDonald, C. Climate change versus the water-energy-food nexus: The oldness or newness of the scientific issues as a factor in the deficit model and the hierarchy of response model. Environ. Dev. Sustain. 2022, 1–18. [Google Scholar] [CrossRef]
- Zidane, Y.J.-T.; Klakegg, O.J.; Andersen, B.; Hussein, B. “Superfast!” managing the urgent: Case study of telecommunications infrastructure project in Algeria. Int. J. Manag. Proj. Bus. 2018, 11, 507–526. [Google Scholar] [CrossRef]
- Zhu, W.; Wang, J.; Yang, L. A Method Research on Scenario Construction of Critical Infrastructure Incidents and Emergency Capacity Evaluation. Manag. Rev. 2016, 28, 59–65. (In Chinese) [Google Scholar]
- Yu, D.; Gao, L.; Zhao, S. Emergecny facility location-allocation problem with convex barriers. Syst. Eng. Theory Pract. 2019, 39, 1178–1188. (In Chinese) [Google Scholar]
- Yuan, Y.; Liu, Y.; Zhu, S.; Wang, J. Maximal preparedness coverage model and its algorithm for emergency shelter location. J. Nat. Disasters 2015, 24, 8–14. (In Chinese) [Google Scholar]
- Jin, J.; Yu, J.; Sun, Q.; Gao, Y. Modular co-evolution of digital infrastructure innovation: A case study of China’s public health emergency governance. Stud. Sci. Sci. 2021, 39, 713–724. (In Chinese) [Google Scholar]
- Mao, L.; Wen, L. The Influencing Factors of Academic Entrepreneurial Intention Research Based on TPB Model. Oper. Res. Manag. Sci. 2022, 31, 164–169. (In Chinese) [Google Scholar]
- Ren, Z.; Zhang, P.; Liu, J.; Lan, Y. Research on netizens’ emotion evolution in emergency based on machine learning. J. Phys. Conf. Ser. 2019, 1419, 012004. [Google Scholar] [CrossRef]
- Wazirali, R. An Improved Intrusion Detection System Based on KNN Hyperparameter Tuning and Cross-Validation. Arab. J. Sci. Eng. 2020, 45, 10859–10873. [Google Scholar] [CrossRef]
- Li, Y.; Liu, G.; Lu, G.; Jiao, L.; Marturi, N.; Shang, R. Hyper-Parameter Optimization Using MARS Surrogate for Machine-Learning Algorithms. IEEE Trans. Emerg. Top. Comput. Intell. 2019, 4, 287–297. [Google Scholar] [CrossRef]
- Kim, C.; Park, T. Predicting Determinants of Lifelong Learning Intention Using Gradient Boosting Machine (GBM) with Grid Search. Sustainability 2022, 14, 5256. [Google Scholar] [CrossRef]
- Deng, X.; Liu, Q.; Deng, Y.; Mahadevan, S. An improved method to construct basic probability assignment based on the confusion matrix for classification problem. Inf. Sci. 2016, 340–341, 250–261. [Google Scholar] [CrossRef]
- Song, E.; Yoo, H.J. Impact of social support and social trust on public viral risk response: A COVID-19 survey study. Int. J. Environ. Res. Public Health 2020, 17, 6589. [Google Scholar] [CrossRef]
- Miller, A.H.; Listhaug, O. Political Parties and Confidence in Government: A Comparison of Norway, Sweden and The United States. Br. J. Political Sci. 1990, 20, 357–373. [Google Scholar] [CrossRef]
- Soonhee, K. Public Trust in Government in Japan and South Korea: Does the Rise of Critical Citizen Matter? Public Adm. Rev. 2010, 70, 801–810. [Google Scholar]
- Whiting, A.; Williams, D.L. Why people use social media: A uses and gratifications approach. Qual. Mark. Res. 2013, 16, 362–369. [Google Scholar] [CrossRef]
- Zhu, D.; Wang, G. Influencing Factors and Mechanism of Netizens’ Social Emotions in Emergencies—Qualitative Comparative Analysis of Multiple Cases Based on Ternary Interactive Determinism (QCA). J. Intell. 2020, 39, 95–104. (In Chinese) [Google Scholar]
- Bandura, A.; Pastorelli, C.; Barbaranelli, C.; Caprara, G.U. Self-efficacy path ways in depression. J. Personal. Soc. Psychol. 1999, 76, 258–269. [Google Scholar] [CrossRef] [PubMed]
- Finucane, M.L.; Alhakami, A.; Slovic, P.; Johnson, S.M. The Affect Heuristic in Judgments of Risks and Benefits. J. Behav. Decis. Mak. 2000, 13, 1–17. [Google Scholar] [CrossRef]
- Connelly, S.; Gooty, J. Leading with emotion: An overview of the special issue on leadership and emotions. Leadersh. Q. 2015, 26, 485–488. [Google Scholar] [CrossRef]
- Swerdlow, B.; Johnson, S. How Will You Regulate My Emotions? A Multistudy Investigation of Dimensions and Outcomes of Interpersonal Emotion Regulation Interactions; University of California: Berkeley, CA, USA, 2019. [Google Scholar] [CrossRef]
- Rasmus, T.-K.; Karl, W.; Phillip, H.K. Practice makes perfect: Entrepreneurial-experience curves and venture performance. J. Bus. Ventur. 2014, 29, 453–470. [Google Scholar]
- Alexander, A.; Richard, C.; Sourav, R. A theory of entrepreneurial opportunity identification and development. J. Bus. Ventur. 2003, 18, 105–123. [Google Scholar]
- Preece, J. Sociability and usability in online communities: Determining and measuring success. Behav. Inf. Technol. 2001, 20, 347–356. [Google Scholar] [CrossRef]
- Liu, J.; Geng, L.; Xia, B.; Bridge, A. Never Let a Good Crisis Go to Waste: Exploring the Effects of Psychological Distance of Project Failure on Learning Intention. J. Manag. Eng. 2017, 33, 04017006. [Google Scholar] [CrossRef]
- Chu, H.; Yang, J.Z. Risk or Efficacy? How Psychological Distance Influences Climate Change Engagement. Risk Anal. Off. Publ. Soc. Risk Anal. 2020, 40, 758–770. [Google Scholar] [CrossRef]
- Spence, A.; Poortinga, W.; Pidgeon, N. The psychological distance of climate change. Risk Anal. Off. Publ. Soc. Risk Anal. 2012, 32, 957–972. [Google Scholar] [CrossRef] [PubMed]
- Li, Q.; Luo, R.; Zhang, X.; Meng, G.; Dai, B.; Liu, X. Intolerance of COVID-19-related uncertainty and negative emotions among chinese adolescents: A moderated mediation model of risk perception, social exclusion and perceived efficacy. Int. J. Environ. Res. Public Health 2021, 18, 2864. [Google Scholar] [CrossRef] [PubMed]
- Wang, Q.; Liu, J.; Zhang, L. Study on the Classification of K-Nearest Algorithm. J. Xi’an Technol. Univ. 2015, 35, 119–124+141. (In Chinese) [Google Scholar]
- Lyu, Z.; Yu, Y.; Samali, B.; Rashidi, M.; Mohammadi, M.; Nguyen, T.N.; Nguyen, A. Back-Propagation Neural Network Optimized by K-Fold Cross-Validation for Prediction of Torsional Strength of Reinforced Concrete Beam. Materials 2022, 15, 1477. [Google Scholar] [CrossRef] [PubMed]
- Jia, H.; Lin, J.; Liu, J. An Earthquake Fatalities Assessment Method Based on Feature Importance with Deep Learning and Random Forest Models. Sustainability 2019, 11, 2727. [Google Scholar] [CrossRef]
- Chen, G. Research on the practical dilemma and countermeasures of network public opinion governance of grassroots government. Netw. Secur. Technol. Appl. 2022, 03, 118–120. (In Chinese) [Google Scholar]
- Xu, L.; Ma, Y.; Wang, X. Study on Environmental Policy Selection for Green Technology Innovation Based on Evolutionary Game: Government Behavior vs. Public Participation. Chin. J. Manag. Sci. 2022, 30, 30–42. (In Chinese) [Google Scholar]
- Oliver, R.L. Cognitive, Affective, and Attribute Bases of the Satisfaction Response. J. Consum. Res. 1993, 20, 418–430. [Google Scholar] [CrossRef]
- Gerrity, M.S.; White, K.P.; Devellis, R.F.; Dittus, R.S. Physicians’reactions to uncertainty: Refining the constructs and scales. Motiv. Emot. 1995, 19, 175–191. [Google Scholar] [CrossRef]
- Dai, W.; Meng, G.; Zheng, Y.; Li, Q.; Dai, B.; Liu, X. The impact of intolerance of uncertainty on negative emotions in COVID-19: Mediation by pandemic-focused time and moderation by perceived efficacy. Int. J. Environ. Res. Public Health 2021, 18, 4189. [Google Scholar] [CrossRef]


| Prediction Positive | Description | Prediction Negative | Description | |
|---|---|---|---|---|
| Reference Positive | True Positive (TP) | Predicted as positive class. Correctly predicted. | False Positive (FN) | Predicted as negative class. Incorrectly predicted. |
| Reference Negative | False Positive (FP) | Predicted as positive class. Incorrectly predicted. | True Negative (TN) | Predicted as negative class. Correctly predicted. |
| Features | Items | Option | Coding | Features | Items | Option | Coding |
|---|---|---|---|---|---|---|---|
| Gen | Gender | Male | 1 | Occ | Occupation Type | Agricultural laborer | 1 |
| Female | 2 | Self-employed worker | 2 | ||||
| Age | Age | <30 | 1 | Company employee | 3 | ||
| 30–44 | 2 | Student | 4 | ||||
| 45–59 | 3 | Government employee | 5 | ||||
| >60 | 4 | Other occupation | 6 | ||||
| Edu | Educational Level | ≤Junior high school | 1 | Dis | Distance from Leishenshan Hospital | <1 km | 1 |
| Senior high school | 2 | 1–3 km | 2 | ||||
| Junior college | 3 | 3–6 km | 3 | ||||
| Undergraduate | 4 | 6–12 km | 4 | ||||
| ≥Graduate | 5 | >12 km | 5 | ||||
| Tre | Someone you know was admitted to Leishenshan Hospital for treatment | Yes | 1 | Dia | Someone you know has confirmed COVID-19 | Yes | 1 |
| No | 2 | No | 2 |
| Categories | Features | Items | Option | Coding | Numbers | References |
|---|---|---|---|---|---|---|
| Government attention | G-attention | Government concern about public concerns. | Insufficient attention | 0 | 156 | [18,19,20] |
| Extremely concerned | 1 | 289 | ||||
| Public concern | P-concern-t | Concern about the COVID-19 situation. | Insufficient attention | 0 | 202 | [21] |
| Extremely concerned | 1 | 243 | ||||
| P-concern-e | Concern about Leishenshan Hospital. | Insufficient attention | 0 | 245 | ||
| Extremely concerned | 1 | 200 | ||||
| Social comparison | S-comparison | Concern about comparisons with foreign countries. | Insufficient attention | 0 | 292 | [22,23] |
| Extremely concerned | 1 | 153 | ||||
| Emotional response | E-response | Emotional responses lead to support for all decisions. | Insufficient attention | 0 | 164 | [24,25,26] |
| Extremely concerned | 1 | 281 | ||||
| Prior experience | P-experience | Experienced other similar emergencies. | Heard or never experienced | 0 | 224 | [27,28] |
| Personal experience | 1 | 221 | ||||
| Interaction level | I-level | Frequent participation in topical discussions and interactions. | Low participation | 0 | 184 | [25,29] |
| Frequently participate | 1 | 261 | ||||
| Psychological distance | P-environment | Will not pollute the surrounding environment. | Some pollution to varying degrees | 0 | 142 | [30,31,32] |
| Will not pollute | 1 | 175 | ||||
| Potential pollution hazards | 2 | 128 | ||||
| N-impact | Has not had negative impacts on life. | Some impact to varying degrees | 0 | 95 | ||
| No impact | 1 | 206 | ||||
| Negligible impact | 2 | 144 | ||||
| Public’s support | support | Public support for emergency infrastructure projects. | Dissatisfied | 0 | 173 | [33] |
| Strongly supportive | 1 | 272 |
| Features | Option | Number | Percentage |
|---|---|---|---|
| Gen | Male | 205 | 46.1% |
| Female | 240 | 53.9% | |
| Age | <30 | 168 | 37.8% |
| 30–44 | 117 | 26.3% | |
| 45–59 | 86 | 19.3% | |
| >60 | 74 | 16.6% | |
| Edu | ≤Junior high school | 78 | 17.5% |
| Senior high school | 146 | 32.8% | |
| Junior college | 110 | 24.7% | |
| Undergraduate | 104 | 23.4% | |
| ≥Graduate | 7 | 1.6% | |
| Occ | Agricultural laborer | 37 | 8.3% |
| Self-employed worker | 37 | 8.3% | |
| Company employee | 64 | 14.4% | |
| Student | 62 | 13.9% | |
| Government employee | 32 | 7.2% | |
| Other occupation | 213 | 47.9% | |
| Dis | <1000 m | 10 | 2.2% |
| 1000–3000 m | 59 | 13.3% | |
| 3000–6000 m | 60 | 13.4% | |
| 6000–12,000 m | 253 | 56.9% | |
| >12,000 m | 63 | 14.2% | |
| Dia | True | 69 | 15.5% |
| False | 376 | 84.5% | |
| Tre | True | 32 | 7.2% |
| False | 413 | 92.8% |
| Categories | Features | N | Mean | Standard Deviation | Skewness | Kurtosis |
|---|---|---|---|---|---|---|
| Government attention | G-attention | 445 | 0.65 | 0.478 | −0.629 | −1.612 |
| Public concern | P-concern-t | 445 | 0.55 | 0.498 | −0.186 | −1.974 |
| P-concern-e | 445 | 0.45 | 0.498 | 0.204 | −1.967 | |
| Social comparison | S-comparison | 445 | 0.34 | 0.476 | 0.660 | −1.572 |
| Emotional response | E-response | 445 | 0.63 | 0.483 | −0.547 | −1.709 |
| Prior experience | P-experience | 445 | 0.50 | 0.501 | 0.014 | −2.009 |
| Interaction level | I-level | 445 | 0.59 | 0.493 | −0.353 | −1.884 |
| Psychological distance | P-environment | 445 | 0.97 | 0.779 | 0.055 | −1.349 |
| N-impact | 445 | 1.11 | 0.725 | −0.171 | −1.086 | |
| Public’s support | support | 445 | 0.61 | 0.488 | −0.458 | −1.798 |
| Gen | Age | Edu | Occ | Dis | Dia | Tre | |
|---|---|---|---|---|---|---|---|
| ER1 | 0.014 | 0.069 | 0.014 | 0.105 * | 0.065 | –0.121 * | –0.055 |
| Parameter of GridSearchCV Method | Options | Parameter of GridSearchCV Method | Options |
|---|---|---|---|
| estimator | KNeighborsClassifier | n_jobs | 1 |
| param_grid | n_neighbors: range [0,20] | verbose | 0 |
| cv | 5 or 10 | refit | True |
| scoring | accuracy | iid | True |
| m-Fold Cross-Validation | Value of Nearest Neighbor Parameter k | Grid Search Accuracy |
|---|---|---|
| Five-fold cross-Validation | 12 | 92.25% |
| Ten-fold cross-Validation | 8 | 93.66% |
| Evaluation Metrics | Learning Curve with m-Fold Cross-Validation | Grid Search | |||
|---|---|---|---|---|---|
| Five-Fold (k = 12) | Ten-Fold (k = 14) | Five-Fold (k = 12) | Ten-Fold (k = 8) | ||
| Accuracy | 94.44% | 95.83% | 94.44% | 95.83% | |
| Recall | 0 | 93.00% | 96.00% | 93.00% | 96.00% |
| 1 | 96.00% | 96.00% | 96.00% | 96.00% | |
| Precision | 0 | 93.00% | 93.00% | 93.00% | 93.00% |
| 1 | 96.00% | 98.00% | 96.00% | 98.00% | |
| F1-score | 0 | 93.00% | 95.00% | 93.00% | 95.00% |
| 1 | 96.00% | 97.00% | 96.00% | 97.00% | |
| Actual Public Support Intention | 1 | 0 | 0 | 0 | 0 | 1 | 0 | 0 | 1 | 0 | 0 | 1 | 1 | 0 | 0 | 1 | 1 | 1 | 0 | 1 |
| Model Prediction Result (k = 8) | 1 | 1 | 0 | 0 | 0 | 0 | 0 | 1 | 1 | 0 | 1 | 1 | 1 | 0 | 1 | 1 | 1 | 1 | 0 | 1 |
| Model Prediction Result (k = 14) | 1 | 1 | 0 | 1 | 0 | 0 | 0 | 1 | 1 | 0 | 1 | 1 | 1 | 1 | 1 | 1 | 1 | 1 | 0 | 1 |
Disclaimer/Publisher’s Note: The statements, opinions and data contained in all publications are solely those of the individual author(s) and contributor(s) and not of MDPI and/or the editor(s). MDPI and/or the editor(s) disclaim responsibility for any injury to people or property resulting from any ideas, methods, instructions or products referred to in the content. |
© 2023 by the authors. Licensee MDPI, Basel, Switzerland. This article is an open access article distributed under the terms and conditions of the Creative Commons Attribution (CC BY) license (https://creativecommons.org/licenses/by/4.0/).
Share and Cite
Cui, C.; Cao, H.; Shao, Q.; Xie, T.; Li, Y. Research on the Public’s Support for Emergency Infrastructure Projects Based on K-Nearest Neighbors Machine Learning Algorithm. Buildings 2023, 13, 2495. https://doi.org/10.3390/buildings13102495
Cui C, Cao H, Shao Q, Xie T, Li Y. Research on the Public’s Support for Emergency Infrastructure Projects Based on K-Nearest Neighbors Machine Learning Algorithm. Buildings. 2023; 13(10):2495. https://doi.org/10.3390/buildings13102495
Chicago/Turabian StyleCui, Caiyun, Huan Cao, Qianwen Shao, Tingyu Xie, and Yaming Li. 2023. "Research on the Public’s Support for Emergency Infrastructure Projects Based on K-Nearest Neighbors Machine Learning Algorithm" Buildings 13, no. 10: 2495. https://doi.org/10.3390/buildings13102495