Article

A Sustainable Evaluation Study Based on Emergy–Geographic Information System (GIS) Methodology in Hangzhou City from 2010 to 2035

1
School of Architecture, Sanjiang University, Nanjing 210012, China
2
Yangzhou Survey Design Research Institute Co., Ltd., Yangzhou 225000, China
3
School of Civil Engineering and Architecture, Jiangsu University of Science and Technology, Zhenjiang 212100, China
*
Author to whom correspondence should be addressed.
Buildings 2023, 13(10), 2445; https://doi.org/10.3390/buildings13102445
Submission received: 31 July 2023 / Revised: 19 September 2023 / Accepted: 23 September 2023 / Published: 26 September 2023

Abstract

:
Sustainability studies are vital for the long-term development of ecological cities. For cities, single qualitative or quantitative evaluation studies cannot effectively illustrate the ecological and sustainable status of a city. This study employs the emergy–geographic information system (GIS) method to conduct a sustainability evaluation of a city, so as to effectively verify the evaluation results. The emergy method and GIS are both commonly used approaches to address urban issues, but their synergistic effect has rarely been considered, explored, and utilized in urban planning. This study aims to investigate this effect on Hangzhou city through comparative analysis. The results show that rain (geopotential energy) and rain (chemical potential energy) have the highest emergy values from 2000 to 2035, followed by solar emergy, wind emergy, and geothermal heat emergy. These findings are also supported by the GIS map that shows a similar pattern with renewable emergy. Using the five plots (cropland, woodland, grassland, water area, and built-up land) on the GIS map as examples, the accuracy of emergy calculation results for Hangzhou city can be verified, demonstrating the effectiveness of the emergy–GIS methodology. This research provides practical recommendations for city designers and professionals worldwide on urban sustainability. By incorporating both emergy and GIS methods, cities can make informed decisions toward achieving environmentally sustainable development.

1. Introduction

At present, the vast majority of people reside in urban areas, leading to numerous challenges such as urban heat islands, solid and water pollution, air pollution, traffic congestion, and more. Cities in China are facing a variety of issues, including outdated infrastructure, urban congestion, water and air pollution, public health crises, waste gas and solid pollution, urban heat island effects, and others [1]. To address these challenges, it is urgent to apply and practice the concept of sustainable development. Before initiating sustainable urban renewal and governance, it is crucial to evaluate the state of urban development. Therefore, urban sustainability assessment has become a critical research topic.
Urban sustainability analysis needs to assess the environmental, social, and economic impacts of urban development and operations. It aims to find balanced development strategies that meet current needs without compromising the ability of future generations to meet their own needs. Urban sustainability analysis typically involves the following aspects: (1) Environmental sustainability: evaluating resource efficiency, waste management, air quality, water resource management, and other factors to ensure that urban development does not exert excessive pressure on ecosystems. (2) Social sustainability: considering the social welfare, equity, and inclusivity of urban residents. This includes assessing education, healthcare services, community engagement, cultural preservation, and other factors to ensure that everyone can share in the benefits of urban development. (3) Economic sustainability: analyzing economic growth, employment opportunities, and innovation capacity in cities. This includes evaluating industrial diversity, entrepreneurial environments, and sustainable economic models to ensure long-term prosperity and development. Through urban sustainability analysis, governments, planners, and decision-makers can understand the overall impact of urban development and formulate corresponding policies and measures to promote sustainable development. This comprehensive analytical approach helps achieve a balance between the environment, society, and economy of cities, creating more sustainable and livable urban environments.
However, due to the complexity of urban sustainability and the wide range of aspects it encompasses, researchers have conducted their analysis and exploration from various different perspectives. These include ecological security [2,3,4], ecological footprint [5,6], urban symbiosis [7], ecological civilization construction [8], ecological network [9], environmental quality [10], ecological smart city [11,12], ecological livability assessment [13], emergy analysis [14], ecological literacy [15], ecological pattern [16], ecological risks [17], and more. These analytical perspectives provide theoretical support for the design and development of sustainable cities, offering various insights for urban managers and designers. They contribute to the improvement and enhancement of urban sustainability.
In the field of urban sustainability, GIS methods and emergy methods are two mainstream research approaches that assess the sustainable state of cities from quantitative and qualitative perspectives. The GIS approach has been widely used in urban research, encompassing areas such as bibliometric analysis [18], dynamic evaluation [19], disaster susceptibility [20], smart perspective [21,22], ecological risk [23], urban greenspace accessibility [24], ecological security [25], land-use change assessment [26], and more. The emergy method is also frequently utilized in urban research [27,28,29,30,31,32,33,34,35,36,37,38,39,40]. Its advantage lies in the ability to quantitatively calculate various inputs and outputs of urban systems, which facilitates a clear identification of the sustainability status of the city system.
Therefore, some researchers have combined emergy and GIS methods to analyze and explore the sustainability of urban systems. This methodological approach effectively leverages the advantages of both approaches and enables precise positioning of urban sustainability. Emergy–GIS is a methodology based on ecology, economics, and GIS. This method can quantitatively and qualitatively evaluate the flow of materials and energy in a specific area, as well as the environmental and social impacts of these flows. Using this method, resource utilization efficiency and costs can be determined, and the consequences of various policy and technological choices can be predicted. Through the emergy–GIS method, the city can be divided into different subsystems, such as energy, water resources, waste treatment, and transportation, and each subsystem can be assessed. In this way, different aspects od a city’s sustainability, such as resource utilization efficiency, environmental impact, and social justice, can be determined. Considering the two aspects of the emergy–GIS evaluation method, the quantitative evaluation more readily enables comparisons and is more accurate, while the qualitative evaluation is more suitable for determining long-term goals and planning. Therefore, both are necessary for the assessment of urban sustainability.
Until now, the emergy–GIS method mainly focused on family farm analysis [41], resource monitoring applications [42], evaluation of renewable resources [43], sustainability studies of rivers [44], land use analysis [45], landscape classification [46], product productivity analysis [47], sponge city design [48], and ecosystem structure [49]. The current research lacks studies and analysis on urban sustainability, and this article precisely fills this gap. The purpose of this article is to use the emergy–GIS method to quantify and qualify the sustainability of the entire urban system, to compare and analyze the similarities and differences between the two, to identify key influencing factors, and to provide improvement measures and efficacy analysis, in order to provide city managers and designers with new choices and references.

2. Materials and Methodology

2.1. Emergy–GIS Framework Design

In this study, an emergy–GIS framework has been built by integrating the emergy method and GIS approach for evaluating eco-cities. The framework is presented in Figure 1. The emergy method provides quantitative calculation of all resource and service inputs in the city, while GIS simulation offers clear images to validate the accuracy of emergy calculations.
In the overall research framework, urban studies serve as the core focus. Through the combined assessment and computation using the energy valuation method and GIS method, the sustainability changes of the entire urban system are analyzed, and specific improvement measures are proposed. The energy valuation method involves input factors such as biodiversity energy value, soil organic matter energy value, water body energy value, industrial waste energy value, and artificial energy value. The GIS method incorporates five elements: solar energy, potential energy of rainwater, chemical energy of rainwater, wind energy, and geothermal energy.
The GIS software (10.3) used in this study is ArcGIS version 10.3. The core steps of utilizing the emergy–GIS methodology include confirmation of area boundary conditions, simulation of various types of pictures (such as water, buildings, forest, grass, etc.), and the emergy assessment of each type of land in the city. In order to predict changes in urban form, the Cellular automata–Markov methodology was adopted. The cellular automata Markov methodology is a method used for simulating and predicting spatial changes. This approach is based on the cellular automaton model, where the study area is divided into small units called cells. Each cell has a specific state and transition rules. By using the probability transition matrix of Markov chains, it models the state changes between cells and predicts future spatial patterns. This methodology is widely applied in fields such as land use, urban development, and environmental management, providing strategies and decision support for understanding future spatial changes.

2.2. Emergy Introduction and Model

2.2.1. Emergy Introduction

The concept of emergy was first proposed by H.T. Odum, and has the unique advantage of evaluating the resource and service value based on available energy from solar energy. The use of transformity allows for the comparison of different types of energy, expressed as sej/g or sej/$ for one unit of each product or service, respectively [50]. Using the emergy method, several systems have achieved efficient comparative calculations on a unified platform, providing valuable management strategies for resources [51,52,53]. In this paper, the emergy baseline is set at 12.0 × 1024 sej/year [54].

2.2.2. Emergy Calculation

The specific emergy calculation equation can be found in (1)
E i = ( M i × U E V i )
where Ei is the total emergy; M i is the inputs (mass, energy, and service); and U E V i is the transformity for the inputs.
Calculations of biodiversity require special instructions, as they involve long-term estimates of deoxyribonucleic acid (DNA) diversity spanning approximately one billion years. Previous research suggests that over two billion years, there have been roughly 1.5 × 10⁹ species. Based on this estimate, the unit emergy value (UEV) of species can be calculated using the latest emergy baseline (12.0 × 1024 sej/yr), as follows:
U E V = ( 12 × 10 24   sej / yr ) × ( 2 × 10 9   yr ) 1.5 × 10 9   species = 1.6 × 10 25   sej / species

2.2.3. Emergy Diagram

Figure 2 illustrates the emergy flow in Hangzhou city and is divided into four parts. On the left is renewable energy, which has five types: sunlight, rain-chemical, rain-geopotential, wind, and geothermal heat. The upper side shows the inputs of the city system elements, including four natural aspects (cropland, woodland, grassland, and water area) and two human elements (labor and service in built-up land). In the middle are two subsystems, the natural ecological system and the manual design system, respectively. Finally, both subsystems are summarized into the environment on the right.

2.2.4. Emergy Indicators

All the metrics considered in the analysis are listed in Table 1.

2.3. Natural Input Evaluation

In the evaluation of Hangzhou city using the emergy–GIS framework, only three parts were considered for analysis: vegetal biomass, soil organic matter, and surface water. Mineral and fossil energy sources in Hangzhou were not included in the calculation.

2.3.1. Vegetal Biomass

The functional distribution of vegetal biomass has been analyzed on the basis of different land uses [55]. The use of each land has been calculated by GIS software. The related raw data can be found in Table 1.

2.3.2. Soil Organic Matter

As a part of an urban system, soil organic matter should be considered in this paper. The equation used specifically to calculate organic matter was as follows:
E om = O M g × 3.5   kcal g × 4186   J kcal × U E V O M
where E om is the emergy of organic matter; O M is the amount of organic matter; and U E V O M is the unit emergy value of the organic matter, which is 1.18 × 10⁴ sej/j.

2.3.3. Surface-Water Emergy Calculation

In this paper, there is a hypothesis that the annual runoff volume is equal to the accumulated surface water for the city. The surface water emergy is represented by Equations (4) and (5)
F i = V × ρ W × G
where Fi is the energy of the surface water (J); V is the volume of water m 3 ;   ρ w is water density (1000 kg/m3); and G represents the Gibbs free energy of surface water, 4940 J/kg; and
E f = F i × U i
where E f is the emergy of surface water in the city ( s e j ) ; and U i ( s e j / J ) is the unit emergy value (2.05 × 10⁴ sej/J) of surface water [56].

2.3.4. Industrial Pollutant Emergy Calculation

Industrial pollutants will hurt human health, so their related damage degree needs to be assessed. In general, the following equations can be used:
Firstly, the human health effect level can be found from Equation (6),
L = W i × D i × α
where L, i, Wi, Di, and α show the human health effect in terms of emergy loss, amount of exhaust gas, disability-adjusted life year, and emergy loss to humans per year (1.68 × 10¹⁶ sej/(a·person)), respectively.
The exhaust gas amount is obtained from Formula (7):
M i = c × ( U i × 10 6 S i )
where Mi is the dilution air amount (kg/a); i is the gas type; C is the air density (1.23 kg/m3); Ui is annual air pollutants mass, kg/a; and si is the acceptable concentration, in mg/m3.
The ecological service emergy can be represented as (8)
R a i r , i = 0.5 M i v 2 T w
where Rair,i is the environmental emergy; v is the wind speed (3 m/s); and Tw is the wind transformity (1.86 × 10³ sej/j).
Mud emergy can be found from Equation (9)
S L M = Z m u d P L β L
where SLM, Zmud, PL, and βL are the mud emergy, mud value (2.32 ha), land demand, and transformity of land, respectively.

2.3.5. Emergy of Human-Made System

In this paper, the human-made system is mainly the buildings, which include the transportation facilities. The specific emergy of land use can be calculated from Equation (10):
E b u i l d i n g = A 1 × N f × h f A 2 × U E V b u i l d i n g
where E b u i l d i n g is the emergy of building in Hangzhou city; A 1 is the area of urban land use; N f is the number of the average floor in the region; h f is the average height; and U E V b u i l d i n g is the transformity, of value 1.41 × 10¹⁵ sej/m3 [57].

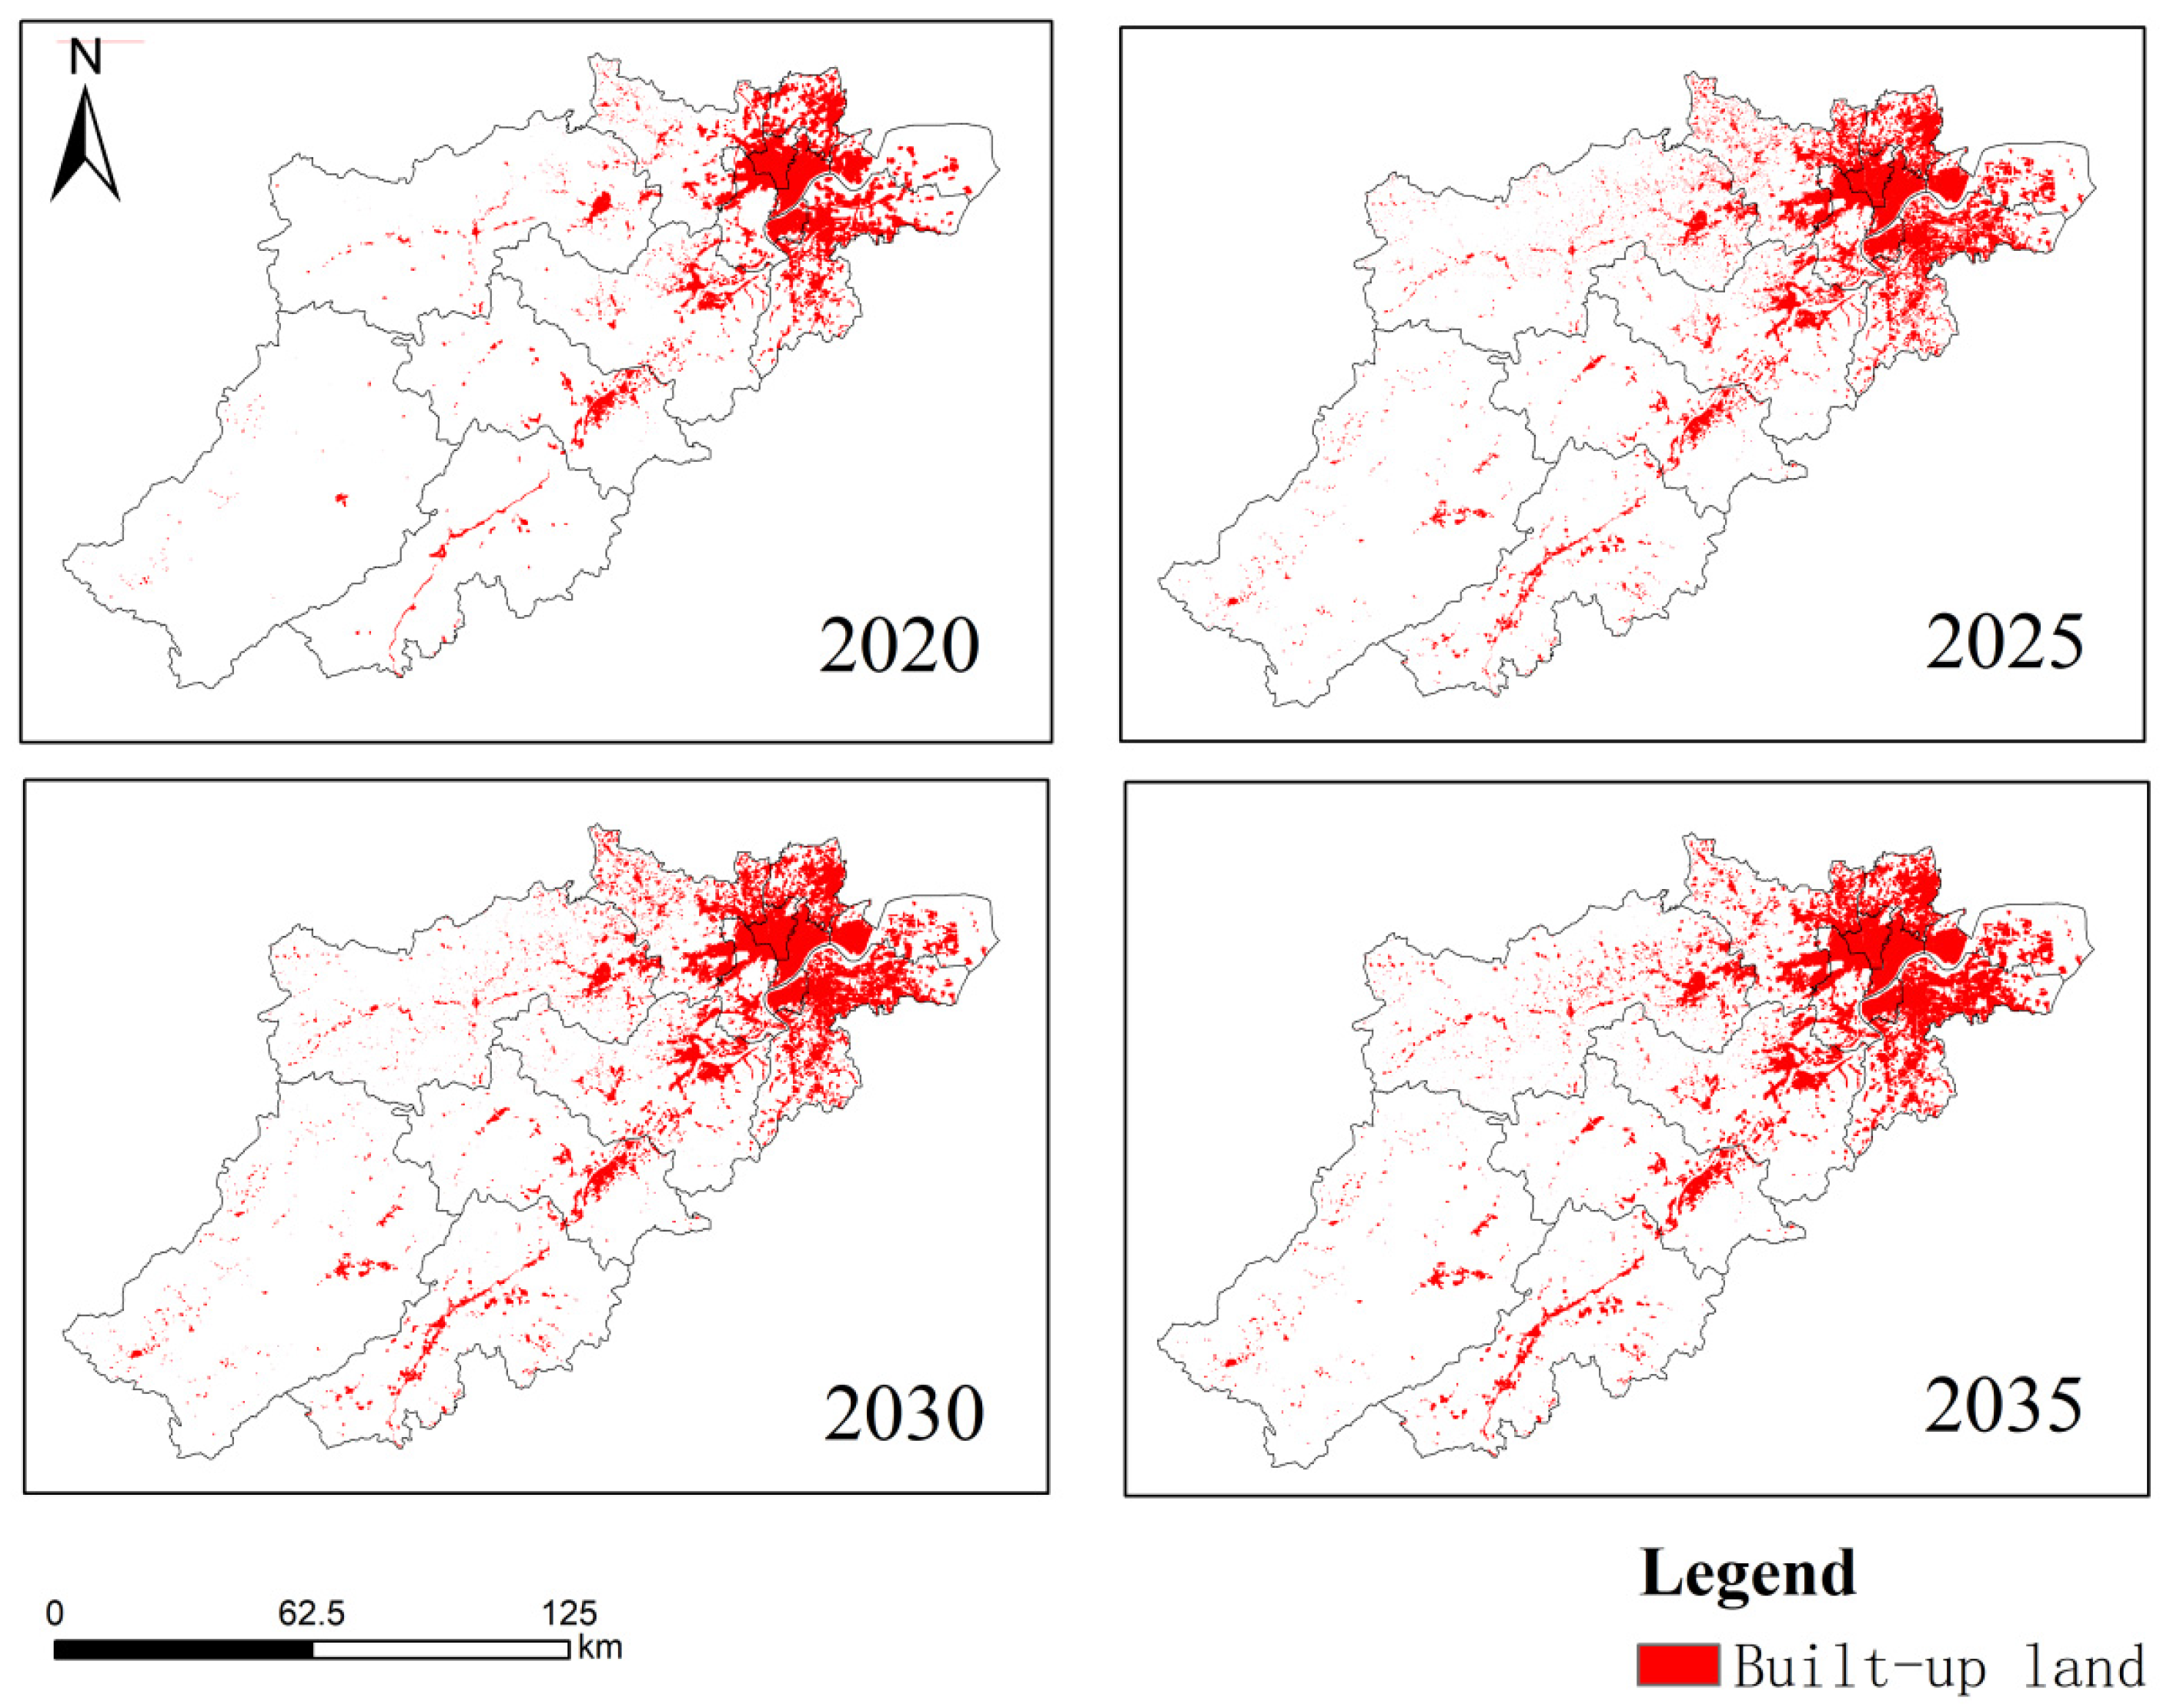
2.4. GIS Method (CA–Markov)

GIS methodshave been widely used in the analysis and prediction of land use changes in urban areas, most notably the cellular automata–Markov chain (CA–Markov) model. This approach combines the spatial analysis capabilities of GIS with the predictive power of the CA–Markov model to assess urban sustainability.
The CA–Markov model utilizes historical data on land use patterns and transition probabilities to simulate future scenarios of land use change. By integrating various spatial and non-spatial factors such as population growth, economic development, environmental constraints, and policy regulations, the model can provide valuable insights into the potential impacts of different land use planning strategies on urban sustainability.
Through the application of the CA–Markov model within a GIS framework, researchers can evaluate the efficiency and effectiveness of current and proposed urban development plans. The model enables precise identification of areas at high risk of unsustainable land use practices and aids in the formulation of targeted interventions for sustainable urban growth.
Overall, the integration of GIS methods, particularly the CA–Markov model, provides a powerful tool for analyzing and predicting land use changes in urban systems. It supports decision-making processes towards achieving more sustainable and resilient cities.

2.5. Study Area

Hangzhou is located in the southern part of the Yangtze River Delta, at the western end of Hangzhou Bay, downstream of the Qiantang River, and at the southern end of the Beijing–Hangzhou Grand Canal. It is an important central city in the Yangtze River Delta and a transportation hub in southeastern China. Its geographical coordinates are approximately 29°11′ to 30°34′ north latitude and 118°20′ to 120°37′ east longitude. The city center is situated at 120°12′ east longitude and 30°16′ north latitude, with a total area of 16,850 square kilometers. Hangzhou is located in the southern part of the Yangtze River Delta and the Qiantang River basin, characterized by diverse terrain. The western part of Hangzhou belongs to the Zhejiang–Western Hills region, with major mountain ranges such as Tianmu Mountain. The eastern part belongs to the Zhejiang-North Plain, characterized by low-lying terrain, dense river networks, abundant lakes, and rich natural resources. Hangzhou lies in the subtropical monsoon zone, experiencing a subtropical monsoon climate with distinct seasons and abundant rainfall. The average annual temperature is 17.8 °C, with an average relative humidity of 70.3%. The annual precipitation is 1454 mm, and the annual sunshine hours are 1765. Hangzhou boasts a natural environment of rivers, lakes, mountains, and hills. The city’s hilly and mountainous areas account for 65.6% of the total area, plains occupy 26.4%, and rivers, lakes, and reservoirs cover 8% (Figure 3).
In 2020, Hangzhou achieved a regional gross domestic product (GDP) of 1610.6 billion yuan, representing a growth of 3.9% compared to the previous year. Breaking it down by sectors, the value added by the primary industry was 32.6 billion yuan, a decrease of 1.1%; the value added by the secondary industry was 4821 billion yuan, an increase of 2.3%; and the value added by the tertiary industry was 10,959 billion yuan, showing a growth of 5.0%. The structure of the three industries was 2.0:29.9:68.1.
Table 2 presents data on six types of terrain for the years 2000, 2010, and 2020 in Hangzhou. However, it is uncertain what will happen to each plot after 2020. Therefore, this paper will simulate plot change maps using GIS software for the years 2025, 2030, and 2035. Unfortunately, due to the lack of data, only a general assessment can be made regarding these future years.
Figure 2 shows the area of each land type. In order to improve the efficiency of the simulation, the years selected were 2000, 2010, 2020, 2025, 2030, and 2035, with six land types: cropland, woodland, grassland, water area, built-up land, and unused land. Due to the high level of development in the local area, land has a relatively small proportion and will not be the focus of discussion in this section. By analyzing the data set, we can determine a prediction model to forecast the future trends in land use changes for the different land types.

3. Results and Discussion

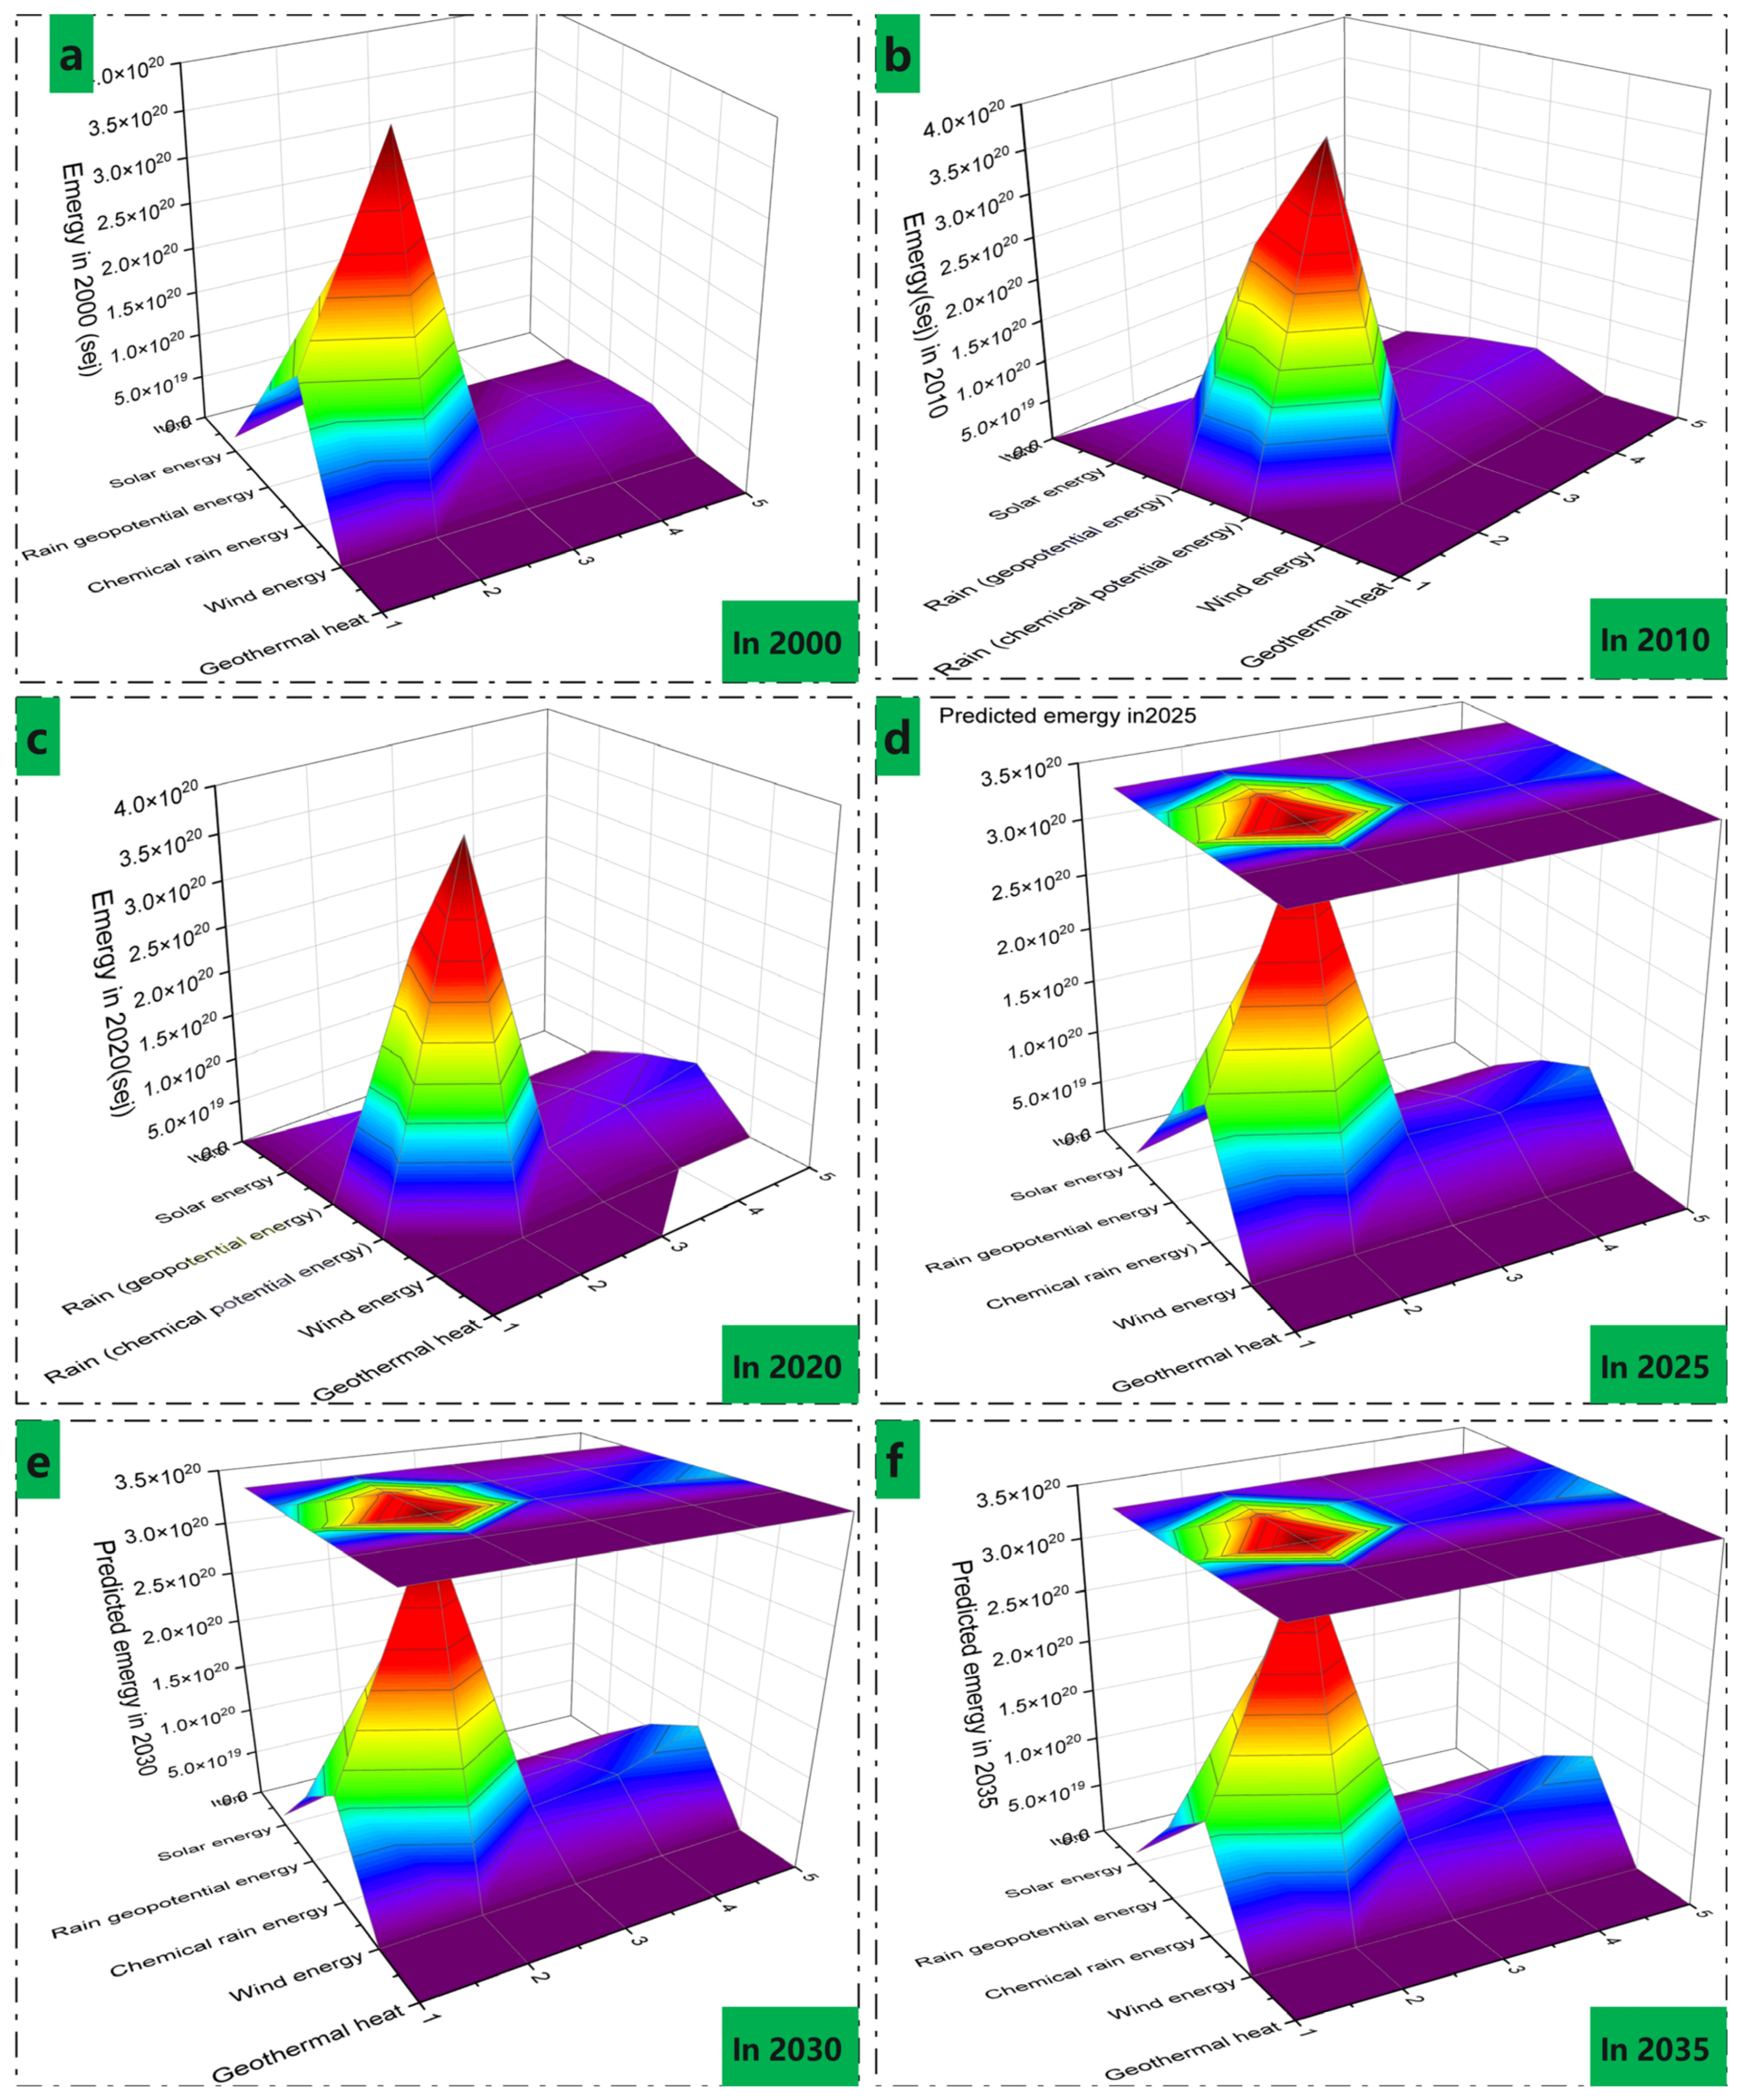
3.1. Emergy Part Result

3.1.1. Basic Emergy Calculation

Table 3 presents the raw data inputs for Hangzhou city in 2020. The whole table has two parts: one is natural ecological input, which involves biodiversity, surface water and groundwater; the other is artificial input, comprising roads, rails and buildings.

3.1.2. Renewable Emergy Calculation for Six Types of Plots

Table 3 represents the input-type calculation for Hangzhou city in 2020, involving the natural spatial storage capacity and the artificial system storage capacity. This provides data support for calculating the renewable energy value and non-renewable energy value of the entire city. Additionally, it further calculates key indicators such as energy load factor, energy generation rate, and environmental sustainability parameters.
In Table 4, the renewable emergy data has been calculated and the specific calculations can be found in the Appendix A.
Table 4 and Figure 4 present the renewable emergy data and change for Hangzhou city. Rain (both geopotential energy and chemical potential energy) have the largest emergy values, followed by solar emergy. Wind emergy and geothermal heat play a minor role in the total renewable emergy in 2000. In Figure 4, the size of each emergy component is clearly shown in the cloud image. Compared to Figure 4a–c, the trends in variation are similar. The entire emergy tends to decrease because part of the ecological land has been occupied by building land from 2000 to 2020. These changes are consistent with the trend observed in the variation of natural ecological input and artificial input over time.
In addition to the calculations based on actual data in 2000, 2010, and 2020, emergy calculations for predicted renewable parts in 2025, 2030, and 2035 were also performed. Figure 4d–f reveals the concentration of emergy degrees across the five aspects considered. These sub-figures demonstrate that the emergy is concentrated in solar energy and rain (both geopotential energy and chemical potential energy), which account for more than 95% of the total renewable emergy for Hangzhou city. The GIS maps of 2025, 2030, and 2035 are predictive maps generated using the CA–Markov prediction model. Although these maps are based on predictions, they exhibit similar change trends to the actual data from 2000, 2010, and 2020. This similarity indicates the reliability of the predictive model.

3.2. GIS Part Discussion

3.2.1. Validation of the GIS Method

To ensure the accuracy of the research results, the effectiveness of the GIS simulation was analyzed before its application in this study. The year 2020, with the most available data, was selected for GIS simulation validation. In this comparison, the error standard between the actual situation and the predicted effect should be within 3% to indicate that the GIS simulation calculation is valid.
Figure 5 shows the six types of feature plates simulated according to the real data of 2020, which are cropland, woodland, grassland, water area, built-up land, and unused land. Based on the total calculation data, the area error of the two drawings is within 3%, indicating that the GIS simulation is accurate. Taking the water area as an example, a comprehensive comparative analysis was conducted based on position, size, and shape aspects. It was found that there was little change in the position of the water area, mainly in the northeast and southwest regions. Regarding the size of the water area, there was also no significant difference between the actual and simulated data. The overall shape of the water area did not change much, except for slight differences, and the main variation was concentrated in the small rivers.
To sum up, the errors of the five sub-items were calculated, which were 4.2% for cropland, 3.9% for woodland, 4.1% for grassland, 1.3% for water area, and 5.1% for built-up land. Overall, the GIS software simulation is effective and can be used for further simulation analysis. In conclusion, the effectiveness of the GIS simulation was analyzed to ensure the accuracy of the research results. The results demonstrate that the GIS simulation is reliable and can be used to inform sustainable development strategies for Hangzhou city and other urban areas.

3.2.2. The Comparison Analysis Based on Emergy and GIS from 2000 to 2010

Figure 6(1) presents the analysis of Hangzhou city from 2000 to 2020 based on real data. The area of farmland is seen to be decreasing, while the floor space is increasing rapidly from 2000 to 2020, especially in the northeast region of Hangzhou. The cropland area decreased by 5.2% (23.3%) from 2000 to 2010 (2020), while built-up space in 2010 was 50% higher than in 2000 and had increased nearly 1.5 times by 2020. However, the area of woodland appears to be almost unchanged visually across the GIS maps, which is supported by specific plate data. For example, the woodland was 100 square meters in 2000, while in 2010 (respectively 2020), 99.6% (respectively 99.7%) of the area was retained, highlighting the effectiveness of Hangzhou’s forest protection policies. In contrast, the grassland areas demonstrate an opposite trend, with grassland planting greatly encouraged to improve the ecological environment. Therefore, the area of grassland increased by 1.3 percent in 2010 and by 0.9 percent in 2020, positively contributing to the restoration of the ecological environment. From 2000 to 2010, the water area decreased by 5.57 percent, highlighting the need for sustainable water resource management policies. To ensure sustainable water resources, the government departments in Hangzhou city have implemented relevant policies and regulations to restrict the development and utilization of water resources. In 2020, the water area had increased by 17.3 percent compared to the data recorded in 2010, indicating that these policies and regulations are effective for maintaining sustainable water resources.
Using the CA–Markov prediction model, change trends have been displayed for Hangzhou city in 2025, 2030, and 2035 (in Figure 6(2)). The building area continues to expand, while the cropland area continues to decrease. By 2035, the built-up area has expanded to the southwest of Hangzhou, particularly along the Qiantang River. However, there is little change in the GIS maps of woodland, grassland, and water area, indicating that although the green area of Hangzhou has not changed significantly, the expansion of the city has had a negative impact on the sustainability of the city as a whole.

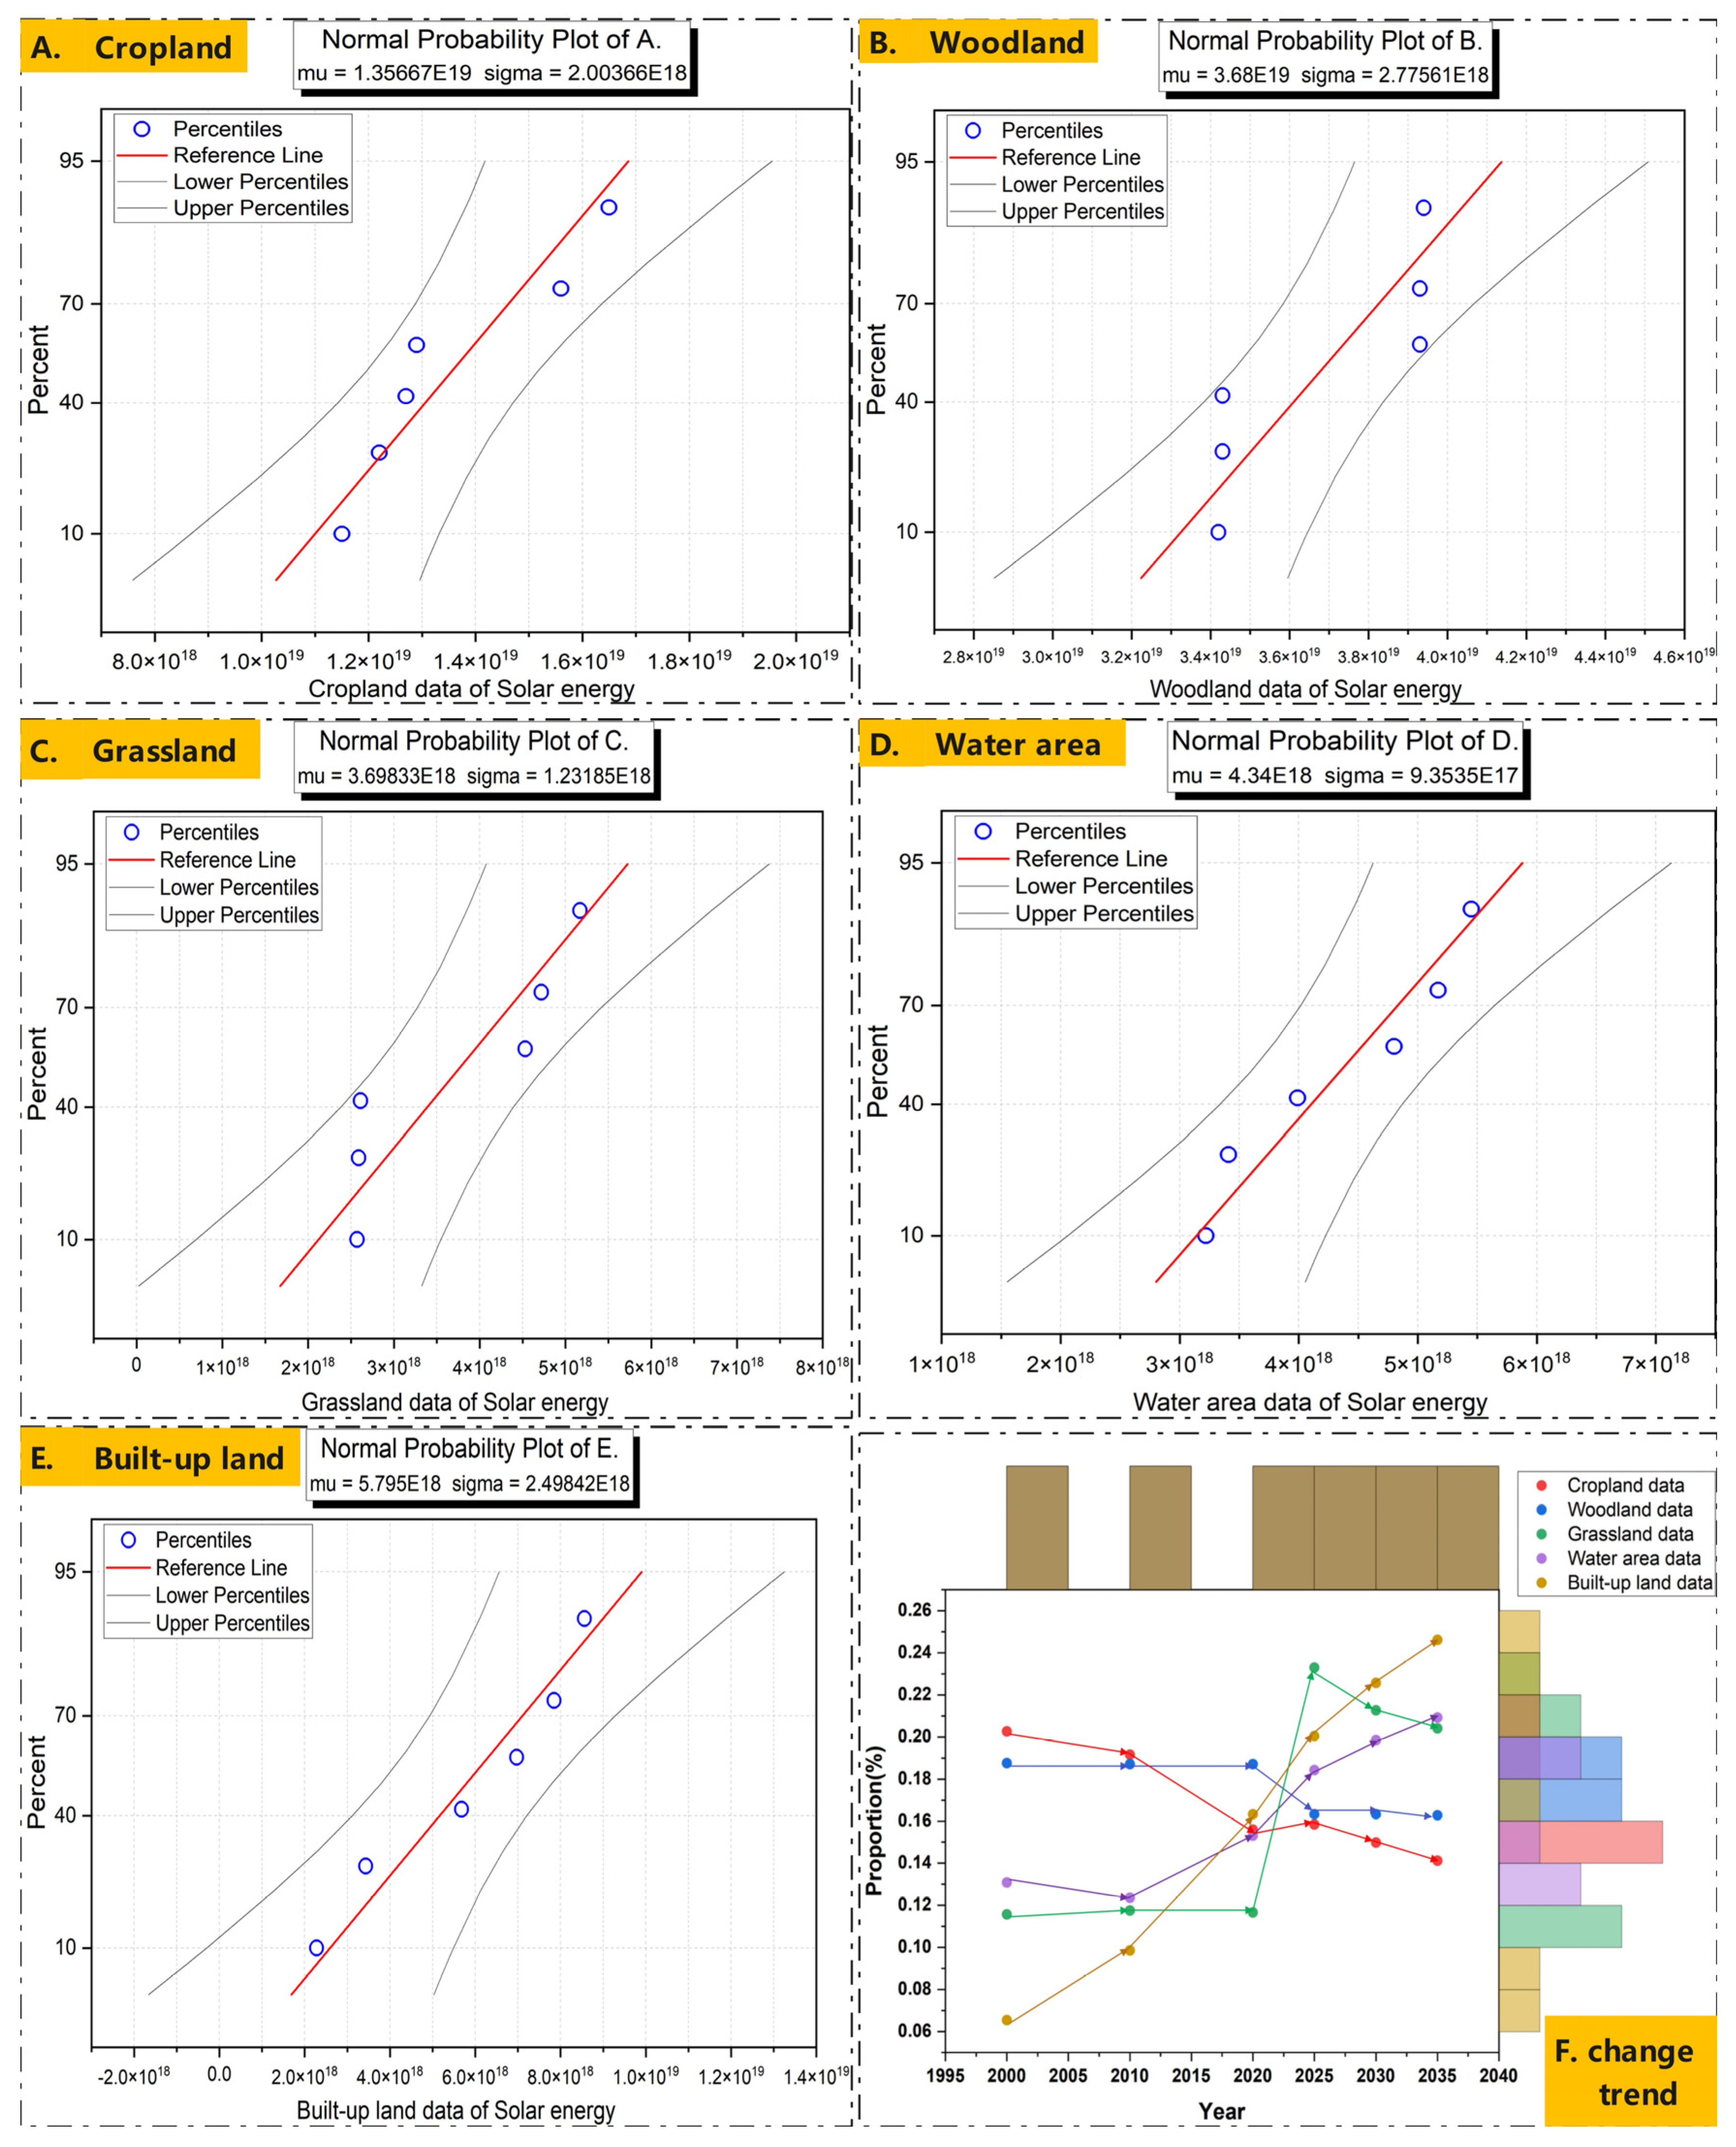
3.2.3. Single Factor Analysis

Figure 7, Figure 8 and Figure 9 show the predicted changes in cropland, woodland, and built-up land for Hangzhou city from 2020 to 2035. Overall, the most significant changes are anticipated in built-up land, followed by woodland and cropland. As a developed city in China, Hangzhou primarily relies on industry and service industries for urban development, with agriculture being secondary. For example, in 2020, the GDP ratio of agriculture, industry, and services was 1:16.5:36.9, accounting for only about 0.18% of the entire GDP in Hangzhou city. Therefore, the modelled cropland changes from 2020 to 2035 have hardly changed on the GIS maps.
With the rapid growth of the population, ecological space is being squeezed, resulting in the reduction of woodland, which is evident on the GIS map from 2020 to 2035. These findings emphasize the need for sustainable development strategies that protect ecological resources while promoting urbanization and economic growth. Furthermore, these results can inform policymakers and stakeholders in Hangzhou city and other urban areas to design effective sustainable development strategies that balance urban development with environmental protection.

4. Discussion

4.1. Main Contributor Analysis

Table 4 presents the emergy calculation for Hangzhou city in 2020. The table shows that biodiversity and buildings display the largest emergy quantities, with building emergy having the largest value of 1.98 × 1028 sej, followed by biodiversity emergy with a value of 2.46 × 1028 sej. This suggests that sustainable change for 2020 will be determined by these two factors. Other terms have relatively small emergy values, playing a minor role in the sustainability of the Hangzhou system in 2020.
The emergy values for 2000 and 2010 were also calculated using the same calculation model, and similar patterns can be observed in 2020. These results highlight the importance of biodiversity and buildings in determining the sustainability of Hangzhou city over time, emphasizing the need for sustainable development strategies that protect biodiversity while promoting urbanization.

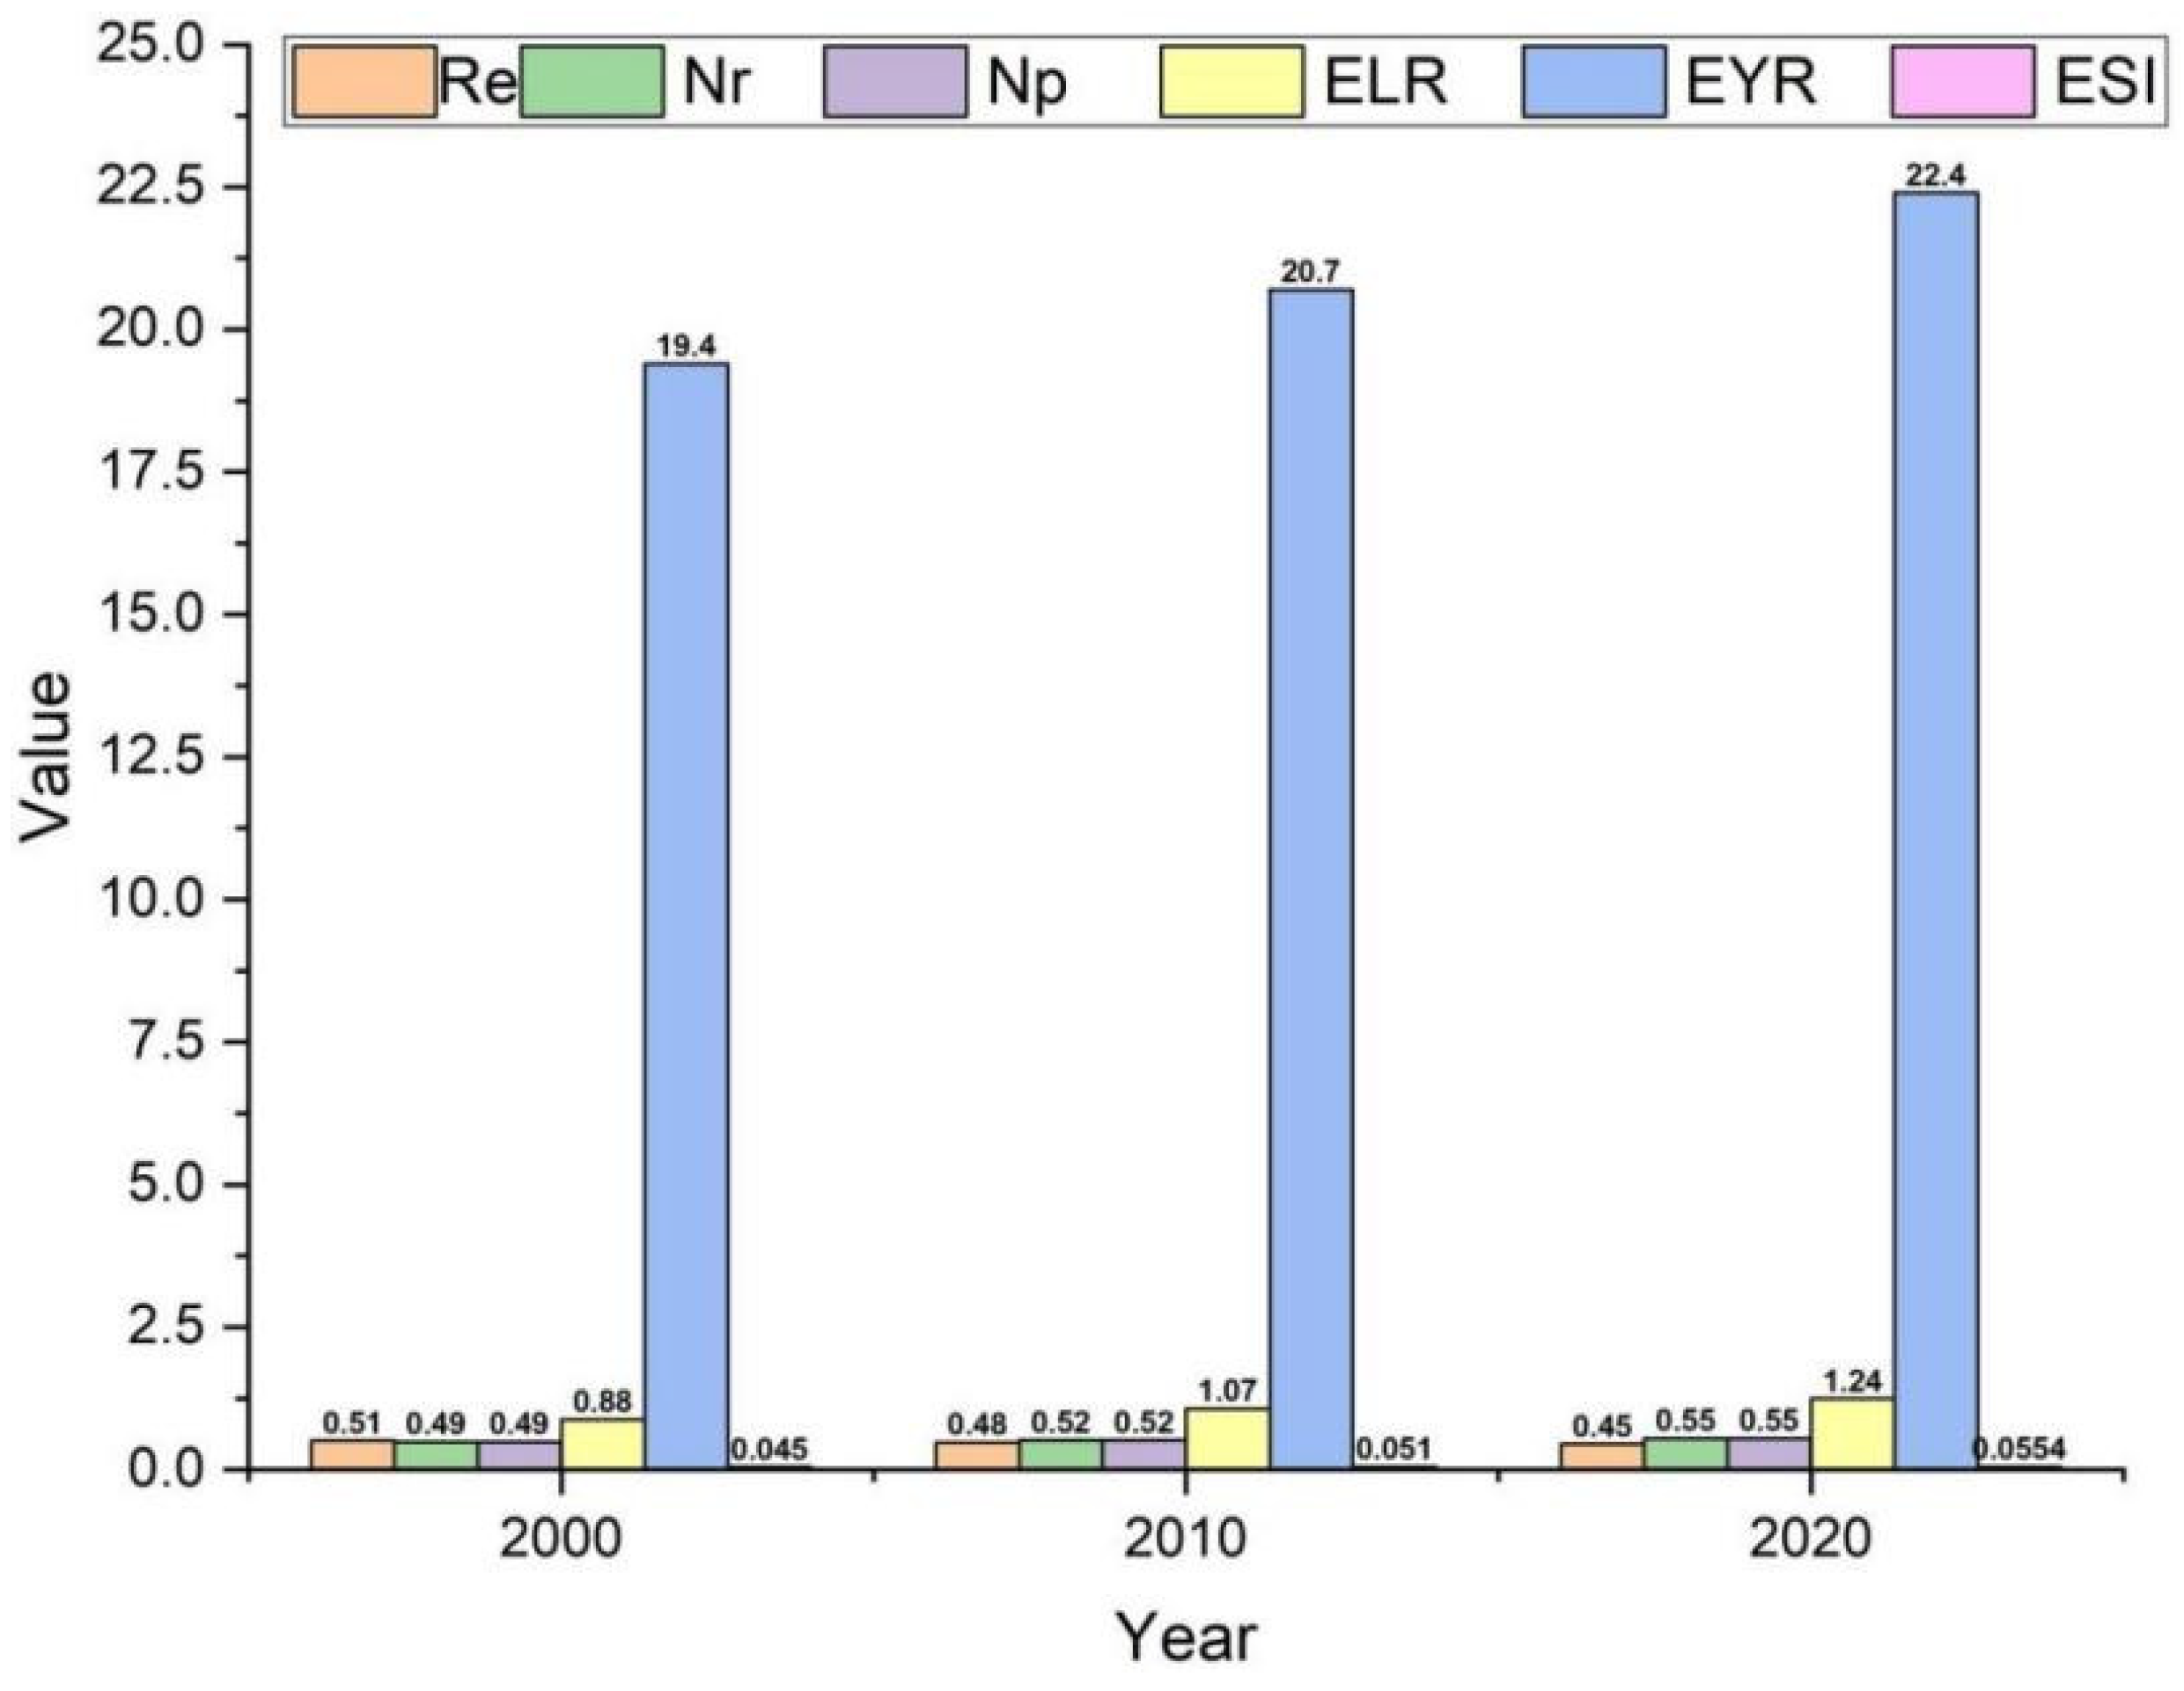
4.2. Ecological Indicator Analysis

Figure 10 presents the sustainable degree of Hangzhou city from 2000 to 2020. From the perspective of a single indicator (Re, Nr, Np), the renewable rate of Hangzhou is decreasing, while the non-renewable rate is increasing. This trend is due to the reduction of ecological areas and the expansion of urban building areas as Hangzhou continues to develop.
Based on a comprehensive analysis of ELR, EYR, and ESI, ELR and EYR tend to increase from 2000 to 2020, which reflects continued urban construction during these decades. As a general rule, when these two values (ELR and EYR) continue to increase, the final sustainability index (ESI) will become smaller. However, in this study, the most critical sustainability indicators are tending to increase from 2000 to 2020. This phenomenon demonstrates that despite environmental pressures, the urban development of Hangzhou is still in a healthy development trend in the long run.

4.3. Sensitivity Analysis

Due to the involvement of a large amount of data, the sensitivity of the data needs to be designed and analyzed to ensure the accuracy of the results. Scholars in the field have offered in-depth discussions and already conducted a range sensitivity analyses [60,61]. In turn, this study provides sensitivity analysis on five types of land use, including arable land, forest land, grassland, water area, and construction land, as follows:
The sensitivity of different land types, including farmland, forests, grasslands, water bodies, and construction land, was analyzed based on solar data from the five types of land. As shown in Figure 11A–E, the data sensitivity of water bodies and construction land is better, while that of farmland, forests, and grasslands is relatively poor. Figure 11F shows the magnitude of changes in data for these five land types, and the trend analysis on the right side indicates that the sensitivity of farmland has changed the most, followed by grasslands and forests. This result is consistent with the corresponding Figure 11A–E.
In addition to analyzing the sensitivity of solar energy data for the five types of land, the study also explored the sensitivity of four other types of energy: rain potential energy, rain chemical energy, wind energy, and geothermal energy. Figure 12 includes four violin plots that show the trend of sensitivity changes indicated by the red lines, which connect the mean data of the five types of land. The four plots reveal that the sensitivity of rain potential energy, rain chemical energy, and wind energy data fluctuate the least. On the other hand, the sensitivity of geothermal energy fluctuates more, which may be attributed to difficulties in extracting geothermal energy data and large errors in actual data.

4.4. Comprehensive Sustainability Analysis

The emergy method and the GIS method are two distinct approaches for studying urban problems. The emergy method is an ecological economic approach, while the GIS method is a geographic information system method that examines morphological changes from a spatial perspective. Additionally, the emergy method is a quantitative evaluation model, whereas the GIS method is a qualitative research model.
This paper aims to investigate ecological sustainability in Hangzhou city by coupling these two methods. Using the emergy method, the ecological sustainability of the city was calculated and assessed, while the GIS map was used to display the ecological changes of the city (i.e., the five types of plots) to verify the accuracy of the emergy calculation results.
Using data from 2000, 2010, and 2020 based on the GIS method, it is evident that the area of ecological elements is decreasing, while the building area is increasing rapidly, indicating an increase in ecological pressure throughout the city. This trend is also supported by the data presented in Figure 7, which indicate that the environmental loading ratio increased from 0.88 in 2000 to 1.07 in 2010 and to 1.24 in 2020, showing that the entire environmental burden of the city is gradually increasing with its sustainable development.
Taken together, the emergy method and the GIS method can be used to comprehensively analyze urban ecological changes and provide valuable insights into how to promote sustainable development strategies that balance urbanization and ecological protection.

5. Improvement Measures

5.1. Increasing Green Area Measures

Green areas play a significant role in promoting urban ecology, as they not only reduce carbon emissions but also alleviate the urban heat island effect, thereby enhancing the sustainable development of cities. In this study, based on the green area of Hangzhou city in 2020, if the green area is increased by 20%, 30%, and 40%, the corresponding indicators can be obtained according to emergy calculation. Figure 13 shows the changes in various indicators after improvement, clearly indicating the positive effects of green areas on urban ecology. Taking the ELR index as an example, with a 20% increase in urban green areas, the negative value load ratio will decrease by 1.62%; with a 30% increase in green areas, the index will decrease by 4.01%; with a 40% increase in green areas, the index will decrease by 6.45%. These results fully demonstrate that increasing green areas can reduce the ecological burden of cities, and the larger the green area, the more significant the reduction in the ecological burden. To enhance the ecological sustainability of cities, green areas should be increased based on the specific circumstances of each city.

5.2. Improving Urban Water Areas

Water bodies are also one of the core elements for enhancing urban ecology. To improve the overall sustainable level of Hangzhou city, measures to increase water area have been proposed. As there are not many large river gathering areas in Hangzhou city and they are mostly concentrated in the southwest, in order to verify the effect of increasing water area on the sustainability of the city, the study used the water area of Hangzhou city in 2020 as the basic data and quantitatively analyzed its changes by assuming incremental increases in water area based on emergy evaluation indicators.
In Figure 14, the results of four hypothetical scenarios were considered. As the water area increases by 20%, 25%, 30% and 40%, the environmental loading ratio of Hangzhou city decreases significantly (as shown in Figure 14A–D), with reductions of 5.4%, 8.1%, 19.2%, and 23.7%, respectively. The increasing difference in area indicates that water bodies promote urban sustainability and reduce environmental pressure.

6. Conclusions

In summary, this study utilized the emergy–GIS method to assess urban sustainability in Hangzhou city from 2000 to 2035, which demonstrates that combining the emergy with the GIS approach can effectively promote each other to validate the sustainability status of a city. Therefore, this study provides a comprehensive methodology for researchers and designers to assess urban sustainability from a new perspective in the future.
However, these methods also have their limitations. Although the emergy method and GIS method can be integrated for urban sustainability research, they belong to two different fields, and this can present obstacles to comparative studies of urban sustainability. Firstly, the GIS method is a large-scale urban spatial analysis approach that involves multiple elements on the GIS map. This presents challenges for all emergy calculations for the city because not all urban elements currently have a unit emergy value. For instance, the emergy of microbes is difficult to calculate accurately due to an inaccurate unit emergy value, which results in uncertainty in the calculation results. Secondly, the lack of urban data leads to inconsistent results between the two methods, particularly in larger cities. The more detailed the data results, the more consistent the calculation results become based on the emergy method and GIS method. To address this issue and further promote the development of the emergy–GIS method, comprehensive urban data and existing unit emergy values are essential.
In addition, multi-criteria decision analysis (MCDA) and life cycle assessment (LCA) contribute to enhancing the integration of emergy analysis with GIS, enabling comprehensive qualitative and quantitative results. MCDA techniques provide a systematic framework for evaluating multiple criteria and making informed decisions. By combining emergy analysis with MCDA, decision-makers can incorporate environmental, economic, and social factors into a unified evaluation process. This integration allows for prioritizing different alternatives or interventions based on their emergy performance and spatial distribution. Life cycle assessment is a widely used methodology for assessing the environmental impacts of products, processes, or systems throughout their entire life cycle. Integrating emergy analysis with LCA enables a more comprehensive evaluation of resource use and environmental impacts. Leveraging the strengths of both approaches provides a holistic perspective on sustainability and facilitates decision-making towards more sustainable practices.
Future research should strive to overcome the obstacles previously noted by utilizing more reliable and accurate data sources to improve the precision and accuracy of the emergy–GIS method. Additionally, researchers could explore new ways to integrate the emergy method and GIS method more effectively to achieve a more comprehensive understanding of urban sustainability and its associated challenges.

Author Contributions

Conceptualization, L.L. and J.Z.; investigation, R.C.; formal analysis, J.Z.; methodology, J.Z.; resources, J.Z.; writing—review and editing, J.Z. All authors have read and agreed to the published version of the manuscript.

Funding

The work described in this paper was supported by the XJTLU Urban and Environmental Studies University Research Centre (UES) (UES-RSF-23030601).

Data Availability Statement

The data presented in this study are available within this article.

Conflicts of Interest

The authors declare no conflict of interest.

Appendix A

Taking the cropland (in 2000) as the calculation example, calculations are as follows:
1. Solar energy calculation:
Area of plot = 4,341,224,700 m2;
Insolation = 5.43 × 10⁹ J/m2/yr;
Albedo = 0.30;
Energy = (insolation) × (1-albedo) × (area) = (5.43 × 10⁹ J/m2/yr) × (1−0.30) × (4,341,224,700 m2) = 1.65 × 10¹⁹ J/yr;
UEV = 1.00 sej/J by definition;
Emergy = 1.65 × 10¹⁹ J/yr × 1.00 sej/J = 1.65 × 10¹⁹ sej.
2. Rain (geopotential energy) calculation:
Area of plot = 4,341,224,700 m2;
Rainfall (annual average, n = 5) = 0.71 m/year;
Average elevation = 316 m; water density = 1.00 × 10³ kg/m3;
Runoff rate = 40.00%;
Energy = (area) × (rainfall) × (runoff rate) × (water density) × (average elevation) × (gravity) = (4,341,224,700 m2) × (0.71 m/yr) × (40.00%) × (1.00 × 10³ kg/m3) × (316 m) × (9.8 kg/m2) = 3.82 × 10¹⁵ J/yr;
UEV = 2.79 × 10⁴ sej/J;
Emergy = 3.82 × 10¹⁵ J/yr × 2.79 × 10⁴ sej/J = 1.07 × 10²⁰ sej.
3. Rain (chemical potential energy) calculation:
Area of plot = 4,341,224,700 m2;
Rainfall (annual average, n = 5) = 0.71 m/year;
Water density = 1000 kg/m3;
Evapotranspiration rate = 60%;
Gibbs free energy of water = 4.94 × 10³ J/kg;
Energy = (area) × (rainfall) × (evapotranspiration rate) × (water density) × (Gibbs free energy of water) = (4,341,224,700 m2) × (0.71 m/yr) × (1.00 × 10³ kg/m3) × (60%) × (4.94 × 10³ J/kg) = 9.14 × 10¹⁵ J/year;
UEV = 18199 sej/J;
Emergy = 9.14 × 10¹⁵ J/yr × 18,199 sej/J =1.66 × 10²⁰ sej.
4. Wind energy calculation:
Area of plot = 4,341,224,700 m2;
Air density = 1.29 kg/m3;
Wind velocity (annual average, n = 2) = 1.95 m/s;
Velocity of geostrophic wind = 3.25 m/s (surface winds are considered as 0.6 of geostrophic wind);
Drag coefficient = 1.00 × 10⁻³;
Energy = (area) × (air density) × (drag coefficient) × (velocity of geostrophic wind)3 = (4,341,224,700 m2) × (1.29 kg/m3) × (1.00 × 10−3) × (1.95 m/s)3 = 4.2 × 10⁷ J/yr;
UEV = 1496 sej/J;
Emergy = 4.2 × 10⁷ J/yr × 1496 sej/J = 6.28 × 10¹⁰ sej.
5. Geothermal heat calculation:
Area of plot = 4,341,224,700 m2;
Heat flow (average) = 3.50 × 10⁻² J/m2/s. Energy = (area) × (heat flow) = (4,341,224,700 m2) × (3.50 × 10−2 J/m2/s) = 1.52 × 10⁸ J/yr;
UEV = 34,377 sej/J;
Emergy = 1.52 × 10⁸ J/yr × 34,377 sej/J = 5.22 × 10¹² sej.

References

  1. China Urban Development Report in 2021. Available online: http://bj.ieaschina.org/organization/introduce.html (accessed on 10 September 2023).
  2. Wang, D.; Huang, Z.; Wang, Y.; Mao, J. Ecological security of mineral resource-based cities in China: Multidimensional measurements, spatiotemporal evolution, and comparisons of classifications. Ecol. Indic. 2021, 132, 108269. [Google Scholar] [CrossRef]
  3. Chai, J.; Wang, Z.; Yu, C. Analysis for the Interaction Relationship between Urbanization and Ecological Security: A Case Study in Wuhan City Circle of China. Int. J. Environ. Res. Public Health 2021, 18, 13187. [Google Scholar] [CrossRef]
  4. Zhang, H.; Li, J.; Tian, P.; Pu, R.; Cao, L. Construction of ecological security patterns and ecological restoration zones in the city of Ningbo, China. J. Geogr. Sci. 2022, 32, 663–681. [Google Scholar] [CrossRef]
  5. Wu, J.; Bai, Z. Spatial and temporal changes of the ecological footprint of China’s resource-based cities in the process of urbanization. Resour. Policy 2022, 75, 102491. [Google Scholar] [CrossRef]
  6. Zhang, S.; Li, F.; Zhou, Y.; Hu, Z.; Zhang, R.; Xiang, X.; Zhang, Y. Using Net Primary Productivity to Characterize the Spatio-Temporal Dynamics of Ecological Footprint for a Resource-Based City, Panzhihua in China. Sustainability 2022, 14, 3067. [Google Scholar] [CrossRef]
  7. Lu, C.; Wang, S.; Wang, K.; Gao, Y.; Zhang, R. Uncovering the benefits of integrating industrial symbiosis and urban symbiosis targeting a resource-dependent city: A case study of Yongcheng, China. J. Clean. Prod. 2020, 255, 120210. [Google Scholar] [CrossRef]
  8. Zhang, L.; Wang, H.; Zhang, W.; Wang, C.; Bao, M.; Liang, T.; Liu, K. Study on the development patterns of ecological civilization construction in China: An empirical analysis of 324 prefectural cities. J. Clean. Prod. 2022, 367, 132975. [Google Scholar] [CrossRef]
  9. Yang, Y.; Feng, Z.; Wu, K.; Lin, Q. How to construct a coordinated ecological network at different levels: A case from Ningbo city, China. Ecol. Inform. 2022, 70, 101742. [Google Scholar] [CrossRef]
  10. Sun, F.; Ye, C.; Zheng, W.; Miao, X. Model of Urban Marketing Strategy Based on Ecological Environment Quality. J. Environ. Public Health 2022, 2022, 8096122. [Google Scholar] [CrossRef]
  11. Xu, S.; Hou, Y.; Mao, L. Application Analysis of the Ecological Economics Model of Parallel Accumulation Sorting and Dynamic Internet of Things in the Construction of Ecological Smart City. Wirel. Commun. Mob. Comput. 2022, 2022, 8770859. [Google Scholar] [CrossRef]
  12. Ma, Q.; Yang, Y. Analysis of Ecological Environment Evaluation and Coupled and Coordinated Development of Smart Cities Based on Multisource Data. J. Sens. 2022, 2022, 5959495. [Google Scholar] [CrossRef]
  13. Fan, Z.; Wang, Y.; Feng, Y. Ecological Livability Assessment of Urban Agglomerations in Guangdong-Hong Kong-Macao Greater Bay Area. Int. J. Environ. Res. Public Health 2021, 18, 13349. [Google Scholar] [CrossRef]
  14. Zhang, J.; Ma, L. Urban ecological security dynamic analysis based on an innovative emergy ecological footprint method. Environment. Environ. Dev. Sustain. 2021, 23, 16163–16191. [Google Scholar] [CrossRef]
  15. Ha, C.; Huang, G.; Zhang, J.; Dong, S. Assessing ecological literacy and its application based on linguistic ecology: A case study of Guiyang City, China. Environ. Sci. Pollut. Res. 2022, 29, 18741–18754. [Google Scholar] [CrossRef]
  16. Huang, L.; Wang, D.; He, C. Ecological security assessment and ecological pattern optimization for Lhasa city (Tibet) based on the minimum cumulative resistance model. Environ. Sci. Pollut. Res. 2022, 29, 83437–83451. [Google Scholar] [CrossRef] [PubMed]
  17. Wang, D.; Ji, X.; Li, C.; Gong, Y. Spatiotemporal Variations of Landscape Ecological Risks in a Resource-Based City under Transformation. Sustainability 2020, 13, 5297. [Google Scholar] [CrossRef]
  18. Xia, H.; Liu, Z.; Efremochkin, M.; Liu, X.; Lin, C. Study on city digital twin technologies for sustainable smart city design: A review and bibliometric analysis of geographic information system and building information modeling integration. Sustain. Cities Soc. 2022, 84, 104009. [Google Scholar] [CrossRef]
  19. Xu, W.; Yi, J.; Shuai, J.; Yu, Z.; Cheng, J. Dynamic evaluation of the ecological civilization of Jiangxi Province: GIS and AHP approaches. PLoS ONE 2022, 17, e0271768. [Google Scholar] [CrossRef] [PubMed]
  20. Wang, X.; Zhang, C.; Wang, C.; Liu, G.; Wang, H. GIS-based for prediction and prevention of environmental geological disaster susceptibility: From a perspective of sustainable development. Ecotoxicol. Environ. Saf. 2021, 226, 112881. [Google Scholar] [CrossRef]
  21. Di Pinto, V.; Rinaldi, A.M.; Rossini, F. Learning from the Informality. Using GIS Tools to Analyze the Structure of Autopoietic Urban Systems in the “Smart Perspective”. ISPRS Int. J. Geo-Inf. 2021, 10, 202. [Google Scholar] [CrossRef]
  22. Zhu, J.; Wu, P. Towards Effective BIM/GIS Data Integration for Smart City by Integrating Computer Graphics Technique. Remote Sens. 2021, 13, 1889. [Google Scholar] [CrossRef]
  23. Xie, H.; Wen, J.; Chen, Q.; Wu, Q. Evaluating the landscape ecological risk based on GIS: A case-study in the Poyang Lake region of China. Land Degrad. Dev. 2021, 32, 2762–2774. [Google Scholar] [CrossRef]
  24. Pallathadka, A.; Pallathadka, L.; Rao, S.; Chang, H.; Van Dommelen, D. Using GIS-based spatial analysis to determine urban greenspace accessibility for different racial groups in the backdrop of COVID-19: A case study of four US cities. GeoJournal 2021, 87, 4879–4899. [Google Scholar] [CrossRef] [PubMed]
  25. He, D.; Hou, K.; Wen, J.F.; Wu, S.Q.; Wu, Z.P. A coupled study of ecological security and land use change based on GIS and entropy method—A typical region in Northwest China, Lanzhou. Environ. Sci. Pollut. Res. 2022, 29, 6347–6359. [Google Scholar] [CrossRef] [PubMed]
  26. Parveen, M.T.; Ilahi, R.A. Assessment of land-use change and its impact on the environment using GIS techniques: A case of Kolkata Municipal Corporation, West Bengal, India. GeoJournal 2022, 87, 551–566. [Google Scholar] [CrossRef]
  27. Fan, Y.; Fang, C. Evolution process analysis of urban metabolic patterns and sustainability assessment in western China, a case study of Xining city. Ecol. Indic. 2020, 109, 105784. [Google Scholar] [CrossRef]
  28. Chen, Y.; Peng, L.; Cao, W. Health evaluation and coordinated development characteristics of urban agglomeration: Case study of Fujian Delta in China. Ecol. Indic. 2021, 121, 107149. [Google Scholar] [CrossRef]
  29. Wang, Q.; Liu, M.; Tian, S.; Yuan, X.; Ma, Q.; Hao, H. Evaluation and improvement path of ecosystem health for resource-based city: A case study in China. Ecol. Indic. 2021, 128, 107852. [Google Scholar] [CrossRef]
  30. Liu, Y.; Qu, Y.; Cang, Y.; Ding, X. Ecological security assessment for megacities in the Yangtze River basin: Applying improved emergy-ecological footprint and DEA-SBM model. Ecol. Indic. 2022, 134, 108481. [Google Scholar] [CrossRef]
  31. Voukkali, I.; Zorpas, A.A. Evaluation of urban metabolism assessment methods through SWOT analysis and analytical hierocracy process. Sci. Total Environ. 2022, 807, 150700. [Google Scholar] [CrossRef]
  32. Tang, M.; Hong, J.; Wang, X.; He, R. Sustainability accounting of neighborhood metabolism and its applications for urban renewal based on emergy analysis and SBM-DEA. J. Environ. Manag. 2020, 275, 111177. [Google Scholar] [CrossRef] [PubMed]
  33. Li, Q.; Wu, J.; Su, Y.; Zhang, C.; Wu, X.; Wen, X.; Huang, G.; Deng, Y.; Lafortezza, R.; Chen, X. Estimating ecological sustainability in the Guangdong-Hong Kong-Macao Greater Bay Area, China: Retrospective analysis and prospective trajectories. J. Environ. Manag. 2022, 303, 114167. [Google Scholar] [CrossRef]
  34. Lee, Y.-C.; Liao, P.-T. The effect of tourism on teleconnected ecosystem services and urban sustainability: An emergy approach. Ecol. Model. 2021, 439, 109343. [Google Scholar] [CrossRef]
  35. Alizadeh, S.; Zafari-koloukhi, H.; Rostami, F.; Rouhbakhsh, M.; Avami, A. The eco-effificiency assessment of wastewater treatment plants in the city of Mashhad using emergy and life cycle analyses. J. Clean. Prod. 2020, 249, 119327. [Google Scholar] [CrossRef]
  36. Zhou, H.; Li, H.; Zhao, X.; Ding, Y. Emergy ecological model for sponge cities: A case study of China. J. Clean. Prod. 2021, 296, 126530. [Google Scholar] [CrossRef]
  37. Li, J.; Sun, W.; Song, H.; Li, R.; Hao, J. Toward the construction of a circular economy eco-city: An emergy-based sustainability evaluation of Rizhao city in China. Sustain. Cities Soc. 2021, 71, 102956. [Google Scholar] [CrossRef]
  38. Zhang, J.; Asutosh, A.T.; Zhang, H.; Yan, Y.; Zhang, Y.; Wei, G.; Ma, C.; Shi, Y.; Gao, Y.; Yan, X.; et al. Environmental sustainability in the city of Shanghai municipal solid waste treatment system: An integrated framework of artifcial neural network (ANN) and LCA-emergy methodology. Arab. J. Geosci. 2022, 15, 1271. [Google Scholar] [CrossRef]
  39. Farzaneh, H.; Dashti, M.; Zusman, E.; Lee, S.-Y.; Dagvadorj, D.; Nie, Z. Assessing the Environmental-Health-Economic Co-Benefifits from Solar Electricity and Thermal Heating in Ulaanbaatar, Mongolia. Int. J. Environ. Res. Public Health 2022, 19, 6931. [Google Scholar] [CrossRef]
  40. Liu, W.; Zhan, J.; Li, Z.; Jia, S.; Zhang, F.; Li, Y. Eco-Efficiency Evaluation of Regional Circular Economy: A Case Study in Zengcheng, Guangzhou. Sustainability 2018, 10, 453. [Google Scholar] [CrossRef]
  41. Agostinho, F.; Diniz, G.; Siche, R.; Ortega, E. The use of emergy assessment and the Geographical Information System in the diagnosis of small family farms in Brazil. Ecol. Model. 2008, 210, 37–57. [Google Scholar] [CrossRef]
  42. Pulselli, R.M. Integrating emergy evaluation and geographic information systems for monitoring resource use in the Abruzzo region (Italy). J. Environ. Manag. 2010, 91, 2349–2357. [Google Scholar] [CrossRef] [PubMed]
  43. Mellino, S.; Ripa, M.; Zucaro, A.; Ulgiati, S. An emergy–GIS approach to the evaluation of renewable resource flows: A case study of Campania Region, Italy. Ecol. Model. 2014, 271, 103–112. [Google Scholar] [CrossRef]
  44. Arbault, D.; Rugani, B.; Tiruta-Barna, L.; Benetto, E. A first global and spatially explicit emergy database of rivers and streams based on high-resolution GIS-maps. Ecol. Model. 2014, 281, 52–64. [Google Scholar] [CrossRef]
  45. Mellino, S.; Buonocore, E.; Ulgiati, S. The worth of land use: A GIS–emergy evaluation of natural and human-made capital. Sci. Total Environ. 2015, 506–507, 137–148. [Google Scholar] [CrossRef]
  46. Mellino, S.; Ulgiati, S. Mapping the evolution of impervious surfaces to investigate landscape metabolism: An Emergy–GIS monitoring application. Ecol. Inform. 2015, 26, 50–59. [Google Scholar] [CrossRef]
  47. Wang, C.; Zhang, S.; Yan, W.; Wang, R.; Liu, J.; Wang, Y. Evaluating renewable natural resources flow and net primary productivity with a GIS-Emergy approach: A case study of Hokkaido, Japan. Sci. Rep. 2016, 6, 37552. [Google Scholar] [CrossRef]
  48. Zhao, Y.-B.; Yang, M.-Z.; Ni, H.-G. An emergy-GIS method of selecting areas for sponge-like urban reconstruction. J. Hydrol. 2018, 564, 640–650. [Google Scholar] [CrossRef]
  49. Lee, D.J.; Brown, M.T. Estimating the Value of Global Ecosystem Structure and Productivity: A Geographic Information System and Emergy Based Approach. Ecol. Model. 2021, 439, 109307. [Google Scholar] [CrossRef]
  50. Odum, H.T. Environmental accounting. In Emergy and Environmental Decision Making; John Wiley & Sons: New York, NY, USA, 1996. [Google Scholar]
  51. Agostinho, F.; Ambrósio, L.A.; Ortega, E. Assessment of a large watershed in Brazil using Emergy Evaluation and Geographical Information System. Ecol Model. 2010, 221, 1209–1220. [Google Scholar] [CrossRef]
  52. Brown, M.T.; Martinez, A.; Uche, J. Emergy analysis applied to the estimation of the recovery of costs for water services under the European Water Frame-work Directive. Ecol. Model. 2010, 221, 2123–2132. [Google Scholar] [CrossRef]
  53. Zhang, L.X.; Ulgiati, S.; Yang, Z.F.; Chen, B. Emergy evaluation and economic analysis of three wetland fifish farming systems in Nansi Lake area, China. J. Environ. Manag. 2011, 92, 683–694. [Google Scholar] [CrossRef]
  54. Brown, M.T.; Ulgiati, S. Updated evaluation of exergy and emergy driving the geobiosphere: A review and refinement of the emergy baseline. Ecol. Model. 2016, 221, 2501–2508. [Google Scholar] [CrossRef]
  55. Hangzhou Yearbook. 2021. Available online: http://tjj.hangzhou.gov.cn/col/col1229453450/index.html (accessed on 1 September 2023).
  56. Campbell, E.T.; Brown, M.T. Environmental accounting of natural capital and ecosystem services for the US National Forest System. Environ. Dev. Sustain. 2012, 14, 691–724. [Google Scholar] [CrossRef]
  57. Pulselli, R.M.; Simoncini, E.; Marchettini, N. Energy and emergy based cost-benefifit evaluation of building envelopes relative to geographical location and climate. Build. Environ. 2009, 44, 920–928. [Google Scholar] [CrossRef]
  58. Dong, X.B.; Yu, B.H.; Brown, M.; Zhang, Y.S.; Kang, M.Y.; Jin, Y.; Zhang, X.S.; Ulgiati, S. Environmental and economic consequences of the overexploitation of natural capital and ecosystem services in Xilinguole League, China. Energy Policy 2014, 67, 767–780. [Google Scholar] [CrossRef]
  59. Brown, M.T.; Ulgiati, S. A geobiosphere baseline for LCA-emergy evaluations. In Emergy Synthesis 7: Theory and Applications of the Emergy Methodology, Proceedings of the 7th Biennial Emergy Conference Center for Environmental Policy; Brown, M.T., Sweeney, S., Campbell, D.E., Huang, S., Kang, D., Rydberg, T., Tilley, D., Ulgiati, S., Eds.; University of Florida Gainesville: Gainesville, FL, USA, 2013. [Google Scholar]
  60. Zhang, J.; Asutosh, A.T. A Sustainability Analysis Based on the LCA–Emergy–Carbon Emission Approach in the Building System. Appl. Sci. 2023, 13, 9707. [Google Scholar] [CrossRef]
  61. Cao, J.; Zhu, Y.; Zhang, J.; Wang, H.; Zhu, H. The Sustainability Study and Exploration in the Building Commercial Complex System Based on Life Cycle Assessment (LCA)–Emergy–Carbon Emission Analysis. Processes 2023, 11, 1989. [Google Scholar] [CrossRef]
Figure 1. Research framework design.
Buildings 13 02445 g001
Figure 2. Emergy diagram of Hangzhou city.
Buildings 13 02445 g002
Figure 3. The map of Hangzhou City.
Buildings 13 02445 g003
Figure 4. Concentration degree of renewable emergy from 2010 to 2035. (a)—Emergy in 2000; (b)—Emergy in 2010; (c)—Emergy in 2020; (d)—Predicted emergy in 2025; (e)—Predicted emergy in 2030; (f)—Predicted emergy in 2035; 1—Crop land; 2—Wood land; 3—Glass land; 4—Water area; 5—Built-up land.
Buildings 13 02445 g004
Figure 5. Preliminary validation verification of GIS method.
Buildings 13 02445 g005
Figure 6. Analysis diagram of Hangzhou.
Buildings 13 02445 g006
Figure 7. Cropland changes on GIS map in 2020, 2025, 2030 and 2035.
Buildings 13 02445 g007
Figure 8. Woodland changes on GIS map in 2020, 2025, 2030 and 2035.
Buildings 13 02445 g008
Figure 9. Built-up land changes on GIS map in 2020, 2025, 2030 and 2035.
Buildings 13 02445 g009
Figure 10. Comparison between and change from 2000 to 2020.
Buildings 13 02445 g010
Figure 11. Sensitivity analysis of solar energy data. (A) Cropland data; (B) Woodland data; (C) Grassland data; (D) Water area data; (E) Built-up data; (F) Comprehensive analysis.
Buildings 13 02445 g011
Figure 12. Sensitivity analysis of the remaining four types of data.
Buildings 13 02445 g012
Figure 13. Sustainability indicator changes between original state and scenarios of increasing green space.
Buildings 13 02445 g013
Figure 14. Sustainability indicator changes between original state and scenarios of increasing water space. (A) 20% increasement design; (B) 25% increasement design; (C) 30% increasement design; (D) 40% increasement design.
Buildings 13 02445 g014
Table 1. Sustainable indices of emergy.
ItemIndexMeaning
Renewability rateReRenewable proportion
Non-renewability rateNrNon-renewable proportion
Non-renewability rate of purchased resourceNpPurchased resource rate
Environmental loading ratioELREnvironmental pressure
Emergy yield ratioEYRAbility to obtain emergy
Emergy sustainability indicatorESISustainability degree
Table 2. Data on the type and size of each plot.
Area (m2)YearCroplandWoodlandGrasslandWater AreaBuilt-Up LandUnused Land
20004,341,224,70010,372,600,800677,226,600896,639,400600,055,200117,000
20104,116,312,90010,335,283,200685,984,500846,707,400903,460,500115,200
20203,329,491,50010,343,995,200683,514,9001,051,451,1001,479,392,10018,900
20253,400,155,0009,032,335,2001,359,180,9001,263,180,6001,833,006,6005400
20303,199,225,5009,020,878,2001,241,289,9001,360,538,1002,065,931,100900
20353,012,943,5008,994,467,7001,192,640,4001,434,662,1002,253,144,6005400
Table 3. The input of Hangzhou city in 2020.
ItemRaw AmountData
Ref.
UEVUEV Ref.Emergy
(sej)
Artificial systems storage
Roads16,919 kmc3.04 × 109 sej/g[46]1.64 × 1021
Rails539 kmc3.04 × 109 sej/g[46]1.13 × 1021
Buildings822,000 m2c1.49 × 109 sej/g[50]2.46 × 1028
Natural capital storage
Biodiversity1237 speciesa1.6 × 1025 sej/species[50]1.98 × 1028
Groundwater38.75 × 109 m3b2.26 × 106 sej/j[58]4.33 × 1023
Surface water216.69 × 109 m3b2.05 × 104 sej/j[59]2.19 × 1022
Total4.44 × 1028
Note: a refers to the Plant List of Hangzhou in 2020. For specific calculations, refer to Section 2.3. b refers to the Hangzhou Water Resources Announcement in 2020. The specific calculation can be found in Section 2.3. c refers to the Hangzhou Yearbook in 2020.
Table 4. Renewable emergy calculation from 2000 to 2035.
ItemCroplandWoodlandGrasslandWater AreaBuilt-Up LandYear
Solar energy emergy
(unit: sej)
1.65 × 10193.94 × 10192.57 × 10183.41 × 10182.28 × 10182000
1.56 × 10193.93 × 10192.61 × 10183.22 × 10183.43 × 10182010
1.27 × 10193.93 × 10192.59 × 10183.99 × 10185.68 × 10182020
1.29 × 10193.43 × 10195.17 × 10184.8 × 10186.97 × 10182025
1.22 × 10193.43 × 10194.72 × 10185.17 × 10187.85 × 10182030
1.15 × 10193.42 × 10194.53 × 10185.45 × 10188.56 × 10182035
Rain
(geopotential energy)
emergy (unit: sej)
1.07 × 10202.54 × 10201.66 × 10192.20 × 10191.47 × 10192000
1.01 × 10202.54 × 10201.68 × 10192.08 × 10192.22 × 10192010
8.17 × 10192.54 × 10201.68 × 10192.58 × 10193.63 × 10192020
8.34 × 10192.22 × 10203.32 × 10193.10 × 10194.49 × 10192025
7.84 × 10192.21 × 10203.04 × 10193.32 × 10195.08 × 10192030
7.39 × 10192.21 × 10202.93 × 10193.52 × 10195.52 × 10192035
Rain
(chemical potential energy)
emergy (unit: sej)
1.66 × 10203.97 × 10202.59 × 10193.43 × 10192.29 × 10192000
1.58 × 10203.96 × 10202.63 × 10193.24 × 10193.46 × 10192010
1.28 × 10203.96 × 10202.62 × 10194.03 × 10195.67 × 10192020
1.30 × 10203.46 × 10205.21 × 10194.84 × 10197.02 × 10192025
1.23 × 10203.45 × 10204.75 × 10195.21 × 10197.91 × 10192030
1.15 × 10203.44 × 10204.57 × 10195.49 × 10198.63 × 10192035
Wind energy
emergy (unit: sej)
6.28 × 10101.48 × 10119.69 × 1091.28 × 10108.59 × 1092000
5.89 × 10101.48 × 10119.82 × 1091.21 × 10101.29 × 10102010
4.76 × 10101.48 × 10119.78 × 1091.50 × 10102.12 × 10102020
1.28 × 10103.40 × 10105.11 × 1094.75 × 1096.90 × 1092025
1.20 × 10103.39 × 10104.67 × 1095.12 × 1097.77 × 1092030
1.13 × 10103.38 × 10104.49 × 1095.40 × 1098.48 × 1092035
Geothermal heat
emergy (unit: sej)
5.22 × 10121.24 × 10138.15 × 10111.08 × 10127.22 × 10112000
4.95 × 10121.24 × 10138.25 × 10111.02 × 10121.09 × 10122010
4.01 × 10121.24 × 10138.22 × 10111.27 × 10121.78 × 10122020
4.09 × 10121.09 × 10131.64 × 10121.52 × 10122.21 × 10122025
3.85 × 10121.09 × 10131.49 × 10121.64 × 10122.49 × 10122030
3.63 × 10121.08 × 10131.43 × 10121.73 × 10122.71 × 10122035
Disclaimer/Publisher’s Note: The statements, opinions and data contained in all publications are solely those of the individual author(s) and contributor(s) and not of MDPI and/or the editor(s). MDPI and/or the editor(s) disclaim responsibility for any injury to people or property resulting from any ideas, methods, instructions or products referred to in the content.

