Article

Effects of the In-Plane Flexural Behavior Modeling Choices for Hollow Clay Masonry Brickwork with Horizontal Holes

Department of Engineering and Applied Sciences, University of Bergamo, 24044 Dalmine, Italy
*
Author to whom correspondence should be addressed.
Buildings 2023, 13(10), 2438; https://doi.org/10.3390/buildings13102438
Submission received: 6 September 2023 / Revised: 20 September 2023 / Accepted: 22 September 2023 / Published: 25 September 2023
(This article belongs to the Special Issue Maintenance, Repair and Rehabilitation of Building Structures)

Abstract

:
Buildings with load-bearing structures made of hollow clay blocks with horizontal holes and cement-based mortar are quite common in Italy, yet the current design standards do not consider specific modeling issues to be addressed by practicing engineers. In the absence of peculiar specifications, the prescriptions given for ordinary masonry walls are thus commonly adopted. However, experimental tests proved that walls built with hollow brick masonry performed quite differently from ordinary masonry walls. Considering the in-plane flexural behavior under horizontal loads, unlike ordinary masonry walls that exhibit some ductility, this construction typology performs quite poorly, showing very little deformation capacity and ductility. In recent experimental campaigns, a brittle collapse mechanism was observed due to the toe crush, which entailed the inability of the wall to further withstand the vertical loads. In this paper, the effects of incorrect modeling choices on the characterization of the in-plane behavior of this construction typology and the consequences related to overestimating ductility are discussed; the effects of the reduced ductility on the reliability of the assessment of an existing building as well as on the conceptual design of possible structural retrofit measures are investigated. From the critical discussion, the need emerged to accurately model the in-plane flexural behavior and to update the code provisions to explicitly consider masonry walls with hollow clay bricks with horizontal holes.

1. Introduction

Buildings with load-bearing structures made of hollow clay blocks with horizontal holes and cement-based mortar are quite common in Italy [1,2,3,4]. Nowadays, this construction technique is only used for non-structural elements in new buildings with reinforced concrete-bearing structures, but from 1950 to the end of the 1960s, a period also known as the “economic boom period”, this construction technique was quite a common practice in the erection of small- to medium-sized buildings, up to three stories high. The demand for houses and the inadequacies of the building codes of that time caused urban areas to be quickly constructed with quite low-quality building technologies, materials, and structural details, with buildings designed for basic structural performances and to withstand only vertical loads, without considering seismic actions.
The seismic events that struck the Italian territory (e.g., the Benaco earthquake in 2004 and the Emilia earthquake in 2012) proved evidence of the seismic vulnerability of buildings constructed with hollow clay bricks with horizontal holes. The observed early collapses of the masonry structures were probably caused by the brittle crushing of the hollow bricks due to the abrupt stress concentration in the thin clay webs and by the inability of this masonry typology to redistribute the stresses once the load-bearing capacity is reached. In slender walls, the hollow bricks brittle crushing can affect a significant portion of the wall base cross-section, potentially making it impossible to further support the vertical loads.
Despite the relevance of the topic, little research has been carried out on the structural behavior of this masonry typology [1,2,3,4,5], and the current design standards do not consider dedicated modeling specifications that should rather be addressed by practitioners.
Considering the in-plane flexural behavior of slender masonry walls with horizontal holes, recent research highlight that, unlike those ordinary masonry walls that exhibit ductility, this construction typology exhibits very little deformation capacity and ductility [3,4]. In the absence of dedicated design specifications, the adoption of the code provisions for ordinary masonry walls to model the flexural behavior of hollow bricks masonry walls with horizontal holes can lead to an incorrect evaluation of the building response, overestimating ductility regardless of the evidence documented in the scientific literature.
Based on these considerations, the effects of different modeling options for characterizing the in-plane flexural behavior of hollow brick masonry walls are evaluated and discussed in this paper, emphasizing the importance of correctly representing in the reduced ductility. The results show that specific design parameters for hollow clay bricks with horizontal holes should be included in the current codes and a careful evaluation of the modeling choices in the case of masonry walls with horizontal holes is essential not only for the structural assessment of existing building but also for the design of any possible retrofit solutions.

2. Literature Review on In-Plane Failure Mechanisms of Hollow Clay Brick Masonry Walls with Horizontal Holes

Three main in-plane failure mechanisms can occur in masonry walls, namely, horizontal shear sliding, diagonal shear failure, and in-plane flexural/rocking failure (Figure 1a–c, respectively). Depending on the wall boundary conditions, out-of-plane mechanisms can also occur; some insights into this failure mode can be found in Valluzzi et al. [5]. In this section, a critical literature review of the main experimental results of material characterization tests (Figure 2b,c) and in-plane cyclic tests (Figure 1a–c) is presented.

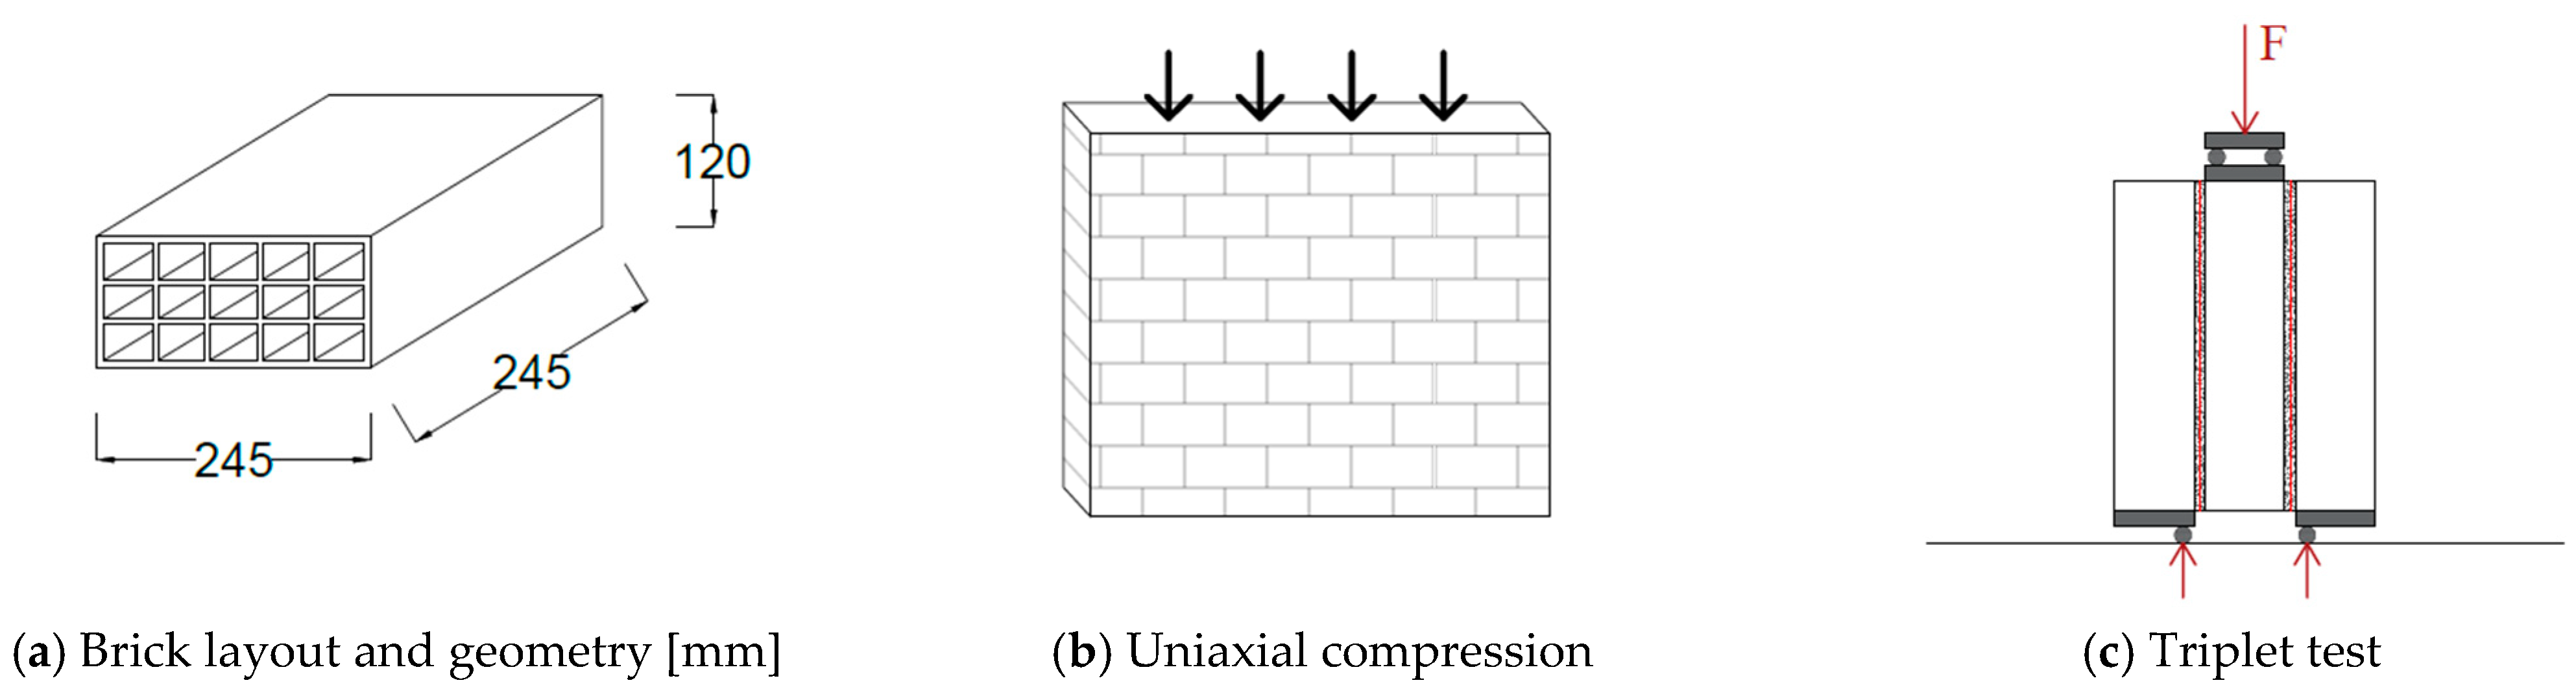
2.1. Uniaxial Compression of Masonry Sub-Assemblies

In ref. [1], researchers performed uniaxial compression tests on well-preserved masonry assemblies taken from a construction site during the renovation work of a residential building constructed in the 1960s. The masonry assembly had a cross-section area of (0.68 × 0.25) m2 and was made by four courses of hollow clay bricks (250 × 330 × 120) mm3 with 8 cells and a void area greater than 60%; M2 or M3 cement-based mortar was estimated for the bed joints [7]. The average compressive strength of the masonry assembly ( f c , v ) was 1.19 MPa.
Messali et al. [3] used newly manufactured (245 × 245 × 120) mm3 hollow clay bricks with 10 cells and a void ratio greater than 60% (Figure 2a), and M2.5 cement-based mortar to realize a six-course masonry assembly with a (0.50 × 0.25) m2 cross-section area. The average compressive strength ( f c , v ) and modulus of elasticity ( E M ) equal to 1.57 MPa and 2370 MPa, respectively, were obtained according to [8].
Labò and Marini [4] tested the six-course specimens made of (245 × 245 × 120) mm3 hollow clay bricks with 15 cells and a void ratio of 62% [8] using the same standard procedure. In this case, three pre-mixed cement-based mortars were used, namely: M2.5, M5.0, and M20.0, with compressive strength equal to 2.5 MPa, 5.0 MPa, and 20.0 MPa, respectively. M2.5 and M5.0 were selected to represent weak and average mortars, respectively; the M20 mortar, which is stronger than necessary for the intended application, was chosen to highlight the influence of mortar compressive strength on the ductility of the wall. Uniaxial compressive average strengths ( f c , v ) of 1.10 MPa, 1.12 MPa, and 1.45 MPa, and elastic moduli ( E M ) of 1100 MPa, 1200 MPa, and 1400 MPa, respectively, were determined for the three types of mortar. An ultimate average strain ( ε c , v ) equal to about 0.1% was observed in all three cases.
Similar average compressive strengths were obtained in the tests, while the elastic modulus was characterized by higher variability. This might be attributed to the limited number of tests conducted on this construction typology, which leads to inconclusive statistical results, as well as to both the varying manufacturing process of the specimens, possible inhomogeneity of blocks (with small defects such as micro-cracks in the thin web) and mortars and measuring issues due to the very small displacements developed by the specimen in the elastic phase of the test. The experimental values are summarized in Table 1.

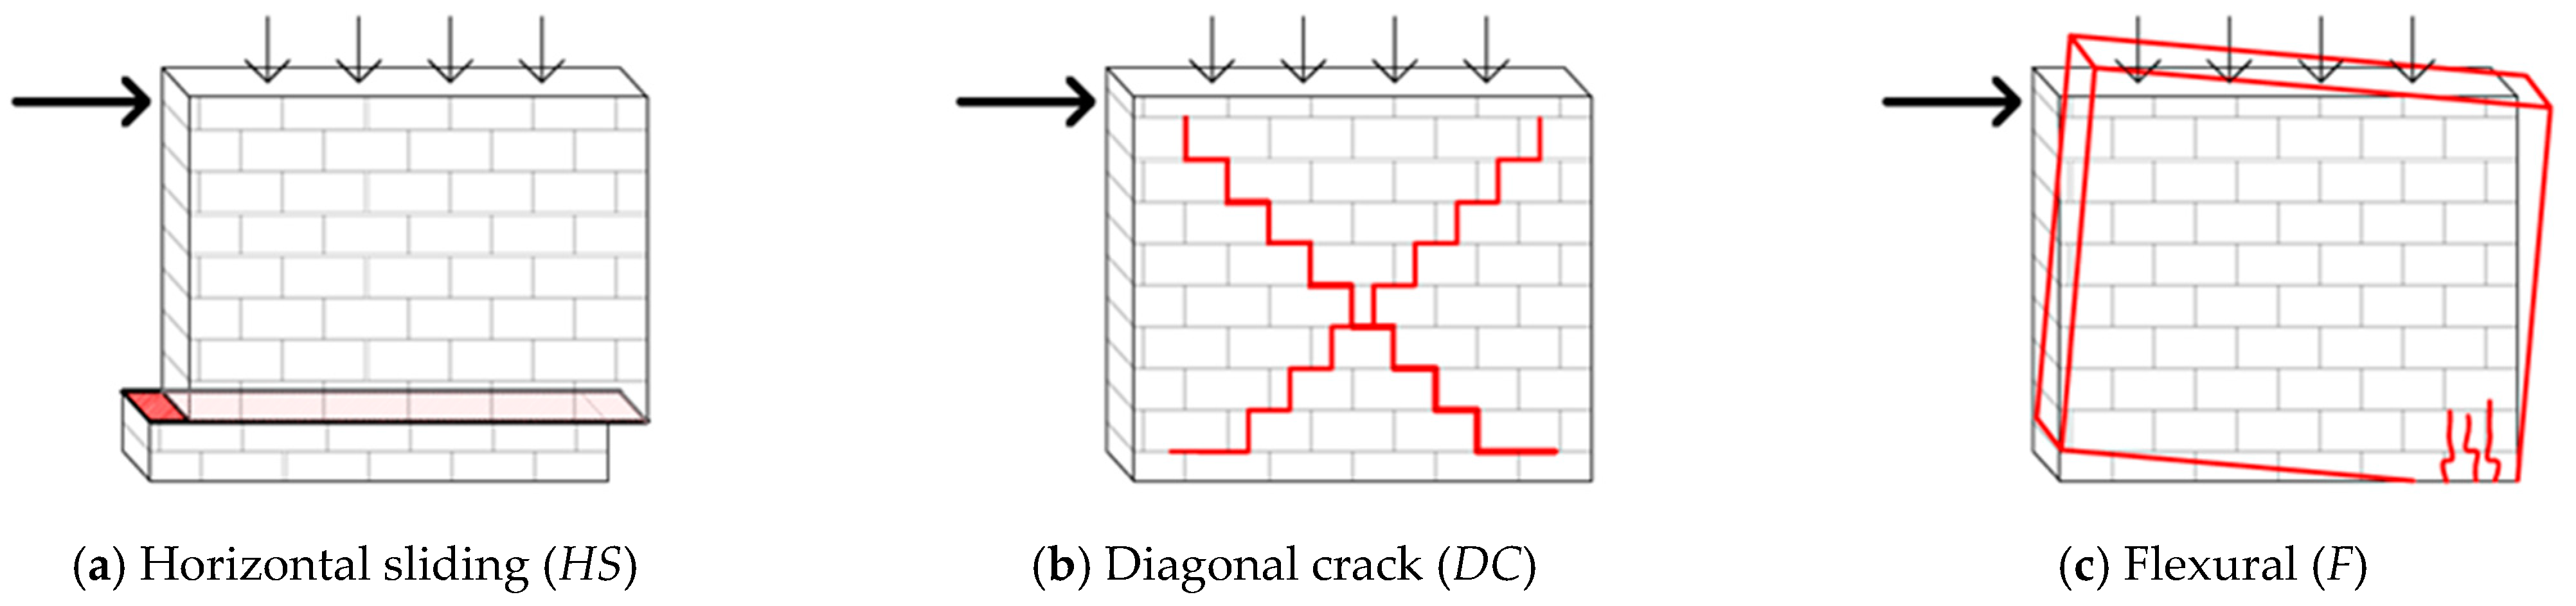
2.2. In-Plane Horizontal Shear Sliding (HS)

To the best of the authors’ knowledge, no specific experimental campaigns have been carried out on full-scale specimens built with hollow bricks with horizontal holes failing under horizontal sliding.
The shear-sliding capacity was evaluated only by performing triplet tests according to the procedure described in EN 1052-3:2002 [9] (Figure 2c). In Messali et al. [3], triplet tests were performed on specimens subjected to average lateral normal stresses ranging between 0.1 MPa and 0.3 MPa. Shear failure occurred along the unit mortar interfaces (type A.1. according to EN 1052-3:2002); cohesion ( f v 0 ) and initial friction coefficient ( μ ) equal to 0.09 MPa and 0.96 (corresponding to a friction angle φ = 44 ° ) were obtained. The residual friction coefficient was 0.84 MPa ( φ = 40 ° ), while no residual cohesion was observed. In Labò and Marini [4], the same lateral compression force was applied, and the same failure mode was observed (type A.1. in conformity with EN 1052-3:2002). The cement mortar used did not affect the results; f v 0 and μ equal to 0.05 MPa and 0.70 MPa ( φ = 35 ° ) were obtained as initial values, while the residual friction coefficient was 0.67 ( φ = 33 ° ) and the residual cohesion was almost nil.

2.3. In-Plane Diagonal Cracking (DC)

The resistance of this type of masonry to diagonal shear cracking was studied by Riva et al. [2] with 12 diagonal compression tests on (1.00 × 1.00 × 0.25) m3 masonry assemblies. The same bricks as in Messali et al. [3] and M5 cement mortar were used to build the specimens which were subjected to an average vertical confinement stress ranging between 0 MPa and 0.1 MPa. Diagonal cracks propagating along the joints with an inclination of 45° were observed. As expected, coherently with a Mohr–Coulomb behavior, the results confirmed the proportionality of the resistant tangential stress and the average normal confining stress; the average values of the shear stress ranged from 0.47 MPa to 0.58 MPa. The observed results were higher than the values recommended by the code for hollow bricks (up to +183%) [10]. Elastic-fragile behavior was observed during the test campaign.

2.4. Flexural Panel Crushing (F)

The first studies about the flexural collapse mechanism of a masonry wall built with hollow bricks with horizontal holes can be found in Messali et al. [3], who carried out an in-plane quasi-static cyclic test on an inverted T-shear wall subjected to a uniformly distributed vertical load.
Labò and Marini [4] adopted a specific experimental setup, adapted from Giuriani et al. [11], in order to replicate the static and kinematic conditions of slender masonry walls (with a height-to-length ratio of 2.5) which exhibit a rocking behavior. The experimental setup was designed to maintain a constant vertical resultant for the duration of the test while the cyclic horizontal displacement was applied. In addition, the test setup enables the independent shift of the vertical resultant position while increasing the horizontal displacement, thus enabling the progressive increase in the diagonal compressed strut angle which develops within the masonry pier. The test was carried out on two full-scale masonry walls in which two different cement mortars were used (M2.5 and M20.0). Very small maximum ultimate drifts of 6 (‰) and 5 (‰) were obtained for the M2.5 and M20.0, respectively, whilst capacity was in line with the values recommended by the codes for masonry. In the same research work, a FEM was validated against the experimental results, and numerical sensitivity analyses were conducted to further explore various boundary conditions for the masonry pier. More specifically, in the experimental campaign, the upper collector, possibly mimicking a strong spandrel wall, was free to rotate; whilst in the FEM, such an approximation was discussed by considering also other boundary conditions in which rotation is inhibited and the upper collector can shift vertically and horizontally while maintaining the horizontal orientation. It is worth mentioning that the wall ductility was even lower in the case of strong spandrel wall due to a higher concentration of stresses.
Table 1. Summary of the literature review results.
ElementPropertySymbol
[Unit]
Labò et al. [4]Messali et al. [3]Canal [1]
M. assembly: masonry portionCompressive strength f c , v
(MPa)
f c , v M 2.5 = 1.10 f c , v M 2.5 = 1.57 f c , v M 2 3 = 1.19
f c , v M 5.0 = 1.12--
f c , v M 20.0 = 1.45--
Elastic modulus E M
(MPa)
E M M 2.5 = 1100 E M M 2.5 = 2370-
E M M 5.0 = 1200 --
E M 20.0 = 1400--
Compressive strain
at collapse
ε c , v
(-)
ε c , v M 2.5 = 0.1%
ε c , v M 5.0 = 0.1%
ε c , v M 20.0 = 0.1%
M. assembly: tripletInitial shear strength f v 0
(MPa)
f v 0 M 2.5 = 0.05 f v 0 M 2.5 = 0.09-
Shear friction coefficient μ
(-)
μ M 2.5 = 0.70 μ M 2.5 = 0.96-
The indication of the mortar is superscripted (e.g., f c , v M j , and E M M j with j   = 2.5, 5.0, 20).
Based on the experimental and numerical results, Labò and Marini [4] proposed a bilinear load-horizontal displacement skeleton curve to represent the in-plane flexural response of this masonry wall typology, partly calibrated on experimental results and partly with reference to current standards. Specifically, the skeleton curve is characterized by the maximum base shear ( V R d F ), computed in accordance with guidelines provided in the code [10]; the elastic stiffness of the masonry wall, calculated based on the Timoshenko theory ( k E l ); and the ultimate drift ( u F ), assumed as the ultimate drift determined in the experimental test (5‰) divided by a safety factor ( γ ) equal to 2 [4]. The safety factor takes into account the results of the experimental campaign and the results of the FEM; in particular, it considers (1) the maximum drift and base shear are affected by the ultimate compressive strength of the wall assembly, which may vary depending on the manufacturing process; (2) the constraint conditions of the upper collector may significantly affect the global response; a rotationally constrained top chord can reduce the ultimate displacement by 50% [4]; (3) brittle failure without any softening is expected; (4) once the maximum load-bearing capacity is reached at the wall base, the wall cannot resist even vertical loads due to the crushing of the thin brick webs.

2.5. Mixed Failure Modes

In Messali et al. [3], a squat shear wall was also tested, in which a mixed shear-flexure failure was observed. The specimen, tested under the same conditions as the inverted T-wall and subjected to a uniform vertical compression of 0.10 MPa, exhibited the onset of wall toe crushing and diagonal shear damage. The test was stopped at a drift of 5.8‰ to enable further studies on some retrofit techniques. In this case, the wall was able to withstand the vertical loads once its capacity was reached, provided that the area affected by crushing compared with the wall base cross-section was small.

2.6. General Considerations

The current code [10] makes no reference to brick walls with a high void ratio (above 60%) or to hollow brick masonry with horizontal holes. Based on the outcomes of the literature review, it is worth noting that the adoption of recommendations for common masonry walls for this type of construction may be severely unconservative. For example, assuming an ultimate flexural drift of 1%, as suggested by the current code for ordinary masonry walls, would entail a dramatic overestimation of the pier displacement capacity, which in turn would result in the incorrect assessment of the seismic vulnerability of the existing building and make no mention of the need of assessing the stability against the vertical loads after the onset of the flexural failure mechanism. Based on these preliminary considerations, there is a need to encourage the introduction of specific assessment rules for this type of masonry in the current codes. To corroborate this instance, the impact of modeling choices in assessing the vulnerability and in designing possible retrofit solutions for hollow block masonry with horizontal holes is critically discussed in the following sections.

3. Modeling Choices: Impact of the Reduced In-Plane Flexural Ductility on the Structural Response

The literature review on the in-plane flexural behavior of masonry piers made of hollow bricks with horizontal holes highlights that distinct specifications are needed for the accurate representation of the whole structure response and that this wall typology cannot be equated with others. Its lower flexural drift capacity, the associated quasi-brittle failure behavior, and the incapacity to resist gravity loads once the ultimate flexural capacity is attained, reduce or even prevent the redistribution of forces between the masonry piers, which would rather be expected in the case of ductile behavior.
For example, if the wall in Figure 3 consists of ordinary masonry piers and spandrels made of solid clay bricks and assuming a strong spandrel-weak piers behavior, the ultimate capacity can be preliminarily evaluated by adding the ultimate capacity of each pier. Thanks to the in-plane ductile flexural behavior of common masonry walls ( u _ N T C F = 1.0 % ), when the maximum base shear is reached in wall 2 (green shaded pier in Figure 3a), the applied action can be further increased thanks to the force redistribution to the other masonry walls until their maximum base shear and horizontal displacement are also achieved. In addition, the ultimate displacement of the entire wall is bound to the mechanism with the lower displacement capacity; due to the expected mechanisms of horizontal shear sliding (HS) and in-plane deflection (F), the ultimate displacement of the wall would be determined by the horizontal sliding mechanism, which guarantees the ability of the wall to withstand the vertical loads when the ultimate capacity is reached. To give an example, considering only piers 1, 2, and 3 (whose capacities are plotted in Figure 3b), the sum of their capacities is plotted in blue in Figure 3c.
On the other hand, if hollow brick masonry piers with horizontal holes are considered, the performance of the wall is lower, both in terms of maximum force and displacement (green line in Figure 3c). The onset of a quasi-brittle failure mechanism of pier 2 and its consequent inability to continue resisting the vertical loads lead to the early collapse of the entire wall before the maximum base shear of pier 3 and the maximum displacement of pier 1 are reached.
In the case of rigid diaphragms and torsionally weak buildings, the need to accurately consider the in-plane flexural behavior of hollow clay brick masonry walls becomes even more important. Because of torsional behavior, walls that are far from the shear center (S) must be able to accommodate larger displacements than those closer to S (Figure 3d). In these cases, the need to protect the structural integrity of these walls characterized by a very low flexural ultimate drift could have a relevant impact on the design of possible seismic strengthening solutions.
To support these concepts, a critical evaluation of the modeling choices is first performed in this section. Then, the impact of such modeling choices on the structural vulnerability assessment and associated seismic risk mitigation strategies are discussed using a reference case in Section 4.
The following modeling options were selected to describe the behavior of hollow brick masonry walls with horizontal holes. For in-plane flexural behavior, the skeleton curve suggested by Labò and Marini [4] was adopted; as for the other in-plane mechanisms, the current code prescriptions were addressed since no specific tests have yet been performed. The code equations are summarized in Section 3.1. As for the compressive strength of the masonry ( f d = f c , v (Table 1)), unless specific tests are performed, based on the literature findings, a f d was chosen in the range 1.0–1.5 MPa.
Horizontal shear sliding (superscript HS in Section 3.1.2) is modeled with reference to the Mohr–Coulomb law, in which a friction coefficient of 0.4 and an ultimate drift of 0.5% were assumed [10]. It is worth noting that the influence of the friction coefficient on the structural response should also be investigated as it may influence the pier failure mechanisms activation order; for the sake of simplicity, this work focuses on the sole in-plane flexural mechanism.
Diagonal shear cracking (superscript DC in Section 3.1.3) is modeled by addressing Turnsec and Cacovic’s formulation. Diagonal cracking is a quite rare failure mode for this building typology, characterized by low average normal stresses.

3.1. Summary of the Parameters Adopted to Model the Hollow Clay Bricks Masonry Wall

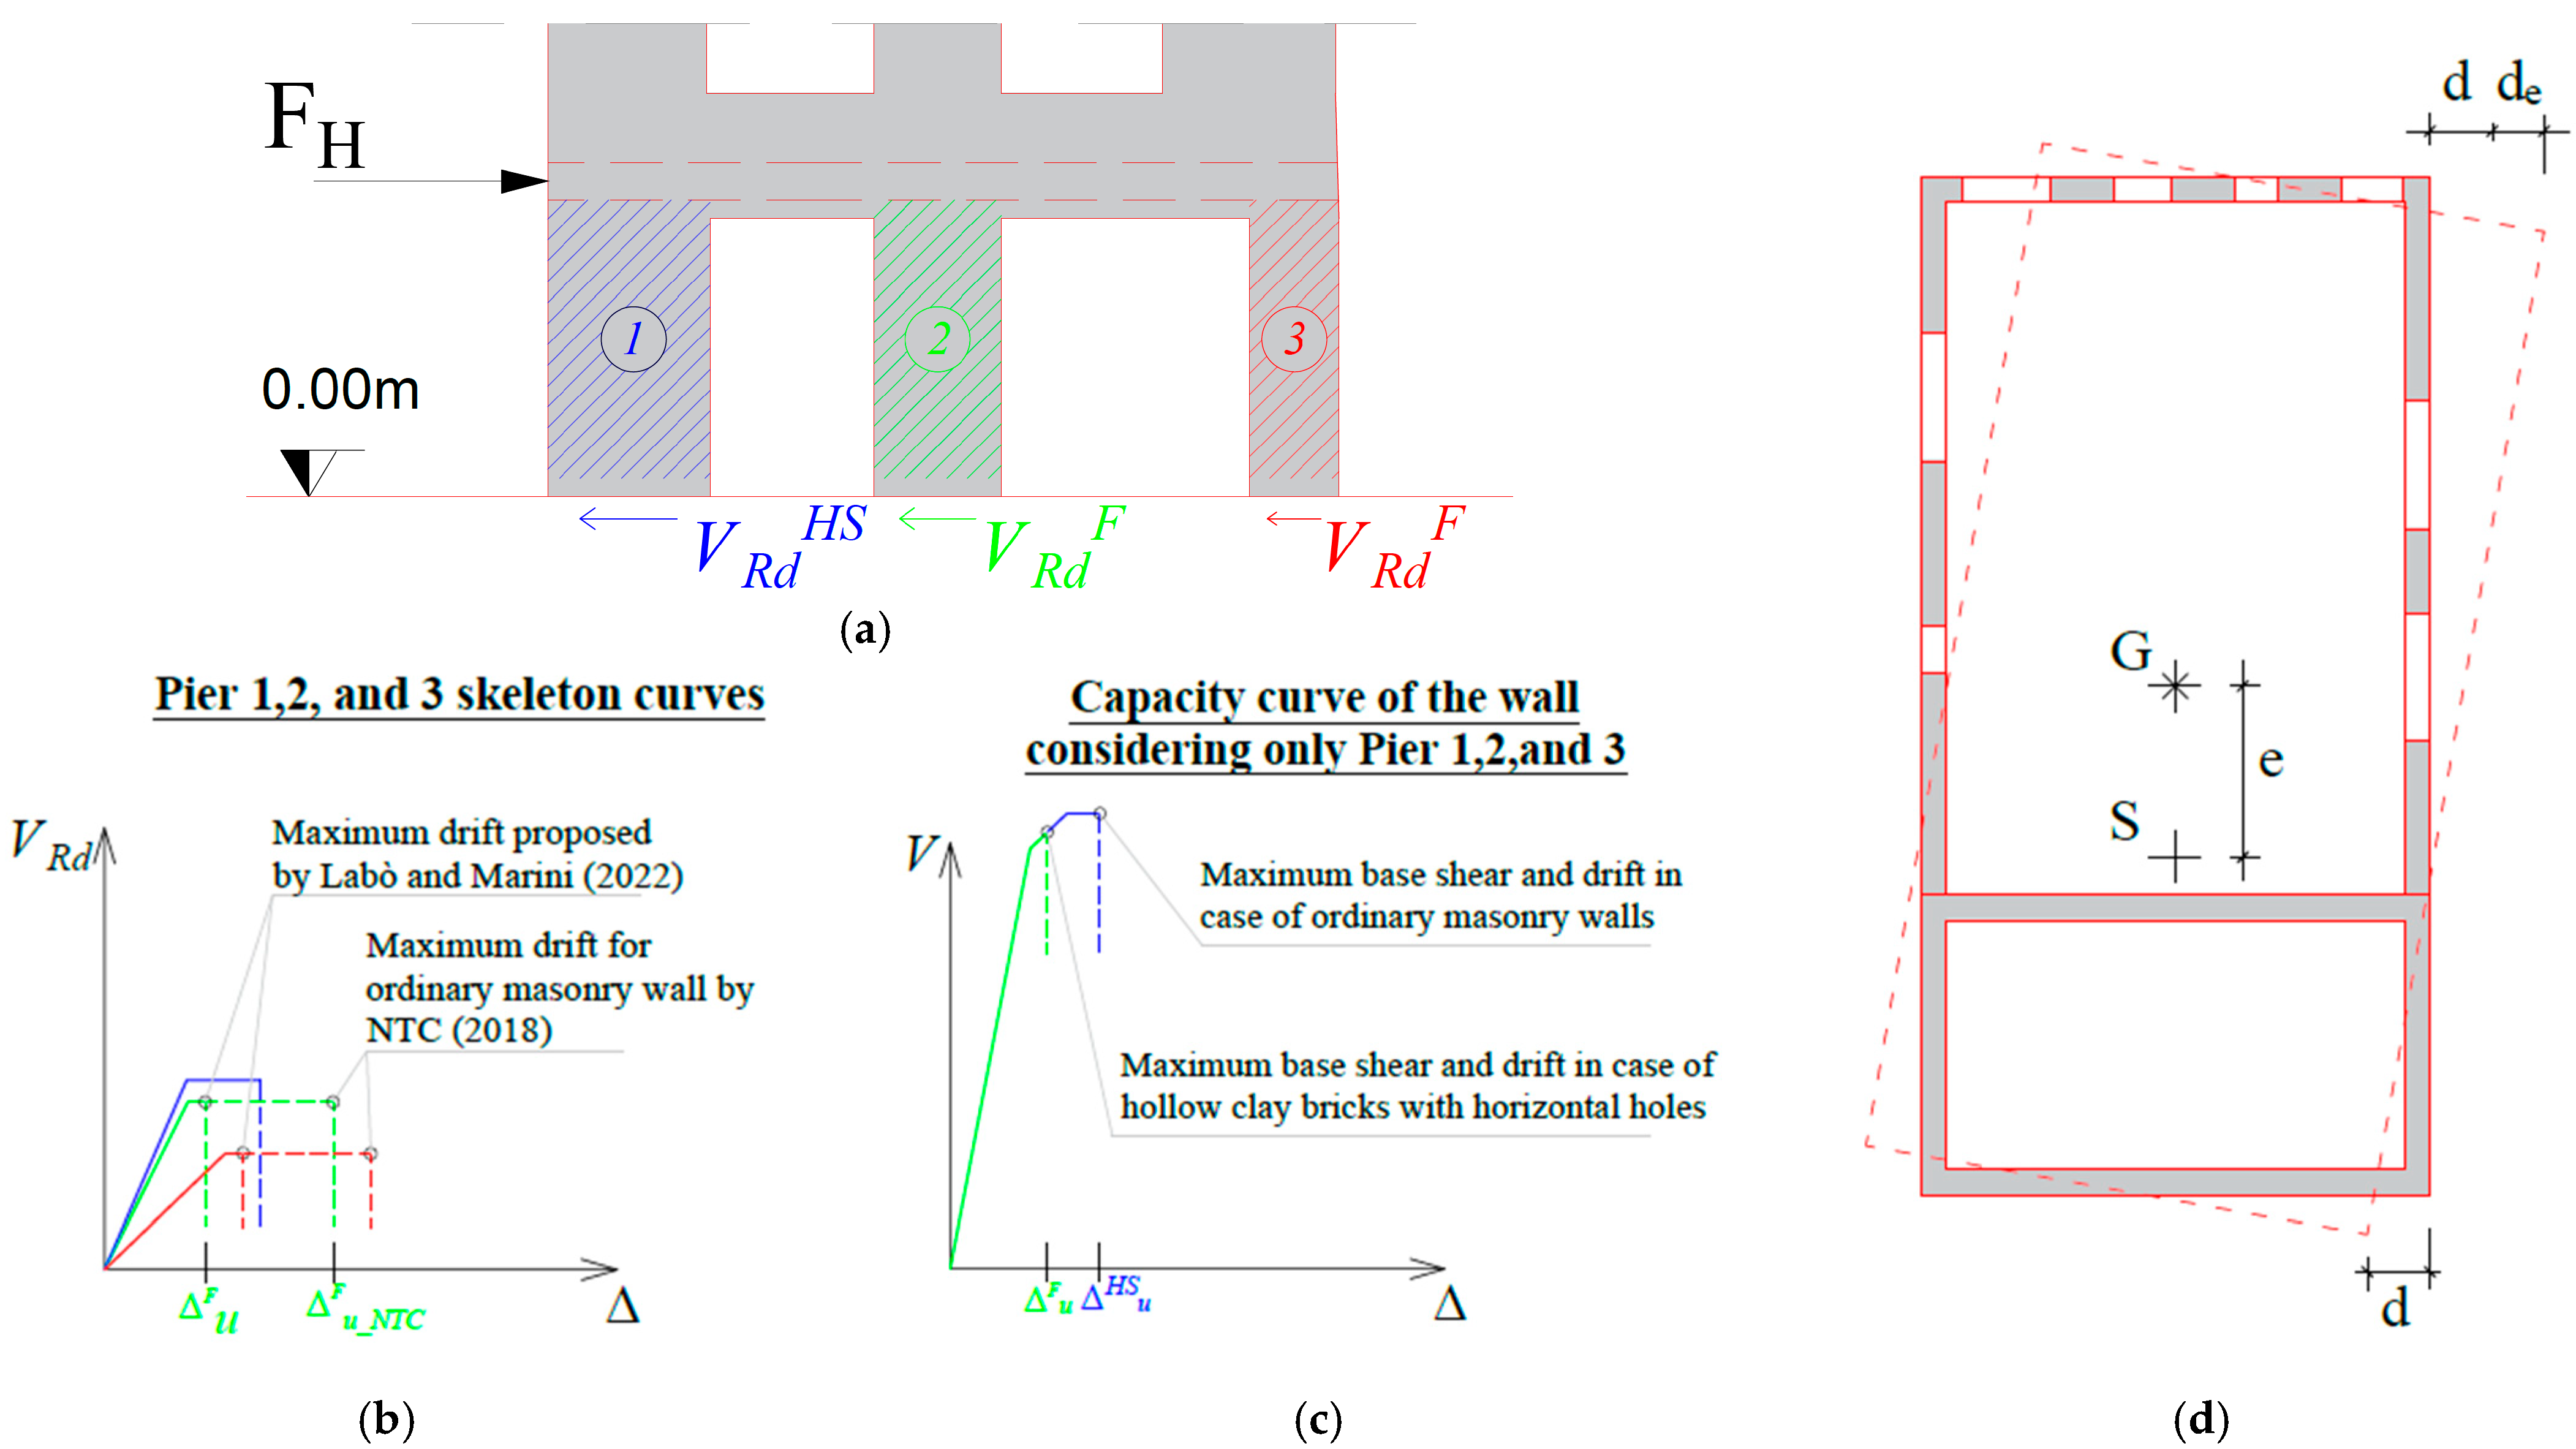
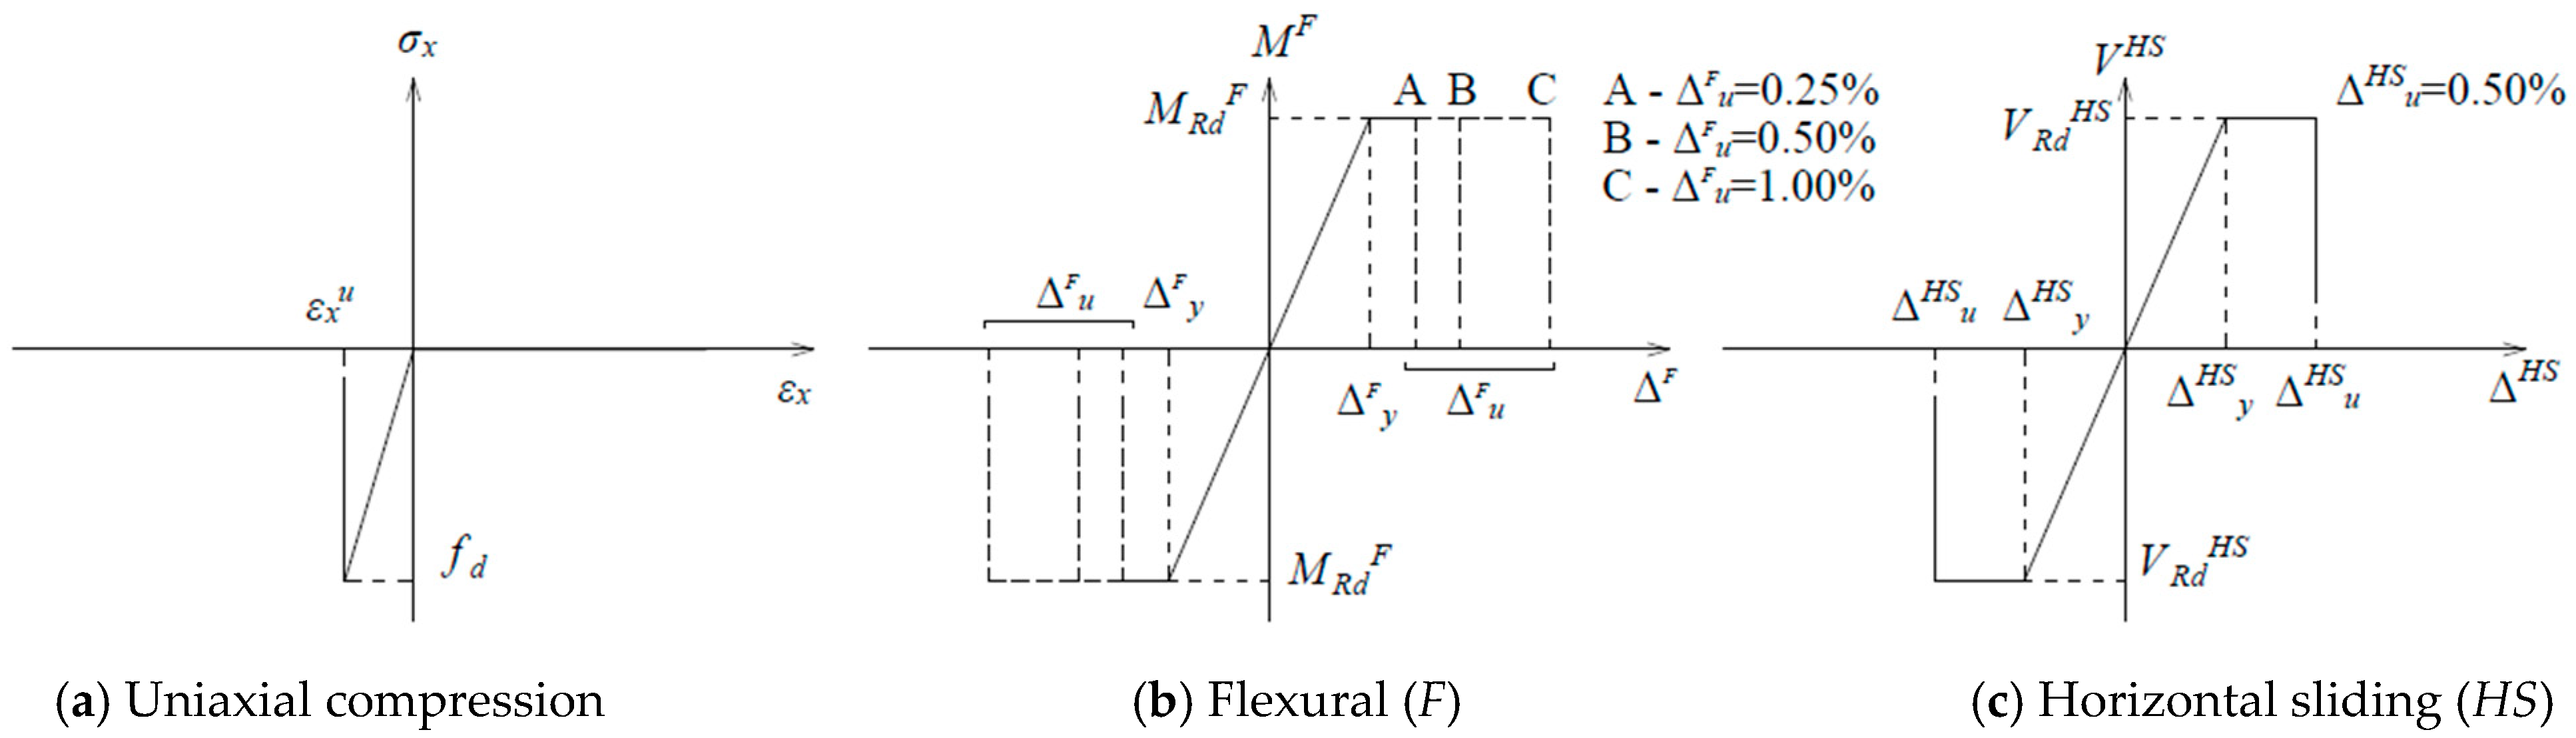
3.1.1. In-Plane Flexural Behavior (F)

The ultimate resisting moment ( M R d F ) can be calculated as:
M R d F = L 2   t   σ 0 2 1 σ 0 0.85 f d
where L and t are length and thickness of the masonry wall, σ 0 = F v L t is the compressive strength on the upper wall cross-section generated by the vertical load F v , and f d = f c , v is the design maximum strength which can be assumed equal to 1.00–1.50 (MPa).
The resistant base shear ( V R d F ) can be obtained by dividing M R d F by the effective height of the wall ( h 0 ) as follows:
V R d F = M R d F h 0
The elastic stiffness of the masonry wall ( k E l ), the yielding displacement can be derived as
k E l = 12 E I H 3 ( 1 + Φ ) 1 = 1 ( H 3 12 E I + H G A ) y F = V R d F k E l
where G , E , I , and A are the shear modulus, the elastic modulus, the inertia moment, and the cross-section area ( L · t ), respectively. The same elastic stiffness can be considered for the other mechanisms.
In addition the ultimate drift ( u F )
u F = F γ
where F is 0.5% and γ can be assumed equal to 2.

3.1.2. Horizontal Sliding (HS)

The ultimate resisting shear ( V R d H S ) can be calculated as:
V R d H S = L   t   f v d
where L   is the compressed zone of the wall defined according to the code [10], and f v d = f v k γ M , which, in case on non-linear static analysis is defined as f v d = f v k 0 0.7 + 0.4 σ n [10].
The yielding displacement can be derived as
y H S = V R d H S k E l
and the ultimate drift ( u H S ) can be considered as equal to 0.5% [10].

3.1.3. Diagonal Cracking (DC)

The ultimate resisting shear ( V R d D C ) can be calculated as:
V R d D C = L t 1.5   τ 0 d b     1 + σ 0 1.5   τ 0 d
where 1 b = h L   1.5   is the cross-section ratio, and τ 0 d is the shear strength defined according to the standards (NTC2018).
The yielding displacement can be derived as
y D C = V R d D C k E l
In addition, the ultimate drift ( u D C ) can be considered as equal to 0.4% [10].

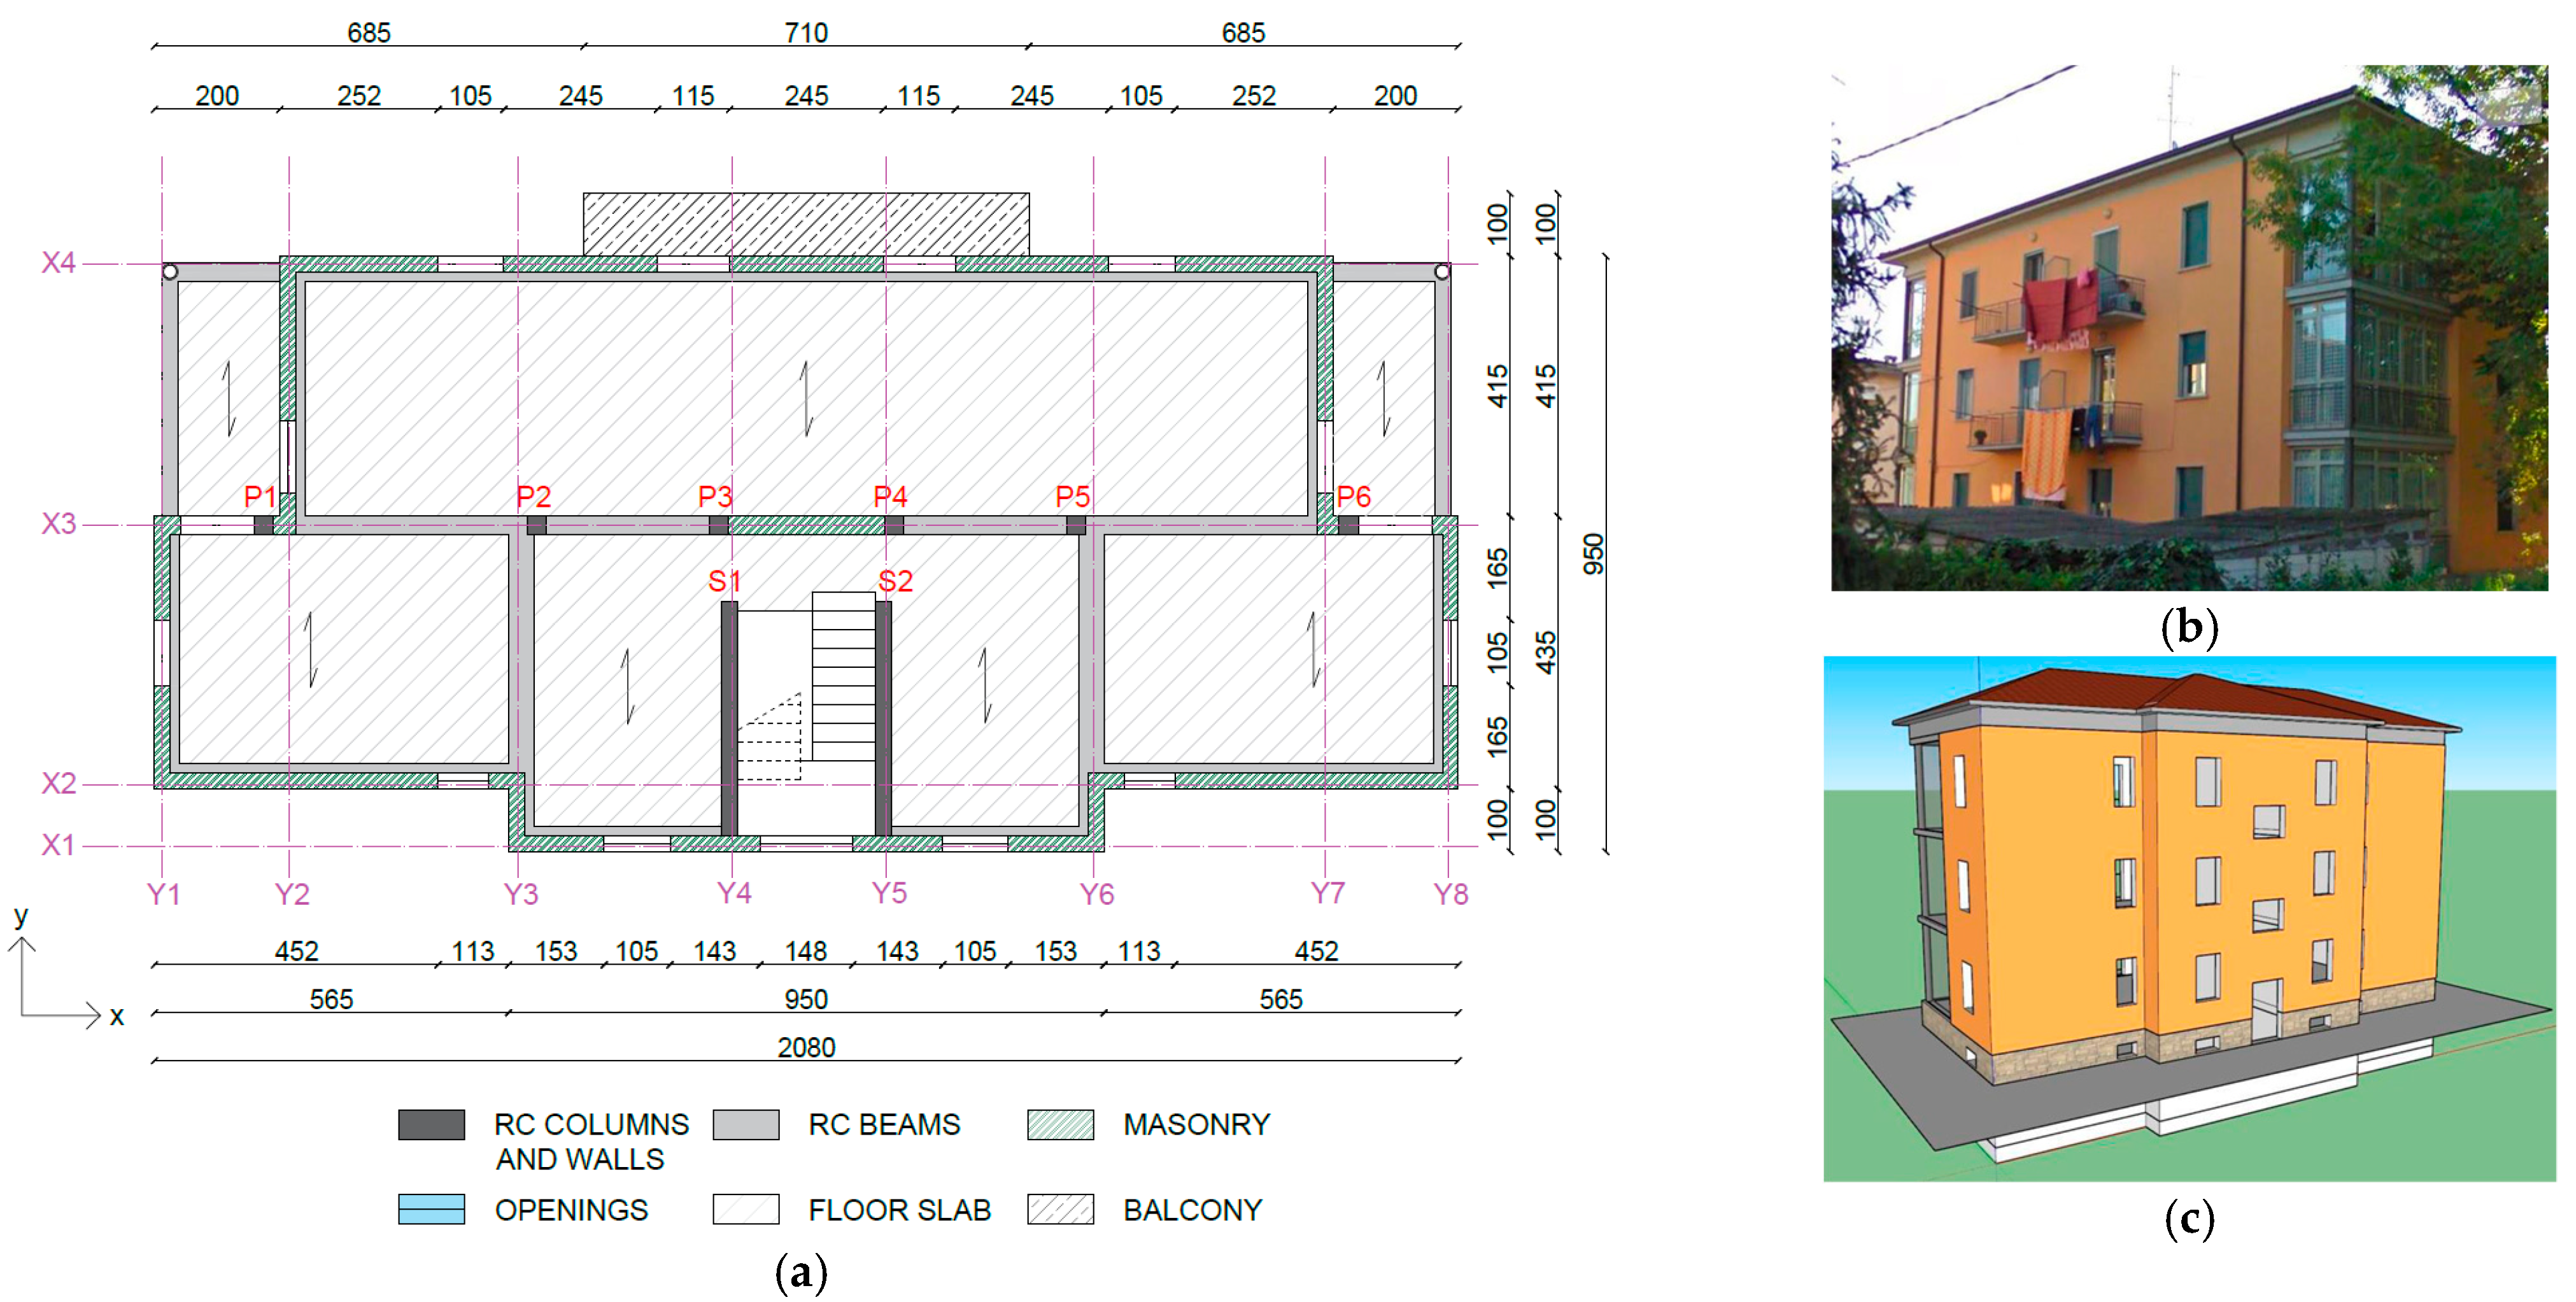
4. Impact of the Modeling Choices through the Application to a Reference Building

Focusing on flexural behavior, this section discusses the impact of the modeling choices on both the structural vulnerability assessment and the seismic risk mitigation strategies using a reference case.
The vulnerability assessment of the reference building was performed considering different values of in-plane flexural ultimate drift ( u F ), namely, (A) 0.25% as suggested by [4], (B) 0.50% as determined by the experimental campaign in [4] without considering a safety factor and considering the top section of the pier as free to rotate, and (C) 1.00% as suggested by the code for ordinary masonry [10].
A post-World War II residential building was selected as a reference case. The building is a rectangular three-story building constructed over a reinforced concrete basement (20.8 × 9.5) m2. The inter-story height is 3.2 m.
The bearing structure, designed for vertical loads only, consists of 25 cm thick hollow brick masonry walls (green shaded in Figure 4a), a central row of RC columns (30 × 30) cm2 with longitudinal reinforcement consisting of 4φ16 in FeB32k (dark grey in Figure 4a), and RC beams 40 × 30 cm2 with longitudinal reinforcement consisting of 4φ16 in FeB32k (light grey in Figure 4a). The bearing structure is symmetrical in plan and regular in elevation. The staircase walls (3.6 × 0.25) m2 are made of hollow bricks with horizontal holes.
Floors are made of a one-way RC beam and clay block floor system without RC overlay for a total thickness of 16.5 cm. The roof is made of wooden beams, joists, and planking.
FeB32k steel and C16/20 and C20/25 concrete were used for the foundation system, and beams and columns, respectively. The mechanical properties of the masonry were derived from the literature; in particular, an elastic modulus ( E ) equal to 1200 MPa, a compressive strength ( f d ) equal to 1.5 MPa, a shear strength ( τ 0 d ) equal to 0.05 MPa, and a material density equal to 12 kN/m3 were considered.
The finite element model was developed using MidasGen [12]; because the bearing structure is regular in the plane and in elevation, an equivalent frame approach was adopted. Masonry walls and frame members were modeled as beam elements; walls and columns were considered as Timoshenko beams fixed at their base. To properly represent the wall height, the RC chord width was accounted for by rigid links between the masonry wall ends and the top and bottom chord longitudinal axes.
The inelastic behavior was accounted for by lumped plastic hinges. For the RC elements, plastic hinges developed based on EC8 recommendations were considered [13]. As for the masonry walls, flexural and sliding shear failure were modeled; the behavior curves of the mechanisms are plotted in Figure 5. In the definition of the plastic hinges, the axial force was considered; it is worth noting that no tensile resistance was accounted for (Figure 5a). As for the compression, the maximum force was defined as N R d = f d L t (where f d = f c , v ) and the ultimate strain ( ε x u = ε c , v ) was set equal to 0.1% [4].
By evaluating the floor capacity according to Marini et al. [14], it was observed that the maximum capacity of the existing floors was 108 kN/m, which is higher than the maximum actions expected on the diaphragm. Accordingly, floors were assumed to act like in-plane diaphragms, resisting the horizontal loads up to their ultimate capacity through the development of an in-plane tied-arch resistant mechanism.

4.1. Nonlinear Static Analyses in the As-Built Condition

Nonlinear static analyses were performed for each of the three cases (A, B, C); both mass- and first-mode proportional distributions were considered. For the sake of clarity, the pushover curves related to the weakest distribution (mass proportional) are reported.
According to the current code [10], the collapse limit state (CLS) performance points were set at the displacement at which the ultimate capacity of the first masonry wall was reached; thus, when u F or u H S was reached. The life safety limit state (LSLS) is assumed to be reached when ¾ of the CLS lateral displacement is reached [10]. In Figure 6a and Figure 7a, the CLS is marked with a triangle (▴) or an asterisk (*) when the horizontal sliding or flexural capacity were reached, respectively. The plots of the plastic hinge state at the CLS are plotted in Figure 6c,d and Figure 7c,d for the x- and y-direction, respectively. The LSLS performance points are plotted with full dots. In Figure 6b and Figure 7b, the inter-story drift profile at the CLS is plotted.
As for the x-direction, Figure 6a shows that by assuming u F equal to 0.25% or 0.50%, the flexural failure of the X1 wall slender piers occurs at a lateral drift equal to 0.17% and 0.27%, respectively (Figure 6c), while assuming that u F is equal to 1.00% the sliding shear failure of the staircase squat wall occurs (Figure 6d) at a lateral drift of 0.27%. It is essential to note that, although the ultimate drifts in the cases where u F was equal to 0.50% and 1.00% were similar (about 158% with respect to the case with u F = 0.25 % ), the collapse mechanisms were different. In the first case, a flexural mechanism was triggered while; in the second case, a sliding shear failure occurred. Such a difference can led to quite different considerations when evaluating an existing building built with hollow clay bricks with horizontal holes, since slender masonry walls built with this construction typology cannot even resist the vertical loads once the ultimate flexural capacity is reached; this is not certain in the case of sliding failure of squat walls, where reduction in the base cross-section may not occur. From this consideration, it is clear that an erroneous overestimation of the ultimate drift ( u F ) can lead to an unexpected flexural collapse of the X1 wall with its consequent loss of capacity with respect to vertical loads and the collapse of the building.
At the global collapse step, as expected, the RC basement exhibits no displacement since it can be considered over-resistant and rigid with respect to the upper masonry walls; while the inter-story drift profile in Figure 6b shows a high drift concentration at the first floor, where the failure mechanisms were observed (Figure 6c,d).
In the y-direction, a slightly pronounced difference was observed between the cases where u F was set equal to 0.50% and 1.00% (equal to 0.49%); in this case, compared to the case where u F was set to 1.00%, the ultimate global drift reduced by 6% (drift equal to 0.46%) and 55% (drift equal to 0.22%) for the cases with u F equal to 0.50% and 0.25%, respectively. However, similar considerations can be made for the x-direction. In this case, the drift profile is constant along the building height since the in-plane and in-elevation regular seismic-resistant elements allow for a linear deformed shape.

4.2. Influence of the Modeling Choices on the Seismic Risk Mitigation Strategies

To evaluate the impact of the modeling choices on the seismic risk mitigation strategy definition, the reference building was located in three different Italian seismic zones; in particular, a low ( a g S L V = 0.105 g ,   F 0 = 2.42 ,   T c * = 0.271 ), medium ( a g S L V = 0.195 g ,   F 0 = 2.44 ,   T c * = 0.281 ), and high ( a g S L V = 0.334 g ,   F 0 = 2.40 ,   T c * = 0.3646 ) seismic areas were considered. Site class C and topography T1 were considered. First, the vulnerability assessment was performed for each site, and then preliminary considerations were made for the conceptual design of a possible retrofit solution. The focus was made on retrofit solutions carried out from the outside and given the fragility of the analyzed building typology, elastic over-resistant solutions were considered [15]. For this reason, a comparison was made between the stiffnesses of the retrofit solution required for the different cases ( u F = 0.25 % ,   0.50 % ,   and   1.00 % ), while both the maximum capacity of the retrofit and its nonlinear behavior were not considered; for this purpose, the simplified design spectra proposed in [16] were adopted.

Seismic Vulnerability Indexes of the Building in the As-Built Configuration and the Required Retrofit Stiffness

The capacity curves of the reference building are plotted in the ADR spectrum; the y-direction for each u F was considered. The ADRS and the main parameters of the bilinear curve, namely, the equivalent mass ( m 1 * ), elastic period ( T 1 * ), elastic stiffness ( k 1 * ), yield force ( F y , 1 * ), and the failure mechanism (FM) are summarized in Figure 8. The seismic vulnerability index ( ζ E ) is defined according to the Italian code [10] as the ratio between the LSLS performance point displacement (Figure 7a) and the LSLS displacement demand of each site, while the strength parameter ( η ) is the ratio between the reference building yielding force ( F y , 1 * ) and the associated elastic seismic demand ( m 1 * · S a ( T * ) ).
As shown in Figure 8, m 1 * ,   T 1 * ,   and   k 1 * do not differ significantly by varying the ultimate flexural drift ( u F ) but variations of u F lead to an increase in the ultimate displacement of the reference building. Since the elastic stiffness and peak force do not vary significantly, the strength parameters ( η ) remain almost constant for the three seismic zones. The seismic vulnerability index ( ζ E ) decreases by about 55% when u F is set to 0.25% instead of 1.00%; such an aspect can lead to drastically different choices about the retrofit strategy to be implemented.
To provide some preliminary considerations on the seismic risk mitigation strategies to be implemented in the three different cases ( u F = 0.25 % ,   0.50 % ,   a n d   1.00 % ), design targets were defined.
Assuming a constant inter-story drift of the retrofitted building, the drift design target of the whole building is set to match the ultimate drift of the individual masonry pier (Section 3) to prevent or limit damage to hollow brick masonry piers. For each case, the design targets are given as δ d ; more precisely, δ d = 0.25 % ,   0.50 % ,   a n d   1.00 % were set for the three different cases of u F = 0.25 % ,   0.50 % ,   a n d   1.00 % , respectively. The drift of the SDOF system was considered and equated to the drift of the MDOF system.
The simplified design spectra proposed by Labò et al. [16] were adopted to derive the retrofit elastic stiffness required to meet the design targets. Design spectra are simplified tools for the preliminary design of retrofit solutions; their derivation is based on the hypothesis that the existing building and the retrofit solution (e.g., exoskeleton) can be described through the equations of motion of a 2 DOF system that consists of 2 masses (existing building and retrofit) connected by springs (elastic stiffness of the existing building, retrofit, and their mutual connection), and subjected to an external acceleration. By solving the equations of motion for given existing building parameters, the spectra correlate the retrofit stiffness to the maximum displacement that would be experienced by the existing building after the retrofit.
Defining the strength parameter η = F y , 1 * [ m 1 * S a T 1 * ] as the ratio between the yielding strength of the existing building ( F y , 1 * ) and the mass ( m 1 * ) multiplied by the ground acceleration relative to the elastic period S a T 1 * , design spectra plot the ductility demand ( μ ) to the retrofitted system as a function of the stiffness ratio ( λ ) for a given value of the existing building period ( T 1 * ) and a specific value of the strength parameter ( η ) in the as-built condition. The ductility demand μ = d M A X d y , 1 is the ratio between the maximum displacement ( d M A X ) experienced by the retrofitted building during a seismic event and the yielding displacement of the existing building ( d y , 1 * = F y , 1 * k 1 * ), and the stiffness ratio λ is the ratio between the elastic stiffness of the retrofit ( k 2 * ) and the stiffness of the existing building ( k 1 * ).
Once the existing building parameters are defined ( m 1 * , T 1 * , k 1 * , η ), by setting the target ductility demand μ of the SDOF system of the reference building (e.g., as a function of the design drift μ = δ d / δ y , 1 * ), the stiffness ratio ( λ ) can be obtained and the stiffness of the retrofit can be derived (Figure 9). δ y , 1 * is the drift which corresponds to the yielding displacement of the existing building.
Considering that the design spectra are plotted in terms of the strength parameter ( η ), and that, as shown in the previous section, the strength parameters ( η ) remain almost constant among the three seismic sites for a given ultimate drift u F , the average values of η obtained for the three seismic zones (namely, 0.16, 0.28, and 0.50) were considered. The same approach was addressed for the elastic stiffness ( k 1 * ), which was set equal to 56.77 ( kN mm ). The design spectra are shown in Figure 9 [16].
For a given drift target ( δ d ), the higher the seismic demand (or lower the capacity of the existing building) and the higher the stiffness of the retrofit—which in turn implies that the higher the strength parameter η —the lower the stiffness ratio ( λ ) , and thus, the lower the required stiffness of the retrofit (Figure 9).
For a selected strength parameter ( η ), λ increases significantly (more than linearly in Figure 9) when the drift target ( δ d ) is reduced. This is expected considering a more demanding design target results in a much stiffer retrofit solution. In medium and high seismicity areas ( η = 0.28   and   0.16 , respectively), the retrofit stiffness ratio increases from 0.09 to 1.97 (+2200%) and from 0.56 to 3.80 (+678%), respectively, when the drift design target is reduced from 1.00% to 0.25%. For the low seismicity area ( η = 0.50 ), the retrofit is not required as long as a design drift equal to 1.00% is considered; while stiffness ratios of 0.02 and 0.49 are necessary when δ d is set equal to 0.50% and 0.25%, respectively.
The results show that the modeling choices for characterizing the in-plane flexural behavior can significantly affect both the structural assessment of the existing buildings and the envisioned seismic risk mitigation strategies.
In the vulnerability assessment, the selection of the ultimate in-plane flexural drift was shown to affect:
(1)
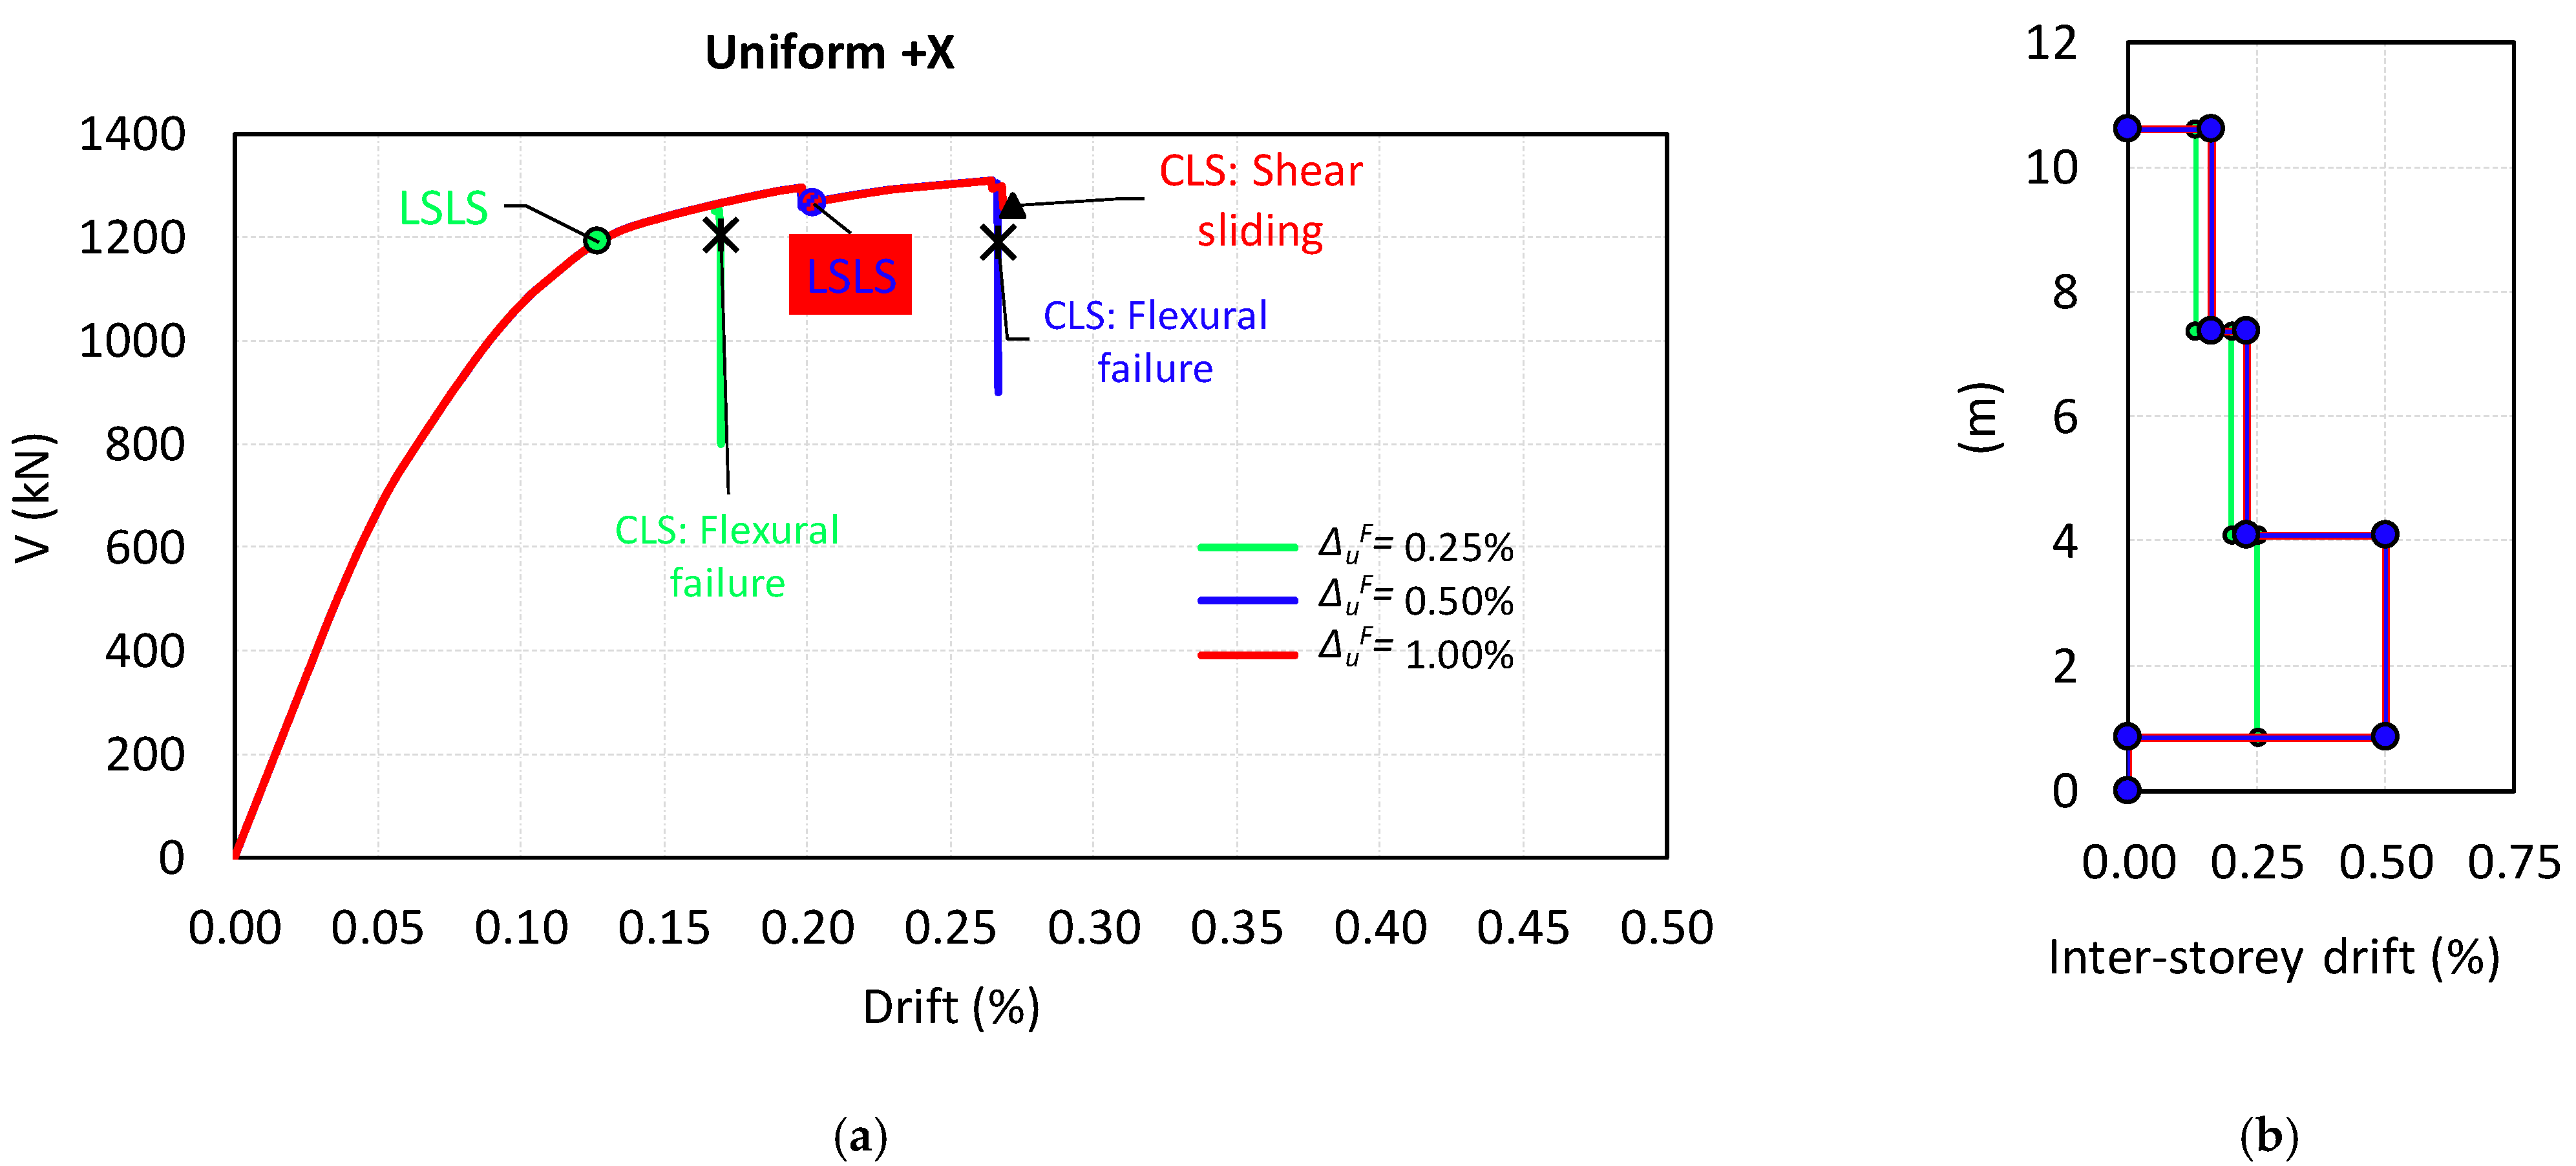
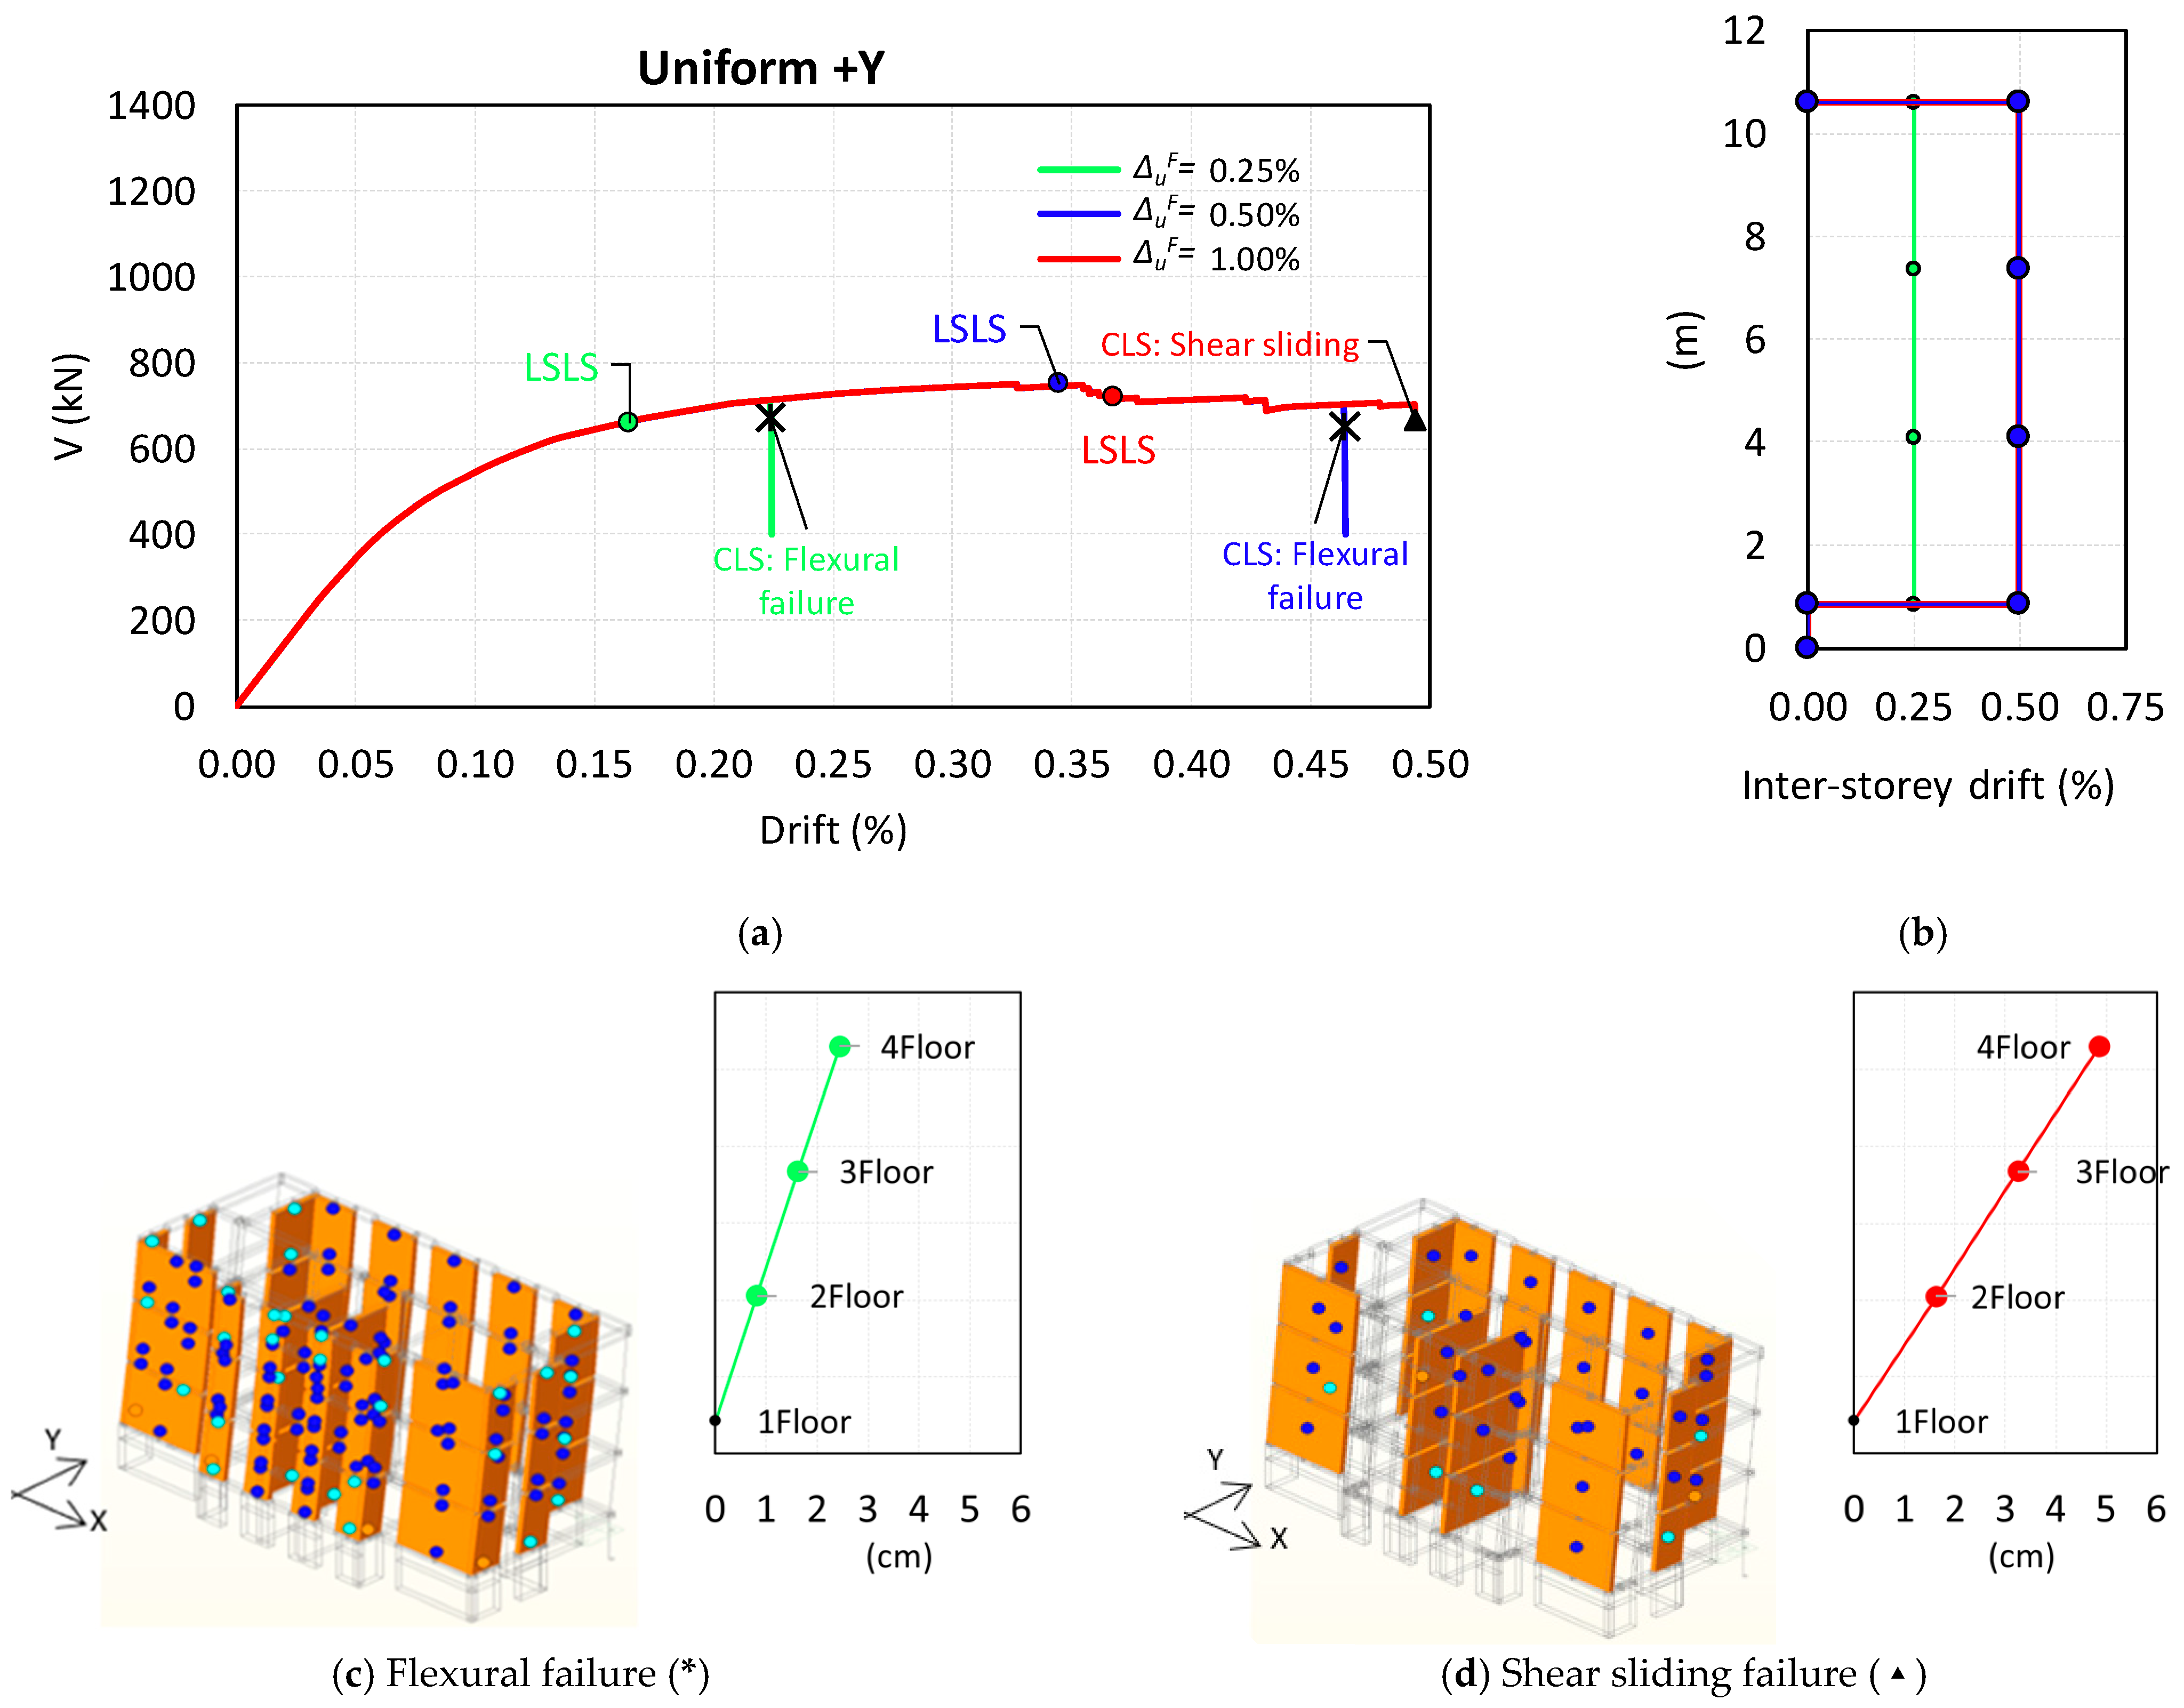
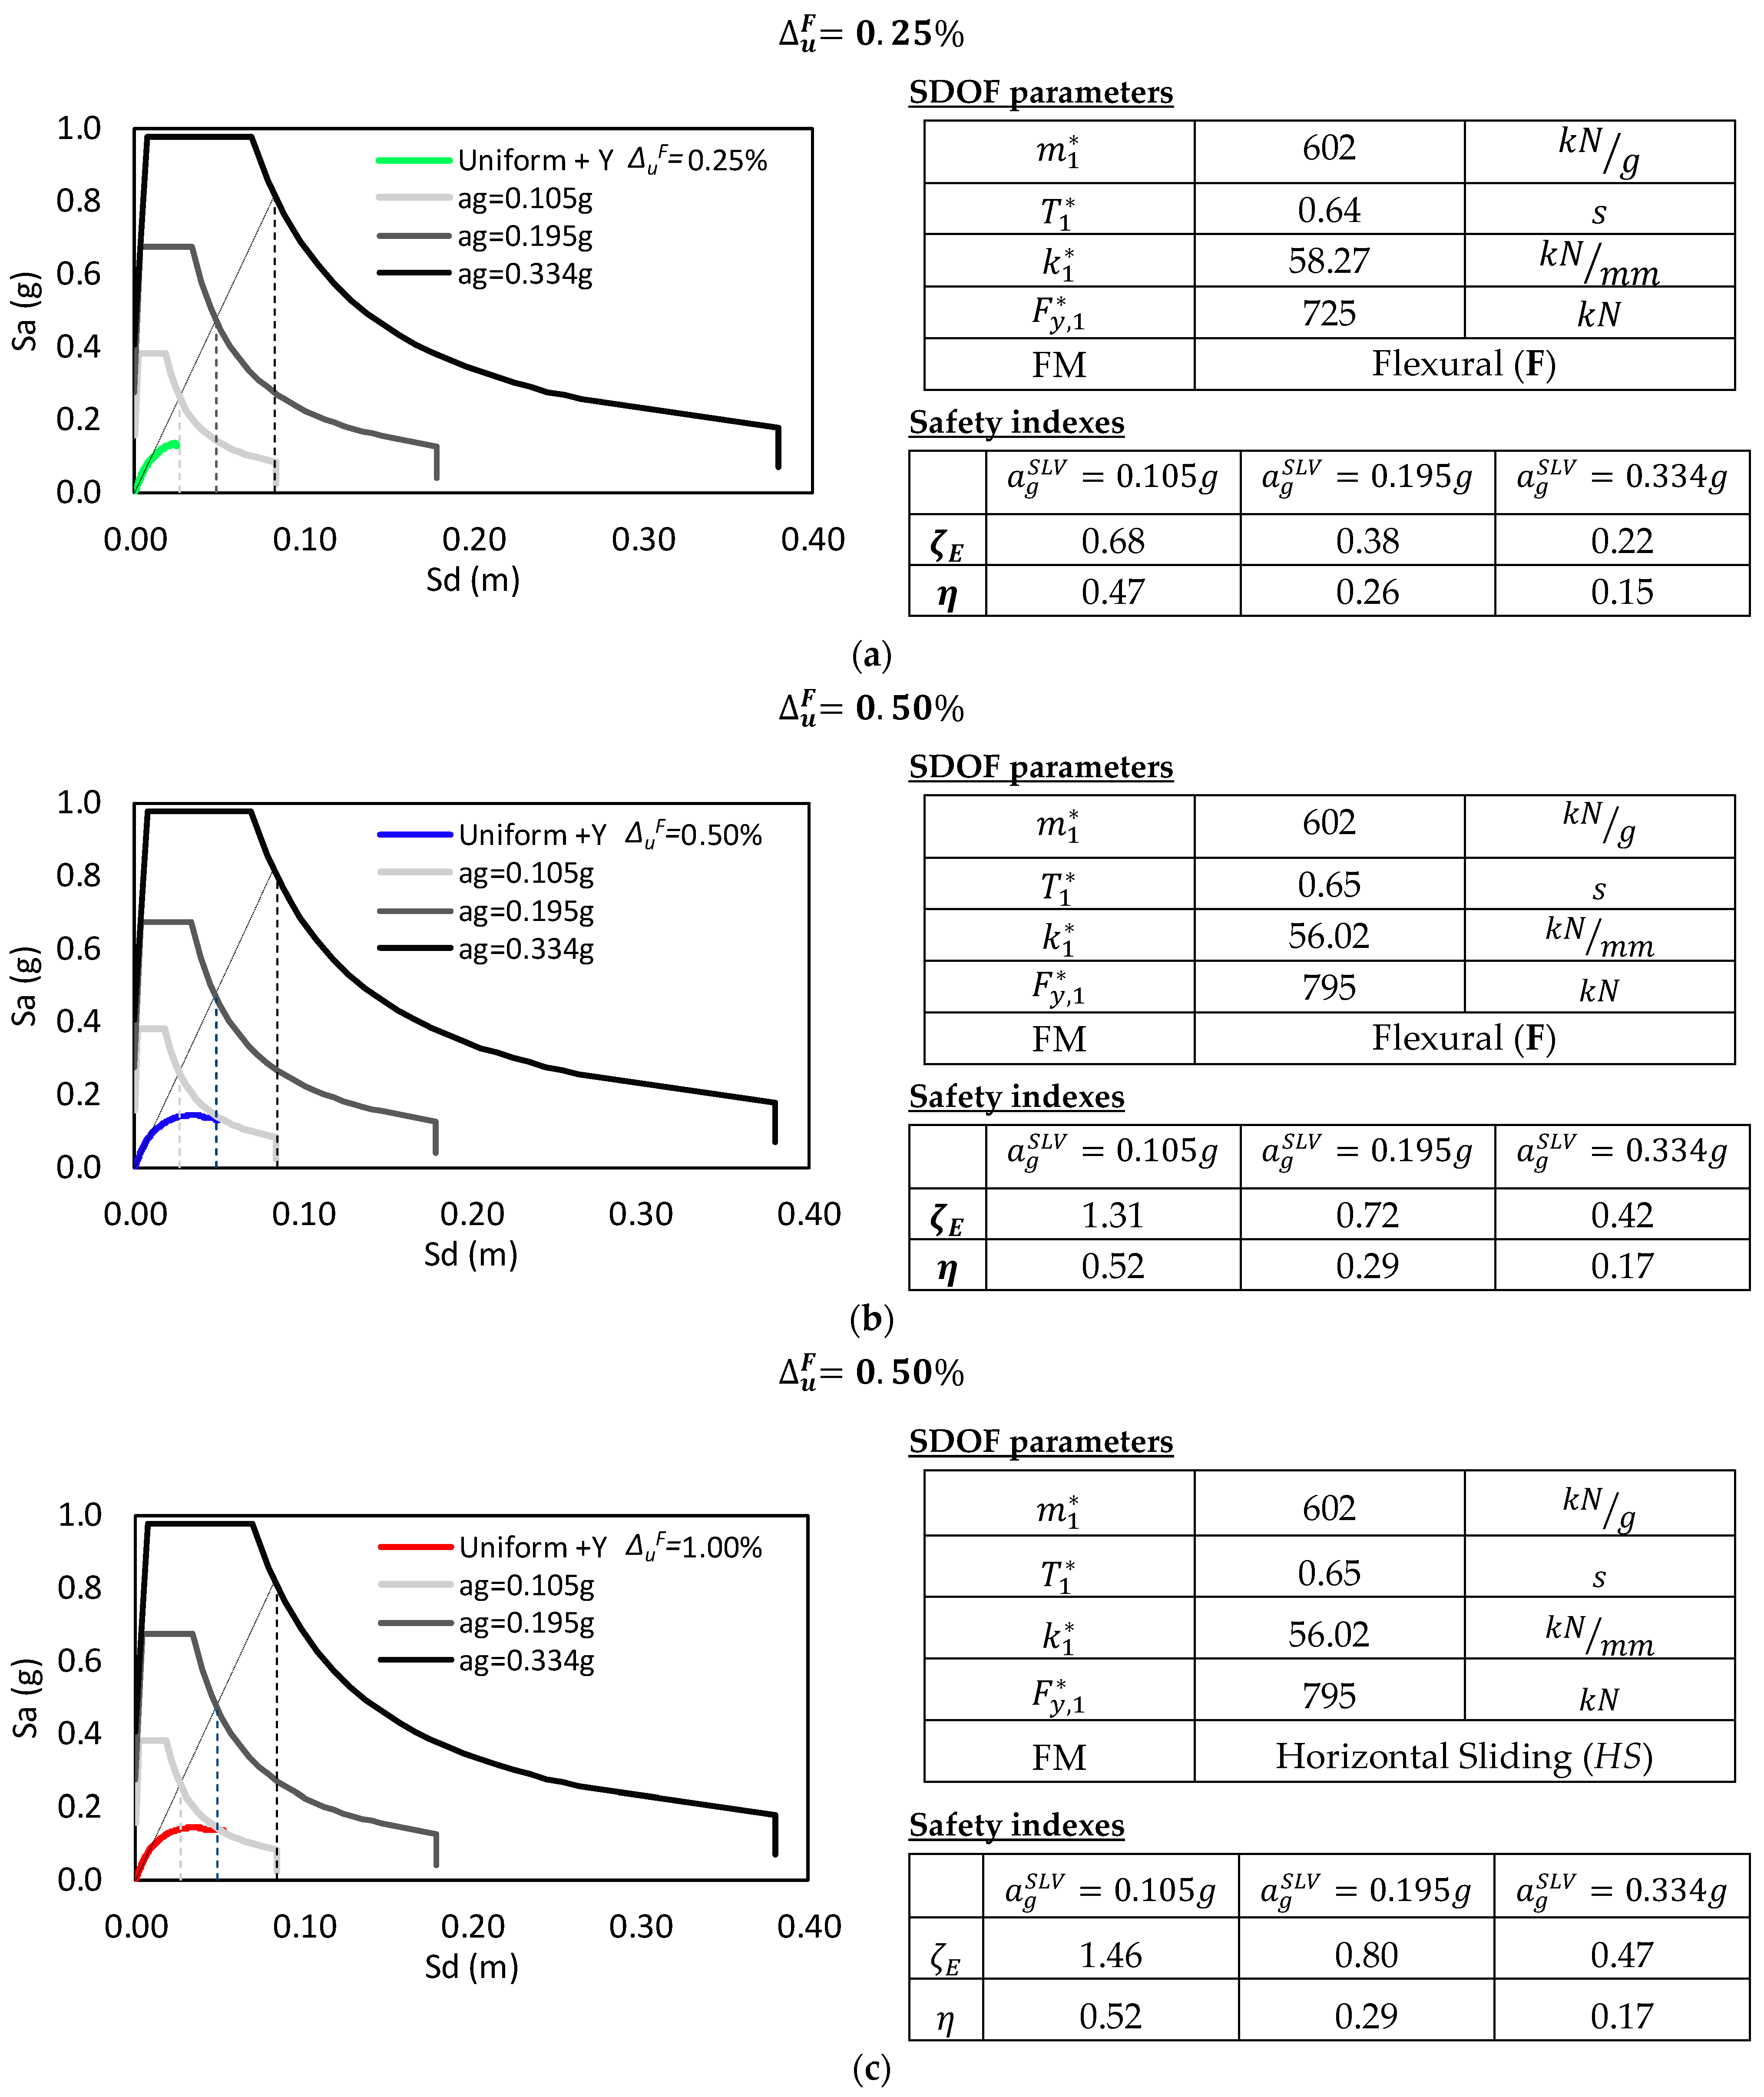
The ultimate drift of the entire building. For u F reducing from 1.00% ([10]) to 0.25%, the global drift reduces from 0.27% to 0.17% and from 0.49% to 0.22%, for the x- and y-directions, respectively.
(2)
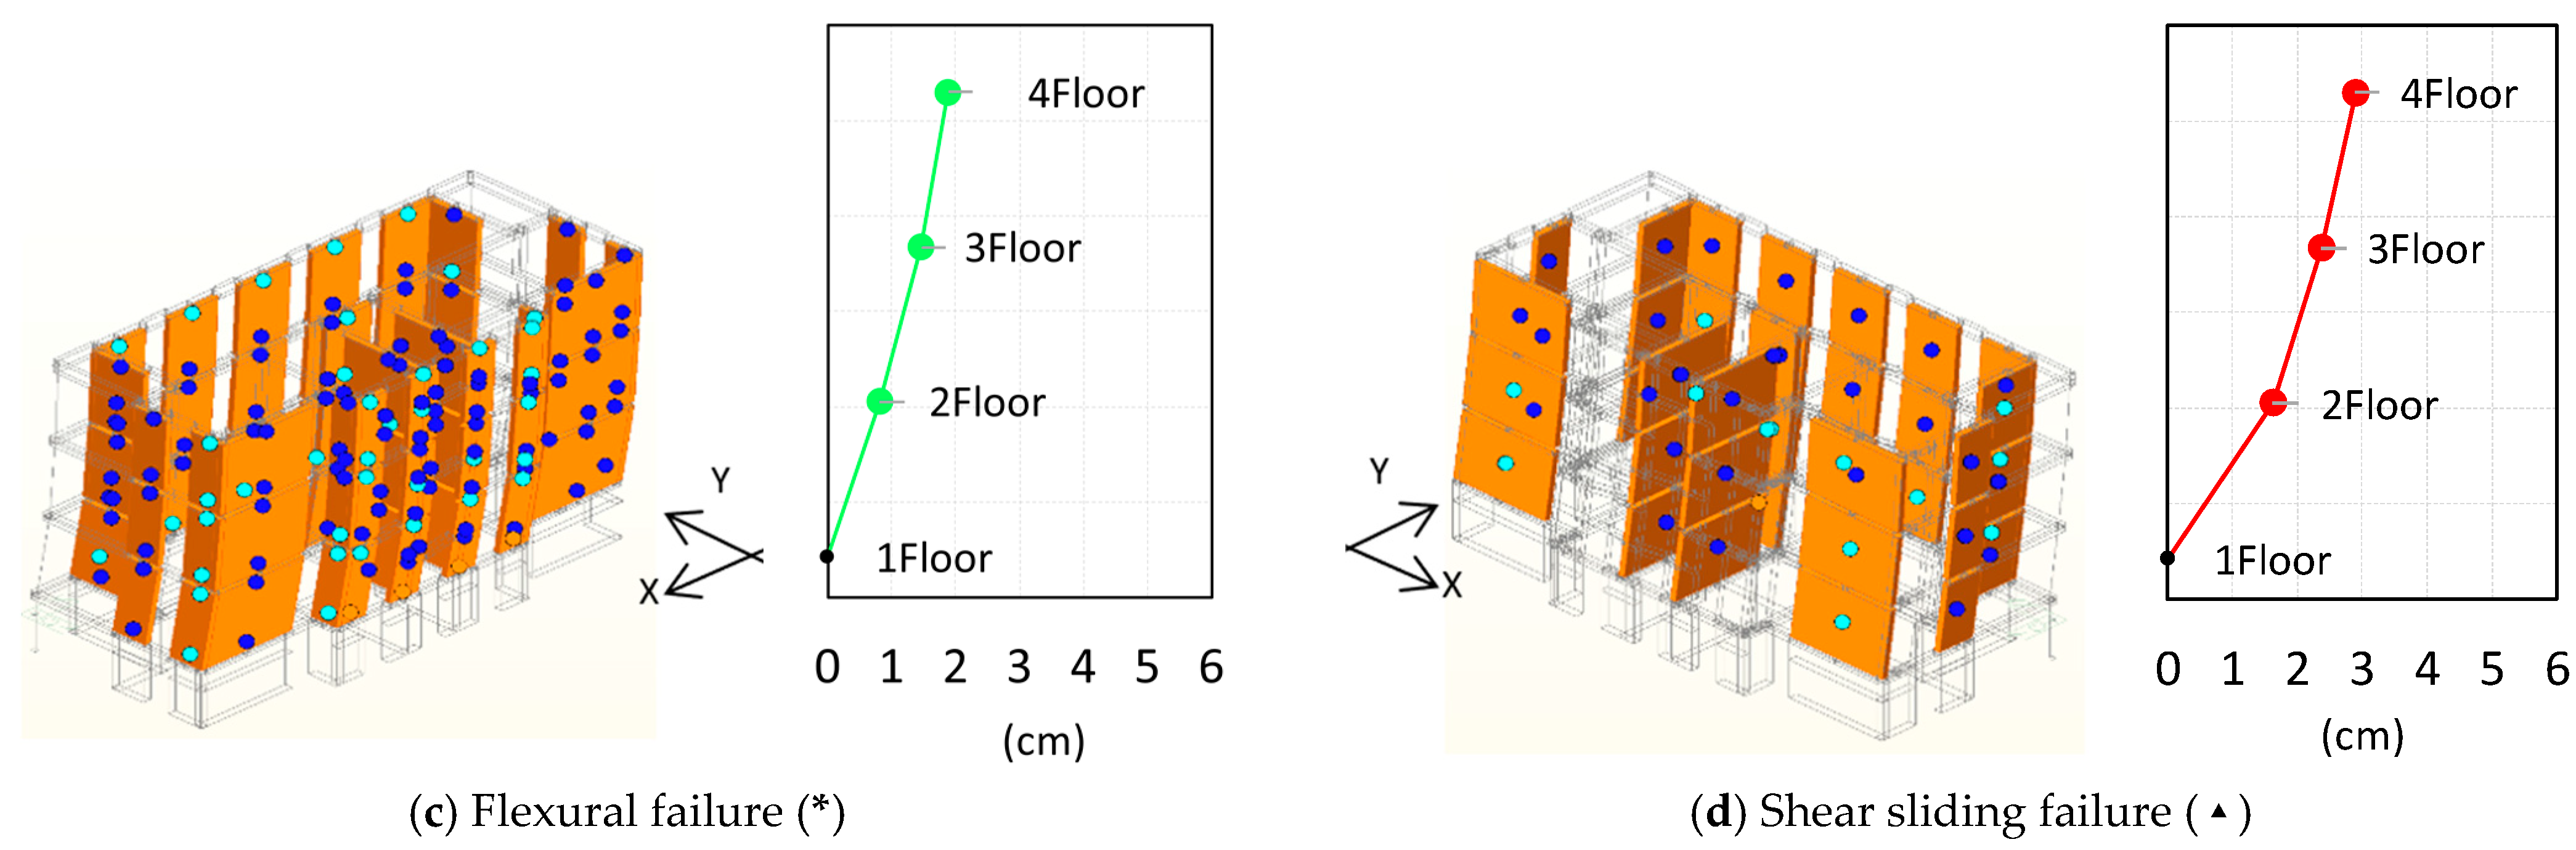
The failure mechanism. By assuming that the ultimate flexural drift is either 0.25% or 0.50%, the collapse mechanism of the building is associated with the flexural failure of the slender piers, while by assuming that u F is equal to 1.00%, the sliding shear failure of the staircase squat wall occurs. Moreover, it is worth noting that since the aim of the paper was to evaluate the effects of the in-plane flexural behavior modeling choices, a conventional value of 0.4 was considered for the friction coefficient, although the experimental tests showed much higher values (0.70–0.96 in [4] and [3], respectively). The use of such higher values could further shift the failure mode towards brittle flexural failure, in place of sliding failure. Considering that this construction typology does not even resist the vertical loads when the ultimate flexural capacity is reached, the wall-associated failure mechanism is crucial to assess the vulnerability of the building. An incorrect evaluation of the failure mechanisms can lead to quite different considerations on the assessment which could result in disregarding the need to assess stability against the vertical loads.
As for the retrofitting strategies, it has been shown that careful selection of the ultimate drift is fundamental to designing an effective seismic retrofit solution. This is important not only for high seismicity areas, where the retrofit stiffness increases by up to 22 times when the design target is reduced from 1.00 to 0.25, but also for medium and low seismicity areas. For the latter, it was found that an overestimation of the ultimate in-plane flexural drift may even result in no need for a retrofit strategy for the analyzed building (i.e., λ equal to 0.02 and 0.09 when δ d = 1.00 ). In general, the inability of this building typology to further withstand vertical loads once the drift capacity is reached may lead to considering quite demanding ultimate in-plane flexural drift of 0.25% and designing a much stiffer retrofit solution to protect the existing walls.

5. Contributions

Although clay hollow bricks with horizontal holes and cement-based mortars found extensive use in constructing small- to medium-rise buildings (up to three floors) from the 1950s to the late 1960s, there has been limited research conducted to date on the structural performance of this construction typology.
Recent research works and experimental tests have shown that, unlike ordinary masonry walls, this construction typology exhibits very low ductility in the case of in-plane flexural mechanism. Very little displacement capacity was observed when slender piers were tested under horizontal loads and once the in-plane flexural capacity was reached, a sudden failure occurred because of the brittle crushing of the pier’s base, where compressive stresses were concentrated. The extension of the crushed zone was so relevant that the inability of the wall to further sustain the vertical loads was also observed.
The paper investigated the impact of the reduced ultimate in-plane flexural ductility of masonry piers on the local and global behavior of the building. The influence of reduced ultimate ductility was discussed also through the application to a reference post-World War II masonry building featuring bricks with horizontal holes.
Analyses were performed by considering different flexural ultimate drifts derived from the literature and those defined by the code prescriptions for ordinary masonry walls (assumed as the reference value in the absence of peculiar specifications). Ultimate drifts for the in-plane flexural response ranging between 0.25% and 1.00% were adopted.
The results highlight how overestimated assumptions on ductility lead to dramatically misleading predictions of seismic vulnerability of both single walls and the entire building and an ineffective design of the retrofit solution.
As for the assessment of an existing structure, a wrong representation of the in-plane flexural behavior may lead to the following:
-
An overestimation of the overall displacement capacity of the building. By reducing the ultimate drift from 1.00% (ordinary masonry walls [10]) to 0.25% (observed in an experimental campaign on slender walls with horizontal holes [4]), the global drift capacity reduces by 37% and 55% in x- and y-directions, respectively.
-
A wrong assessment of the failure mechanisms of the piers. The use of a reduced ultimate in-plane flexural ductility shifts the failure mode towards brittle flexural failure, in place of sliding failure. Such an aspect becomes crucial since slender walls with horizontal holes can no longer withstand vertical loads once their ultimate in-plane flexural capacity is reached.
As for the design of the retrofit solution, an accurate estimation of the ultimate drift capacity of the in-plane flexural behavior is fundamental in the following:
-
Defining the design targets (e.g., to guarantee life safety and avoid excessive damage to structural and non-structural components). To avoid failure of slender walls with horizontal holes an ultimate drift target lower than 0.25% must be considered in place of 1.00% proposed by the current code for ordinary masonry walls [10].
-
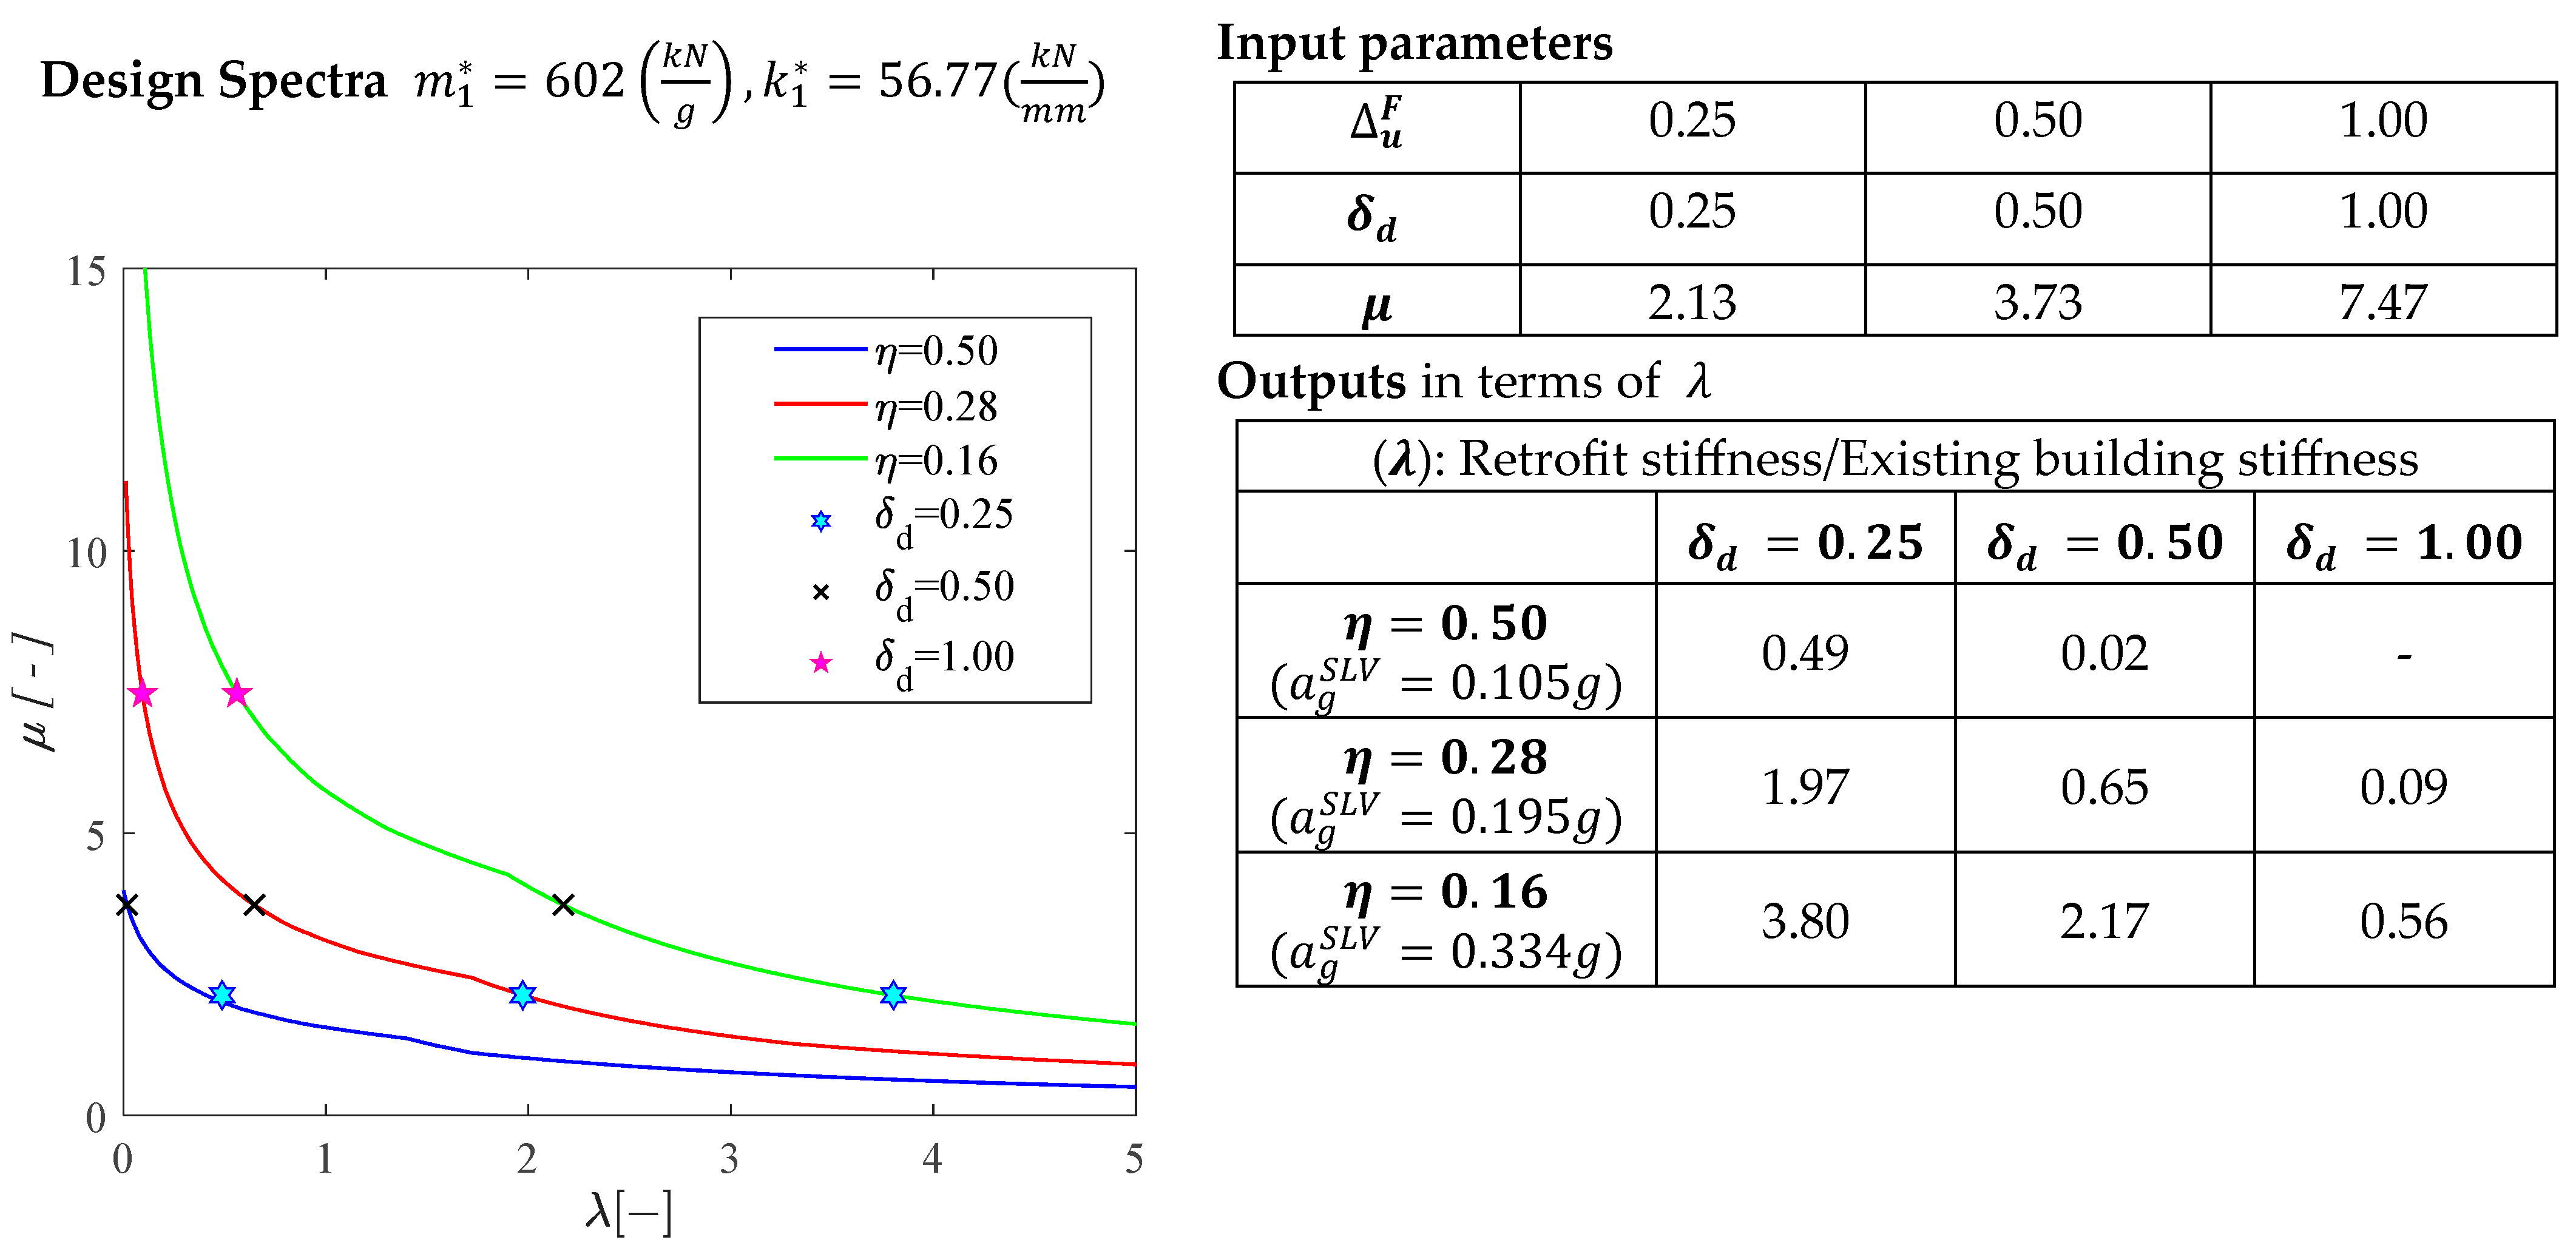
Estimating the minimum stiffness of the retrofit solution, as well as the possible need to retrofit the structure for vertical loads. From the application, it became clear that considering a reduced in-plane flexural ductility (a) in high seismicity areas, the stiffness required to meet the target increased considerably, while (b) in medium-low seismicity areas, the need emerged to introduce a retrofit unlike what was observed considering an ultimate drift compliant with the current codes for ordinary walls.
From the critical discussion, the need emerges to accurately model the in-plane flexural behavior as well as the need for further research with a view to updating the code provisions to explicitly consider piers with hollow clay bricks with horizontal holes.

Author Contributions

Conceptualization, S.L. and A.M.; Methodology, S.L. and A.M.; Software, S.C.; Investigation, S.C.; Writing—original draft, S.L. and S.C.; Writing—review & editing, A.M.; Supervision, A.M. All authors have read and agreed to the published version of the manuscript.

Funding

This research received no external funding.

Data Availability Statement

Not applicable.

Acknowledgments

Authors may greatly acknowledge the financial support of the University of Bergamo through the “STARS” research grant program and ReLuis which partially founded this work.

Conflicts of Interest

The authors declare no conflict of interest.

References

  1. Canal, N. Resistenza Meccanica di Blocchi Forati a Fori Orizzontali; Consorzio Poroton Italia: Verona, Italy, 2006. [Google Scholar]
  2. Riva, P.; Betelli, E.; Belotti, N. Analisi della Vulnerabilità Sismica di Edifici in Muratura anni’60. Utilizzo di Foratoni Strutturali con Giunti Orizzontali. Prove Sperimentali e Confronto con le Normative Esistenti. Master’s Thesis, University of Bergamo, Bergamo, Italy, 2013. (In Italian). [Google Scholar]
  3. Messali, F.; Metelli, G.; Plizzari, G. Experimental results on the retrofitting of hollow brick masonry walls with reinforced high performance mortar coatings. Constr. Build. Mater. 2017, 141, 619–630. [Google Scholar] [CrossRef]
  4. Labò, S.; Marini, A. In-plane flexural behavior of hollow brick masonry walls with horizontal holes. Eng. Struct. 2022, 273, 115086. [Google Scholar] [CrossRef]
  5. Valluzzi, M.R.; da Porto, F.; Garbin, E.; Panizza, M. Out-of-plane behaviour of infill masonry panels. Mater. Struct. 2014, 47, 2131–2145. [Google Scholar] [CrossRef]
  6. Tomaževič, M. Some aspects of experimental testing of seismic behavior of masonry walls and models of masonry buildings. ISET J. Earthq. Technol. 2000, 37, 101–117. [Google Scholar]
  7. EN 1015-11; Methods of Test for Mortar for Masonry-Part 11: Determination of Flexural and Compressive Strength of Hardened Mortar. CEN: Brussels, Belgium, 1999.
  8. EN 1052-1; Methods of Test for Masonry-Part 1. Determination of Compressive Strength. CEN: Brussels, Belgium, 2001.
  9. EN 1052-3:2002; Methods of Test for Masonry-Part 3: Determination of Initial Shear Strength. CEN: Brussels, Belgium, 2002.
  10. NTC. Norme Tecniche per le Costruzioni (NTC 2018); Gazzetta Ufficiale del 20/02/2018, Supplemento Ordinario n.42; NTC: Rome, Italy, 2018. [Google Scholar]
  11. Giuriani, E.; Regazzi, A.; Luterotti, M. Prove Sperimentali Sulla Capacità di Deformazione di una Muratura Sollecitata a Taglio con Fessurazione Diagonale. Master’s Thesis, Dipartimento di Ingegneria Civile, Architettura, Territorio, Ambiente e Matematica—Università degli Studi di Brescia, Brescia, Italy, 2014. (In Italian). [Google Scholar]
  12. MidasGEN. Analysis Manual for Midas GEN. 2020. Available online: www.MidasUser.com (accessed on 5 September 2023).
  13. EC8; Eurocode 8: Design of Structures for Earthquake Resistance. European Committee for Standardization: Brussels, Belgium, 2005.
  14. Marini, A.; Belleri, A.; Passoni, C.; Feroldi, F.; Giuriani, E. In-plane capacity of existing post-WWII beam-and-clay block floor systems. Bull. Earthq. Eng. 2022, 20, 1655–1683. [Google Scholar] [CrossRef]
  15. Passoni, C.; Guo, J.; Christopoulos, C.; Marini, A.; Riva, P. Design of dissipative and elastic high-strength exoskeleton solutions for sustainable seismic upgrades of existing RC buildings. Eng. Struct. 2020, 221, 111057. [Google Scholar] [CrossRef]
  16. Labò, S.; Passoni, C.; Marini, A.; Belleri, A.; Riva, P. Design spectra for the preliminary design of elastic seismic retrofit solution from the outside. In Proceedings of the 7th ECCOMAS Thematic Conference on Computational Methods in Structural Dynamics and Earthquake Engineering—COMPDYN, Crete, Greece, 24–26 June 2019. [Google Scholar]
Figure 1. Sketch of the failure mechanisms of a masonry wall (adapted from [6]).
Buildings 13 02438 g001
Figure 2. Sketch of (a) the brick unit considered with a void ratio greater than 60%, (b) the uniaxial compressive actions, and (c) the triplet test.
Buildings 13 02438 g002
Figure 3. (a) Sketch of a possible building façade; (b) skeleton curves of pier 1 (blue), pier 2 (green), and pier 3 (red), [4,10]; (c) capacity curves of the wall considering only piers 1, 2, and 3 in case of ordinary wall (blue) and hollow clay bricks with horizontal holes (green); (d) sketch of a torsionally weak building. G and S are the gravity and shear center, respectively; e is the in-plane eccentricity, and de is the increase in terms of displacement due to the torsional effects.
Buildings 13 02438 g003
Figure 4. (a) Plan of a reference floor. Dimensions are given in cm; (b) pictures of the reference building; and (c) 3D views of the reference building.
Buildings 13 02438 g004
Figure 5. (a) Axial plastic hinge (compression only); (b) flexural plastic hinge; and (c) shear-sliding plastic hinge.
Buildings 13 02438 g005
Figure 6. (a) Capacity curves in the x-direction. The green, blue, and red lines are the capacity curves in the cases in which u F was considered as equal to 0.25%, 0.50%, 1.00%, respectively. The asterisk represents a flexural failure mechanism (c), while the triangle (▴) represents a sliding shear failure mechanism (d); (b) inter-story drift distribution along the building height at the failure step.
Buildings 13 02438 g006aBuildings 13 02438 g006b
Figure 7. (a) Capacity curves in the y-direction. The green, blue, and red lines are the capacity curves in the cases in which u F was considered as equal to 0.25%, 0.50%, 1.00%, respectively. The asterisk (*) represents a flexural failure mechanism (c), while the triangle (▴) represents a sliding shear failure mechanism (d); (b) inter-story drift distribution along the building height at the failure step.
Buildings 13 02438 g007
Figure 8. ADR Spectrum and main parameters for the three cases, (a) u F = 0.25 % , (b) u F = 0.50 % , and (c) u F = 1.00 % .
Buildings 13 02438 g008
Figure 9. Design spectra for the three different flexural ultimate capacities ( u F ) and for the three seismic sites (i.e., for three different values of the strength parameter η ) [16].
Buildings 13 02438 g009
Disclaimer/Publisher’s Note: The statements, opinions and data contained in all publications are solely those of the individual author(s) and contributor(s) and not of MDPI and/or the editor(s). MDPI and/or the editor(s) disclaim responsibility for any injury to people or property resulting from any ideas, methods, instructions or products referred to in the content.

