
Study on Group Movement Characteristics in Stairwell of High-Rise Buildings
 ,
,
Abstract
:1. Introduction
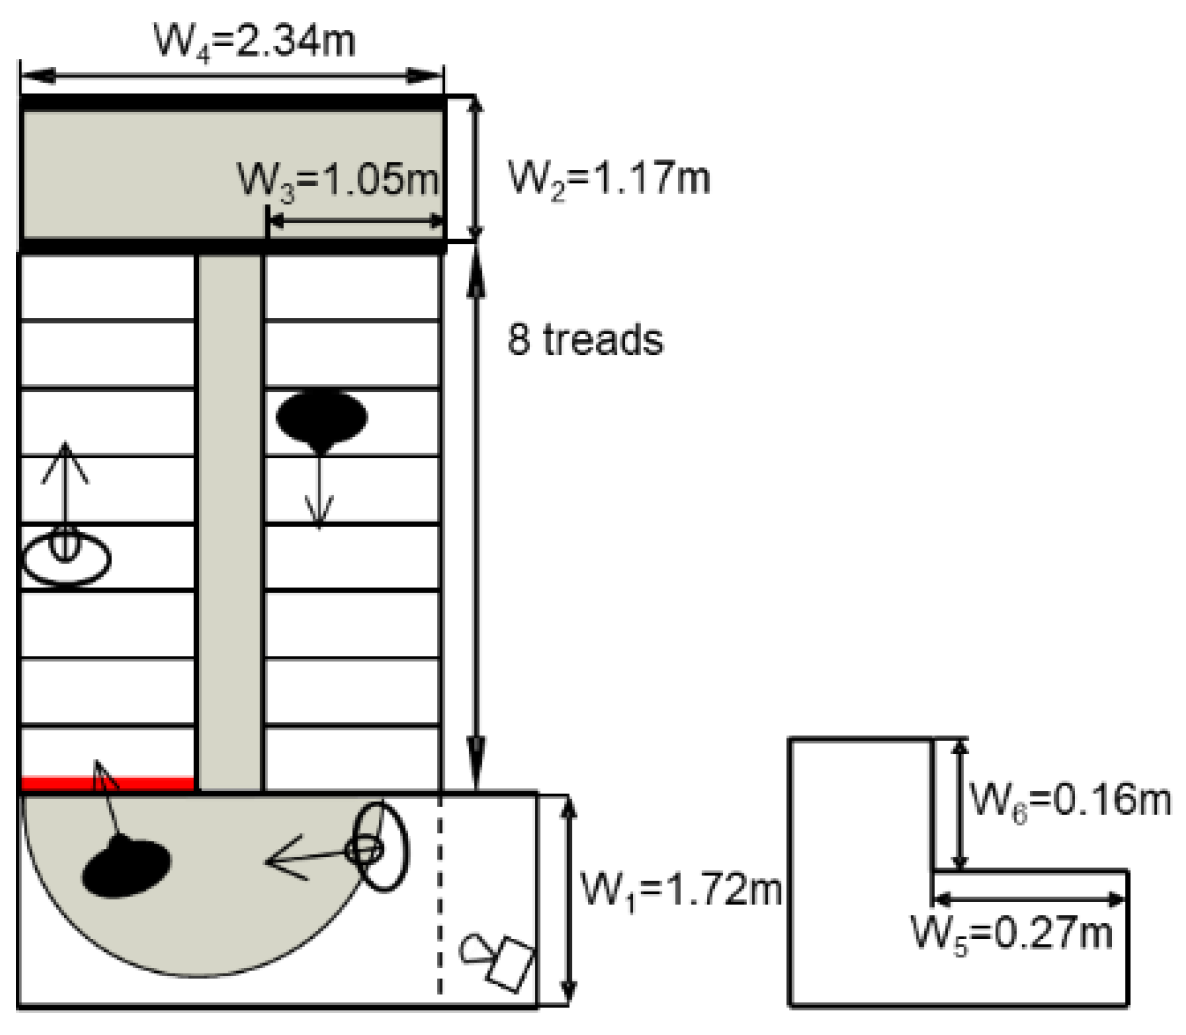
2. Experimental Setup
3. Results and Analysis
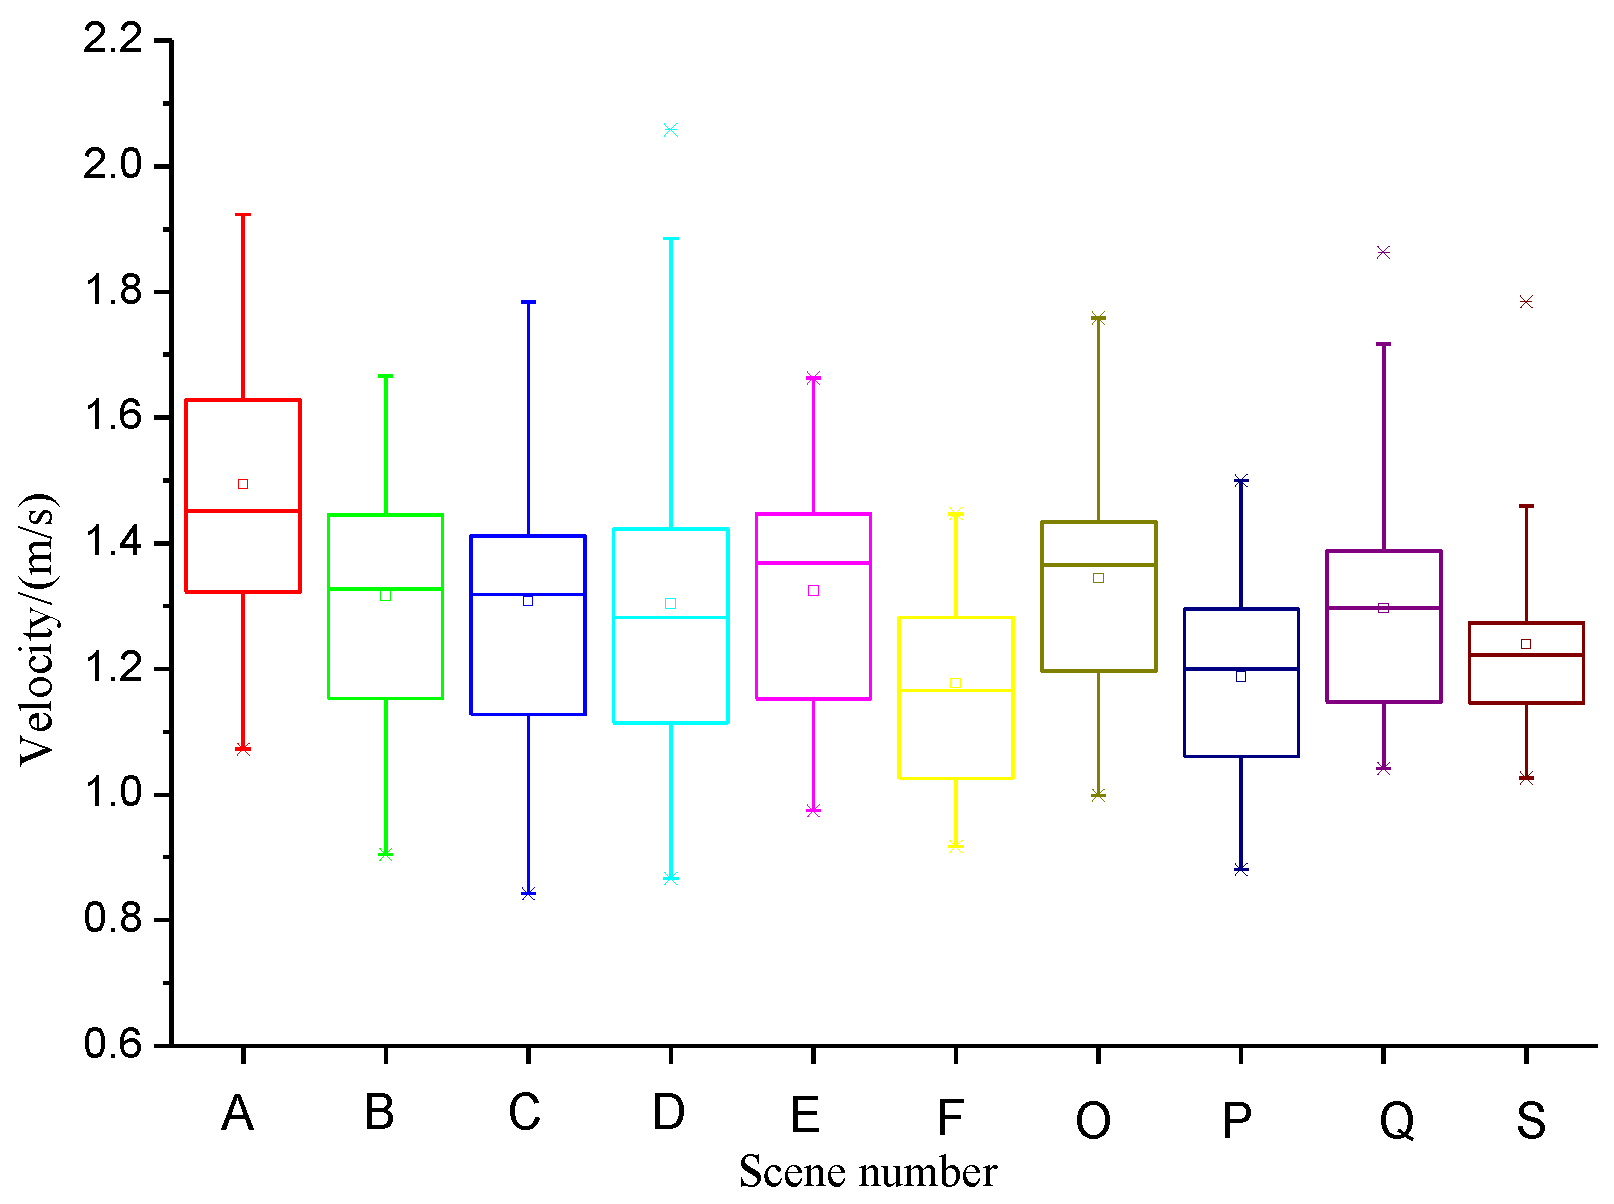
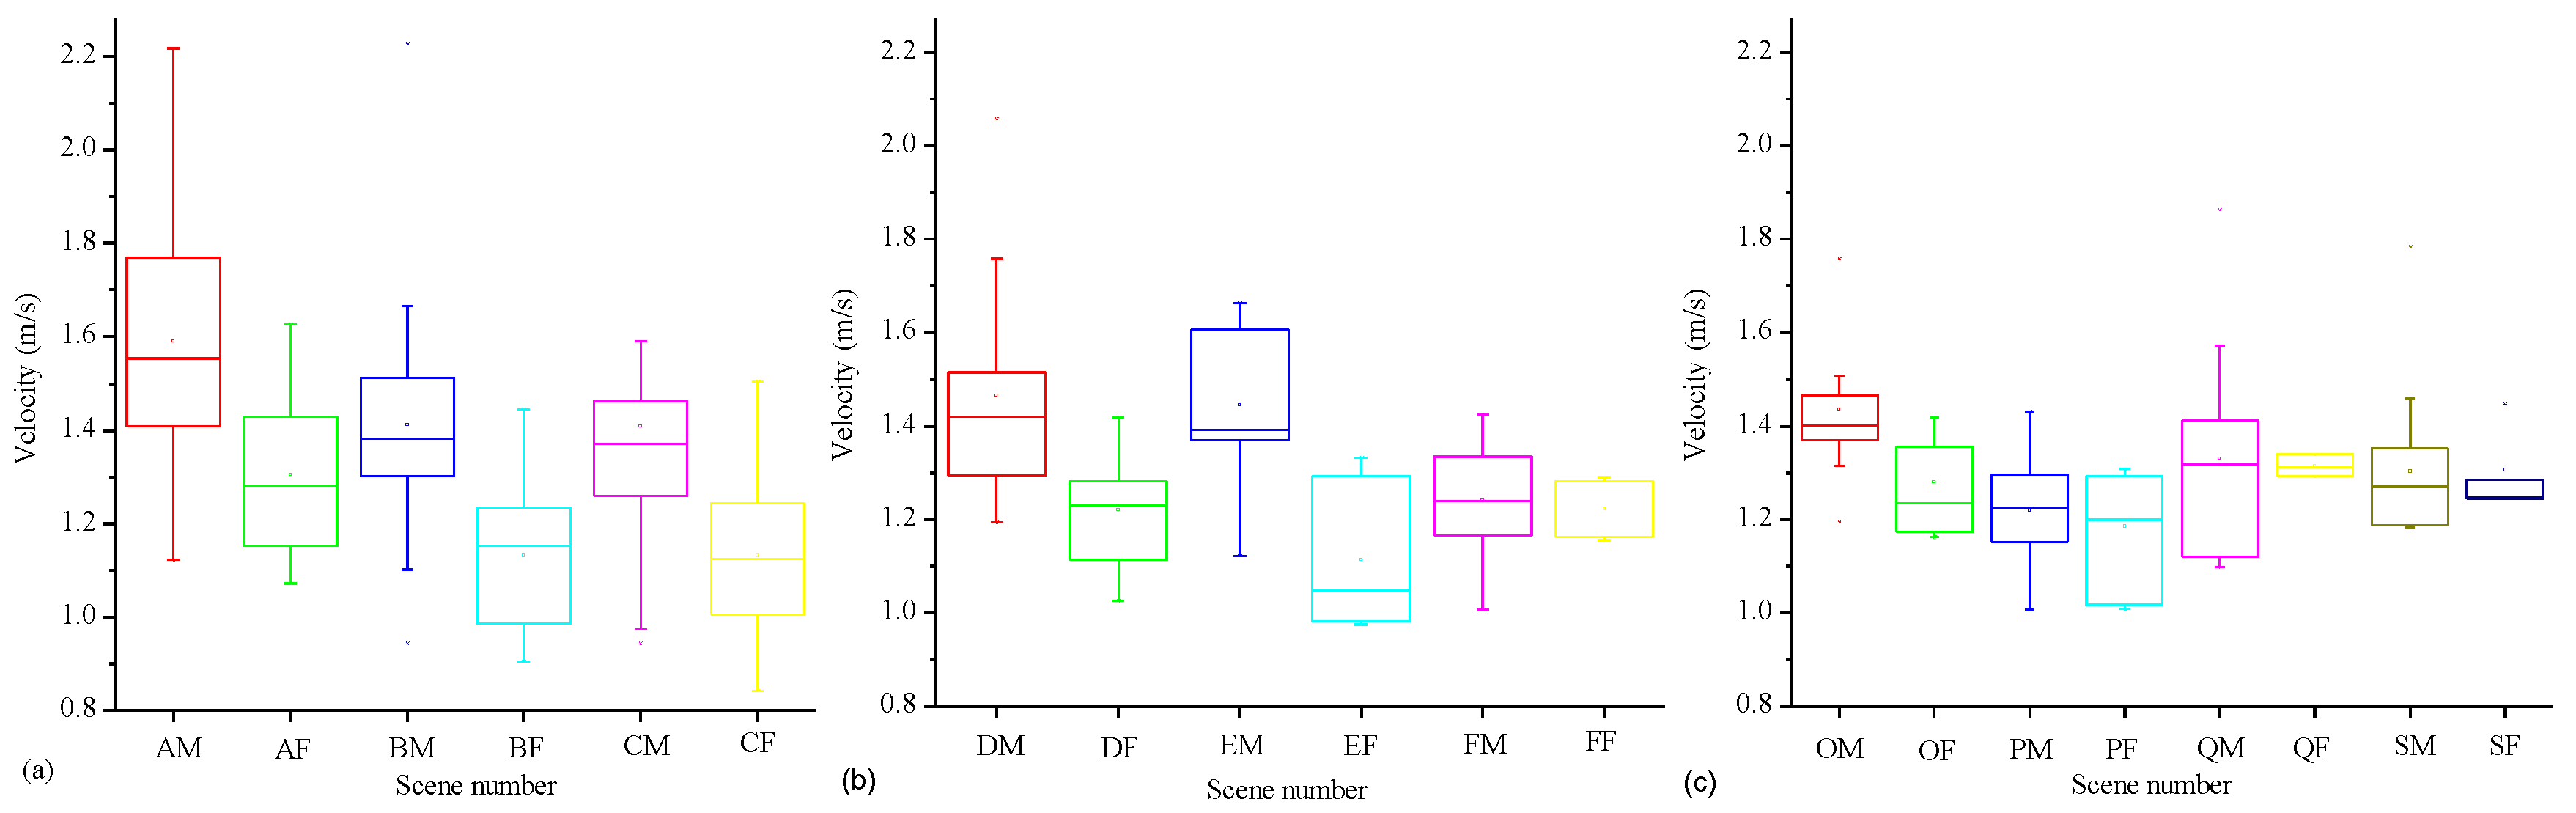
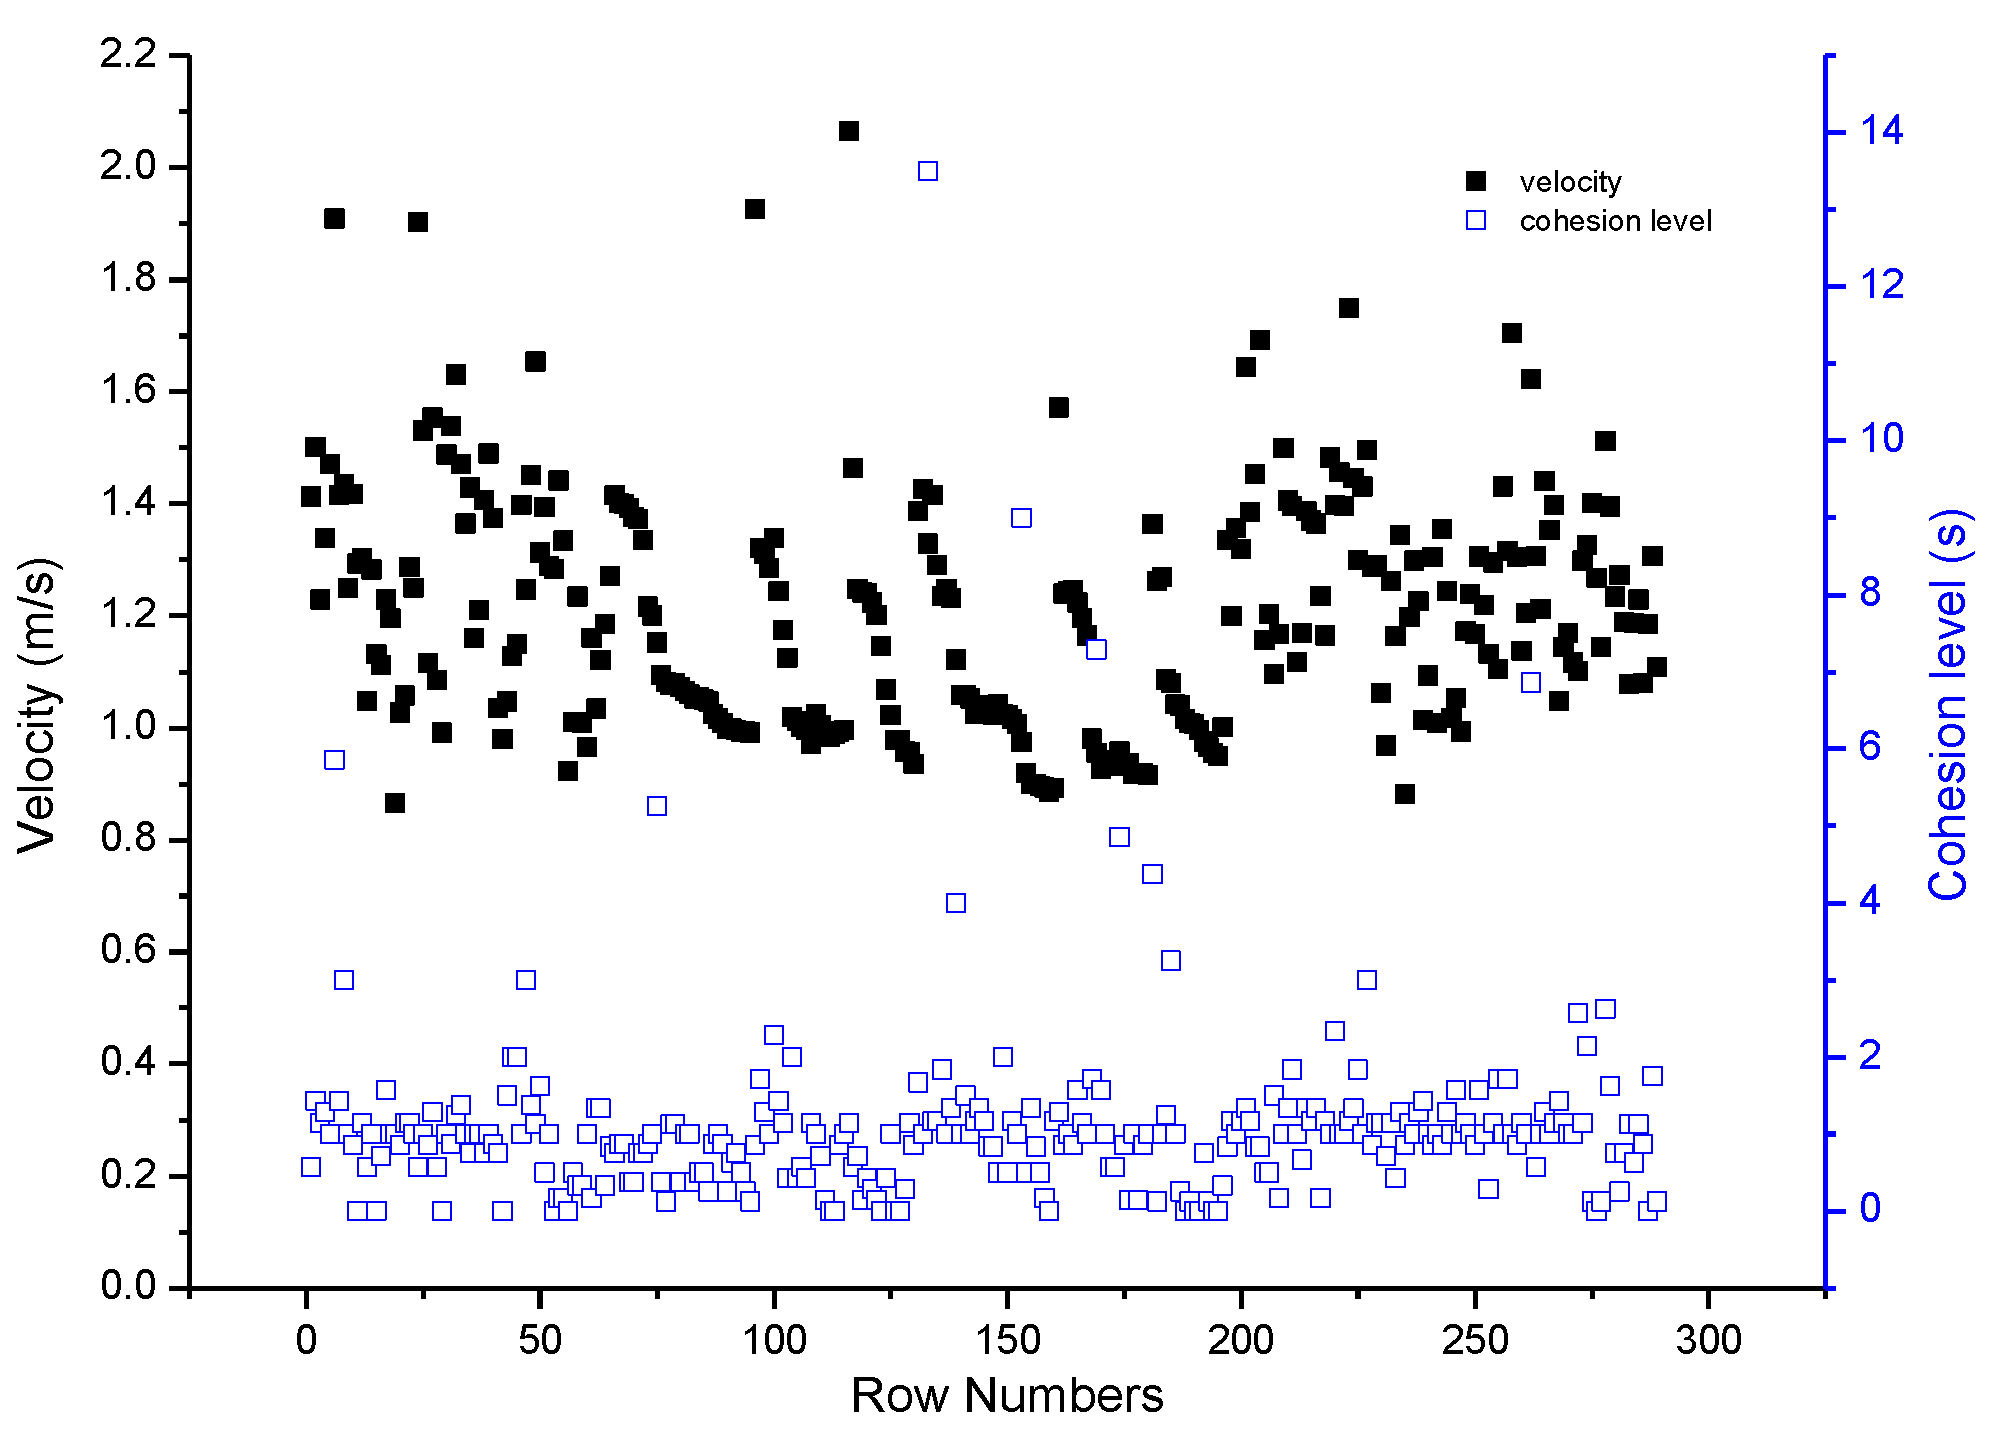
3.1. Group Velocity
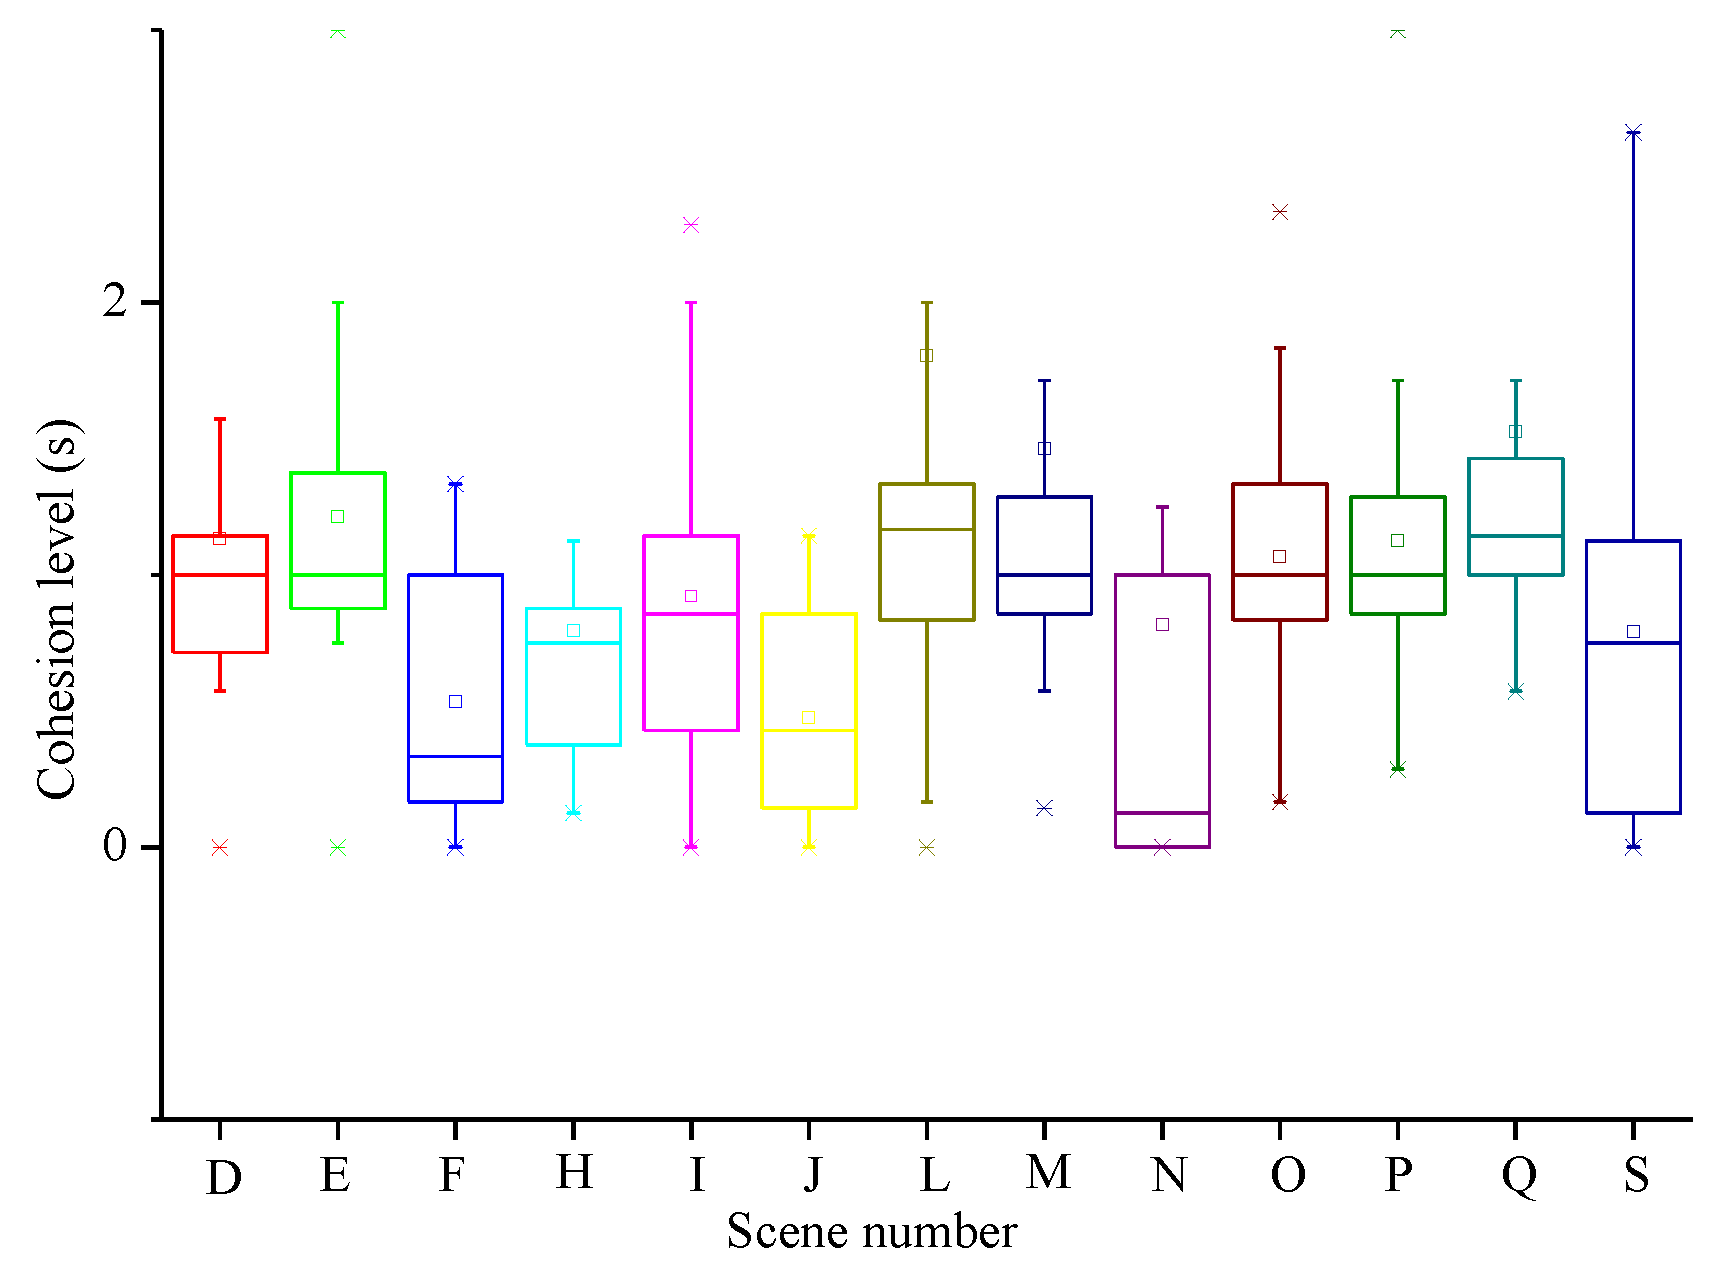
3.2. Group Cohesion
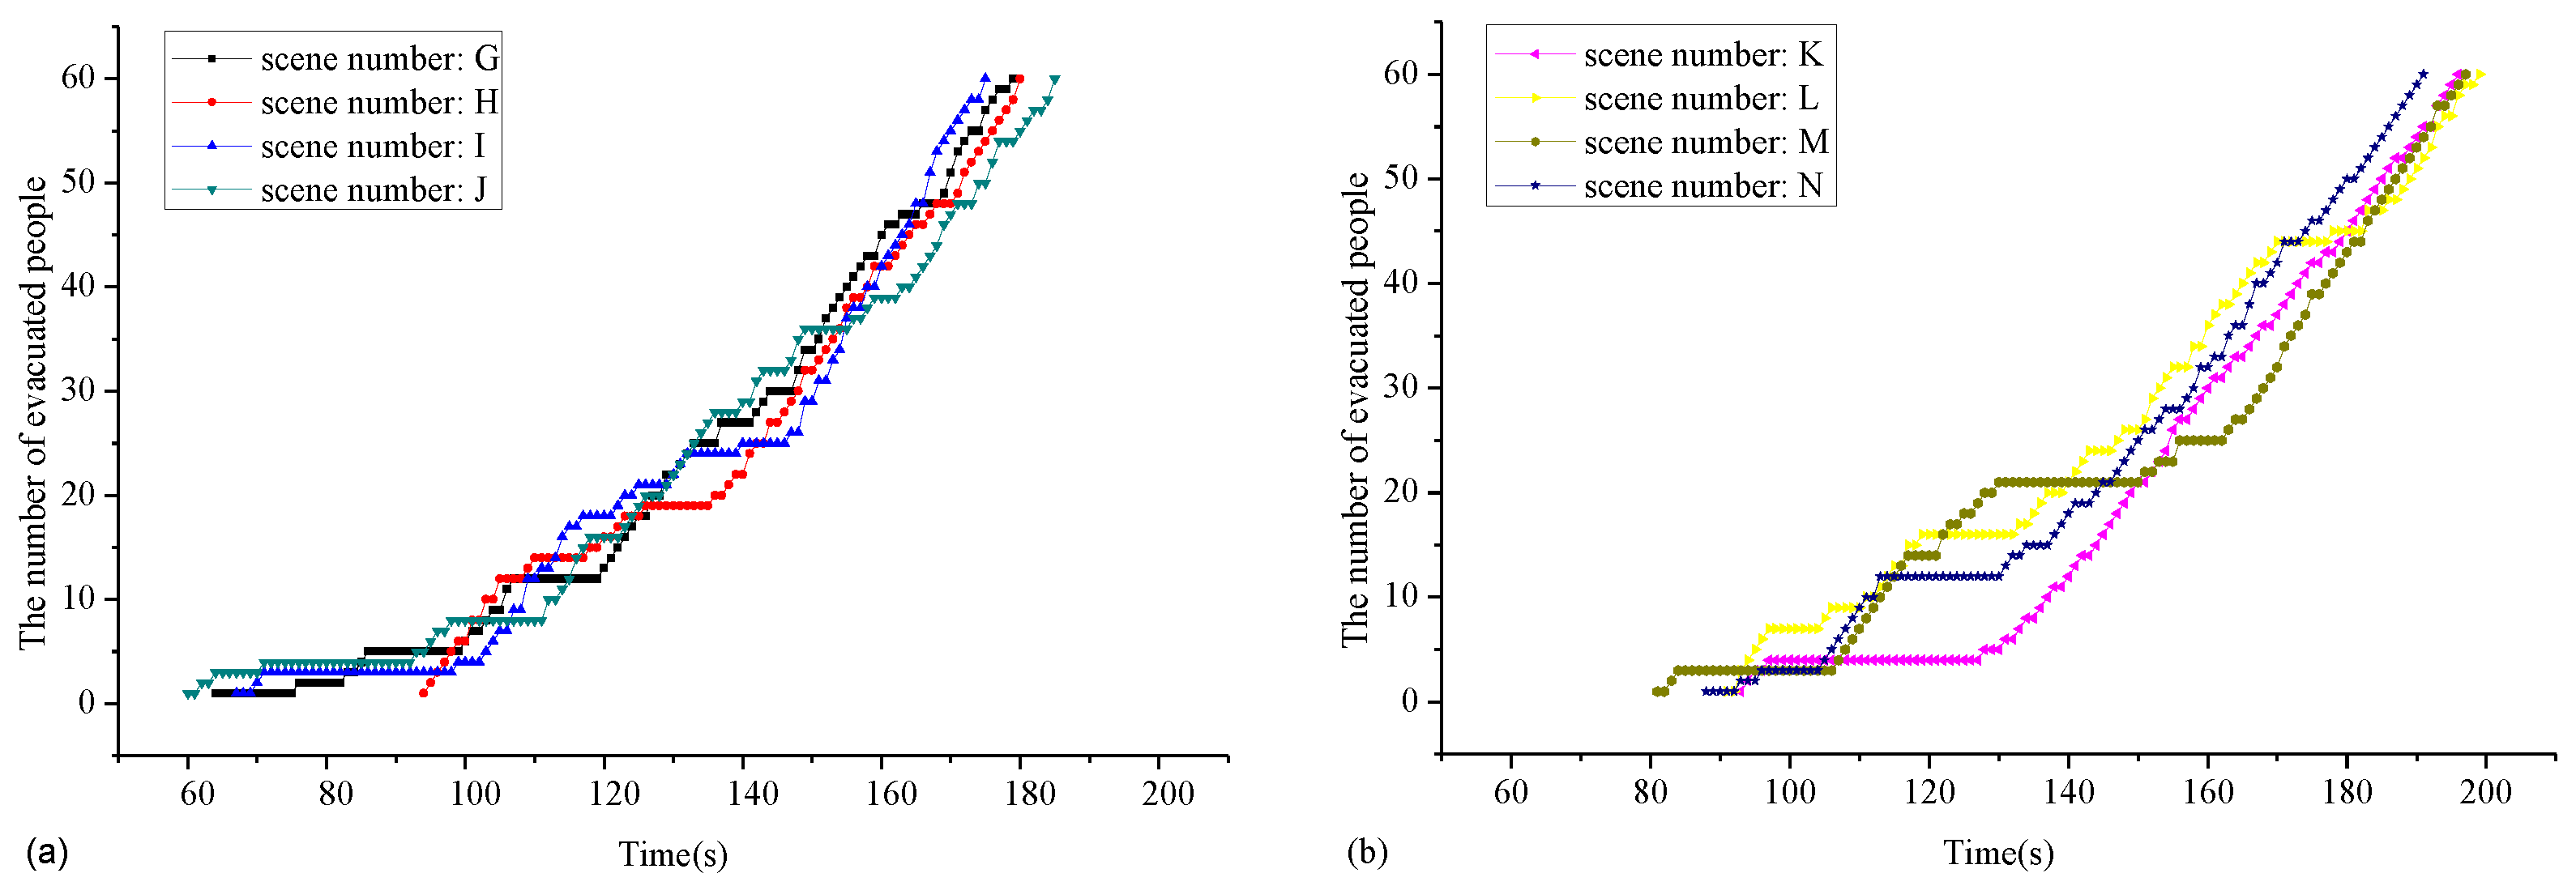
3.3. Evacuation Time
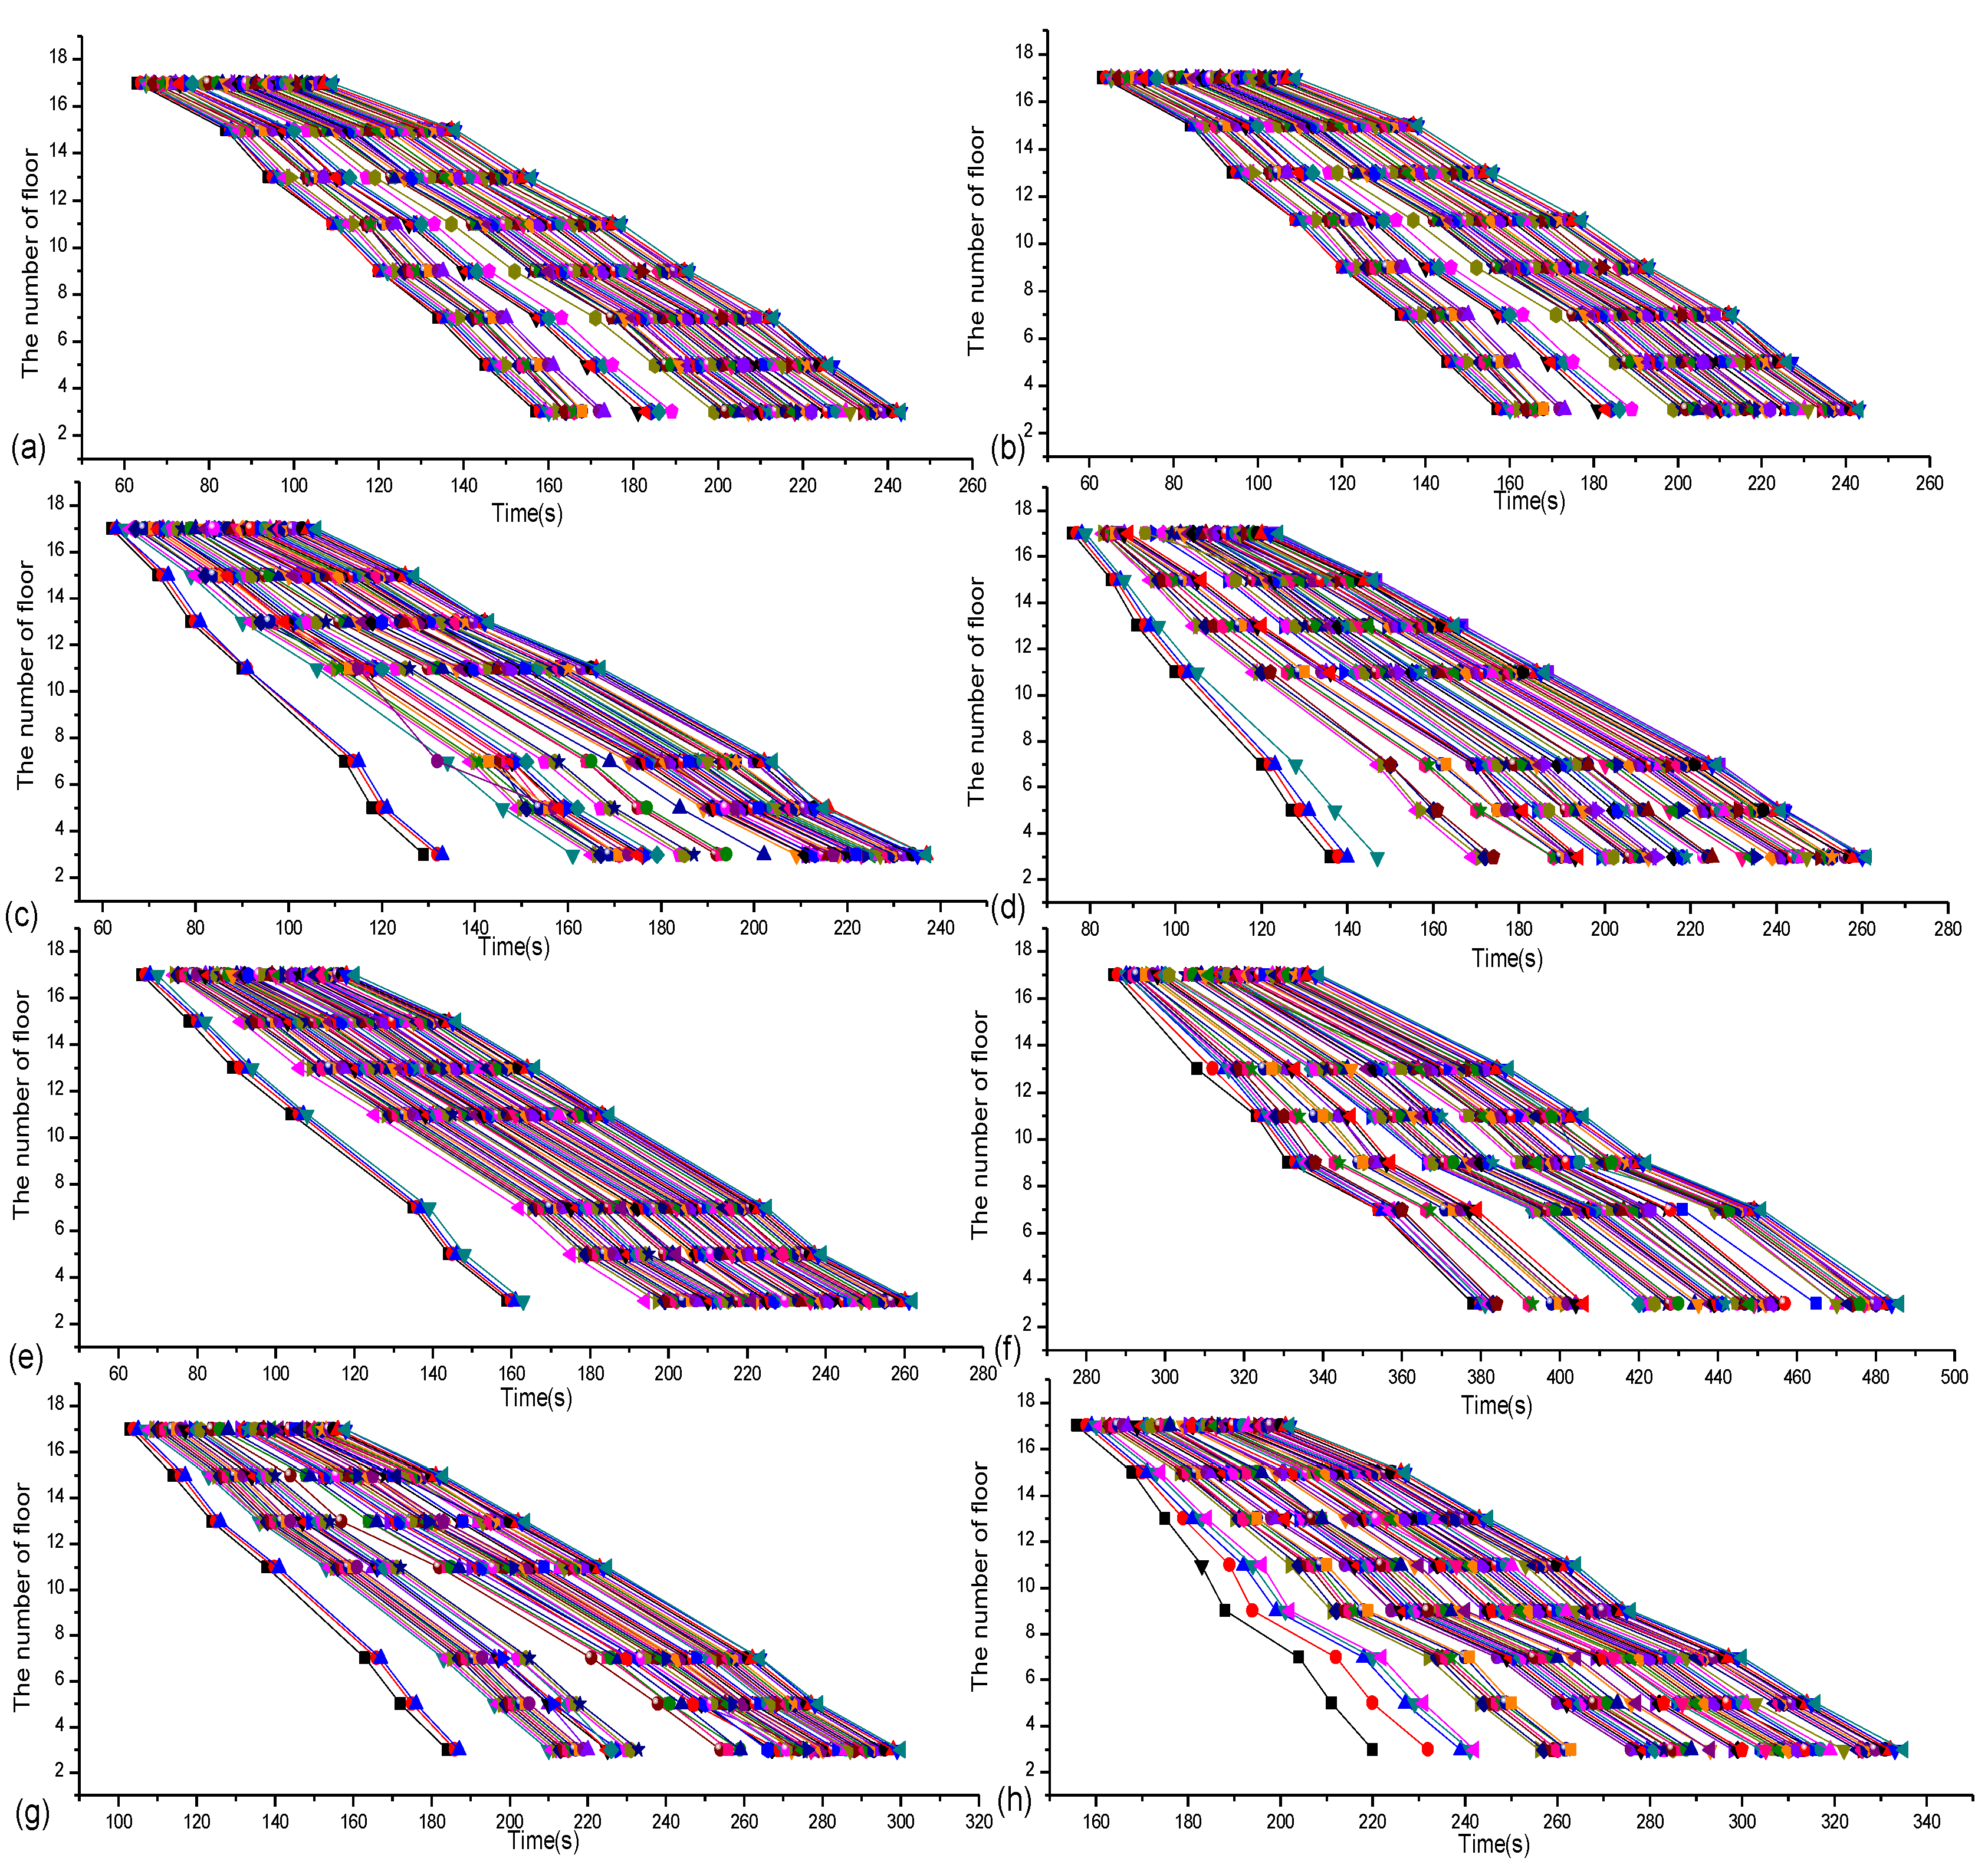
3.4. Temporal and Spatial Distribution of Evacuation Process
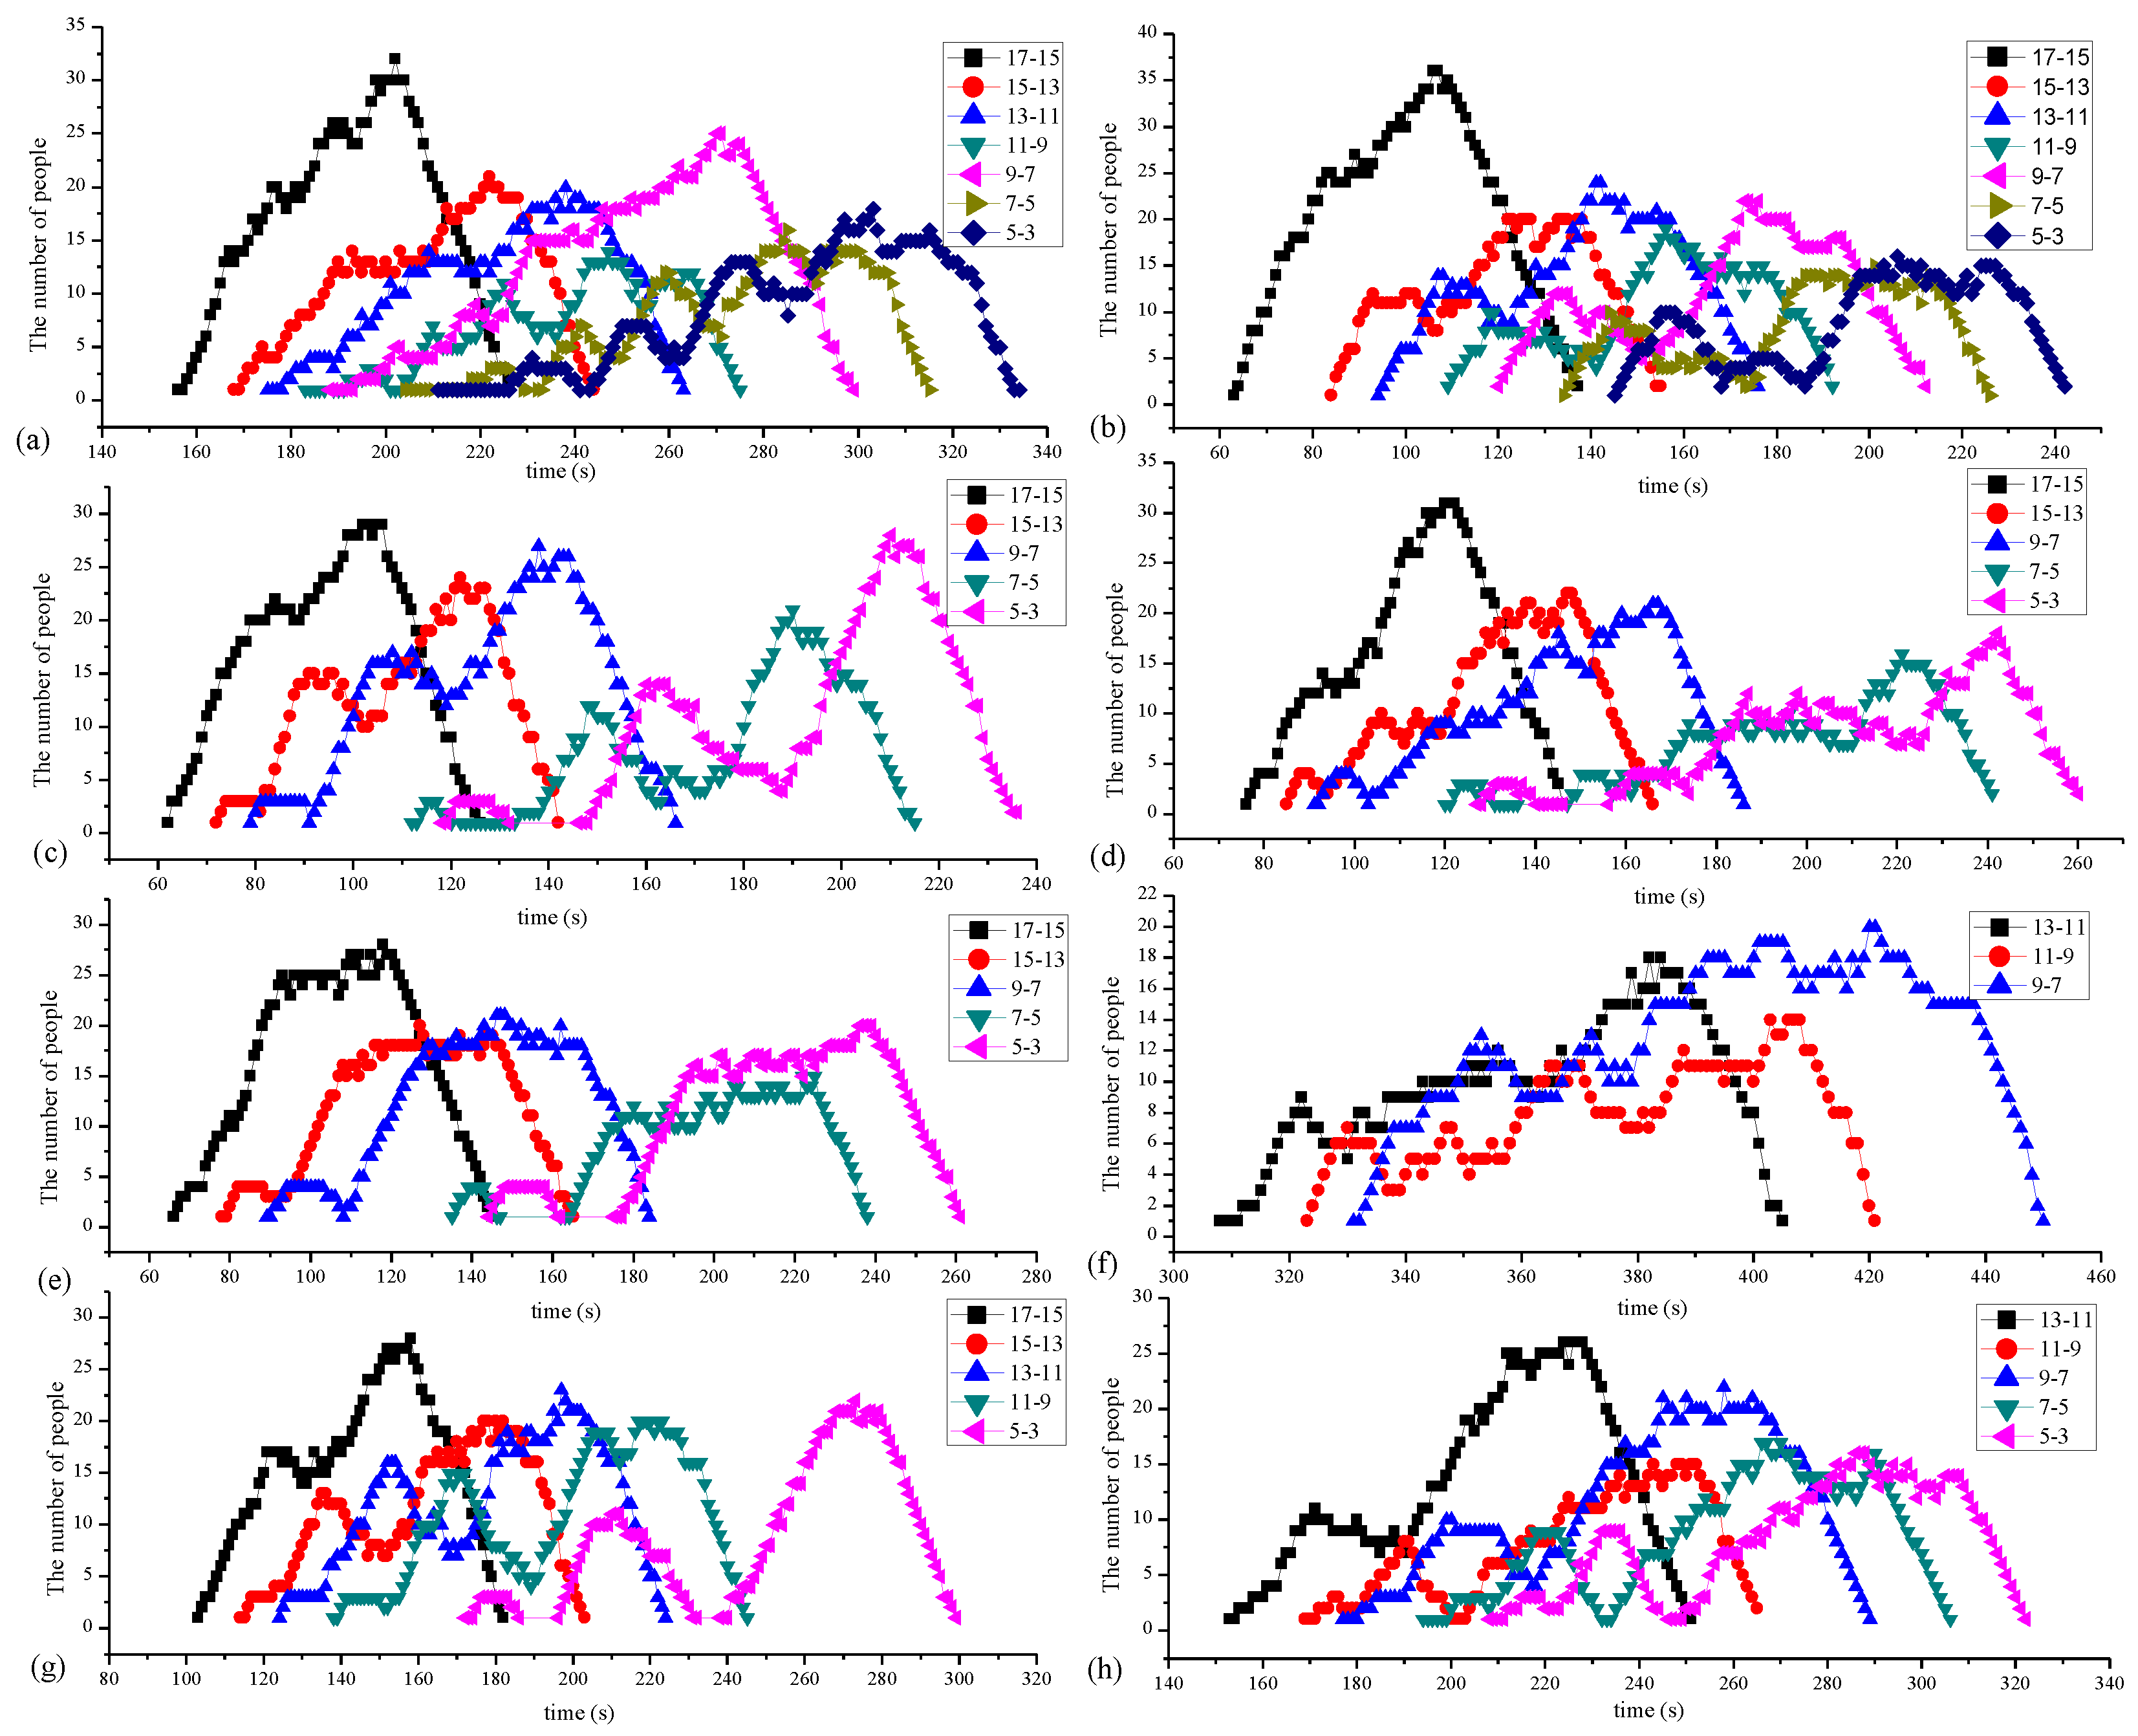
3.5. The Number of People in the Staircase Evolves over Time
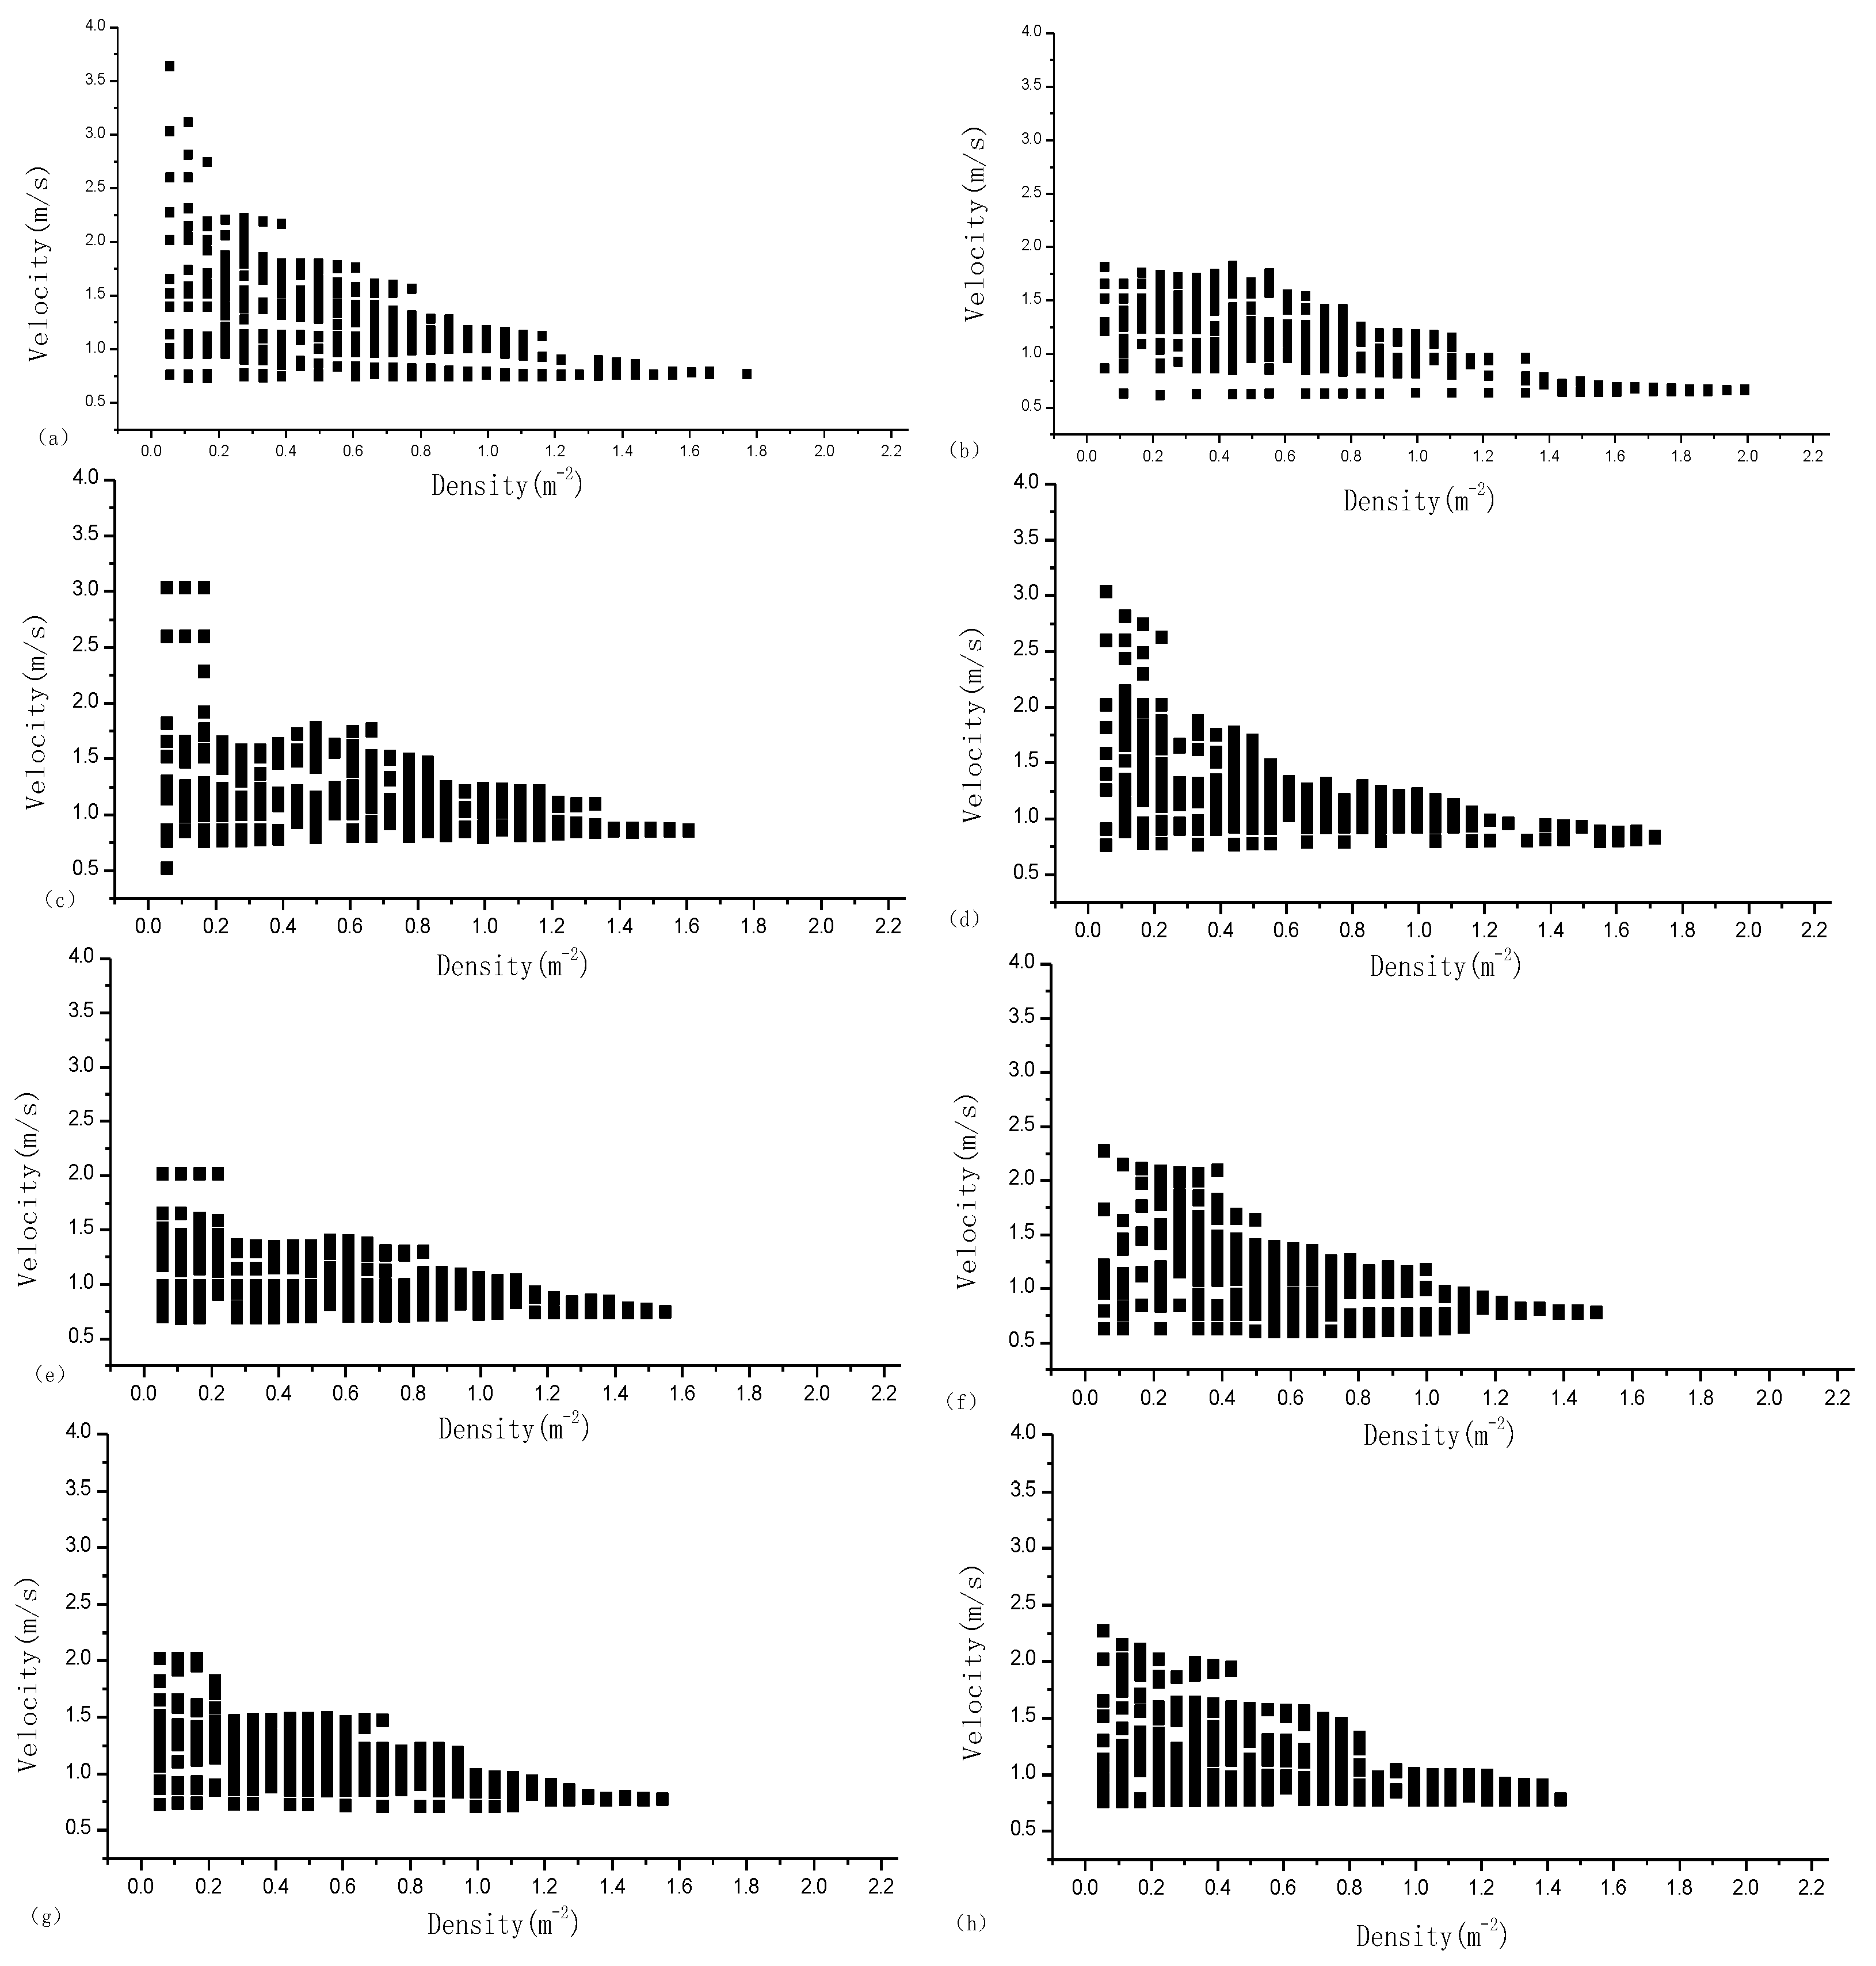
3.6. The Fundamental Diagram
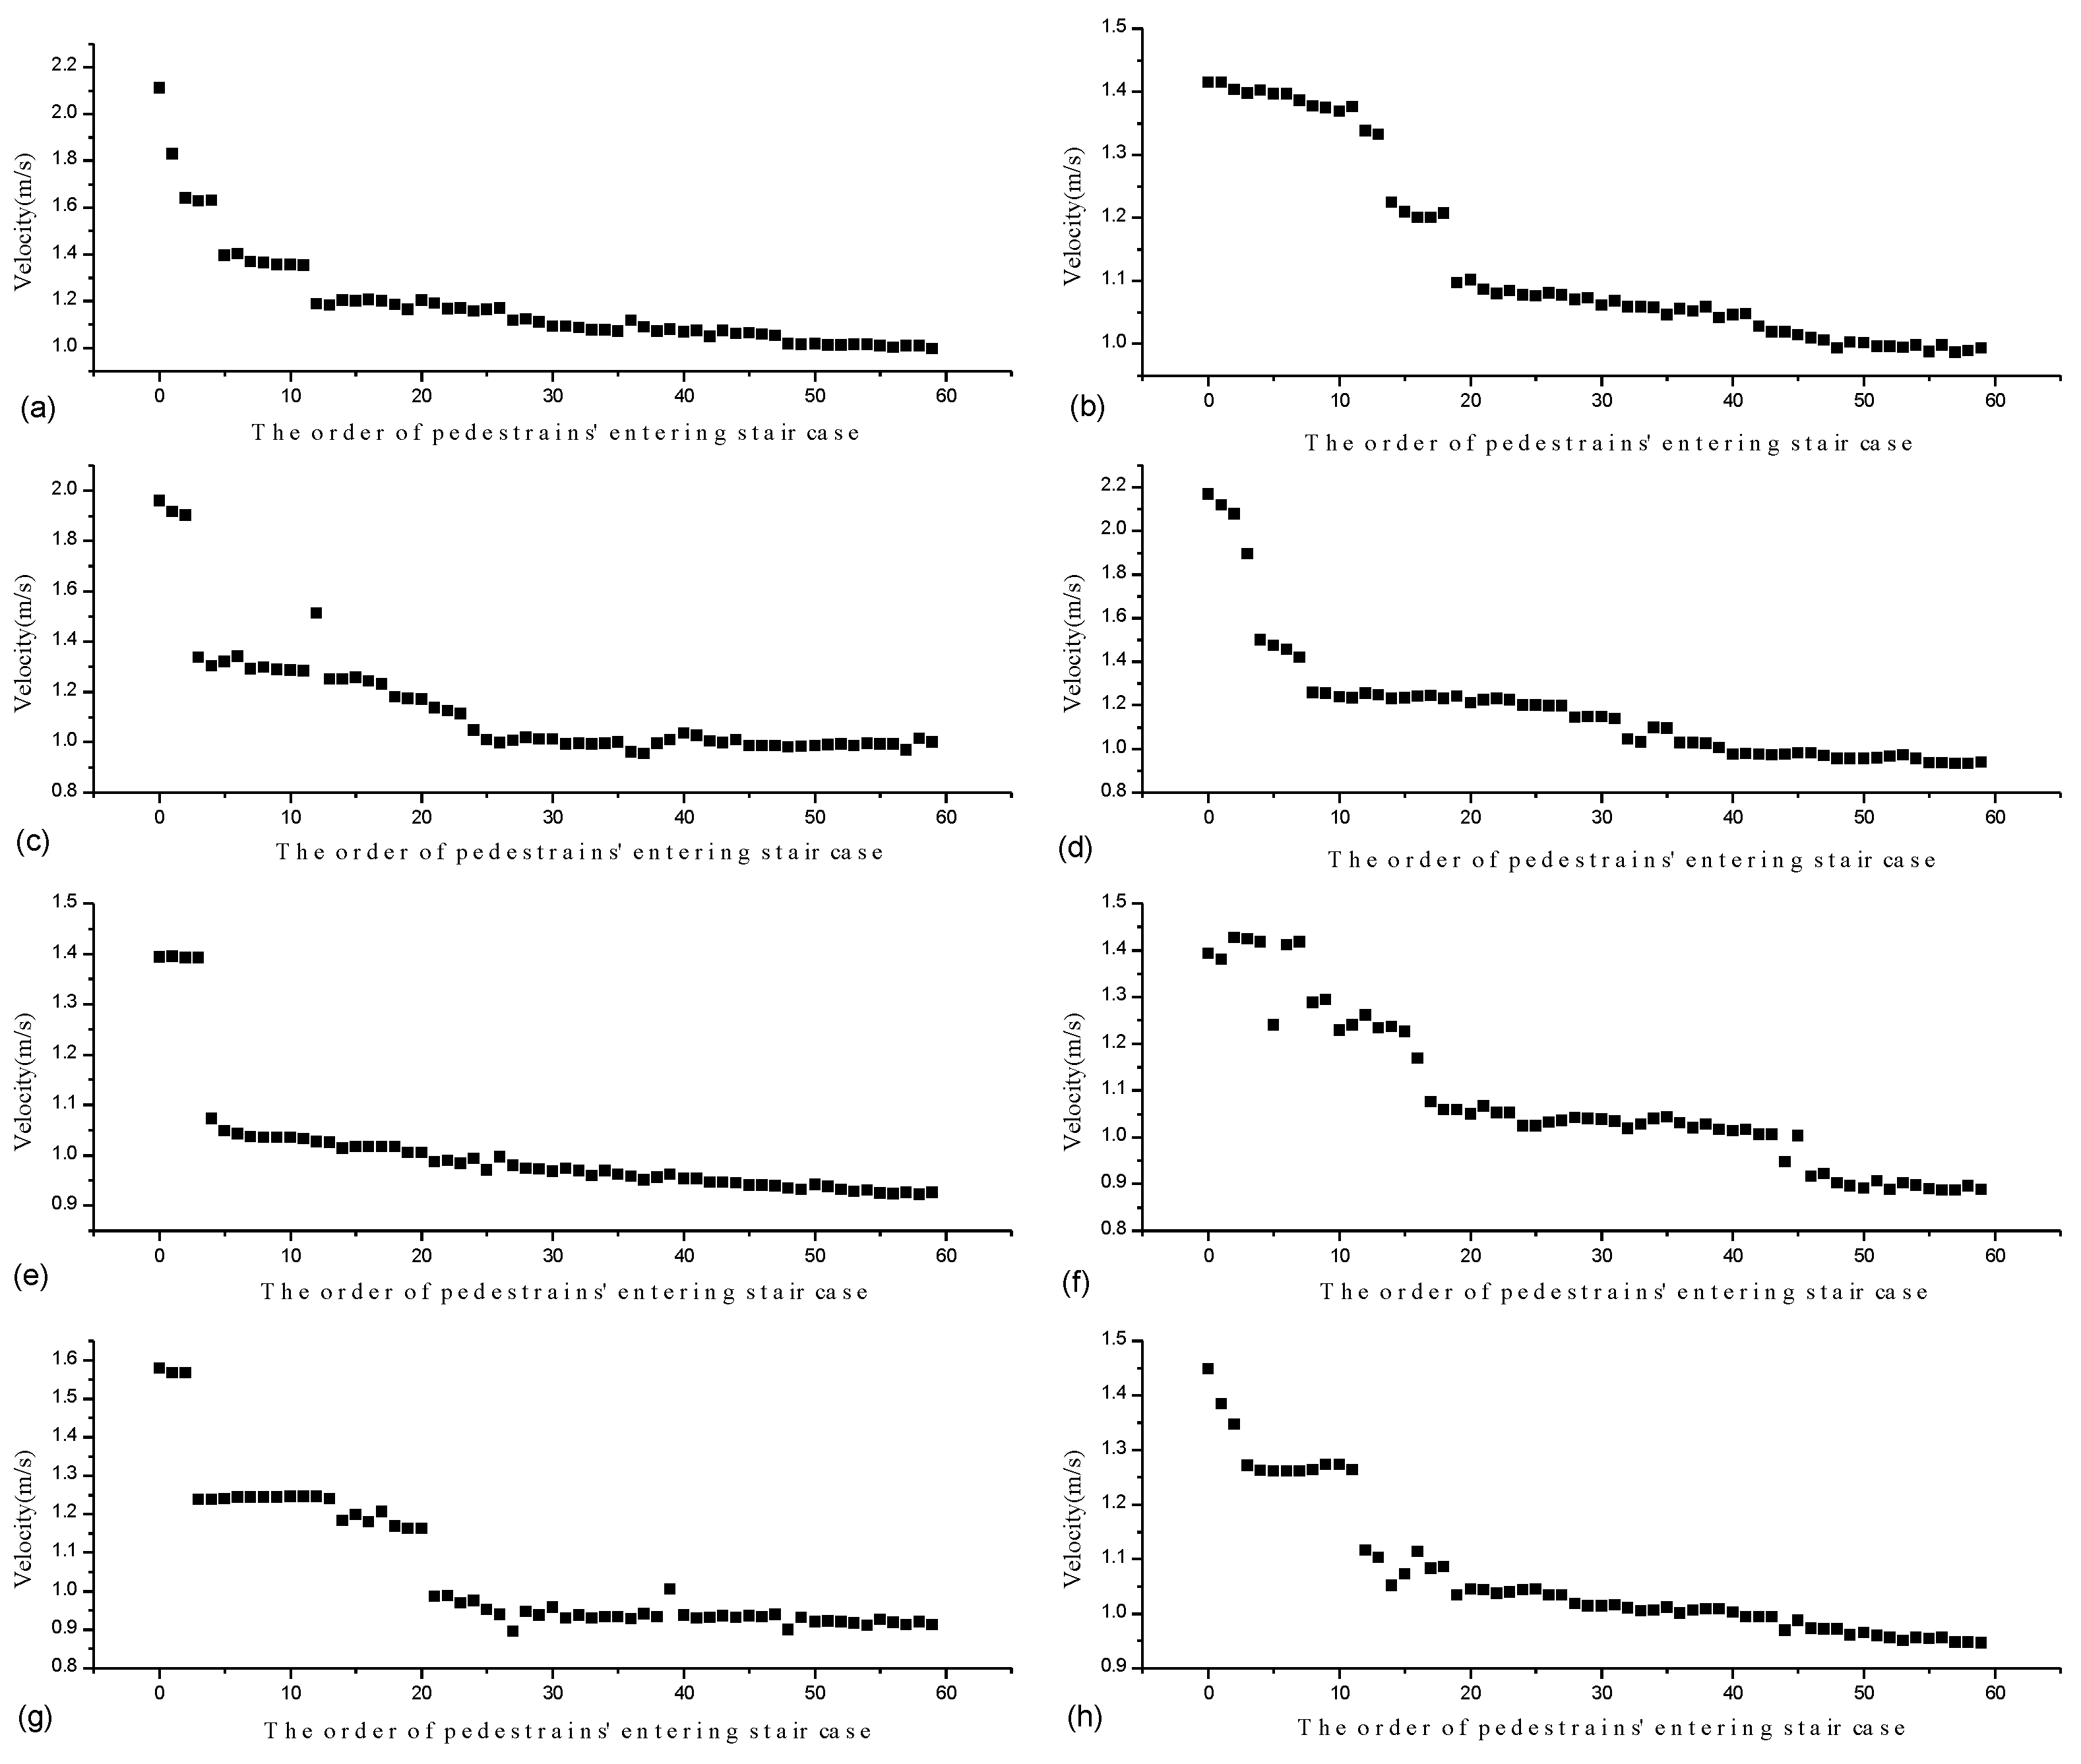
3.7. The Relationship between Pedestrians’ Velocity and the Order of Pedestrians Entering the Stairwell
4. Summary
Author Contributions
Funding
Data Availability Statement
Conflicts of Interest
References
- Liu, D.; Xu, Z.; Yan, L.; Wang, F. Applying Real-Time Travel Times to Estimate Fire Service Coverage Rate for High-Rise Buildings. Appl. Sci. 2020, 10, 6632. [Google Scholar] [CrossRef]
- Jiten, S.; Gaurang, J.; Purnima, P.; Arkatkar, S. Effect of stairway width on pedestrian flow characteristics at railway stations. Transp. Lett. 2016, 8, 98–112. [Google Scholar] [CrossRef]
- Köster, G.; Lehmberg, D.; Kneidl, A. Walking on stairs: Experiment and model. Phys. Rev. E 2019, 100, 022310. [Google Scholar] [CrossRef] [PubMed]
- Sano, T.; Yajima, M.; Kadokura, H.; Sekizawa, A. Human behavior in a staircase during a total evacuation drill in a high-rise building. Fire Mater. 2017, 41, 375–386. [Google Scholar] [CrossRef]
- Campbell, C.K. Occupant Merging Behavior During Egress From High Rise Buildings. Master’s Thesis, University of Maryland, College Park, MD, USA, 2012. [Google Scholar]
- Huo, F.; Song, W.; Lv, W.; Liew, K.M. Analyzing pedestrian merging flow on a floor–stair interface using an extended lattice gas model. Simulation 2014, 90, 501–510. [Google Scholar] [CrossRef]
- Choi, J.H.; Galea, E.R.; Hong, W.H. Individual Stair Ascent and Descent Walk Speeds Measured in a Korean High-Rise Building. Fire Technol. 2014, 50, 267–295. [Google Scholar] [CrossRef]
- Larusdottir, A.R.; Dederichs, A.S. Evacuation of Children: Movement on Stairs and on Horizontal Plane. Fire Technol. 2012, 48, 43–53. [Google Scholar] [CrossRef]
- Yao, Y.; Lu, W. Research on kindergarten children evacuation: Analysis of characteristics of the movement behaviours on stairway. Int. J. Disaster Risk Reduct. 2020, 50, 101718. [Google Scholar] [CrossRef]
- Hamilton, G.N.; Lennon, P.F.; O’Raw, J. Human behaviour during evacuation of primary schools: Investigations on pre-evacuation times, movement on stairways and movement on the horizontal plane. Fire Saf. J. 2017, 91, 937–946. [Google Scholar] [CrossRef]
- Chen, J.; Wang, J.; Wang, B.; Liu, R.; Wang, Q. An experimental study of visibility effect on evacuation speed on stairs. Fire Saf. J. 2018, 96, 189–202. [Google Scholar] [CrossRef]
- Mossberg, A.; Nilsson, D.; Andrée, K. Unannounced Evacuation Experiment in a High-Rise Hotel Building with Evacuation Elevators: A Study of Evacuation Behaviour Using Eye-Tracking. Fire Technol. 2021, 57, 1259–1281. [Google Scholar] [CrossRef]
- Pauls, J. Evacuation Drill Held in the B.C. Hydro Building, 26 June 1969; Division of Building Research, National Research Council of Canada: Ottawa, ON, Canada, 1971.
- Fang, Z.M.; Song, W.G.; Li, Z.J.; Tian, W.; Lv, W.; Ma, J.; Xiao, X. Experimental study on evacuation process in a stairwell of a high-rise building. Build. Environ. 2012, 47, 316–321. [Google Scholar] [CrossRef]
- Yang, L.Z.; Rao, P.; Zhu, K.J.; Liu, S.B.; Zhan, X. Observation study of pedestrian flow on staircases with different dimensions under normal and emergency conditions. Saf. Sci. 2012, 50, 1173–1179. [Google Scholar] [CrossRef]
- Kuligowski, E.; Peacock, R.; Wiess, E.; Hoskins, B. Stair evacuation of people with mobility impairments. Fire Mater. 2015, 39, 371–384. [Google Scholar] [CrossRef]
- Chen, J.M.; Wang, J.Y.; Wang, J.C.; Liu, X.; Li, T.; Lin, P. An Experimental Study of Individual Ascent Speed on Long Stair. Fire Technol. 2017, 53, 283–300. [Google Scholar] [CrossRef]
- Peacock, R.D.; Kuligowski, E.D.; Averill, J.D. Pedestrian and Evacuation Dynamics||Free Walking Speeds on Stairs: Effects of Stair Gradients and Obesity of Pedestrians; Springer: Boston, MA, USA, 2011; pp. 95–106. [Google Scholar] [CrossRef]
- Koo, J.; Kim, Y.S.; Kim, B.-I.; Christensen, K.M. A comparative study of evacuation strategies for people with disabilities in high-rise building evacuation. Expert Syst. Appl. 2013, 40, 408–417. [Google Scholar] [CrossRef]
- Delin, M.; Norén, J.; Ronchi, E.; Kuklane, K.; Halder, A.; Fridolf, K. Ascending stair evacuation: Walking speed as a function of height. Fire Mater. 2017, 41, 514–534. [Google Scholar] [CrossRef]
- Polka, M.; Kukfisz, B.; Auguscik, M.; Leszczynska, M.; Ryszkowska, J. Impact of flame retardants on the smoke generating properties of flexible and semi-rigid polyurethane foams. Przem. Chem. 2017, 96, 1472–1476. [Google Scholar]
- Ronchi, E.; Reneke, P.A.; Kuligowski, E.D.; Peacock, R.D. An analysis of evacuation travel paths on stair landings by means of conditional probabilities. Fire Saf. J. 2014, 65, 30–40. [Google Scholar] [CrossRef]
- Kodur, V.K.R.; Venkatachari, S.; Naser, M.Z. Egress Parameters Influencing Emergency Evacuation in High-Rise Buildings. Fire Technol. 2020, 56, 2035–2057. [Google Scholar] [CrossRef]
- Soltanzadeh, A.; Alaghmandan, M.; Soltanzadeh, H. Performance evaluation of refuge floors in combination with egress components in high-rise buildings. J. Build. Eng. 2018, 19, 519–529. [Google Scholar] [CrossRef]
- Hagwood, C.; Reneke, P.A.; Peacock, R.D.; Kuligowski, E.D. Incorporating Human Interaction into Stair Egress with an Application to Minimum Stair Width. Fire Technol. 2019, 55, 547–567. [Google Scholar] [CrossRef]
- Ding, N.; Zhang, H.; Chen, T. Experimental Study of Egress Selection Behavior Between Stairs and Elevators During High-Rise Building Evacuation. Fire Technol. 2019, 55, 1649–1670. [Google Scholar] [CrossRef] [Green Version]
- Wright, M.; Cook, G.; Webber, G. The effects of smoke on people’s walking speeds using overhead lighting and wayguidance provision. In Proceedings of the 2nd International Symposium on Human Behaviour in Fire; MIT: Boston, MA, USA, 2020. [Google Scholar]
- Zeng, Y.; Song, W.; Jin, S.; Ye, R.; Liu, X. Experimental study on walking preference during high-rise stair evacuation under different ground illuminations. Phys. A Stat. Mech. Appl. 2017, 479, 26–37. [Google Scholar] [CrossRef]
- Ding, N.; Chen, T.; Zhu, Y.; Lu, Y. State-of-the-art high-rise building emergency evacuation behavior. Phys. A Stat. Mech. Its Appl. 2021, 561, 125168. [Google Scholar] [CrossRef]
- Chiangaek, N.; Patvichaichod, S. Performance–based life safety analysis of the hospital building. IOP Conf. Ser. Mater. Sci. Eng. 2020, 715, 012008. [Google Scholar] [CrossRef]
- Sekizawa, A.; Mizuno, M. Analysis of response behavior of people in fire incidents where residential fire alarms successfully worked. Fire Mater. 2017, 41, 441–453. [Google Scholar] [CrossRef]
- Cai, N.; Chow, W.K. Numerical studies on fire hazards of elevator evacuation in supertall buildings. Indoor Built Environ. 2019, 28, 247–263. [Google Scholar] [CrossRef] [Green Version]
- Saelao, T.; Patvichaichod, S. The Computational Fluid Dynamic Simulation of Fire Evacuation from the Student Dormitory. Am. J. Appl. Sci. 2012, 9, 429–435. [Google Scholar]
- Chen, J.; Liu, R.; Wang, J.; Chen, Y. Experimental Influence of Pedestrian Load on Individual and Group Evacuation Speed in Staircases. Fire Technol. 2017, 53, 1745–1763. [Google Scholar] [CrossRef]
- Wei, X.; Mai, X.; Lv, W.; Song, W. Microscopic Character and Movement Consistency of Pedestrian Group: An Experimental Study in Campus. Fire Saf. Sci. 2014, 11, 1103–1114. [Google Scholar] [CrossRef]
- Moussaïd, M.; Perozo, N.; Garnier, S.; Helbing, D.; Theraulaz, G. The walking behaviour of pedestrian social groups and its impact on crowd dynamics. PLoS ONE 2010, 5, e10047. [Google Scholar] [CrossRef] [PubMed] [Green Version]
- Wei, X.G.; Lv, W.; Song, W.G.; Li, X.L. Survey study and experimental investigation on the local behavior of pedestrian groups. Complexity 2015, 20, 87–97. [Google Scholar] [CrossRef]
- Peacock, R.D.; Hoskins, B.L.; Kuligowski, E.D. Overall and local movement speeds during fire drill evacuations in buildings up to 31 stories. Saf. Sci. 2012, 50, 1655–1664. [Google Scholar] [CrossRef]
- Jelić, A.; Appert-Rolland, C.; Lemercier, S.; Pettré, J. Properties of pedestrians walking in line: Fundamental diagrams. Phys. Rev. E Stat. Nonlinear Soft Matter Phys. 2012, 85, 036111. [Google Scholar] [CrossRef] [Green Version]
- Gao, J.; Gong, J.; He, J.; Zhang, D.; Qiu, G.; Zhang, J. Experimental study on pedestrians’ uni- and bi-directional movement on staircases under emergency conditions. J. Stat. Mech. Theory Exp. 2020, 2020, 103401. [Google Scholar] [CrossRef]
- Breitinger, F.; Stivaktakis, G.; Baier, H. FRASH: A framework to test algorithms of similarity hashing. Digit. Investig. 2013, 10, S50–S58. [Google Scholar] [CrossRef]
- Zeng, Y.; Song, W.; Huo, F.; Fang, Z.; Cao, S.; Vizzari, G. Effects of Initial Distribution Ratio and Illumination on Merging Behaviors During High-Rise Stair Descent Process. Fire Technol. 2018, 54, 1095–1112. [Google Scholar] [CrossRef]


| Scene Number | Description | Scene Number | Description |
|---|---|---|---|
| A | Individual (1 pedestrian I) | J | A crowd with four-person groups (60 pedestrian I) |
| B | Individual (1 pedestrian II) | K | A crowd with individuals (30 pedestrian I, 15 pedestrian II and 15 pedestrian III) |
| C | Individual (1 pedestrian III) | L | A crowd with the dyads (30 pedestrian I, 15 pedestrian II and 15 pedestrian III) |
| D | Dyad (2 pedestrian I) | M | A crowd with the triads (30 pedestrian I, 15 pedestrian II and 15 pedestrian III) |
| E | Triad (3 pedestrian I) | N | A crowd with the 4-person groups (30 pedestrian I, 15 pedestrian II, and 15 pedestrian III) |
| F | Four-person group (4 pedestrian I) | O | Dyad (1 pedestrian I and 1 pedestrian III) |
| G | A crowd with individuals (60 pedestrian I) | P | Dyad (1 pedestrian A and 1 pedestrian II) |
| H | A crowd with the dyads (60 pedestrian I) | Q | Triad (1 pedestrian I, 1 pedestrian II and 1 pedestrian III) |
| I | A crowd with the triads (60 pedestrian I) | S | 4-person group (2 pedestrian I, 1 pedestrian II and 1 pedestrian III) |
Disclaimer/Publisher’s Note: The statements, opinions and data contained in all publications are solely those of the individual author(s) and contributor(s) and not of MDPI and/or the editor(s). MDPI and/or the editor(s) disclaim responsibility for any injury to people or property resulting from any ideas, methods, instructions or products referred to in the content. |
© 2022 by the authors. Licensee MDPI, Basel, Switzerland. This article is an open access article distributed under the terms and conditions of the Creative Commons Attribution (CC BY) license (https://creativecommons.org/licenses/by/4.0/).
Share and Cite
Wei, X.; Zhao, Y.; Lian, L.; Yao, H.; Song, H.; Qin, H. Study on Group Movement Characteristics in Stairwell of High-Rise Buildings. Buildings 2023, 13, 83. https://doi.org/10.3390/buildings13010083
Wei X, Zhao Y, Lian L, Yao H, Song H, Qin H. Study on Group Movement Characteristics in Stairwell of High-Rise Buildings. Buildings. 2023; 13(1):83. https://doi.org/10.3390/buildings13010083
Chicago/Turabian StyleWei, Xiaoge, Yinlong Zhao, Liping Lian, Haowei Yao, Huaitao Song, and Hengjie Qin. 2023. "Study on Group Movement Characteristics in Stairwell of High-Rise Buildings" Buildings 13, no. 1: 83. https://doi.org/10.3390/buildings13010083