Article

An Empirical Study of Carbon Emission Calculation in the Production and Construction Phase of A Prefabricated Office Building from Zhejiang, China

1
College of Civil Engineering and Architecture, Zhejiang University, Hangzhou 310030, China
2
Center for Balanced Architecture Research, Zhejiang University, Hangzhou 310028, China
3
The Architectural Design & Research Institute of Zhejiang University Co., Ltd., Hangzhou 310028, China
4
School of Management Science and Real Estate, Chongqing University, Chongqing 400044, China
5
Institute of Anji-Zhejiang University of Science and Technology, Anji 313300, China
6
Zhejiang Architectural Science Design and Research Institute Co., Ltd., Hangzhou 310028, China
*
Authors to whom correspondence should be addressed.
Current address: Zhejiang University Forest University Architectural Design and Research Institute Co., Ltd., Building B1, Xiyuan 8th Road, Xihu District, Hangzhou 310063, China.
These authors contributed equally to this work.
Buildings 2023, 13(1), 53; https://doi.org/10.3390/buildings13010053
Submission received: 20 October 2022 / Revised: 5 December 2022 / Accepted: 12 December 2022 / Published: 26 December 2022

Abstract

:
This study analyzes an office building located in Hangzhou, Zhejiang region, with a high assembly rate of 96.8%. Based on whole-process records and first-hand factory data, using an original method, we empirically investigate the carbon emissions associated to the assembly production and construction phase by comparing the results collected in the field with the calculation results for the simulated non-prefabricated building. The calculation results show that the production and construction stage of the prefabricated office building is characterized by a large reduction in carbon emissions, where the total measured carbon emissions of the subject building were 2265.73 tCO 2 e, which is 22 kgCO 2 e/m 2 less than that under the non-prefabricated method. In the future development of China’s construction industry, taking Zhejiang Province as an example, the implementation of prefabricated office buildings with a PEC structure system can effectively reduce carbon emissions, which can help China to achieve the carbon peak as soon as possible.

1. Introduction

The impacts of human construction activities on the environment [1,2] are rapidly leading the international community to find effective strategies to combat global warming and to develop strategies to mitigate climate change [3]. In the face of climate problems, the Intergovernmental Panel on Climate Change (IPCC) has proposed a goal of limiting global warming to 1.5 ° C. This goal requires deep reductions in energy, land, urban and infrastructure, and industrial systems, in order to achieve carbon neutrality by 2050. In response, China pledged, at the 75th session of the United Nations General Assembly in September 2020, to peak by 2030 and work toward carbon neutrality by 2060.
At present, China’s construction sector accounts for 51.3% of its national carbon emissions, and is the highest-emitting sector. According to the data of the Energy Consumption Statistics Committee of China Construction Energy Conservation Association, the total carbon emissions of China’s buildings have presented a continuous growth trend, reaching about 2.1 billion tons in 2019, an increase of about 3.14 times compared with 668 million tons in 2000, with an average annual growth of 6.96%. If this is taken as the benchmark, the time for China’s construction industry to reach its peak is expected to be around 2039, which is 9 years later than the time when the country as a whole is expected to achieve its carbon peak, and there will still be 1.5 billion tCO2 by 2060, which will seriously restrict the achievement of China’s carbon neutrality target [4]. Therefore, how to effectively reduce carbon emissions in the building sector and achieve the carbon peak as early as possible is a key challenge for the building sector.

1.1. Carbon Reduction Path in the Building Sector

The reduction in carbon emissions in the building sector can be realized in two ways: reducing emissions in the operational phase of existing buildings, or reducing emissions in the production and construction phase of new buildings. From previous studies, building emissions reduction is mainly focused on the operational phase; as about 80% of carbon emissions during the whole life-cycle of a building is generated during the operational phase of the building [5], many studies have focused on developing advanced technologies, policies, and measures to control and reduce carbon emissions during the operational phase.
While there is historical evidence that most building emissions are related to operations, recent studies have suggested that implied emissions may account for more than half of total building life-cycle emissions [6,7]. In terms of the carbon peak, carbon emissions per unit time of buildings have been emphasized, and the concentration of carbon emissions and the absolute amount of emissions in the building phase, compared to the operational phase, of a building are key to the early achievement of carbon peak in the building sector. In 2018, for example, the carbon emissions in the production and construction stages of the construction industry were found to be 7.4% higher than those in the construction and operational stages [4]. According to one study, the carbon emissions in the building phase for one year are equivalent to those of the operation phase over eight years [8]. Recent findings have suggested that housing-related GHG emissions are under-estimated by 60%, as GHG emissions are not included in emissions projections [9]. In the upcoming decade, there will be a large number of new buildings in China, with an expected 14.947 billion m 2 of housing construction, for an annual increase of 3.68% [10], and this large base of building construction activities will lead to a large amount of carbon emissions. Therefore, how to ensure carbon emissions reduction in the building construction phase must urgently be studied.
Among the existing building construction methods, prefabricated buildings are considered to be an effective approach for carbon emissions reduction [11]. Prefabrication, modularization, and information technology can significantly reduce water and wastewater discharge during the construction process, and can reduce noise, wastewater discharge, and dust pollution at the construction site [12,13]. Some studies have shown that prefabricated buildings can provide significant carbon emissions savings, compared to non-prefabricated buildings, especially in the residential sector. For example, Quale et al. compared the construction process of prefabricated buildings with that of traditional residential non-prefabricated buildings, and found that the carbon emissions of non-prefabricated buildings were 40% higher than those of prefabricated buildings. [14]. Aye et al. calculated and analyzed the specific energy savings of modular prefabricated steel and wood-frame residential buildings, and demonstrated that prefabricated means can achieve energy savings of up to 81% and material mass savings of 51% [15].
Dong et al. compared the carbon emissions of prefabricated and non-prefabricated materialization stages considering a private residential building in Hong Kong as an example, further demonstrating that the prefabricated approach can reduce carbon emissions by 10% per one cubic meter of concrete [16]. Teng et al. provided a more systematic understanding of the cradle-to-end of construction, where the embodied carbon generated from typical high-rise public residential buildings in Hong Kong was 561 kgCO 2 /m 2 , mainly generated from the consumption of materials [17]. In contrast, relatively few scholars have studied prefabricated office buildings. Kumanayake et al. assessed the embedded carbon in commercial office buildings in Sri Lanka, focusing on the material production phase of the building life-cycle, and found that the embedded carbon in the material production phase was 629.6 kgCO 2 /m 2 of the total floor area. Reinforced concrete and clay bricks were the main carbon-emitting materials, accounting for over 70% [18].
Over the whole life-cycle of a prefabricated building, there are many complex processes involved, and it is almost impossible to calculate the carbon emissions of the whole process completely and accurately; thus, some scholars have targeted the carbon emissions measurement research of certain processes. In the construction phase, Li et al. studied precast concrete pile products and their carbon footprints during the construction phase, based on the life-cycle assessment (LCA) method, and compiled a database of carbon emission factors for mechanical equipment [19]. Xu et al. investigated a life-cycle carbon emission calculation model for the three stages of component production, logistics and transportation, and on-site installation during the whole construction process of composite beams in prefabricated buildings [20]. Fang et al. assisted construction managers in identifying carbon emissions, in order to optimize them through better construction scheduling. They first defined the system boundary of the construction phase and identified relevant activities in the construction process. A method to identify carbon emissions sources in the construction process based on the Chinese quota method was also proposed [21]. In the phase of building materialization, Li et al. aimed to study precast concrete (PC) buildings and their carbon footprint in the production and construction phase. The development of PC buildings can potentially reduce resource and energy consumption, thus meeting the low carbon and environmental requirements of the construction industry. They also compiled a database of carbon emission factors based on the databases of the Intergovernmental Panel on Climate Change (IPCC) and the China Life Cycle Database (CLCD) [22]. Emanuele Bonamente et al. conducted a systematic analysis of greenhouse gas emissions (carbon footprint) and primary energy consumption (energy footprint) throughout the life-cycle of prefabricated industrial buildings [23].
Partial carbon reduction studies have also been carried out on building materials. A comparison of life-cycle carbon emissions (LCCO 2 ) and embodied energy calculations between two types of bricks—sun-dried and fired clay bricks—was presented by Dabaieh et al. as a way to assess the energy and climate impacts and production economics of each type of brick [24]. Saad et al. developed a conceptual stage-specific carbon measurement tool that can be used in the design phase of building projects to calculate the carbon content [25]. Ding et al. developed a carbon measurement system for prefabricated residential buildings (PRBs) during the production and construction phase, based on building information modeling (BIM) and carbon emissions measurement models [26]. Meneghelli et al. described how data collected during LEED certification can serve as a viable and representative description of an entire project at a LEED-certified public library in Chicago, IL, USA, examining regional differences in recycled steel and aluminum content, product loss, transportation of materials to the site, and anticipated repairs and replacements [27].
However, few studies have taken into account the uncertainty caused by errors in input parameters, scenario assumptions, and analytical uncertainty in model selection in the study of carbon emissions from prefabricated buildings, which may lead to the misinterpretation of the results. Teng et al. developed a five-level framework for assessing deterministic embedded carbon in prefabricated buildings using a process-based approach. Using the SimaPro 9.0 software, a Monte Carlo simulation approach based on data quality indices was used for uncertainty analysis [28]. Mastrucci et al. proposed a spatio-temporal LCA framework to evaluate retrofit options for urban housing, including: (1) A geospatial building model, (2) an energy demand model, (3) product-based LCA, and (4) a scenario generator. Both the LCA and the LCA phases consider the temporal factor, take into account the evolution of existing housing, and apply a time-adjusted carbon footprint calculation [29].
Through the above literature analysis, the following three shortcomings of existing studies can be summarized: (1) the carbon emissions are mostly calculated through software simulations and compared with similar types of buildings, but the comparison results may not be accurate, due to the many differences in areas, floor areas, and construction processes [30]; (2) the prefabrication rate of prefabricated buildings is usually low, generally below 50% (Wang et al. 2020), which cannot fully allow for the carbon reduction advantages of prefabricated construction. Thus, the carbon reduction advantages of prefabricated construction methods have not been fully demonstrated; and (3) existing studies on carbon emissions of prefabricated buildings have focused on the residential scope, while few have analyzed prefabricated office buildings. However, there are still a large number of new prefabricated office buildings every year, and different functions will lead to different research scopes.

1.2. Research Purpose and Advantages

The collection of carbon emissions during the production and construction of assembled buildings requires a large amount of data support and calculation, and in most of these projects either open data is used but at a low level of detail (city/region/country), or a high level of detail (below city level) is used but the user needs to enter a large amount of private data to get to the planning stage [31]. Much of these data, as a process, are private and not easily available to the public. Energy engineers and planners must provide the simplest and most powerful tools to collect, process, and analyze data to provide reliable data-based evidence for building, district, and regional-scale future projections for effective system planning [32]. Therefore, this collection, processing, and analysis of data is ultimately presented in terms of total carbon emissions (kgCO 2 e) and carbon emissions per unit area (kgCO 2 e/m 2 ), and these data can be used as open data to contribute to the political, social and economic development of a country [33]. With reliable data, citizen participation can be stimulated, and sustainable behavior and CO 2 reduction can be encouraged.
Considering the above, in this paper, a 96.8% prefabricated—where the concept of assembly rate generally refers to the ratio of the number (or area) of prefabricated components and building components in a building to the total number (or area) of similar components—office building in Hangzhou, Zhejiang Province, designed and built by the author’s team, is used to study the carbon emissions of prefabricated buildings at the construction stage, based on whole-process records and first-hand factory data, as well as the empirical calculations of existing buildings with reference to the non-prefabricated equivalent of this building. The purpose of this study is to demonstrate the accuracy of the empirical data collected and to fill the data gaps in the field through the use of accurate primary data compared to traditional simulation methods, to demonstrate the carbon reduction efficiency of prefabricated public buildings through calculations and references, and to provide calculated data to assist in the design decision-making process regarding the development of low carbon buildings optimized for environmental performance, in order to contribute toward carbon neutrality.

2. Materials and Methods

From previous studies, three main approaches have been used to assess the carbon impact of buildings: process-based analysis, input–output analysis, and hybrid analysis [34]. However, the first two methods have their limitations, and the use of such methods can lead to incomplete system boundaries [35,36,37]. The implied carbon emissions can be reduced by 31.6% by analyzing the uncertainty of the model itself [28]. To further explore the completeness of the LCA model, Manfred Lenzen et al. demonstrated that the boundaries of the hybrid assessment analysis method can be well-confirmed to accommodate specificity, accuracy, cost, labor, and time requirements [35]. Robert H. et al. further showed that the hybrid life-cycle inventory method is sufficiently accurate, as long as the data quality and availability are guaranteed [38]. The author, as the designer and participant of the case study in this paper, has a large amount of first-hand project data—including detailed design process and cost control information—and, after a comprehensive comparison, we chose the hybrid life-cycle inventory approach as the method for study and evaluation. However, it should be emphasized here that the process-based LCA used in the research process is dominant.

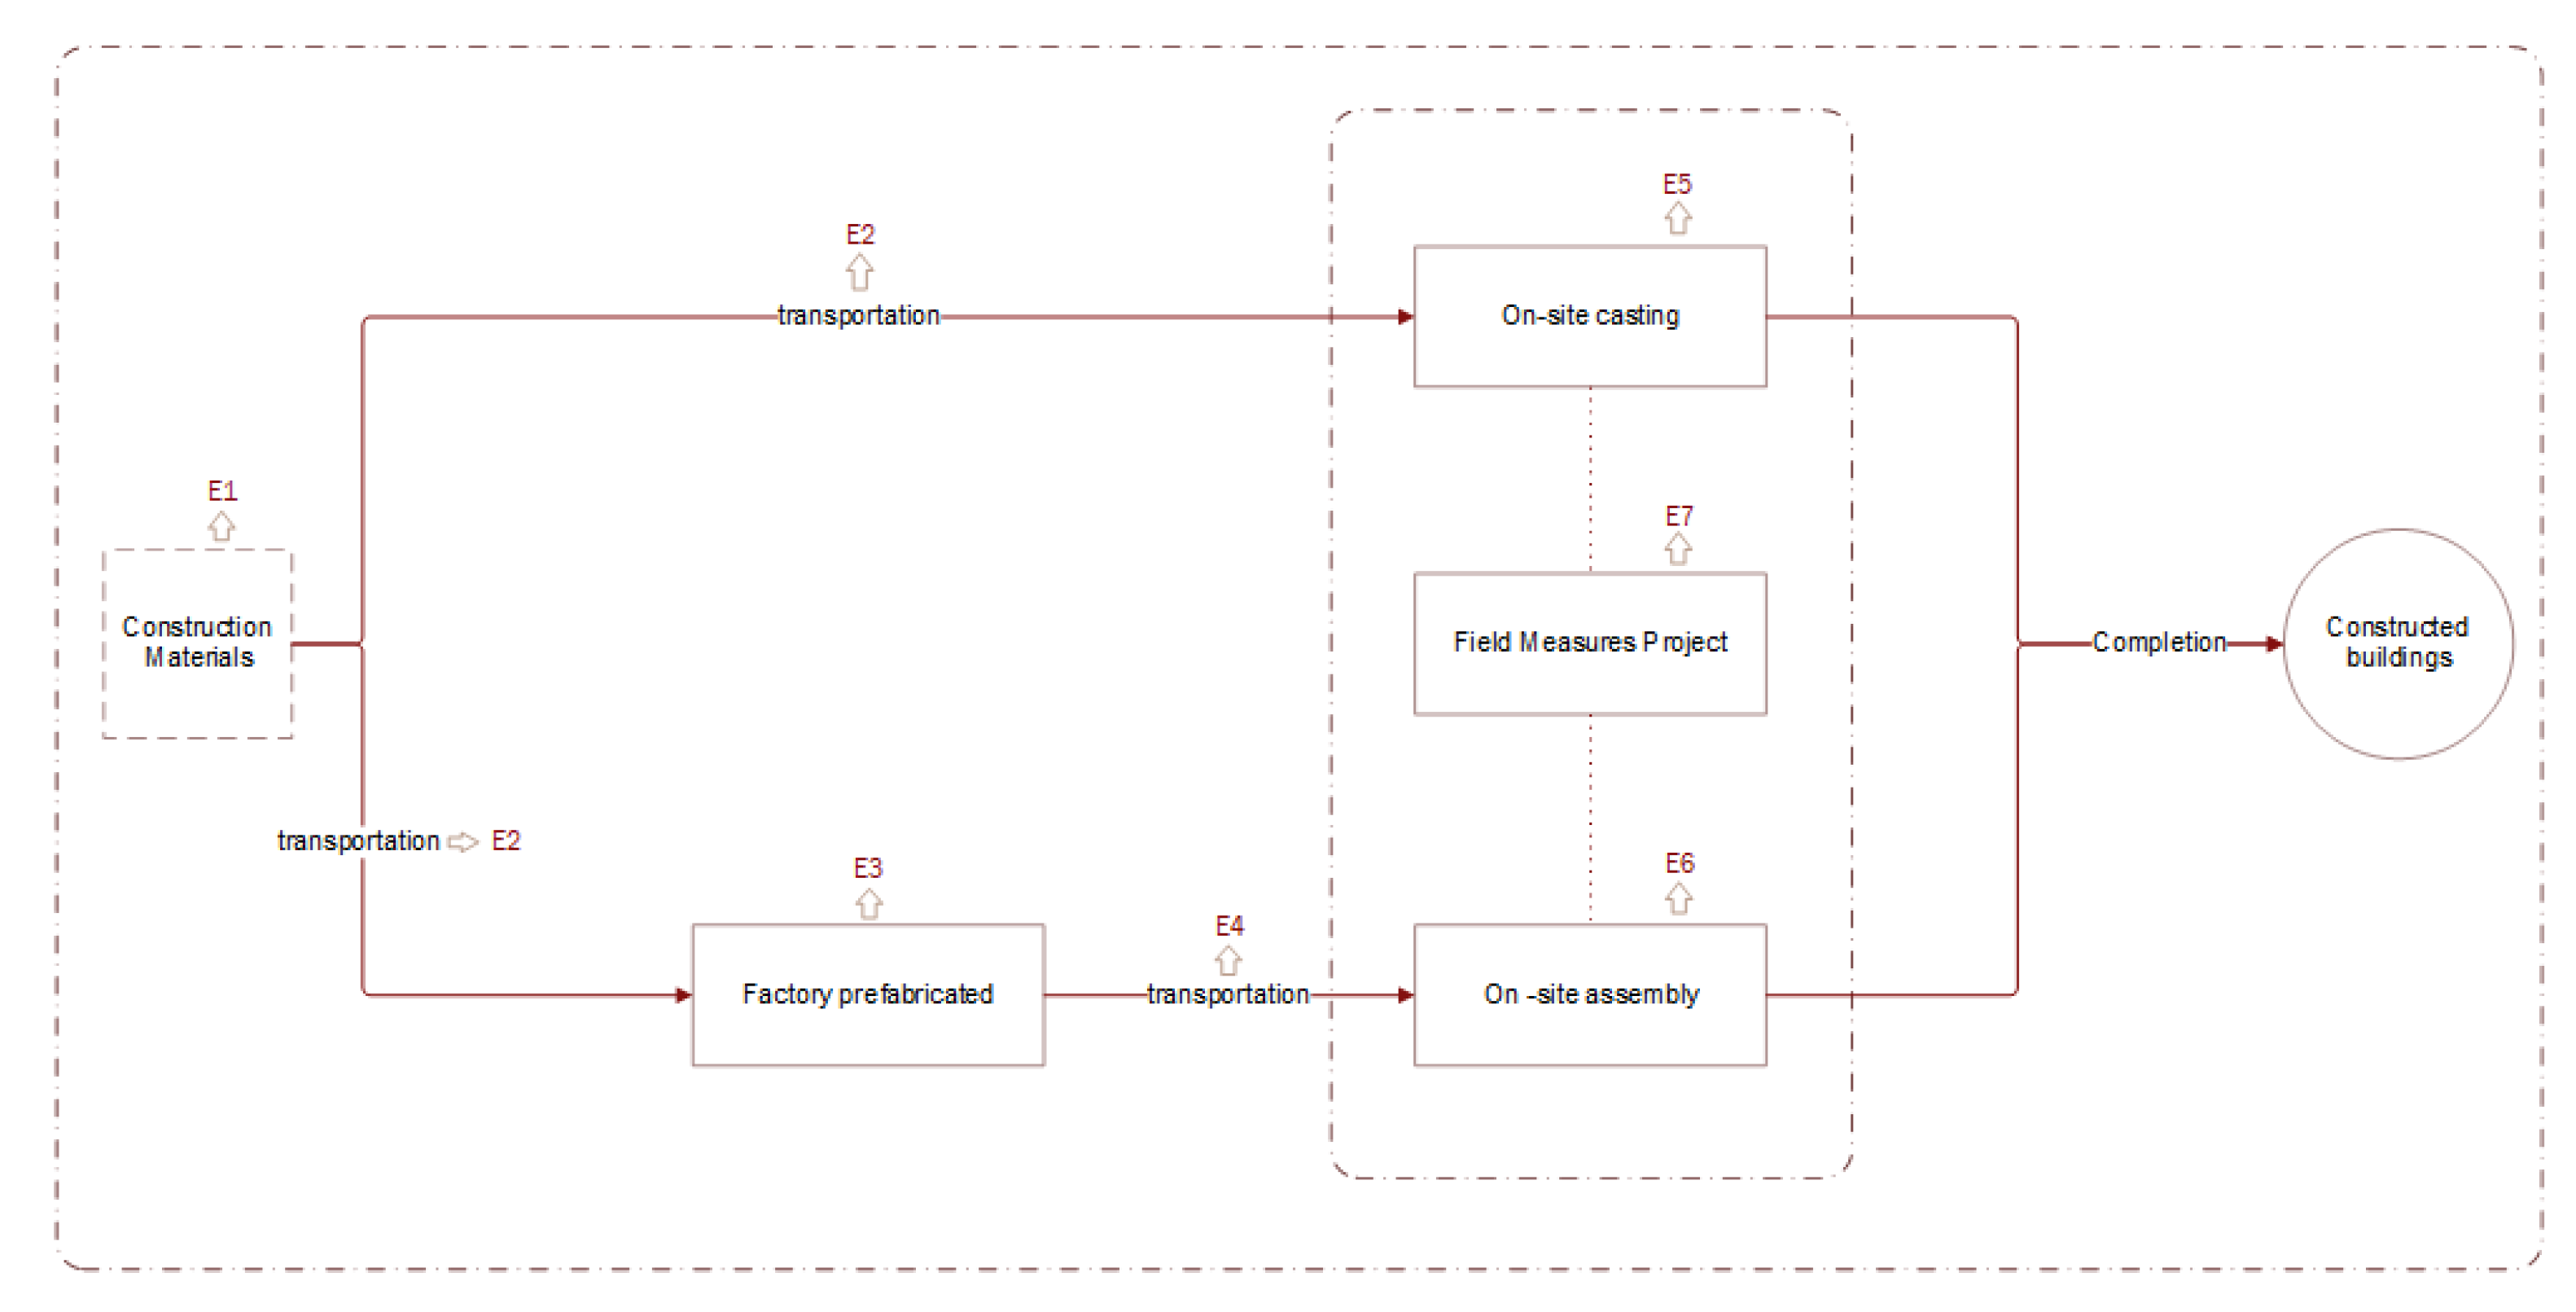
2.1. Comparison Path

The differences between prefabricated construction and traditional non-prefabricated construction are mainly reflected in the three stages of production, transportation, and construction. Compared with the traditional construction method of on-site operation, the prefabricated construction method reduces the impact of seasonal and manual operation on construction. In the transportation stage, the prefabricated construction method involves transporting the finished components to the site, according to the construction schedule, while, in the traditional non-prefabricated method, the materials are transported to the construction site according to the design instructions. In the construction stage, the prefabricated construction method lifts and installs the finished components directly at the site. In the construction stage, the finished components transported to the site are directly lifted and installed, and can be quickly positioned and accurately installed through the mortise and tenon combination method, which greatly reduces the amount of open-air work on site, as in traditional non-prefabricated buildings, and reduces the mechanical construction steps, such as concrete pumping, pounding, and the tying and welding of the rebar [39,40]. In order to compare the exact difference in carbon emissions between the physical phase of the prefabricated office building and conventional non-prefabricated practice, we re-designed the B1 building with the same functional plan using the non-prefabricated method as the reference building. The reference building was re-designed as a frame shear wall structure and re-calculated according to the non-prefabricated method, without changing its floor area, function, or form, but only changing its structure and internal wall practices. The differences between the specific methods are detailed in Table 1.

2.2. Scope of the Study

The production and construction phase of a building usually includes the production, transportation, and construction stages. However, the prefabricated building construction method is different from the traditional non-prefabricated building, as shown in Figure 1. The prefabricated building is constructed by processing the prefabricated components in a factory and assembling them on site. In the study of carbon emissions, the carbon emissions in traditional building construction come from the material factory, transportation, and construction site, while most of the components of a prefabricated building are prefabricated and produced in factories, and the carbon emissions are calculated according to the material factory, material transportation, component factory, component transportation, and assembly site [41]. In this paper, the emissions boundary for the production and construction phase of the prefabricated building is calculated from the cradle to the end of completion. Specifically, it includes the implicit carbon emissions of materials, the carbon emissions of the material transportation stage, the carbon emissions of the factory processing stage, and the carbon emissions associated with the on-site construction and assembly stage.
According to the above calculation boundary, the carbon emissions of prefabricated buildings can be mainly separated into two parts, prefabrication factories and construction sites, while non-prefabricated buildings have no prefabrication factory part. Through specific refinement, we can divide the carbon emissions in the materialization stage into three parts, which can be specifically divided into E1–E7, as shown in Figure 2.
Off-site carbon emissions:
E1: Specific carbon emissions of major permanent construction materials;
E3: Carbon resource and energy consumption emissions from the operation of equipment and construction techniques for building components—in this case, resources and energy including labor, natural gas, electricity, water, and auxiliary materials.
Transportation carbon emissions:
E2: Carbon emissions from fuel combustion during the transportation of construction materials, either from the distribution center to the off-site prefabrication plant or from the distribution center to the project site;
E4: Carbon emissions from fuel combustion during the transportation of prefabricated components from the off-site prefabrication plant to the project.
On-site carbon emissions:
E5: Carbon emissions from energy use in on-site construction subcomponent projects;
E6: Carbon emissions from energy use in on-site assembly sub-projects;
E7: Carbon emissions from scaffolding, formwork and bracing, vertical transportation, building super-elevation, and other measure items that can be counted as work volume.

2.3. Calculation Model

For activities occurring during the assembly and building-up, quantification can follow the guidance of ISO 14064-1:2006 [42] for direct and indirect emissions. Therefore, the first step in this section is to establish a calculation method for all emission sources during a given period, where the emission factors for direct fuel combustion and energy use are adjusted according to the recommendations of the IPCC guidelines [43]:
C z = i = 1 7 E i ,
where C z is the total carbon emissions for the whole construction phase, and E i is the carbon emission source in the construction process.

2.3.1. Construction Materials

Equation
E 1 = j = 1 j M j f j b 1 + ϵ j ,
where E 1 denotes the specific carbon emissions of all construction materials (in tCO 2 e), M j is the quantity of construction material j (in tons), f j b is the carbon emissions factor of construction material j (in kgCO 2 e/kg), and ϵ j is the waste factor of construction material j during material transportation or building installation. The value of the waste factor depends on the type of construction material and, given the limited data on carbon emissions factors of construction materials in China, the values used in this study are based on highly cited scholarly articles [5,44,45]. Table 2 collates the relevant waste factors and emission factors used in this study.
Table 2. Construction material waste factors and carbon emissions factors.
Material NameWaste FactorCO 2 Emissions Factor (kgCO 2 e/kg)
Steel components5%0.352
Precast concrete0%0.113
Non-prefabricated concrete2.5%1.021
Gypsum board2.5%0.218
Cement2.5%0.653
Aerated concrete block5%0.106
Architectural glass5%1.735
Cement fiberboard2.5%0.629
Wood5%−1.655
Aluminum5%0.622
Waste factor from Tingyao Chen et al. [28,46,47]; carbon emission factor from [48,49,50].

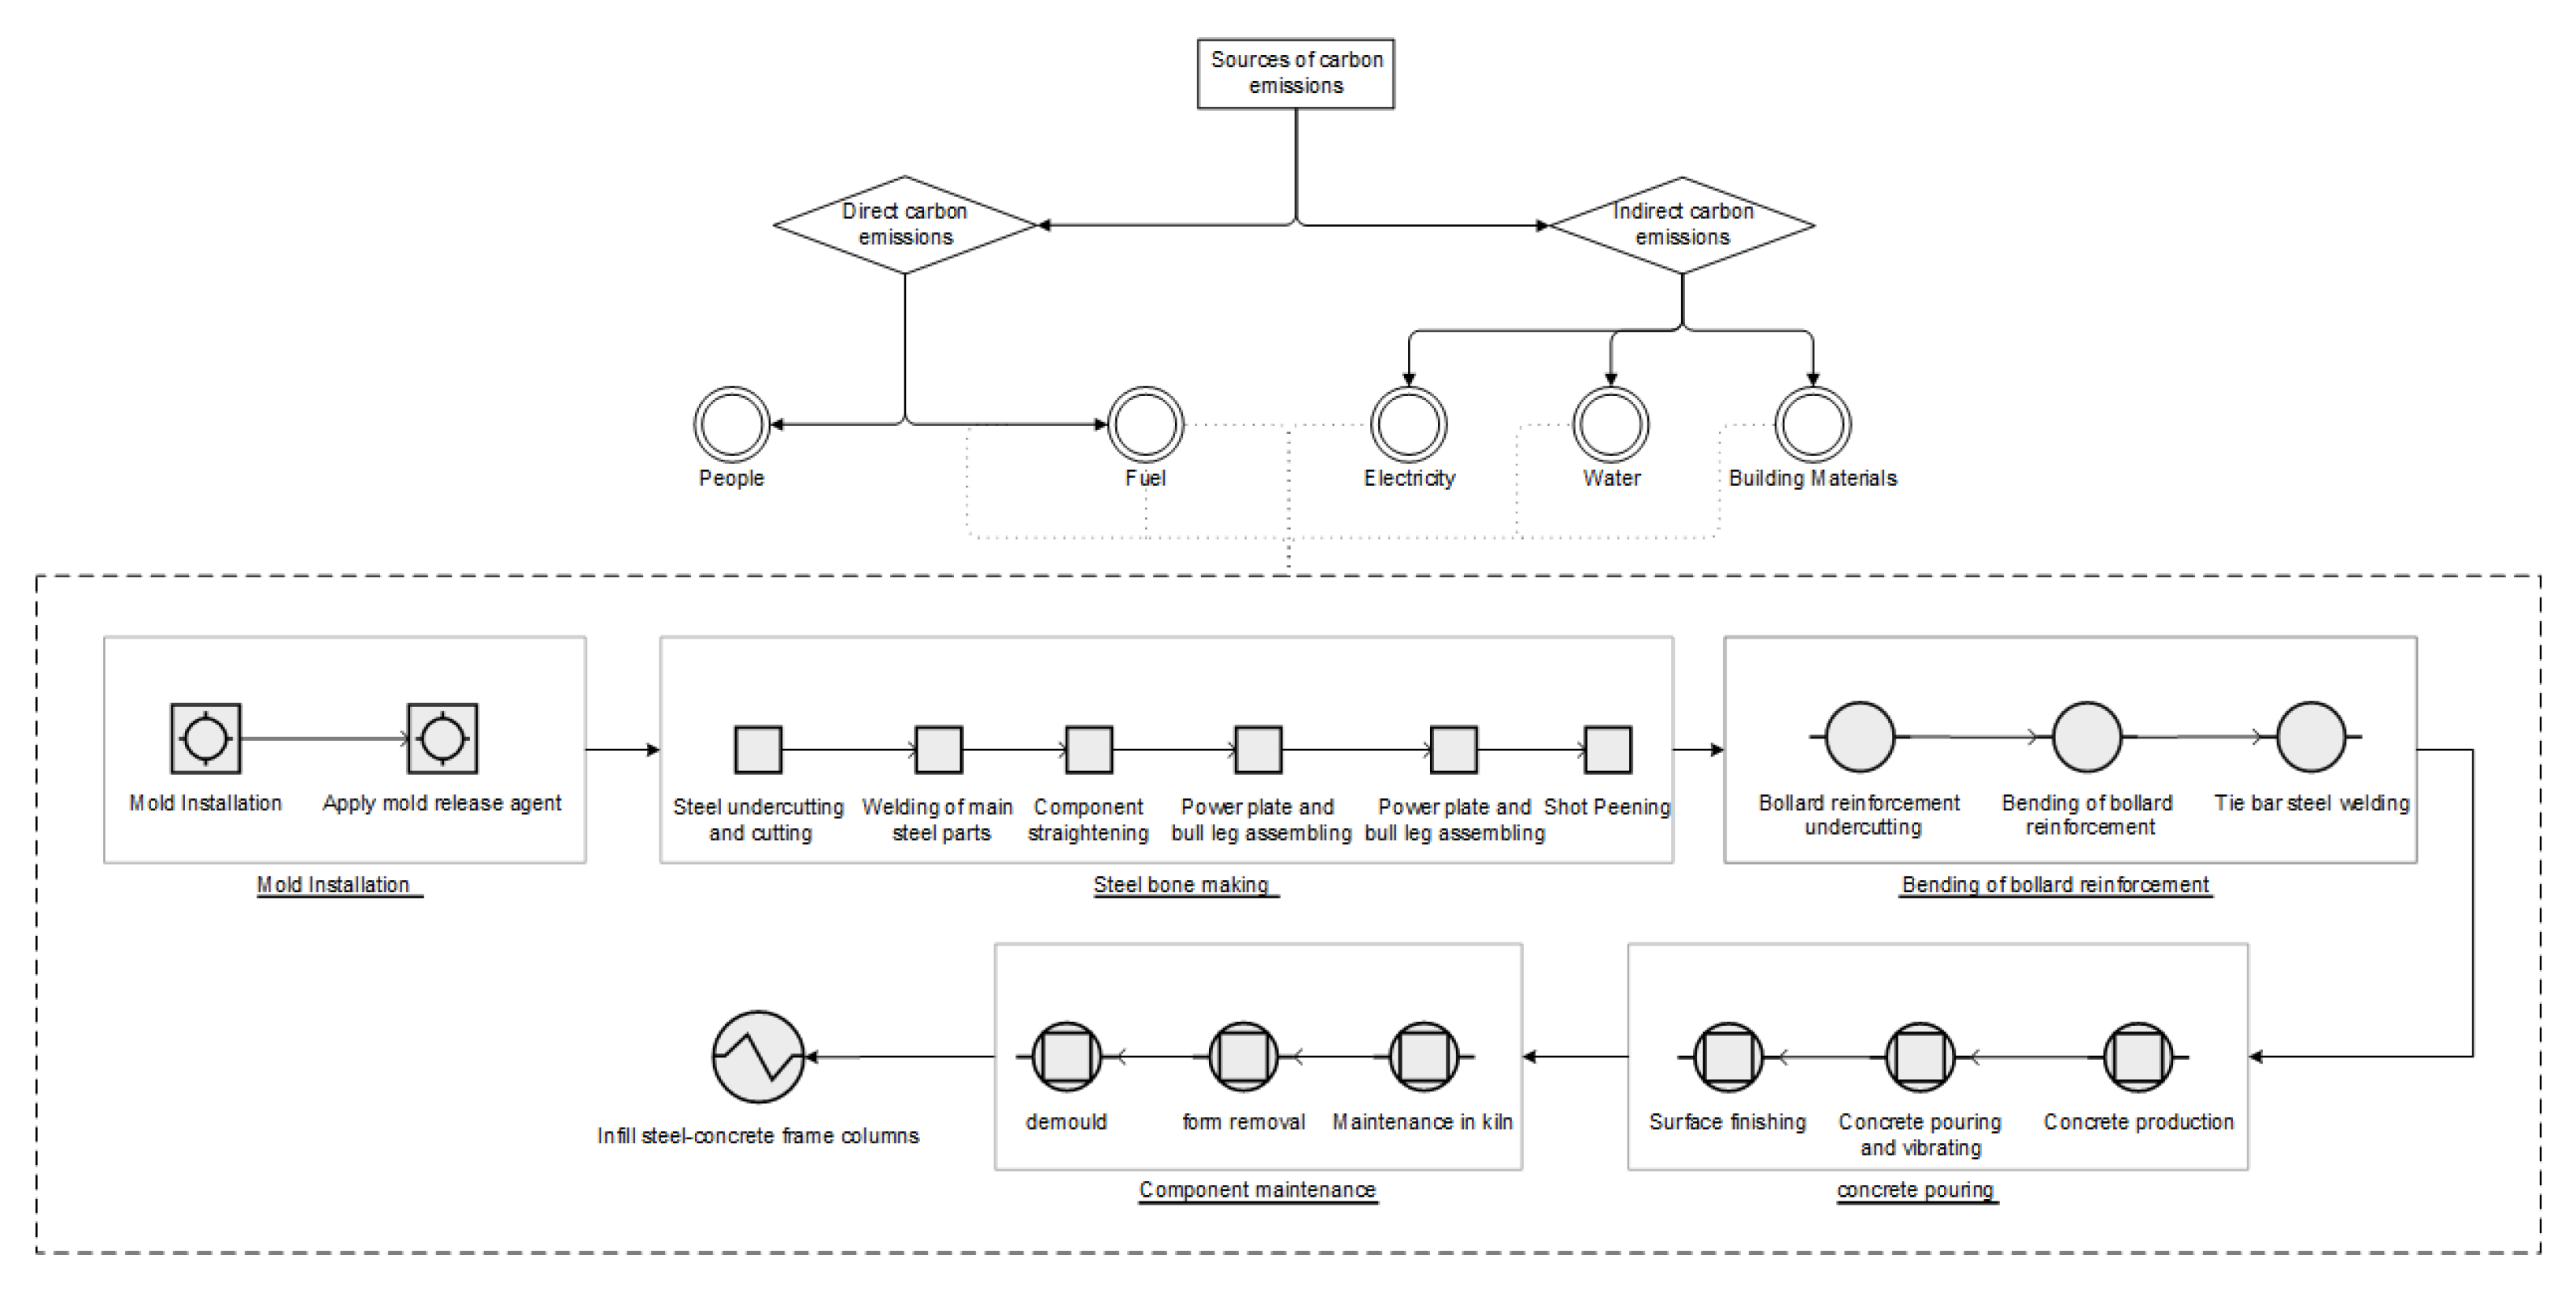
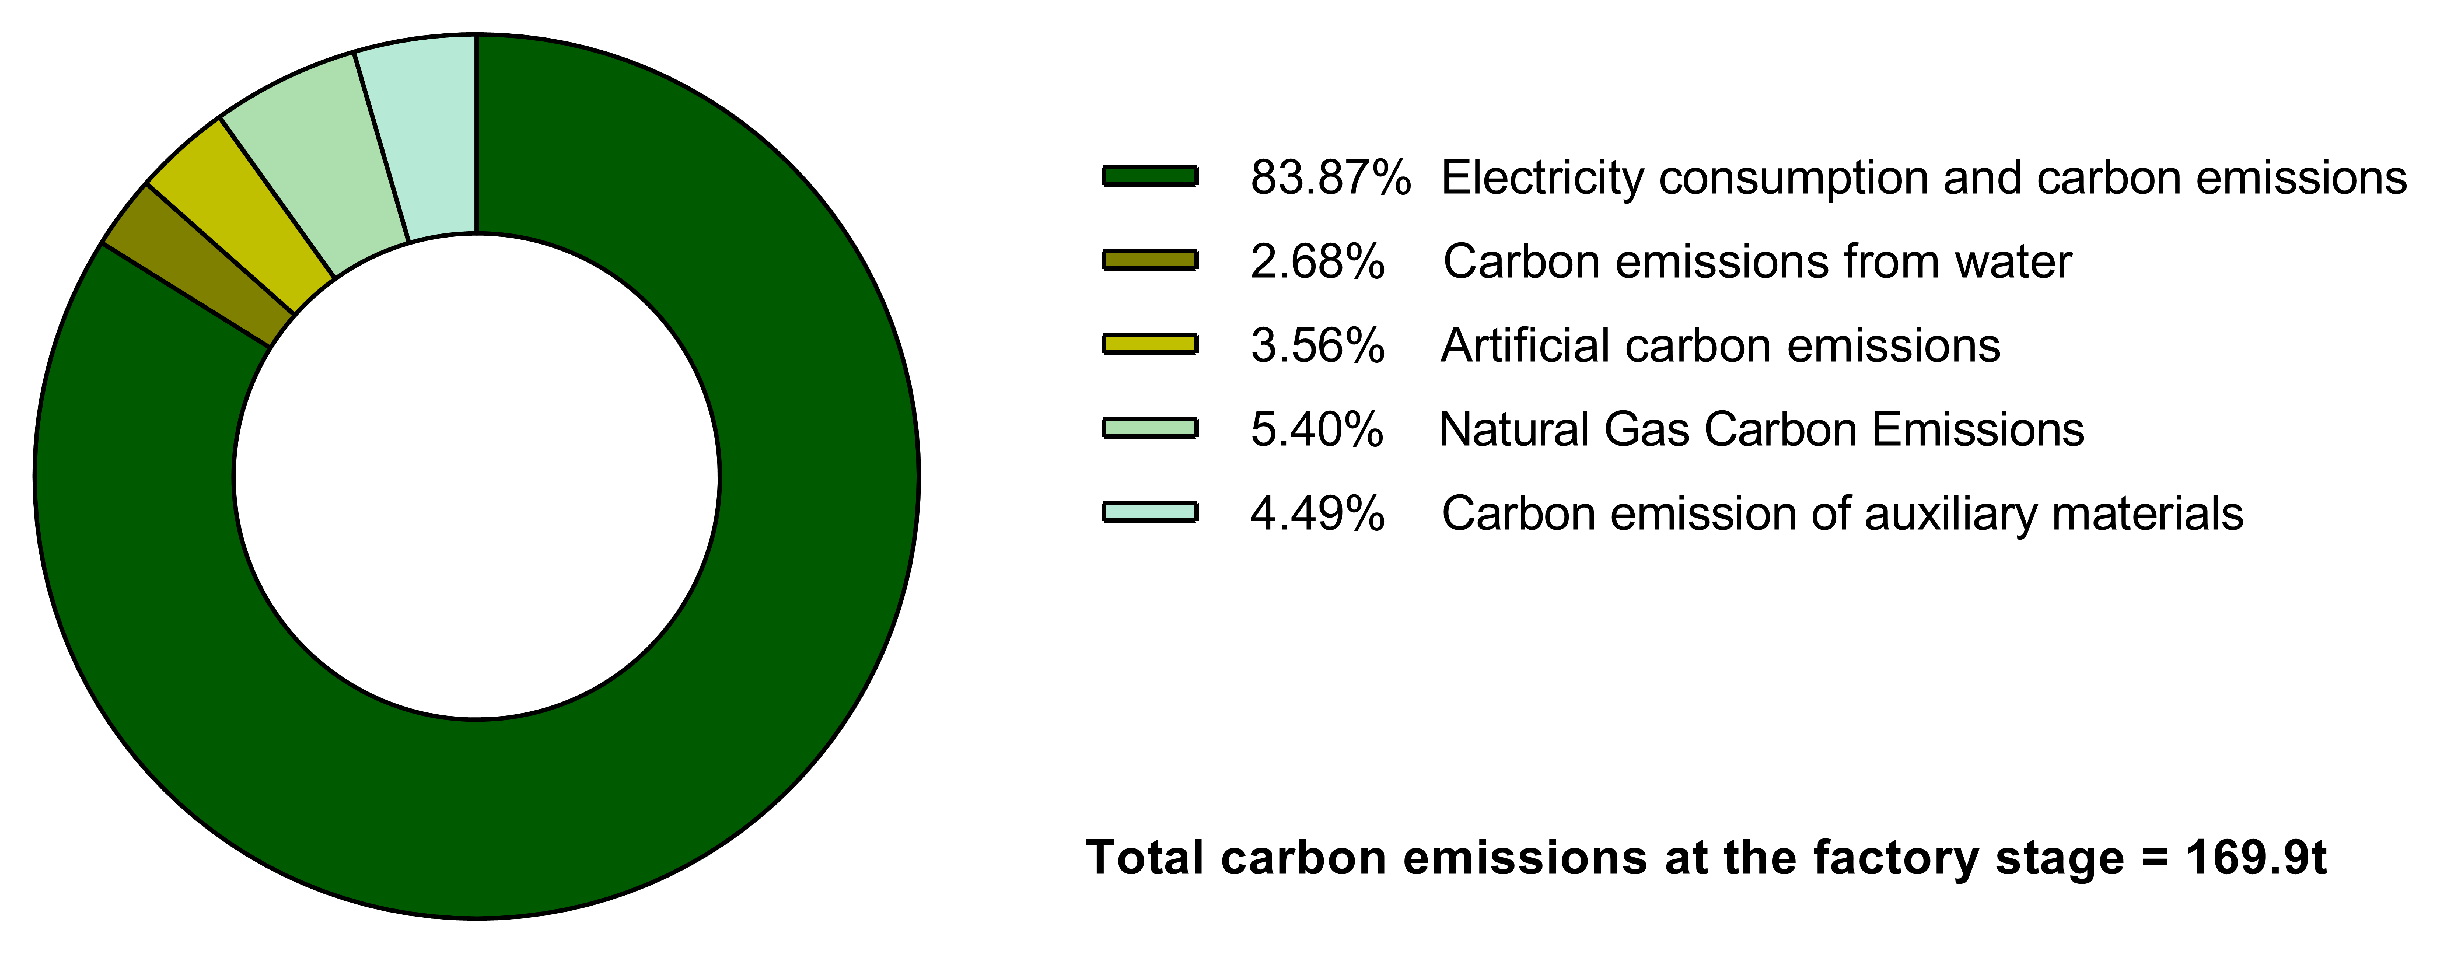
2.3.2. Prefabrication Stage

The CO 2 emissions from the production process of prefabricated components originate from three components: CO 2 from the combustion of minerals or fuels, CO 2 converted from electricity consumption, and CO 2 that may be generated from chemical reactions. Therefore, the carbon emissions of prefabricated components can be calculated from the total carbon emissions associated with the raw materials, fossil fuels, people, water, and electricity [51]. The calculation is expressed as follows:
E 2 = j = 1 j M a f a t + M b i f b i + M c f c + M d f d + M e f e
where E 2 is the specific carbon emissions (in tons) of all precast plant processes, M a is the amount of precast auxiliary material a (in tons), f a t is the general carbon emissions factor of auxiliary material a in the production phase, M b i is the energy consumption in the production process, f b i is the carbon emission factor of the i source of energy, M c is the total number of labor days in the manufacturing process, f c is the human carbon emissions factor, M d is the water consumption in the production process, f d is the water carbon emissions factor, M e is the electricity consumption in the production process, and f e is the electricity carbon emissions factor.
The data of potential emissions factors and carbon oxidation rates by fuel species in the 2006 IPCC Guidelines for National Greenhouse Gas Inventories were used to derive the CO 2 emissions factors per kWh of coal power in the East China Power Grid, in terms of the average over the period 2015–2017 [45] in Table 3.

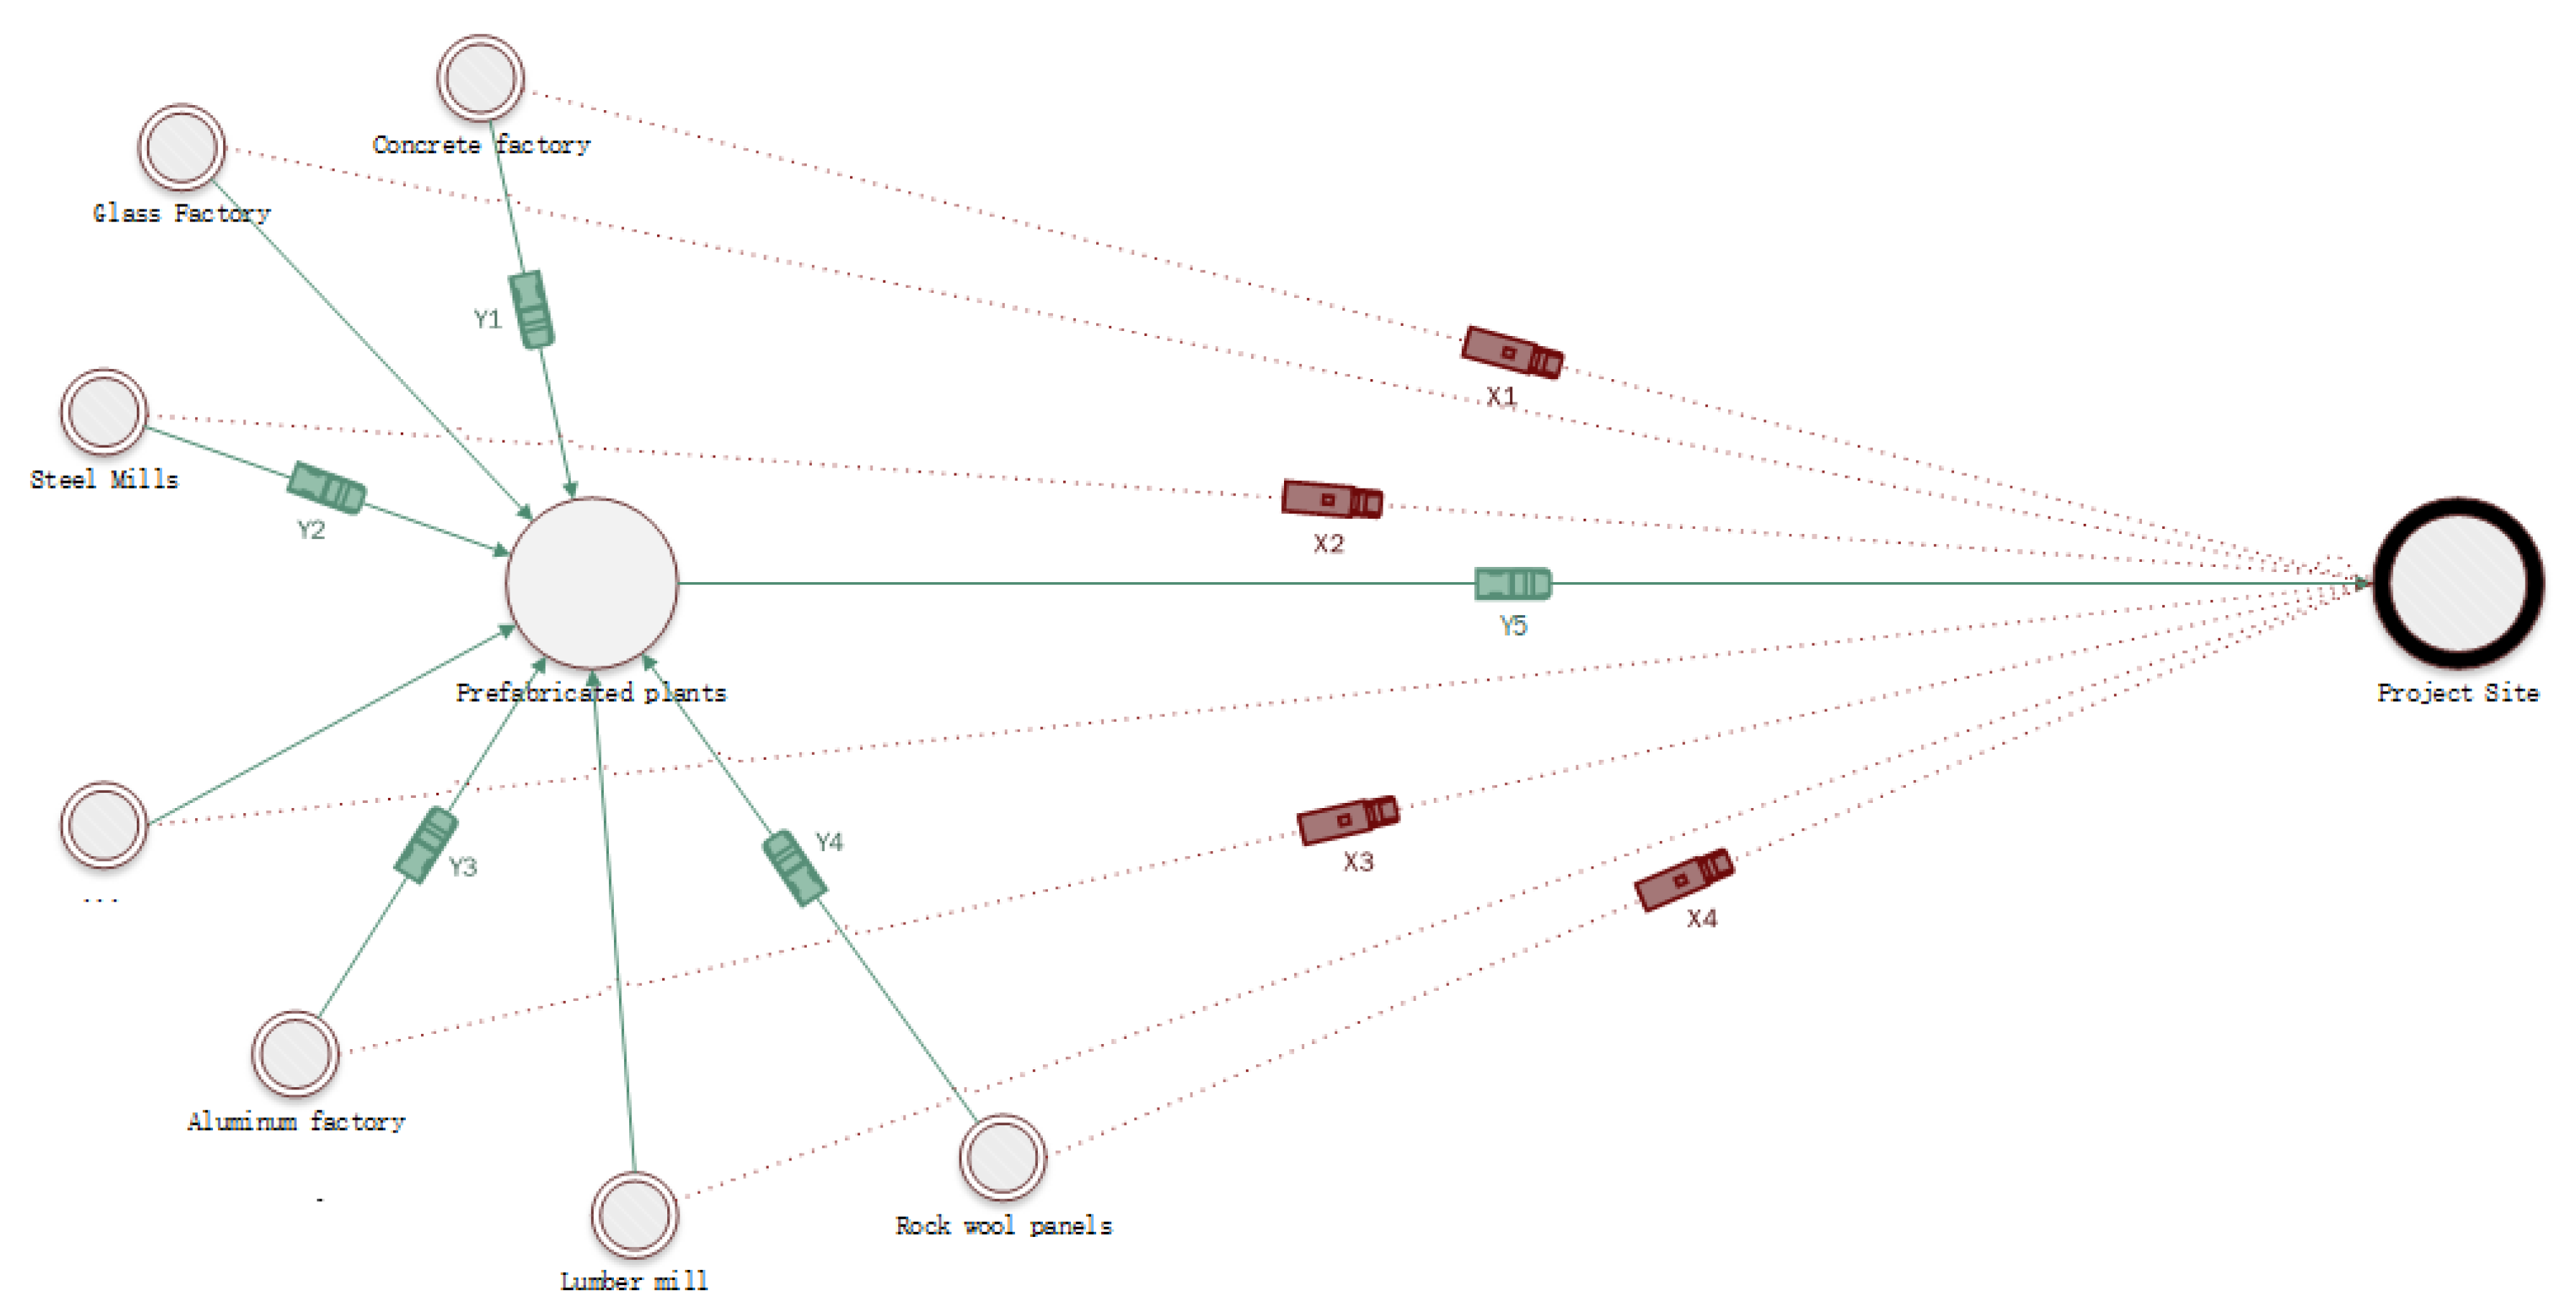
2.3.3. Transportation Phase

Equation
E 3 = k = 1 k j = 1 j M j L j m f k t 1000 ,
where E 3 is the total carbon emissions from fuel combustion for the transportation of construction materials (in tons), L j m is the distance (in km) from the distribution center to the off-site prefabrication plant or from the distribution center to the project site, and f k t is the carbon emissions factor for fuel combustion for transportation method k (in kgCO 2 /tkm), such as vehicle, train, or ship. Table 4 lists the carbon emissions factors for different modes of transportation.

2.3.4. Construction Site

Equation
E x = E 5 + E 6 + E 7 ,
where E x denotes the total energy use in the building construction phase (kwh or kg), E 5 denotes the carbon emissions from the energy use of non-prefabricated sub-projects (kwh or kg), E 6 denotes the carbon emissions from the energy use of on-site assembly sub-projects (kwh or kg), and E 7 denotes the carbon emissions from the energy use of scaffolding, formwork and bracing, vertical transportation, building superstructure, and so on.
The energy usage of sub-projects is calculated according to the following formula:
E 5 + E 6 = i = 1 n Q f f f ,
f f = i = 1 n T i j R i j + E k ,
where Q f is the volume of the i th project in the sub-project, f f is the energy consumption coefficient of the i th project in the sub-project (kwh/volume measurement unit), T i j is the j th type of construction machinery shift consumption in the i th project (shift), R i j is the energy consumption of the j th construction machinery unit shift (kwh/shift) in the i th project (determined in accordance with Appendix C of this standard or according to empirical data, when it is available), and E k is the consumption of energy included in the material part of the energy consumption (kwh); note that small construction machinery is not included in the mechanical shift consumption. The energy consumption associated to scaffolding, formwork and brackets, vertical transportation, building super-elevation, and other measure items that can be calculated for the volume of work should be calculated according to the following formula:
E 7 = i = 1 n Q c f c ,
f c = i = 1 n T A j R i j ,
where Q c is the quantity of work of the i th item in the measure project, f c is the energy consumption coefficient (kwh/volume unit of measure) of the i th project in the measure project, T A j is the consumption of the j th construction machinery shift (shift) for the i th measure project unit quantity, and R i j is the energy consumption of the j th construction machinery unit shift for the i th project (kwh/shift).

3. Embodied Carbon Calculations

Building B1 of Zijin Campus of Zhejiang University Architectural Design and Research Institute (hereinafter referred to as Building B1) is a sub-project of Zijin Crowd Town, with two underground floors connected to other single units and 3 above-ground floors with a construction area of 8888 square meters. In the project, professional BIM technology was adopted throughout the whole process, from design to construction. Its assembly rate is 96.8%, which is a leading position in China. It is a national AAA-grade assembly building and three-star green building, and is also a 2019 Ministry of Housing and Construction assembly building technology demonstration project. It is depicted in Figure 3.
The building information model (BIM) method can help to make environmentally sustainable decisions, in order to reduce the energy waste in projects [53]. China has demonstrated a good practice of using BIM to reduce carbon emissions [22,54]. Combined with the BIMLCA method, the error in statistical process can be reduced [55]. Some scholars have developed a new tool, pycab, based on BIM, which can directly calculate the implied carbon of buildings in the design stage [56]. In this study, the BIM inventory tool is used to obtain statistics and conduct proof-reading of case materials, including concrete and reinforced concrete works, metal structure works, roofing and waterproofing works, heat insulation and anti-corrosion works, painting and fuel framing works, and some supplementary list works, as detailed in Table 5.
In order to collect accurate process data on and off the B1 building site, the author solicited the help and cooperation of the EPC, designers, suppliers, and other stakeholders, aided by a breakdown of the BIM model. Process data were collected from multiple sources, after interviews and field surveys with the aforementioned individuals. The concrete and reinforced concrete works in this project were non-prefabricated works, while the rest of the works were prefabricated. The main aspects of the building are summarized according to the list of the specific parts used in the project
The amount of materials used in the main part of the building are summarized, according to the specific parts in the project, and on-site energy consumption data were compiled through on-site construction energy consumption records. The data for the construction phase were mainly obtained from the design plans and test data provided by the design institute, and the data and materials were provided by the prefabricated project. The main purpose of this study is to compare the carbon emissions of prefabricated and non-prefabricated building projects. The prefabricated components of the factory mainly comprise structural and envelope components, while other practices, such as electromechanical, finishes, and decoration, are basically the same as those of non-prefabricated buildings; therefore, we excluded these parts to facilitate the calculation and reduce the workload.

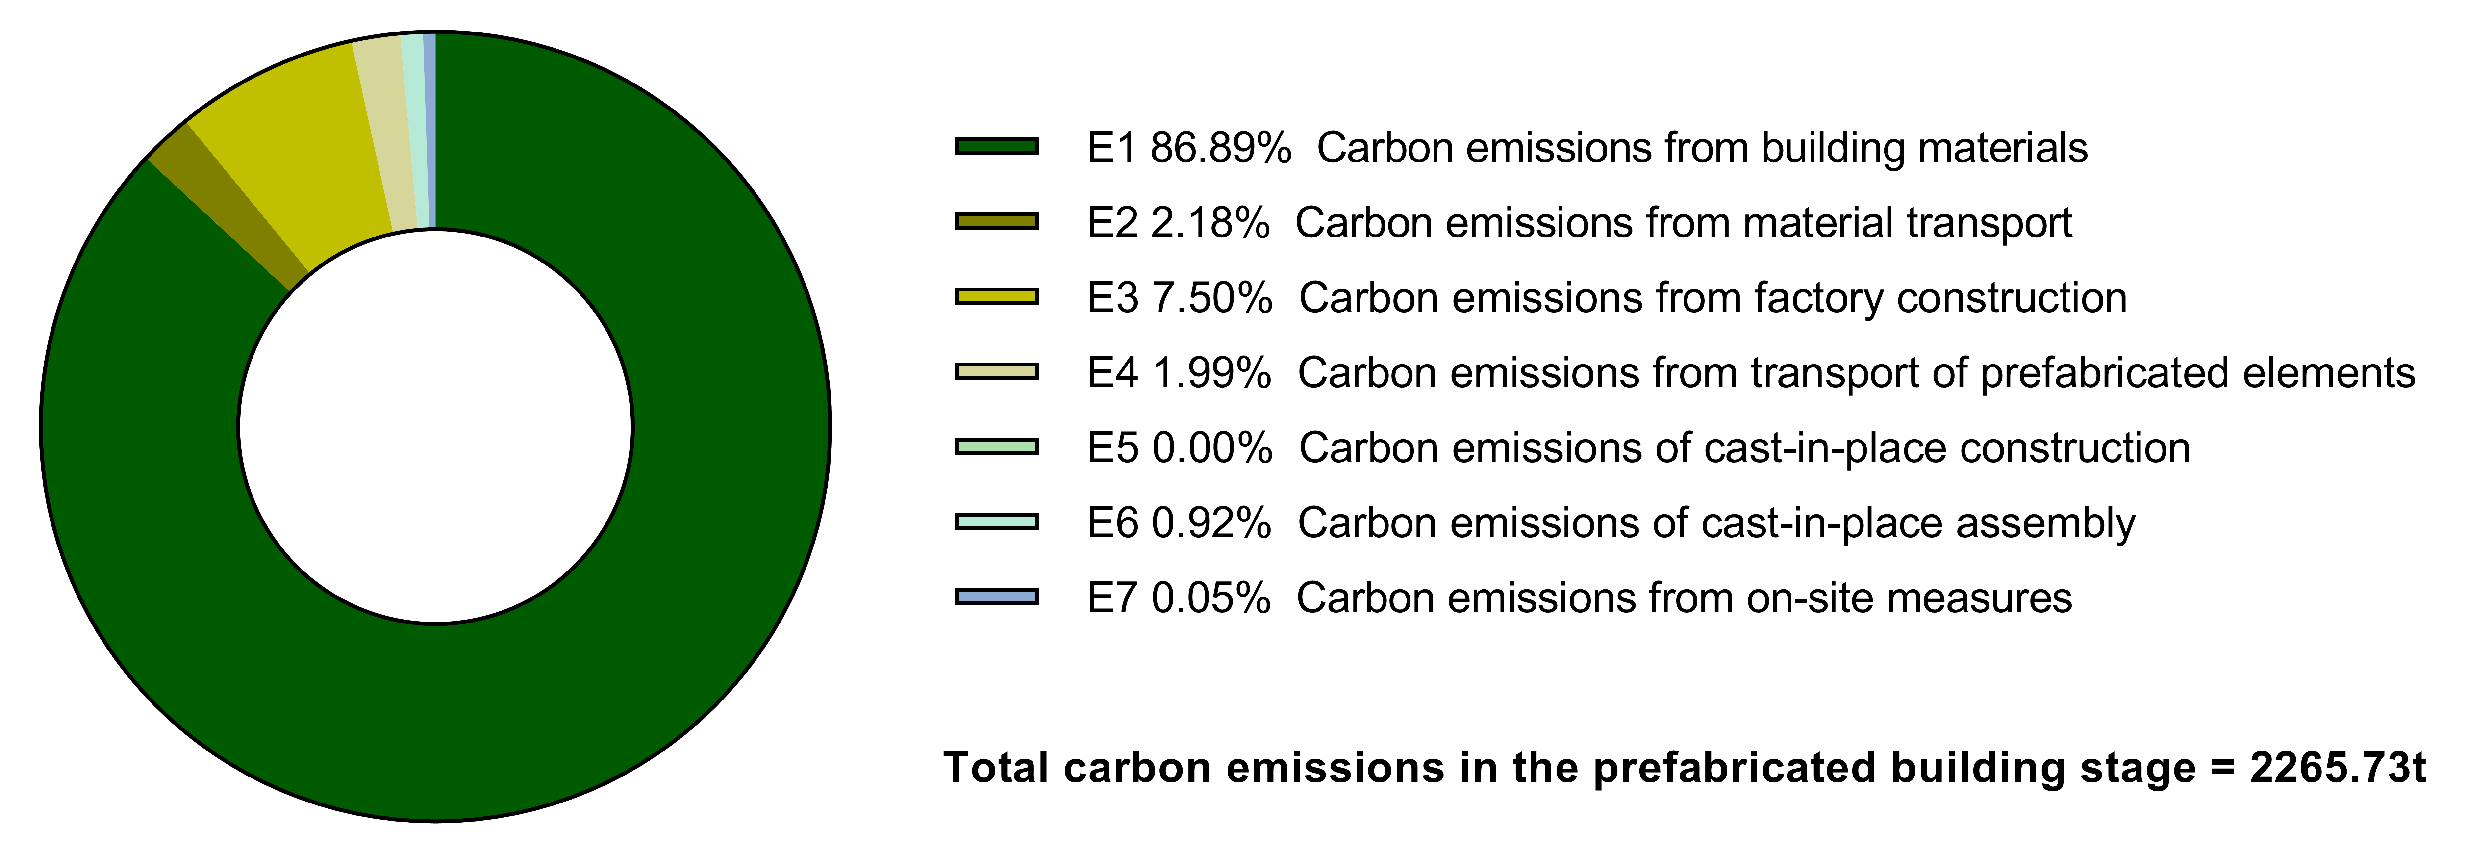
3.1. Calculation of Carbon Emissions during the Production and Construction Phase of the B1 Building

The carbon emission calculation for the production building phase of the B1 building consists of four components: off-site carbon emissions (E1) calculation, off-site carbon emissions (E2) calculation, transportation carbon emissions (E3 and E4) and on-site carbon emissions calculation (E5, E6, E7).

3.1.1. Off-Site Carbon Emissions (E1) Calculation

The B1 building consumed a wide range of building materials, and the calculations in this study focus on 17 major building materials. The total amount of all construction materials was summarized from the project list, and the total carbon emissions of the construction materials were calculated by matching the carbon emissions factors of corresponding materials (Table 6).

3.1.2. Off-Site Carbon Emissions (E2) Calculation

According to the above calculation model, the carbon emissions in the prefabrication stage of the plant are mainly generated through the consumption of labor, fuel, electricity, water, and building materials, and each part of the plant processing line generates different carbon emissions; take the production line of PEC columns as an example, as shown in Figure 4. We conducted a carbon emissions calculation regarding the prefabrication stage of this study, based on plant survey visits and reliable data obtained from the plant.
(1) Calculation of electricity consumption of prefabricated components
Based on the factory survey, the factory production line was calculated based on a one-shift system with 8 h per shift and 250 working days, and the corresponding electricity, water, and natural gas consumption data were collected, as detailed in Table 7.
At present, there are several production lines in the Green Building Group factory, and the annual output and price of each production line were provided by the factory, together with the total installed power of each production line. The total installed power can be divided by the total power of the factory to obtain a production line power consumption ratio H j . It is difficult to record the electricity consumption of a single component in the production process, as the factory only records annual statistics of electricity consumption, which includes both production and domestic electricity. Therefore, we assumed that the consumption of water, electricity, labor, and auxiliary materials for the precast component production line was positively correlated with the production line output; for example, prefabricated cellular beams corresponding to the factory steel component production line. Under this assumption, we calculated the ratio Q i of prefabricated components in Building B1 to the annual output value of the corresponding factory production line, and used this value to indicate the share of prefabricated components in the total production line. In this way, the power, labor, and water consumption of the prefabricated components could be derived from the total power, total labor, and total water consumption, along with the share of prefabricated components in the production line. The total power consumption of prefabricated components in the factory process is detailed in Table 8 and Table 9. It should be noted that the prefabricated components were not produced by one manufacturer, and the decorative integrated ALC panels were purchased from Green Building Group; as the data of the purchasing company were not convenient to obtain, we adopted the existing research results instead. The carbon emissions factor of the prefabrication process of interior wall panels was taken as 637.0028 kgCO 2 e/m 3 [57].
(2) Water consumption and labor calculation for prefabricated components
There was no process wastewater generated during the production process in the project, and the wastewater mainly comes from the domestic sewage of workers. According to the survey, there are 700 people working in the Green Building Group factory, including 440 people in the steel structure production line, 120 people in the PC production line, 70 people in the door and window assembly line, and the remaining 70 people are management personnel. The living water consumption of the residential staff was taken as 175 L per person. The total water consumption of the project was 160 t/d, assuming a one-shift system with 8 h per shift and 360 working days. The calculation is shown in the following Table 10 and Table 11.
(3) Calculation of natural gas use for prefabricated components
According to the factory investigation, the hot water from the gas boilers set up in the Green Building Group factory campus enters the radiators of each workshop and the attached rooms for heating through a pipe network. The heating pipes for each workshop and attached rooms are buried underground. The heating temperature of workshops and auxiliary rooms is controlled at 14–18 ° C. Assuming that the temperature is uniformly distributed inside each space and that each production line workshop is relatively independent, the annual gas consumption of each production line can be derived from the ratio of workshop area to total factory area S i . The calculation is detailed in the following Table 12.
(4) Calculation of auxiliary materials for prefabricated components
The raw and auxiliary materials in the prefabrication process mainly include welding materials, polyurethane glass sealant, butyl rubber for insulating glass, neutral silicone glass glue, and so on. According to the factory survey, the annual consumption of raw and auxiliary materials in each production line of the factory is known, and the total consumption of raw and auxiliary materials of prefabricated components in Building B1 can be obtained through the correspondence between prefabricated components in Building B1 and factory processing; see Table 13 for the specific calculation. In this study, the raw and auxiliary materials mainly consider the recycling of shaped steel, steel bars, and glass, while other materials are not included in the calculation due to their small dosage range.
In summary, E3 could be calculated as
E 3 = E p i + T p i + W p i + N p i + F p i = 169.90 tCO 2 e

3.1.3. Calculation of Transportation Carbon Emissions (E3 and E4)

According to the analysis of the above calculation model, the carbon emissions for the transportation stage were mainly divided into non-prefabricated materials and prefabricated components transported to and from the factory, where the transportation method uses heavy-duty gasoline trucks for transport (10–18 t). The distance of Building B1 from the Green Building Group was taken as 63 km, according to Google Maps, and the carbon emissions of the transportation process E2 and E4 were calculated as shown in Table 14 and Table 15. Overall, the total carbon emissions associated to transportation were 94.67 tCO 2 e

3.1.4. On-Site Carbon Emissions Calculation

The time period for carbon emissions calculation at the site phase was from the start of the project to the completion and acceptance of the project. The site construction profile was known, according to the investigation of the component works list; for example, the ALC strip panel wall was a 220 thick prefabricated lightweight strip internal wall panel, the wall masonry mortar was pre-mixed mortar with capacity weight ≤ 8.0 kN/m 3 , the solid web steel column was prefabricated semi-parcel welded H-beam-concrete frame column, and the concrete strength grade was C30. The calculation process is detailed in the table below. The sum of the total carbon emissions of all activities in the site construction phase was 32.41 t, and the planar carbon emissions per unit was 4.05 kg/m 2 , accounting for 1.3% of the carbon emissions of the whole production and construction phase. Among the values, E5 was 0.07 tkgCO 2 e, accounting for 0.2% of the total carbon emissions of the construction site; E6 was 20.92 t, accounting for 65.4%; and E7 was 11.42 tkgCO 2 e, accounting for 34.4%. The specific calculation is detailed in Table 16.
After the above analysis and calculation, the total carbon emissions in the production and construction phase of Building B1 were obtained, as follows:
C z = E 1 + E 2 + E 3 + E 4 + E 5 + E 6 + E 7 = 2265.73 tCO 2 e
V C z = 2265.73 / 8888 = 0.283 tCO 2 / m 2 = 255 kgCO 2 e / m 2
where C z is the total carbon emissions for the materialization stage of B1, and V C z is the carbon emissions per unit area for the materialization stage of B1. A total of 86.9% of the carbon emissions were for building materials, thus accounting for most of the carbon emission; 4.2% of the carbon emissions were for the transportation stage; 7.5% of the carbon emissions were for factory prefabrication and processing; and 1.4% of the carbon emissions were for the construction site.

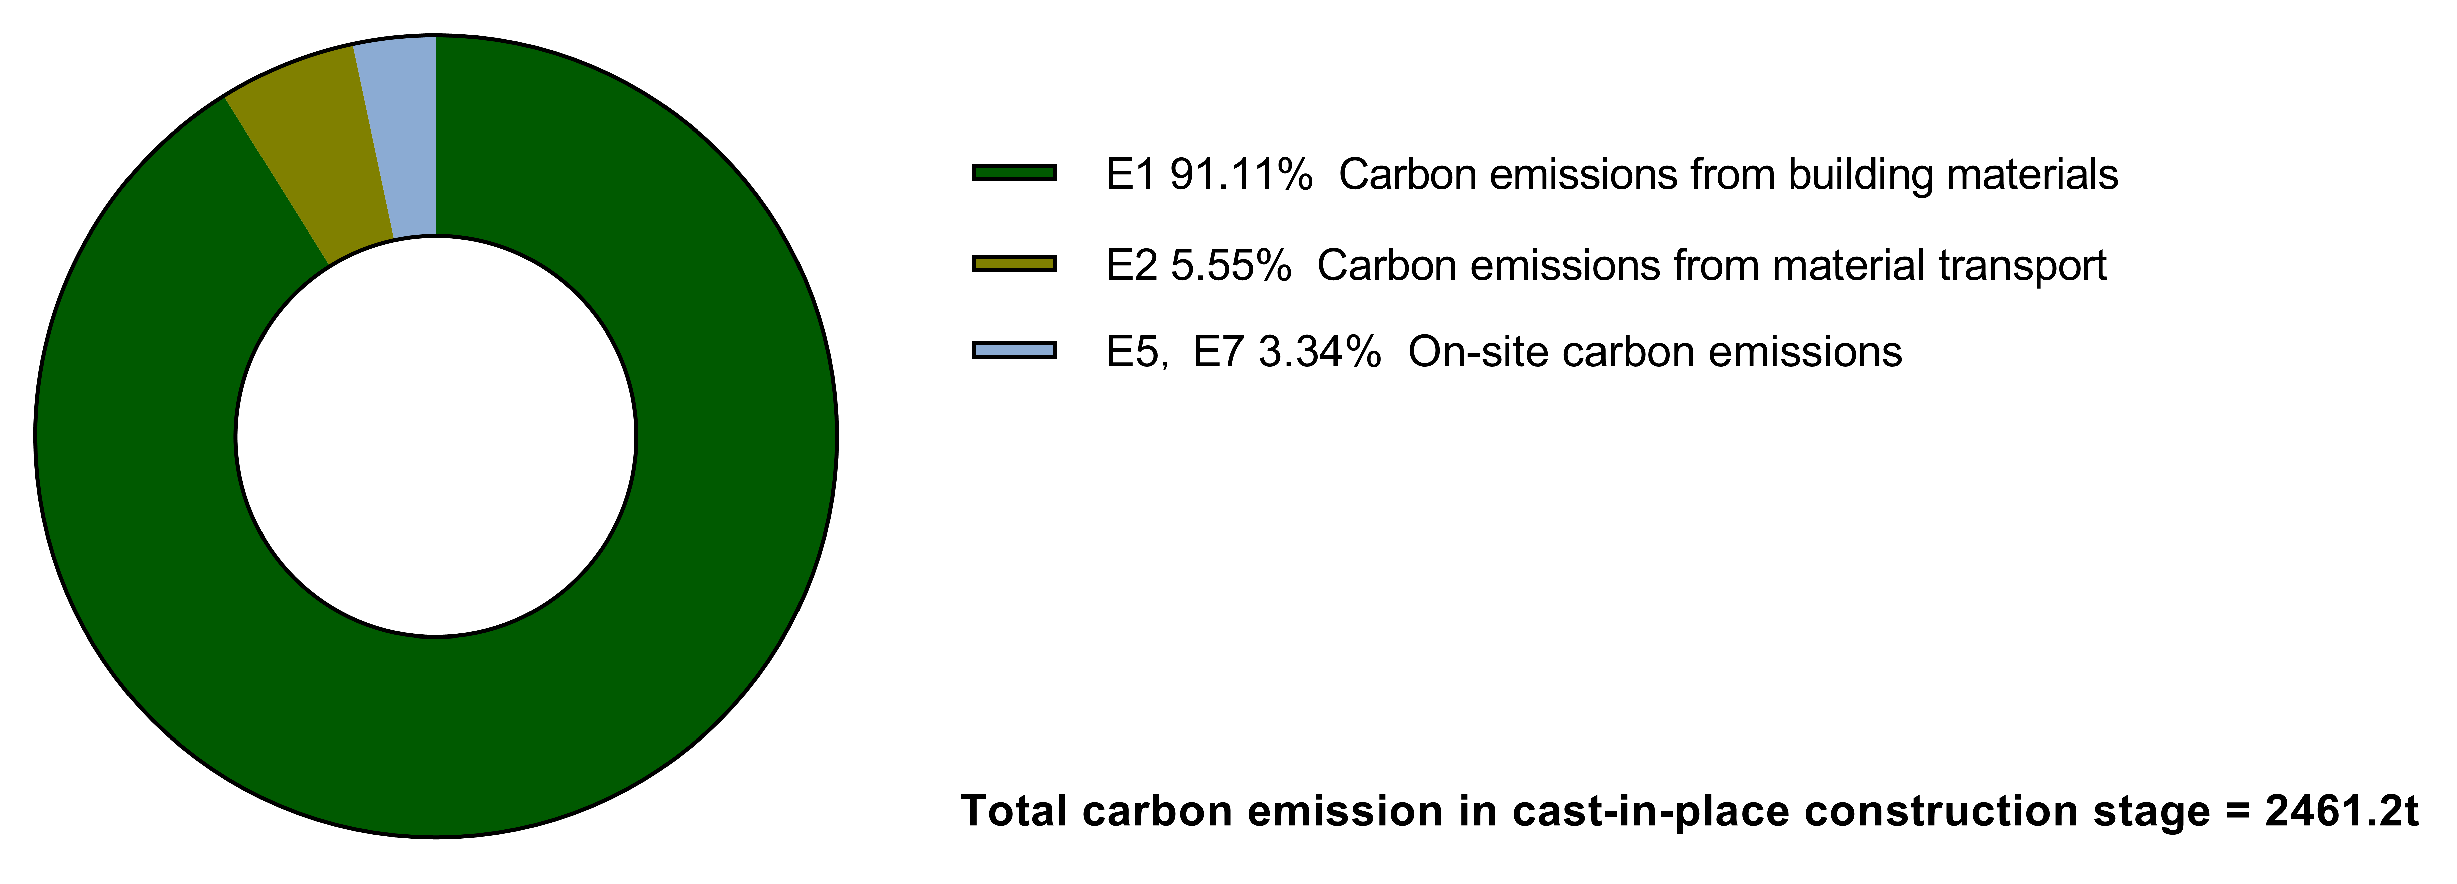
3.2. Calculation of Carbon Emissions in the Production and Construction Phase of the Non-Prefabricated Simulation of Building B1

Compared with prefabricated buildings, the main difference of non-prefabricated buildings is reflected in the main structure and internal wall parts, where the specific materials include steel reinforcement, concrete (including sand, stone, and cement), masonry materials, mortar (including cement and sand), and some admixtures (e.g., admixtures in concrete and mortar). Therefore, in this simulation, we kept the building area, function, and form of the B1 building unchanged. Under these conditions, the main structure and internal wall parts were re-designed by the structural designer as a reference simulated building using the non-prefabricated method of construction; part of the structural design drawings are shown in Figure 5.

3.2.1. Calculation of Carbon Emissions for Materials of B1 Building in the Non-Prefabricated Simulation

Considering the waste of materials such as rework on site, the amount of material work for the building structure was multiplied by a factor of 1.1, according to the experience of structural engineers, and the amount of work was calculated as shown in Table 17, where the total carbon emissions associated to building materials was 2242.50 tCO 2 e.

3.2.2. Carbon Emissions Calculation for the Transport Phase of Building B1 in the Non-Prefabricated Simulation

The carbon emissions in the transportation phase of the reference building were 136.59 tCO 2 e, as calculated in the following Table 18:

3.2.3. Carbon Emissions Calculation for the Construction Stage of the B1 Building in the Non-Prefabricated Simulation

The construction phase of the B1 building reference building included steel works, commercial concrete works, formwork works, transportation works, and scaffolding works, among others, which involve specific energy consumption and material usage that is difficult to estimate. Therefore, the method for converting the carbon emissions ratio in the non-prefabricated building construction stage was adopted from previous studies. According to analysis of China’s building energy consumption research report, the carbon emissions in the building material stage and building construction stage account for 55.17% and 2.02% of the carbon emissions of the whole building process, respectively; if this is taken as a basis, the carbon emissions of the B1 building, with reference to the building construction stage, would be 82.11 t. However, the data of China’s building energy consumption research report include both non-prefabricated buildings and prefabricated buildings, as well as regional differences. If we take the same regional buildings as reference, for example, the results of carbon emissions analysis for Qianjiang Century City of Zhejiang University College of Construction and Engineering were 91.53%, 5.08%, and 3.39% for construction materials, transportation, and construction stages, respectively. Keeping the simulated estimated total carbon emissions of construction materials unchanged, a difference of 12.13 t between the standard transportation stage of ZJU Construction (with an error value of −8.8%) was calculated, as detailed in the following Table 19. The difference between the two was not large and, so, we took the calculation result in China’s building energy consumption research standard, and the carbon emissions for the B1 building in the non-prefabricated construction stage were 82.11 t.

4. Results And Discussion

In summary, the total carbon emissions of the non-prefabricated simulated Building B1 were 2462.15 tCO 2 e, with average carbon emissions of 277 kgCO 2 /m 2 , as shown in Figure 6 and Figure 7. Compared with the actual calculation result for Building B1, the total carbon emissions increased by 197.15 tCO 2 e, while the average carbon emission increased by 22 kgCO 2 e/m 2 .

4.1. Comparison of Off-Site Carbon Emissions for B1 Building

The off-site carbon emissions under the precast method for B1 building of were 103.85 t less than those under the non-prefabricated method. First, at the material level, the E1 under the precast method in B1 building were 273.75 t less than those under the non-prefabricated method, as shown in Figure 8. Second, at the design level, B1 building assembly design was conducted using BIM forward design technology, architecture, structure, equipment, interior, lighting, landscape, curtain wall, and other disciplines, based on the BIM model, as well as decorative structural integration of design, indoor, and ceilings, in order to optimize the overall material consumption. Third, at the technical level, we developed a B1 building structural system using UAD and construction units jointly developed by the “partially filled-concrete frame structure” (PEC) system, through a reasonable combination between concrete and steel members, in order to reduce the cross-sectional area of members. Fourth, the non-prefabricated method utilized a larger amount of materials, such as in the building of a concrete floor structural layer, which requires cement mortar leveling and fine stone concrete smoothing, while shale brick walls require cement–lime plaster priming, leveling, and a paint finish, and so on.
Notably, the carbon emissions (E2) relating to the prefabrication stage exist only in terms of the prefabrication method. The total carbon emissions of all prefabricated components in factory processing were calculated to be 142.49 t for electricity consumption, 4.55 t for total water consumption, 6.05 t for project labor, 9.18 t for natural gas in prefabrication processes, and 7.63 t for auxiliary materials (total, 169.90 t). Among the above, the largest carbon emissions were associated to electricity consumption (84%), followed by natural gas (5%), while the least relative carbon emissions came from water consumption, auxiliary material and labor (4%, 4%, and 3%, respectively), as shown in the Figure 9 below.

4.2. Comparison of Carbon Emissions in the Transportation Phase of Building B1

The carbon emissions associated with the prefabricated method in the transportation phase were 42.66 t lower, when compared to those under the reference building. The main reason for this is that the different construction methods affect the quality of the building materials and the transportation distance in the transportation phase, as shown in Figure 10. The prefabricated method itself requires transporting the building materials from the original material manufacturer to the prefabrication factory first, while the non-prefabricated method only needs transport from the material factory to the project base, such that, in the former, the increased transport distance will lead to higher carbon emissions with the same building materials; however, the reference building in this study, using the non-prefabricated method, requires a greatly increased amount of materials used for the same design. Ultimately, the impact of increased mass overshadows the impact of reduced distance.

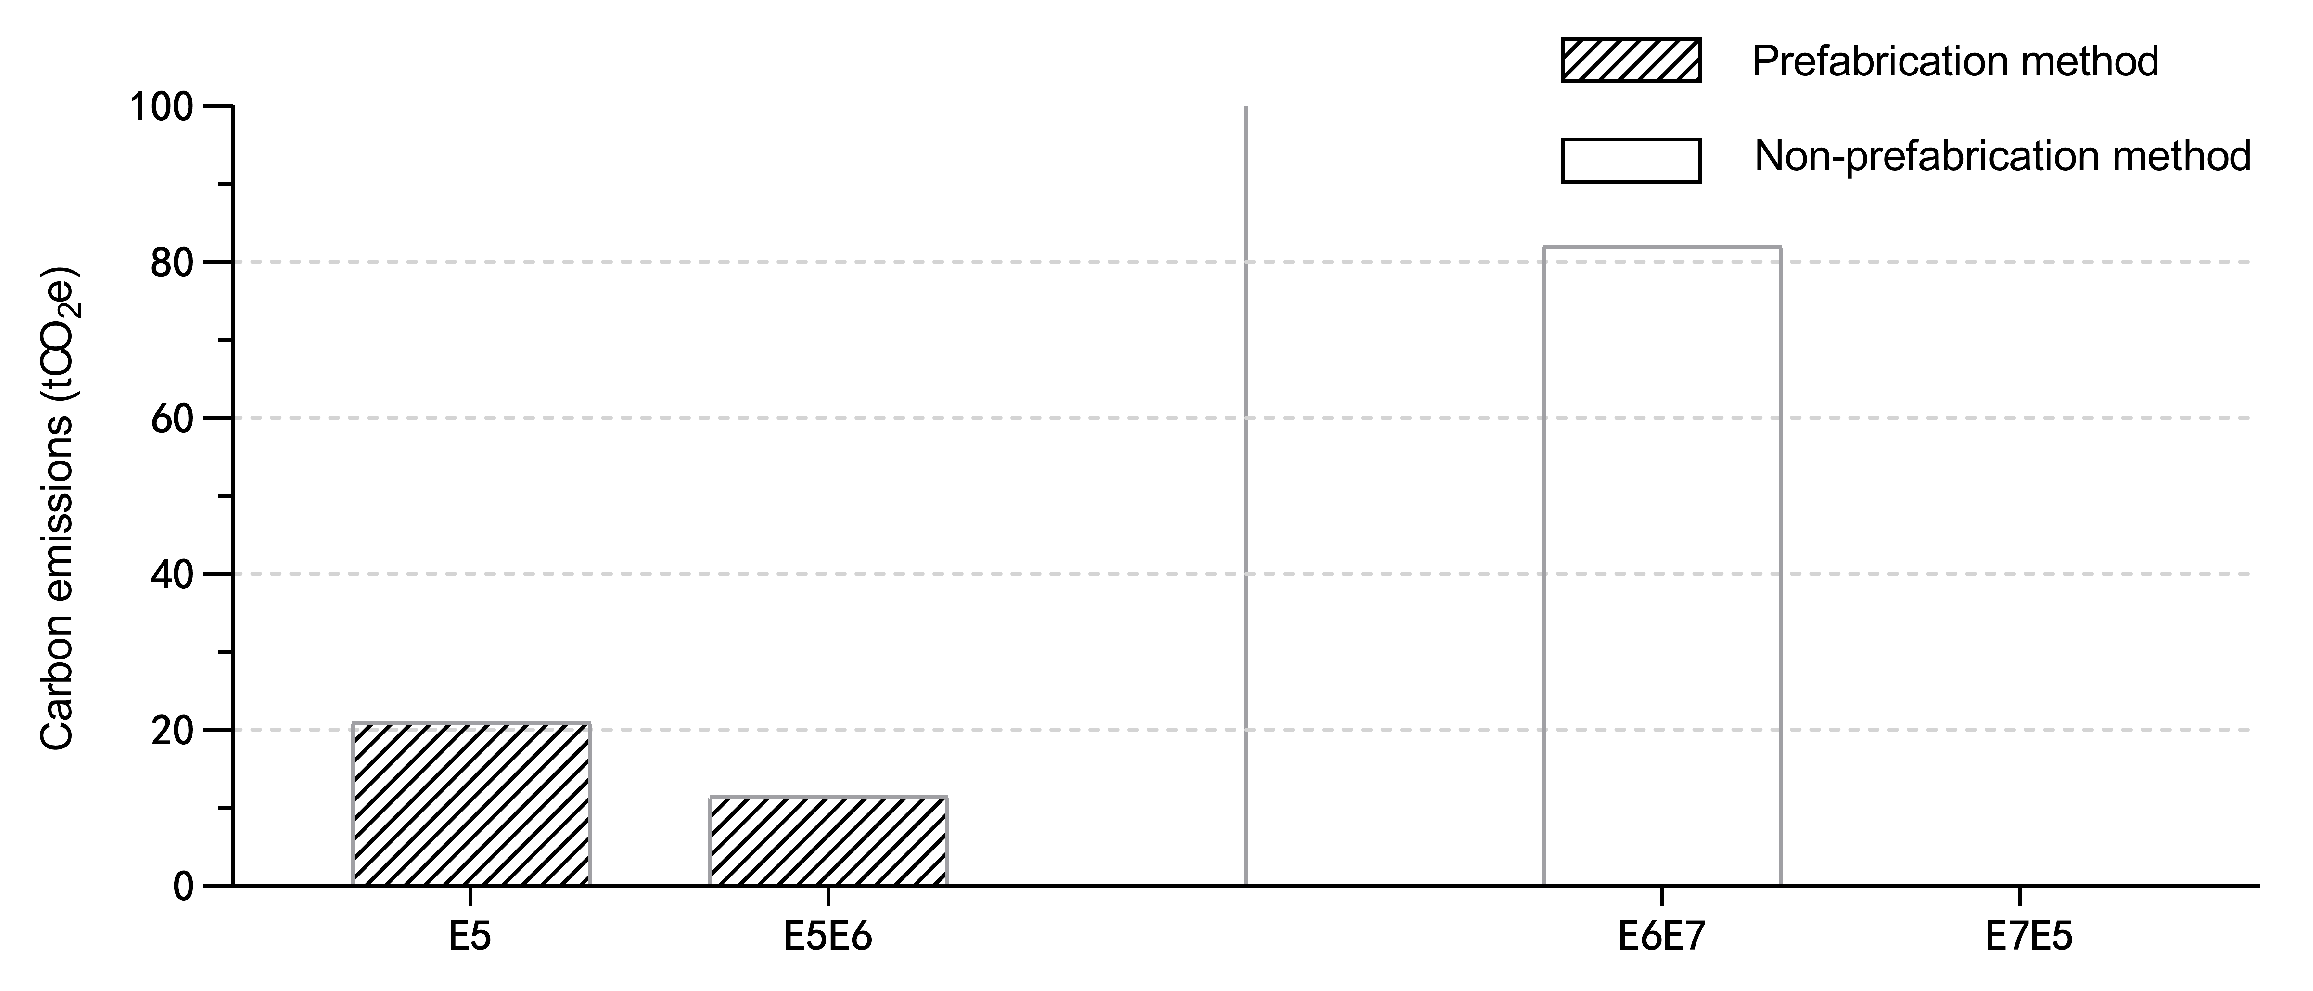
4.3. Comparison of Carbon Emissions in the B1 Building Site

The on-site phase of the B1 building emitted 50.65 t less carbon than the reference building, as shown in Figure 11. The main reason for this is that the B1 building is nearly 100% prefabricated and the on-site assembly work takes up most of the on-site activities, while fabrication construction activities are minimal. Prefabricated assembly can save construction time while improving construction quality and efficiency. The B1 building design planned for site construction to start on 15 October 2019, with the main body and exterior walls completed on 15 December 2019, and the completion and acceptance completed by 30 May 2020, taking less than 8 months in total, greatly reducing the time for site construction. As a result, the total consumption of water and electricity, gasoline and diesel, and labor was reduced significantly.

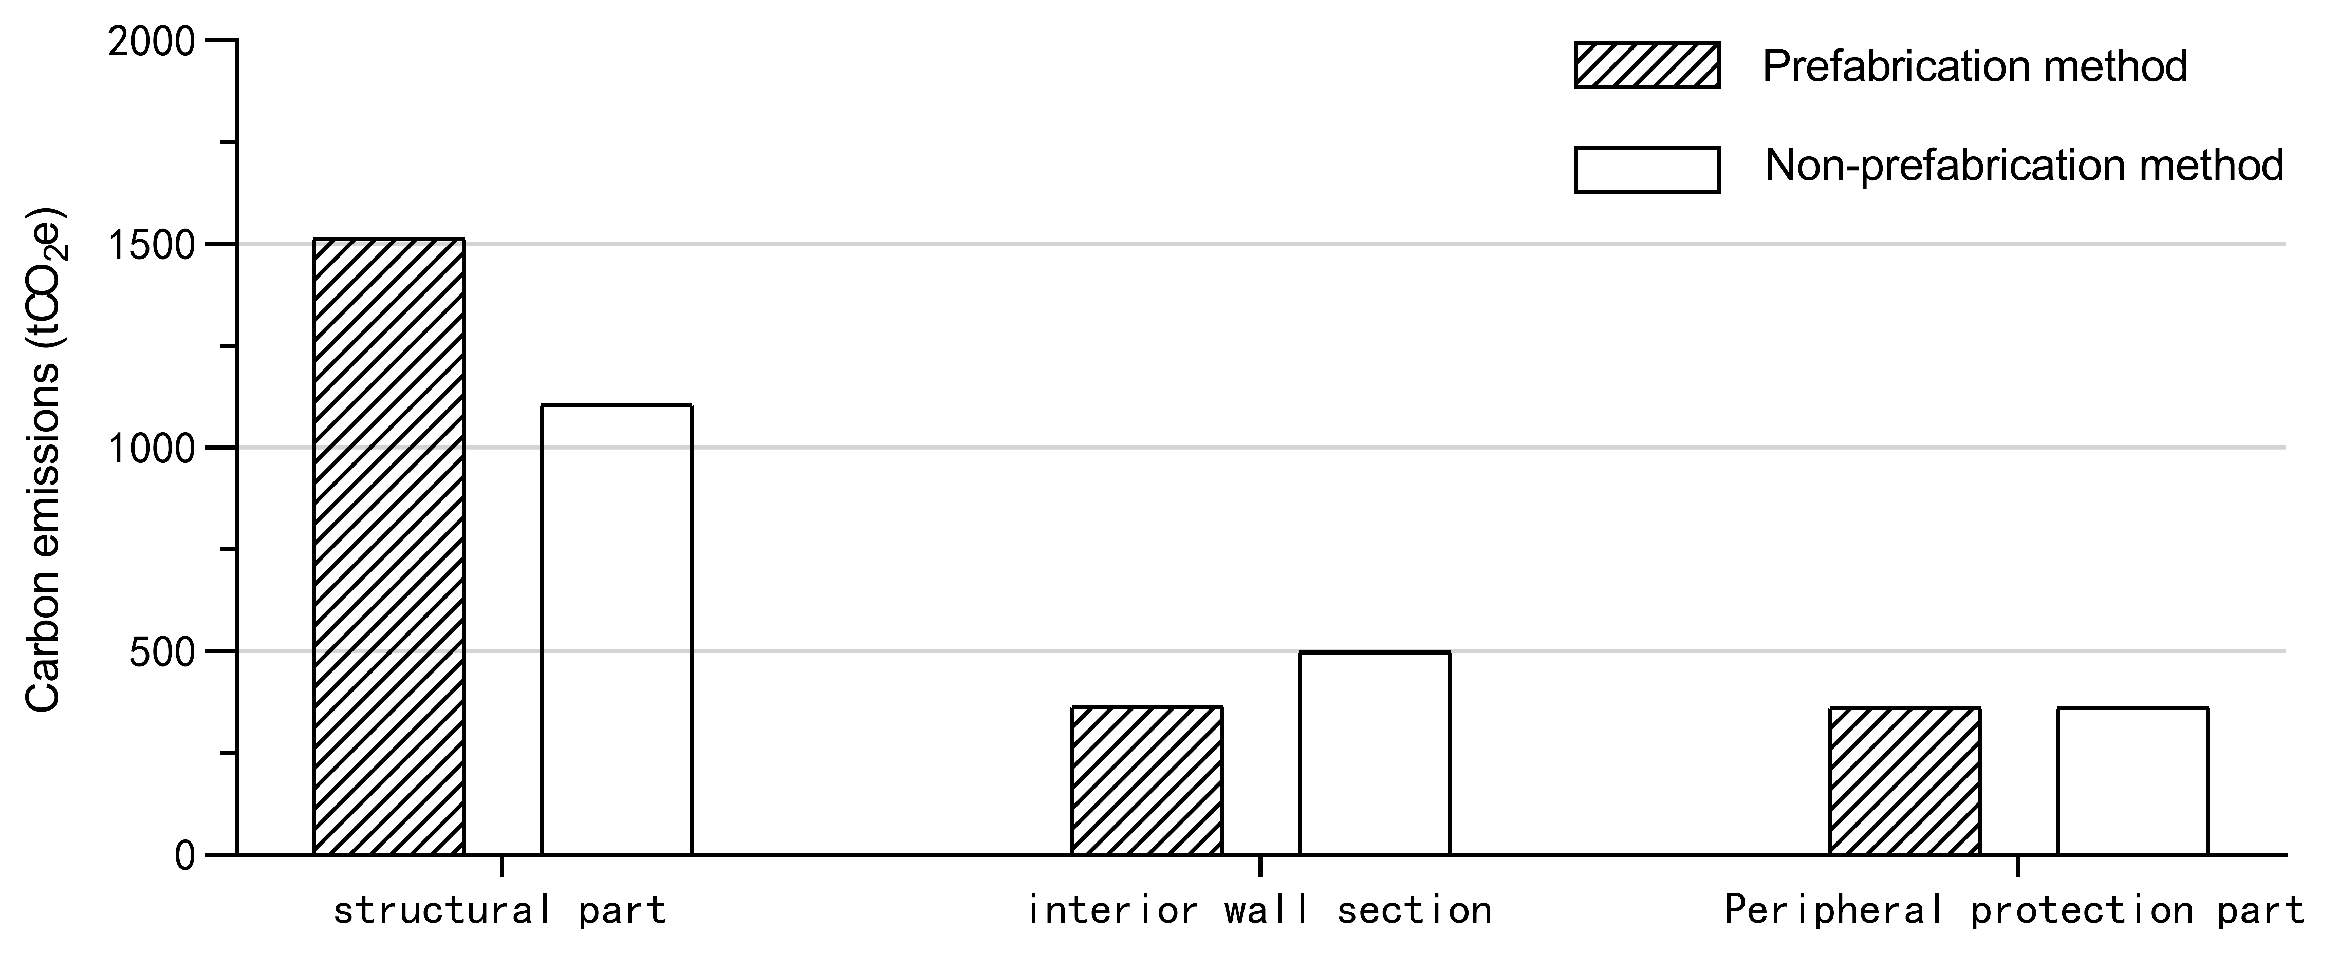
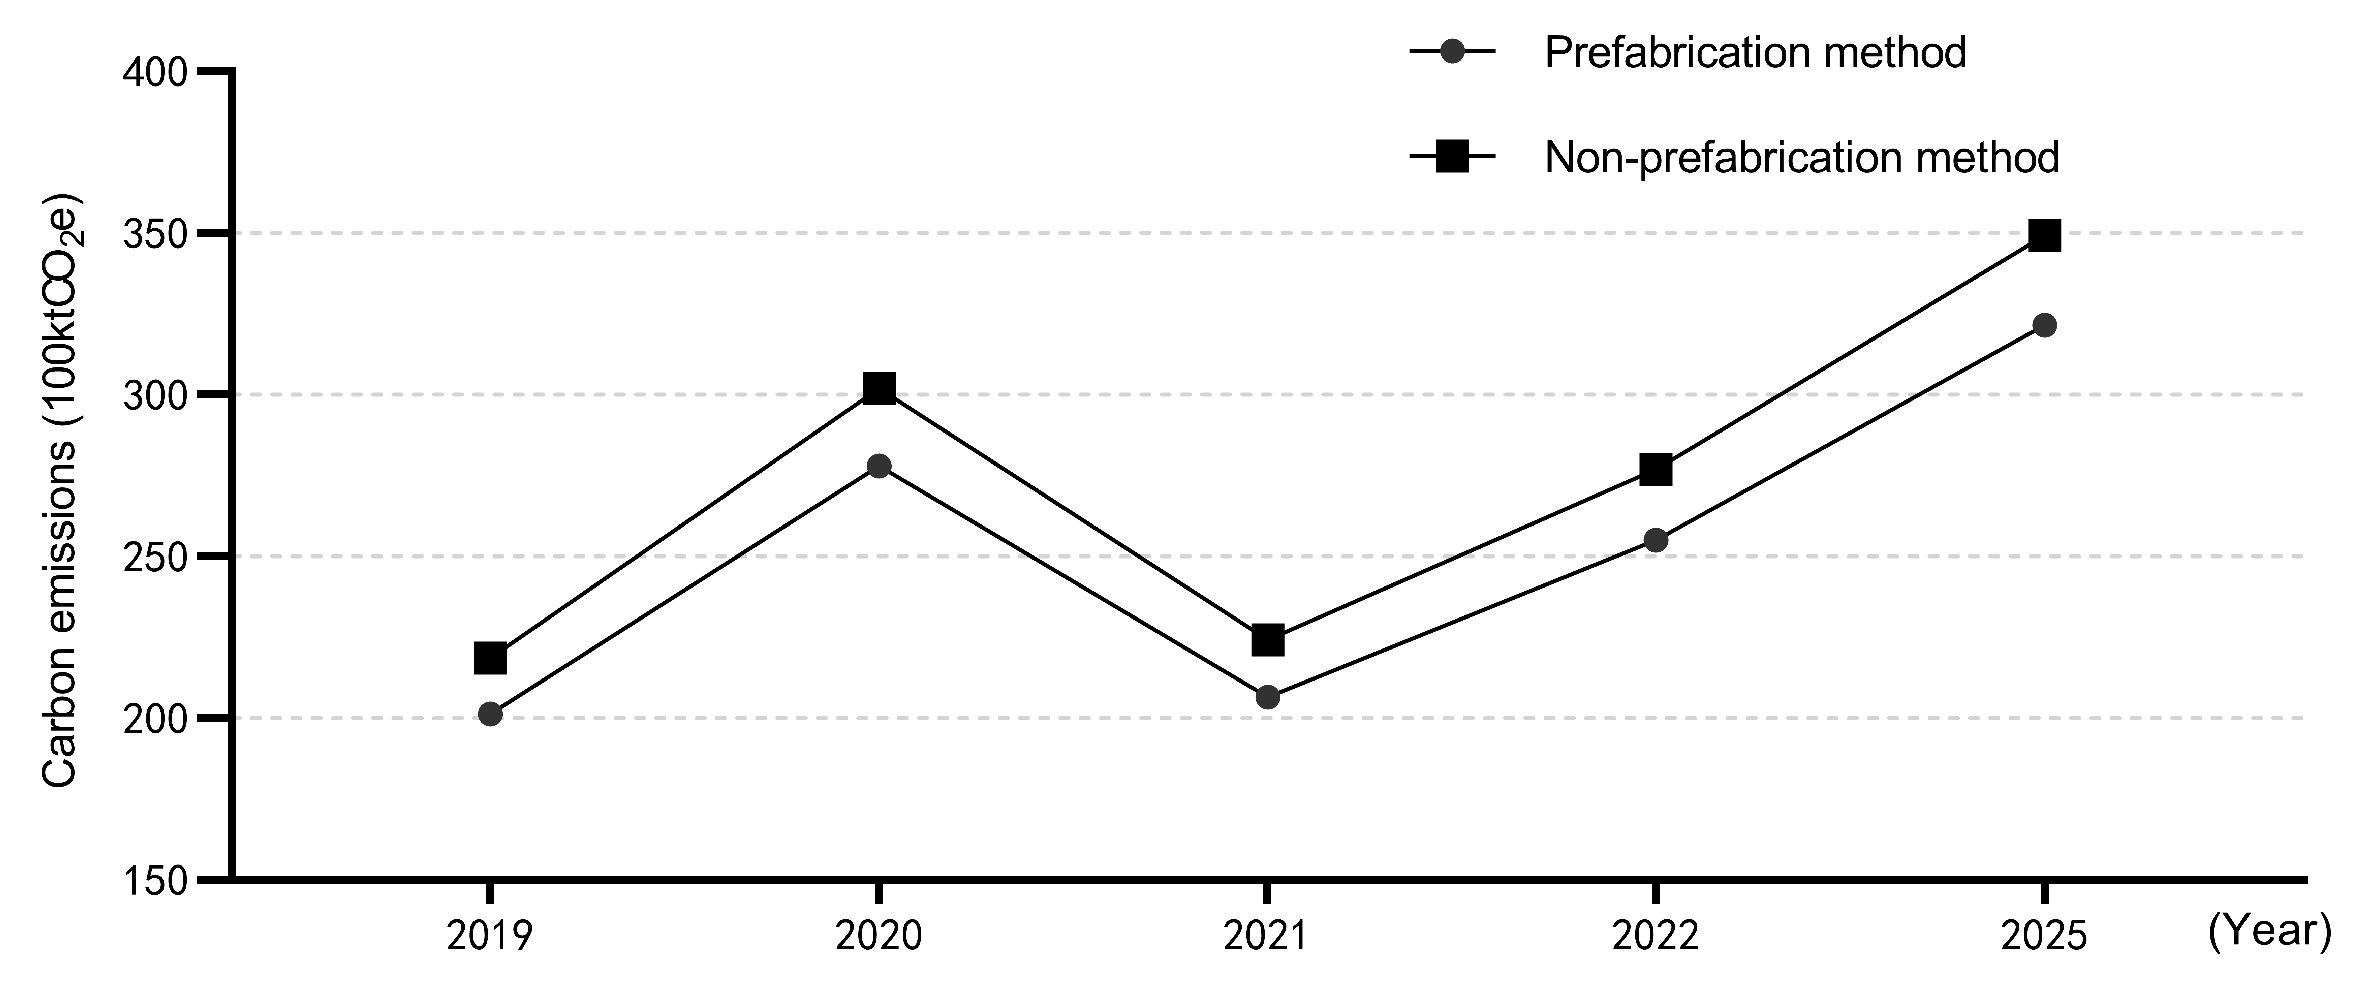
4.4. Analysis of the Technical Contribution of the B1 Building

The above B1 building method can be used to evaluate the carbon reduction associated to new buildings in the future. The new prefabricated construction area in Zhejiang Province reached 78.95 million square meters in 2019, accounting for 18.9% of the new prefabricated construction area in the country, and the new prefabricated office buildings in Zhejiang Province are expected to occupy 0.0378 billion square meters per year as shown in the Figure 12, according to this standard. Compared with the non-prefabricated method, the measured carbon emissions standard of Building B1 can allow for 531,090 tons of carbon emissions per year to be saved, thus saving nearly 5 million tons of carbon emissions by 2030.

5. Conclusions

Under the background of carbon neutrality, China is in a period of vigorously developing prefabricated buildings. However, due to the problems of high cost, lagging production line, and poor water leakage and sound insulation, prefabricated buildings are not yet widely accepted, and their promotion is delayed at this stage. The carbon reduction effect shown in our research result is conducive to enhancing the public’s perception of prefabricated buildings. At the same time, designers can clearly understand the carbon emissions sources in the production and construction process, which is beneficial for control of the carbon emissions in the early design of buildings.
In this study, we investigated the difference in carbon emissions between two construction methods for Building B1 using a life-cycle boundary from cradle to end of construction. The results indicated that the physical phase of the prefabricated office building, with a high assembly rate, can significantly reduce the amount of carbon emissions: the total carbon emissions under the prefabricated construction method of the B1 building were 2265.73 tCO 2 e, which was 22 kgCO 2 e/m 2 less, when compared to the reference construction using the non-prefabricated method. The off-site part of the carbon emissions was reduced by 12.9 kgCO 2 e/m 2 , the transportation stage was reduced by 4.8 kgCO 2 e/m 2 , and the on-site part was reduced by 5.7 kgCO 2 e /m 2 . The reductions in carbon emissions are mainly due to the reduction in carbon emissions of building materials, including the advantages of steel, the good use of BIM design technology to avoid material waste, and the prefabricated system itself. Second, the carbon emissions reduction can be attributed to the on-site assembly construction, as prefabricated assembly can save construction time and improve construction quality and efficiency, such that the corresponding total consumption of water and electricity, gasoline and diesel, and labor is greatly reduced. In the future development of China’s construction industry, through their whole life-cycle, prefabricated buildings can bring a lot of carbon emissions reduction benefits, and the implementation of prefabricated office buildings with PEC structure systems can effectively reduce carbon emissions and help China to achieve carbon-neutral and carbon peak goals as soon as possible.
Finally, there were some limitations to this study. The research results demonstrated that the carbon emissions associated with steel and concrete accounted for a large proportion, and the emissions reduction was really caused by prefabrication or the change of materials. However, we firmly believe that prefabrication can bring about carbon emissions reduction, and enhancement of the industrialization degree of prefabrication processes will also allow for the saving of raw materials. In other words, different construction processes and methods will bring about different quantities of raw materials. In addition, we did not compare the demolition stages of the B1 building, but the recovery rate of B1 building may be as high as 18% [58], in terms of the greenhouse gases produced by materials. Therefore, in the follow-up research, we intend to continue to study how much carbon emissions reduction can be achieved through the use of prefabricated steel structures, compared with steel structures built on-site, as well as visual analysis of carbon emissions in the operational stage of prefabricated public buildings using BIM technology. In the future, we also plan to investigate more real cases. Future research will continue to investigate office buildings with an assembly rate of about 60%, as well as the demolition stage of buildings, in order to further explore the possibility of carbon emissions reductions through prefabricated buildings.

Author Contributions

Conceptualization, Z.M., T.G. and J.Q.; Data curation, T.G.; Formal analysis, T.G.; Methodology, Z.M., T.G., G.C. and W.J.; Project administration, Z.M.; Resources, Z.M. and W.J.; Software, T.G.; Supervision, Z.M. and G.C.; Validation, Z.C.; Visualization, Z.M., T.G. and Z.C.; Writing—original draft, T.G.; Writing—review and editing, Z.M., T.G., J.Q. and G.C. All authors have read and agreed to the published version of the manuscript.

Funding

This research was Funded by Center for Balance Architecture, Zhejiang University; Zhejiang Provincial Construction Research Project, grant number 2021K035; Zhejiang Provincial Construction Research Project, grant number 2021K131.

Data Availability Statement

Not applicable.

Acknowledgments

We would like to express our sincere gratitude to Zhejiang University Architectural Design and Research Institute Co. We also thank all members of the research team for their valuable contributions. For data collection, the authors would like to express their heartfelt thanks to Jiantao Weng of Zhejiang University, Guangming Qin of Green Building Group, and Haijun Chen of EPC for their help; for structural simulation calculations, the authors would like to express their heartfelt thanks to Zhang Shenbin, structural designer of Zhejiang University Institute of Architectural Design.

Conflicts of Interest

The authors declare no conflict of interest.

References

  1. IPCC. Climate Change 2013: The Physical Science Basis. Contribution of Working Group I to the fifth Assessment Report of the Intergovernmental Panel on Climate Change; Cambridge University Press: Cambridge, UK; New York, NY, USA, 2013; p. 1535. [Google Scholar]
  2. United Nations; World Water Assessment Programme UNESCO; UN-Water. Facing the Challenges: Case Studies and Indicators: UNESCO’s Contribution to the United Nations World Water Development Report 2015; UNESCO Publishing: Paris, France, 2015. [Google Scholar]
  3. Rubio-Bellido, C.; Pulido-Arcas, J.A.; Cabeza-Lainez, J.M. Adaptation strategies and resilience to climate change of historic dwellings. Sustainability 2015, 7, 3695–3713. [Google Scholar] [CrossRef] [Green Version]
  4. Hu, S.; Jiang, Y.; Yan, D. China Building Energy Use and Carbon Emission Yearbook 2021: A Roadmap to Carbon Neutrality by 2060; Springer Nature: Berlin/Heidelberg, Germany, 2022. [Google Scholar]
  5. Mao, C.; Shen, Q.; Shen, L.; Tang, L. Comparative study of greenhouse gas emissions between off-site prefabrication and conventional construction methods: Two case studies of residential projects. Energy Build. 2013, 66, 165–176. [Google Scholar] [CrossRef] [Green Version]
  6. RICS (Royal Institution of Chartered Surveyors). Whole Life Carbon Assessment for the Built Environment; RICS: London, UK, 2017. [Google Scholar]
  7. Robati, M.; Oldfield, P.; Nezhad, A.A.; Carmichael, D.G.; Kuru, A. Carbon value engineering: A framework for integrating embodied carbon and cost reduction strategies in building design. Build. Environ. 2021, 192, 107620. [Google Scholar] [CrossRef]
  8. Wu, H.J.; Yuan, Z.W.; Zhang, L.; Bi, J. Life cycle energy consumption and CO2 emission of an office building in China. Int. J. Life Cycle Assess. 2012, 17, 105–118. [Google Scholar] [CrossRef]
  9. Schmidt, M.; Crawford, R.H.; Warren-Myers, G. Quantifying Australia’s life cycle greenhouse gas emissions for new homes. Energy Build. 2020, 224, 110287. [Google Scholar] [CrossRef]
  10. Guo, R. China Ethnic Statistical Yearbook 2020; Springer Nature: Berlin/Heidelberg, Germany, 2020. [Google Scholar]
  11. Yu, S.; Liu, Y.; Wang, D.; Bahaj, A.S.; Wu, Y.; Liu, J. Review of thermal and environmental performance of prefabricated buildings: Implications to emission reductions in China. Renew. Sustain. Energy Rev. 2021, 137, 110472. [Google Scholar] [CrossRef]
  12. Shahzad, W.; Mbachu, J.; Domingo, N. Prefab content versus cost and time savings in construction projects: A regression analysis. In Proceedings of the 4th New Zealand Built Environment Research Symposium (NZBERS), Auckland, New Zealand, 14 November 2014. [Google Scholar]
  13. Shahzad, W.; Mbachu, J.; Domingo, N. Marginal productivity gained through prefabrication: Case studies of building projects in Auckland. Buildings 2015, 5, 196–208. [Google Scholar] [CrossRef]
  14. Quale, J.; Eckelman, M.J.; Williams, K.W.; Sloditskie, G.; Zimmerman, J.B. Construction matters: Comparing environmental impacts of building modular and conventional homes in the United States. J. Ind. Ecol. 2012, 16, 243–253. [Google Scholar] [CrossRef]
  15. Aye, L.; Ngo, T.; Crawford, R.H.; Gammampila, R.; Mendis, P. Life cycle greenhouse gas emissions and energy analysis of prefabricated reusable building modules. Energy Build. 2012, 47, 159–168. [Google Scholar] [CrossRef]
  16. Dong, Y.H.; Jaillon, L.; Chu, P.; Poon, C.S. Comparing carbon emissions of precast and cast-in-situ construction methods—A case study of high-rise private building. Constr. Build. Mater. 2015, 99, 39–53. [Google Scholar] [CrossRef]
  17. Teng, Y.; Pan, W. Systematic embodied carbon assessment and reduction of prefabricated high-rise public residential buildings in Hong Kong. J. Clean. Prod. 2019, 238, 117791. [Google Scholar] [CrossRef]
  18. Kumanayake, R.; Luo, H.; Paulusz, N. Assessment of material related embodied carbon of an office building in Sri Lanka. Energy Build. 2018, 166, 250–257. [Google Scholar] [CrossRef]
  19. Li, X.J.; Zheng, Y.D. Using LCA to research carbon footprint for precast concrete piles during the building construction stage: A China study. J. Clean. Prod. 2020, 245, 118754. [Google Scholar] [CrossRef]
  20. Xu, K.; Kang, H.; Wang, W.; Jiang, P.; Li, N. Carbon Emission Estimation of Assembled Composite Concrete Beams during Construction. Energies 2021, 14, 1810. [Google Scholar] [CrossRef]
  21. Fang, Y.; Ng, S.T.; Ma, Z.; Li, H. Quota-based carbon tracing model for construction processes in China. J. Clean. Prod. 2018, 200, 657–666. [Google Scholar] [CrossRef]
  22. Li, X.J.; Lai, J.Y.; Ma, C.y.; Wang, C. Using BIM to research carbon footprint during the materialization phase of prefabricated concrete buildings: A China study. J. Clean. Prod. 2021, 279, 123454. [Google Scholar] [CrossRef]
  23. Bonamente, E.; Cotana, F. Carbon and energy footprints of prefabricated industrial buildings: A systematic life cycle assessment analysis. Energies 2015, 8, 12685–12701. [Google Scholar] [CrossRef] [Green Version]
  24. Dabaieh, M.; Heinonen, J.; El-Mahdy, D.; Hassan, D.M. A comparative study of life cycle carbon emissions and embodied energy between sun-dried bricks and fired clay bricks. J. Clean. Prod. 2020, 275, 122998. [Google Scholar] [CrossRef]
  25. Saad, S.; Alaloul, W.S.; Ammad, S.; Qureshi, A.H.; Altaf, M.; Rasheed, K. Design phase carbon emission prediction using a visual programming technique. In Proceedings of the 2020 Second International Sustainability and Resilience Conference: Technology and Innovation in Building Designs (51154), Sakheer, Bahrain, 11–12 November 2020; pp. 1–4. [Google Scholar]
  26. Ding, Z.; Liu, S.; Luo, L.; Liao, L. A building information modeling-based carbon emission measurement system for prefabricated residential buildings during the materialization phase. J. Clean. Prod. 2020, 264, 121728. [Google Scholar] [CrossRef]
  27. Meneghelli, A. Whole-building embodied carbon of a North American LEED-certified library: Sensitivity analysis of the environmental impact of buildings materials. Build. Environ. 2018, 134, 230–241. [Google Scholar] [CrossRef]
  28. Teng, Y.; Pan, W. Estimating and minimizing embodied carbon of prefabricated high-rise residential buildings considering parameter, scenario and model uncertainties. Build. Environ. 2020, 180, 106951. [Google Scholar] [CrossRef]
  29. Mastrucci, A.; Marvuglia, A.; Benetto, E.; Leopold, U. A spatio-temporal life cycle assessment framework for building renovation scenarios at the urban scale. Renew. Sustain. Energy Rev. 2020, 126, 109834. [Google Scholar] [CrossRef] [Green Version]
  30. Luo, L.; Chen, Y. Carbon emission energy management analysis of LCA-Based fabricated building construction. Sustain. Comput. Informatics Syst. 2020, 27, 100405. [Google Scholar] [CrossRef]
  31. Fremouw, M.; Bagaini, A.; De Pascali, P. Energy Potential Mapping: Open Data in Support of Urban Transition Planning. Energies 2020, 13, 1264. [Google Scholar] [CrossRef] [Green Version]
  32. Nastasi, B.; Manfren, M.; Noussan, M. Open data and energy analytics. Energies 2020, 13, 2334. [Google Scholar] [CrossRef]
  33. Nastasi, B.; Manfren, M.; Noussan, M. Open data and models for energy and environment. Energies 2021, 14, 4413. [Google Scholar] [CrossRef]
  34. Klöpffer, W. Life cycle assessment. Environ. Sci. Pollut. Res. 1997, 4, 223–228. [Google Scholar] [CrossRef]
  35. Lenzen, M. Errors in conventional and Input-Output—based Life—Cycle inventories. J. Ind. Ecol. 2000, 4, 127–148. [Google Scholar] [CrossRef]
  36. Treloar, G.J. Extracting embodied energy paths from input–output tables: Towards an input–output-based hybrid energy analysis method. Econ. Syst. Res. 1997, 9, 375–391. [Google Scholar] [CrossRef]
  37. Treloar, G.J.; Love, P.E.; Holt, G.D. Using national input/output data for embodied energy analysis of individual residential buildings. Constr. Manag. Econ. 2001, 19, 49–61. [Google Scholar] [CrossRef]
  38. Crawford, R.H. Validation of a hybrid life-cycle inventory analysis method. J. Environ. Manag. 2008, 88, 496–506. [Google Scholar] [CrossRef] [PubMed]
  39. Chen, Y.; Zhou, Y.; Feng, W.; Fang, Y.; Feng, A. Factors That Influence the Quantification of the Embodied Carbon Emission of Prefabricated Buildings: A Systematic Review, Meta-Analysis and the Way Forward. Buildings 2022, 12, 1265. [Google Scholar] [CrossRef]
  40. Wang, J.; Guo, F.; Song, Y.; Liu, Y.; Hu, X.; Yuan, C. Safety risk assessment of prefabricated buildings hoisting construction: Based on IHFACS-ISAM-BN. Buildings 2022, 12, 811. [Google Scholar] [CrossRef]
  41. Yan, H.; Shen, Q.; Fan, L.C.; Wang, Y.; Zhang, L. Greenhouse gas emissions in building construction: A case study of One Peking in Hong Kong. Build. Environ. 2010, 45, 949–955. [Google Scholar] [CrossRef] [Green Version]
  42. ISO 14064-1:2018; Greenhouse Gases—Part 1: Specification with Guidance at the Organization Level for Quantification and Reporting of Greenhouse Gas Emissions and Removals. International Organization for Standardization: Geneva, Switzerland, 2006.
  43. IPCC (Intergovernmental Panel on Climate Change). Guidelines for National Greenhouse Gas Inventories; IPCC: Geneva, Switzerland, 2006; Available online: www.ipcc.ch (accessed on 15 October 2022).
  44. Kumar, P. Building Economics and Construction Management. J. Inst. Eng. Archit. Engg. Div. Kolkata 1999, 78. [Google Scholar]
  45. Andrew, A. Embodied Energy and CO2 Coefficients for NZ Building Materials; Centre for Building Performance Research Report; Centre for Building Performance Research: Wellington, New Zealand, 2003. [Google Scholar]
  46. Chen, T.; Burnett, J.; Chau, C.K. Analysis of embodied energy use in the residential building of Hong Kong. Energy 2001, 26, 323–340. [Google Scholar] [CrossRef]
  47. Adalberth, K. Energy use during the life cycle of buildings: A method. Build. Environ. 1997, 32, 317–320. [Google Scholar] [CrossRef]
  48. Shan, Y.; Liu, J.; Liu, Z.; Xu, X.; Shao, S.; Wang, P.; Guan, D. New provincial CO2 emission inventories in China based on apparent energy consumption data and updated emission factors. Appl. Energy 2016, 184, 742–750. [Google Scholar] [CrossRef] [Green Version]
  49. Liu, Z.; Guan, D.; Wei, W.; Davis, S.J.; Ciais, P.; Bai, J.; Peng, S.; Zhang, Q.; Hubacek, K.; Marland, G.; et al. Reduced carbon emission estimates from fossil fuel combustion and cement production in China. Nature 2015, 524, 335–338. [Google Scholar] [CrossRef] [Green Version]
  50. Shan, Y.; Guan, D.; Zheng, H.; Ou, J.; Li, Y.; Meng, J.; Mi, Z.; Liu, Z.; Zhang, Q. Data descriptor: China CO2 emission accounts 1997–2015. Sci. Data 2018, 5, 170201. [Google Scholar] [CrossRef] [Green Version]
  51. Liu, G.; Gu, T.; Xu, P.; Hong, J.; Shrestha, A.; Martek, I. A production line-based carbon emission assessment model for prefabricated components in China. J. Clean. Prod. 2019, 209, 30–39. [Google Scholar] [CrossRef]
  52. Compiled by National Bureau of Statistics of China. China Energy Statistical Yearbook; Compiled by National Bureau of Statistics of China: Beijing, China, 2016. [Google Scholar]
  53. Khahro, S.H.; Kumar, D.; Siddiqui, F.H.; Ali, T.H.; Raza, M.S.; Khoso, A.R. Optimizing energy use, cost and carbon emission through building information modelling and a sustainability approach: A case-study of a hospital building. Sustainability 2021, 13, 3675. [Google Scholar] [CrossRef]
  54. Liu, Z.; Li, P.; Wang, F.; Osmani, M.; Demian, P. Building Information Modeling (BIM) Driven Carbon Emission Reduction Research: A 14-Year Bibliometric Analysis. Int. J. Environ. Res. Public Health 2022, 19, 12820. [Google Scholar] [CrossRef] [PubMed]
  55. Xu, J.; Teng, Y.; Pan, W.; Zhang, Y. BIM-integrated LCA to automate embodied carbon assessment of prefabricated buildings. J. Clean. Prod. 2022, 374, 133894. [Google Scholar] [CrossRef]
  56. Alwan, Z.; Jones, B.I. IFC-based embodied carbon benchmarking for early design analysis. Autom. Constr. 2022, 142, 104505. [Google Scholar] [CrossRef]
  57. Yang, H.; Chen, J. Carbon emission measurement and analysis of prefabricated components of assembled buildings based on quotas. J. Eng. Manag. 2020, 34, 45–50. [Google Scholar]
  58. Blengini, G.A. Life cycle of buildings, demolition and recycling potential: A case study in Turin, Italy. Build. Environ. 2009, 44, 319–330. [Google Scholar] [CrossRef]
Figure 1. Comparison of assembled and cast-in-place construction processes.
Buildings 13 00053 g001
Figure 2. Carbon emission sources for assembled buildings.
Buildings 13 00053 g002
Figure 3. Real-life photograph of building B1.
Buildings 13 00053 g003
Figure 4. Sources of carbon emissions from concrete frame columns.
Buildings 13 00053 g004
Figure 5. Structural plan layout of reference building.
Buildings 13 00053 g005
Figure 6. B1 building prefabrication method materialization stage carbon emissions.
Buildings 13 00053 g006
Figure 7. B1 building non-prefabricated simulation method transportation and construction phase carbon emissions.
Buildings 13 00053 g007
Figure 8. Comparison of material carbon emissions.
Buildings 13 00053 g008
Figure 9. Emissions distribution in prefabrication stage of B1 building.
Buildings 13 00053 g009
Figure 10. Comparison of transportation distance of B1 building.
Buildings 13 00053 g010
Figure 11. Comparison of carbon emissions during the construction phase of Building B1.
Buildings 13 00053 g011
Figure 12. Schematic diagram of carbon emissions reduction in the production and construction stages of newly built prefabricated buildings in Zhejiang Province.
Buildings 13 00053 g012
Table 1. Comparison of carbon emissions between prefabricated empirical and non-prefabricated simulation.
Project DescriptionB1 Building Prefabricated DemonstrationB1 Building Non-Prefabricated Simulation
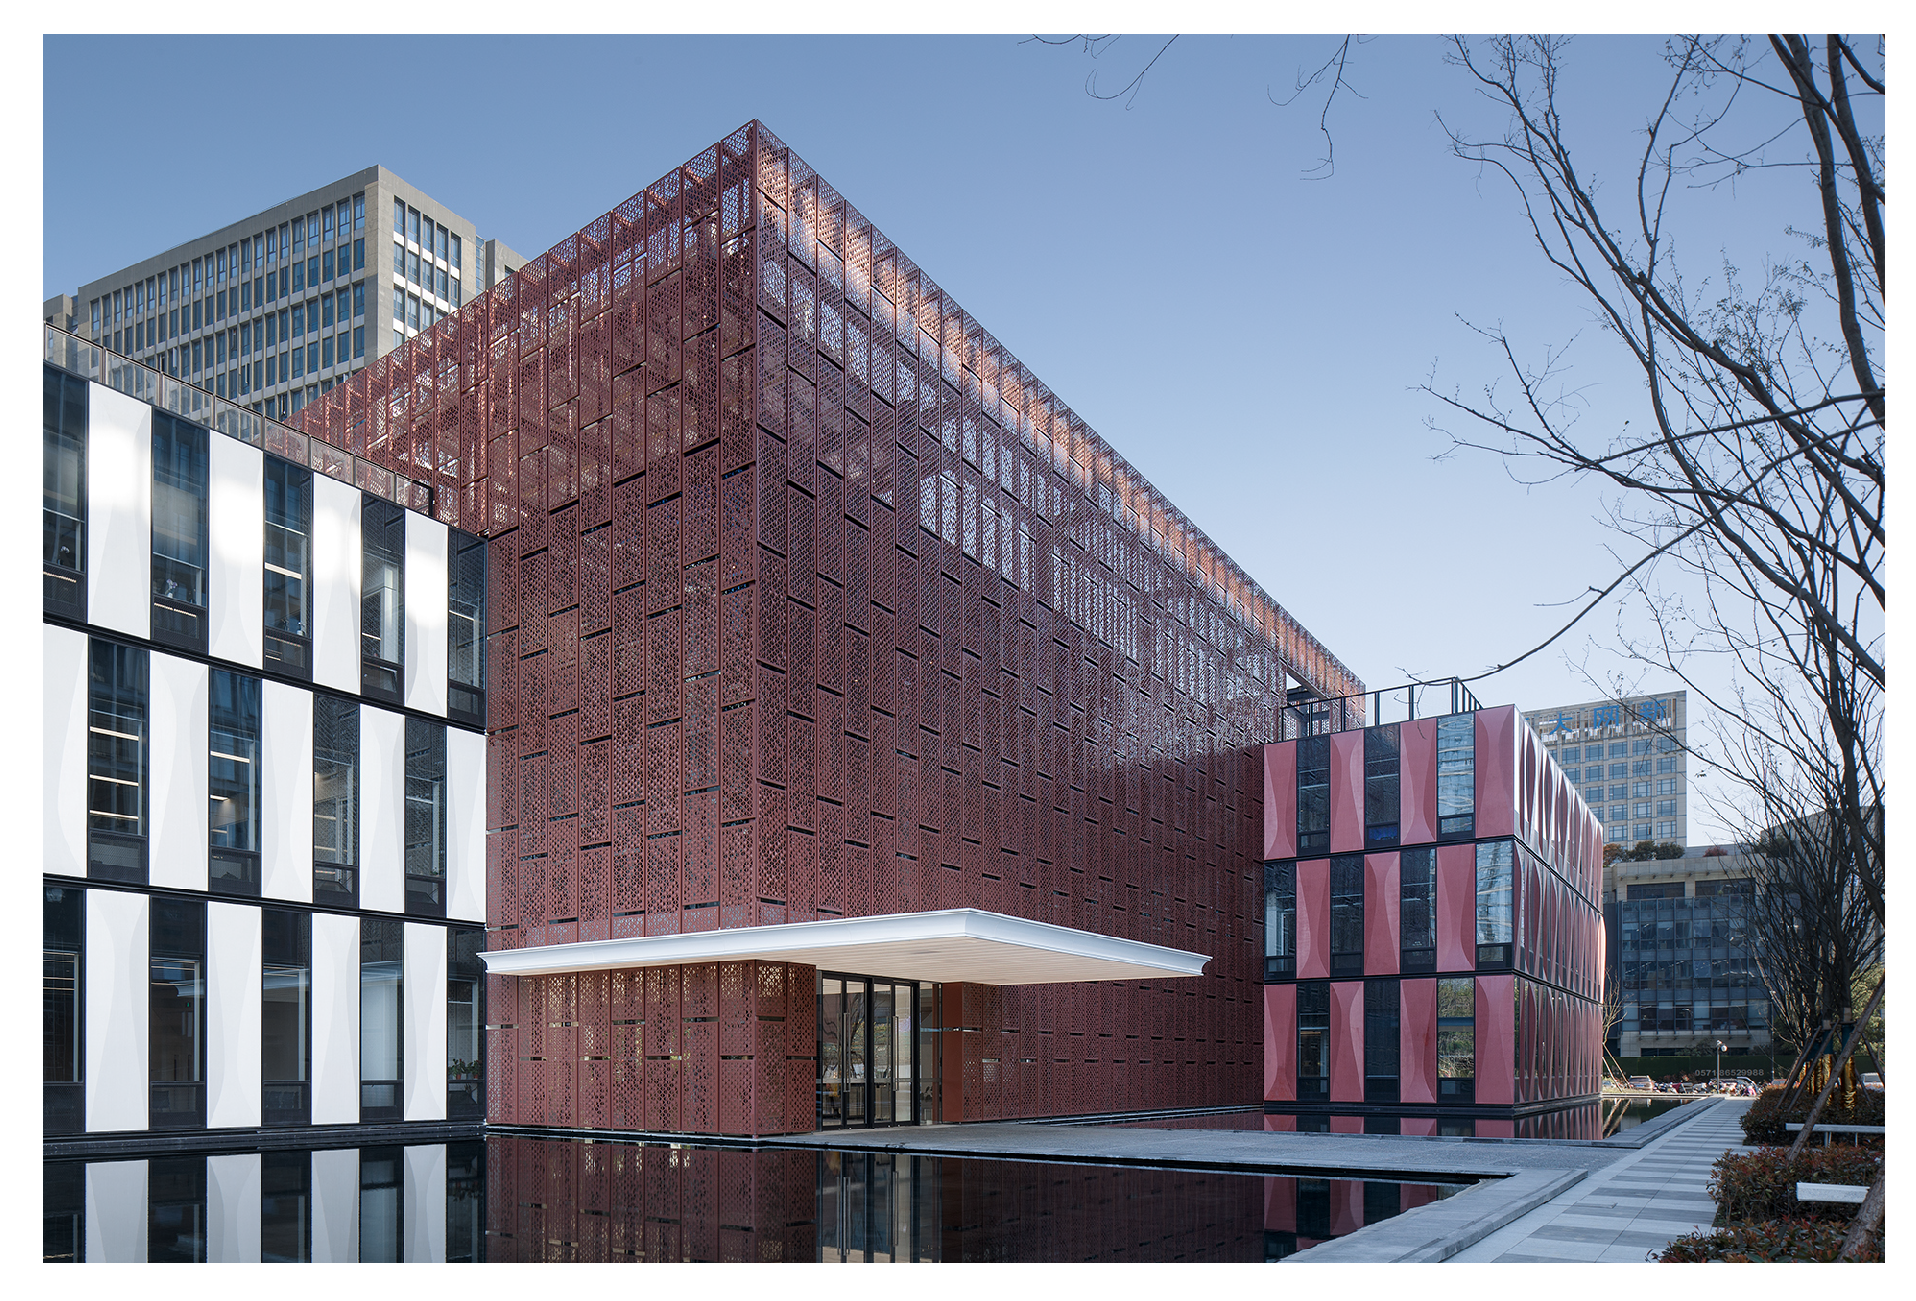
TypeOffice buildingOffice building
LocationHangzhou, Zhejiang ProvinceHangzhou, Zhejiang Province
Area8888 m 2 8888 m 2
Building height16.3 m16.3 m
Structure systemPEC structure systemFrame shear wall structure
Floor height4.78 m4.78 m
Seismic Intensity7.07.0
Construction MethodPrefabricated constructionNon-prefabricated construction
Prefabricated level86.5%0
Structural frame: column, beam, slab, structural wall, slabSteel structure, prefabricatedReinforced concrete, non-prefabricated
Structural frame: staircase, floor slabSteel structure, assemblyReinforced concrete, non-prefabricated
External works: Exterior wallsUHPC + LOW-E glass + perforated aluminum panels, prefabricatedReinforced concrete + perforated aluminum panels, non-prefabricated
External works: RoofSteel structure, prefabricatedReinforced concrete, non-prefabricated
Internal works: Partition wallALC slat wall, prefabricatedShale bricks, masonry
Table 3. Summary of calculation results of OM emissions factors for six regional grids in China in 2019.
Region/Time (Year)201520162017Three-Year Weighted Average
tCO 2 e/MWhtCO 2 e/MWhtCO 2 e/MWhtCO 2 e/MWh
North China Regional Grid0.95900.92420.94370.9419
Northeast regional grid1.09591.06341.08861.0826
East China Regional Grid0.79870.78940.78880.7921
Central China Regional Grid0.87670.85640.84440.8587
Northwest regional grid0.91780.86140.89900.8922
Southern regional grid0.80800.79000.81390.8042
Baseline Emissions Factors for China Regional Grid for the 2019 Emission Reduction Project.
Table 4. Construction material waste factors and carbon emissions factors.
Energy TypeCarbon Emissions Factor (gCO 2 e/MJ)SourceCarbon Emissions Factor (gCO 2 e/MJ)Source
Coal90.4Baines, 1993 [45,52]89Carbon emissions calculation standard for buildings
Oil68Baines, 199372.23Carbon emissions calculation standard for buildings
Gasoline66.6Baines, 199367.91Carbon emissions calculation standard for buildings
Diesel68.7Baines, 199372.59Carbon emissions calculation standard for buildings
Source: China′s Standard for Calculating Carbon Emissions from Buildings (GB/T51366-2019)(GB/T51366-2019).
Table 5. Summary of calculation results of OM emission factors for six regional grids in China in 2019.
Work Method ClassificationProject PartComponent Type
Prefabricated partially laminated floor slab
Precast laminated floor slab
Prefabricated steel stairs
Prefabricated honeycomb beams
Prefabricated partially filled steel-concrete composite beams
Envelope walls and internal partition walls
Unit curtain wall for non-load-bearing exterior parapet walls
PC integrated external wall panels
Perforated aluminum panels Decoration integrated ALC slats
Non-prefabricated partConcrete worksPC laminated beam
Reinforced concrete worksNon-prefabricated component reinforcement
Table 6. E1 calculation table.
Building MaterialsMass/VolumeWaste FactorCarbon Emissions FactorTotal Carbon Emissions (kgCO 2 e)
ALC slatwall769.76 m 3 2.50%336 kgCO 2 e/m 3 265,105.34
C35 Concrete267.71 m 3 2.50%295 kgCO 2 e/m 3 80,948.81
C30 Concrete932.35 m 3 2.50%295 kgCO 2 e/m 3 281,919.33
H section steel1512.69 t5%352 kgCO 2 e/t559,090.22
SBS modified asphalt waterproofing membrane16.45 t2.50%4620 kgCO2 2 e/t77,898.98
C25 fine stone concrete precast block2493.83 m 2 5%295 kgCO2 2 e/m 3 77,245.46
Metal drainage ditch44.760 t5.00% [28]112 kgCO 2 e/t5263.776
588.2 m 2 5%254 kgCO 2 e/m 2 156,872.94
112.5 thick XPS extruded plastic benzene board6.2 t2.50%5020 kgCO 2 e/t31,902.1
C15 fine stone concrete bedding layer248.76 m 3 2.50%295 kgCO 2 e/m 3 75,218.81
25mm UHPC Ultra High Performance Concrete Slab72.27 m 3 0%295 kgCO 2 e/m 3 21,320.39
Steel keel161.45 t5%352 kgCO 2 e/t59,671.92
Insulation rock wool board12.92 t2.50%1980 kgCO 2 e/t26,221.14
Curtain wall liner (aluminum veneer)884.11 m 2 5%8.06 kgCO 2 e/m 2 7482.22
Curtain wall glass135.32 t5%1130 kgCO 2 e/t160,557.18
Perforated aluminum panel3282 m 2 5%8.06 kgCO 2 e/m 2 27,775.57
Aluminum keel36.403 t5%622 kgCO 2 e/t [45]23,774.8
Insulation liner (galvanized thin steel)14.16 t5%2050 kgCO 2 e/t30,479.4
E1 1968.75 tCO 2 e
The carbon emissions factors are derived from the Chinese national standard “Carbon Emission Calculation Standard for Buildings” (GB/T51366-2019).
Table 7. Factory survey data sheet.
Plant Survey DataElectricity Consumption (Million kWh) Water Consumption (Million Tons) Natural Gas (Million Cubic Meters)
AreaDomestic and productionDomesticProductionDomesticProduction
Consumption10130.52.5120
Table 8. Annual power consumption of plant lines.
Factory Production LineQuantityInstalled Power (kW)Total Installed Power (kW)Share Based on Total PowerElectricity (Million kWh)
Steel joist floor joist Production line22605207.40%75
PC secondary processing line12002002.90%29.38
Door and window processing line21202403.40%34.44
Concrete mixing plant175751.00%10.13
PC component production line21300260037.20%376.84
Steel structure parts componentsMultipleMultiple335047.90%485.23
Table 9. Carbon emissions of W p i .
Main Part Amount (t)Name of Components (Total)Total Factory Consumption of Electricity (Million kWh)Percentage of Q i Electricity Consumed by Prefabricated Components (Million kWh)Carbon Emissions (tCO 2 e)
Main structurePrefabricated partially filled steel-concrete frame columns514.610.54%2.77889422.01
Prefabricated partially laminated floor slabs376.840.47%1.77114814.03
Prefabricated laminated floor slabs376.840.16%0.6029444.78
Prefabricated steel stairs485.230.07%0.35421792.81
Prefabricated honeycomb beams485.230.93%4.51263935.74
Prefabricated partially filled steel-concrete composite beams514.610.15%0.7719156.11
pc exterior wall panel376.840.04%0.14319921.13
Prefabricated pc board376.840.14%0.5275764.18
Enclosing walls and internal partitionsNon-load-bearing perimeter parapet wall using unit curtain wall34.440.94%2.3832482.56
PC integrated external wall panels, perforated aluminum panels376.841.63%3.0147248.65
Decoration integrated ALC slats769.76 m 3 * 637.0028 kgCO 2 /m 3 [45] 0.49
Total Carbon Emissions 142.49 tCO 2 e
Table 10. Carbon emissions of W p i .
Main PartComponent NamePercentage of QiProduction Line LaborPrefabricated Components LaborPersonnel Domestic Water ConsumptionWater Carbon Emissions FactorTotal Carbon Emissions Amount (kgCO 2 e)
Main structureSteel-filled concrete frame column0.54%56094.5175 L/person.d0.4137886.6667
Prefabricated partially laminated floor slabs0.47%12017.625175 L/person.d0.4137143.9335
Prefabricated laminated floor slabs0.16%1206175 L/person.d0.413716.68038
Prefabricated steel stairs0.07%44010.0375175 L/person.d0.413712.73161
Prefabricated honeycomb beams0.93%440127.875175 L/person.d0.41372066.348
Prefabricated partially filled steel-concrete composite beams0.15%56026.25175 L/person.d0.413768.41564
PC exterior wall panel0.04%1201.425175 L/person.d0.41370.940878
Prefabricated PC board0.14%1205.25175 L/person.d0.413712.77092
Enclosing walls and internal partitionsNon-load-bearing perimeter parapet wall using unit curtain wall0.94%7020.5625175 L/person.d0.4137335.8448
PC integrated external wall panels perforated aluminum panels1.63%7035.65625175 L/person.d0.41371009.853
4.55 tCO 2 e
Data from prefabricators.
Table 11. Carbon emissions of T p i .
Main PartComponent NamePercentage of QiProduction Line LaborLabor Hours (Unit)Human Carbon Emission Factor (kg/unit)Carbon Dioxide Emissions (kgCO 2 e)
Main structureSteel-filled concrete frame column0.54%5607500.731655.64
Prefabricated partially laminated floor slabs0.47%1207500.73308.79
Prefabricated laminated
Floor slabs0.16%1207500.73105.12
Prefabricated steel stairs0.07%4407500.73175.857
Prefabricated honeycomb beams0.93%4407500.732240.37
Prefabricated partially filled steel-concrete composite beams0.15%5607500.73459.9
PC exterior wall panel0.04%1207500.7324.966
Prefabricated PC board0.14%1207500.7391.98
Enclosing walls and internal partitionsNon-load-bearing perimeter parapet wall using unit curtain wall0.94%707500.73360.255
PC integrated external wall panels perforated aluminum panels1.63%707500.73624.6975
6.05 tCO 2 e
Table 12. Carbon emission of N p i .
Factory Production LineArea (m 2 )Total Factory Floor Area (m 2 )Percentage of Production Line Workshop AreaTotal Annual Natural Gas Consumption of the Plant (Million m 3 )Natural Gas Carbon Emissions FactorsCarbon Emissions (tCO 2 e)
Steel truss floor joist production line6300103,0006.102055.54 tCO 2 e/TJ0.71
PC secondary processing line7236 7.00% 0.82
Door and window processing line12,492 12.10% 1.41
Concrete mixing plant4000 3.90% 0.45
PC component production line17,708 17.00% 1.99
Steel structure parts33,216 32.20% 3.77
9.18 tCO 2 e
Table 13. Calculation of carbon emissions of main auxiliary materials.
Name of Auxiliary MaterialTotalCarbon Emissions FactorCarbon Emissions (t)
Knot 422 welding material59.01 t2350 kgCO 2 /t7.06
Polyurethane glass sealant94 kg5.22 kgCO 2 eq/kg0.49
Mold release agent24.083.6 kgCO 2 eq/kg0.08
7.63
The amount of auxiliary materials was obtained from the statistics of the prefabrication plants.
Table 14. E2 calculation table.
Transport MaterialMassCarbon Emissions FactorTransportation DistanceTotal Carbon Emissions (kgCO 2 e)
Concrete1200.06 t0.104 kgCO 2 e/(t·km)20 km24,960.1248
Steel3608.98 t0.104 kgCO 2 e/(t·km)65 km24,396.7048
Aluminum (Al)4705.6 kg0.104 kgCO 2 e/(t·km)85 km41.597504
Rock wool board12.92 t0.104 kgCO 2 e/(t·km)75 km100.776
E2 49.50 tCO 2 e
Shaoxing Lvzhu Building Materials Co., Ltd. 65 km; rock wool, Shaoxing Shengzhou Ding’s RockWool Insulation Material Co., Ltd., 75 km; aluminum, Ningbo Fubang Jingye Aluminum, 85 km; concrete, green building plant self-produced, 0 km; concrete sand and stone raw material, Shaoxing Qianqing Shaoxing Pier (original source not determined), 20 km.
Table 15. E4 calculation table.
Transport MaterialMassCarbon Emissions FactorTransportation DistanceTotal Carbon Emissions (kgCO 2 e)
Unit type curtain wall291.29 t0.104 kgCO 2 e/(t·km)63 km1908.532
Prefabricated steel components1197.41 t0.104 kgCO 2 e/(t·km)63 km7845.43
Prefabricated concrete components2411.57 t0.104 kgCO 2 e/(t·km)63 km15,800.61
Concrete2880.14 t0.104 kgCO 2 e/(t·km)63 km18,870.68
Metal44.760 t0.104 kgCO 2 e/(t·km)65 km302.5776
Insulation liner (steel plate)14.16 t0.104 kgCO 2 e/(t·km)65 km95.7216
25mm UHPC plate169.54 t0.104 kgCO 2 e/(t·km)20 km352.6432
E4 45.17 tCO 2 e
Building B1 is 63 km from Shaoxing Green Building Group Co.
Table 16. Calculation of carbon emissions by site phase.
Construction ActivitiesProjectQualityEnergy TypeNatural Gas Carbon Emissions FactorsTotal Carbon Emissions (kgCO 2 e)
On-site transportationSteam crane2639 kgDiesel fuel2298 gCO 2 /L6064.422
Lifting arm truck2343.2 kgDiesel fuel2618 gCO 2 /L6134.498
Forklift131.25 kgDiesel fuel2618 gCO 2 /L343.6125
Lorry81.25 kgGasoline2298 gCO 2 /L186.7125
Welding processHandlebar welding463.89 kW/hPower0.7898 kgCO 2 e/kWh366.3803
Carbon dioxide gas shielded welding49 kW/hPower0.7898 kgCO 2 e/kWh38.7002
Purchased electricity for constructionOn-site electricity23,980 kW/hPower0.7898 kgCO 2 e/kWh18,939.4
On-site worker activitiesResident ActivitiesNo solid waste-3.17
kgCO 2 e/kg
Water Production250 m 3 Water0.42 kgCO 2 e/m 3 105
Unorganized emissionsNone-
Unorganized emissions311.77 /Workday 0.73 kgCO 2 /Workday227.5921
E5 + E6 + E7 32.41 tCO 2 e
The above data were collected from the site and recorded data.
Table 17. Calculation of carbon emissions in site phase.
MaterialTotal AmountCarbon Emissions FactorCarbon Emissions (kgCO 2 e)
Structural componentConcrete3588 m 3 295 kgCO 2 e/m 3 1085.22
Steel65.12 t352 kgCO 2 e/t24.07
Steel reinforcement676.03 t352 kgCO 2 /t249.86
SBS modified asphalt16.45 t4620 kgCO 2 /t77,898.98
C25 fine stone concrete2493.83 m 2 295 kgCO 2 /m 3 77,245.46
Internal wall partShale bricks382.06292 kgCO 2 /m 3 111.56
350.8 102.43
386.18 112.76
Cement mortar67.14 m 3 496 kgCO 2 /m 3 33,301.44
Putty powder11.19 m 3 501 kgCO 2 /m 3 5606.19
External envelope part25 mm UHPC ultra high performance concrete slab72.27 m 3 295 kgCO 2 e/m 3 21,320.39
Steel keel161.45 t352 kgCO 2 e/t59,671.92
Insulation rock wool board12.92 t1980 kgCO 2 e/t26,221.14
Curtain wall liner (aluminum veneer)884.11 m 2 8.06 kgCO 2 e/m 2 7482.22
Curtain wall glass135.32 t1130 kgCO 2 e/t160,557.18
Perforated aluminum panel3282 m 2 8.06 kgCO 2 e/m 2 27,775.57
Aluminum alloy keel36.403 t622 kgCO 2 /t23,774.8
Insulation liner (galvanized thin steel plate)14.16 t2050 kgCO 2 e/t30,479.4
Metal Drains44.760 t112 kgCO 2 e/t5263.776
2242.50 tCO 2 e
The above data are from structural calculations and building plan statistics. 2 The carbon emission factors derived from the Chinese national standard “Carbon Emission Calculation Standard for Buildings” (GB/T51366-2019).
Table 18. Calculation of carbon emissions of transportation of Building B1 in non-prefabricated simulation.
Material TransportedMassVehicle Emissions Factor (kgCO 2 /t·km)Transportation DistanceTotal Carbon Emission (kgCO 2 e)
Concrete8417.45 t0.104 kgCO 2 e/(t·km)20 km24,960.1248
Steel714.15 t0.104 kgCO 2 e/(t·km)65 km24,396.7048
Aluminum4705.6 kg0.104 kgCO 2 e/(t·km)85 km41.597504
Rock wool board12.92 t0.104 kgCO 2 e/(t·km)75 km100.776
Metal44.760 t0.104 kgCO 2 e/(t·km)65 km302.5776
Insulation liner (galvanized thin steel)14.16 t0.104 kgCO 2 e/(t·km)65 km95.7216
Concrete slab169.54 t0.104 kgCO 2 e/(t·km)20 km352.6432
Steel keel161.45 t0.104 kgCO 2 e/(t·km)65 km1091.402
136.59 tCO 2 e
Shaoxing Lvzhu Building Materials Co., Ltd. 65 km; rock wool, Shaoxing Shengzhou Ding′s RockWool Insulation Material Co., Ltd., 75 km; aluminum, Ningbo Fubang Jingye Aluminum, 85 km; concrete, green building plant self-produced, 0 km; concrete sand and stone raw material, Shaoxing Qianqing Shaoxing Pier (original source not determined), 20 km.
Table 19. Calculation of carbon emissions of B1 building construction by casting-in-place simulation.
Accounting StandardsConstruction MaterialsTransportation PhaseConstruction Phase Carbon Emissions (tCO 2 e)
B1 building reference building accounting2242.50136.59-
Chinese building energy consumption research standard2242.50136.5982.11
ZJU Construction Statistics Standard2242.50124.4683.06
136.59 tCO 2 e
Disclaimer/Publisher’s Note: The statements, opinions and data contained in all publications are solely those of the individual author(s) and contributor(s) and not of MDPI and/or the editor(s). MDPI and/or the editor(s) disclaim responsibility for any injury to people or property resulting from any ideas, methods, instructions or products referred to in the content.

