Article

Development of a Classification Framework for Construction Personnel’s Safety Behavior Based on Machine Learning

1
College of Information, Mechanical and Electrical Engineering, Shanghai Normal University, Shanghai 201418, China
2
College of Civil Engineering, Shanghai Normal University, Shanghai 201418, China
3
Department of Real Estate and Construction, University of Hong Kong, Hong Kong, China
4
School of Society and Design, Bond University, Robina, QLD 4226, Australia
*
Author to whom correspondence should be addressed.
Buildings 2023, 13(1), 43; https://doi.org/10.3390/buildings13010043
Submission received: 24 November 2022 / Revised: 19 December 2022 / Accepted: 21 December 2022 / Published: 24 December 2022
(This article belongs to the Topic Advances in Construction and Project Management)

Abstract

:
Different sets of drivers underlie different safety behaviors, and uncovering such complex patterns helps formulate targeted measures to cultivate safety behaviors. Machine learning can explore such complex patterns among safety behavioral data. This paper aims to develop a classification framework for construction personnel’s safety behaviors with machine learning algorithms, including logistics regression (LR), support vector machine (SVM), random forest (RF), and categorical boosting (CatBoost). The classification framework has three steps, i.e., data collection and preprocessing, modeling and algorithm implementation, and optimal model acquisition. For illustrative purposes, five common safety behaviors of a random sample of Hong Kong-based construction personnel are used to validate the classification framework. To achieve high classification performance, this paper employed a combinative strategy, consisting of feature selection, synthetic minority over-sampling technique (SMOTE), one-hot encoding, standard scaler and classifiers to classify safety behaviors, and multi-objective slime mould algorithm (MOSMA) to optimize parameters in the classifiers. Results suggest that the combinative strategy of CatBoost–MOSMA achieves the highest classification performance with the maximum average scores, including area under the curve of receiver characteristic operator (AUC) ranging from 0.84 to 0.92, accuracy ranging from 0.80 to 0.86, and F1-score ranging from 0.79 to 0.86. From the optimal model, a unique set of important features was identified for each safety behavior, and ten out of the 46 input indicators were found important for all five safety behaviors. Based on the findings, this study advocates using the machine learning strategy of CatBoost–MOSMA in future construction safety behavior research and makes concrete and targeted suggestions to cultivate different construction safety behaviors.

1. Introduction

Unsafe behaviors are the primary direct cause of construction accidents. Different types of accidents can be attributed to different sets of unsafe behaviors [1]. For example, to avoid falls from height the management should take care of unprotected holes/borders and correct workers’ inappropriate use of personal protective equipment (PPE). Safety behavior is traditionally categorized as either safety compliance or safety participation. The former is an in-role task-related behavior, while the latter involves extra-role behaviors, which are voluntary and initiated by employees [2]. Griffin and Curcuruto further identify two categories of safety participation behavior: affiliative and proactive [3]. Helping and stewardship behaviors, civic virtue, and caring for safety are typical of affiliative safety participation behavior, whereas proactive safety participation behavior includes safety voice behaviors and initiating safety-related changes. Affiliative safety participation behavior is related to minor incidents, such as property damage and microinjuries, while proactive safety participation behavior is positively associated with near-miss reporting. Therefore, it can be hypothesized that different sets of drivers are accountable for different (un)safety behaviors. This paper attempts to validate this hypothesis with a machine-learning-enabled classification framework.
Besides the theoretical significance, this paper also has both a practical and a methodological significance as well. On the practical front, if different patterns of drivers for different safety behaviors are ascertained, targeted interventions can be proposed accordingly. Specifically, this paper selects five typical safety behaviors, i.e., the use of all necessary safety equipment to do the job (hereafter coded as SB1); following safety procedures in doing the job (hereafter coded as SB2); promoting safety programs willingly (hereafter coded as SB3); put in extra effort to improve workplace safety (hereafter coded as SB4); and help colleagues out when they are under risky conditions (hereafter coded as SB5). On the methodological front, as a subset of artificial intelligence, machine learning enables a system to learn from example data or past experience without explicit programming. Like traditional statistical modelling, it is also intended to seek solutions from data. Unlike traditional methods that are based on assumptions and ignore the nonlinear relationship among independent variables, machine learning methods are more flexible, have fundamental and simple assumptions, and take into consideration the complex relationship among independent variables. Machine learning has seen an increasing use by safety researchers in recent years. Construction workers’ risk perceptions have a direct impact on their safety behavior. The traditional measurement of risk perceptions primarily relies on a post hoc survey-based assessment, which has limitations such as lack of objectivity and continuous monitoring ability. Given this, Lee et al. developed an automatic system to measure workers’ risk perception using physiological signals obtained by wristband-type wearable biosensors in combination with a supervised learning algorithm [4]. Overexertion-induced work-related musculoskeletal disorders (WMSDs) are a primary cause of the nonfatal injuries for construction workers. To reduce overexertion, appropriate levels of physical loads need to be identified. In this regard, Yang et al. propose to employ a bidirectional long short-term memory algorithm to classify physical load levels, and investigate the feasibility of such an approach with a laboratory experiment [5]. In view of machine learning’s advantage in predictive accuracy, Goh et al. use six supervised learning algorithms (i.e., support vector machine, random forest, K-nearest neighbor, naïve Bayes, artificial neural network, and decision tree) to assess the relative importance of different cognitive factors derived from the theory of reasoned action in affecting safety behavior [6].
Given the theoretical, practical, and methodological significance, a machine-learning-enabled safety behavior classification framework should be developed in order to improve construction safety performance in an efficient and effective way. In particular, this paper has two objectives, namely: (a) To identify drivers of different safety behaviors; (b) To propose new machine learning methods in predicting safety behaviors. The former intends to make targeted interventions for different safety behaviors based on the findings and the latter to explore new algorithms which are more suitable for analyzing safety-related behavioral data.
This paper is organized as follows. First, a safety behavior factor analysis and classification system is developed based on the literature review. Second, the sample, measures, machine learning models, and classification outputs are described. Third, results are presented, with an emphasis on model performance and factor importance analysis. Finally, both the contribution and limitations of the findings are discussed along with future research directions.

2. Safety Behavior Factor Analysis and Classification System

Safety behavior is an emergent property of a more complex system. Choi and Lee find that construction workers’ safety behavior is a function of their socio-cognitive process and their interaction with the environment [7]. Based on bibliometric and content analyses of 101 empirical studies, Xia et al. propose a safety behavior antecedent analysis and classification system [8], which organizes the antecedents of safety behavior into five levels: (a) Self; (b) Work; (c) Home; (d) Work–home interface; (e) Industry/society. In addition, they put forward a resource flow model to explain how safety behavior emerges from such a complex system. Using Xia et al. ’s framework [
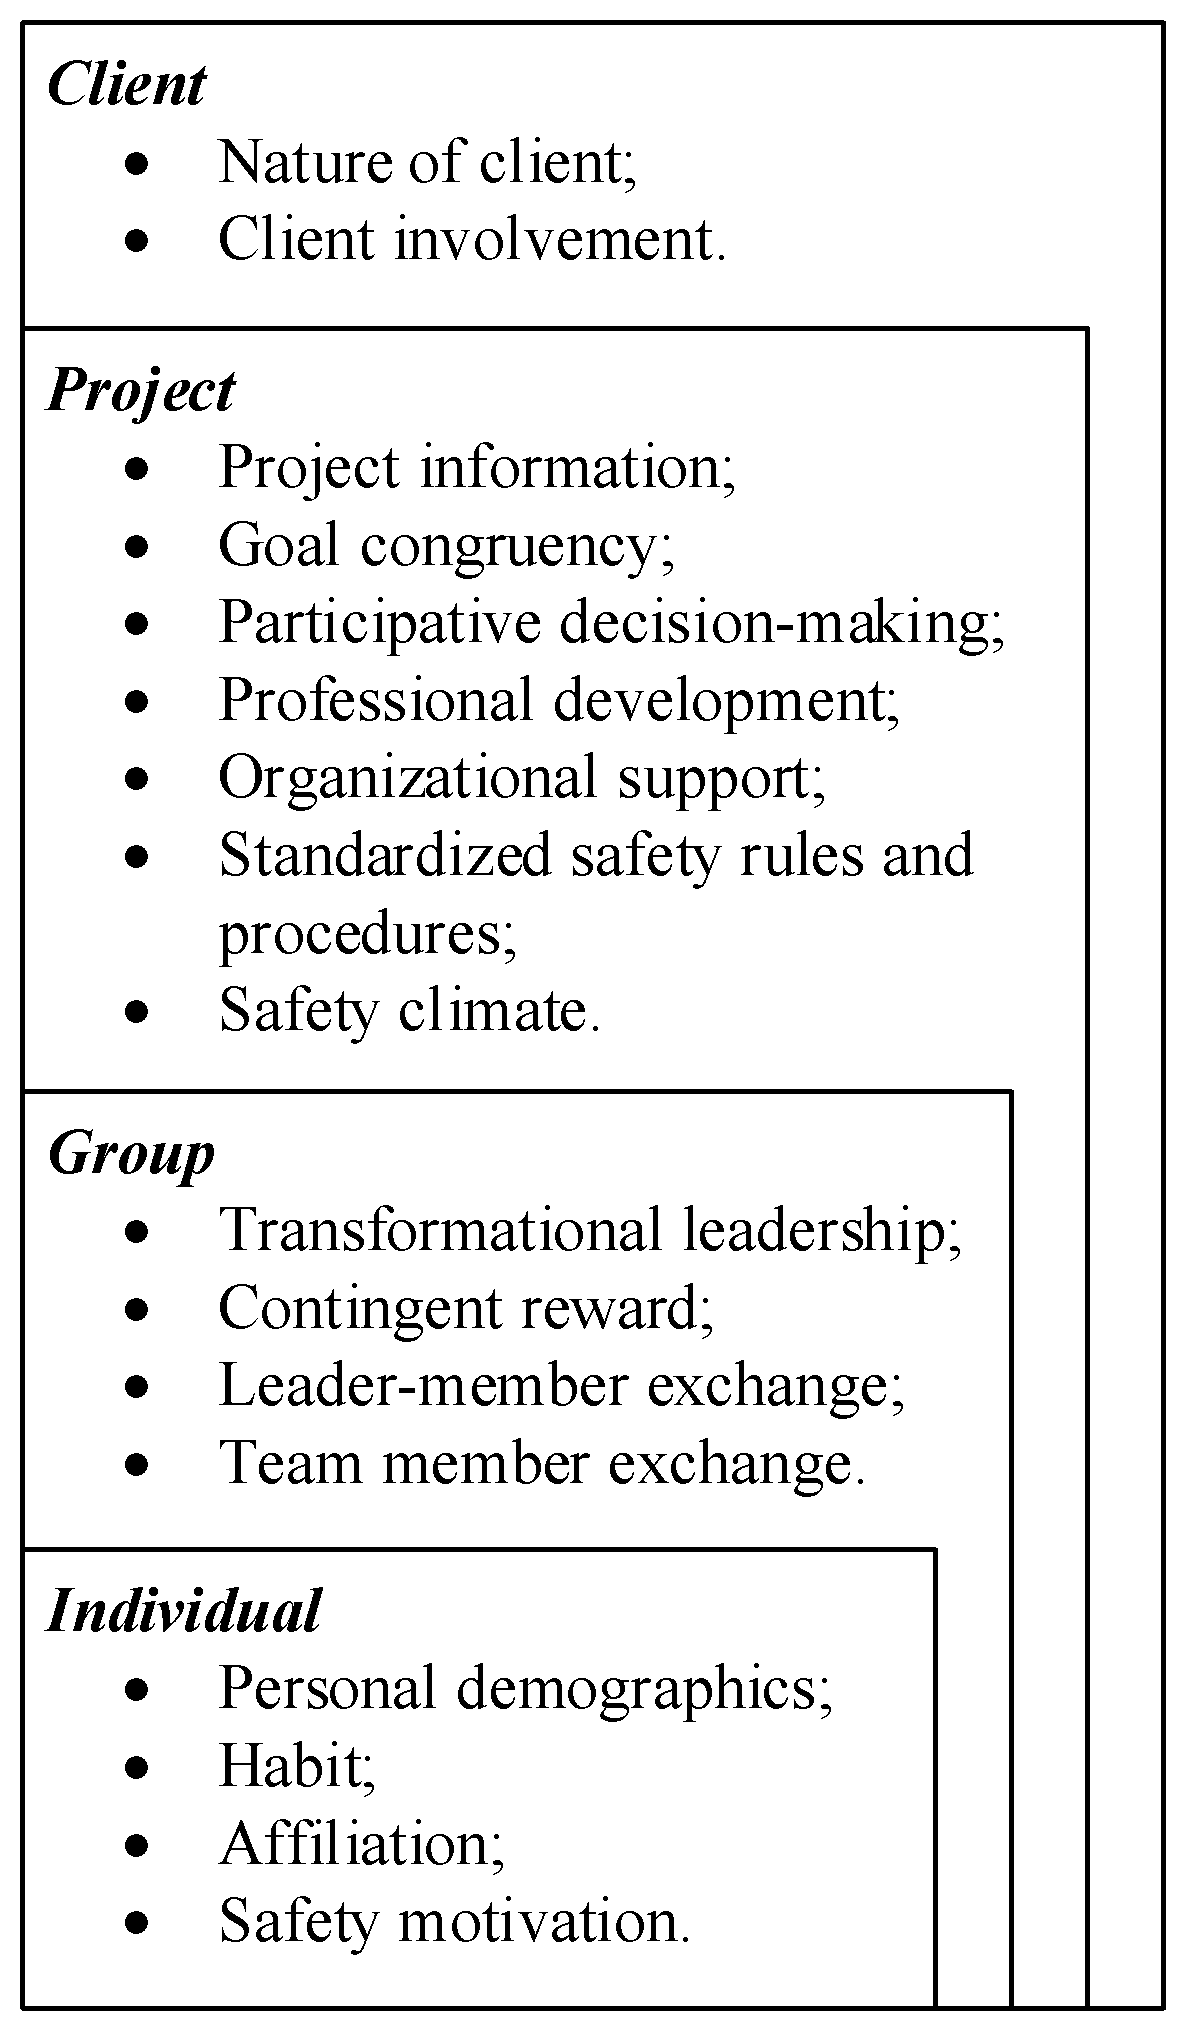
8], this study organizes influencing factors of construction safety behavior at four levels, i.e., client, project, group, and individual, and hence, develops a safety behavior factor analysis and classification system as well. The next section deliberates on the impact of these factors on safety behavior before presenting the system.

2.1. Client Level Factors

Among stakeholders in the construction supply chain, clients have the economic power to encourage other stakeholders to implement safety measures. Therefore, clients play a pivotal role in improving safety performance across construction projects. Specifically, client type and the extent of client involvement in safety management have implications for safety performance [9,10].

2.1.1. Client Type

Construction project clients can be categorized as either public or private according to their source of funding. Ma observes that safety records for the projects with public sector clients are better than those projects with private sector clients in Hong Kong [11], and believes that the reason is that most safety initiatives are mandatorily executed in public works’ contracts, whereas they are voluntarily adopted in the private sector. In Nigeria, Umeokafor also notes that public clients’ safety commitment and attitudes are better than their counterparts [12]. So, it is hypothesized that there are more safety behaviors in public projects than in private projects.

2.1.2. Client Involvement

Clients’ direct involvement in safety management contributes to safety performance. In Australia, given the important contribution that clients can make to the safety performance of the construction projects, Lingard et al. develop a model client framework [13]. The framework establishes clients’ safety roles throughout the life-cycle of the project. Using safety climate as a leading indicator of safety performance of small- and medium-sized construction projects, Votano and Sunindijo found that six of the clients’ safety roles depicted by Lingard et al. are related to safety performance, and they are participation in the safety program, review and analysis of safety data, appointment of safety team, selection of safe contractors, safety specifications in tenders, and regular checks on plant/equipment [13,14]. Hence, this research postulates that client safety involvement is positively associated with workers’ safety behaviors.

2.2. Project Level Factors

Safety management system at the project level has implications for workers’ safety behavior. In order to curb unsafe acts, Shin et al. suggest that project management should offer a safety incentive as early as possible and facilitate effective communication about accidents in as much detail as possible [15]. Fang et al. propose a leadership–culture–behavior (LCB) approach, which maintains that leadership creates a safety culture, and hence, promotes safety behavior [16]. The LCB approach has been implemented in railway and residential projects in mainland China and Hong Kong, and has seen success. Among others, this paper focuses on the following project level factors: stage of project, contract sum, goal congruency, participative decision-making, professional development, organizational support, standardized safety rules and procedures, and safety climate.

2.2.1. Project Information

At least two project characteristics, namely, stage of project and contract sum, have bearing on construction project employees’ safety behavior. Based on the percentage of construction works that has been completed, a project can be categorized into three stages, namely, start-up, advanced, and near close-out. At the start-up stage, the construction work has been completed by less than 30%. At the advanced stage, the construction work has been completed by 30–70%. At the near close-out stage, the construction work that has been completed is more than 70%. Employees usually exhibit more safety behaviors at the start-up and near close-out stages than at the advanced stage. This is because at the start-up stage, employees are new to the site, and act scrupulously. As time passes and production pressure increases, employees are more likely to take shortcuts and more unsafe behaviors ensue. When the project is being completed, as employees are more familiar with the site and some of their unsafe behaviors have been rectified, their safety behavior increase. Awolusi and Marks develop a safety activity analysis framework and tool, and validate the framework and tool using a case study project that is in the construction stage [17]. Over an eight-month period of the case study project, the occurrence rate of safety behavior experiences a U-shaped curve, initially decreasing from 45.7% to 37.0% and then increasing to 62.8%.
Contract sum is also related to employees’ safety performance. Generally, in jurisdictions where mandatory safety incentive scheme is applied, projects with large a contract sum usually set aside more money on safety measures, and therefore, more safety behaviors result. Take Hong Kong as an example, due to the introduction of safety initiatives, such as the Pay for Safety Scheme (PFSS), the Safety Management System (SMS),the Independent Safety Auditing Scheme (ISAS), and the Site Supervision Plan System (SSPS), the construction industry has seen a dramatic decrease in accidents [18]. Hence, this paper hypothesizes that a large contract sum contributes to more safety behaviors.

2.2.2. Goal Congruency

Goal congruency has an impact on organizational behavior. Goal congruency is a scenario where employees at different levels of an organization share the same goal. When employees’ personal goals are consistent with organizational goals, they feel more positive about the organization and expend more personal efforts to achieve those goals. Ukraine-based IT professionals De Clercq et al. found that goal congruence between employees and their supervisor negatively affects employees’ organizational deviance, and the indirect effect of goal congruence on organizational deviance through work engagement is moderated by employees’ emotional intelligence [19]. With 171 employees under the leadership of 24 supervisors, Bouckenooghe et al. found that supervisors’ ethical leadership has a positive effect on followers’ in-role job performance through the sequential mediation of goal congruence and psychological capital [20]. Hence, when project personnel, both the management and workers, take safety as the first priority, their safety behavior ensues.

2.2.3. Participative Decision-Making

Participative decision-making is positively associated with safety behavior. Participative decision-making refers to the extent to which employers allow or encourage employees to take part in organizational decision-making. Through participation in decision-making, employees bring different perspectives and frames of references to safety discussions and activities, and hence, can reduce all members’ ignorance to hazards and signals of danger [21]. As employees are aware that their suggestions have been incorporated in safety decisions, they are more likely to take ownership of those decisions and act on them more proactively. As a leadership behavior, participative decision-making is associated with safety participation [22]. In the medical industry, Lee et al. found that empowering leaders who empower employees to participate in decision-making enhance employees’ safety compliance [23].

2.2.4. Professional Development

Employees are the most valuable resource in construction projects. Despite the time and resource pressures preventing project managers from investing in employees’ professional development, it pays off. Design for safety has been advocated for quite a long time, and designers need to receive safety training as part of their professional development. Toole elaborates on the opportunities and barriers in increasing designers’ role in construction safety [24]. In another scenario, if a semi-skilled bar bender is sponsored to receive more professional training, s/he may bring more best safety practices to the crew and promote more safety behaviors.

2.2.5. Organizational Support

Organizational support is critical in creating a safety climate and, hence, safety behavior. Organizational support refers to employees’ global beliefs about the extent to which their organization satisfies their needs and cherishes their contributions. It can be general or specific. Mearns and Reader found that general perceived organizational support has an impact on the UK’s offshore workers’ safety performance [25]. With Ghanaian industrial workers, Gyekye and Salminen found that general perceived organizational support is positively associated with compliance with safety procedures [26]. Guo et al. discovered that perceived supervisory and coworker support for safety reduces the negative impact of job insecurity on Chinese high-railway drivers’ safety performance [27]. Tucker et al. found that urban bus drivers’ perceived organizational support for safety exerts influence on their safety voice behavior through the mediation of their perceived coworkers’ support for safety [28], highlighting the role played by coworkers.

2.2.6. Standardized Safety Rules and Procedures

Standardization in construction projects is difficult to achieve. Other high-risk industries, such as aviation and nuclear, usually have well-defined work procedures. Since the construction process is characterized by high variety and loose coupling, most of the construction work, to a significant extent, depends on employees’ discretion and experience. Standardized safety rules and procedures make those rules and procedures easy to follow, and hence, contribute to an increase in safety behavior. However, the secondary effect of too much standardization should be restrained [29].

2.2.7. Safety Climate

Safety climate is a perceptual, collective, and multidimensional phenomenon, referring to individuals’ shared perceptions of how safety is valued in the workplace [3]. The impact of a safety climate on safety behavior has been well-documented. Safety climates can exert a direct influence on safety behavior, and also can impact safety behavior through mediators, such as the psychological contract [30], safety knowledge and motivation [31], etc.

2.3. Group Level Factors

Construction workers usually move from project to project and may work with different main contractors, but they often work in a workgroups for a relatively long period. Therefore, compared with supervisors from the main contractor, workgroup supervisors usually have a bigger influence on construction workers [32]. This paper focuses on four phenomena at the workgroup level, i.e., supervisors’ transformational leadership and contingent reward behavior (one aspect of their transactional leadership), leader–member exchange, and team–member exchange.

2.3.1. Transformational Leadership

Leadership refers to a process of motivating others to act toward shared goals. It involves setting goals, devising achievement methods, persuading others to accept these goals and achievement methods, and solving problems decisively and quickly. James M. Burns proposes two leadership styles: transactional and transformational. The transactional leader identifies the needs of employees and the organization, and then informs employees what to do to meet these needs. Beyond these needs, transformational leaders arouse and satisfy higher needs within each individual. A transactional–transformational leadership paradigm is broad enough to capture the leadership construct.
Transformational leadership is positively associated with safety behavior. Shen et al. propose and validate a sequential mediation model to explain the impact of supervisory transformational leadership on construction personnel’s safety behavior [10]. Hoffmeister et al. found that different facets of transformational leadership have a different impact on different sample’s safety behavior [33]. In particular, idealized influence has an impact on safety compliance behavior in both the apprentice and journeyman samples, but it has an impact on safety participation behavior only in the apprentice sample.

2.3.2. Contingent Reward

Contingent reward is a facet of transactional leadership, and refers to the leader clarifying which employee behaviors are desired, what the rewards for such behaviors will be, and rewarding the followers depending on task fulfilment and outcome. Behaviorism maintains that behavior is a function of its consequences. Leaders engage in contingent reward with regard to safety when they help employees appreciate safety-related goals, keep them focused on meeting these goals, and reward them for engaging in safety behaviors required by those goals [33]. Therefore, contingent reward should be associated with increased employee safety behaviors.

2.3.3. Leader–Member Exchange

Leader–follower relationships are an essential part of leadership effectiveness, and leader–member exchange refers to the follower’s perceptions of the quality of the exchange between leader and followers [34]. Leader–member exchange is positively associated with safety behavior [35,36,37].

2.3.4. Team–Member Exchange

Similar to leader–member exchange, team–member exchange refers to an individual’s perception of the quality of the exchange relationships within the team. It is positively associated with safety behavior [38,39].

2.4. Individual Level Factors

Safety behavior is complex, and an individual may work safely in some occasions and unsafely in others [40]. Hence, some individual differences may contribute to an individual’s safety behavior. This study focuses on construction personnel’s personal demographics, habit, affiliation, and safety motivation.

2.4.1. Personal Demographics

Personal demographics, including age, gender, marital status, educational level, number of dependents to support, and industrial experience, may have an influence on safety behavior [41]. Meng and Chan found that female poorly educated workers exhibit less safety citizenship behavior [42]. The level of safety citizenship behavior has seen an initial downtrend followed by an uptrend as industrial experience increases.

2.4.2. Habit

Alcohol and tobacco use are more prevalent in blue collar workers than in white collar workers. There is a strong association between unsafe behavior (e.g., infrequently using sunscreen) and smoking and risky drinking [43].

2.4.3. Affiliation

At least two affiliation-related factors, namely, affiliation type and hierarchical position in affiliation, are related to construction personnel’s safety behavior. Personnel affiliated with clients exhibit more safety behaviors than those with contractors and consultants. Personnel in managerial positions exhibit more safety behaviors than supervisory staff, who in turn exhibit more safety behavior than workers.

2.4.4. Safety Motivation

Safety motivation refers to an individual’s readiness to expend effort to engage in safety behaviors and the valence associated with these behaviors. It directs, energizes and sustains safety behavior [3]. Griffin and Curcuruto view safety motivation as an outcome of safety climate and a determinant of safety behavior based on theories and empirical evidence [3].
Based on the arguments made earlier, the safety behavior factor analysis and classification system is proposed and shown in Figure 1.

3. Materials and Methods

This study proposes a safety behavior classification framework that combines statistical analysis methods and machine learning algorithms. As shown in Figure 2, the framework has three steps, i.e., data collection and preprocessing, modeling and algorithm implementation, and optimal model acquisition. The data is processed automatically by the proposed combinative strategies. The proposed methods are described in detail as follows.

3.1. Data Collection and Preprocessing

3.1.1. Data Collection

A questionnaire is used to collect data. The questionnaire has two parts. The first part is input variables, which have been shown in Figure 1. The second part is output variables, i.e., the five common safety behaviors. The sources of those indicators measuring these variables and the measures to ensure the questionnaire is self-contained and self-sufficient are recorded in Shen’s work [41]. The sources of the indicators for each construct are also recorded in Shen’s work [41]. The details of those input and output indicators are shown in Table A1 (Appendix A) and Table A2 (Appendix A), respectively.
The target population is Hong Kong construction personnel who are generally in three categories, i.e., contractor, consultant, and client. The contractor category includes management staff and direct laborers from main contractors and subcontractors. The consultant category covers engineers, architects, and quantity surveyors. The client category comprises both the public and private sectors. The target population size is unknown. The research team sets the confidence level at 90%, the margin of error at ±5%, and the population proportion at 50%. Using Cochran’s formula, the required sample size should be no less than 273. In order to secure sufficient, valid, and representative responses, the research team constructs a sampling frame consisting of construction personnel from local construction trade associations, professional bodies, governmental agencies, and property developers. Then, the research team sends hard-copy questionnaires to a random sample of 2996 construction personnel from the sampling frame. After two rounds of administration, the research team secures 292 valid responses. Non-response bias is not an issue [10].

3.1.2. Test on Reliability, Validity and Multicollinearity

For the purpose of highly reasonable and effective model training, data pre-processing is crucial in machine learning. As each record is collected by questionnaires, data need to pass both reliability and Bartlett’s tests. In particular, the reliability of input second-level indicators (Cronbach’s Alpha) is 0.82 above the threshold value of 0.7 [44]. Bartlett’s test of those input second-level indicators is 0.81, indicating that feature selection can be done.
Additionally, one common issue in machine learning is that the large regression coefficients cannot be estimated precisely when the features are multicollinear. In accordance to Hair et al., variance inflation factor (VIF) is calculated to determine whether there is multicollinearity among independent variables [44]. In general, when the VIF values are lower than the common cutoff threshold of 10, multicollinearity is not a significant issue. The results of the multicollinearity test for all input second-level indicators are shown in Table 1, and it can be concluded that there is no multicollinearity among them.

3.2. Modeling and Algorithm Implementation

3.2.1. Combinative Strategy Encoding and Data Improvement

In order to reach an optimal model, a combinative strategy, which contains five subprocesses, is proposed. The five subprocesses are feature selection, synthetic minority over-sampling technique (SMOTE), one-hot encoding, standard scaler, and classifiers. Feature selection is a process used to reduce the number of input variables in developing a classification model. This study simply divides the behaviors into Yes (high risk) and No (low risk), and this approach may result in an imbalanced distribution of each behavior. SMOTE is a proper method to address the imbalanced distribution issue [45]. The dataset contained nominal-categorical and ordinal-categorical features. One-hot encoding is used to create new binary features for each element in a categorical [46]. Moreover, all features are scaled at different intervals in the obtained dataset. By means of standard scaler, all features are converted, leading to a distribution with a mean value of 0 and a standard deviation of 1. Standard scaler helps limit the sample differences [46]. As a supervised learning concept, classification is a process of categorizing a set of data points into classes. In machine learning, a classifier is basically an algorithm that categorizes data into classes. This study used four classifiers, i.e., logistic regression (LR), support vector machines (SVM), random forest (RF), and categorical boosting (CatBoost).
This study tried 64 models, which are coded by the rules shown in Figure 3. The value of the first four bits is represented by the binary numbers 1 and 0, with 1 indicating used and 0 unused. The first part refers to feature selection, the second to SMOTE, the third to one-hot encoding, the fourth to standard scaler, and the last part is the first letter of the classifier’s name. For example, a model code of “0101R” means that the model uses SMOTE, standard scaler and RF, and does not use feature selection and one-hot encoding.

3.2.2. Classification by Four Classifiers of Machine Learning

In terms of classification, there are many classic machine-learning algorithms, such as LR, SVM, etc. Recently, emerging algorithms are increasingly used, such as RF and CatBoost. In order to select a more suitable classifier, this study uses four classifiers, i.e., LR, SVM, RF and CatBoost.
Based on the natural logarithm, LR follows a logistic S-curve. Classification is determined by the probability of an outcome. SVM includes a set of related supervised learning methods to make prediction and regression. The statistical learning theory and structural risk minimization underlie the learning algorithms of SVM. According to Antwi-Afari et al. [47], SVM shows comparable or even better results than other machine-learning methods. RF is an ensemble of decision trees. It employs a bagging method to achieve classification. Each node is split using the best predictor from a subset of predictors chosen randomly at that node. As it is more robust in terms of generalizability than the decision trees, RF plays an important role in machine learning, such as the works of Niu et al. and Poh et al. [45,48]. Recently, decision trees have been extended to the family of gradient boosting algorithms, such as eXtreme Gradient Boosting (XGBoost), Light Gradient Boosting Machine (LightGBM), and Categorical Boosting (CatBoost). In particular, CatBoost is a framework based on oblivious trees. It has few parameters, supports categorical variables, and deals with categorical features in an efficient and reasonable manner. Furthermore, it modifies gradient computation to avoid a prediction shift in order to improve model accuracy. The results of a three-algorithm comparison show that CatBoost achieves the best results [49] despite the small differences among them.

3.2.3. Model Tuning and Hyperparameter Optimization by MOSMA and LOO

In some cases, over-fitting the data is an issue during the machine-learning process, resulting in poor generalizability. One of the most acceptable resolutions is to tune models and optimize parameters. This study uses an algorithm named slime mould algorithm (SMA) to tune the classifiers automatically. SMA is inspired by the behavior of slime mould, and has been applied in graph theory and path networks [50,51]. Since five behaviors are modeled in this study, a multi-objective SMA (MOSMA) is used to search the maximum average scores for these five behaviors. According to Houssein et al. [52], the MOSMA consumes significantly less training time than traditional optimization algorithms such as grid-search. Moreover, leave one out (LOO) cross-validation is fitting for those cases with a small sample size. For n samples, the number of training samples is n-1, while only one sample is left out for validation. This train-validation process is repeated for n times, and fully utilizes the dataset of the training dataset. Since there is no random sampling, bias is eliminated by LOO cross-validation [45]. Therefore, it is reasonable to combine LOO and MOSMA to find optimal settings in order to maximize the generalizability of the model.

3.2.4. Three Methods for Feature Selection

This study employs a combination of three traditional feature selection methods, i.e., feature importance (FI), Chi-square test (CT) and Boruta selection (BS).
When the variables in the dataset have varying degrees of influence on the five (un)safety behaviors, focusing on the most important features is critical for gaining a better understanding of them, respectively. To some extent, FI represents the diverse effects of various features. However, it does not entirely capture the association between the features and the safety behaviors, nor does it determine whether the feature has a positive or negative impact. In this regard, CT and odds ratio (OR) can make up for this deficiency, as they can not only calculate the correlation between features and safety behaviors, but also can reveal the nature of the impact (i.e., positive or negative). BS is a novel feature-selection algorithm for finding all relevant variables [53]. According to Poh et al. [45], BS has a critical advantage over ordinary feature-selection techniques in that it may pick the input variable in a robust and unbiased manner by using bagging schemes and including statistical confidence tests into its selection process.
Features are preserved in each iteration if more than half of the votes are in favor of passing. On the contrary, they are returned to the prediction part of modeling until the maximum score is achieved. For instance, Table 2 explains how to make selection decisions regarding three input indicators, i.e., NatClit, DeptRsp, and TMX1.

3.3. Optimal Model Acquisition

There are many indicators to evaluate the final training model’s performance. For simplicity and efficiency, this study employs common indicators, including area under the curve of receiver characteristic operator (AUC), accuracy, precision, recall, and F1-score [48]. Accuracy, precision, recall, and F1-score are partial performance indicators, whereas AUC is a comprehensive indicator. They are defined by the following functions, which are based on the confusion matrix.
A U C =   I ( P positive , P negative   ) M × N
where I ( P positive , P negative   ) = { 1 ,   P positive   > P negative   0.5 ,   P positive   = P negative   0 ,   P positive   < P negative   , M and N are the numbers of positive and negative samples in the dataset, respectively.
Accuracy   = T P + T N T P + T N + F P + F N
Precision   = T P T P + F P
R e c a l l = T P T P + F N
F 1 s c o r e = 2 × P r e c i s i o n × R e c a l l   Precision   + R e c a l l

4. Results

4.1. Necessity of Tuning Models and Optimizing Parameters by MOSMA

Since the sample was randomly divided into training and test sets, it is necessary to limit the error of the model by tuning models and optimizing parameters. This study used the MOSMA method, which is rarely employed in the construction safety domain. Using the average of the outcomes of 10 random divisions as the final performance score, this study compared the performance of the MOSMA and the traditional grid-search method. Figure 4 shows the average AUC scores of the four classifiers for the five behaviors, and Figure 5 shows the average accuracy and F1-scores. From these two figures, it can be concluded that CatBoost–MOSMA has the maximum classification performance, and hence, is used for feature importance analysis later on.

4.2. Performance of Different Models

As mentioned above, this study has tried 64 models. Figure 6 depicts their performance in terms of AUC, accuracy, and F1-score. As can be seen from Figure 6, the models coded as “1111C” (No. 64) and “1010C” (No. 40) have satisfactory performance. In the former model, four methods (i.e., feature selection, SMOTE, one-hot encoding, and standard scaler) and the classifier of CatBoost are employed. In the latter model, two methods (i.e., feature selection and one-hot encoding) and CatBoost are used. The former model yields the maximum AUC of 0.9175, accuracy of 0.8075, and F1-score of 0.6497. Although the F1-score of 0.6497 is not the highest, it ranks the upper-middle among all models. The latter model yields the AUC of 0.8970, accuracy of 0.8583, and the maximum F1-score of 0.7725. Since No. 64 model garners the maximum AUC, which is a comprehensive performance indicator, the following sections report results from it.

4.3. Feature Selection

After feature selection, different numbers of input indicators are supposed to account for different safety behaviors. As shown in Figure 7, SB1 needs to consider the fewest input indicators (i.e., 25), while SB5 needs to consider the most input indicators (i.e., 35). Despite that, there are ten input indicators that account for all of the five safety behaviors in common. The ten input indicators are affiliation (coded as AffRes), contract value (coded as ConSum), clients setting safety goals (coded as CI2), very clear safety rules, policies, and procedures (coded as SSRP2), safety rules not allowed to be violated (coded as SSRP3), colleagues understanding my job needs (coded as TMX4), project managers seeking safety suggestions (coded as SC2), timely accident reporting (coded as SC4), safety ownership (coded as SM2), and risk reduction at workplace (coded as SM4).

4.3.1. Feature Importance

The importance of all input indicators for all the five safety behaviors is shown in Table 3. The top three important indicators for the five safety behaviors are highlighted. For example, regarding SB5, the top three important indicators are contract value (coded as ConSum), project managers seeking safety suggestions (coded as SC2), and affiliation (coded as AffRes). This indicates that construction personnel on projects with larger contract value, construction personnel on projects where project managers seek more safety suggestions, and those personnel from the client are more likely to use all necessary safety equipment on site.

4.3.2. Correlation and OR Values

As mentioned earlier, FI reflects the relative importance of different input indicators for each safety behavior but it does not show whether they exert positive influence or negative influence. In order to make up for this deficiency, correlation analysis based on CTs with OR values is carried out. Table 4 shows the results of correlation analysis for SB1 (i.e., use all necessary safety equipment to do the job). If the p-value is significant and the OR is above 1.0 along with the confidence interval, then with feature SB1 is more likely to take place. If the p-value is significant and the OR is below 1.0 along with the confidence interval, then feature SB1 is less likely to happen. From Table 5, it can be concluded that the drivers of SB1 are GC1, SSRP3, CI3, LMX1, TMX4, SC2, and SM2, among others. OR values between the five safety behaviors and all of the input indicators are shown in Figure 8. At least two points deserve mentioning. First, different sets of drivers are behind different safety behaviors. For example, ConSum has more impacts on SB3 and SB4 than on SB1. Second, some indicators can be omitted in establishing the classification framework, such as StgProj, Gender, Age, EduRsp, and DriHab, because they have no bearing on any of the five safety behaviors.

5. Discussion

5.1. Findings

This study has achieved the two objectives mentioned earlier, and has theoretical, practical, and methodological implications.
First, in theory, safety behavior as an emergent property of a complex socio-technical system has different drivers. Using machine learning, this study supports the proposition. In particular, this study found that in order to encourage personnel to use all necessary safety equipment on the job (i.e., SB1), clients should set examples for contractors and consultants, safety motivation should be enhanced, and clients, private clients in particular, are encouraged to be involve in safety management as early as possible. In projects with a large contract sum, older personnel with more dependents to support is more likely to follow safety procedures on the job (i.e., SB2). In projects with a large contract sum, construction personnel are more likely to promote safety programs willingly (i.e., SB3) with clients actively engaging in safety management. In public projects with a large contract sum, personnel is encouraged to pursue professional development, and hence, more likely to put in extra effort to improve workplace safety (i.e., SB4). In projects with a sound safety climate and more client involvement, personnel is more likely to help colleagues who are in risky conditions (i.e., SB5). Based on the findings, practicable and targeted measures are proposed to promote the five safety behaviors, respectively.
Second, machine learning has advantage over traditional statistical methods in addressing more complex interrelations among independent variables [
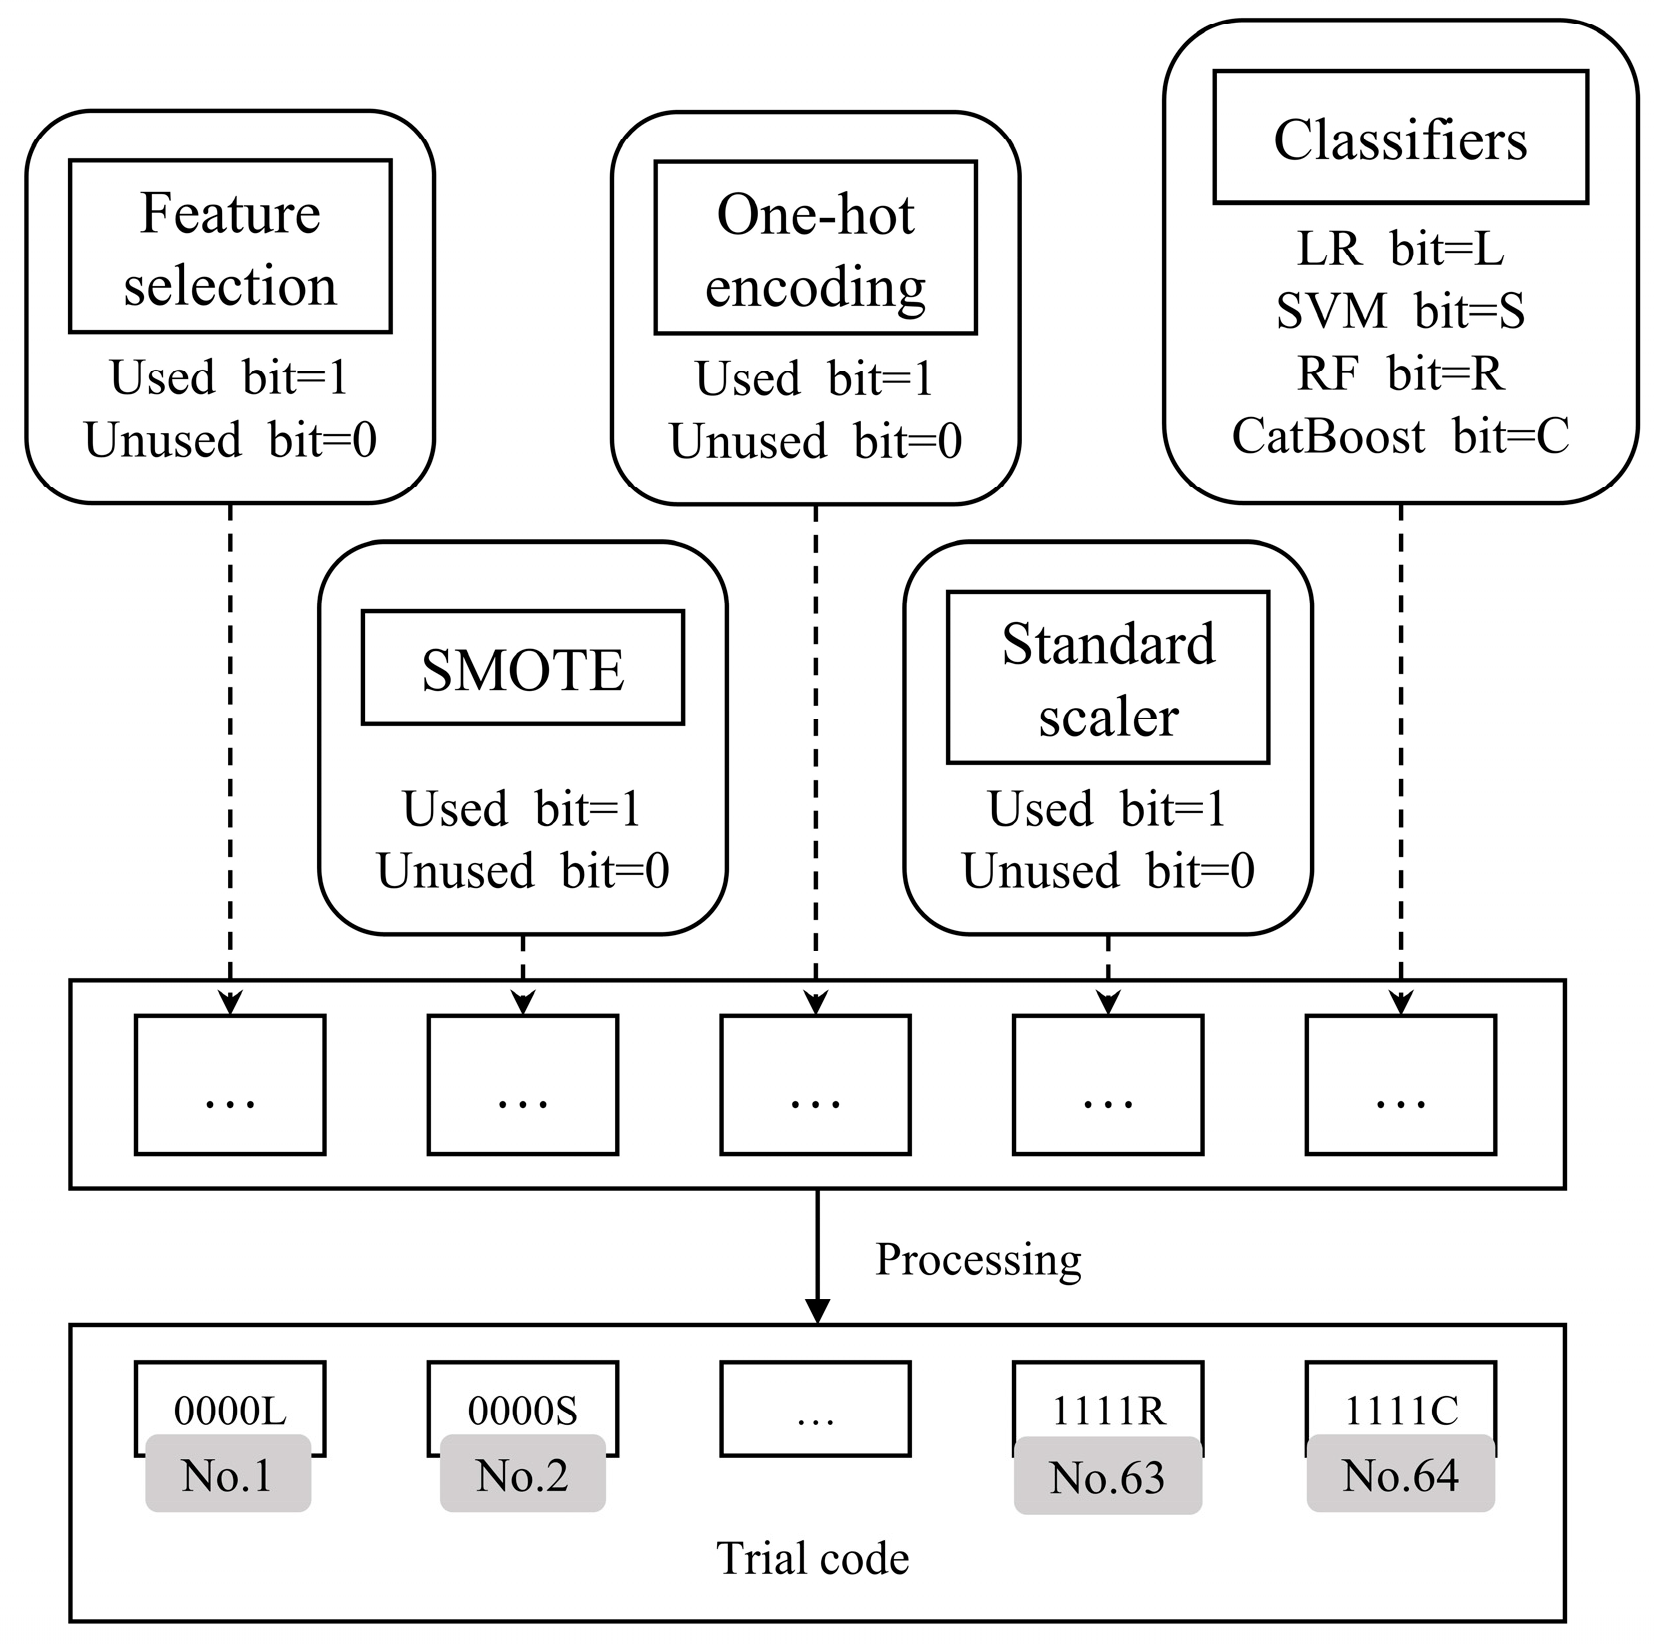
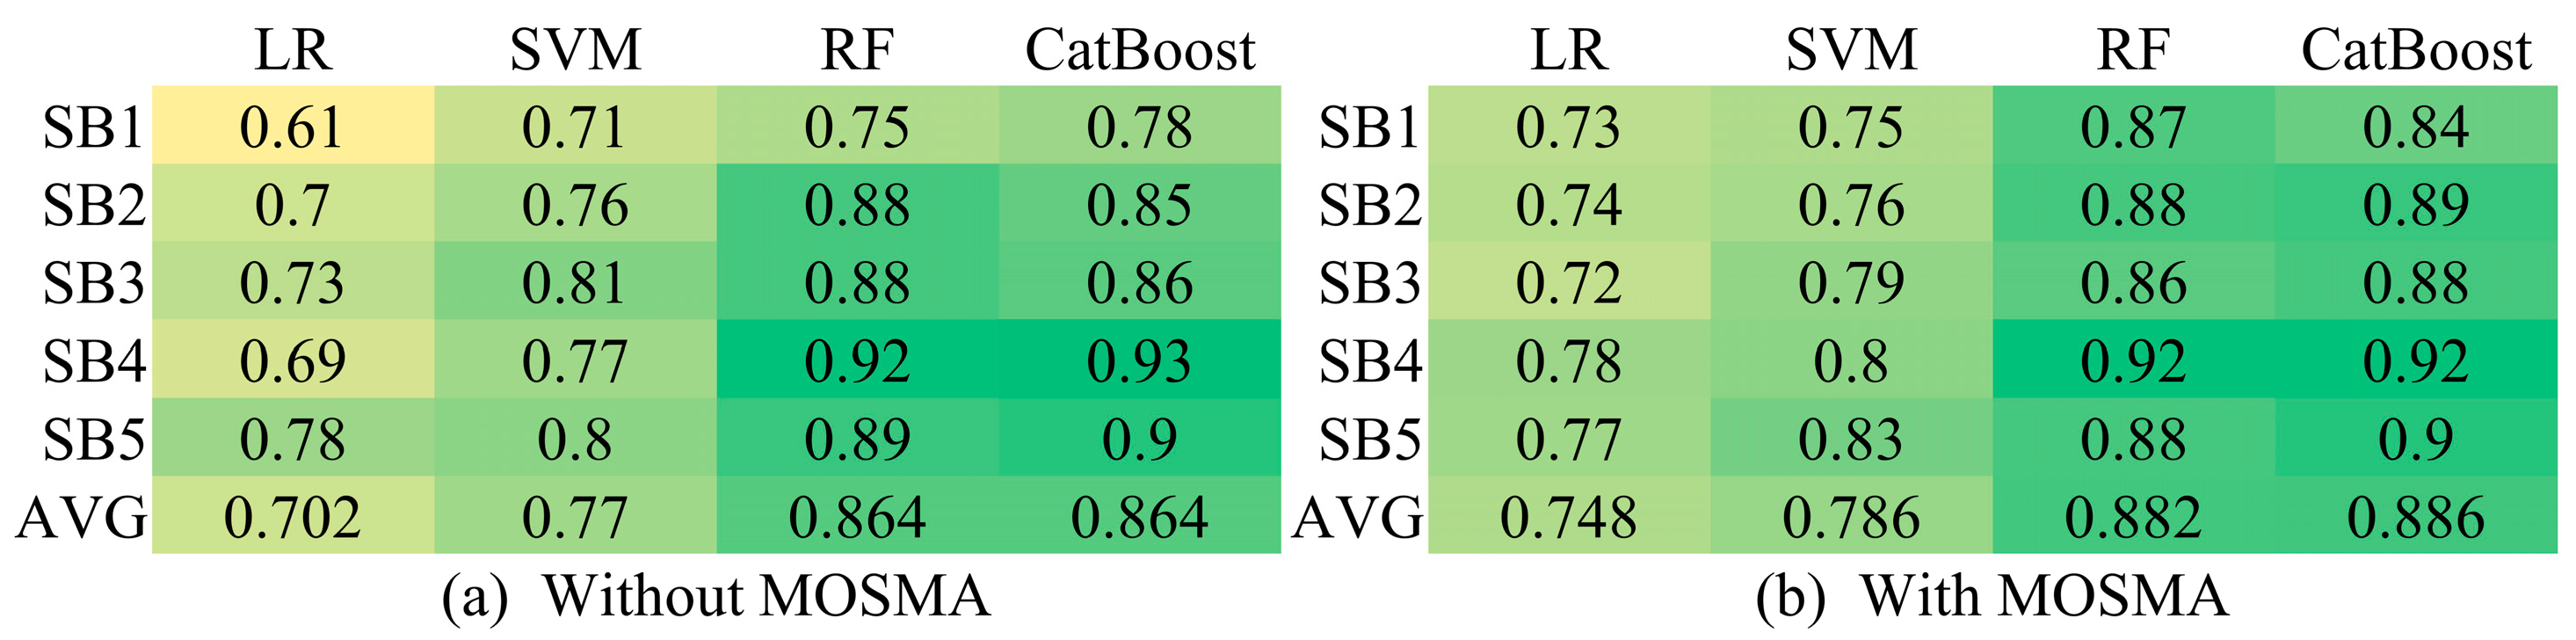
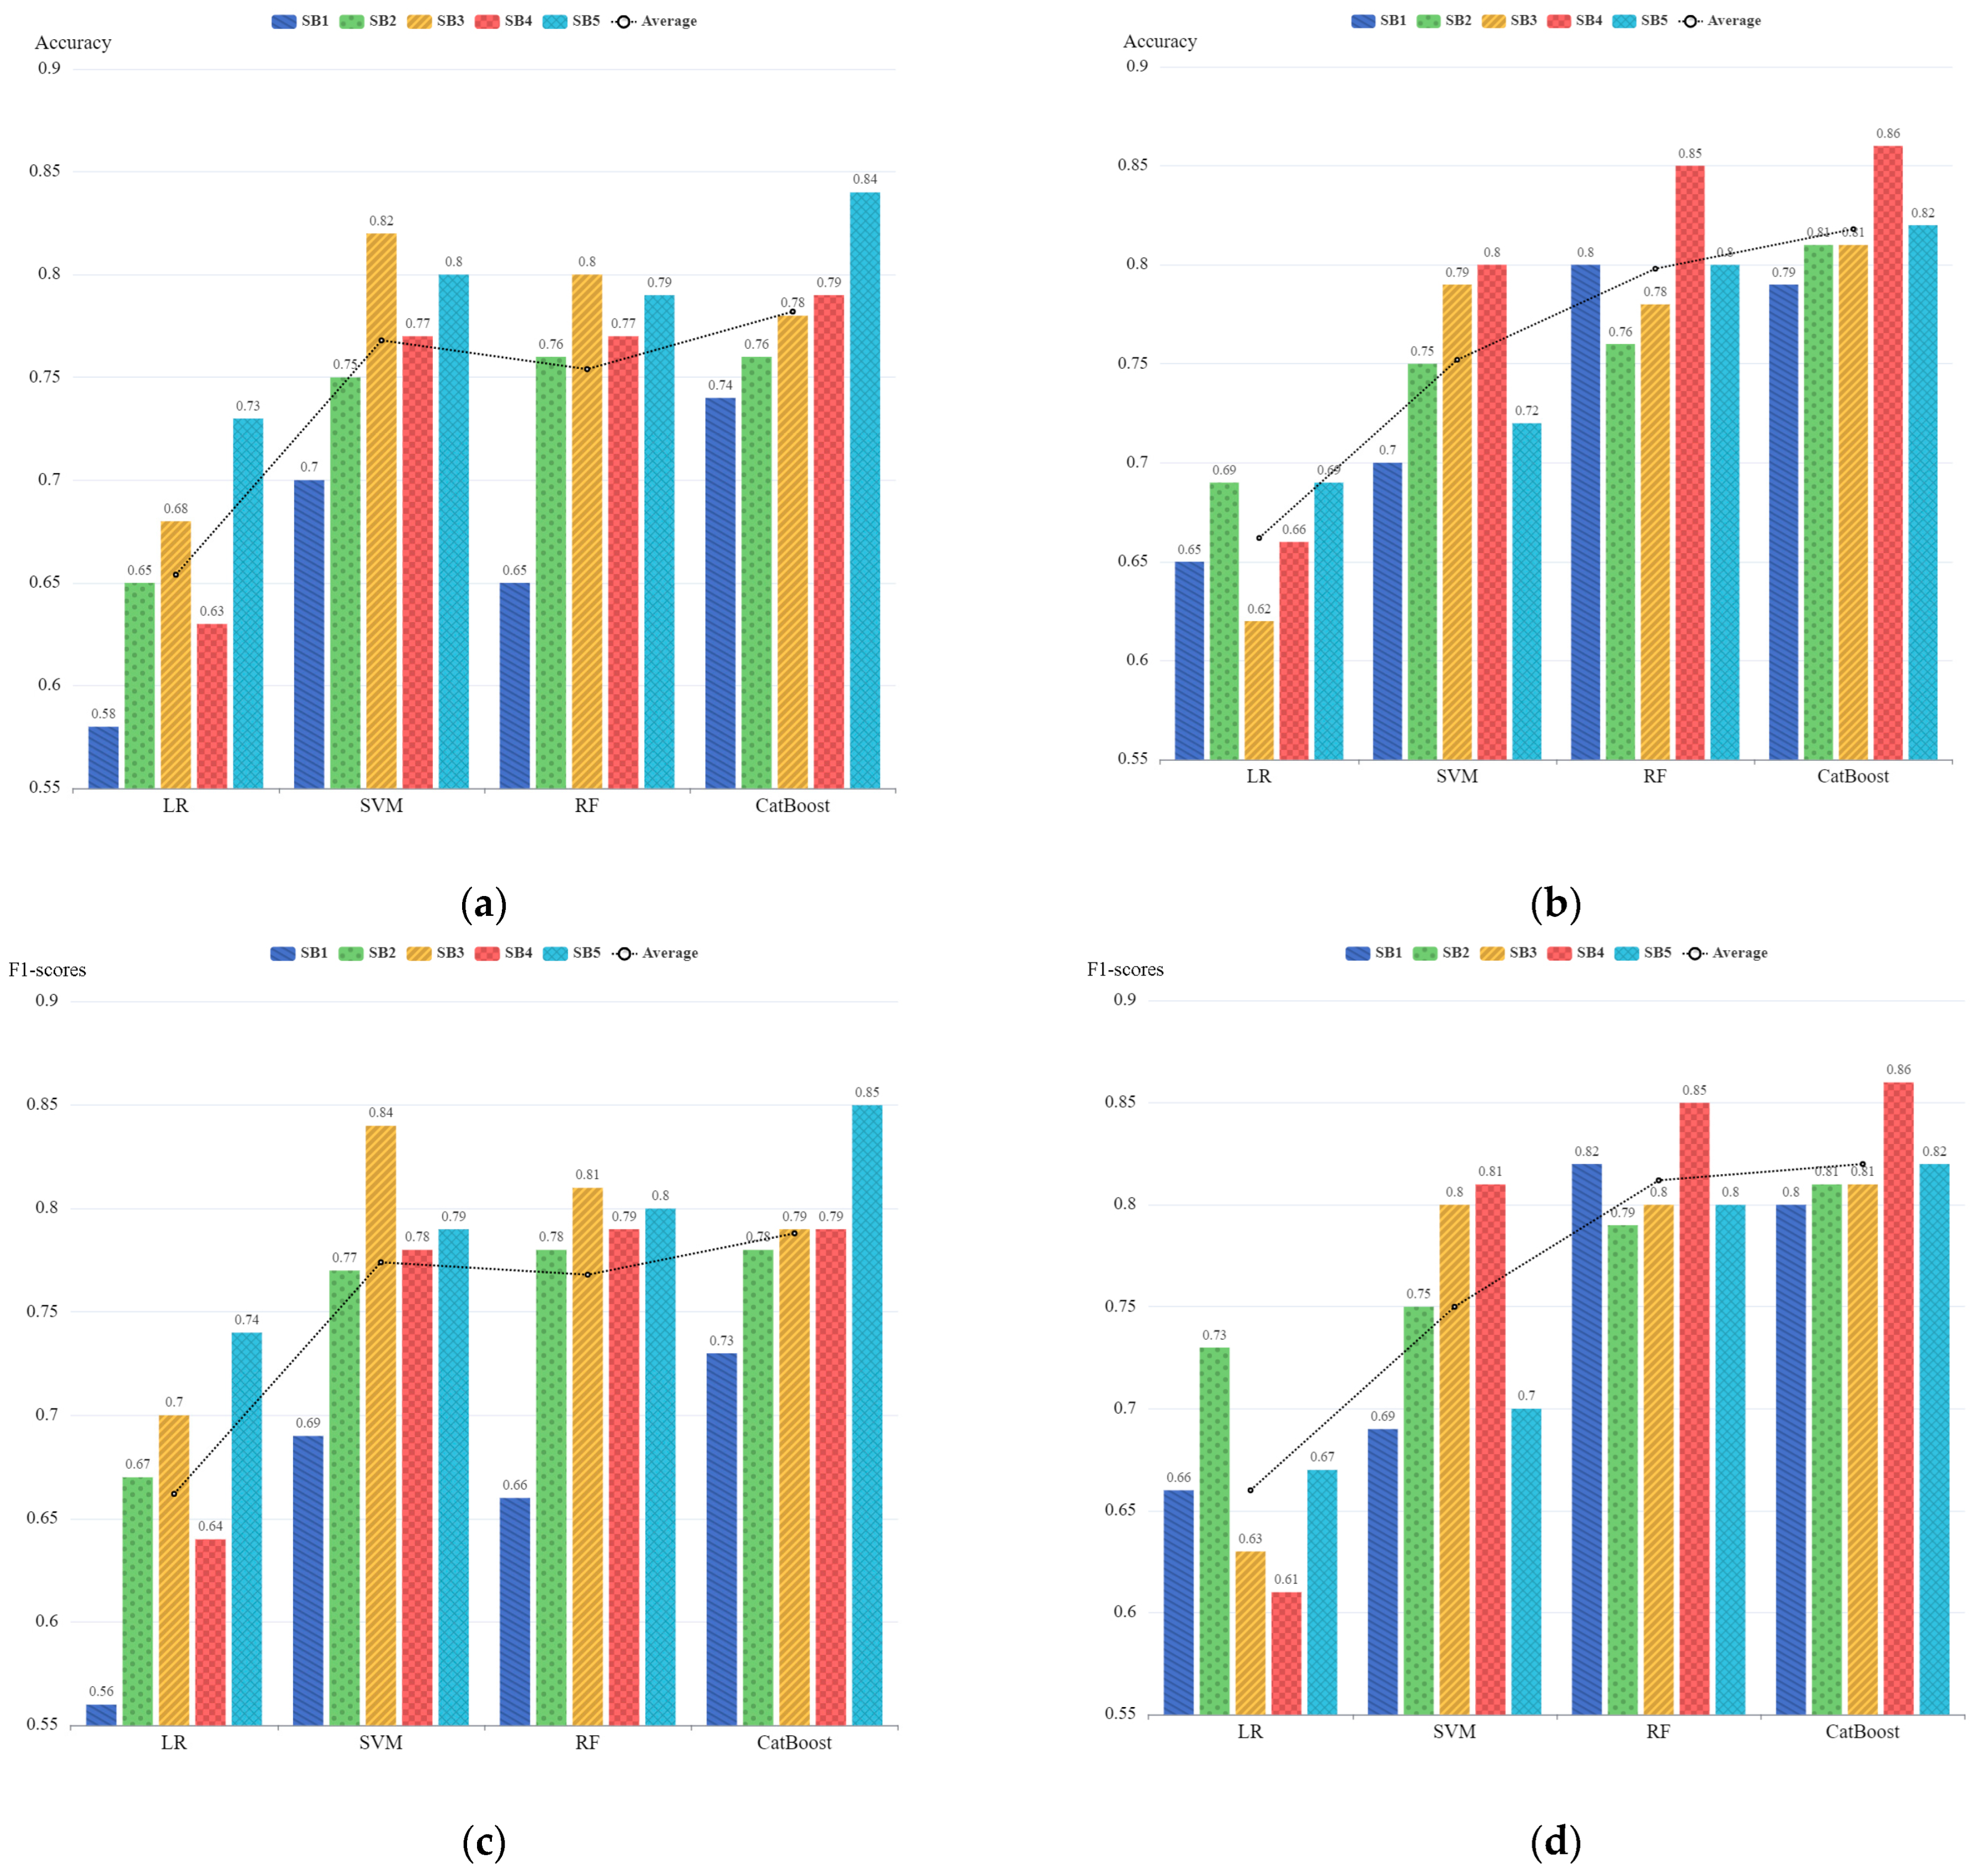
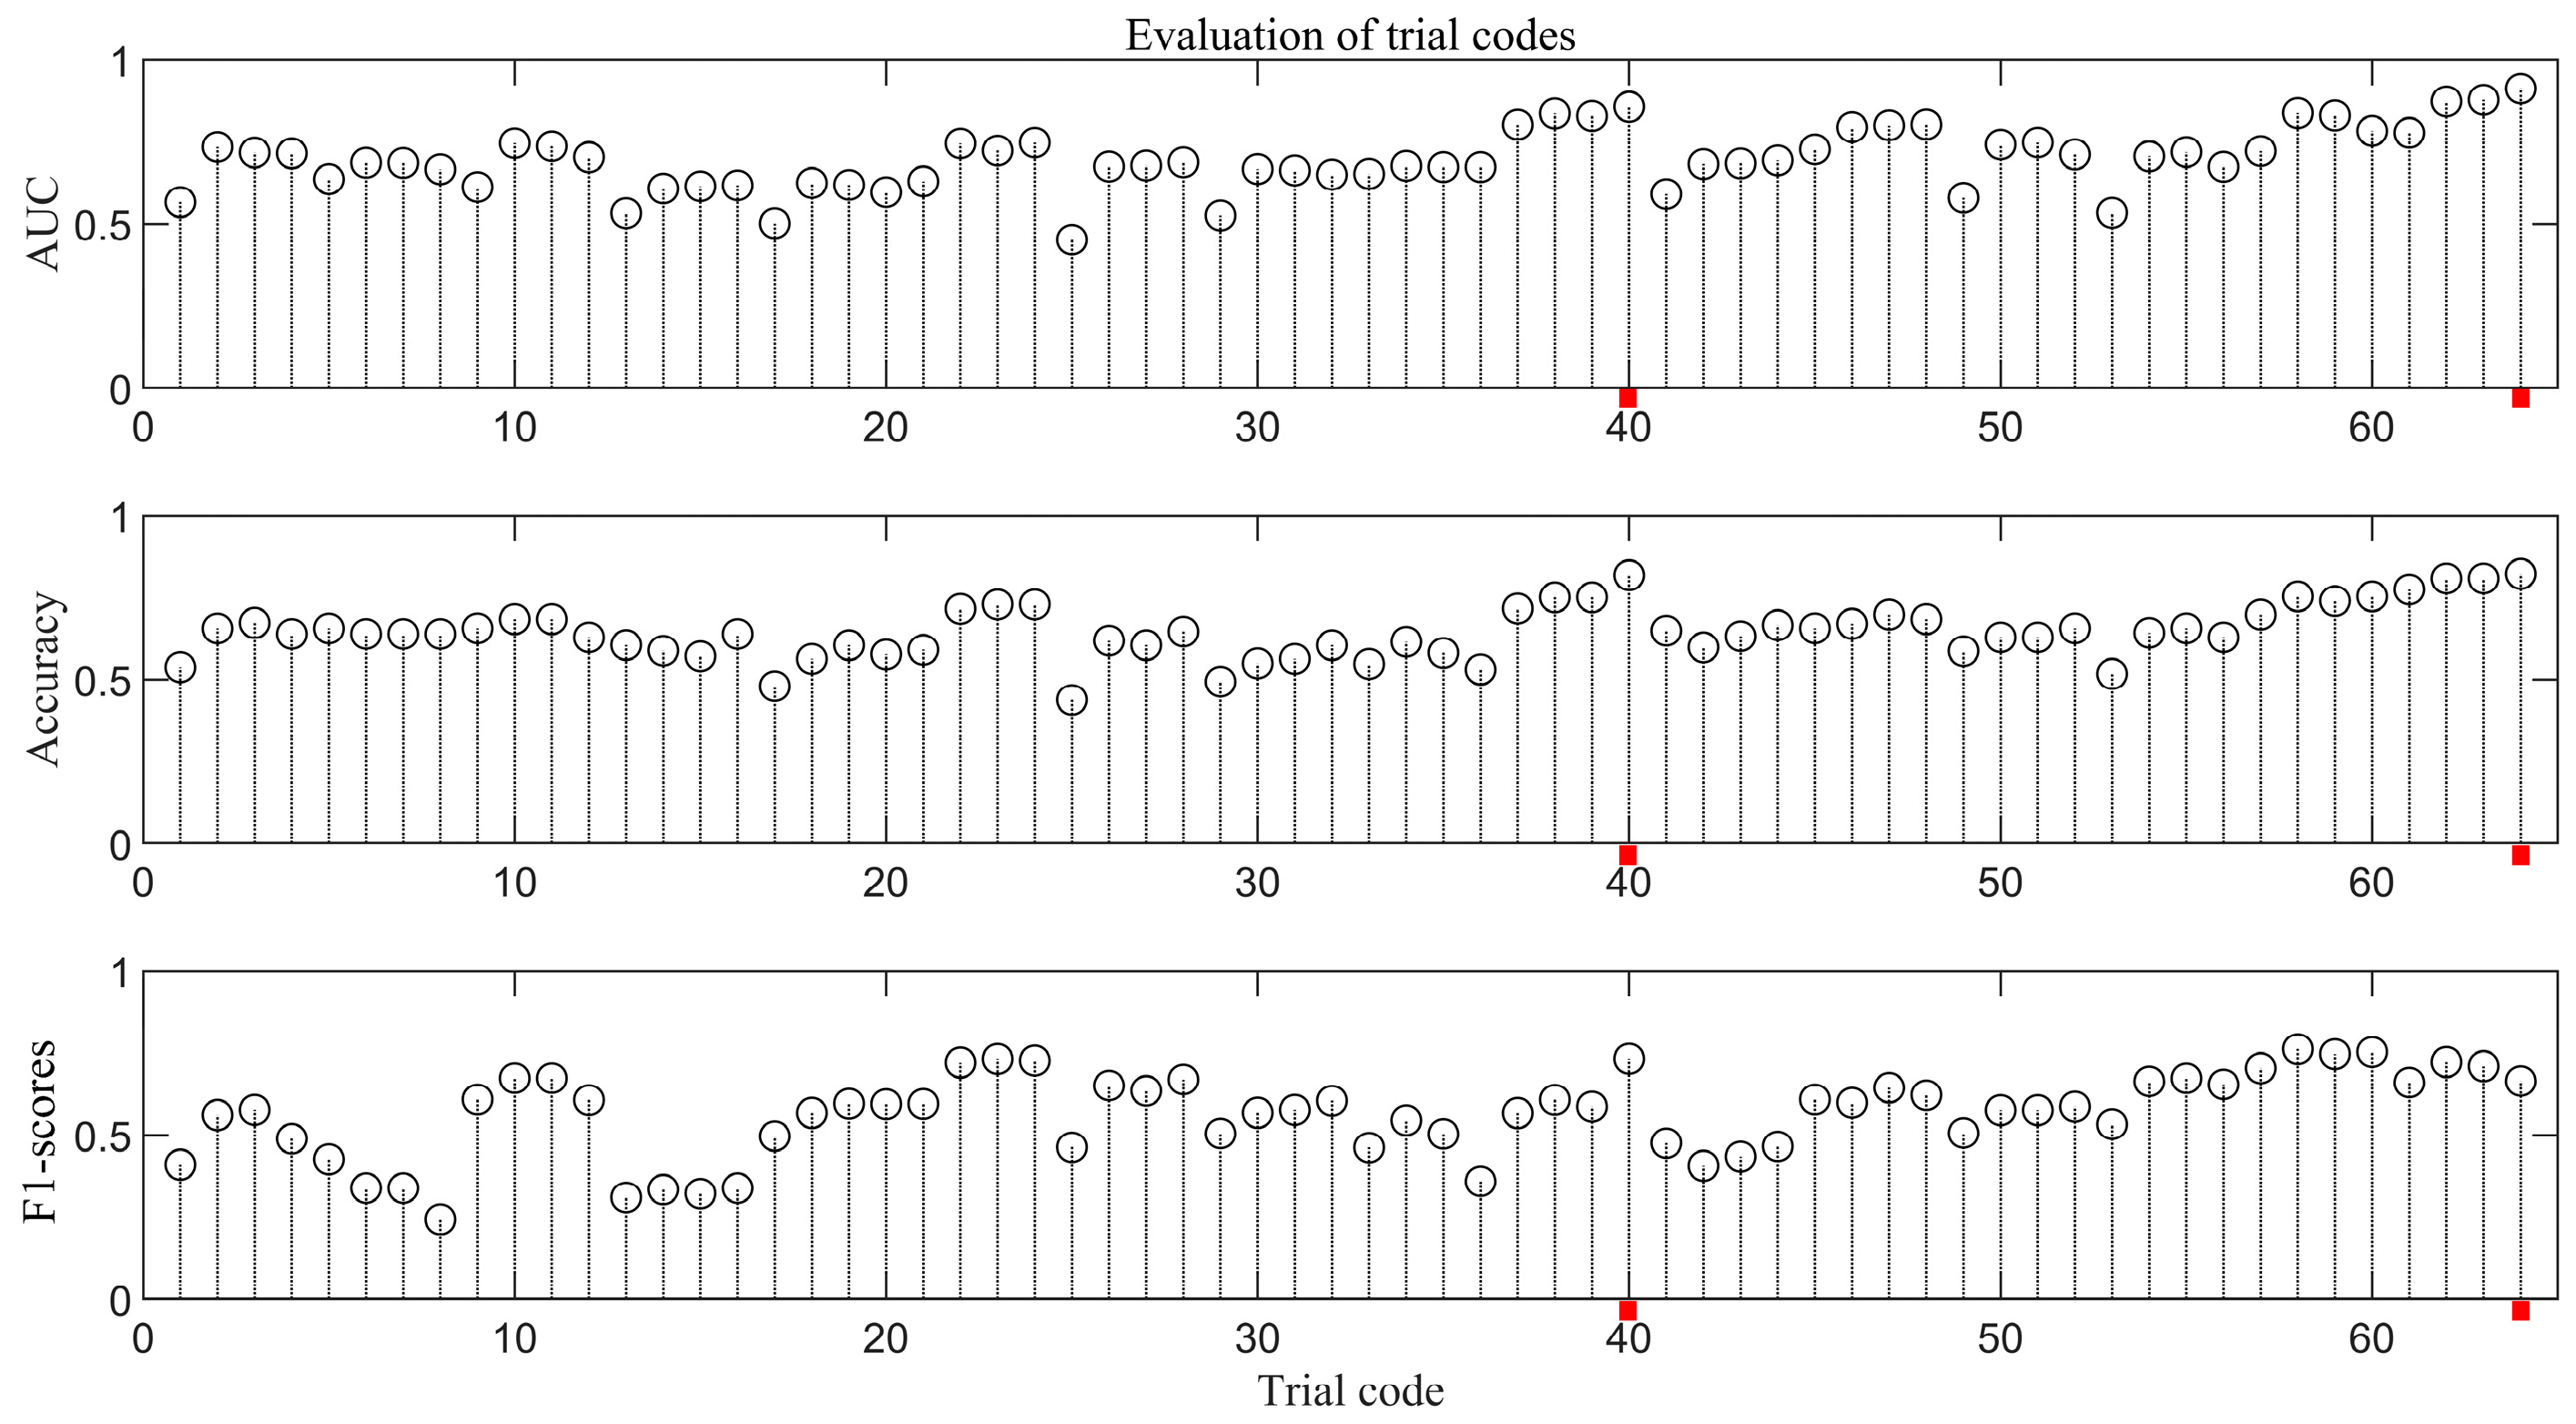
6]. To garner this advantage, this study first evaluates the performance of four common machine-learning methods. Although these four methods achieve the comparatively satisfactory performance, this study develops a combinative method, CatBoost–MOSMA, to train and test the data again. This is because MOSMA has achieved superior performance in hyperparameter tuning, and this study attempts to introduce it into the safety research domain. Through 64 trials, the combinative method has achieved the maximum classification performance, and therefore, is used to establish factor importance. Furthermore, as noted by Poh et al. [45], the imbalanced distribution of the classes is usually an issue in previous research. This combinative method adopts the SMOTE technique to address this issue and obtains more robust results. This is shown in Table 5, which compares the classification performance between the proposed combinative method and other classification methods. Compared with other methods of tuning and optimization, MOSMA achieves a higher accuracy score when using the same classifiers. When the performance of classifiers is not significantly different, MOSMA achieves a higher F1-score. Hence, it can be concluded that the proposed combinative strategy of MOSMA-CatBoost is effective and efficient in classifying binary construction safety behavioral data.

5.2. Limitations and Future Research Directions

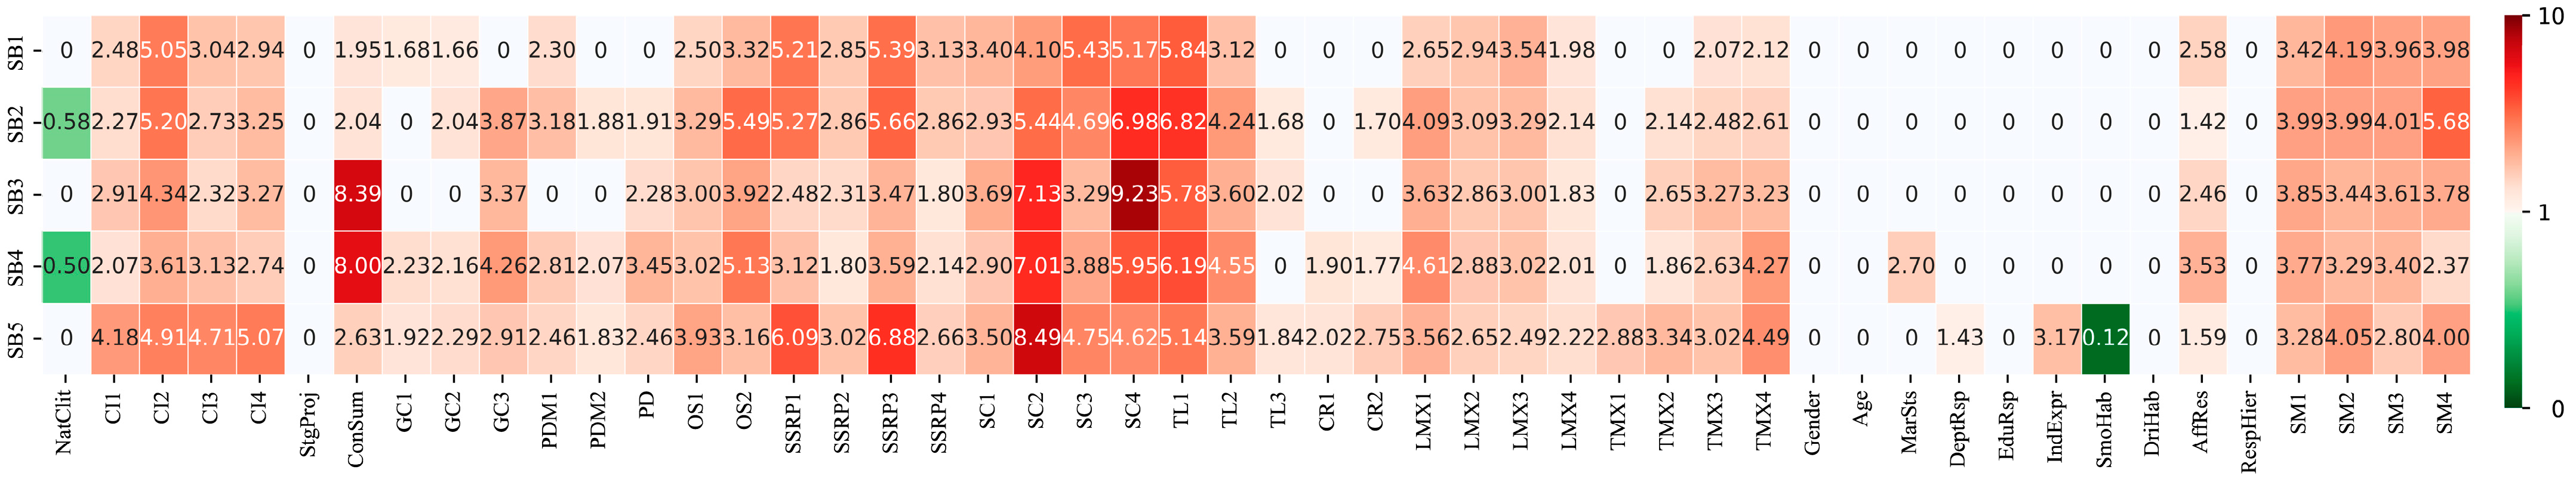
Although the study has achieved its objectives, it has limitations. First, the sample size can be further enlarged. Although a new machine-learning strategy is developed specifically to tackle the small sample size issue and some seminal studies have used a smaller sample set, it is highly recommended that future researches collect more data. Second, the study uses a sample from Hong Kong, and whether the findings can be extrapolated to other countries/regions needs more research efforts. Third, the factors affecting safety behaviors mentioned in the study are not exhaustive, and their interrelationship is not clearcut. Hence, more in-depth research needs to be undertaken in this regard. Fourth, similar to the third one, this study attempts to propose a generic classification framework, and different construction sites are encouraged to tailor the framework to cater for their own needs. Fifth, this study employs a combination of three feature-selection methods, including FI, CT and BS. Only those input indicators that obtain over half votes were retained. In other word, this approach may omit some input indicators that are strongly correlated with some safety behavior. For instance, the input indicator SmoHab is strongly negatively correlated with SB5, but does not correlate with other safety behaviors. Therefore, it has been deleted. It can be seen in the experiment results that this method generally benefits all of the safety behaviors as a whole since the classification performance improves after deleting those input indicators that were only correlated with certain safety behaviors.
Despite these limitations, the classification framework is highly recommended for future research efforts, given its satisfactory performance.

5.3. Practical Use of the Research

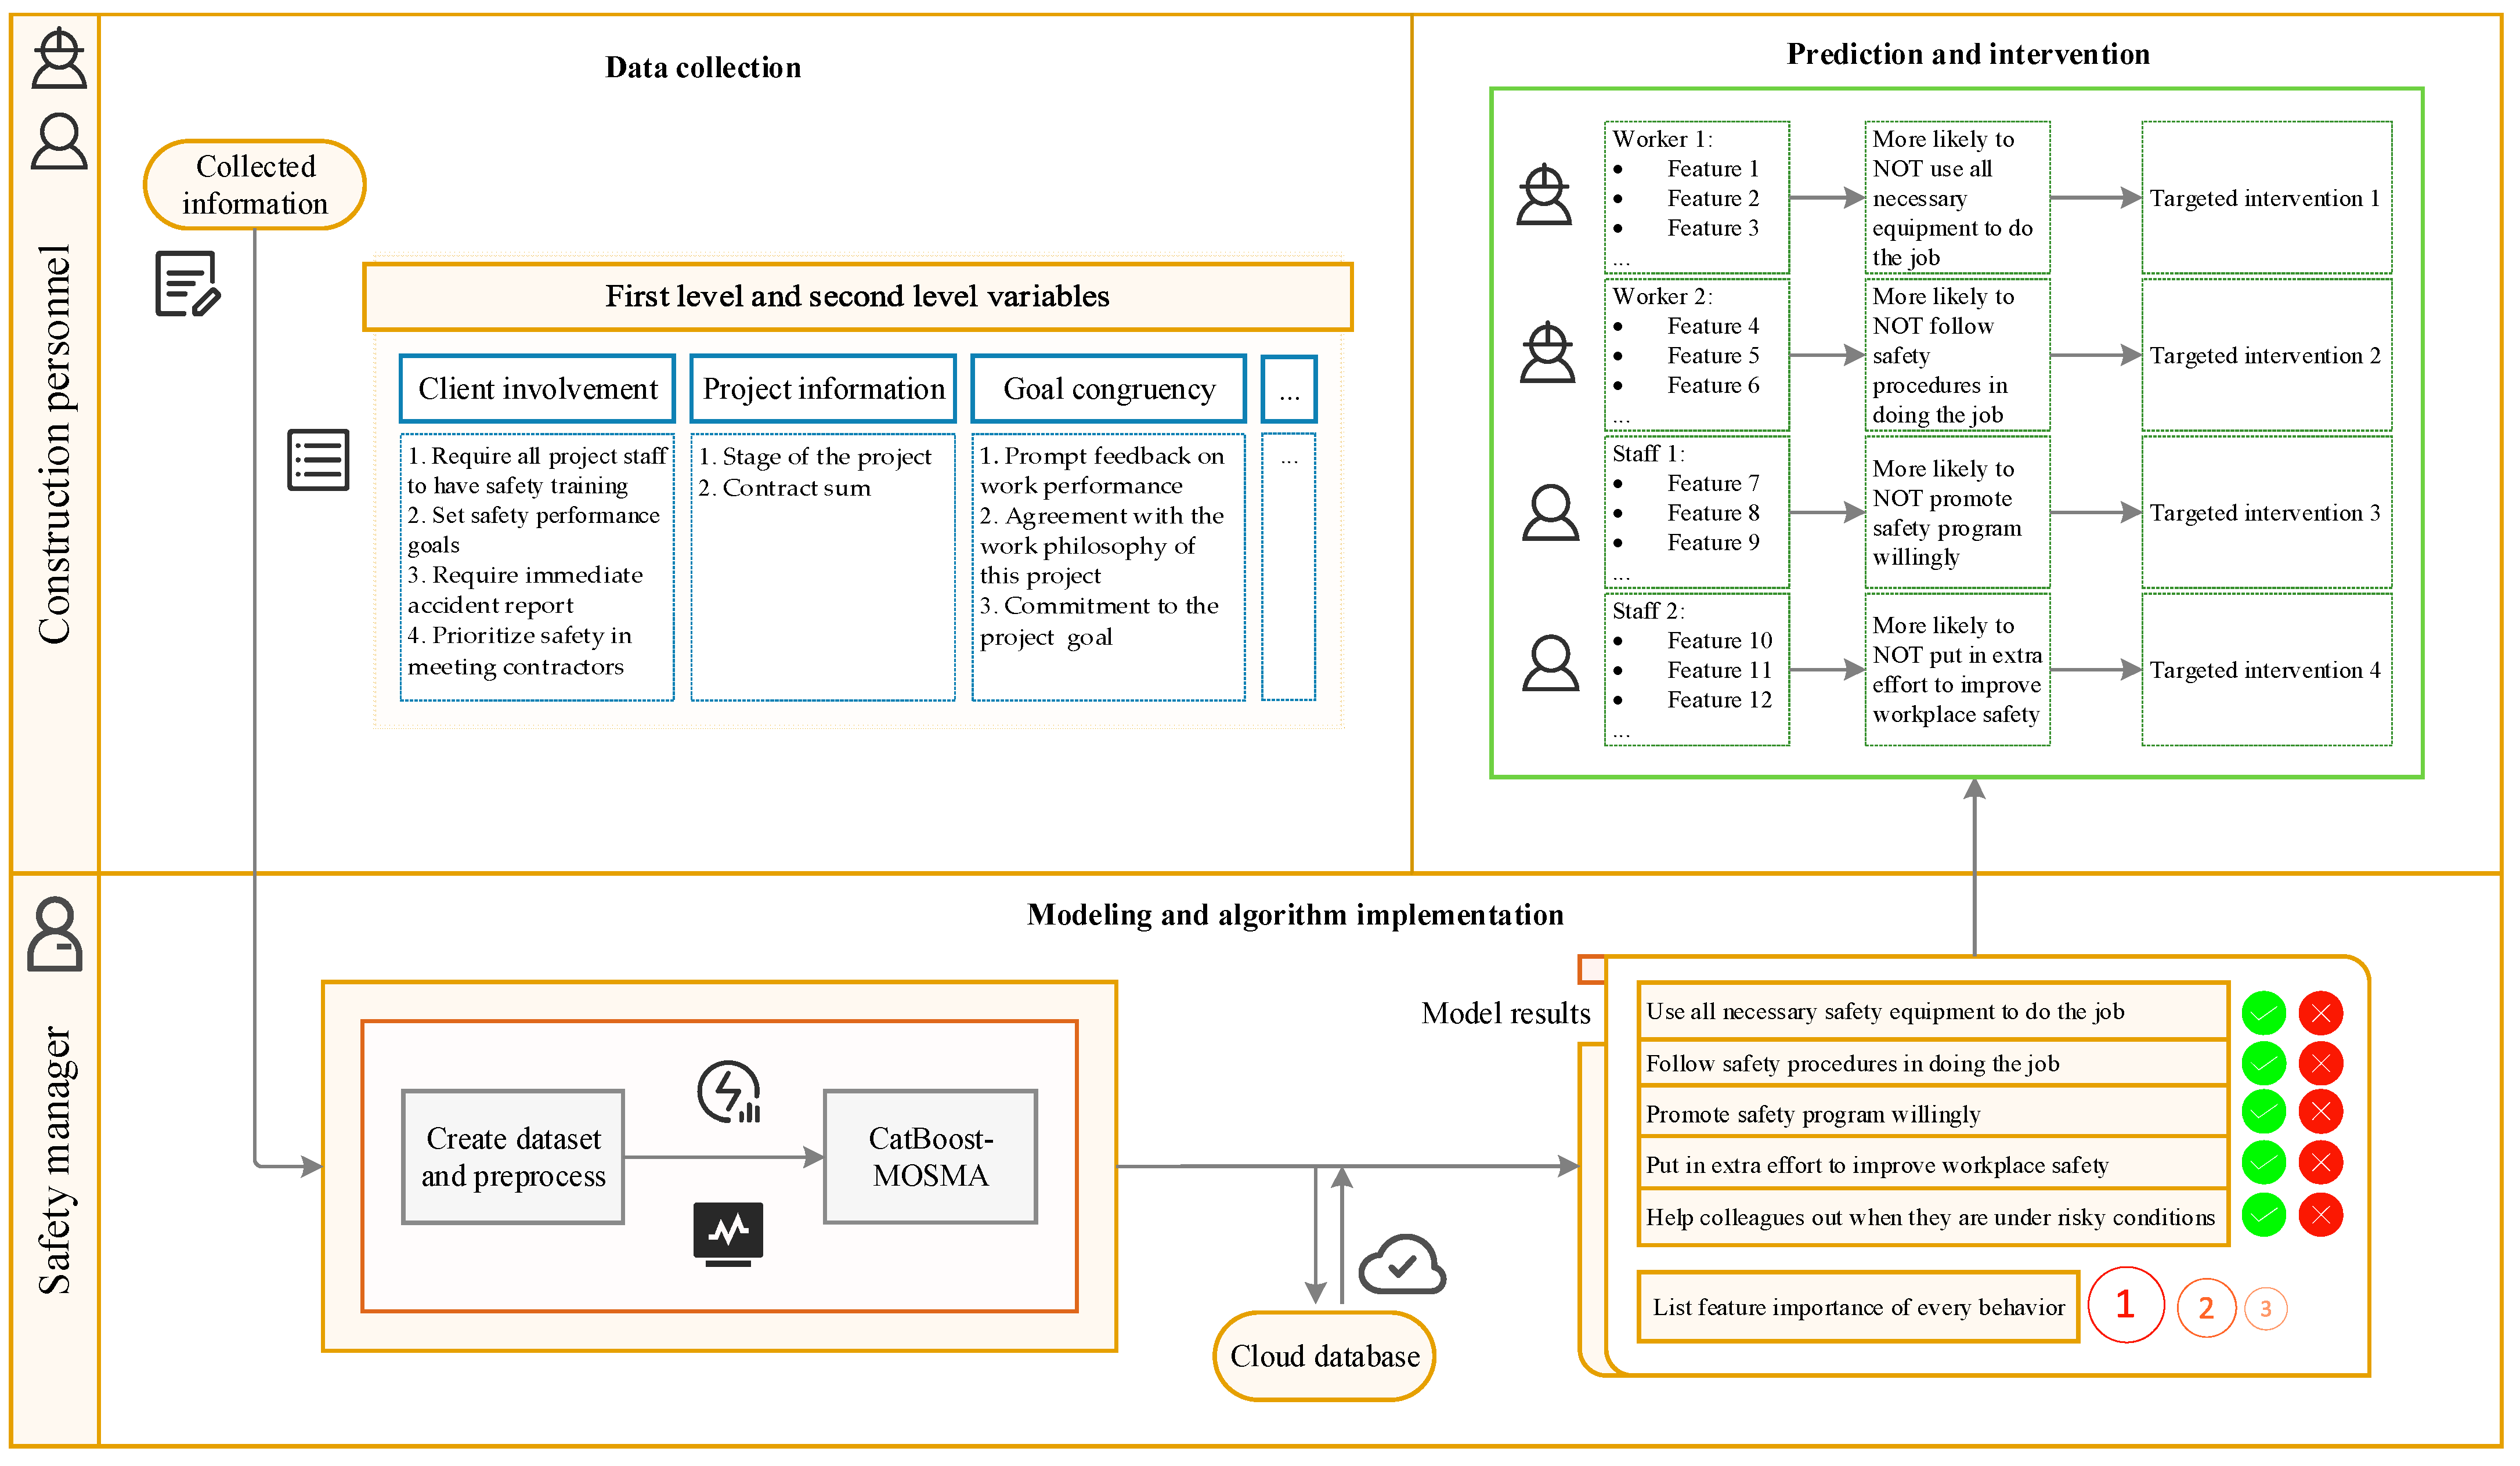
The proposed methods can be used in safety management practice on construction sites, as shown in Figure 9. A survey is conducted with a representative sample of construction personnel on the site, and the data are stored into a safety behavioral database. After training, safety staff is charged with modeling and algorithm implementation and deriving model results, which suggest different safety behavioral orientation associated with different feature patterns. Using a combination of their experience and this data-driven clue, safety staff shall be able to predict a newcomer’s safety behavioral orientation, and then propose and implement targeted interventions. When the prediction performance turns out to be unsatisfactory, a new round of survey begins, and more data are stored in the database. Complemented with their gut feeling, this data-driven decision support system is supposed to help deter unsafe behaviors on construction sites in an efficient and effective way.

6. Conclusions

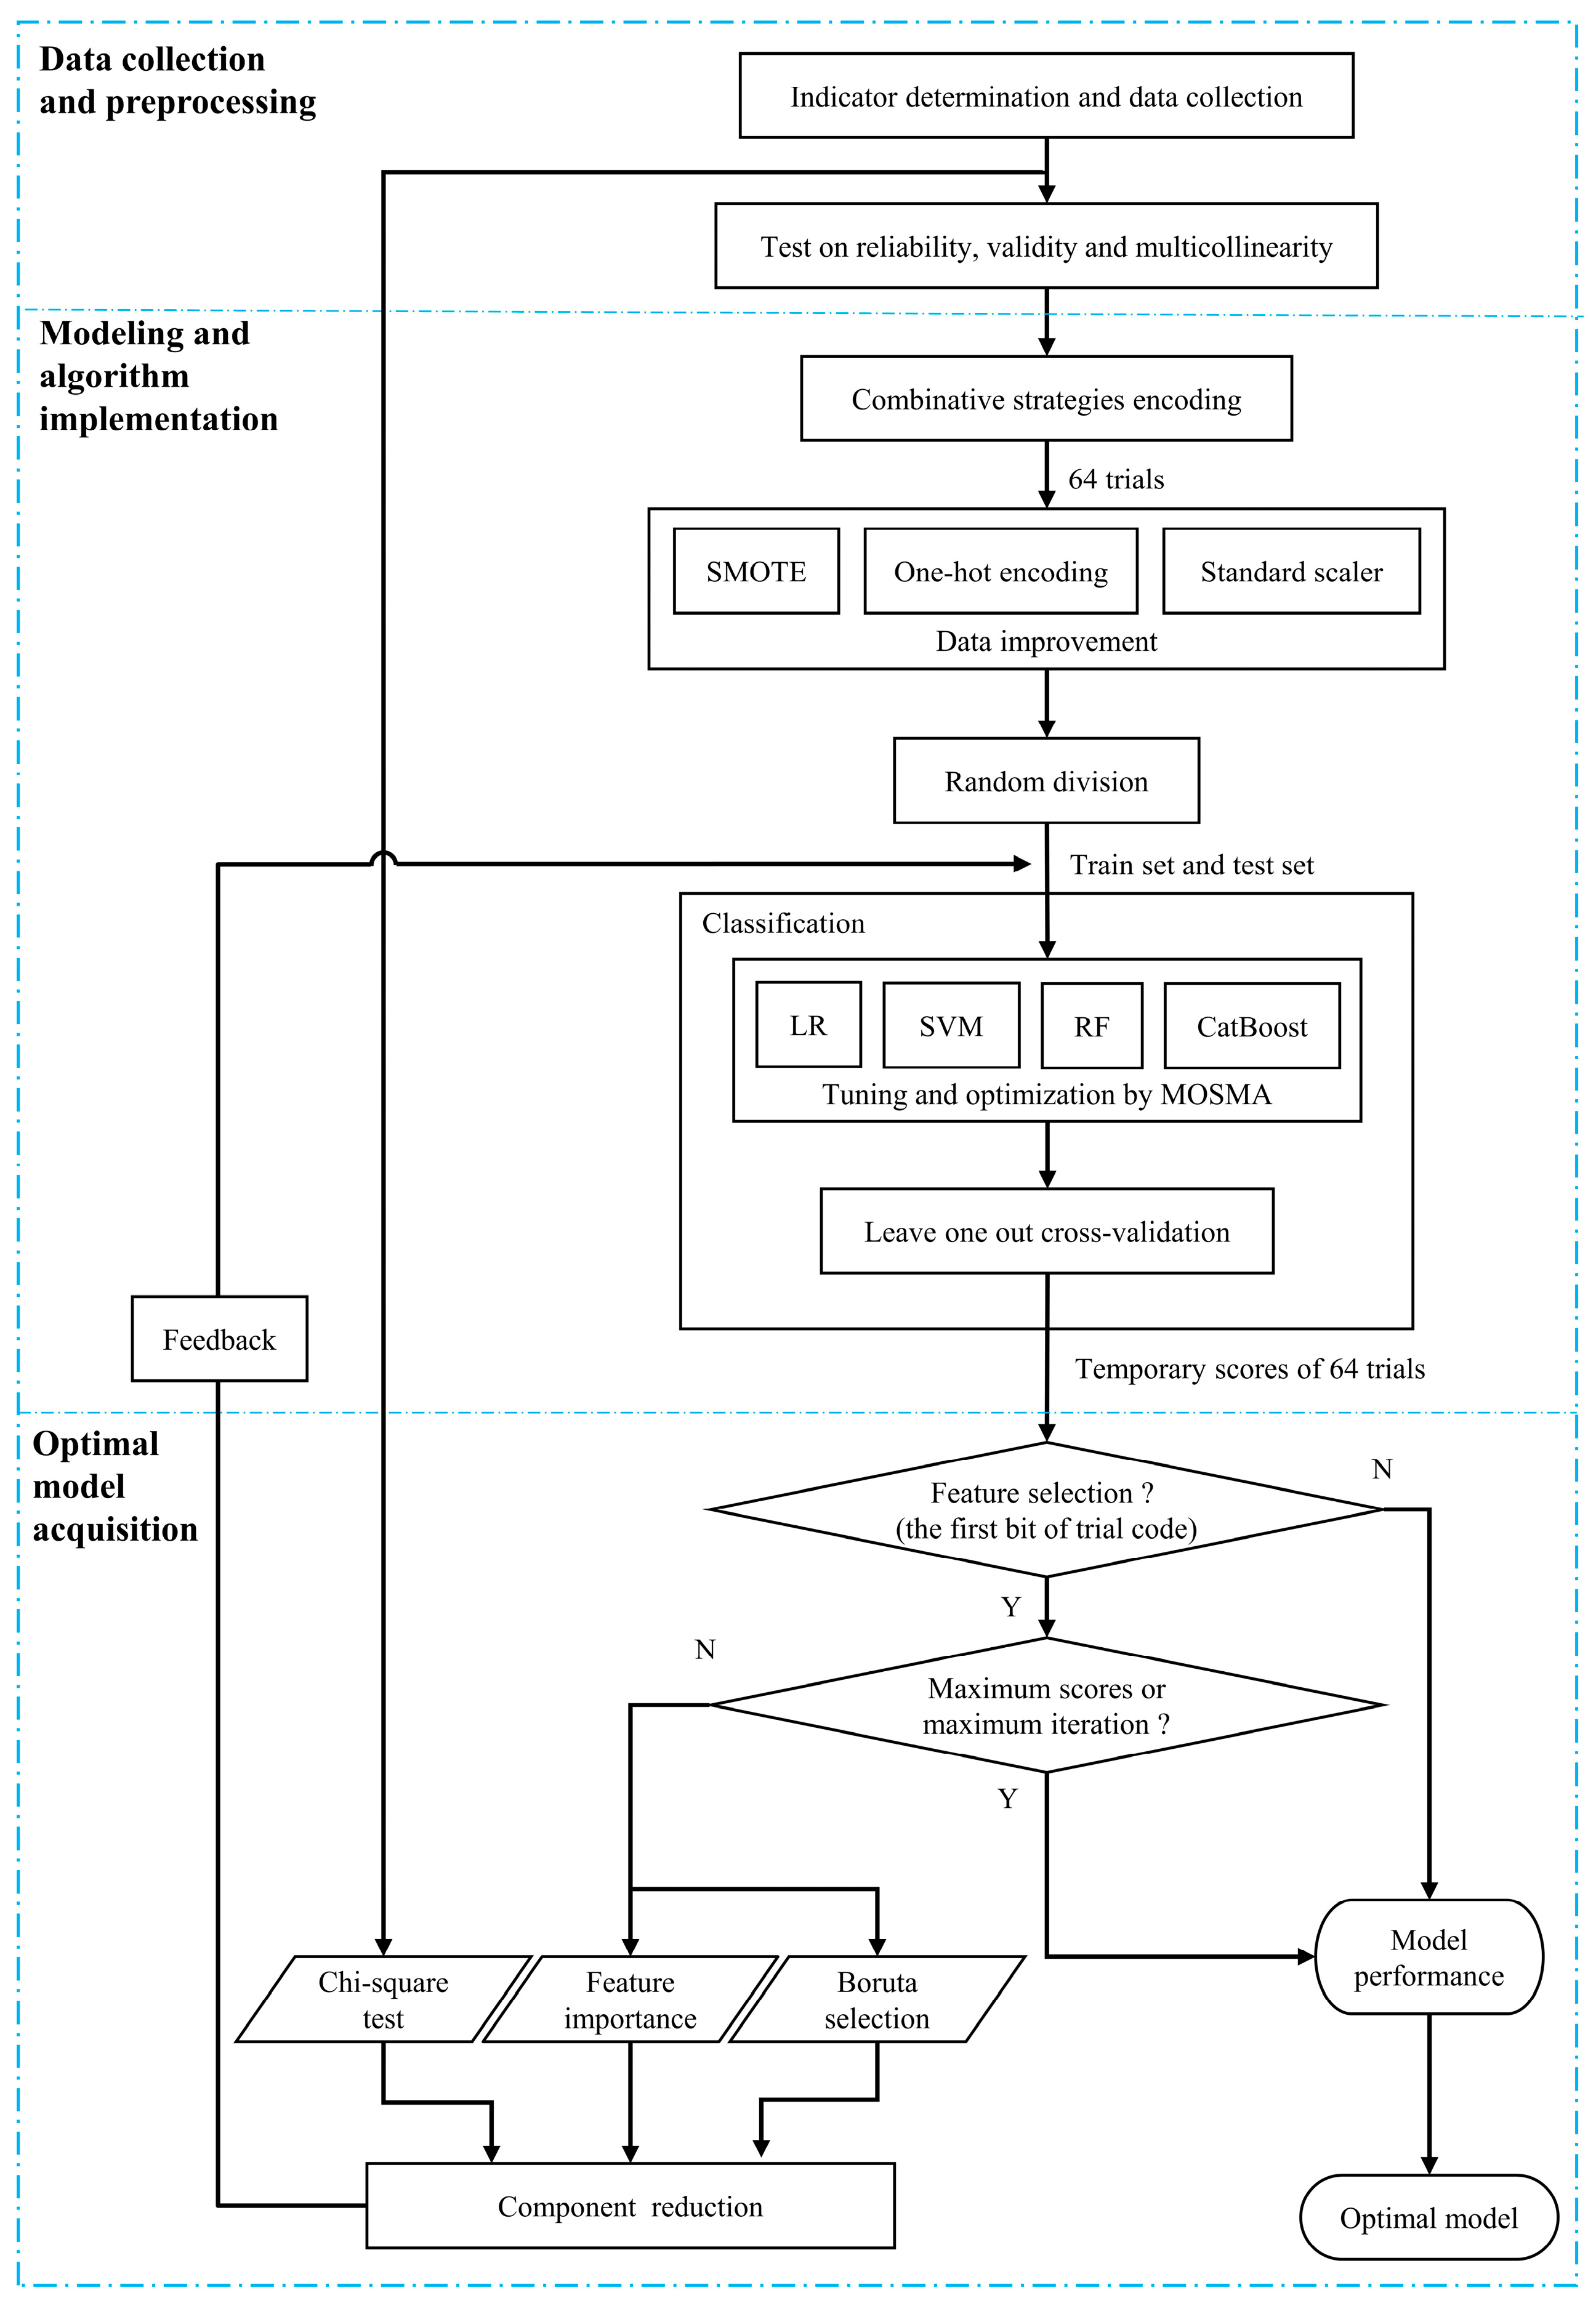
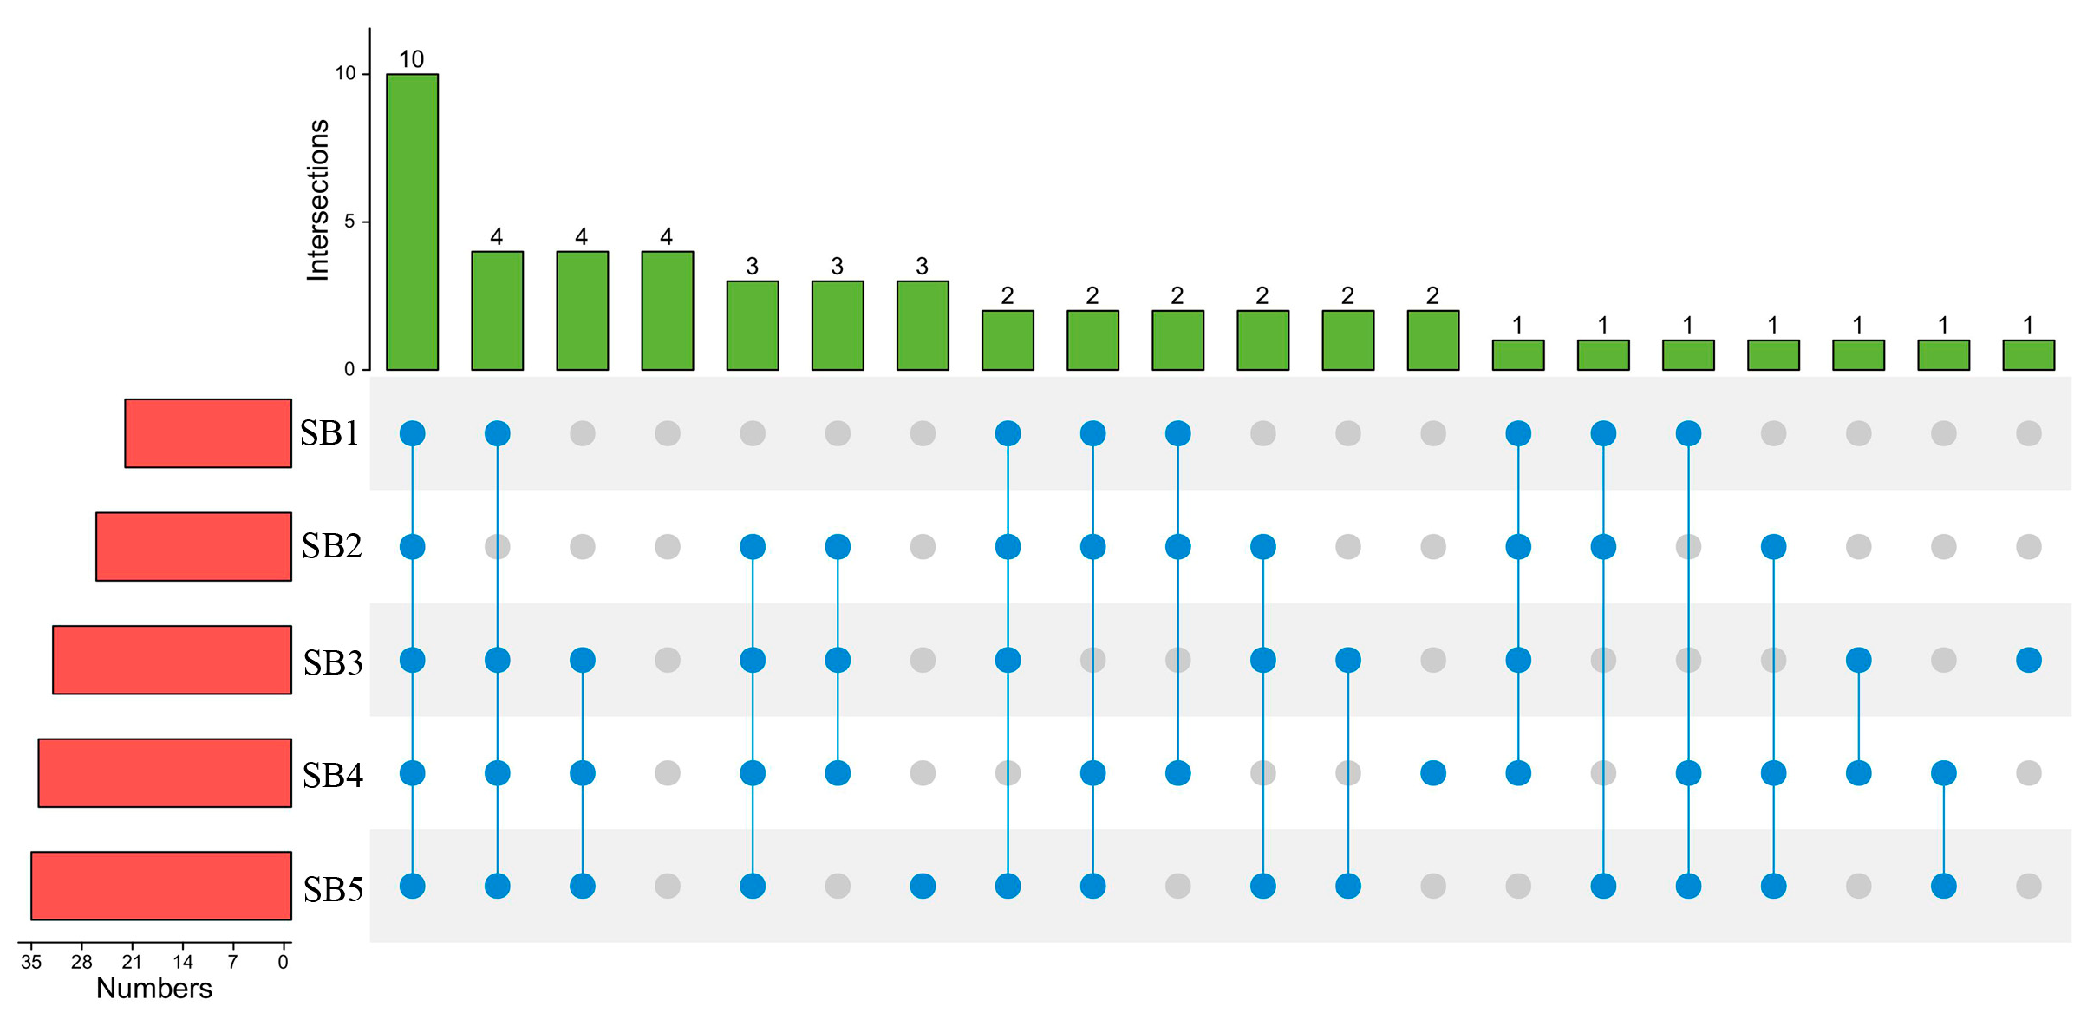
Different sets of drivers underlie different safety behaviors, and uncovering such complex patterns, help formulate targeted measures to cultivate safety behaviors. Machine learning can explore such complex patterns among safety behavioral data. Given the theoretical, methodological and practical significance, this paper attempts to develop a classification framework for construction personnel’s safety behaviors with machine-learning algorithms, including LR, SVM, RF, and CatBoost. The classification framework has three steps, i.e., data collection and preprocessing, modeling and algorithm implementation, and optimal model acquisition. For illustrative purposes, five common safety behaviors of a random and representative sample of Hong Kong-based construction personnel are used to validate the classification framework. To achieve a high classification performance, this paper employs a combinative strategy of CatBoost–MOSMA. Results support this combinative strategy in dealing with construction safety behavioral data. From the derived optimal model, a unique set of important features can be identified for each safety behavior, and ten out of the 46 input indicators are found important for all the five safety behaviors. Based on the findings, safety staff is supposed to make concrete and targeted interventions to individual construction personnel on site, and improve safety performance in a more efficient and effective way.

Author Contributions

Conceptualization, S.Y. and Y.S.; methodology, S.Y. and Y.W.; validation, Y.S. and Y.W.; formal analysis, Y.S.; investigation, S.Y., Y.W., Y.S. and S.R.; writing—original draft preparation, S.Y., Y.W. and Y.S.; writing—review and editing, Y.S., S.Y. and S.R.; funding acquisition, Y.S. All authors have read and agreed to the published version of the manuscript.

Funding

This study is supported by a grant from the National Natural Science Foundation of China (Project No.: 71701130).

Institutional Review Board Statement

The study was conducted in accordance with the Declaration of Helsinki, and approved by the Institutional Review Board (or Ethics Committee) of the University of Hong Kong (protocol code EA011011 and 6 October 2011).

Informed Consent Statement

Informed consent was obtained from all subjects involved in the study.

Data Availability Statement

Not applicable.

Conflicts of Interest

The authors declare no conflict of interest.

Appendix A

Table A1. Input indicators.
First-Level DimensionsSecond-Level IndicatorsLabel Value Frequency Percent (%)Code
Nature of clientClient typePublic120570.2NatClit
Private28729.8
Client involvementRequire all project staff to have safety trainingYes 113245.2CI1
No 016054.8
Set safety performance goalsYes 19632.9CI2
No 019667.1
Require immediate accident reportYes 115252.1CI3
No 014047.9
Prioritize safety in meeting contractorsYes 113044.5CI4
No 016255.5
Project informationStage of the projectStart-up (less than 30%)17726.4StgProj
Advanced (30–70%)211740.1
Near close-out (greater than 70%)39833.6
Contract sum≤99 millions16722.9ConSum
100–499 millions29833.6
500–999 millions34013.7
≥1000 millions48729.8
Goal congruencyPrompt feedback on work performanceYes114650GC1
No014650
Agreement with the work philosophy of this projectYes 113445.9GC2
No015854.1
Commitment to the project’s goalYes 13411.6GC3
No 025888.4
Participative decision-makingSatisfaction with the decision-making processYes 1268.9PDM1
No 026691.1
Have opportunity to participate in decision makingYes 113245.2PDM2
No 016054.8
Professional developmentEncouraged to seek further professional developmentYes 111840.4PD
No 017459.6
Organizational supportSupport from colleaguesYes 14314.7OS1
No 024985.3
Support from the leadershipYes 14916.8OS2
No 024383.2
Standardized safety rules and procedures Performance standards are very clear.Yes 13712.7SSRP1
No 025587.3
Rules, policies, and procedures are very clear.Yes 114449.3SSRP2
No 014850.7
Rules cannot be violated.Yes 14716.1SSRP3
No 024583.9
Rules are enforced strictly.Yes 113044.5SSRP4
No 016255.5
Safety climateAccidents and incidents are always reported.Yes 110636.3SC1
No 018663.7
The project manager encourages staff to make suggestions to improve safety.Yes 15418.5SC2
No 023881.5
The project manager genuinely cares about the staff’s safety.Yes 15318.2SC3
No 023981.8
All the project staff are fully committed to safety.Yes 14615.8SC4
No 024684.2
Transformational leadershipMy supervisor suggests new ways.Yes 1299.9TL1
No 026390.1
My supervisor suggests different angles.Yes 13311.3TL2
No 025988.7
My supervisor teaches and coaches.Yes 111338.7TL3
No 017961.3
Contingent rewardMy supervisor rewards my achievement.Yes 111539.4CR1
No 017760.6
My supervisor recognizes my achievement.Yes 114549.7CR2
No 014750.3
Leader–member exchangeSupervisor understands my job problems and needs.Yes 13512.0LMX1
No 025788.0
Supervisor recognizes my potential.Yes 14415.1LMX2
No 024884.9
Supervisor helps me out with all his might.Yes 14314.7LMX3
No 024985.3
My working relationship with supervisor is very good.Yes 112944.2LMX4
No 016355.8
Team–member exchangeMy colleagues are willing to help me with my assignment.Yes 19733.2TMX1
No 019566.8
My colleagues recognize my potential.Yes 112944.2TMX2
No 016355.8
My colleagues let me know if I interfere with their work.Yes 111539.4TMX3
No 017760.6
My colleagues understand my job problems and needs.Yes 18930.5TMX4
No 020369.5
Demographic informationGenderMale126992.1Gender
Female 2237.9
Age <20100Age
20–302206.8
31–4035117.5
41–5049933.9
>50512241.8
Marital statusMarried124684.2MarSts
Single 24615.8
Number of dependents01217.2DeptRsp
1–2213245.2
3–4312342.1
5–64124.1
>6541.4
Educational levelBelow primary110.3EduRsp
Primary 251.7
Secondary 3227.5
Certificate/diploma4175.8
College or higher524784.6
Industrial experience<31103.4IndExpr
3–102299.9
11–1533612.3
16–2043712.7
>20518061.6
HabitSmoking habitSmoke even at work193.1SmoHab
Smoke, but not at work2248.2
Do not smoke325988.7
Drinking habitDrink even at work100DriHab
Drink, but not at work210435.6
Do not drink318864.4
AffiliationType of affiliationContractor111940.8AffRes
Consultant28930.5
Client38428.8
Hierarchical positionWorker1186.2RespHier
Supervisory staff211539.4
Management315954.5
Safety motivationWorkplace health and safety is important.Yes 114750.3SM1
No 014549.7
It is beneficial to me to maintain or improve my personal safety.Yes 114449.3SM2
No 014850.7
Maintaining safety at all times is important.Yes 117058.2SM3
No 012241.8
To reduce the risk of workplace accidents and incidents is very important.Yes 117359.2SM4
No 011940.8
Table A2. Output indicators.
Safety behaviorUse all necessary safety equipment to do the jobYes 111439.0SB1
No 017861.0
Follow safety procedures in doing the jobYes 110536.0SB2
No 018764.0
Promote safety program willingly Yes 17626.0SB3
No 021674.0
Put in extra effort to improve workplace safety Yes 16622.6SB4
No 022677.4
Help colleagues out when they are under risky conditions.Yes 19030.8SB5
No 020269.2

References

  1. Guo, S.; He, J.; Li, J.; Tang, B. Exploring the Impact of Unsafe Behaviors on Building Construction Accidents Using a Bayesian Network. Int. J. Environ. Res. Public Health 2020, 17, 221. [Google Scholar] [CrossRef] [PubMed] [Green Version]
  2. Mullen, J.; Kelloway, E.K.; Teed, M. Employer Safety Obligations, Transformational Leadership and Their Interactive Effects on Employee Safety Performance. Saf. Sci. 2017, 91, 405–412. [Google Scholar] [CrossRef]
  3. Griffin, M.A.; Curcuruto, M.M. Safety Climate in Organizations. Annu. Rev. Organ. Psychol. Organ. Behav. 2016, 3, 191–212. [Google Scholar] [CrossRef]
  4. Lee, B.G.; Choi, B.; Jebelli, H.; Lee, S. Assessment of Construction Workers’ Perceived Risk Using Physiological Data from Wearable Sensors: A Machine Learning Approach. J. Build. Eng. 2021, 42, 102824. [Google Scholar] [CrossRef]
  5. Yang, K.; Ahn, C.R.; Kim, H. Deep Learning-Based Classification of Work-Related Physical Load Levels in Construction. Adv. Eng. Inform. 2020, 45, 101104. [Google Scholar] [CrossRef]
  6. Goh, Y.M.; Ubeynarayana, C.U.; Wong, K.L.X.; Guo, B.H.W. Factors Influencing Unsafe Behaviors: A Supervised Learning Approach. Accid. Anal. Prev. 2018, 118, 77–85. [Google Scholar] [CrossRef]
  7. Choi, B.; Lee, S. An Empirically Based Agent-Based Model of the Sociocognitive Process of Construction Workers’ Safety Behavior. J. Constr. Eng. Manag. 2018, 144, 04017102. [Google Scholar] [CrossRef]
  8. Xia, N.; Xie, Q.; Griffin, M.A.; Ye, G.; Yuan, J. Antecedents of Safety Behavior in Construction: A Literature Review and an Integrated Conceptual Framework. Accid. Anal. Prev. 2020, 148, 105834. [Google Scholar] [CrossRef]
  9. Onubi, H.O.; Yusof, N.; Hassan, A.S. The Moderating Effect of Client Types on the Relationship between Green Construction Practices and Health and Safety Performance. Int. J. Sustain. Dev. World Ecol. 2020, 27, 732–748. [Google Scholar] [CrossRef]
  10. Shen, Y.Z.; Ju, C.J.; Koh, T.Y.; Rowlinson, S.; Bridge, A.J. The Impact of Transformational Leadership on Safety Climate and Individual Safety Behavior on Construction Sites. Int. J. Environ. Res. Public Health 2017, 14, 45. [Google Scholar] [CrossRef]
  11. Ma, Y.H. Client’s Contributions to Project Safety Performance: A Comparison between Public and Private Construction Projects; The University of Hong Kong: Hong Kong, 2006. [Google Scholar]
  12. Umeokafor, N. An Investigation into Public and Private Clients’ Attitudes, Commitment and Impact on Construction Health and Safety in Nigeria. Eng. Constr. Archit. Manag. 2018, 25, 798–815. [Google Scholar] [CrossRef]
  13. Lingard, H.; Blismas, N.; Cooke, T.; Cooper, H. The Model Client Framework: Resources to Help Australian Government Agencies to Promote Safe Construction. Int. J. Manag. Proj. Bus. 2009, 2, 131–140. [Google Scholar] [CrossRef]
  14. Votano, S.; Sunindijo, R.Y. Client Safety Roles in Small and Medium Construction Projects in Australia. J. Constr. Eng. Manag. 2014, 140, 04014045. [Google Scholar] [CrossRef]
  15. Shin, M.; Lee, H.S.; Park, M.; Moon, M.; Han, S. A System Dynamics Approach for Modeling Construction Workers’ Safety Attitudes and Behaviors. Accid. Anal. Prev. 2014, 68, 95–105. [Google Scholar] [CrossRef] [PubMed]
  16. Fang, D.; Huang, Y.; Guo, H.; Lim, H.W. LCB Approach for Construction Safety. Saf. Sci. 2020, 128, 104761. [Google Scholar] [CrossRef]
  17. Awolusi, I.G.; Marks, E.D. Safety Activity Analysis Framework to Evaluate Safety Performance in Construction. J. Constr. Eng. Manag. 2017, 143, 05016022. [Google Scholar] [CrossRef] [Green Version]
  18. Choi, T.N.Y.; Chan, D.W.M.; Chan, A.P.C. Perceived Benefits of Applying Pay for Safety Scheme (PFSS) in Construction-A Factor Analysis Approach. Saf. Sci. 2011, 49, 813–823. [Google Scholar] [CrossRef] [Green Version]
  19. De Clercq, D.; Bouckenooghe, D.; Raja, U.; Matsyborska, G. Unpacking the Goal Congruence–Organizational Deviance Relationship: The Roles of Work Engagement and Emotional Intelligence. J. Bus. Ethics 2014, 124, 695–711. [Google Scholar] [CrossRef]
  20. Bouckenooghe, D.; Zafar, A.; Raja, U. How Ethical Leadership Shapes Employees’ Job Performance: The Mediating Roles of Goal Congruence and Psychological Capital. J. Bus. Ethics 2015, 129, 251–264. [Google Scholar] [CrossRef]
  21. Nævestad, T. Safety Cultural Preconditions for Organizational Learning in High-risk Organizations. J. Contingencies Crisis Manag. 2008, 16, 154–163. [Google Scholar] [CrossRef]
  22. Wu, C.; Wang, F.; Zou, P.X.W.; Fang, D. How Safety Leadership Works among Owners, Contractors and Subcontractors in Construction Projects. Int. J. Proj. Manag. 2016, 34, 789–805. [Google Scholar] [CrossRef]
  23. Lee, Y.-H.; Lu, T.-E.; Yang, C.C.; Chang, G. A Multilevel Approach on Empowering Leadership and Safety Behavior in the Medical Industry: The Mediating Effects of Knowledge Sharing and Safety Climate. Saf. Sci. 2019, 117, 1–9. [Google Scholar] [CrossRef]
  24. Toole, T.M. Increasing Engineers’ Role in Construction Safety: Opportunities and Barriers. J. Prof. Issues Eng. Educ. Pract. 2005, 131, 199–207. [Google Scholar] [CrossRef]
  25. Mearns, K.J.; Reader, T. Organizational Support and Safety Outcomes: An Un-Investigated Relationship? Saf. Sci. 2008, 46, 388–397. [Google Scholar] [CrossRef]
  26. Gyekye, S.A.; Salminen, S. Workplace Safety Perceptions and Perceived Organizational Support: Do Supportive Perceptions Influence Safety Perceptions? Int. J. Occup. Saf. Ergon. 2007, 13, 189–200. [Google Scholar] [CrossRef] [PubMed]
  27. Guo, M.; Liu, S.; Chu, F.; Ye, L.; Zhang, Q. Supervisory and Coworker Support for Safety: Buffers between Job Insecurity and Safety Performance of High-Speed Railway Drivers in China. Saf. Sci. 2019, 117, 290–298. [Google Scholar] [CrossRef]
  28. Tucker, S.; Chmiel, N.; Turner, N.; Hershcovis, M.S.; Stride, C.B. Perceived Organizational Support for Safety and Employee Safety Voice: The Mediating Role of Coworker Support for Safety. J. Occup. Health Psychol. 2008, 13, 319–330. [Google Scholar] [CrossRef] [PubMed]
  29. Dekker, S.W. The Bureaucratization of Safety. Saf. Sci. 2014, 70, 348–357. [Google Scholar] [CrossRef]
  30. Newaz, M.T.; Davis, P.; Jefferies, M.; Pillay, M. The Psychological Contract: A Missing Link between Safety Climate and Safety Behaviour on Construction Sites. Saf. Sci. 2019, 112, 9–17. [Google Scholar] [CrossRef]
  31. Neal, A.; Griffin, M.A.; Hart, P.M. The Impact of Organizational Climate on Safety Climate and Individual Behavior. Saf. Sci. 2000, 34, 99–109. [Google Scholar] [CrossRef]
  32. Oswald, D.; Lingard, H.; Zhang, R.P. How Transactional and Transformational Safety Leadership Behaviours Are Demonstrated within the Construction Industry. Constr. Manag. Econ. 2022, 40, 374–390. [Google Scholar] [CrossRef]
  33. Hoffmeister, K.; Gibbons, A.M.; Johnson, S.K.; Cigularov, K.P.; Chen, P.Y.; Rosecrance, J.C. The Differential Effects of Transformational Leadership Facets on Employee Safety. Saf. Sci. 2014, 62, 68–78. [Google Scholar] [CrossRef]
  34. Gottfredson, R.K.; Wright, S.L.; Heaphy, E.D. A Critique of the Leader-Member Exchange Construct: Back to Square One. Leadersh. Q. 2020, 31, 101385. [Google Scholar] [CrossRef]
  35. He, C.Q.; Jia, G.S.; McCabe, B.; Sun, J.D. Relationship between Leader-Member Exchange and Construction Worker Safety Behavior: The Mediating Role of Communication Competence. Int. J. Occup. Saf. Ergon. 2021, 27, 371–383. [Google Scholar] [CrossRef]
  36. He, C.Q.; McCabe, B.; Jia, G.S. Effect of Leader-Member Exchange on Construction Worker Safety Behavior: Safety Climate and Psychological Capital as the Mediators. Saf. Sci. 2021, 142, 105401. [Google Scholar] [CrossRef]
  37. Li, N.W.; Bao, S.W.; Naseem, S.; Sarfraz, M.; Mohsin, M. Extending the Association Between Leader-Member Exchange Differentiation and Safety Performance: A Moderated Mediation Model. Psychol. Res. Behav. Manag. 2021, 14, 1603–1613. [Google Scholar] [CrossRef] [PubMed]
  38. Chen, S.-Y.; Lu, C.-S.; Ye, K.-D.; Shang, K.-C.; Guo, J.-L.; Pan, J.-M. Enablers of Safety Citizenship Behaviors of Seafarers: Leader-Member Exchange, Team-Member Exchange, and Safety Climate. Marit. Policy Manag. 2021, 1–16. [Google Scholar] [CrossRef]
  39. Shen, Y.; Tuuli, M.M.; Xia, B.; Koh, T.Y.; Rowlinson, S. Toward a Model for Forming Psychological Safety Climate in Construction Project Management. Int. J. Proj. Manag. 2015, 33, 223–235. [Google Scholar] [CrossRef] [Green Version]
  40. Beus, J.M.; Taylor, W.D. Working Safely at Some Times and Unsafely at Others: A Typology and within-Person Process Model of Safety-Related Work Behaviors. J. Occup. Health Psychol. 2018, 23, 402–416. [Google Scholar] [CrossRef]
  41. Shen, Y. An Investigation of Safety Climate on Hong Kong Construction Sites. Ph.D. Thesis, The University of Hong Kong, Hong Kong, 2013. [Google Scholar]
  42. Meng, X.; Chan, A.H. Demographic Influences on Safety Consciousness and Safety Citizenship Behavior of Construction Workers. Saf. Sci. 2020, 129, 104835. [Google Scholar] [CrossRef]
  43. Strickland, J.R.; Wagan, S.; Dale, A.M.; Evanoff, B.A. Prevalence and Perception of Risky Health Behaviors among Construction Workers. J. Occup. Environ. Med. 2017, 59, 673–678. [Google Scholar] [CrossRef] [PubMed]
  44. Hair, J.F.; Black, W.C.; Babin, B.J.; Anderson, R.E. Multivariate Data Analysis, 8th ed.; Cengage Learning, EMEA: Hampshire, UK, 2019. [Google Scholar]
  45. Poh, C.Q.X.; Ubeynarayana, C.U.; Goh, Y.M. Safety Leading Indicators for Construction Sites: A Machine Learning Approach. Autom. Constr. 2018, 93, 375–386. [Google Scholar] [CrossRef]
  46. Koc, K.; Gurgun, A.P. Scenario-Based Automated Data Preprocessing to Predict Severity of Construction Accidents. Autom. Constr. 2022, 140, 104351. [Google Scholar] [CrossRef]
  47. Antwi-Afari, M.F.; Li, H.; Yu, Y.; Kong, L. Wearable Insole Pressure System for Automated Detection and Classification of Awkward Working Postures in Construction Workers. Autom. Constr. 2018, 96, 433–441. [Google Scholar] [CrossRef]
  48. Niu, Y.; Li, Z.; Fan, Y. Analysis of Truck Drivers’ Unsafe Driving Behaviors Using Four Machine Learning Methods. Int. J. Ind. Ergon. 2021, 86, 103192. [Google Scholar] [CrossRef]
  49. Bentéjac, C.; Csörgő, A.; Martínez-Muñoz, G. A Comparative Analysis of Gradient Boosting Algorithms. Artif. Intell. Rev. 2021, 54, 1937–1967. [Google Scholar] [CrossRef]
  50. Becker, M. On the Efficiency of Nature-Inspired Algorithms for Generation of Fault-Tolerant Graphs. In Proceedings of the 2015 IEEE International Conference on Systems, Man, and Cybernetics, Hong Kong, 9–12 October 2015. [Google Scholar]
  51. Li, S.; Chen, H.; Wang, M.; Heidari, A.A.; Mirjalili, S. Slime Mould Algorithm: A New Method for Stochastic Optimization. Future Gener. Comput. Syst. 2020, 111, 300–323. [Google Scholar] [CrossRef]
  52. Houssein, E.H.; Mahdy, M.A.; Shebl, D.; Manzoor, A.; Sarkar, R.; Mohamed, W.M. An Efficient Slime Mould Algorithm for Solving Multi-Objective Optimization Problems. Expert Syst. Appl. 2022, 187, 115870. [Google Scholar] [CrossRef]
  53. Kursa, M.B.; Rudnicki, W.R. Feature Selection with the Boruta Package. J. Stat. Softw. 2010, 36, 1–13. [Google Scholar] [CrossRef]
Figure 1. Safety behavior factor analysis and classification system.
Buildings 13 00043 g001
Figure 2. The safety behavior classification framework. First, users need to determine variables and indicators, and complete necessary preprocessing after data collection. Second, each trial has a unique code, and 64 models in total are trained and tuned automatically by specific methods mentioned in their codes. Last, the performance of the 64 models is output, and the model with maximum scores stands out as the optimal model. Meanwhile, users can also observe the results of feature selection to guide the analysis of the important factors of one risk behavior or the average important factors of certain risk behaviors.
Buildings 13 00043 g002
Figure 3. The process of encoding models.
Buildings 13 00043 g003
Figure 4. AUC of classifiers with(out) MOSMA.
Buildings 13 00043 g004
Figure 5. Accuracy and F1-scores of classifiers with(out) MOSMA. (a) Accuracy without MOSMA. (b) Accuracy with MOSMA. (c) F1-scores without MOSMA. (d) F1-scores with MOSMA.
Buildings 13 00043 g005
Figure 6. Performance of 64 models.
Buildings 13 00043 g006
Figure 7. Upset plot for variables after feature selection.
Buildings 13 00043 g007
Figure 8. OR values between the five safety behaviors and all of the input indicators.
Buildings 13 00043 g008
Figure 9. Practical use of the research.
Buildings 13 00043 g009
Table 1. VIF values of input second-level indicators.
Variable *VIFVariableVIFVariableVIFVariableVIFVariableVIF
NatClit1.25IndExpr3.53OS21.75LMX22.21CR12.37
StgProj1.14SmoHab1.60CI11.90LMX32.47CR22.47
ConSum1.23DriHab1.34CI22.00LMX41.57SC11.83
AffRes1.41GC11.61CI31.90TMX11.93SC21.77
RespHier1.73GC21.83CI42.07TMX21.99SC31.58
Gender1.44GC31.88SSRP11.80TMX31.92SC41.64
Age3.17PDM12.00SSRP21.80TMX42.06SM12.52
MarSts1.53PDM21.52SSRP31.86TL12.62SM22.98
DeptRsp1.32PD1.56SSRP41.78TL22.73SM33.48
EduRsp1.89OS11.87LMX12.21TL31.75SM42.81
* These codes refer to input second-level indicators, which are shown in Table A1 in Appendix A. For example, the code of ‘GC1′ refers to the first second-level indicator measuring the variable of goal congruency.
Table 2. Feature-selection method.
VariablesMethodsSB1SB2SB3SB4SB5VotesResult
NatClitFI√ *9Retain
BS
CT
DeptRspFI10Retain
BS
CT
TMX1FI 2Cut
BS
CT
* The variable obtains one vote if it is shown as an important feature for one behavior.
Table 3. Feature importance of the five safety behaviors.
SB1SB2SB3SB4SB5
NatClit0.060.050.030.09 (3rd)0.08
CI10.000.040.000.030.03
CI20.10 (2nd)0.10 (3rd)0.010.030.01
CI30.050.020.040.070.04
CI40.000.000.010.000.02
ConSum0.040.020.13 (2nd)0.09 (3rd)0.17 (1st)
GC30.000.000.010.000.00
PDM10.000.000.000.000.00
PDM20.020.010.020.000.00
PD0.020.000.010.10 (2nd)0.02
OS10.000.000.010.000.00
OS20.010.010.020.000.00
SSRP10.010.030.010.000.01
SSRP20.08 (3rd)0.010.010.020.05
SSRP30.020.010.000.000.01
SSRP40.050.030.000.020.00
SC10.000.000.030.010.00
SC20.020.000.010.000.16 (2nd)
SC30.000.000.010.000.00
SC40.020.020.21 (1st)0.020.00
TL10.040.010.000.000.00
TL20.000.000.000.000.00
TL30.050.040.010.060.00
LMX10.000.000.000.000.00
LMX20.000.010.000.000.00
LMX30.000.010.010.010.00
LMX40.000.030.010.030.01
TMX20.000.010.020.000.01
TMX30.000.020.000.000.01
TMX40.030.010.040.040.04
Age0.050.10 (3rd)0.050.080.06
DeptRsp0.020.040.050.050.04
AffRes0.14 (1st)0.13 (2nd)0.12 (3rd)0.18 (1st)0.13 (3rd)
SM10.020.030.090.010.00
SM20.08 (3rd)0.000.000.010.04
SM30.020.040.010.010.00
SM40.050.16 (1st)0.030.040.04
SUM1.001.001.001.001.00
Table 4. Chi-square test and OR values.
FeaturesChi-Square TestOR95% CI
χ 2 p Lower LimitUpper Limit
Age0.810.3680
GC14.660.0311.681.052.71
SSRP326.100.0005.392.7010.78
CI320.070.0003.041.864.99
LMX17.340.0072.651.285.45
TMX11.710.1910
TMX48.600.0032.121.283.53
SC221.250.0004.102.197.68
SM232.560.0004.192.536.94
Table 5. Comparison with previous studies.
ReferenceMethod of Tuning and OptimizationLabelClassifierCross-
Validation
AccuracyF1-Score
Poh et al. [45]Fixed parametersTrichotomyRFLOO0.78/
Fixed parametersTrichotomyLRLOO0.59/
Fixed parametersTrichotomySVMLOO0.44/
Fixed parametersTrichotomyDT *LOO0.71/
Fixed parametersTrichotomyKNN *LOO0.73/
Niu et al. [48]Grid searchBinaryGBDT *10 folds0.800.61
Grid searchBinaryRF10 folds0.770.67
Lee et al. [4]BPSO *BinaryGSVM *10 folds0.810.81
BPSOBinaryKNN10 folds0.79/
BPSOBinaryDT10 folds0.71/
Koc and Gurgun [46]Trial errorQuarteringXGBoost//0.61
Proposed MOSMABinaryCatBoostLOO0.860.86
MOSMABinaryRFLOO0.850.85
MOSMABinarySVMLOO0.800.81
MOSMABinaryLRLOO0.690.73
* BPSO, binary particle swarm optimization; DT decision tree; KNN, k-nearest neighbor; GBDT, gradient boosting decision tree; GSVM, Gaussian support vector machine; Bi-LSTM, bidirectional long short-term memory.
Disclaimer/Publisher’s Note: The statements, opinions and data contained in all publications are solely those of the individual author(s) and contributor(s) and not of MDPI and/or the editor(s). MDPI and/or the editor(s) disclaim responsibility for any injury to people or property resulting from any ideas, methods, instructions or products referred to in the content.

