1. Introduction
Managers and researchers have had a difficult time keeping up with the challenge of accurately measuring the performance of the organization. Therefore, it contributes significantly to the advancement of the organizational contribution. [
1,
2,
3,
4,
5]. It is critical to comprehend the influence of measurement systems on organizational assessment. In today’s competitive environment, all organizations, whether government or private, require some kind of effective performance evaluation system for development, growth, and sustainability. The effectiveness and efficiency of the organization’s strategies and human resources procedures can be evaluated using this method. In other words, high-ranking management has always sought a solution to ensure strategy execution. As a tool to manage the execution of their strategies, performance assessment methods have been preferred in the meantime. Today, numerous manufacturers and service providers are compelled to adopt innovative management strategies. The balanced scorecard is an effective and essential tool in performance evaluation. The emphasis in this measurement system shifts from internal to external factors. Additionally, attention is given to how to implement processes with regard to environmental conditions as well as strategy implementation rather than task performance. The balanced scorecard is regarded as a new kind of measurement system. It investigates the organization’s conditions in four domains: financial, processes, customers, and learning and growth [
1,
2,
3,
4,
5,
6,
7,
8,
9,
10,
11,
12].
However, we should be aware that the four aspects of the balanced scorecard are widely accepted as a fundamental model. However, a greater or lesser number of card aspects may be taken into consideration depending on the character of the organizations, their type of mission, and their organizational framework. Programs that have the potential to be effective and efficient are identified by the performance evaluation system. This system can also identify undesired but beneficial projects and plans. The management team is also assisted by the control and evaluation system in identifying program weaknesses and implementing the appropriate corrective actions. In order to create an open space where people can learn from their errors and improve, a control and evaluation strategy can be employed to lessen anxiety inside the government and organization. One source of knowledge capital is an effective control and evaluation system. The government and organizations can use this system to design and develop knowledge-based programs and initiatives. Additionally, it enhances organizational knowledge while providing ongoing feedback during the management, adjustment, and evaluation processes in order to accomplish particular goals. [
12,
13,
14,
15,
16]
Municipalities are among the organizations that, on a global scale, are known to have significant impact on the country’s development and the expansion of the civil sphere. Municipalities in Iran function as non-governmental public organizations responsible for providing residents with basic services while also enhancing the city’s effectiveness, usefulness, and economic development. Currently, the demands for an organizational performance measurement tool is understood more than ever before, owing to the growth and development of cities, as well as the increase in their inhabitants, and as a consequence of the expansion of the rang e of urban services. One of the most popular models for assessing how well municipalities are performing globally is the balanced scorecard. The municipality’s long-term achievement can be evaluated using the balanced scorecard method, which can also be employed as a monitoring tool for the municipality’s performance.
On the other hand, we are aware that the municipality places a high priority on social responsibility because it is one of the most significant institutions in the public sector and the body in charge of the city’s administration. By evaluating the dimensions of the sustainable city regularly, this organization can inspect the city’s state from the standpoint of sustainable development and enhance the city’s state. As a result, the municipality ought to serve as a pioneer to follow in adhering to social responsibility in addition to its legally defined obligations. In addition to the four standpoints of financial state, customer, internal processes, and learning and development, the balanced evaluation model described in this article takes into account and analyzes the organization’s performance in the field of social responsibilities. According to the researchers, one of the primary cornerstones of municipalities’ obligations is the domain of social responsibilities, and managing municipalities’ development without taking social responsibilities into account is worthless.
The quantitative assessment of various domains of the card, which is performed with the assistance of data coverage analysis, is a crucial subject in the assessment of points for the card domains. The non-parametric data envelopment analysis (DEA) method converts numerous inputs into numerous outputs while considering both quantitative and qualitative criteria. It is used to analyze and evaluate the decision-making units (DMUs) performance.
While the balanced scorecard and data coverage analysis together make for a potent tool, they have only been around for a short period of time, and consequently, there are only a small number of studies and articles dedicated to the topic. Decision units are compared to one another because DEA is based on relative analysis [
15,
16,
17]. One of the main challenges with the balanced scorecard, the requirement to establish the benchmarks and the baseline, is thus circumvented by employing the BSC–DEA integrated model. One of the most significant benefits of the recommended model is that it provides administrators with an exhaustive perspective of the business, and a balanced assessment based on all the aspects highlighted in the BSC in a networked manner while preserving the balance, linearity, and flexibility between them [
16,
17,
18,
19].
The input and output indicators in all five domains are initially determined employing the balanced scorecard (BSC) and also according to its objectives and strategic network map. Afterward, a combined and concurrent evaluation of the five components of the BSC is carried out for the municipalities using data envelopment analysis, a tool based on network and decision theory. Increasing the effectiveness of the entire organization is the ultimate objective [
16].
2. Balanced Scorecard in the Municipality
According to Kaplan and Norton, administrators and employees pay attention to what is evaluated, and what is not evaluated cannot be managed effectively. As a result, managers devote most of their attention and energy to meeting short-term financial goals while paying little attention to managing and investing in the intangible resources that will ultimately determine the organization’s financial achievement in the future. Therefore, without a solid and efficient performance system, managers cannot develop and improve their intangible resources. As a result, they miss out on numerous chances for value creation [
1,
2,
3,
4,
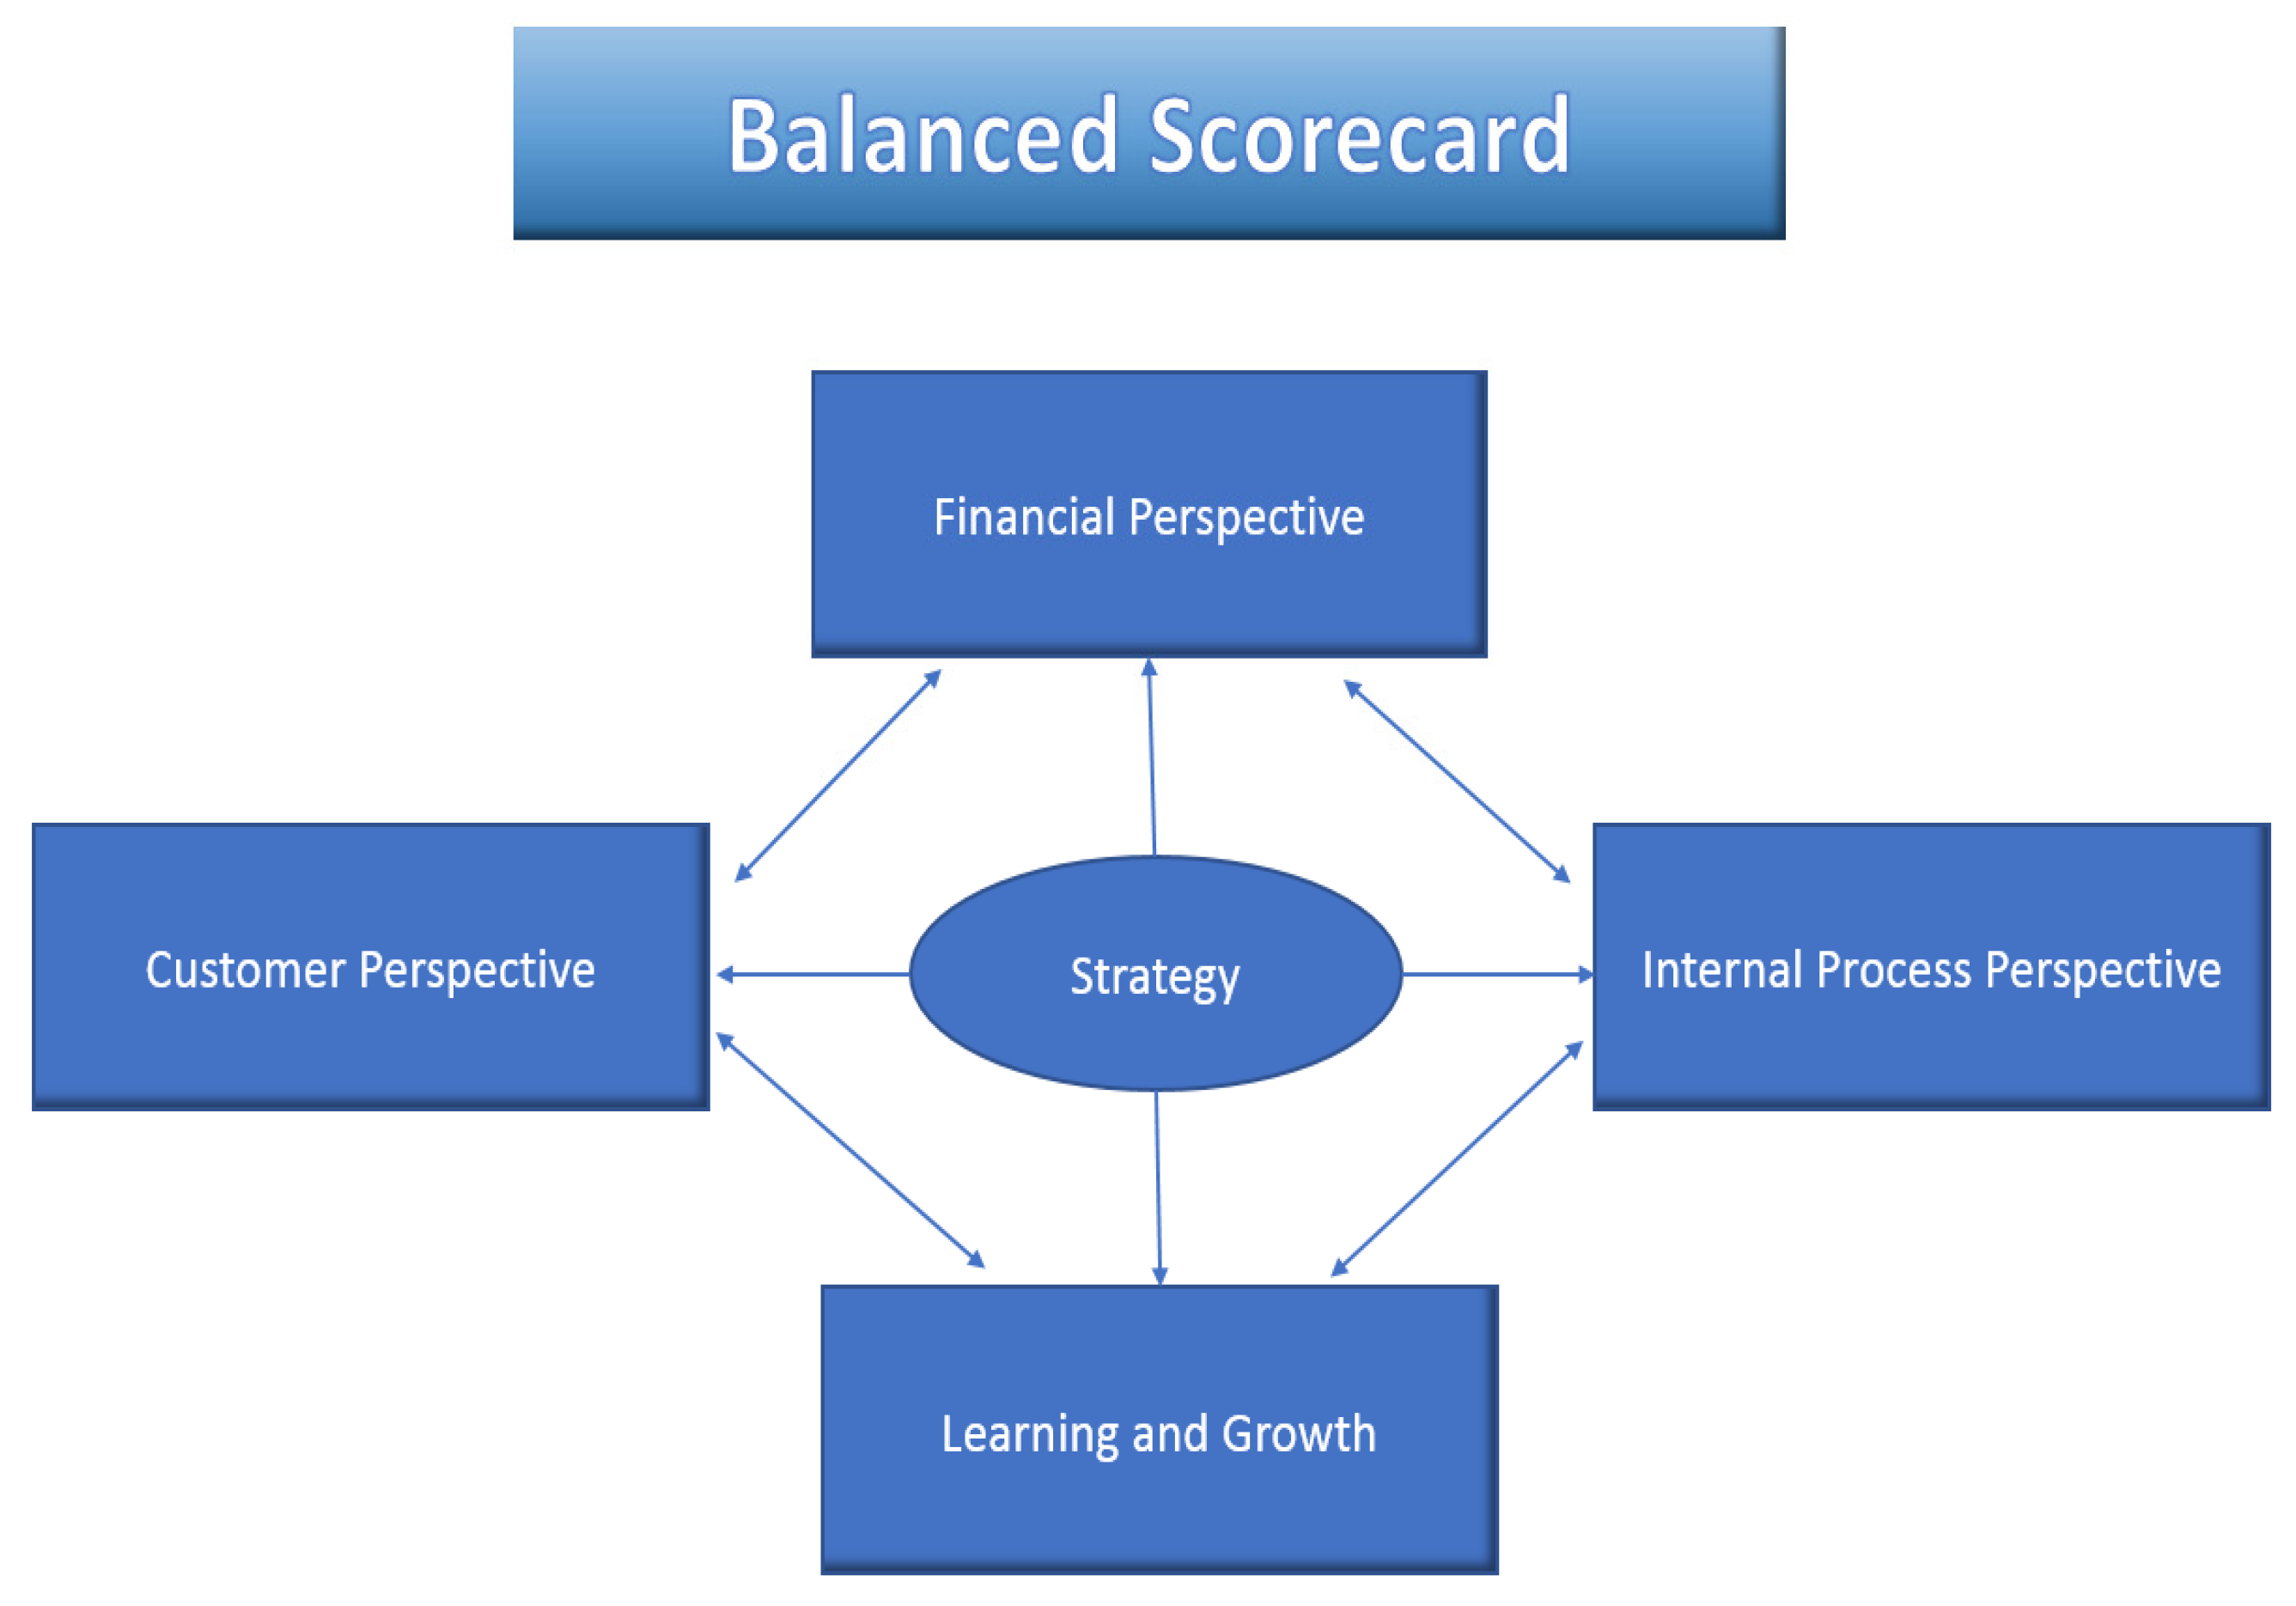
5].They presented a balanced scorecard approach to compensate for this omission. This method assesses the performance of the organization by including three additional dimensions, such as customers, internal business processes, and learning and growth, in addition to the conventional financial assessment. The aforementioned method focuses on the organization’s intangible resources, which have grown in importance in the modern era. This method enables the organization to incorporate it into the favored assessment model by monitoring, controlling, and being informed of the intangible assets’ quality and, if needed, repairing the deficiencies and compensating for the shortcomings. The traditional balanced scorecard, which has four main domains, including financial, internal processes, customer, and growth and learning aspects, is depicted in the
Figure 1:
- ➢
The financial aspect includes customary performance indicators typically connected to profitability [
17]. Meeting shareholder expectations is a concern for financial criteria.
- ➢
The customer aspect typically involves shared indicators resulting from the strategy’s successful findings when properly executed. For instance, customer retention typically results from customer satisfaction.
- ➢
The objective of the internal processe aspect is to gain customer and beneficiary gratification by succeeding in some of the most effective business processes. The internal process or processes that have the biggest effects on customer gratification and achieving organizational objectives should be the focus of internal process criteria.
- ➢
The learning and growth aspect’s initial objective is to set up the framework for achieving the objectives of the other three perspectives and to facilitate long-term development and improvement through people, systems, and organizational practices. In other words, this field minimizes the disparities between the human workforce, the system, and the favored and actual processes.
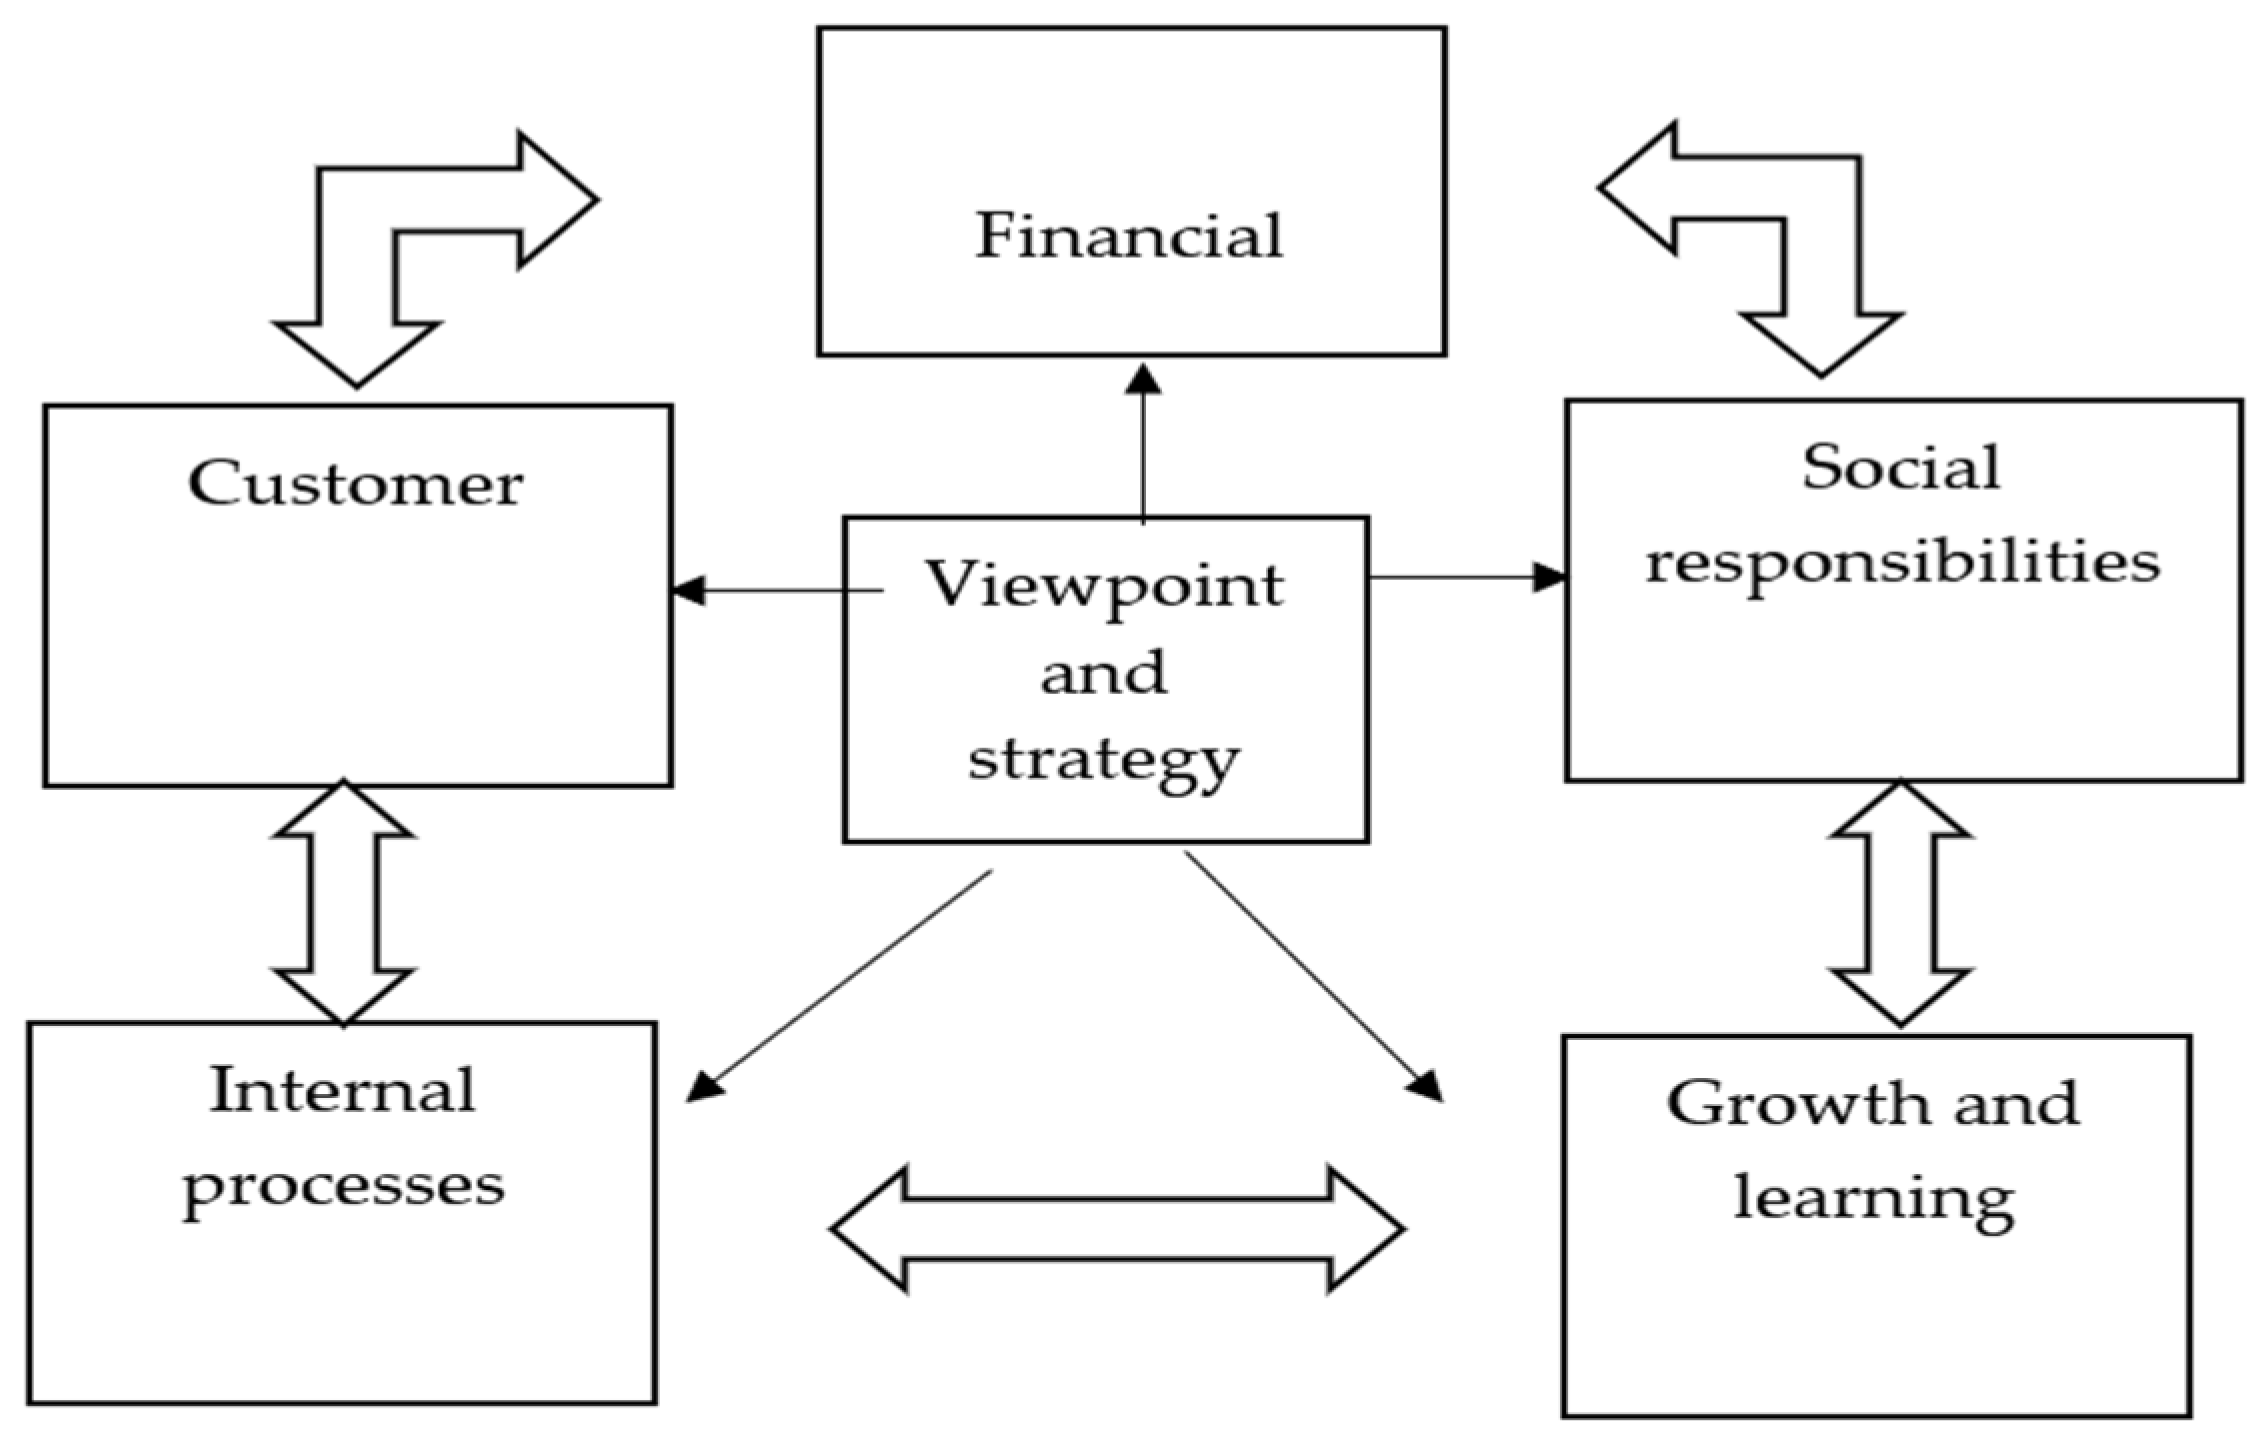
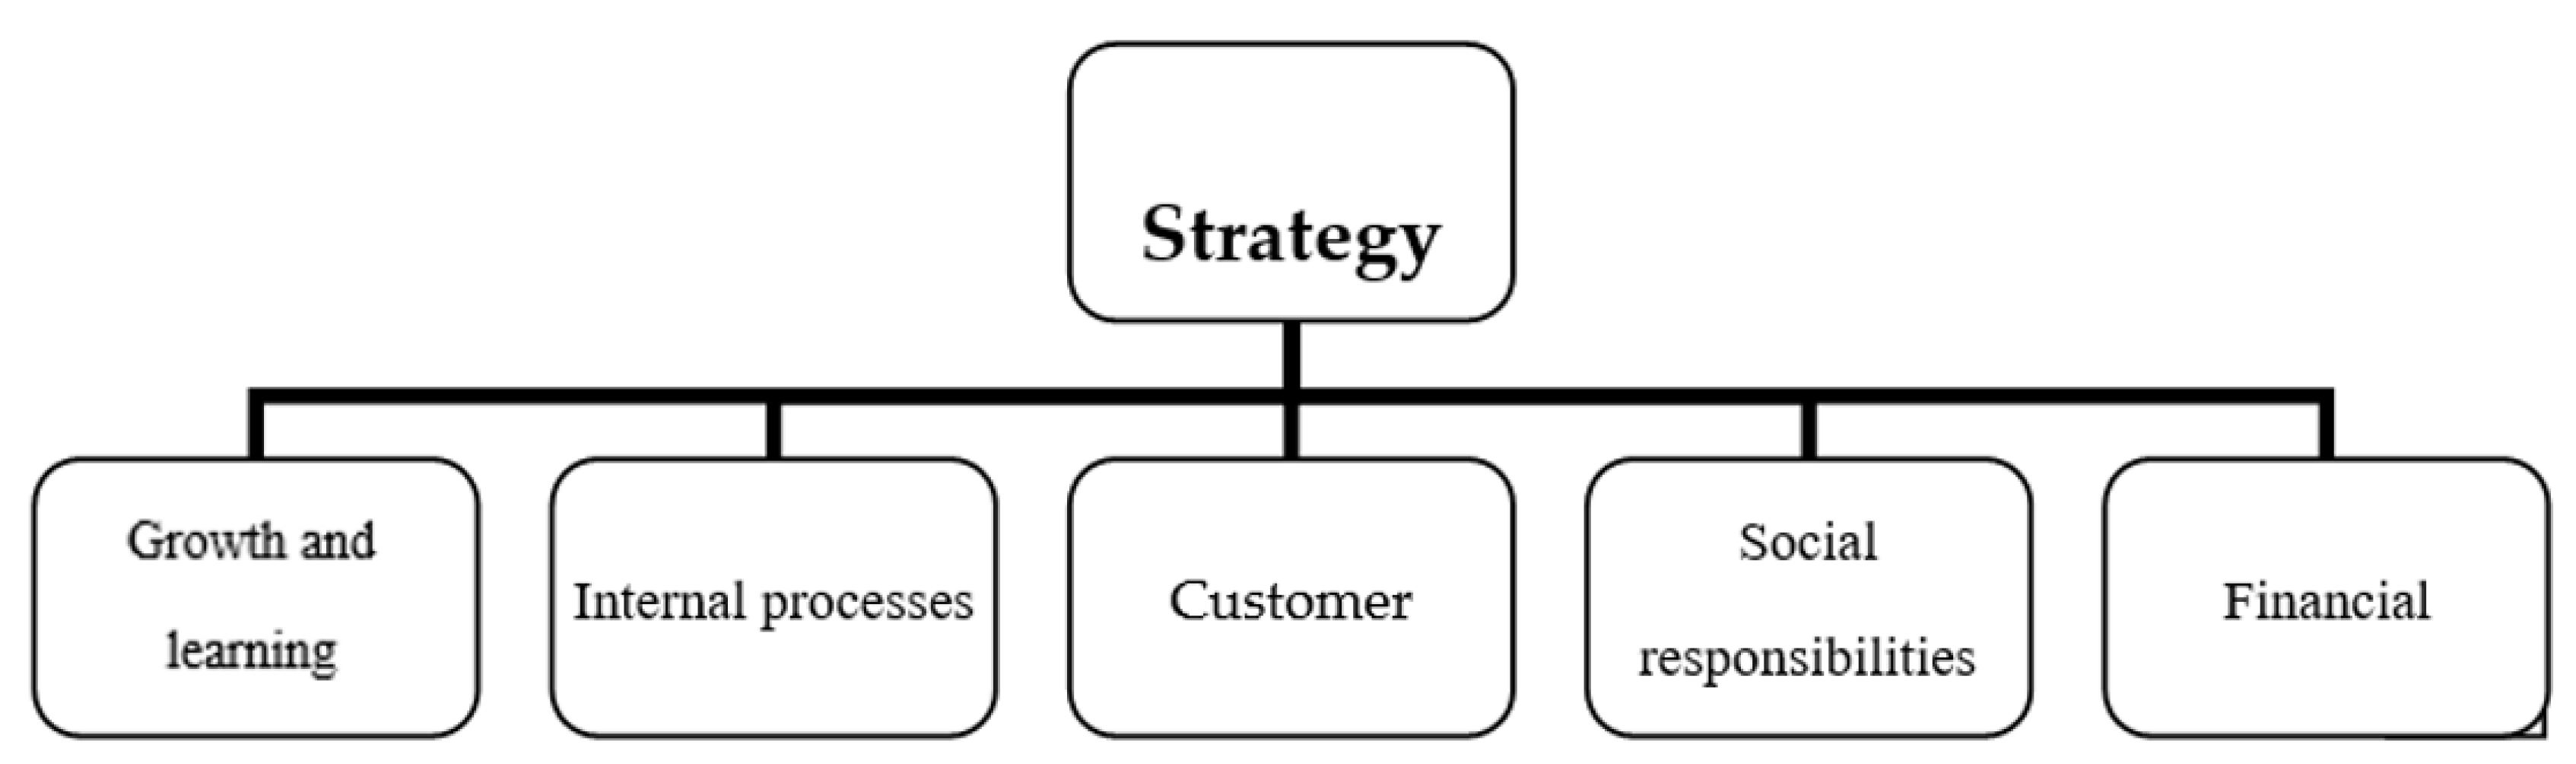
The municipality is in charge of urban management as one of the most significant public sector organizations and as the governing body of the city. Therefore, it is associated with the city’s social, economic, technological, and environmental aspects. By measuring the aspects of the sustainable city on a regular basis, this organization can inspect the state of the city from the standpoint of sustainable development and improve the state of the city. Economic growth, sustainable development, and societal welfare are some of the most significant outcomes of adhering to social responsibility principles. As a result, the municipality should be a pioneer in adhering to social responsibility beyond its legitimately delineated obligations. The domain of social responsibilities will therefore be included in the assessment of the municipality along with the other four components of the balanced scorecard. A balanced scorecard including five domains is depicted in
Figure 2.
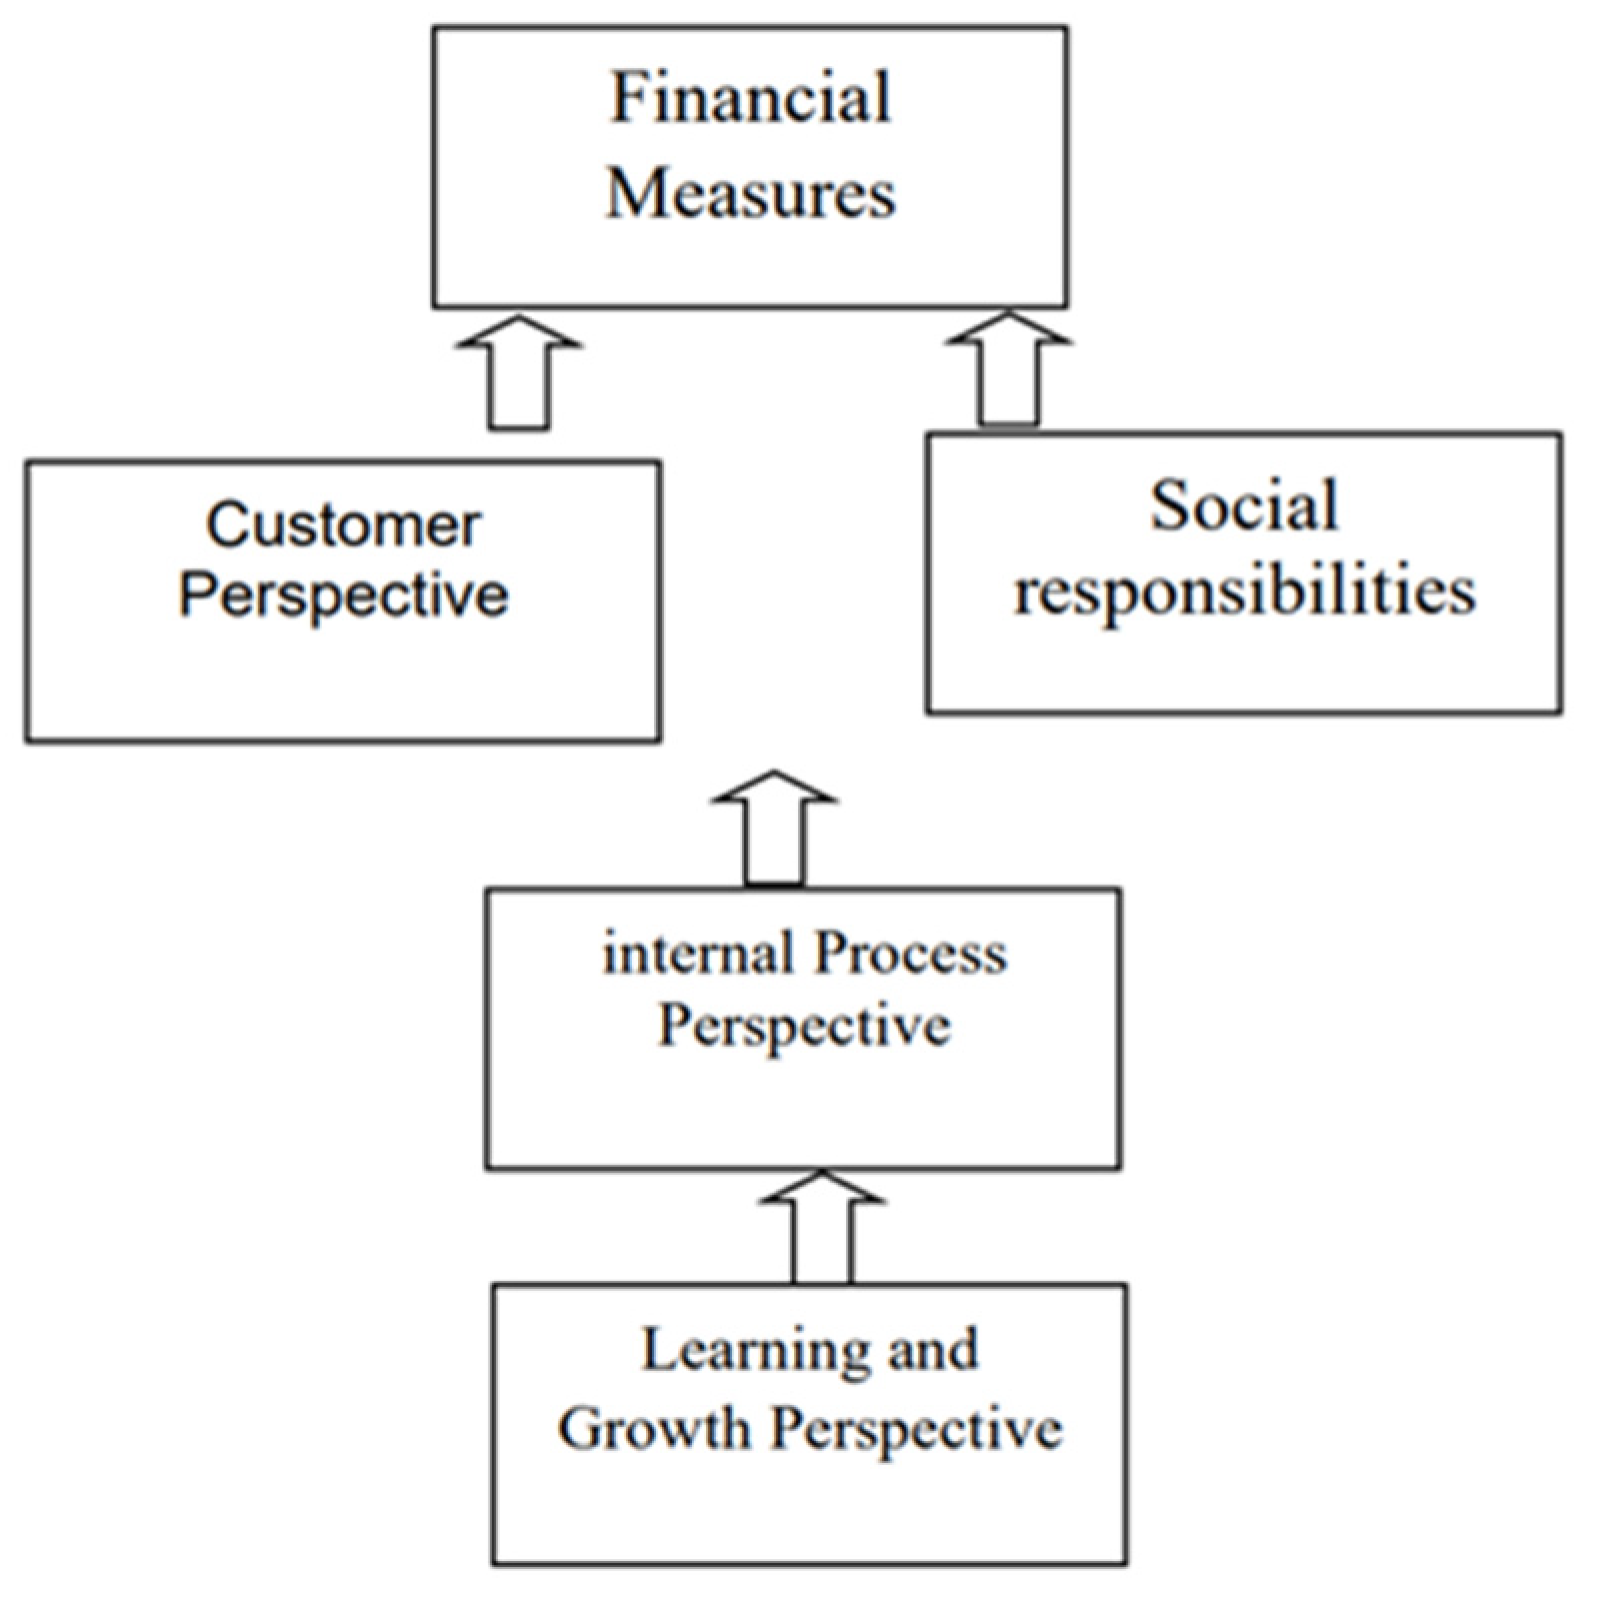
We should be aware that the objectives and metrics for these five domains are connected by a kind of cause-and-effect relationship. An excellent scorecard creates a cause-and-effect relationship between an organization’s present actions and its long-term achievement. The balanced scorecard will be an indispensable tool for the control and management of an organization’s intangible assets, as their development is dependent on these assets. We must create value for our customers to attain financial success in the field of finance, according to
Figure 3 (in the customer field). In the domain of social responsibility, we ought to perform well. This is impractical unless we succeed in our operational procedures and adjust them to our customers’ and society’s needs (in the context of internal processes and social responsibilities). Without creating a comfortable workplace for employees and fostering innovation, creativity, learning, and development within the organization, operational excellence and the development of value-creating processes are impossible (growth and learning domain).
The social responsibility of organizations is often divided into four subsystems, which are economic, legal, moral, and public responsibilities that are carried out voluntarily.
In general, social responsibility is the commitment of decision makers for actions that, in addition to securing their own interests, also improve the welfare of the society. In this definition, there are several elements; first, social responsibility is an obligation that institutions must be accountable for actions that harm the health of the society, and should be avoided. Lastly, the organizations should try to improve social welfare by allocating financial resources and by actions such as helping the country’s culture and cultural institutions and improving the quality of life. Finally, what is meant by social responsibility is that because organizations have a major impact on society, their activities must be in such a way that there is no harm to society as a result, and in case of harm, the related organizations are required to provide compensation. In simpler words, organizations should act as a part related to the larger system in which they are situated.
We know that the set of municipal activities can be divided into two sectors: public services and special services. In the public services sector, which is considered one of the social responsibilities of municipalities, and special services are like the types of licenses that private sectors give and earn from them. We should know that both types of activities are very important for municipalities and the success in both depends on the conditions of the organization’s internal processes. If the organization is agile and the processes respond to the needs, the success of the municipalities is certain. The importance of the two fields of social responsibility and customer is the same from the point of view of the municipality and the audience. We should know that the municipality, as one of the important organizations of the public sector, and as the organization that manages the city, which is responsible for urban management and is related to all the different aspects of the city, such as social, economic, technological and environmental aspects. Regular measurement of the dimensions of a sustainable city improves the state of the city, because one of the most important results of acting on the principles of social responsibility is economic growth, sustainable development, and welfare of society. Therefore, the municipality should be a leader in adhering to social responsibility beyond its defined legal responsibilities. In general, the discussion of social responsibility is associated with the missions of municipalities, and it is not possible to create a clear demarcation between legal responsibility and social responsibility of municipalities.
There are few studies and articles that have been published on the subject of the integrated method of balanced scorecard and data envelopment analysis, despite the fact that they are a potent instrument in this context [
20,
21,
22,
23]. Professor Galloni, head of the Faculty of Engineering at Technics University, presented an article titled DEA–BSC. Professor Galloni applied for the first time the DEA–BSC technique to R&D projects. Dr. Alirezaei and Dr. Mir Hosseini’s article “Comprehensive Organizational Productivity System using DEA Centered on BSC”, and another article titled “Integration of two performance assessment systems, a mathematical viewpoint” was presented in Iran. Each article approached the topic of integration from a unique perspective. Some articles that concentrate on the DEA–BSC method are shown in
Table 1.
3. Data Envelopment Analysis Using Uncontrollable Factors
One of the scheduling methods that is frequently employed to assess the effectiveness of similar units with numerous inputs and similar outputs is data envelopment analysis. Each decision-making unit’s (DMU) efficiency is a fractional programming issue. This means that the efficiency of each DMU is attributed to maximum weighted output to weighted input ratio subject to a set of constraints.
Assume that n is a decision-making unit in the shape of {DMUj: j = 1…n}, with m different inputs producing s outputs: rj and ij represent the rth output of r = (1… ) and the ith input of i = (1,..., ) of the decision-making unit jth of i = (1,..., n), respectively.
If we suppose that
= (
1…
s) and
= (
1…
m) represent the vectors of output and input weights, respectively; additionally, the efficiency of the DMUp in the multiple forms and the input nature will be as follows (Najafi et al. [
16]):
Network systems are systems that have multiple processes that are linked together. A network DEA model (NDEA) is required to measure the efficiency of a network system. Lewis and Sexton recommended the network DEA model in response to the shortcomings of the traditional DEA model. This model possesses a multi-stage framework that accounts for divisional and total efficiencies in a single framework and encompasses internal DMU interrelations. The DEA network model, in contrast to conventional DEA models, is network structure-dependent and lacks a standard form. Some network models were developed by Grosskopf and Fare et al [
13]. We determine the amount of input reduction or output enhancement required to achieve the efficiency limit when we solve the data envelopment analysis model for a decision-making unit. This indicates that while the management has total dominance over all inputs and outputs, in actuality, several factors influencing the degree of technical efficiency are outside of the management’s control and are not practical under the management’s supervision. For the first time, Banker and Murray (BM) (1986) recognized the significance of the fact that a number of production-affecting variables are outside of management’s supervision and coined the term “uncontrollable factors.” Investigations in this study demonstrate that a number of indicators are beyond management’s supervision.
4. Data Envelopment Analysis and Balanced Scorecard Model
The balanced scorecard is employed as a tool for designing the criteria of performance assessment in the integrated BSC and DEA model, and the DEA is employed as a tool for performance assessment in this model. Both controllable and uncontrollable criteria are provided in this model. Depending on the balance and sustaining the balance between important criteria, performance, and high resolution, the concurrent application of the balanced scorecard and DEA technique, and eventually the adoption of the DEA–BSC integrated balanced model, is recognized to be the most appropriate model for analyzing manufacturing companies. This approach is novel and unique in its own right.
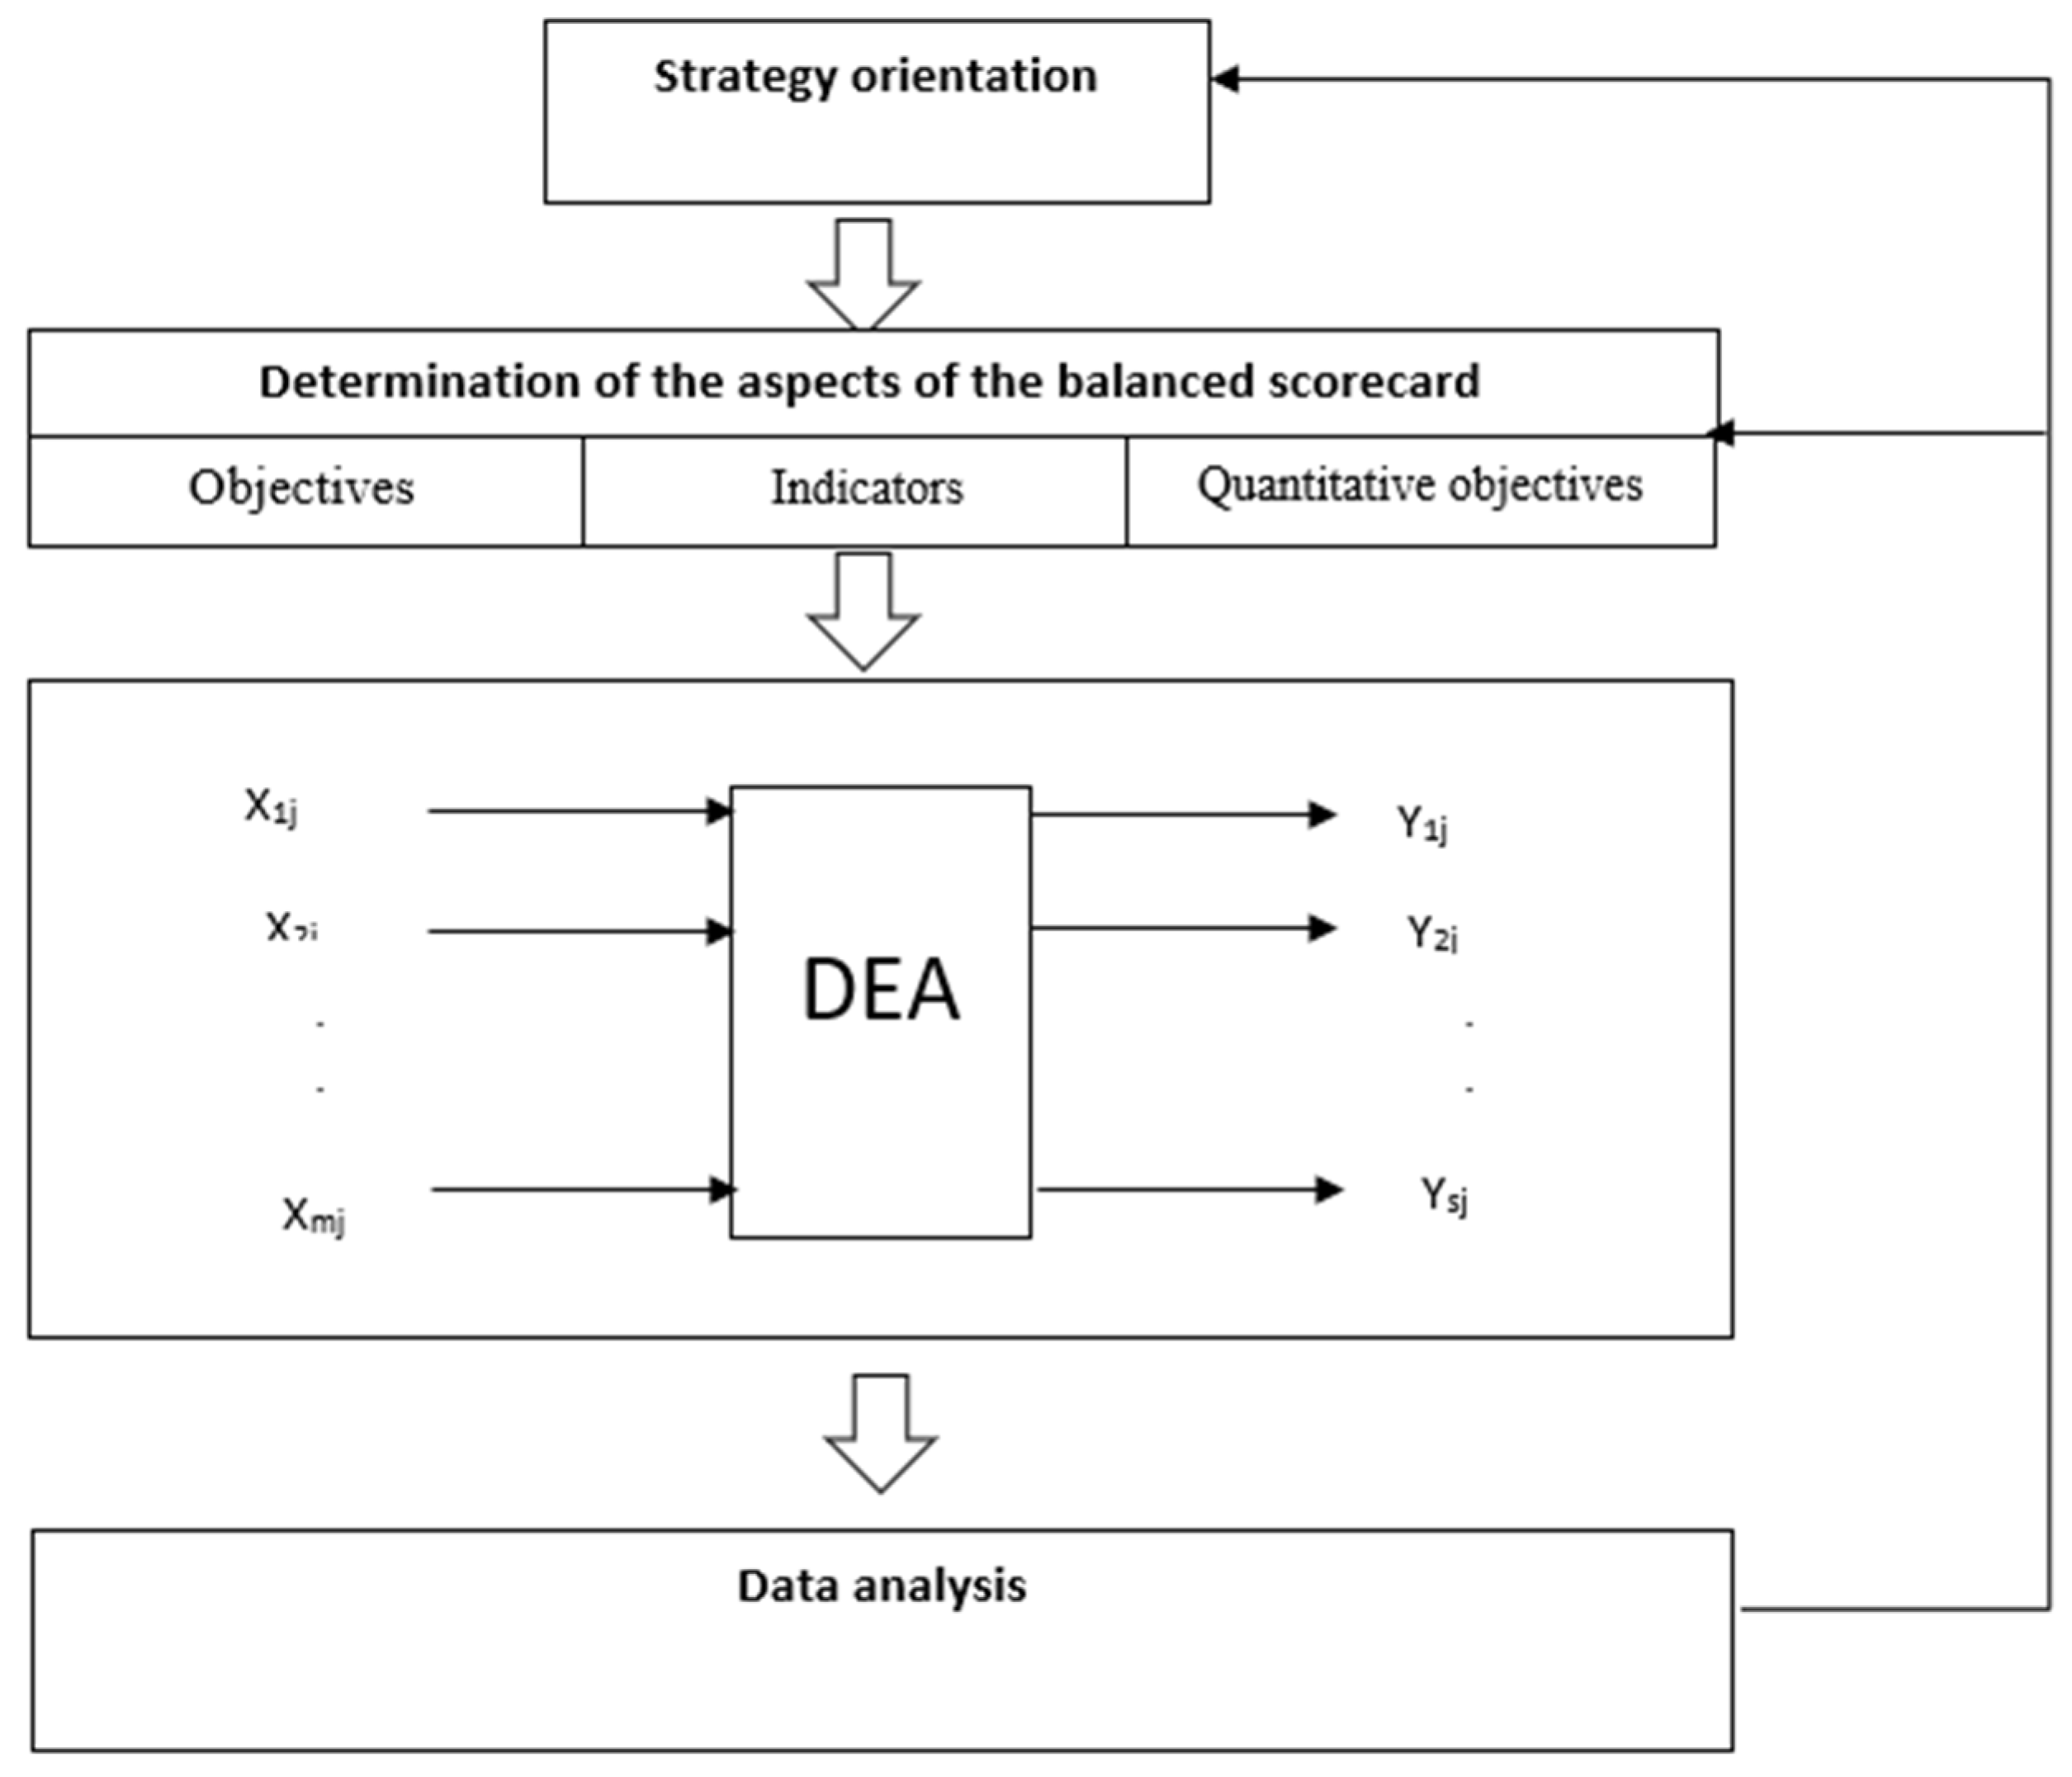
Figure 4 depicts an integrated model of the indexing and performance evaluation phases using two DEA and BSC techniques.
The following algorithm is used by the aforementioned hybrid model:
1. Organization identification: The objectives of the organization’s strategies are recognized in this stage, and the BSC technique is used to design the criteria in each perspective. As a result, balanced indicators with various standpoints are developed.
2. Performance evaluation: BSC-evaluated indicators are divided into input and output groups and evaluated employing DEA.
3. Correction and improvement path designing by DEA: For each indicator, the improvement and correction path is determined. Indicators of input should be corrected and improved in a downward direction, while those of output should be improved in an upward direction.
4. Setting the index objectives for the next period: The DEA-determined indicator objectives are used to establish the indicator objectives for the subsequent period of BSC execution. In this technique, the organization is assessed using the DEA technique, and the indicator objectives are determined in the following period every time the BSC is executed, that is, each period whenever the organization’s data is entered into the BSC system and the findings are displayed. The organization will achieve the optimum and anticipated performance situations if the predefined objectives are accomplished. The organization’s situation is compared to the anticipated conditions of the previous period in the upcoming period of performance analysis, and new efficiency and objectives are then established. The manager is intended to manage the organization toward the most efficient circumstances by developing new strategies after each implementation of this method, which is done on a periodic basis.
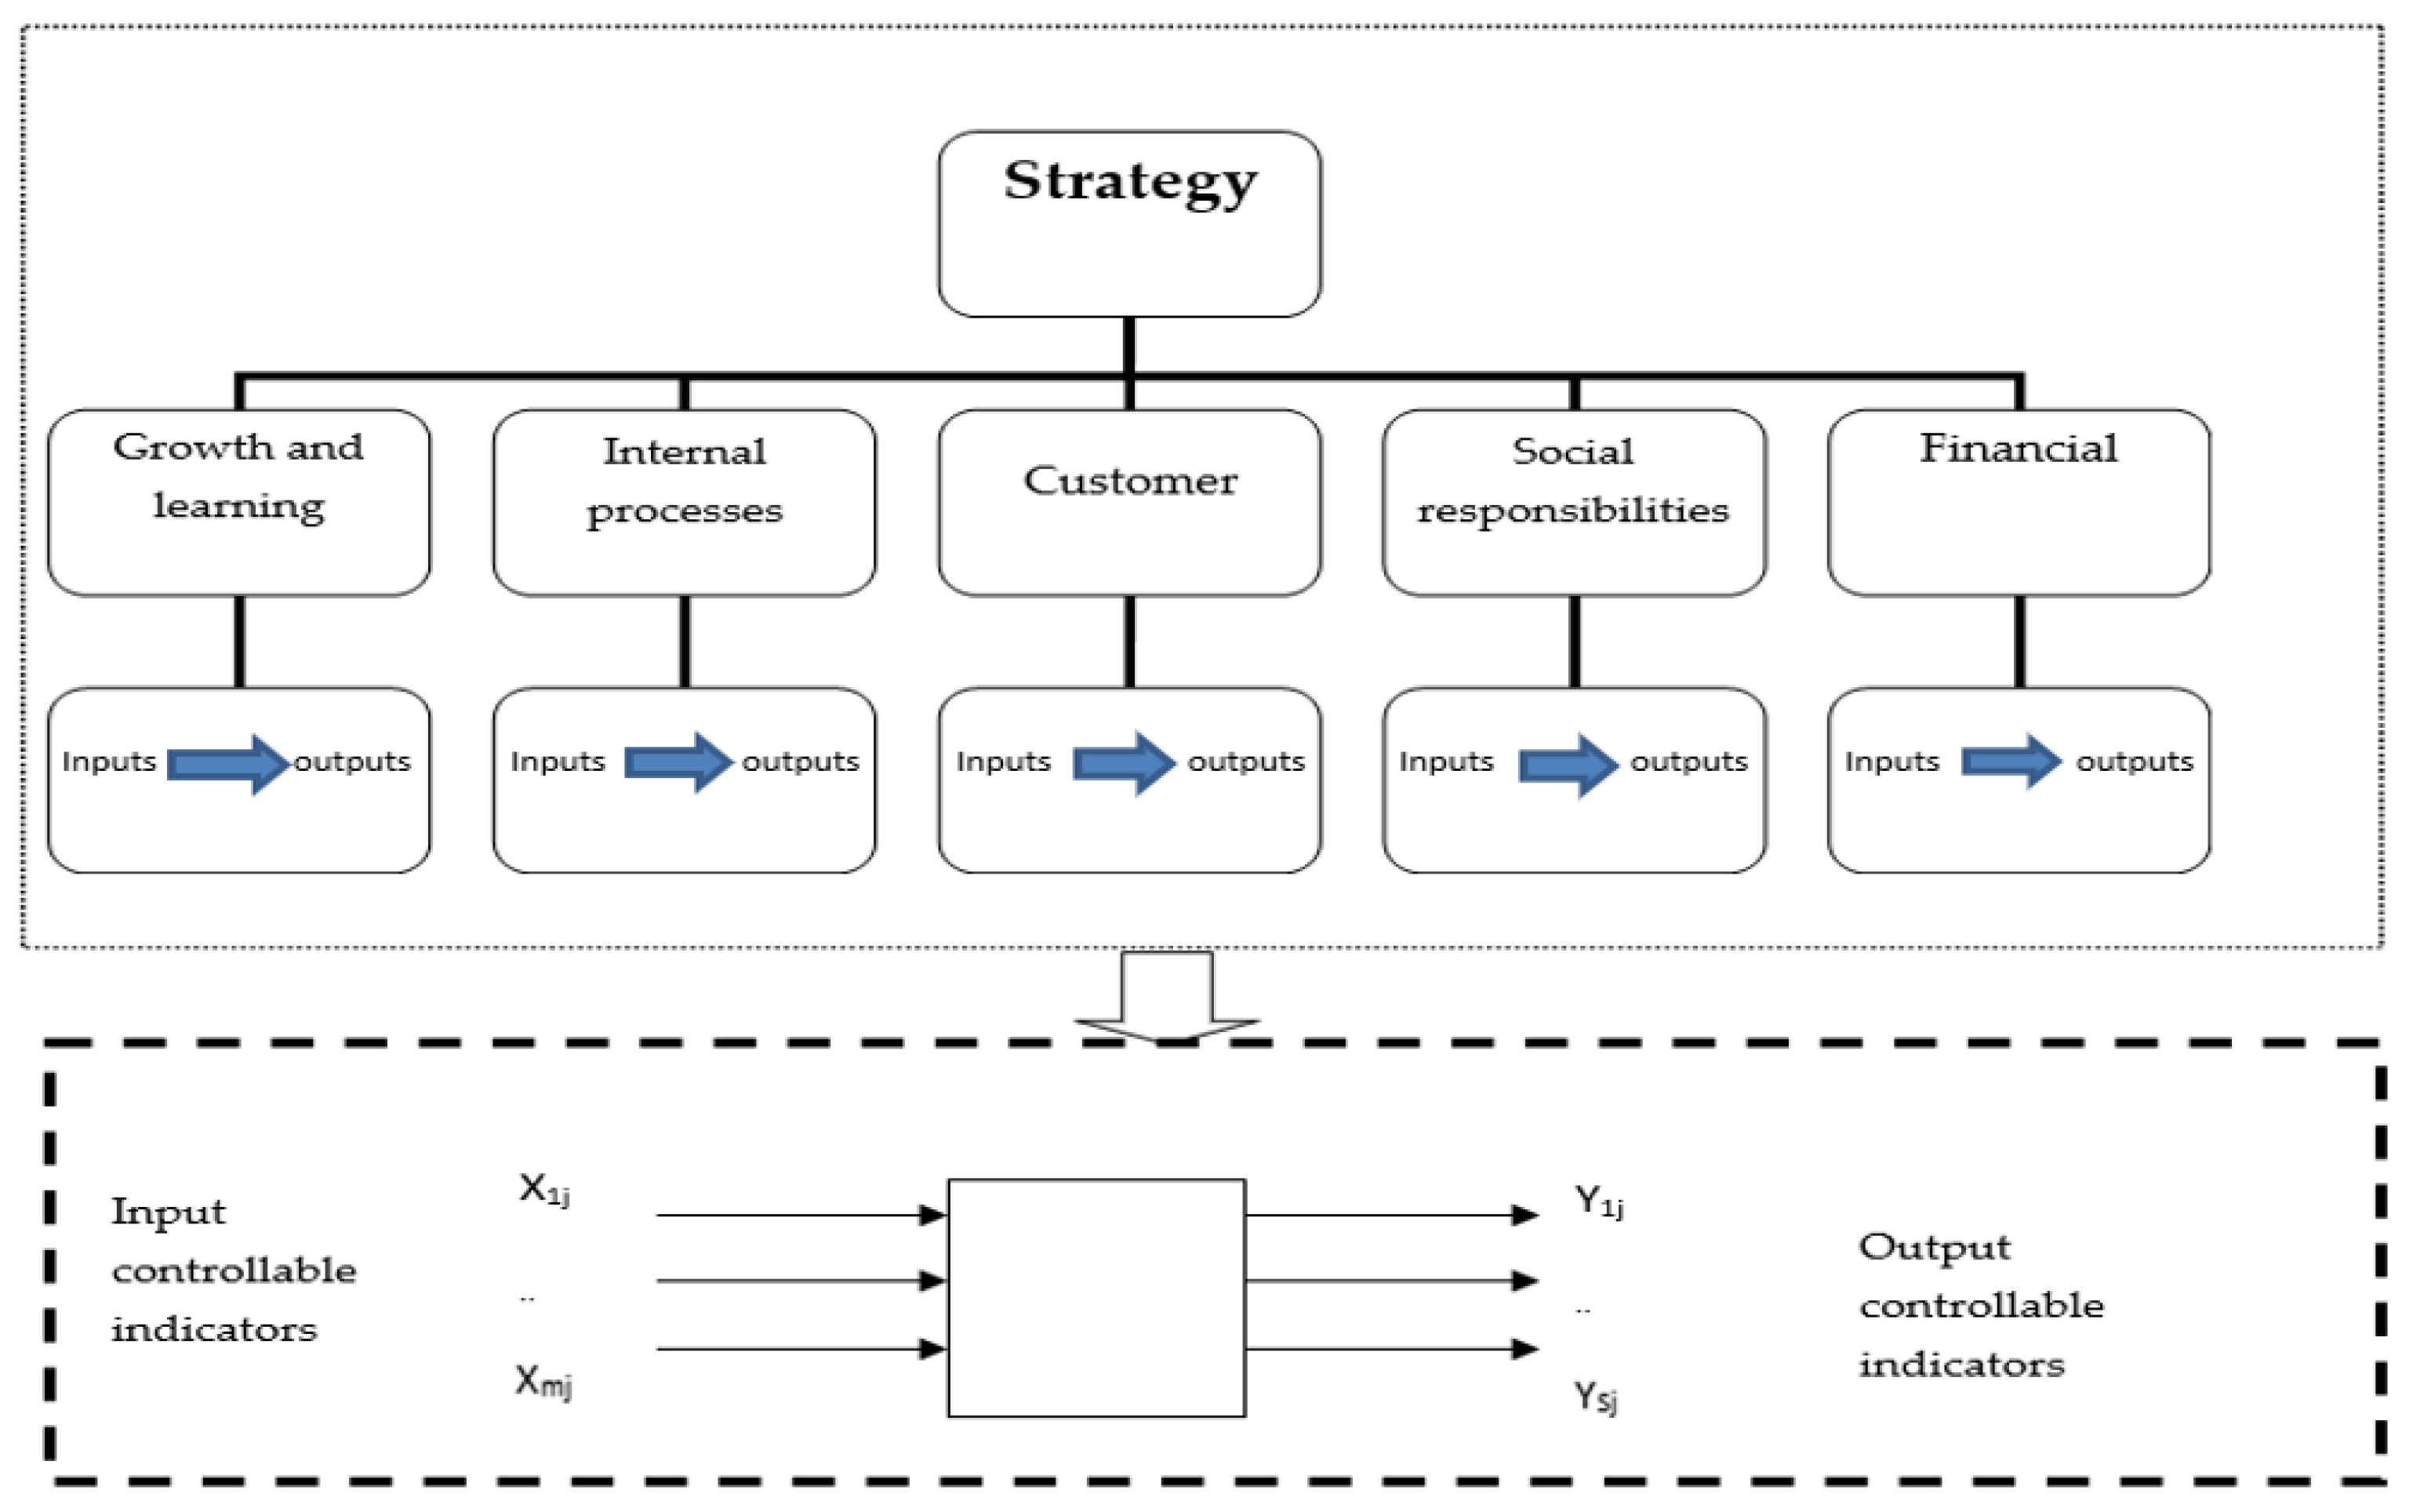
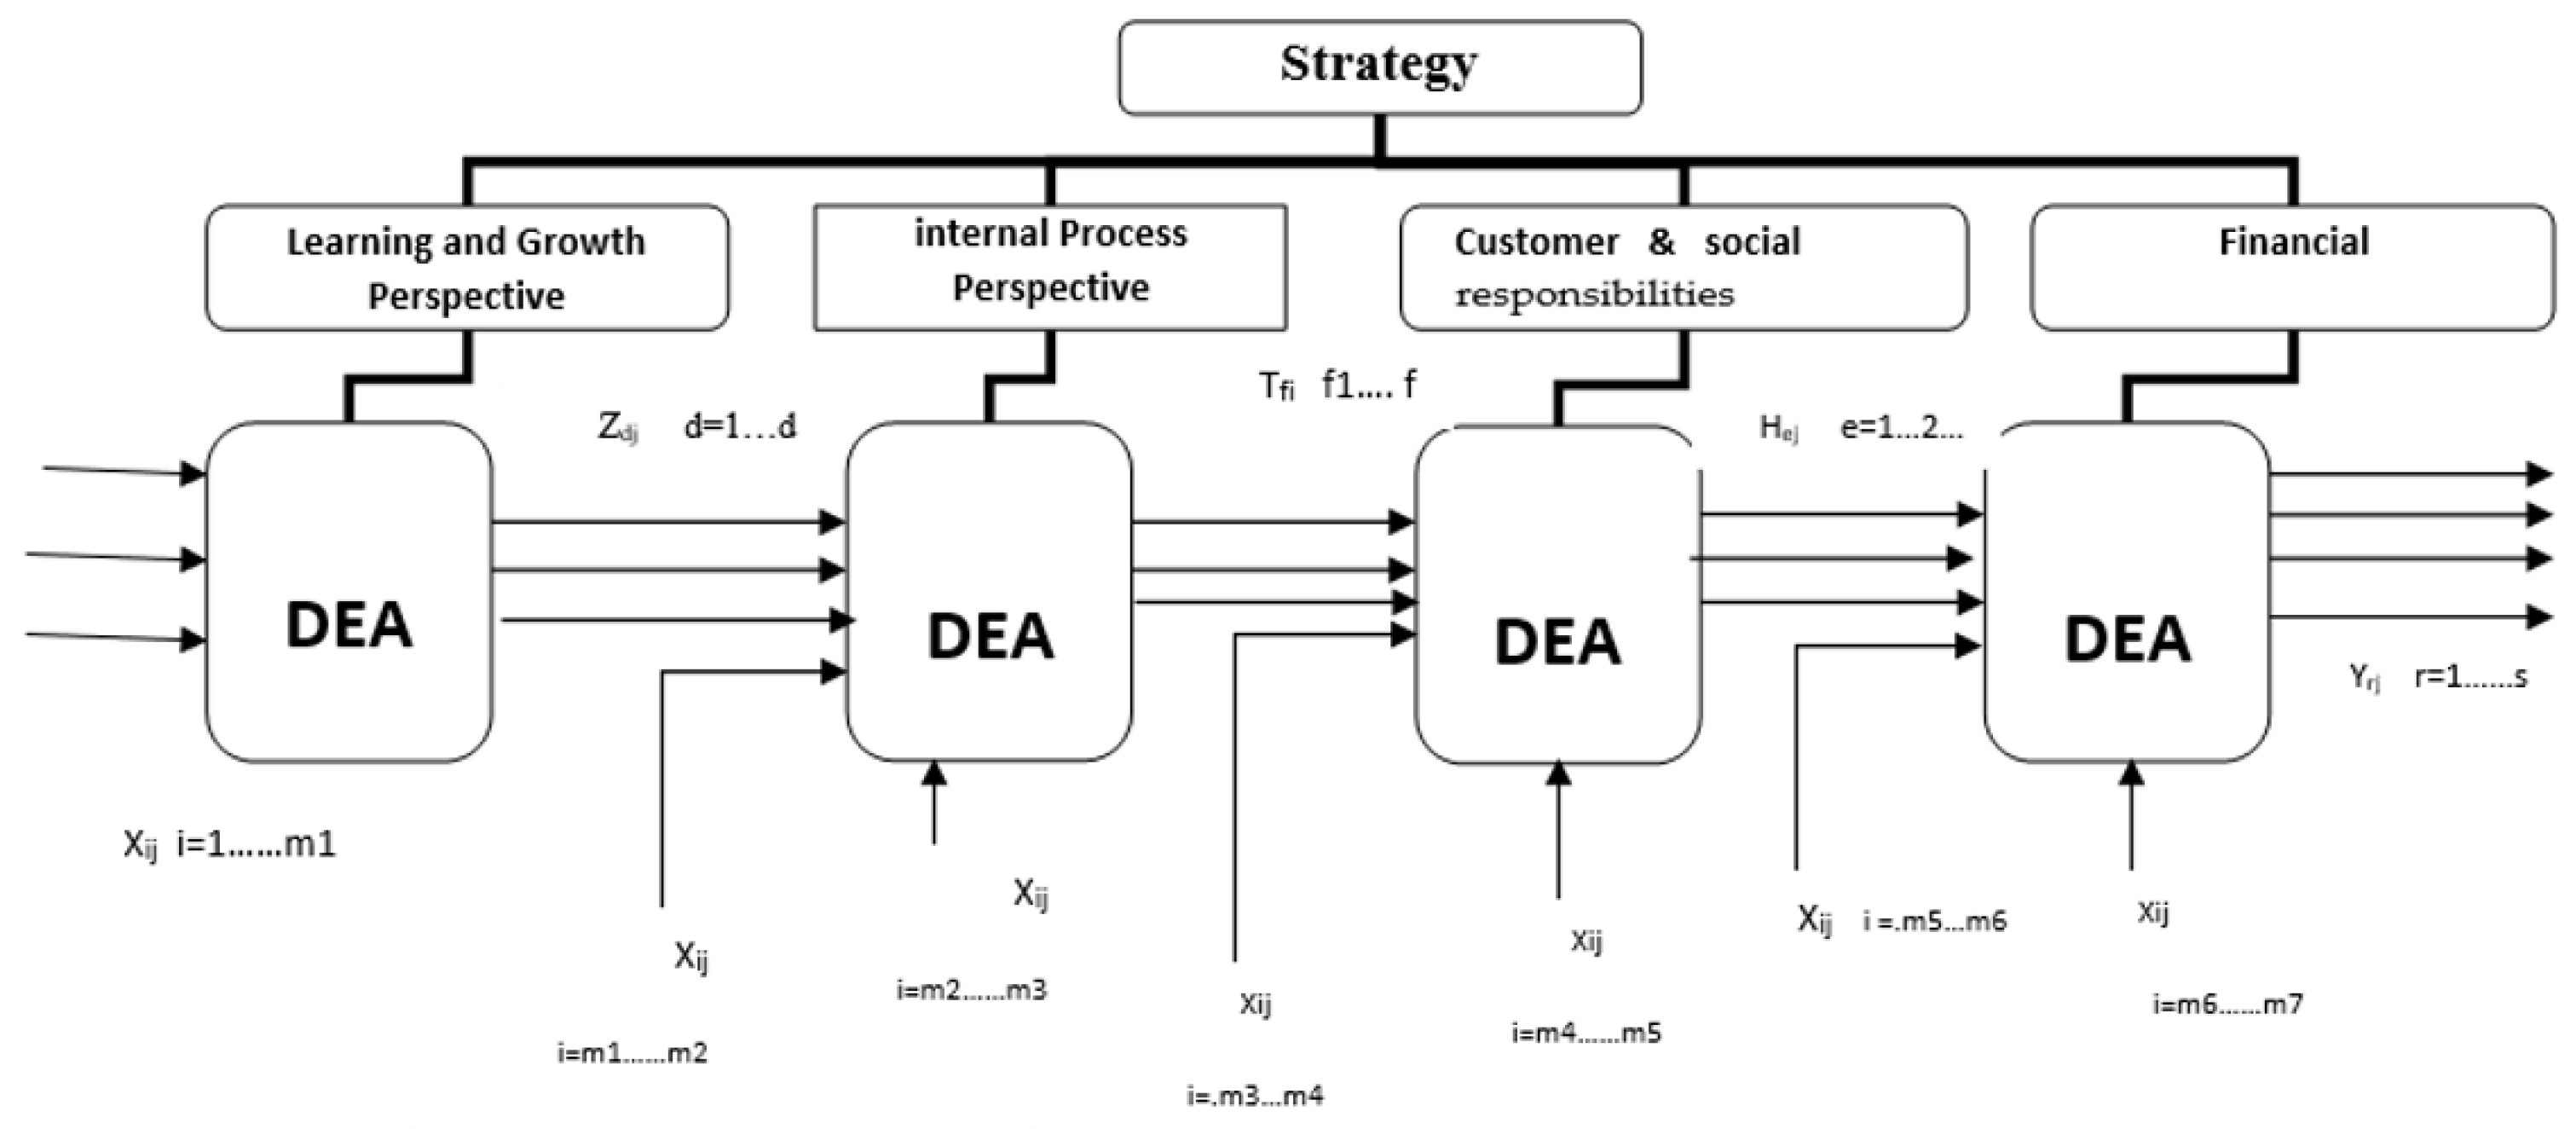
If we desire to generalize the preceding model, it can take the form shown in
Figure 5. This model defines the correlation between the balanced scorecard’s five functional domains and the organizational strategies. Each field’s pertinent indicators are defined by this model, some of which can be input or output:
We can integrate these indicators in a unified manner if we demonstrate the inputs and outputs of five domains in the form of
ij and
yri, where i = (1,...,
m and r = (1,...,
s). Therefore, based on the nature of inputs and the multiple CCR model, the unit being evaluated will be as follows (Aryanezhad et al. [
21]):
We understand that the significance of different domains in a balanced scorecard varies depending on the type and the organization’s assignment. The significance of the domains must therefore be determined in addition to the efficiency calculated using the strategy model. It is worth noting that the importance of each domain in the model mentioned above varies depending on the organizational framework. From a different angle, senior management can establish boundaries between departments to maximize organizational utility. As a result, we characterize a band (upper and lower limits) in each domain in the collection, the values of which show the significance of each domain. The degree of importance of each card must be determined if o
1 to o
5 is a balanced scorecard and O
T is assumed to be the overall strategy. This is done by establishing the lower limit and upper limit for each domain. The importance of the kth domain of a balanced scorecard is referred to as
Fk. It is equivalent to the inputs of the same card divided by the total inputs for inputs and the outputs of the same card divided by the total outputs for outputs. As a result,
Fk is described as follows:
The significance of inputs and outputs must now be established. It is preferable to set this significance in an upper and lower range of each card for this important process. The following equations result from defining the upper and lower limits of each domain as [
Lk,
UR]:
The integrated BSC–DEA model will be as follows if the constraints mentioned above are added to the primary model:
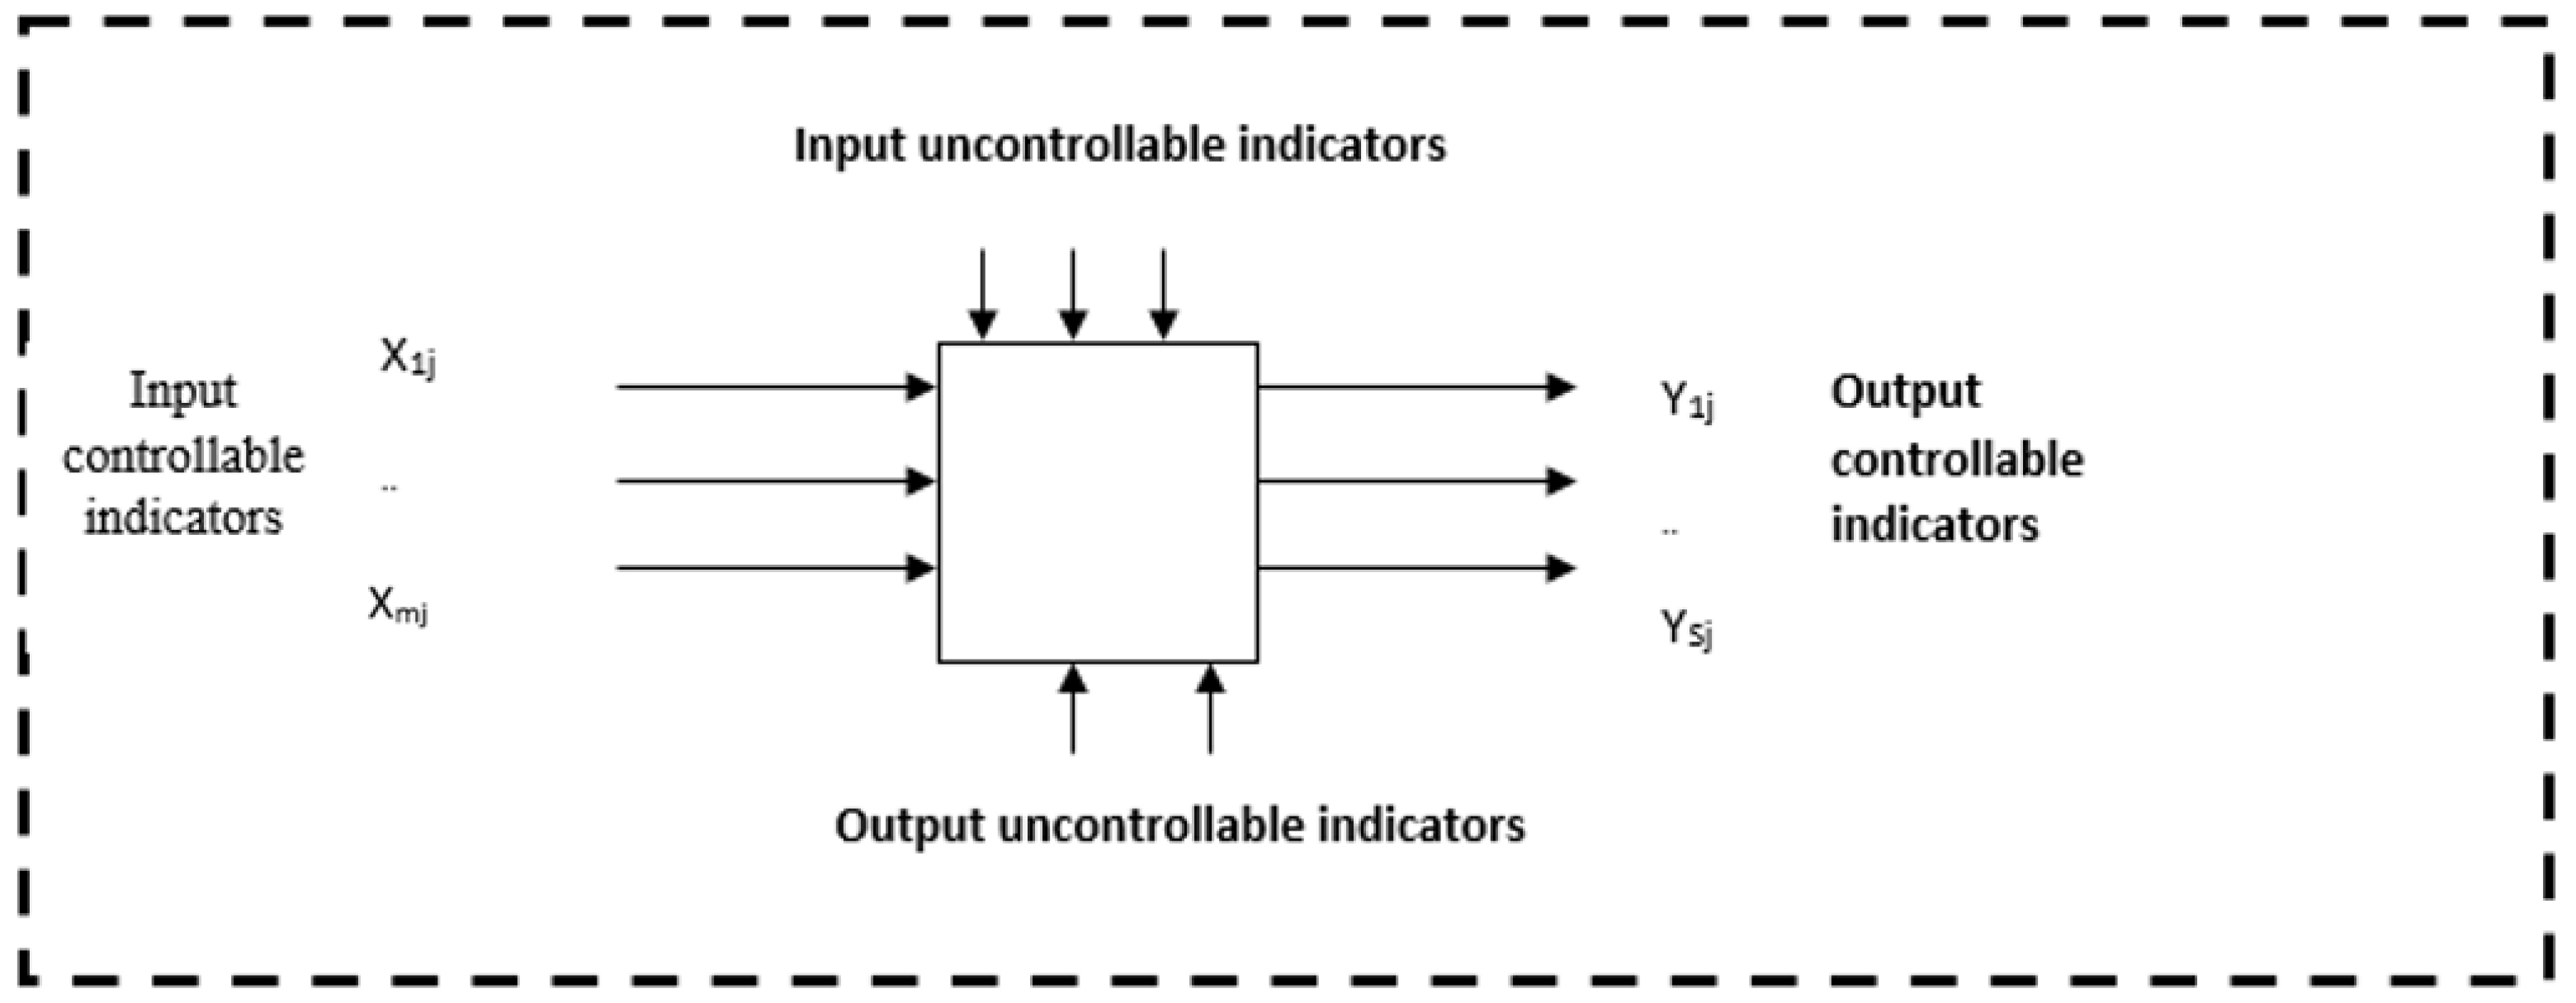
In real-world issues, it is clear that management lacks adequate control over all indicators. It is evident that the integrated model should be developed in accordance with this significant trend. The indicators in
Figure 6 are classified as controllable or uncontrollable.
We are aware that the uncontrollable index needs to be taken into account in the numerical model so that management cannot influence or change it. Based on the uncontrollable indicators in the character of the input, the integrated DEA–BSC model will be as follows:
The DEA technique is used to evaluate the organization every time the BSC is executed in the integrated method. The organization will achieve the favored and anticipated performance situations if the objectives established for the previous period are accomplished. This indicates that in all periods, the organization is compared to the anticipated situations of the earlier period, and new efficiency and objectives are established. The calculation of efficiency also takes into account uncontrollable inputs and outputs that will not change or have an impact on the following period. However, the influence of external, uncontrollable factors on an organization should be minimized by defining the controllable indicators as precisely as possible.
5. Results Analysis Model Implementation
The stages that should be taken into consideration in the design of a scorecard integration system and data envelopment analysis were explained in the preceding sections. In this section, we explain the implementation of this integrated system in Shahriar Municipality. We first gathered indicators for this crucial procedure employing the balanced scorecard’s five domains. Based on the types of input and output, the selected indicators are grouped, and the organization provides the data for each one.
The indicators chosen for the balanced scorecard’s five aspects, along with their input or output character, are shown in
Table 2. It is important to note that these indicators were developed using library research and a professional team in the discipline of social responsibilities. After interviewing specialists and studying the literature on the topic, we collected three informing and culture-making indicators for urban services: the quantity of advertisements disseminated to enhance traffic culture and the indicators of environmental pollution reduction.
As it was said, in order to identify the investigated indicators, 75 indicators were first identified through library studies and interviews. In practice, however, a large number of indicators can cause ambiguity and deviation for decision-makers. Kaplan and Atkinson announced that to implement a standard balanced scorecard, the number of indicators should be between 10 and 25. In order to select the final indicators, the specified indicators were provided to the experts and with the help of the questionnaire, 21 indicators were finally approved.
The expansion of tourism services is an unmanageable indicator among the above indicators and in the domain of customers. Owing to the fact that it has additional trustees, the municipality does not have sole authority over this matter. As a result, this index is uncontrollable.
The weights of each balanced scorecard category must then be calculated. We can employ the hierarchical structure (AHP) shown in
Figure 7 for this critical process. As a result, the specialists were requested to offer their viewpoints by filling out a pairwise comparison table between the five parallel scorecard domains until the relative weights and significance of each aspect were determined by employing the AHP method.
As a first step, we use the experts’ recommendations to develop a matrix of pairwise comparisons (
Table 3).
The following results were acquired by entering the matrix of pairwise comparisons into the Expert Choice software (
Table 4).
The upper and lower limits for each domain of the balanced scorecard are determined with the assistance of the expert team and are shown in
Table 5 because they are required by the numerical model.
According to the tables, the financial sector and customers are given the most weight. Municipalities place a high priority on their finances, and many of their operations are governed in part because doing so will boost their financial assets. A low priority is given to the field of social responsibilities. According to the investigations, this domain is still not recognized as a necessity and an essential factor in generating sustainable income. This field will undoubtedly become much more significant in the management of municipalities in the future.
The importance of the five areas of the balanced scorecard has been obtained by taking into account the opinion of experts in the urban area (
Table 3), and of course, we should know that these results depend to a large extent on the area under investigation. In larger cities with different cultures, different results may be obtained. We know that the social responsibilities of municipalities can be mentioned from development in the fields of transportation, architecture, urban planning and green space to even programs to fight poverty, addiction, begging, social harm, and other issues and problems of society. The issue of public transportation in a metropolis like Tehran has become one of the main tasks of municipalities, but this is not among the priorities of the municipalities in many cities.
Ferdowsieh, Vahidie, Sabashahr, Shahed Shahr, Andisheh, Baghestan, and Shahriar are the seven municipalities that comprise Shahriar Municipality, which has seven departments in total. The processing was carried out using the provided numerical model after gathering the necessary data and completing the data tables; the results are displayed in
Table 6.
Table 6 shows that Andisheh City’s municipality is more effective and productive than those of other cities. The next two ranks are held by the municipalities of Shahriar and Vahidie.
Each municipality’s five domains were evaluated independently, and the results are shown in
Table 7:
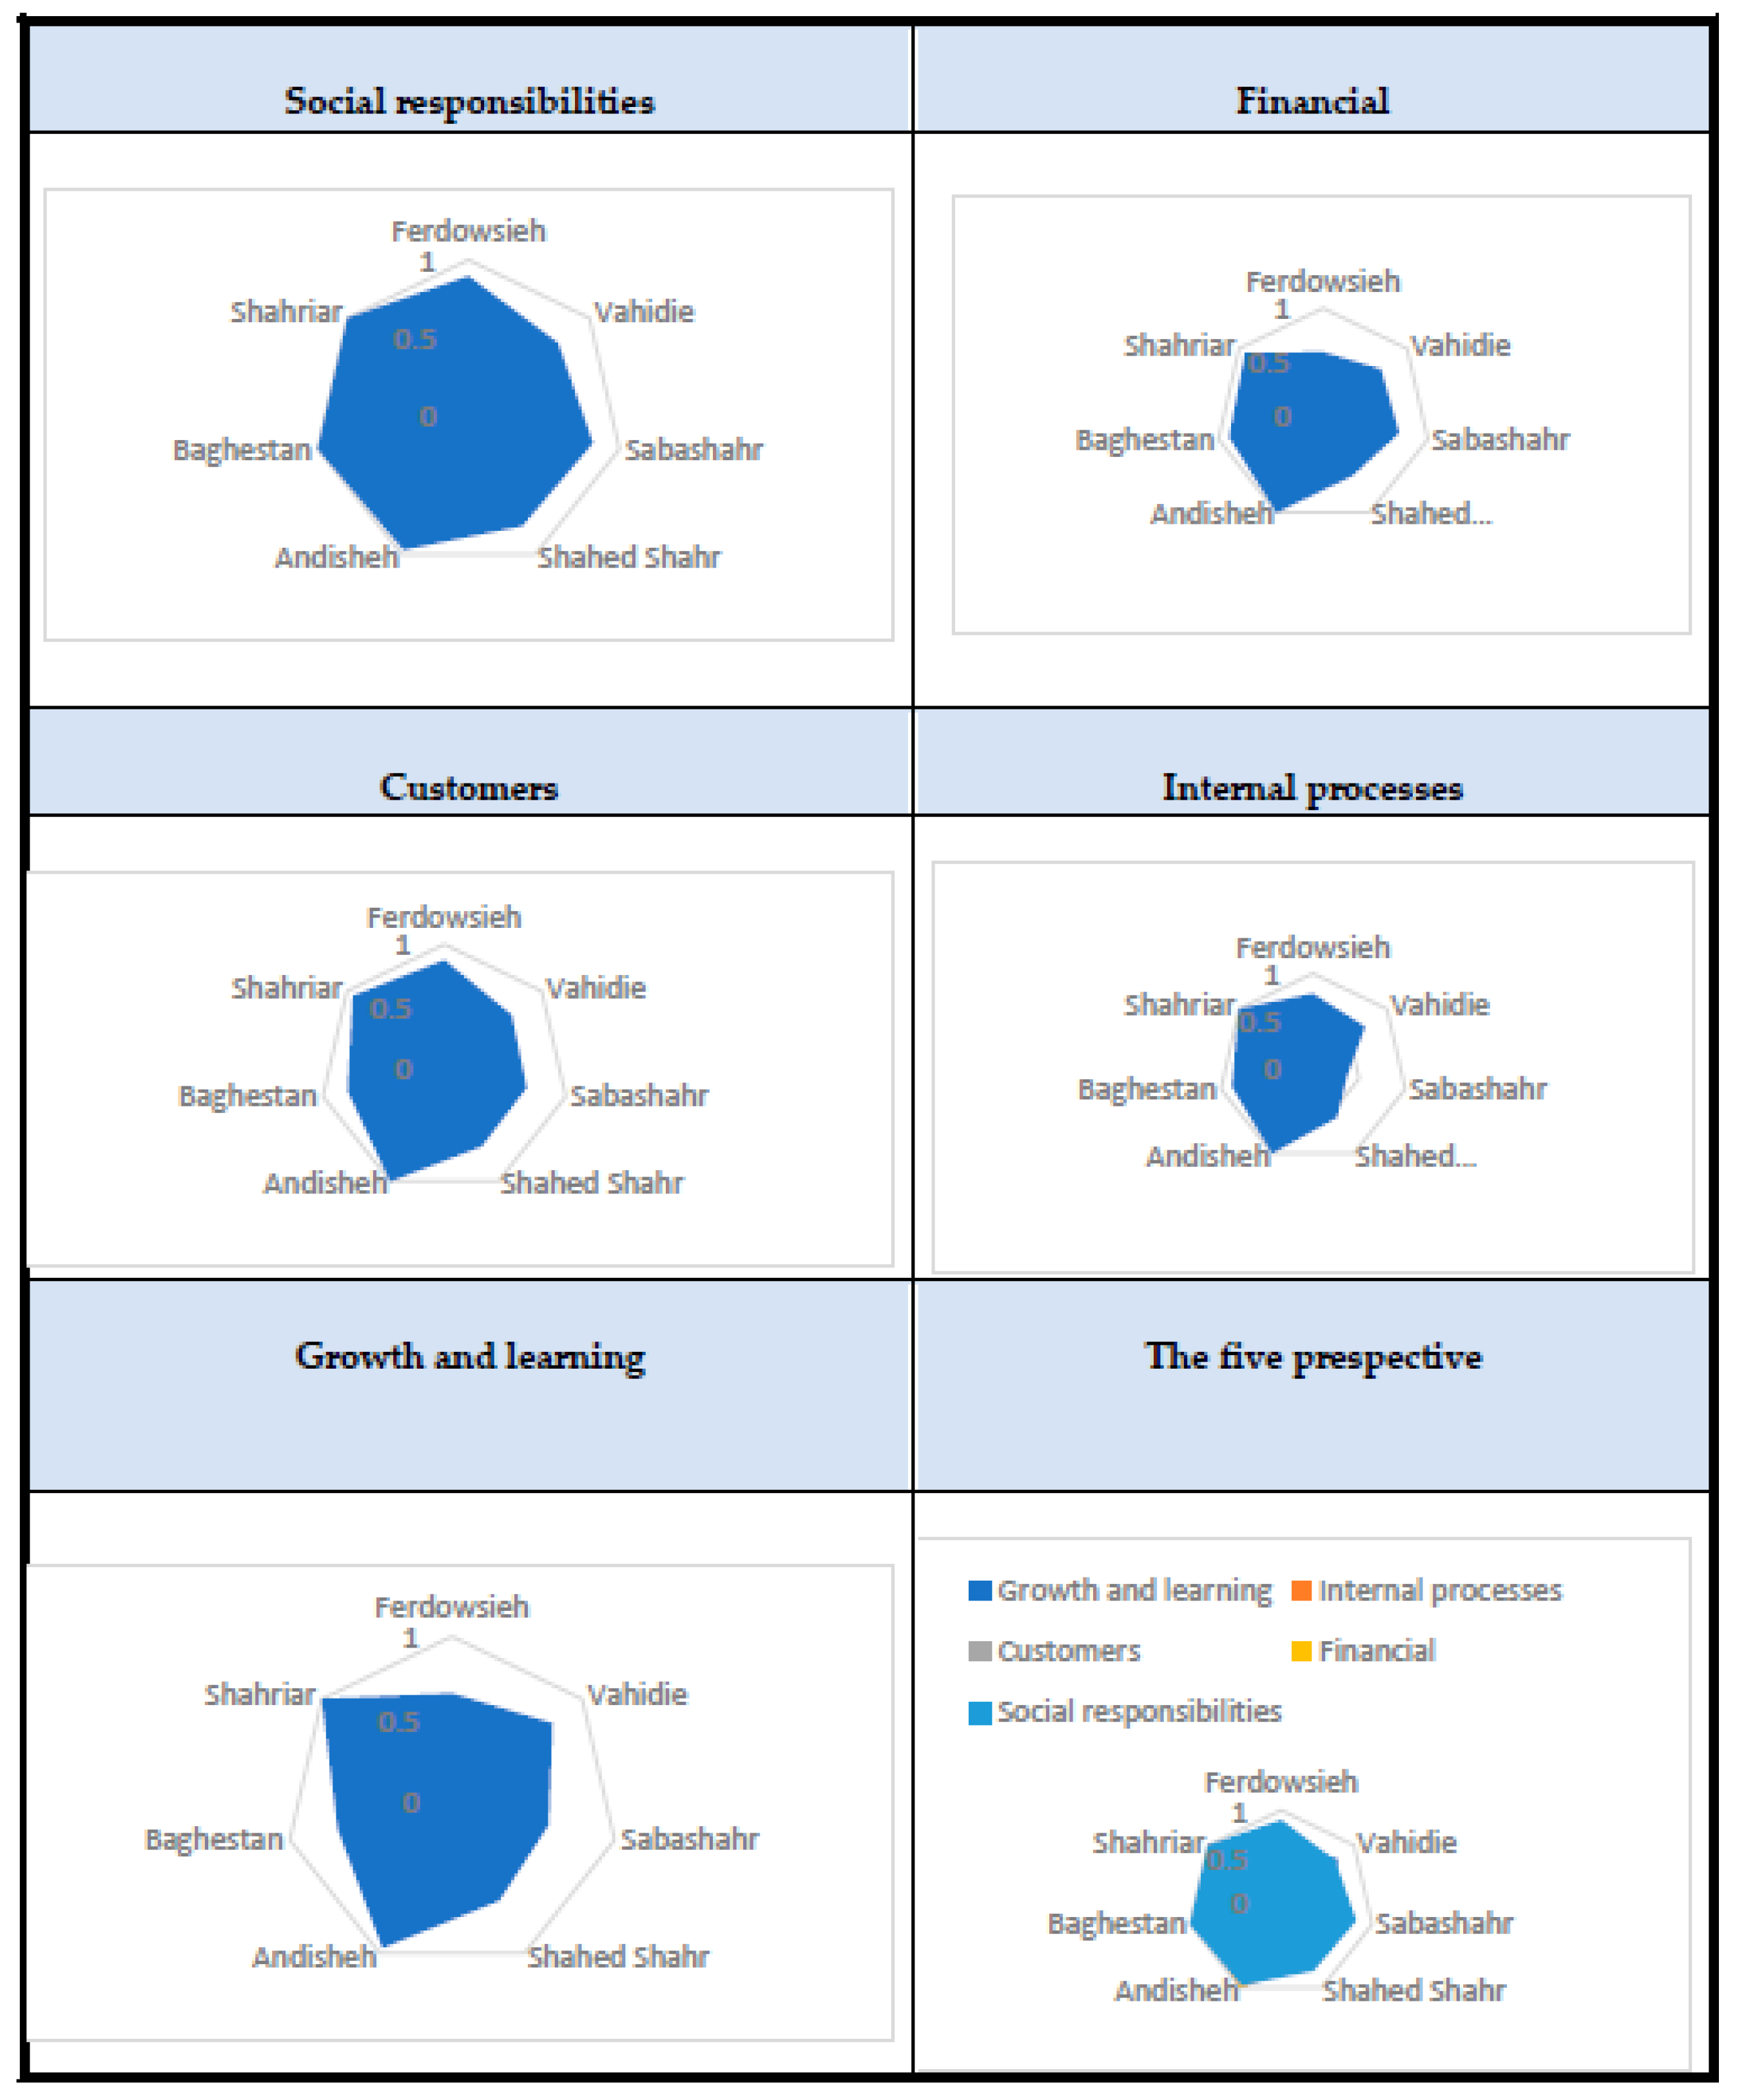
We cannot analyze the network model with connections between domains because each domain in
Table 7 was evaluated individually and independently. In comparison to other cities, Ferdowsieh performs poorly in the financial sector, despite the fact that the findings of the other domains demonstrate that they do not perform well. The results of an analysis of cities based on various domains are demonstrated in the form of a graph (
Figure 8).
As shown, compared to the other municipalities, the municipalities of Andisheh and Shahriar have significantly better conditions in all five aspects. In terms of sustainable development issues, social responsibilities, with its financial aspect being important from the perspective of municipal managers, should be seen as one of the most crucial foundations of municipalities today. Superior performance was shown by the three municipalities of Andisheh, Baghestan, and Shahryar. This function has both positive and negative aspects.
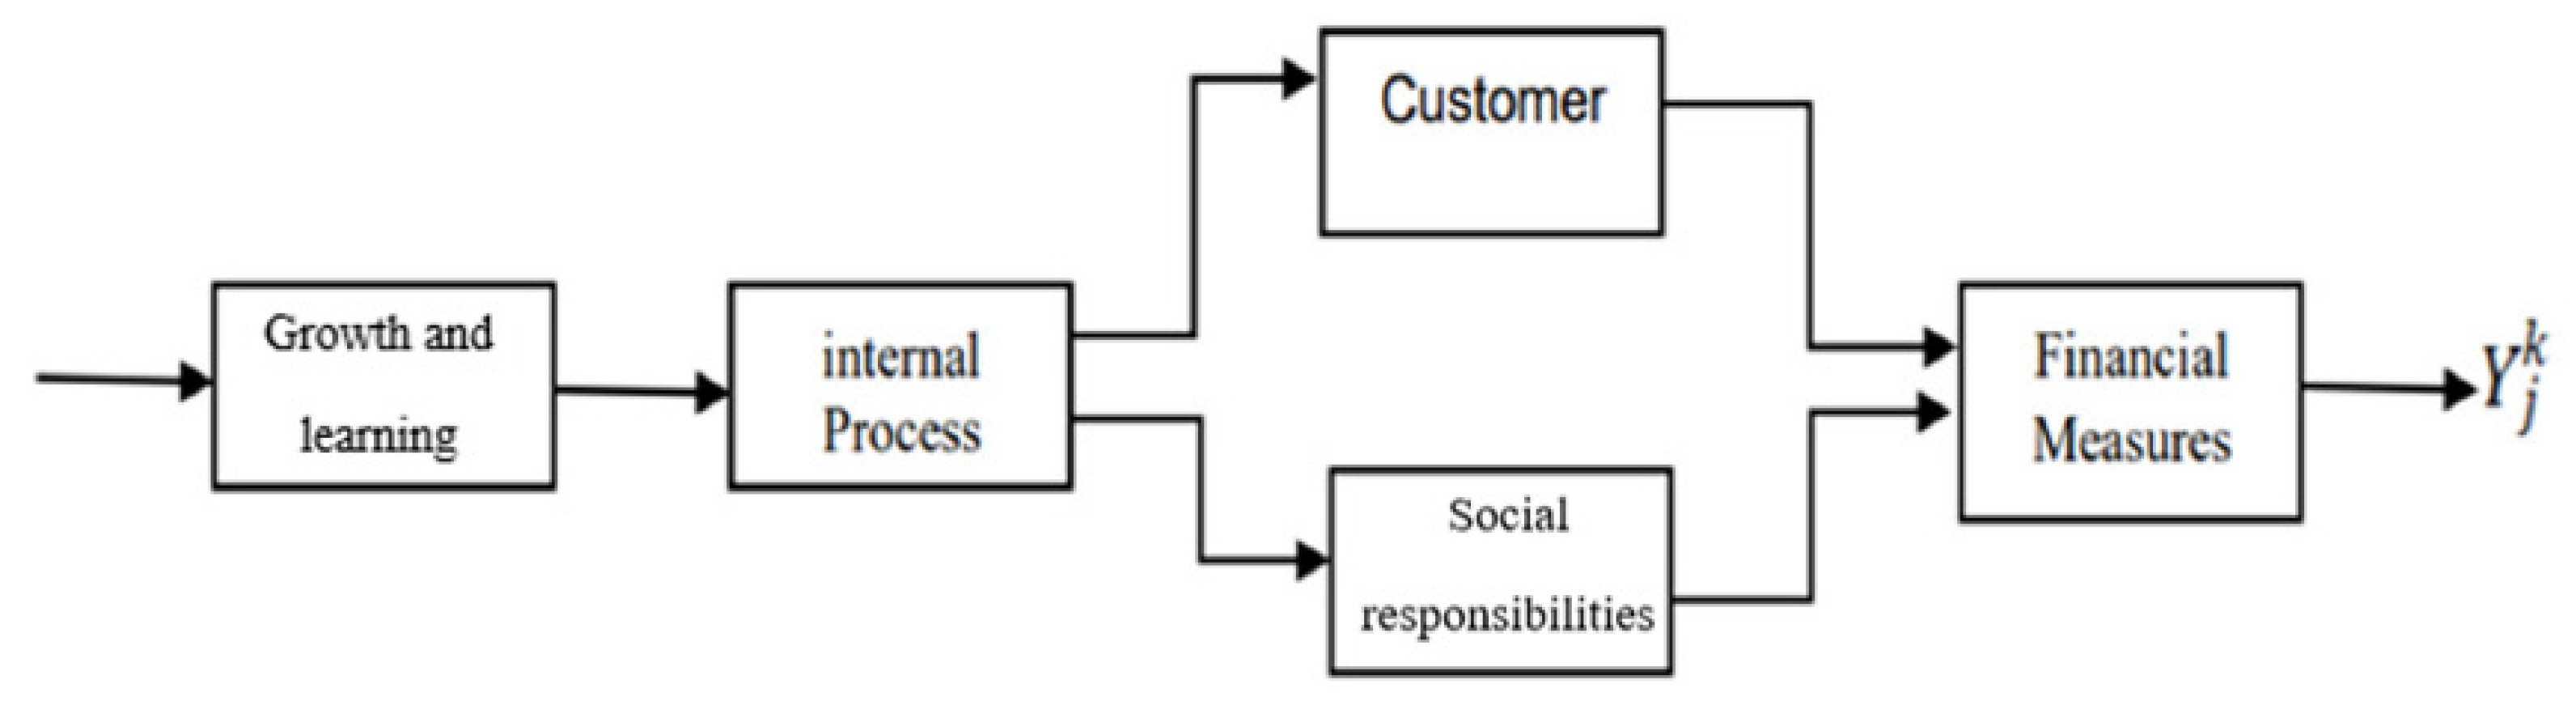
Considering the network structure of the model based on the interaction model between the five balanced scorecard domains depicted in
Figure 2, this connection is established, as illustrated in
Figure 9. The network model is sequential, and the customer and social responsibilities domains are grouped together in a single box.
The following network multiple model is derived if we prefer to take the uncontrollable indicators into account when considering the numerical model of the aforementioned structure:
The growth of tourism services is an uncontrollable indicator, according to the indicators in
Table 2 and
Table 8 considering the important note in the field of customers.
Customers and social responsibility are taken into account in the model above, but if we want to assess them independently, the network structure corresponds to that depicted in
Figure 10.
If this model is used, then the findings are as shown in
Table 9.
According to the findings in
Table 9, the municipalities of Andisheh and Shahriar performed relatively well. Andisheh municipality is efficient in four domains and ineffective in only the growth and learning domain. In light of the fact that the system has a network structure, this unit should focus more on this domain.
As can be seen in
Table 9, Andishe municipality is ineffective in the field of growth and learning but efficient in other areas. It should be said that in the time-series system, the efficiency of the whole system is efficient when all its subcomponents are efficient. Therefore, the functionality of the following components is not definitely efficient. Perhaps, with changes in the efficiency of the growth and learning area, the other components may become ineffective.
6. Conclusions
In this paper, it was intended to evaluate the performance of the municipalities of Shahriar city with a combined method of balanced scorecard and data coverage analysis. First, in accordance with the goals and strategies of the municipality, and in order to create balance and coordination between its various indicators, the balanced scoring card (BSC) was created according to the structure of the municipalities. We know that one of the topics that has received much attention in recent years in municipalities is adherence to social responsibilities. Therefore, in the design of the balanced scorecard model, in addition to the four areas (growth and learning, process, customer, finance), the area of social responsibility has been added to it. The field of social responsibility is, in fact, an effort to understand and respond to the expectations of the organization’s stakeholders in society, and it is very important. The balanced scorecard model, which is one of the innovations of this article, should be evaluated with similar units in Shahriar city, which comprise seven municipal units. Therefore, the network data coverage analysis model has been written in the form of a balanced scorecard. The combined model of these two tools (BSC–NDEA) has been able to consider all indicators in a balanced way.
The network model was investigated and analyzed in two cases, i.e., when two areas of customer and social responsibilities are examined in the form of one area. Additionally, the two mentioned areas have an independent personality. In the first case, the average efficiency is 0.789, and Andisheh municipality is efficient and Wahidiye municipality has the lowest efficiency. The average efficiency in the second case is equal to 0.72 for the joint domain and 0.714 for the domain of social responsibilities, which are very close to each other. Ferdowsie has the lowest efficiency in social responsibilities with a value of 0.476. The results show that in the cities of Shahryar and Andisheh, social responsibilities are highly important (Andisheh = 1 and Shahryar = 0.891). Surveys show that the more we move toward the big cities, the social responsibilities are more important. Therefore, the municipalities of big cities and metropolises should focus more on social responsibilities.
The results show that, in Shahryar city, the field of customer is more important than social responsibilities, but it seems that in big cities like Tehran, this difference is not noticeable and perhaps the field of social responsibilities is more important (which can be suggested as a future study). The results indicate that the two cities of Shahryar and Andisheh have far better results than the other cities.
Research Limitation:
- 1-
The issue of developing a balanced scorecard required the use of experts in the urban area. This issue depends greatly on the cultural atmosphere of the area. Therefore, first, the number of experts in the urban area in the region was low, and second, there was also a sharp difference in the opinions of the experts in the investigated area.
- 2-
The concept and understanding of social responsibilities are not the same in the seven subcategory cities. Therefore, it required much time to unify the concept and understanding for different cities.


