Article

A Validation Study on Mechanical Properties of Foam Concrete with Coarse Aggregate Using ANN Model

Department of Civil Engineering, SRM Institute of Science and Technology, Kattankulathur 603203, India
*
Author to whom correspondence should be addressed.
Buildings 2023, 13(1), 218; https://doi.org/10.3390/buildings13010218
Submission received: 15 December 2022 / Revised: 7 January 2023 / Accepted: 10 January 2023 / Published: 12 January 2023
(This article belongs to the Section Building Materials, and Repair & Renovation)

Abstract

:
The usage of foam concrete (FC) was extended from being used as a filler material to an alternative concrete due to the effect of conventional concrete on global warming. The diversified perspective on FC as an alternative to conventional concrete is due to its low density (400–1800 kg/m3) and good thermal conductivity, which also results in the reduction of costs in production, labor, and transportation. Generally, FC is produced by adding a pre-made foam to the cement slurry consisting of cement and aggregates. Here, the study was carried out by the addition of a coarse aggregate and foaming agent (i.e., 12%, 6%, 3%, 2%, 1%) at varying percentages in FC to improve the strength characteristics. FC was tested for its physical and mechanical properties. From the experimental results, an Artificial Neural Network (ANN) was developed to predict the strength of FC. The results from training and testing of the Polynomial Regression Analysis model (PRA) through ANN have shown great potential in predicting compression, split tensile, and flexural strength of FC. It was found that the strength of FC is increased with the reduction of foam volume and increase in coarse aggregate volume. However, a strength of 25.6 N/mm2 is achieved when 1% foam and 50% coarse aggregate is used.

1. Introduction

Concrete is one of the most broadly used construction materials around the globe. Constructing massive structures requires a huge amount of concrete and a heavy foundation. Due to this, the self-weight of the structure also increases [1]. The self-weight of the structure can be reduced by replacing conventional concrete with other types of lightweight concrete [2,3,4,5,6,7,8,9,10,11]. Foam Concrete (FC) is one such material that is light in weight, durable, sustainable, and environmentally friendly [1,12]. FC is produced by mixing cement, sand, water, and a stable foaming agent [13]. In FC, air voids are induced in the mortar with the help of a suitable foaming agent [14]. The amount of foam added to the slurry significantly impacts the density of FC, which ranges between 400 kg/m3 and 1800 kg/m3 [1].
Foam is produced using a foam generator by infusing compressed air in a diluted foaming agent. This foaming solution is diluted with water in 1:20 ratio. It is then added to the premade slurry, made up of cement, sand, and water. The air voids in FC range from 10% to 70% based on the added foam volume [6,15].
To minimize the experimental work, probabilistic models and constitutive equations are typically developed [16,17,18]. Most probabilistic modeling research focuses on developing mathematical models that illustrate the connection between a material’s behavior and its components. However, predicting a material’s behavior mathematically in the case of non-linear behavior is a highly challenging endeavor. Regression models are one of the traditional methods used in model generation. The main benefit of regression analysis is that it makes predictions easier and faster [18,19].
The use of Multiple Regression Analysis (MRA) can improve the model’s accuracy in a big way [20]. It has been found that the accuracy of a model decreases with the increase in the number of independent variables. In these kinds of complicated situations, methods such as Artificial Neural Networks (ANNs) [21,22,23], the adaptive neuro-fuzzy inference system [24,25], factorial design [26], genetic-based algorithms [27], model tree [28], and fuzzy logic [29] can be used to make predictions more accurate [30]. Regression analysis is divided into five types, which are simple linear, multiple linear, logistic, polynomial, and cox regression. They were chosen based on the dependent and independent variable types [31].
The ability of Artificial Neural Networks (ANNs) to learn from experimental or numerical data has led many researchers to use them in predicting the strength of concrete. An ANN requires enough input and output data but it does not require any specific equation. The essential attribute of ANN is its capacity for direct learning from examples. As a result, complicated or partial data problems can be handled effectively by ANN [19].
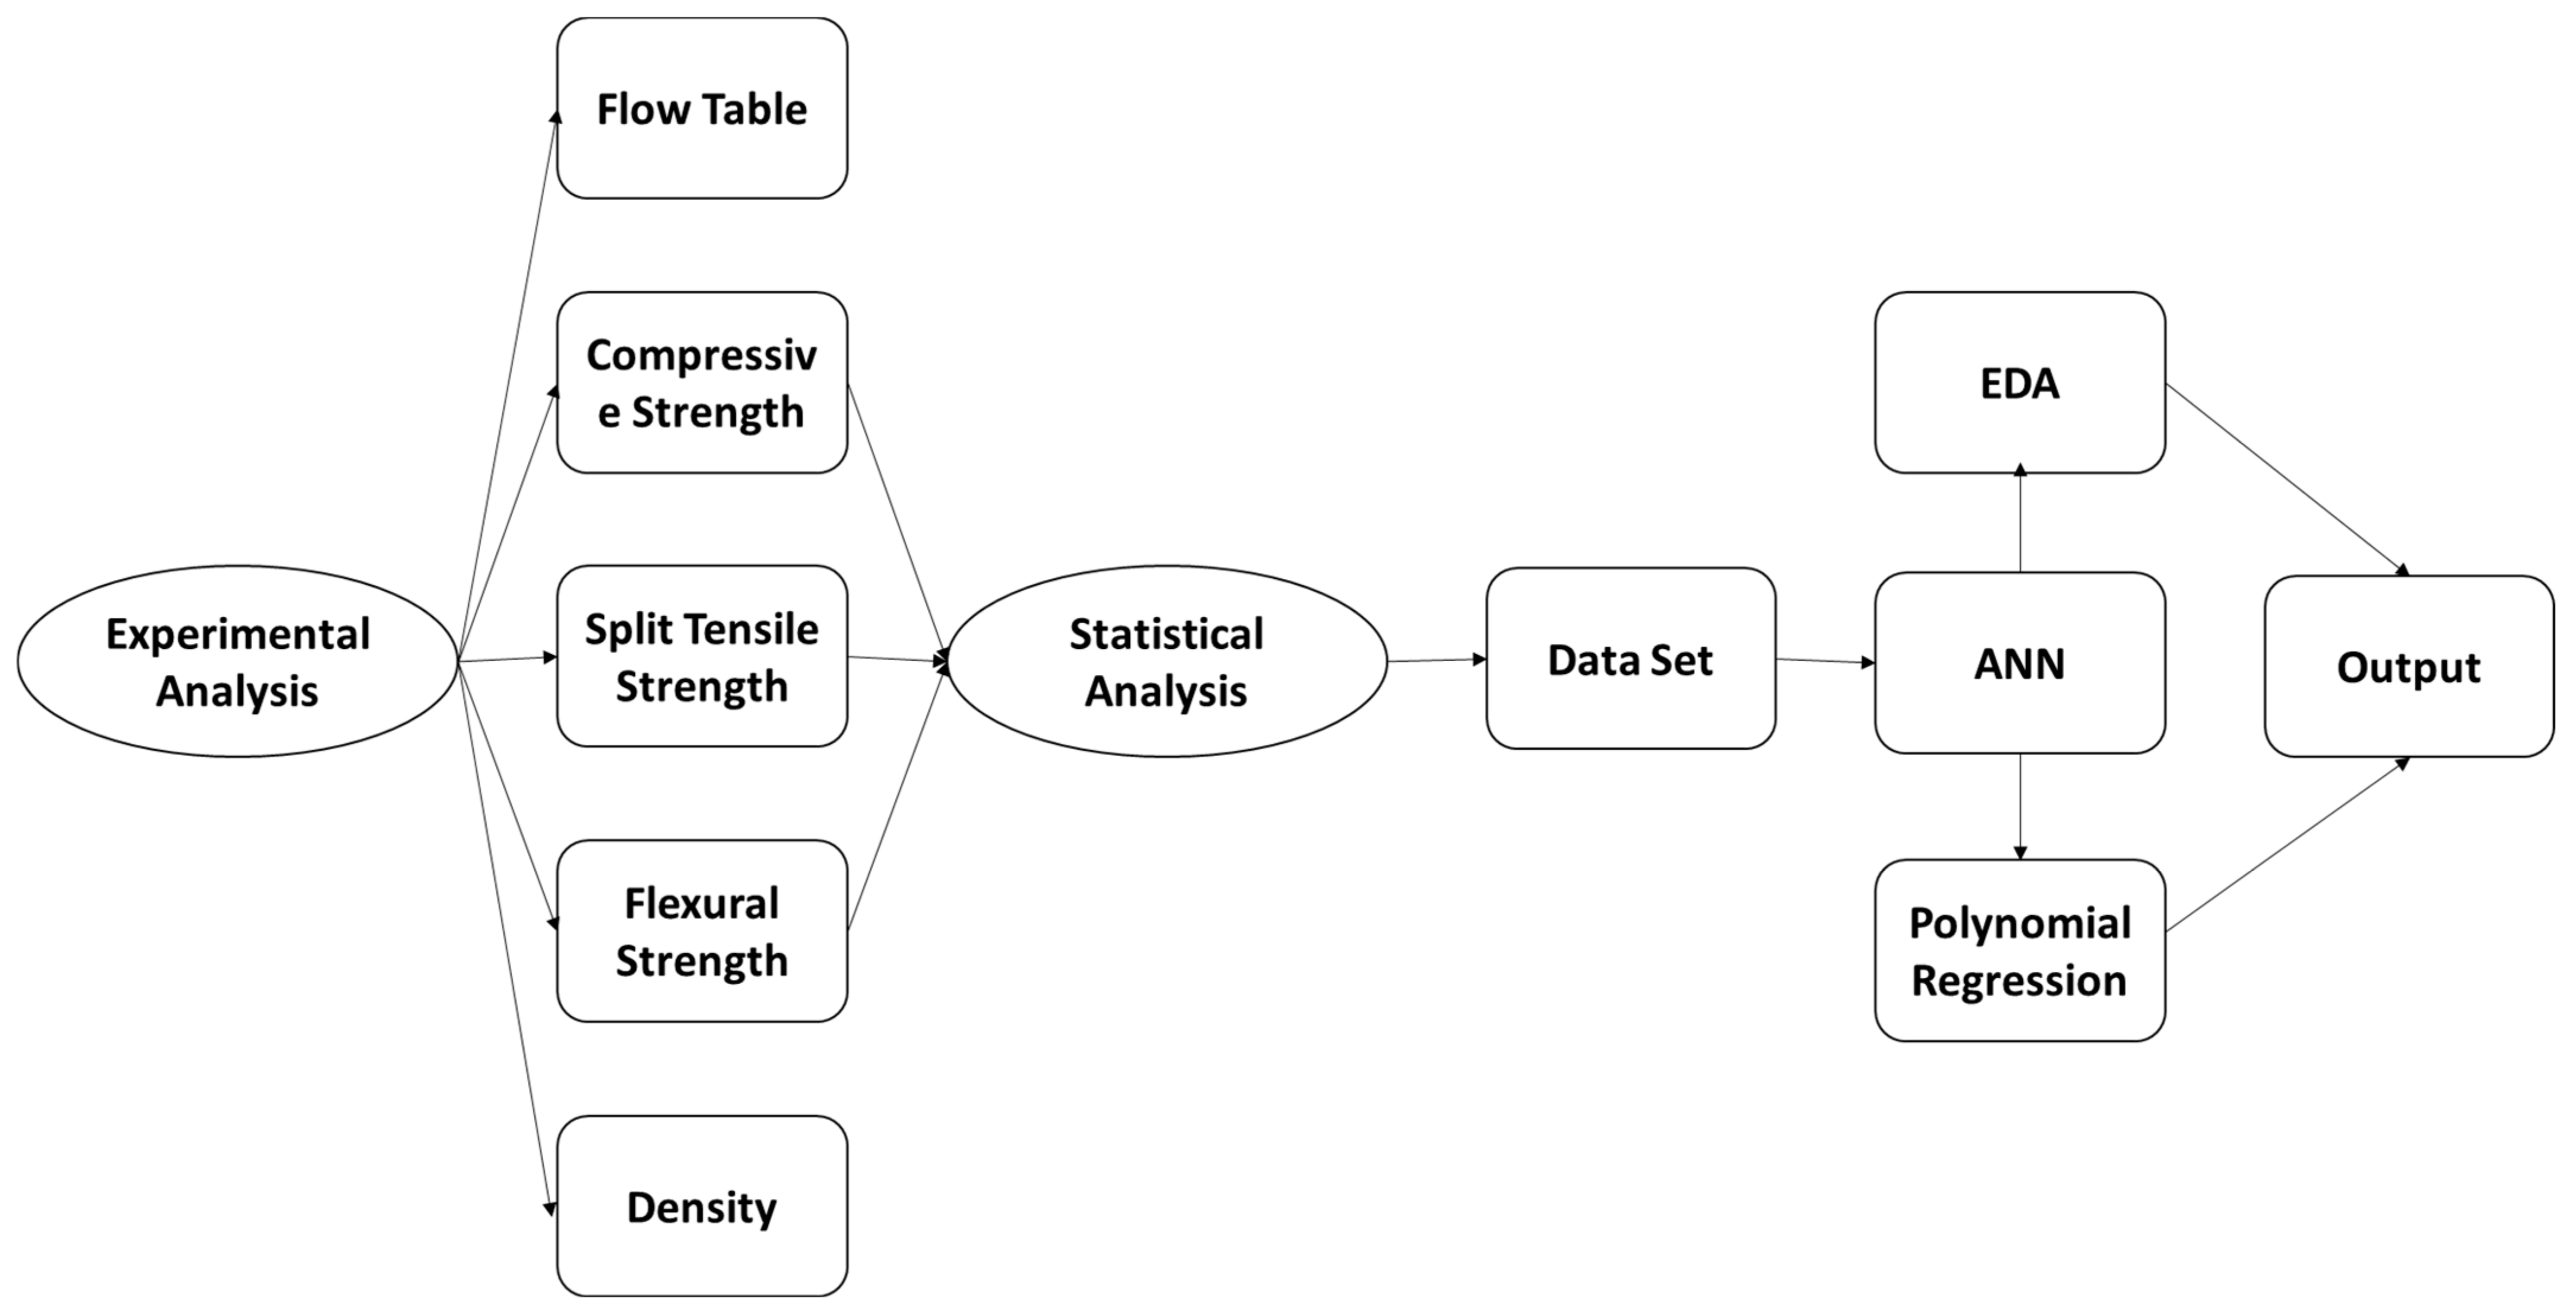
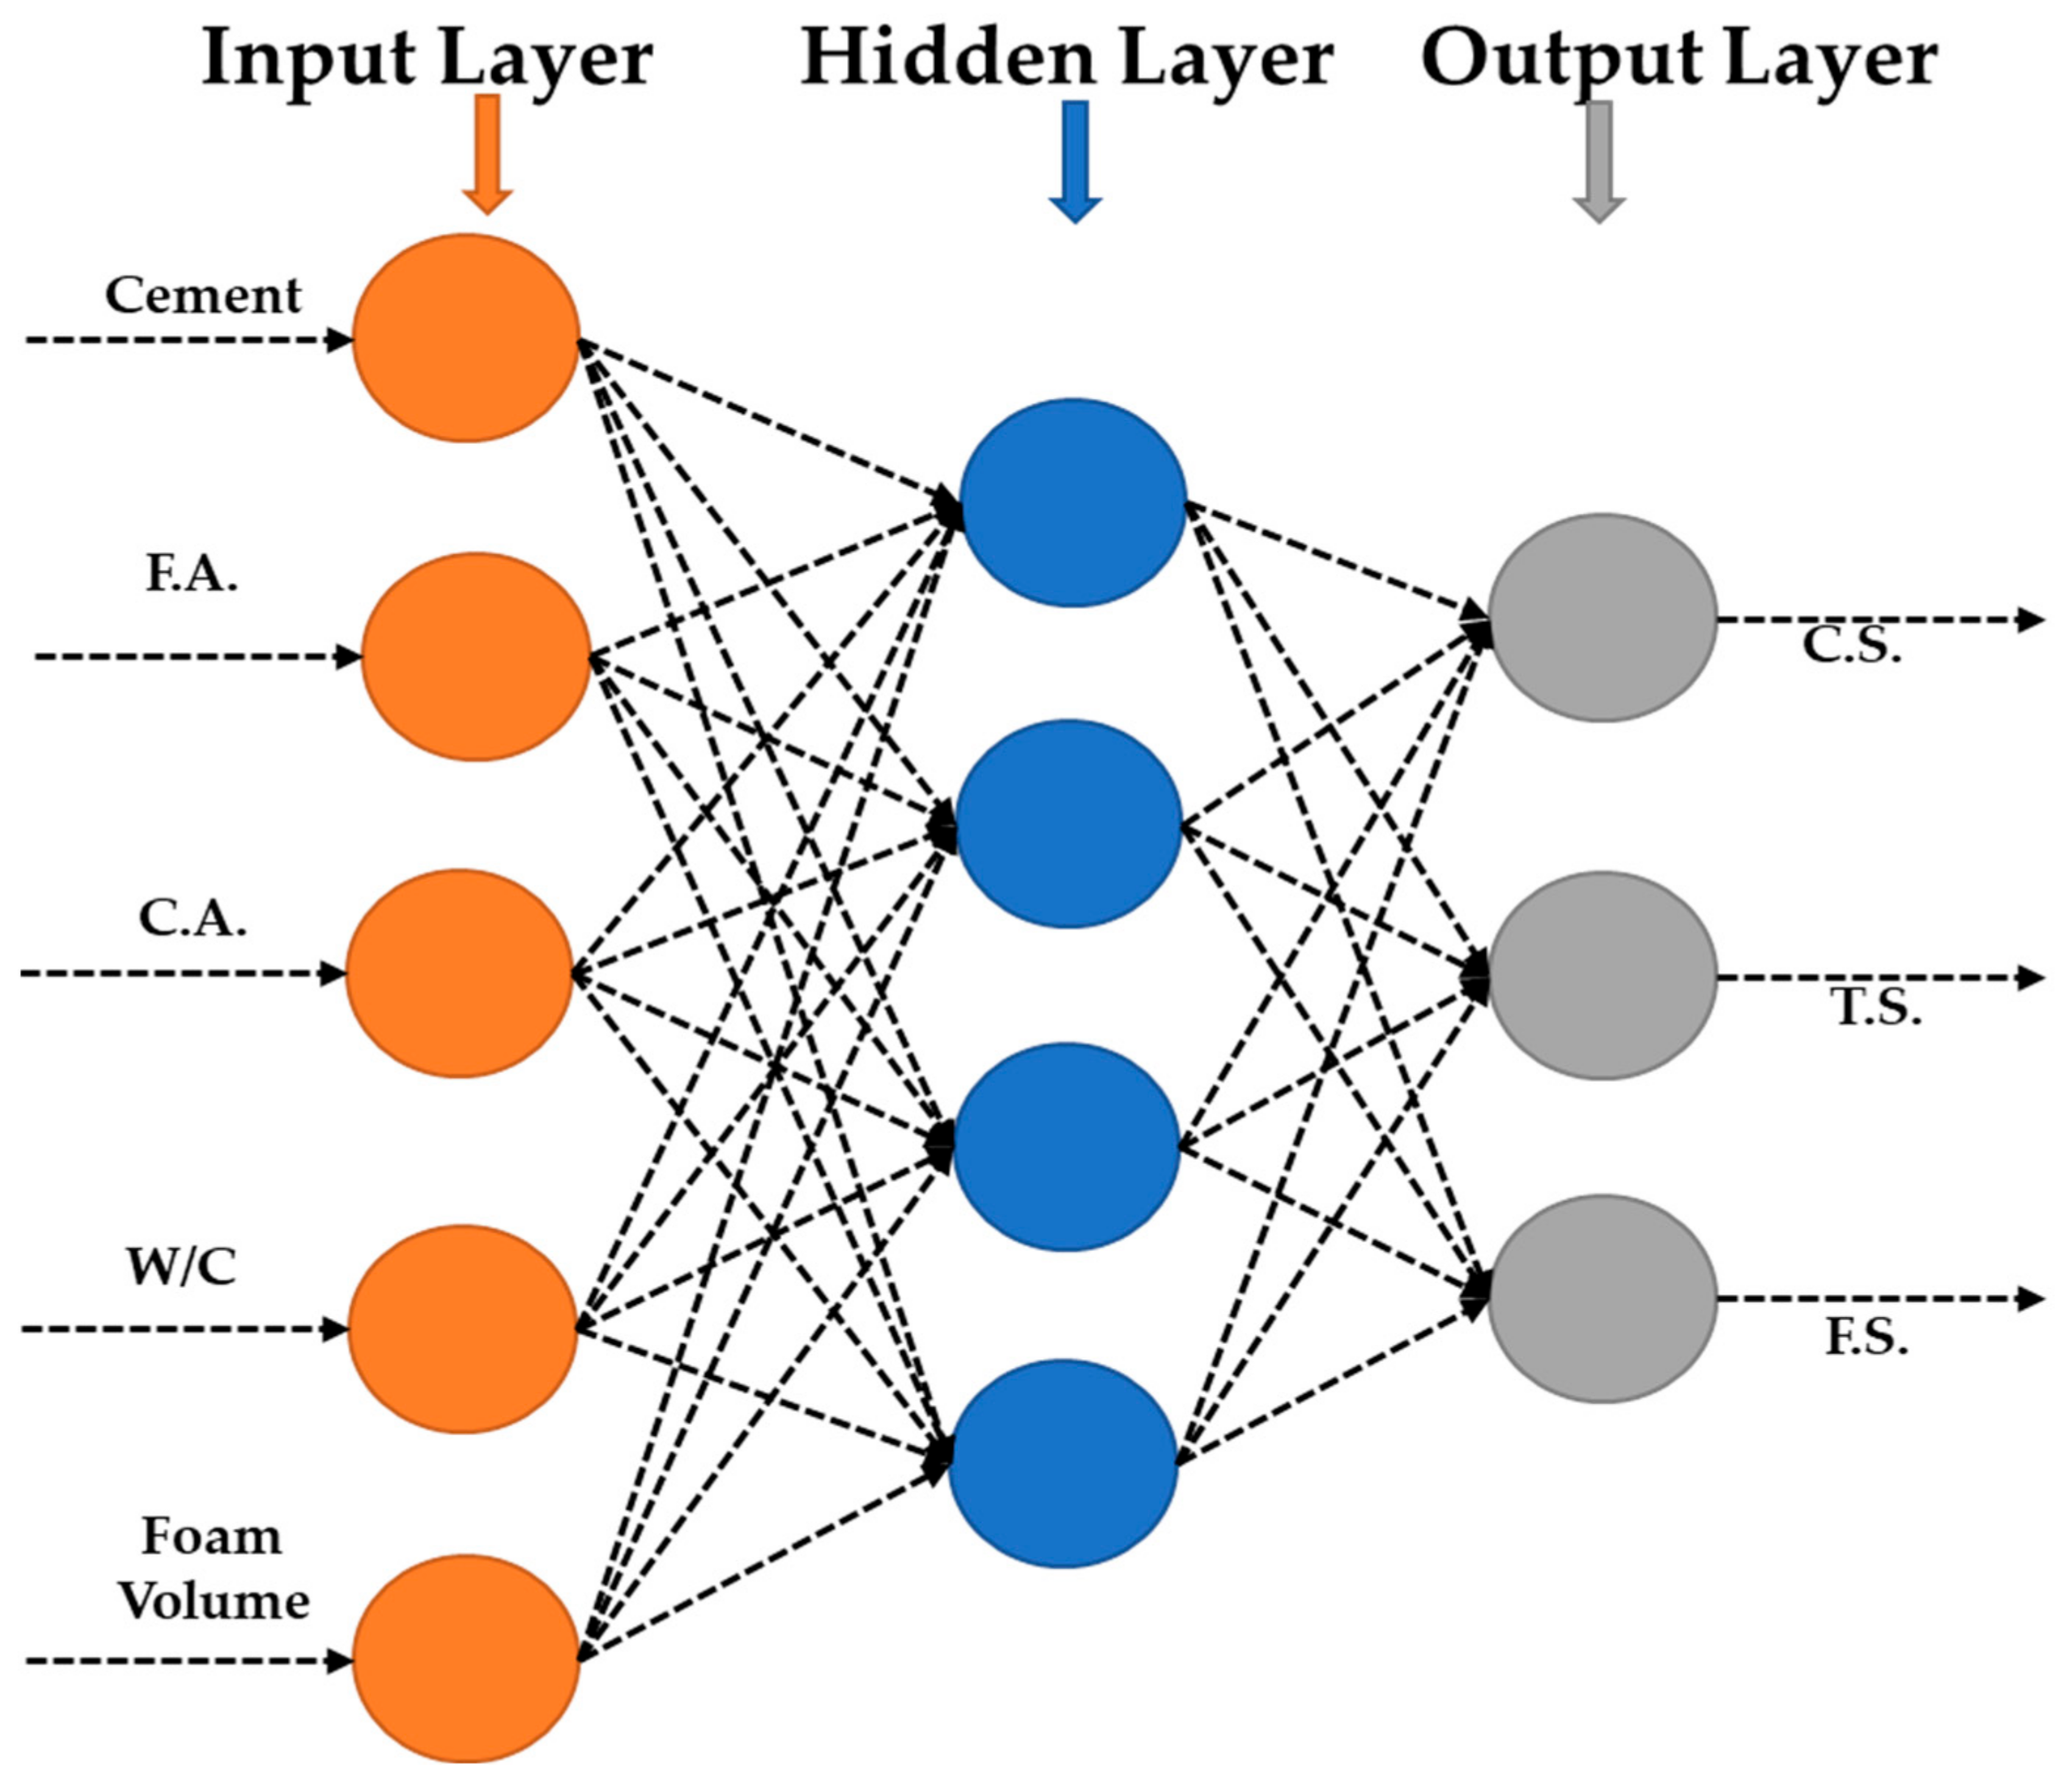
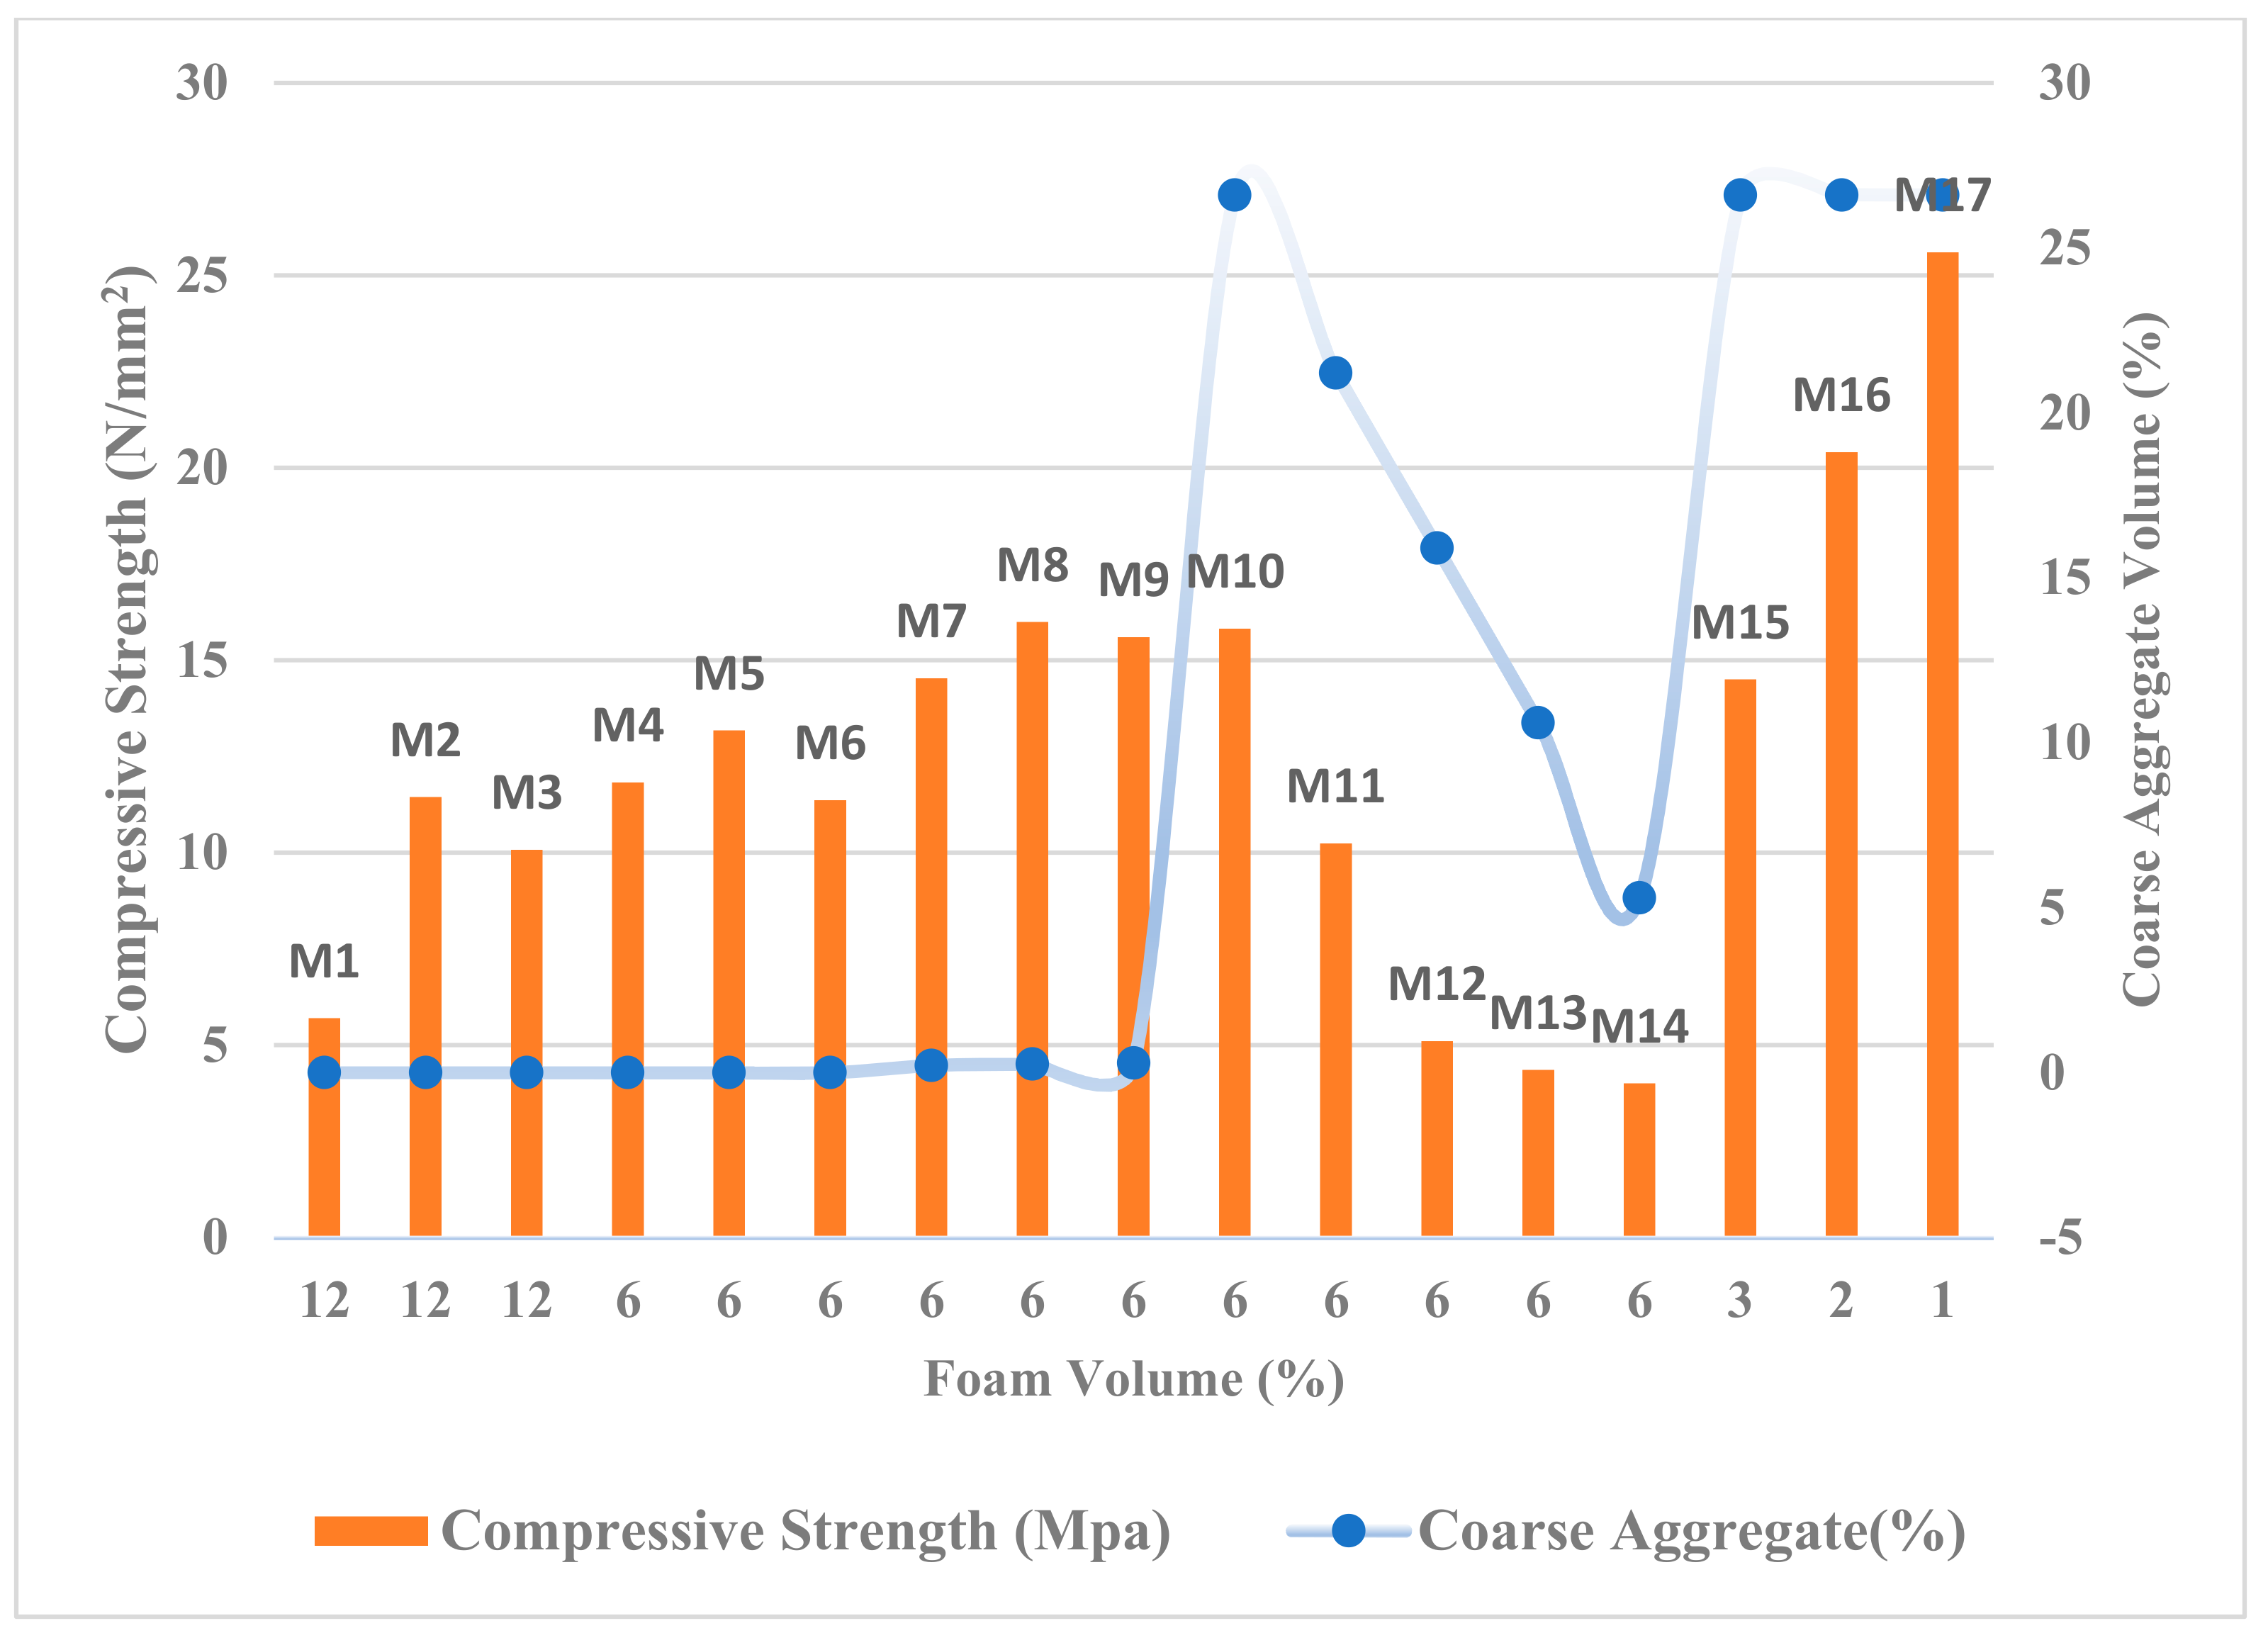
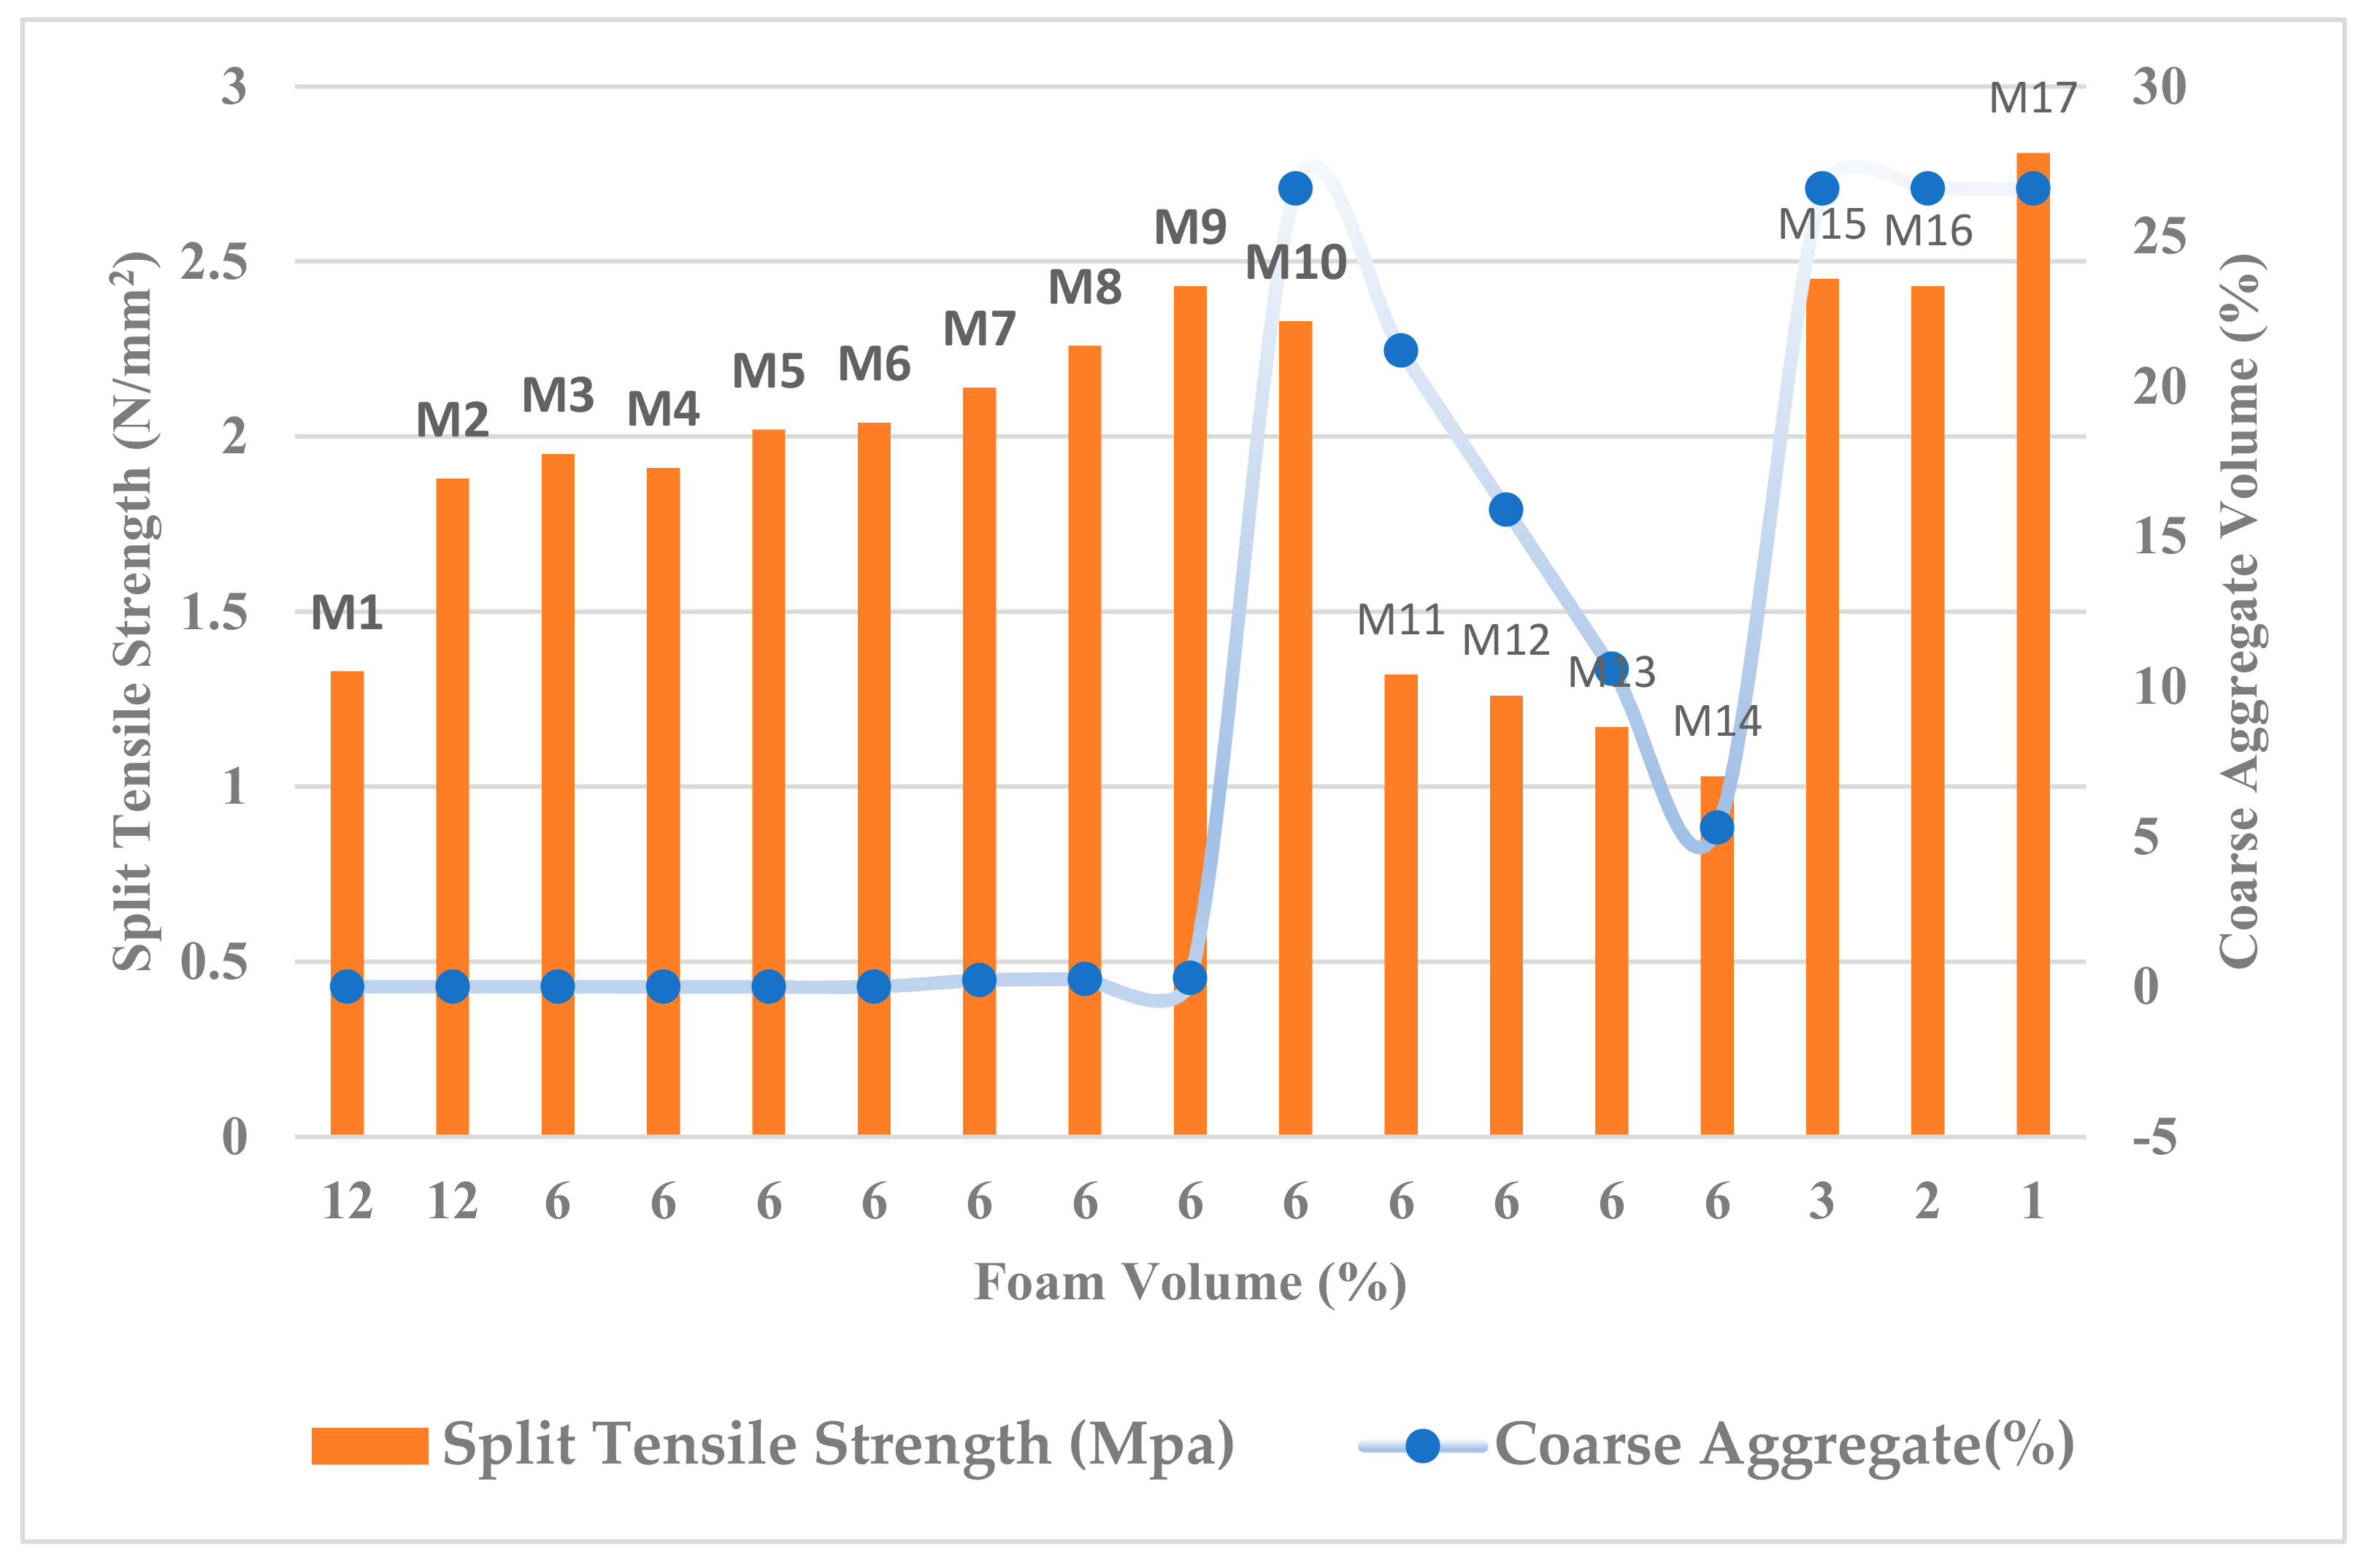
In this study, an ANN model was developed by using the data from an experimental analysis. This is used for exploratory data analysis as well as polynomial regression analysis for predicting the mechanical properties of FC. In the current model, cement, fine aggregate, coarse aggregate, the w/c ratio, and foam content were considered independent variables, while Compressive strength (CS), Split Tensile Strength (TS), and Flexural Strength (FS) were the dependent variables. The ANN model is developed for 17 different FC mixtures to predict the mechanical properties through Multiple Regression Analysis (MRA).

2. Materials and Methodology

2.1. Cement

Cement is a binding material with cohesive and adhesive qualities, enabling it to be combined with various construction elements to form compact structures. In the current study, Ordinary Portland Cement (O.P.C) 53-grade was used and investigated for its physical and chemical properties as per Indian Standards, IS 12269: 1987. The properties are shown in Table 1 and Table 2 [32].

2.2. Fine Aggregate

The low void proportions in FC can be achieved by proper gradation of fine aggregates that will also make it free from clay, silt, chloride, and other contaminants. River sand from Zone II was used as per IS 383: 2016 [33]. Table 3 shows the characteristics of the fine aggregate used in the current study.

2.3. Coarse Aggregate

Coarse aggregate is the most rigid and durable material in concrete that offers resistance to chemical reactions and possesses less porosity. The selection of coarse aggregate requires special attention regarding parameters such as crushing strength, durability, maximum size, gradation, surface texture, and the flakiness index. In accordance with IS 383: 2016, 6.3 mm gravel was used for the current study. The aggregates were analyzed based on IS 2386: 1963 [34], and the results are shown in Table 4.

2.4. Portable Water

It is commonly believed that water that is fit for human consumption can also be used successfully in concrete production. For this study, potable water that meets the requirements of IS 456: 2000 [35] was used.

2.5. Foaming Agent

From the available foaming agents, a synthetic-based foaming agent was selected for this study [36]. Synthetic-based foaming agents primarily exhibit solid air bubbles compared to protein-based foaming agents. Table 5 describes the details of the foaming agent used. The foaming solution was combined with water in a ratio of 1:20 (i.e., one part of the foaming solution is mixed with 20 parts of water) [37,38,39]. The foam produced by the foaming machine was combined with a cement slurry to produce FC. As the cement and sand particles were thoroughly mixed together, they formed a grid material that held the air bubbles and spread the stable foam throughout the mixture.

2.6. Methodology

In the current study, initially, mechanical property testing was carried out. With the results of experimental data, a test dataset was prepared, which then was used for Exploratory Data Analysis (EDA) and Polynomial Regression Analysis (PRA). Figure 1 shows the methodology of experimental data and statistical analysis.

3. Research Framework

In the current investigation, foam concrete was produced using cement, sand, water, and foam under controlled conditions. Mechanical properties such as Compressive Strength (CS), Split Tensile Strength (TS), and Flexural Strength (FS) of FC were then investigated.

3.1. Mix Design and Mix Proportion

A formula that the University of Dundee created is used to determine the design mix for FC [40]. Cement and fine aggregate quantity should be determined while generating a mix. The materials’ overall weight should be equal to the casting density to make one cubic meter of foamed concrete. The equations can be written as:
D = C + A + W
where:
  • D = Design Density of FC. (Kg/m3).
  • C = Cement (Kg/m3).
  • A = Aggregate (Kg/m3).
  • W = Water (liters).
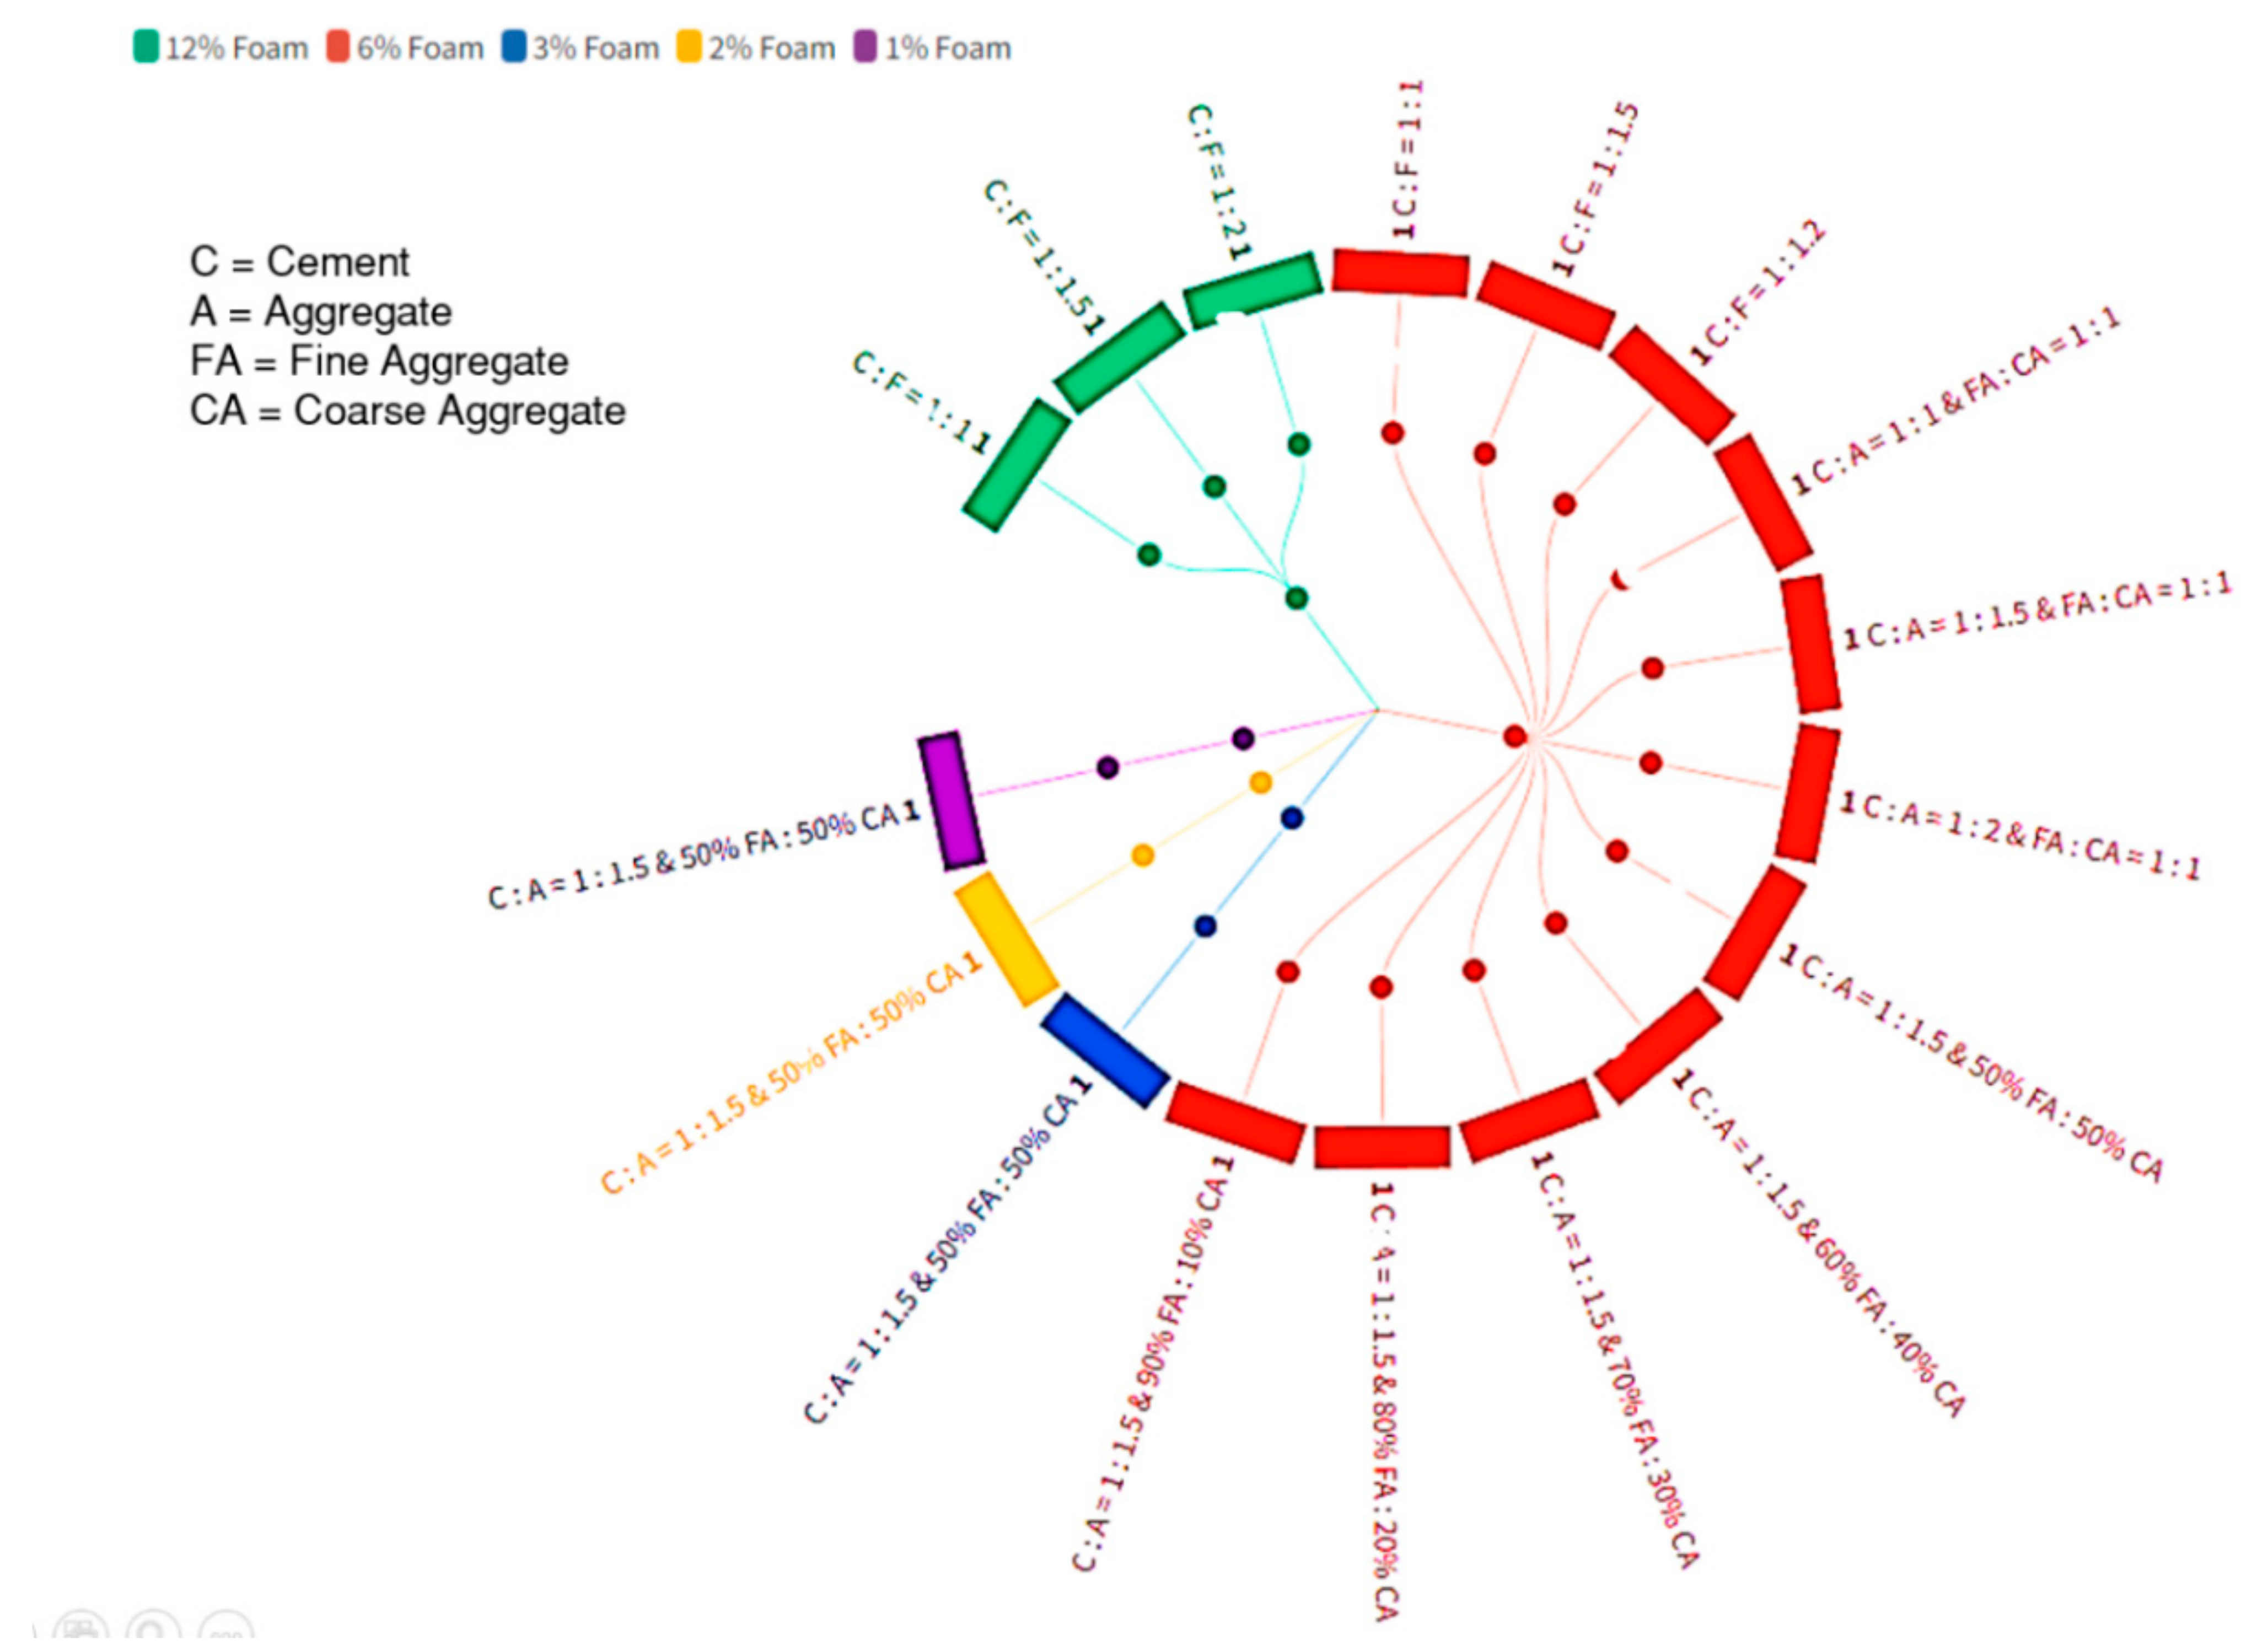
A total of 17 foam concrete mixtures were designed, cast, and tested. Details of batches are given below:
  • Batch 1 consists of three mixed proportions with 12% foam and different cement/sand (c/s) ratios.
  • Batch 2 consists of three mixed proportions with 6% foam and different c/s ratios.
  • Batch 3 consists of three mixed proportions with 6% foam, different c/s ratios, and coarse aggregate (where fine: coarse aggregate is considered 1:1).
  • Batch 4 consists of a c/s ratio of 1:1.5 (which showed optimum results in batches 1, 2, and 3), 6% foam, and coarse aggregate (where fine: coarse aggregate is taken as a percentage basis).
  • Batches 5, 6, and 7 consist of 3%, 2%, and 1% foam, respectively. A cement/sand ratio of 1:1.5 is kept constant along with coarse aggregate (where fine: coarse aggregate is taken as 50%:50%, which is the optimum percentage in the above batch).
The Cement-to-sand mix ratio is based on the mass proportions of the materials rather than on a volume basis. Table 6 shows the mixed proportions of FC. Figure 2 represents the mixture categories in the form of a radial diagram.
Radial Diagram of Mix Compositions. Figure 2 is a depiction of different mixtures used for the current study. Green indicates 12% foam with different cement-to-sand (c/s) ratios. Red indicates 6% foam with different c/s ratios and Fine aggregate to coarse aggregate ratios. Blue indicates the mix with 3% foam, 50% CA, and 50% FA. Yellow indicates the mixture with 2% foam, 50% CA, and 50% FA. Purple indicates the mix with 1% foam, 50% CA, and 50% FA.

3.2. Experimental Analysis

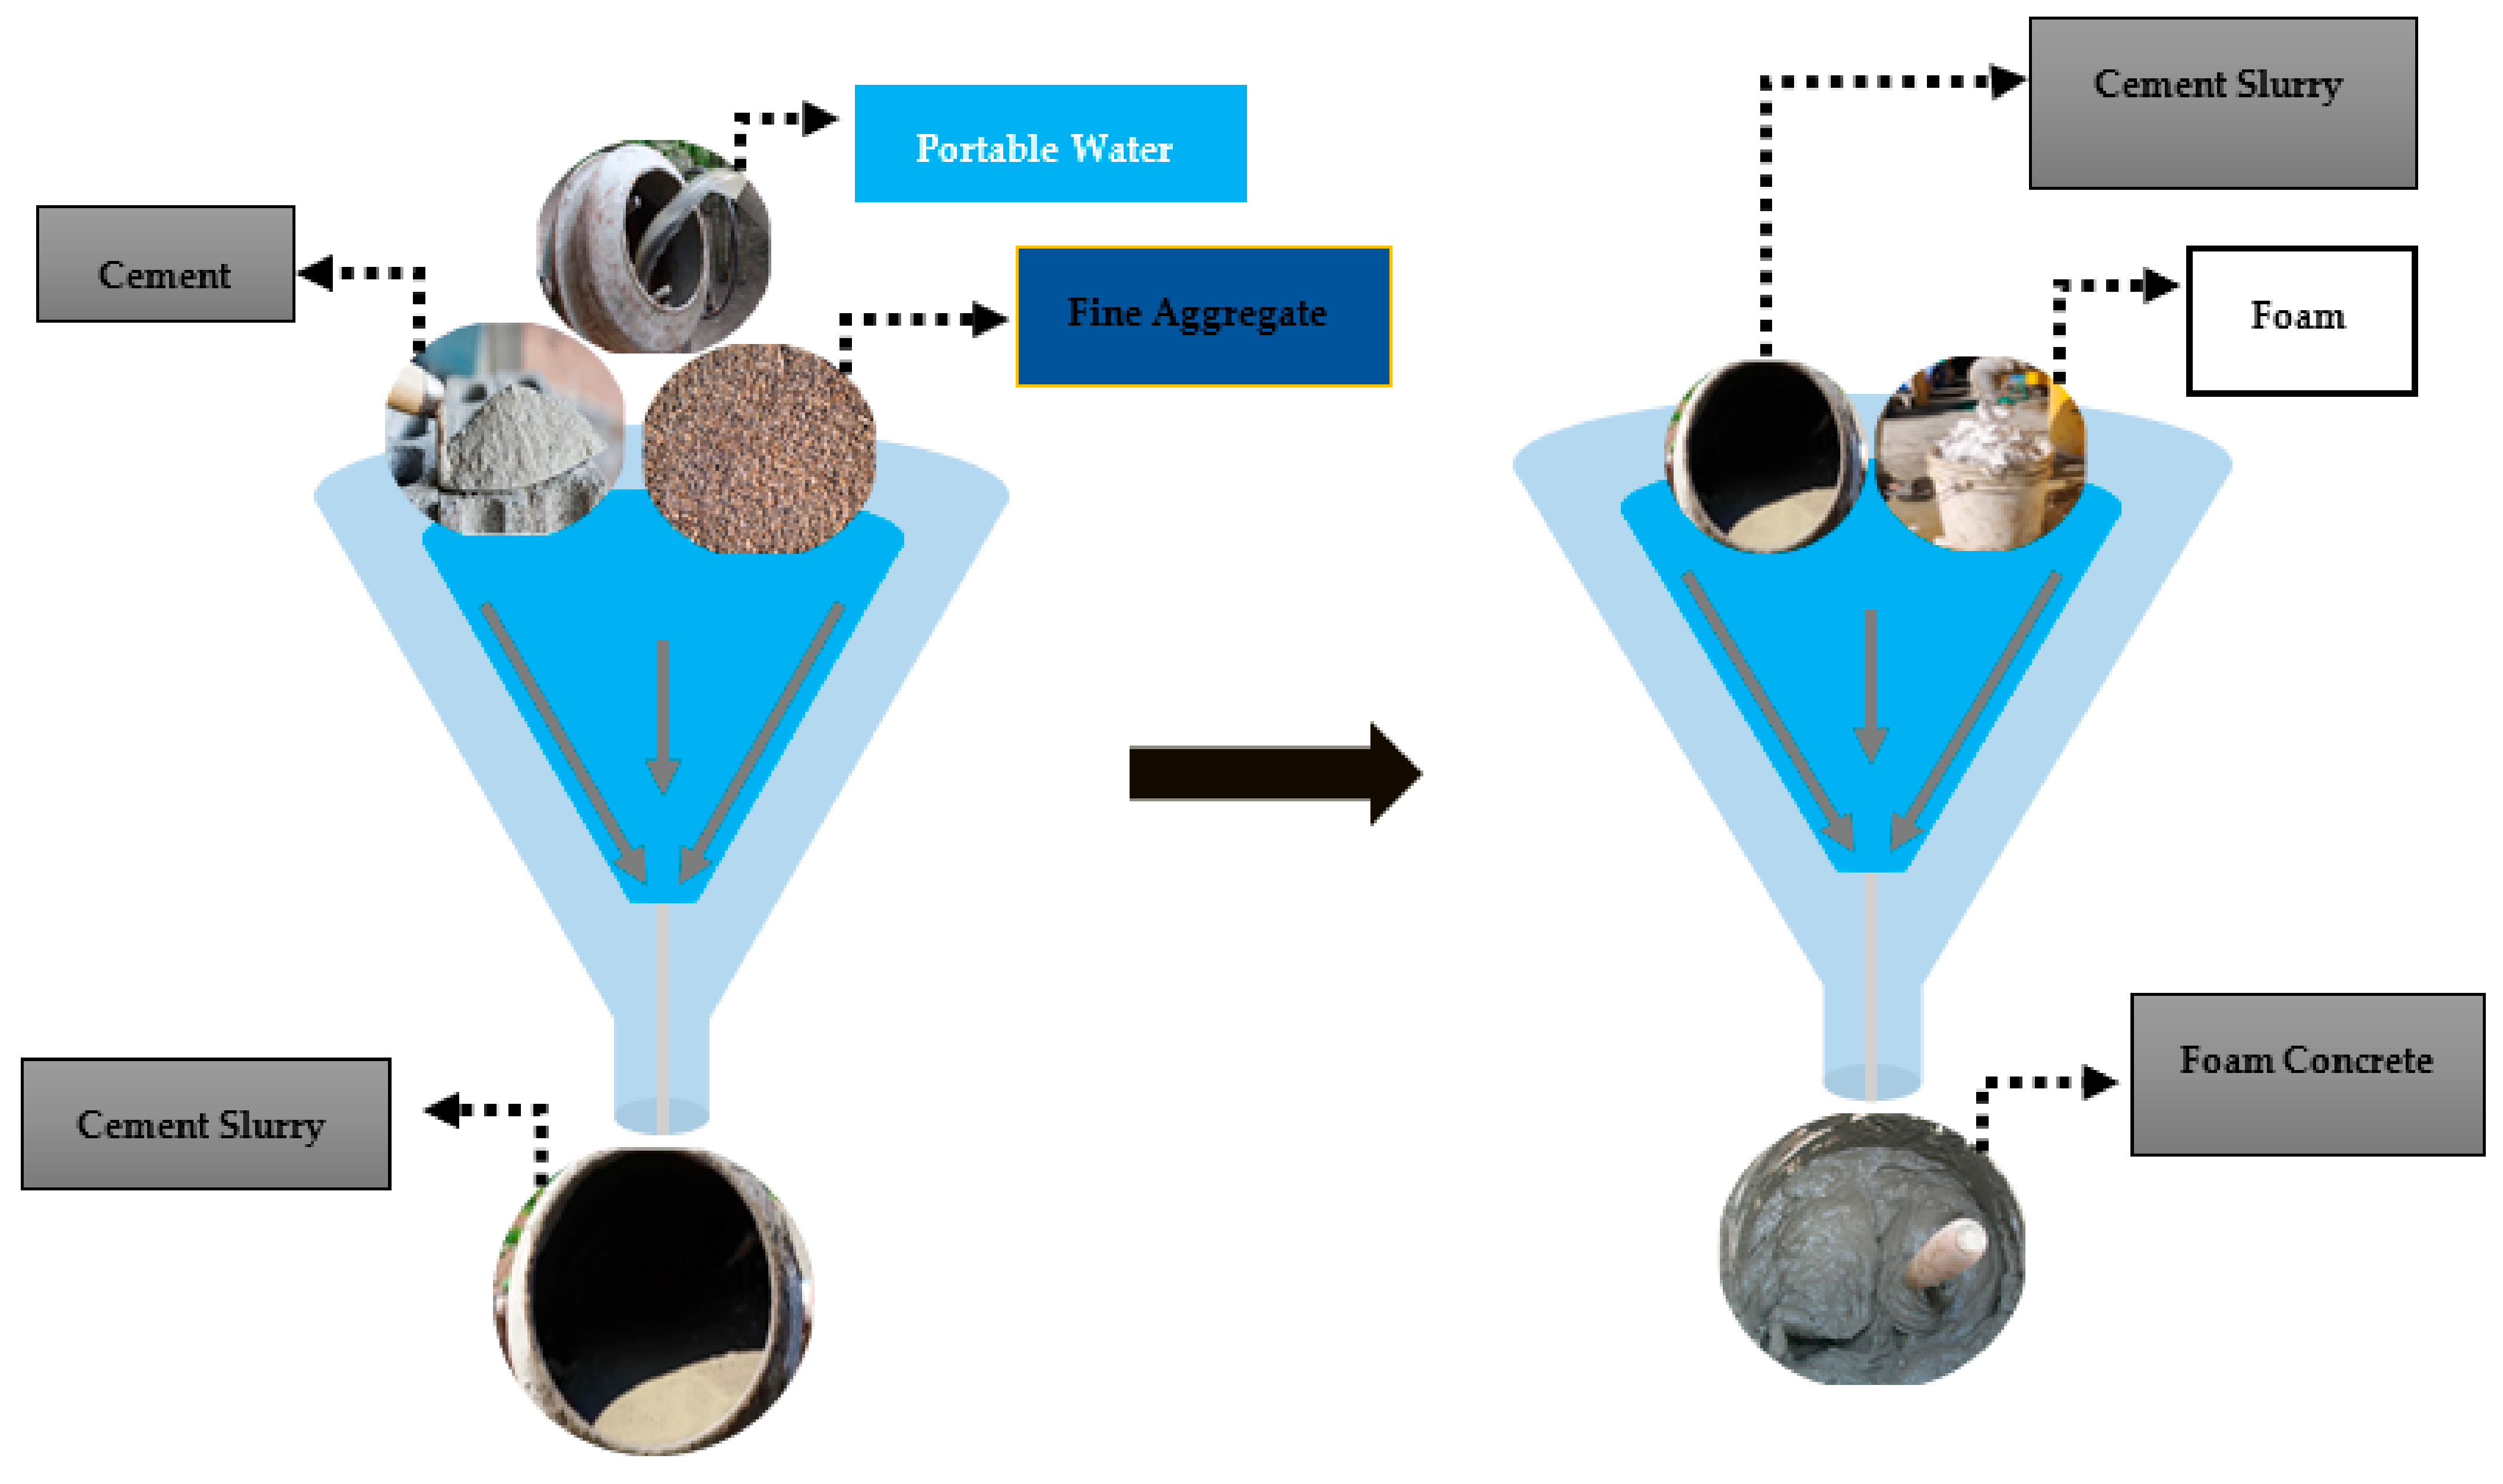
3.2.1. Preparation of FC

A concrete mixer generates FC by mixing foam and cement slurry. The pre-foaming method is adopted to create FC as per IS 2185: 2008 (part 4) [36]. Into the homogeneous mixture of cement slurry made up of Portland cement and fine aggregate, the prefabricated foam will then be poured, and this process of mixing continues until the bubbles have been dispersed uniformly [41]. The FC mixture’s wet density should range within ±100 kg/m3. The preparation of FC and the foam generation process are shown in Figure 3 [42].
Three major problems and their causes were encountered during the preparation of FC:
  • Formation of cement balls due to change of mixing time and low water content in the mixture, thus impairing its homogeneity.
  • Requirement of additional water due to a change in mix proportion than the quantity determined to produce the mixture.
  • Variation in mixture density from the predetermined density was identified either due to a change in temperature or density of foam added or coarse aggregate.
To mitigate the problems mentioned above, the following precautions can be maintained:
  • Duration of mixing is to be set between 1.5 min and 3 min to prevent the coagulation of the dry materials.
  • Adjustment of water–cement ratio based on the flow table test results.
  • Addition of chemical admixture (1% of airen) helps to maintain the density of the mixture.

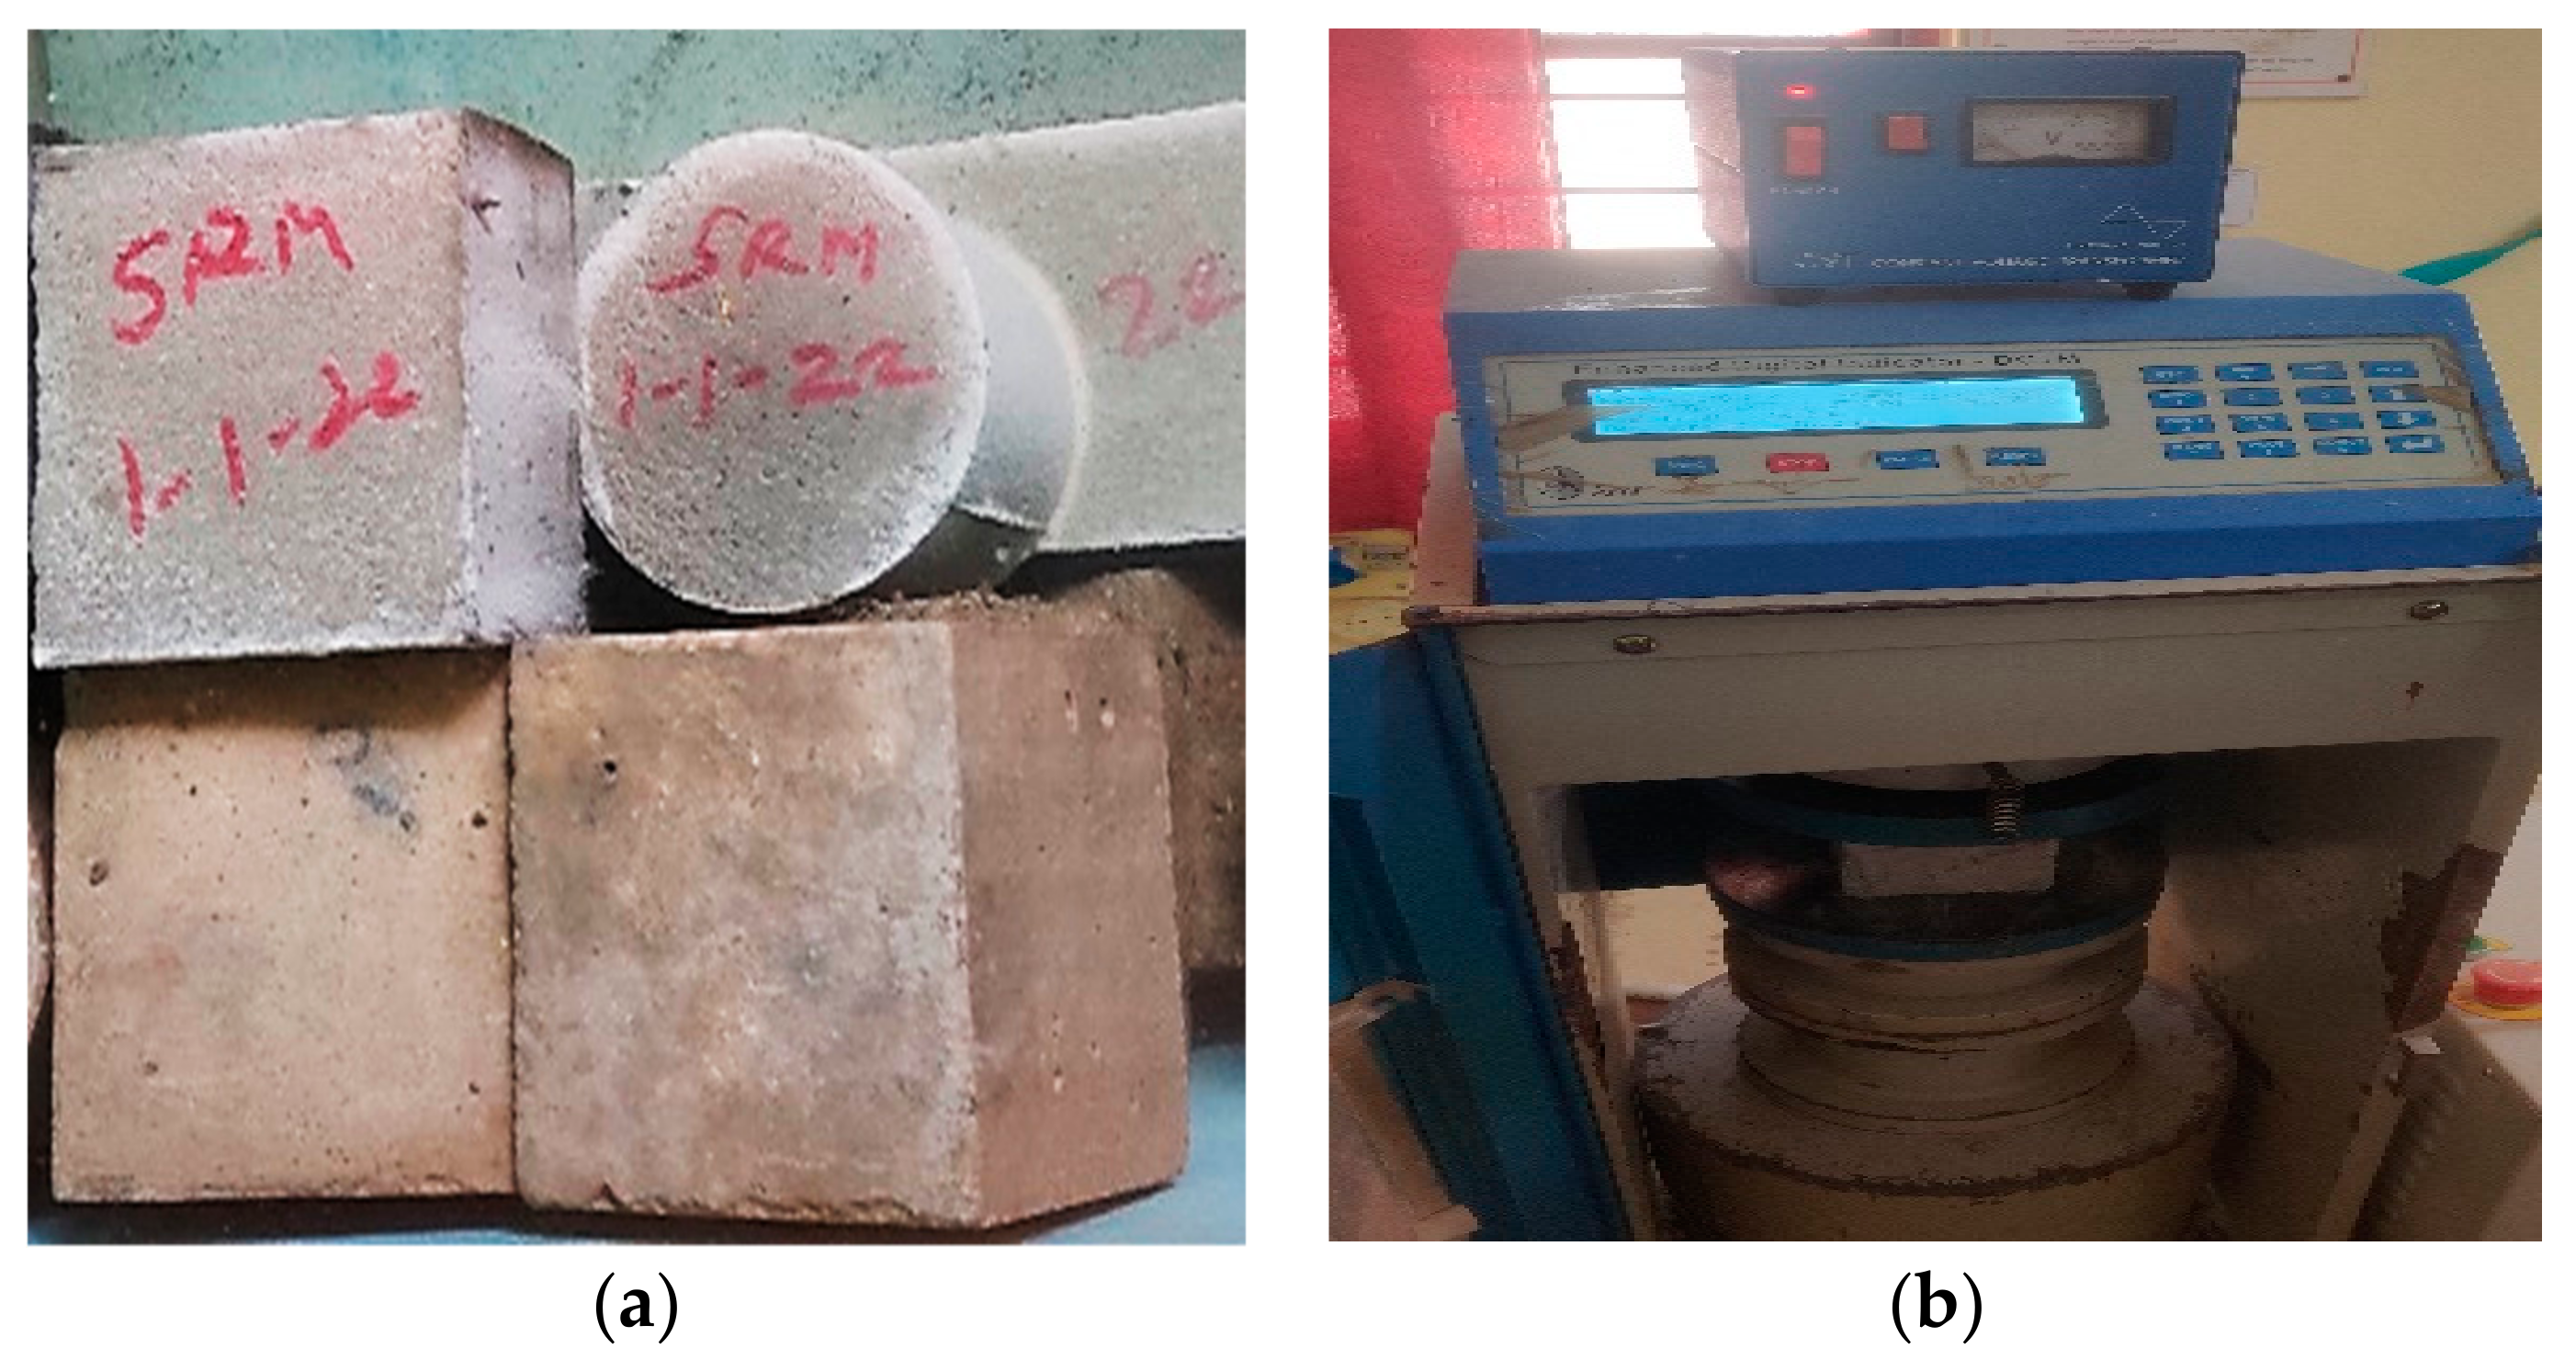
3.2.2. Experimental Investigation

Mechanical characteristics of the FC were analyzed and characterized, as mentioned above in Table 6. Mechanical parameters were tested for several mixes before confirming the best possible mixture. For the compressive strength test, a cube specimen of 100 × 100 × 100 mm was used. A crushing load was applied steadily on the specimen during testing. The rate of loading applied on the specimen was 2.29 kN/s. The specimens were tested every 3, 7, and 28 days. Cubes were kept in the oven drying for ±24 h to achieve a dryer density. The weight of each specimen was recorded for detailed data analysis. A compressive test was performed as per (IS 516: 1959) [43]. For the split tensile strength, a specimen of size 100 × 200 mm was used for the study as per ASTM C 496 [
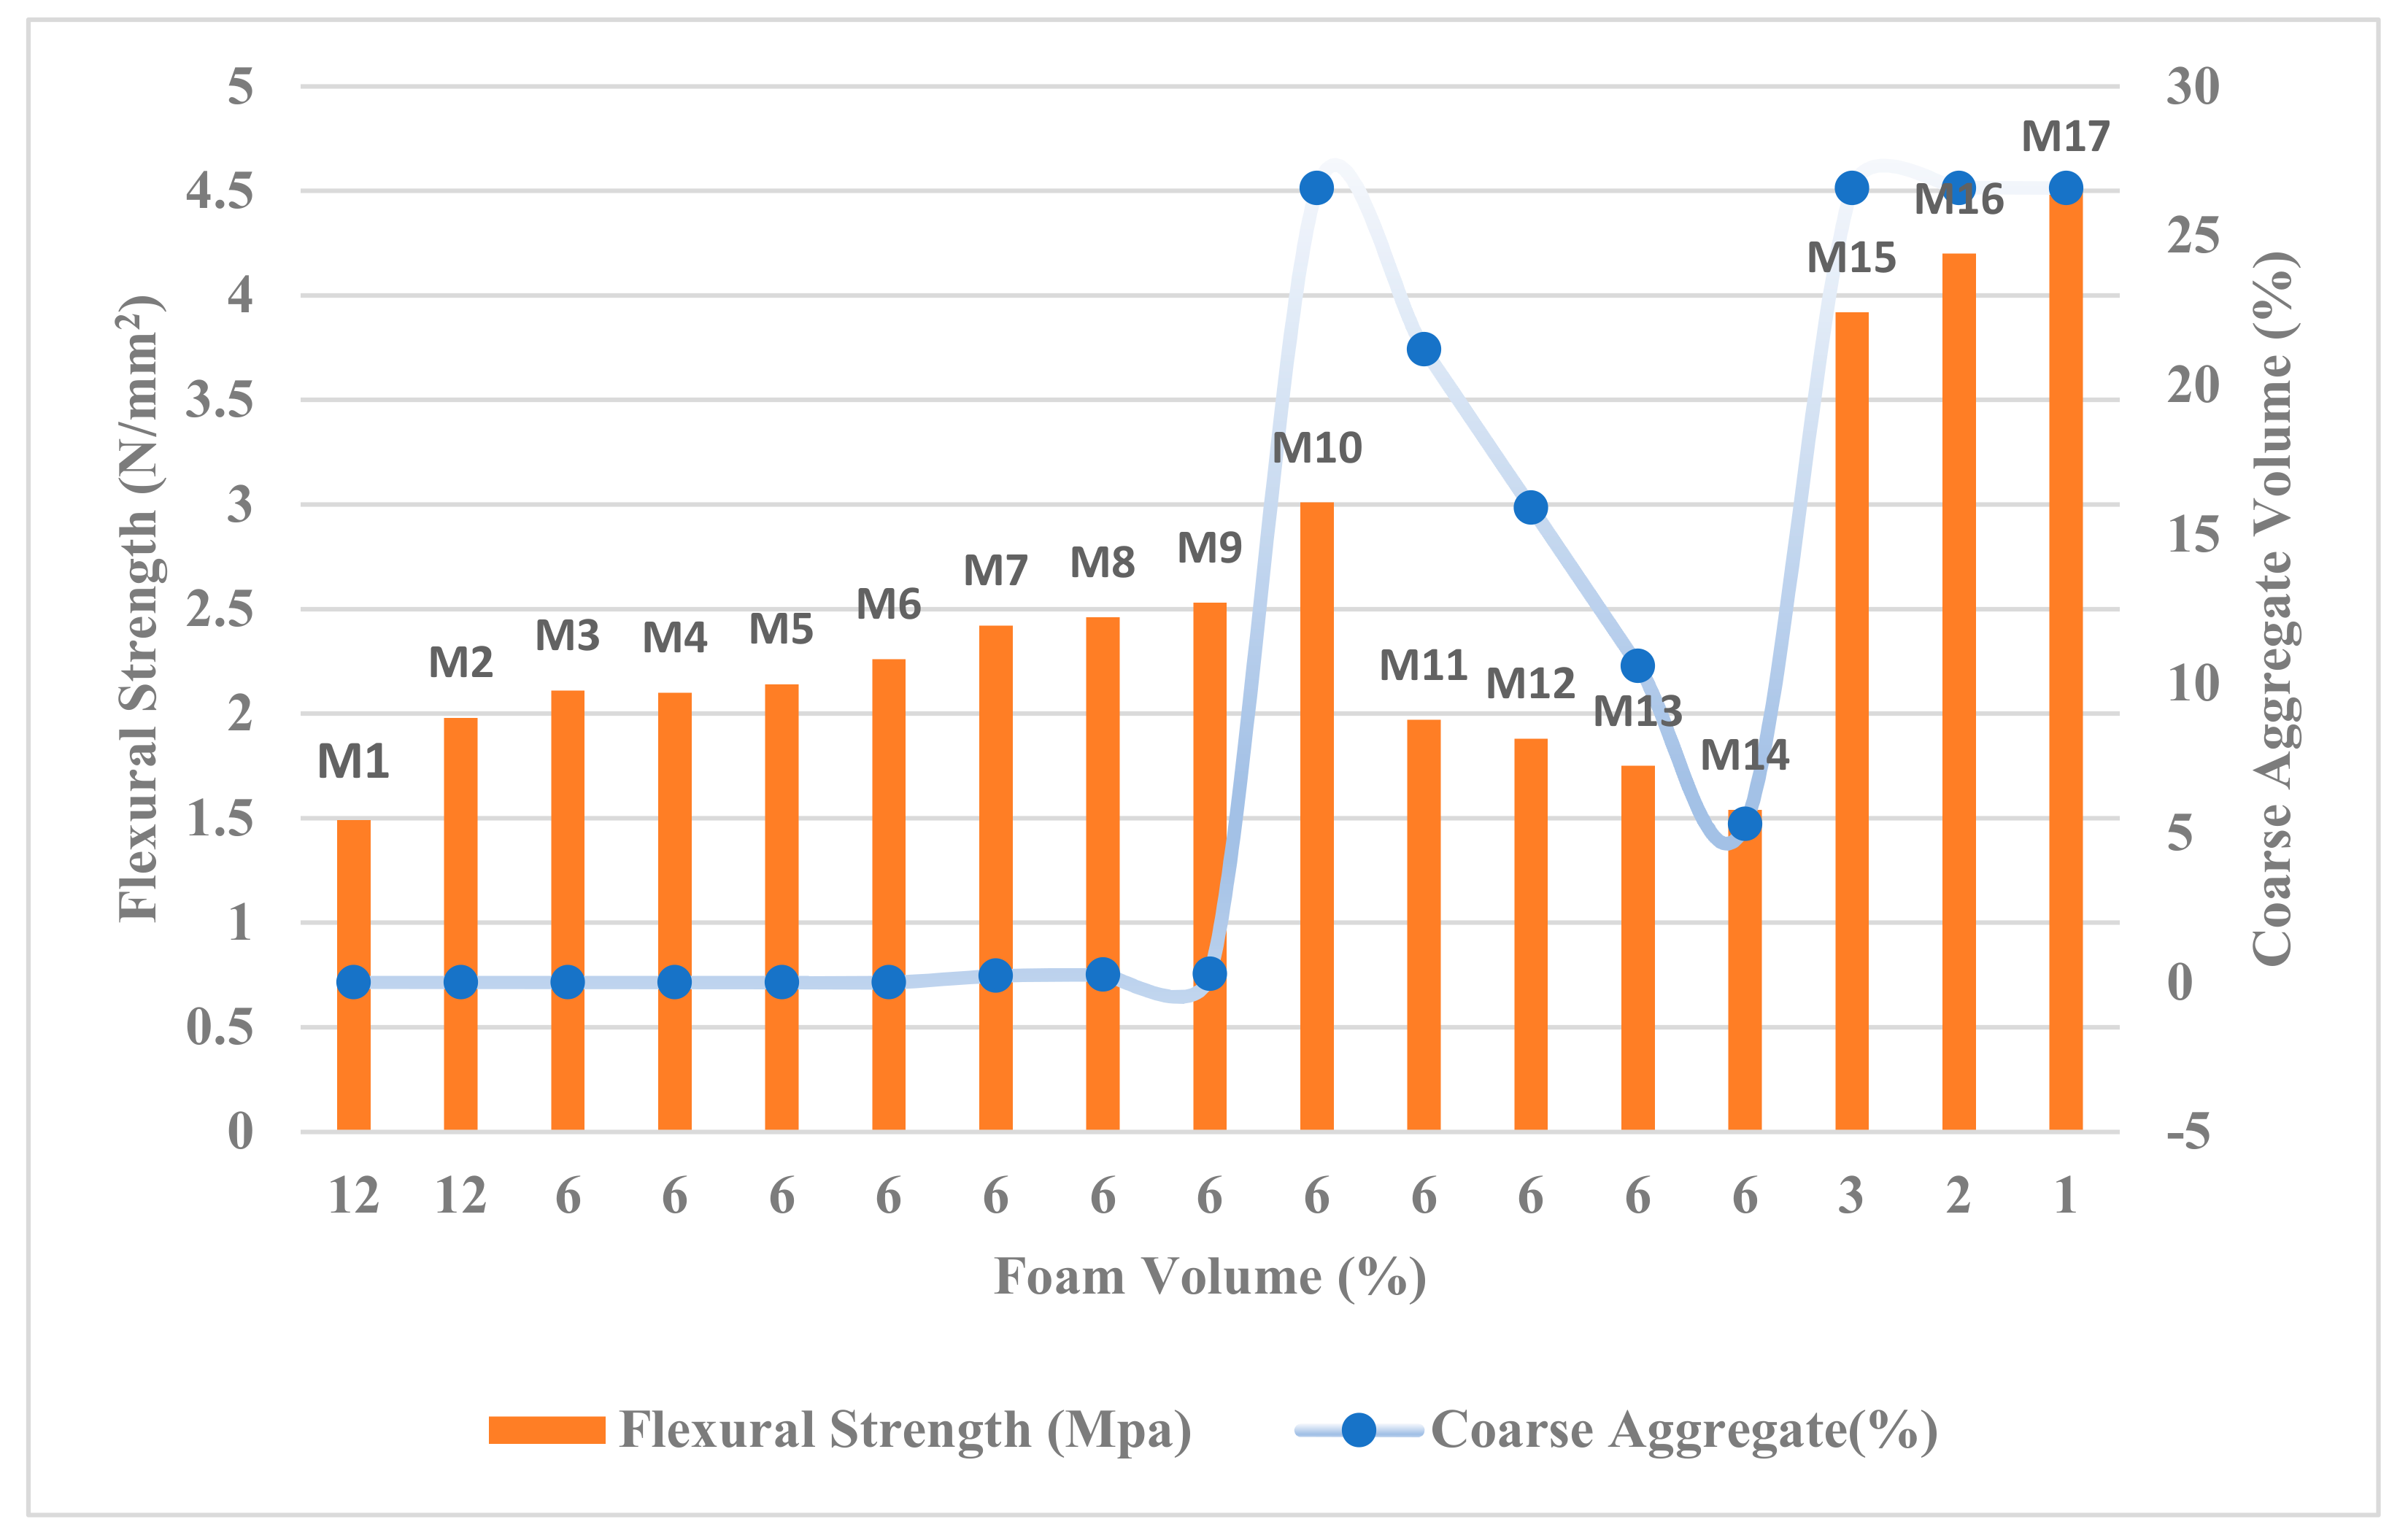
44]. The specimen was placed horizontally within the loading plate and a packing strip was placed on the top and bottom of the specimen for uniform stress distribution. The sample was tested for splitting tensile strength at a loading rate of 0.70 kN/s, and the load was gradually applied until the splitting of the specimen occurred. The flexural strength of FC for 17 mix ratios was studied using a four-point loading test ASTM C 78–84 [45]. A specimen of size 100 × 100 × 500 mm was cast and tested for this study. The specimen was placed in the test setup where the load was applied gradually at a rate of 29.43 kN/mm2 until fracture occurred, and the failure load and fracture point were recorded. Samples of FC and the test setup are shown in Figure 4.

3.3. Statistical Analysis

3.3.1. Artificial Neural Network (ANN)

An Artificial Neural Network, also known as an ANN, simulates how the human brain interprets and processes information. It gathers samples based on prior observations to categorize, model, identify, and predict probable problems. The typical ANN has three layers [46], as represented in Figure 5. Information is taken from the surrounding environment by neurons located in the input layer, which then passes it along to neurons located in the hidden layer. After that, the neurons in the hidden layers will process the information they have received, isolate the key features, and then use those to re-create the mapping between the input and output domains. At long last, the network’s predictions will be communicated to the outside world by the neurons that make up the output layer [47].

3.3.2. Exploratory Data Analysis

Exploratory Data Analysis (EDA) is used to analyze the given data through visual practice. With the use of statistical summaries and a graphical representation, it is used to identify trend lines and patterns or verify presumptions. Compared to other statistical analyses, EDA does not require any model for observations. The data considered are the batch or list of numbers. The study’s major purpose is to look at the facts from a different point of view and generate an informal conclusion [48].
In general, several tools are available for EDA, some of which are the median, a box plot, re-expression, median polish, residuals, the running median, etc. In the current study, the median is used as a tool for EDA. It uses a small number of parameters to describe a sample’s characteristics. They are typically regarded in the form of estimations of the pertinent demographic variables that comprise the sample. These characteristics can express the spread of the data (variance, standard deviation, interquartile range, maximum value, and minimum value), as well as the central tendency (arithmetic mean, median, and mode) and some distributional characteristics (skewness, kurtosis) [48].

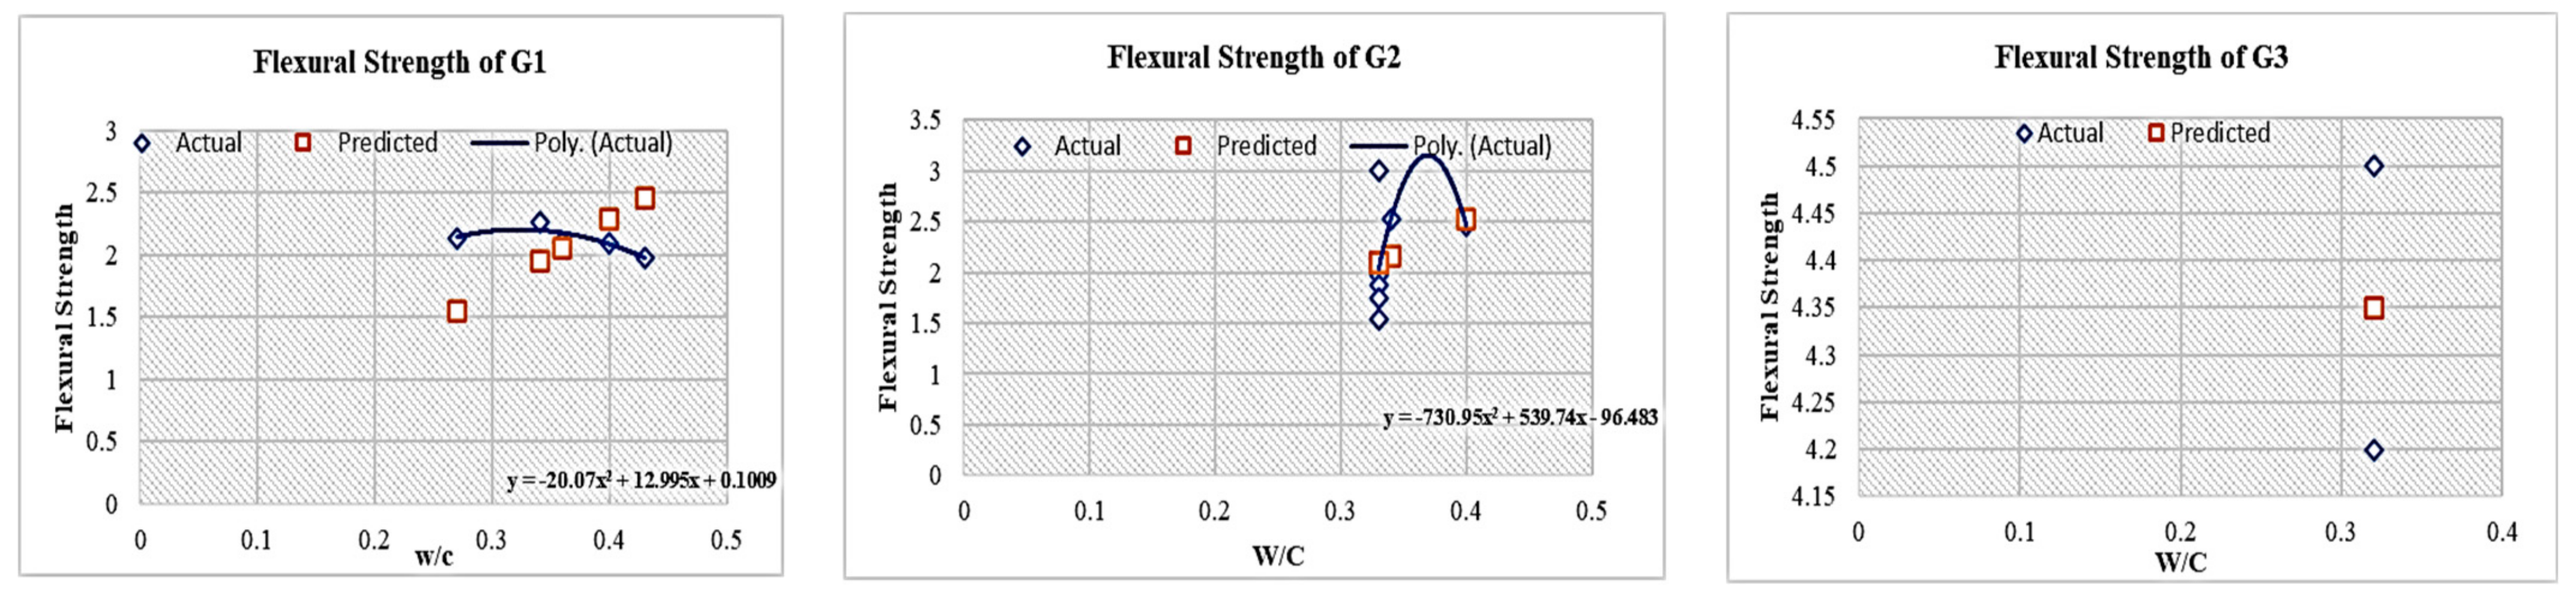
3.3.3. Polynomial Regression Analysis

Because of the flexible structure in polynomial regression analysis (PRA), it is suitable for data fitting. Through PRA, many complex curve forms can be generated by adding higher-order terms and modifying the signs and magnitudes of the coefficients. A polynomial regression analysis has the following structure [49].
Y = a ^ 0 + a ^ 1 x 1 + a ^ 2 x 2 +         + a ^ n x n + e
where a ^ 1 , a ^ 2 …, and a ^ n are the polynomial regression coefficients, x denotes the input variable, y represents the output variable, and a ^ 0 denotes the intercept. PRA refers to the addition of multiple variables to polynomial regression. PRA for a system with ‘n’ input variables is represented by the following formula [49].
y = a ^ 0 + l 1 = 1 n a ^ l 1 x l 1 + l 1 = 1 n l 2 = l 1 n a ^ l 1 l 2 x l 1 l 2 +   l 1 = 1 n l 2 = l 1 n . l k = l k 1 n a ^ l 1 l 2 l k x l 1 l 2 . l k
Even though PRA adapts a non-linear model for the data, the multivariate function (Equation (4)) is linear, with respect to its coefficients. The sum of squared errors between the expected and actual outcome determines the polynomial regression coefficients.
The metrics used to quantify the errors that occur during the training and testing of the ANN model include the Root Mean Squared Error (RMSE), Mean Square Error (MSE), Mean Absolute Error (MAE), and coefficient of determination (R2). The equations for calculating the errors are presented below [47,49]:
RMSE = 1 n i = 1 n a i p i 2
MSE = 1 n i = 1 n a i p i 2
MAE = 1 n i = 1 n p i a i
R 2 = i = 1 n ( a 1 a i   avg ) 2 i = 1 n ( a 1 p i   ) 2 i = 1 n ( a 1 a i   avg ) 2
Note: ai = Actual Value, ai avg = Average of Actual Value, pi = Predicted Value, and n = Sample Size.
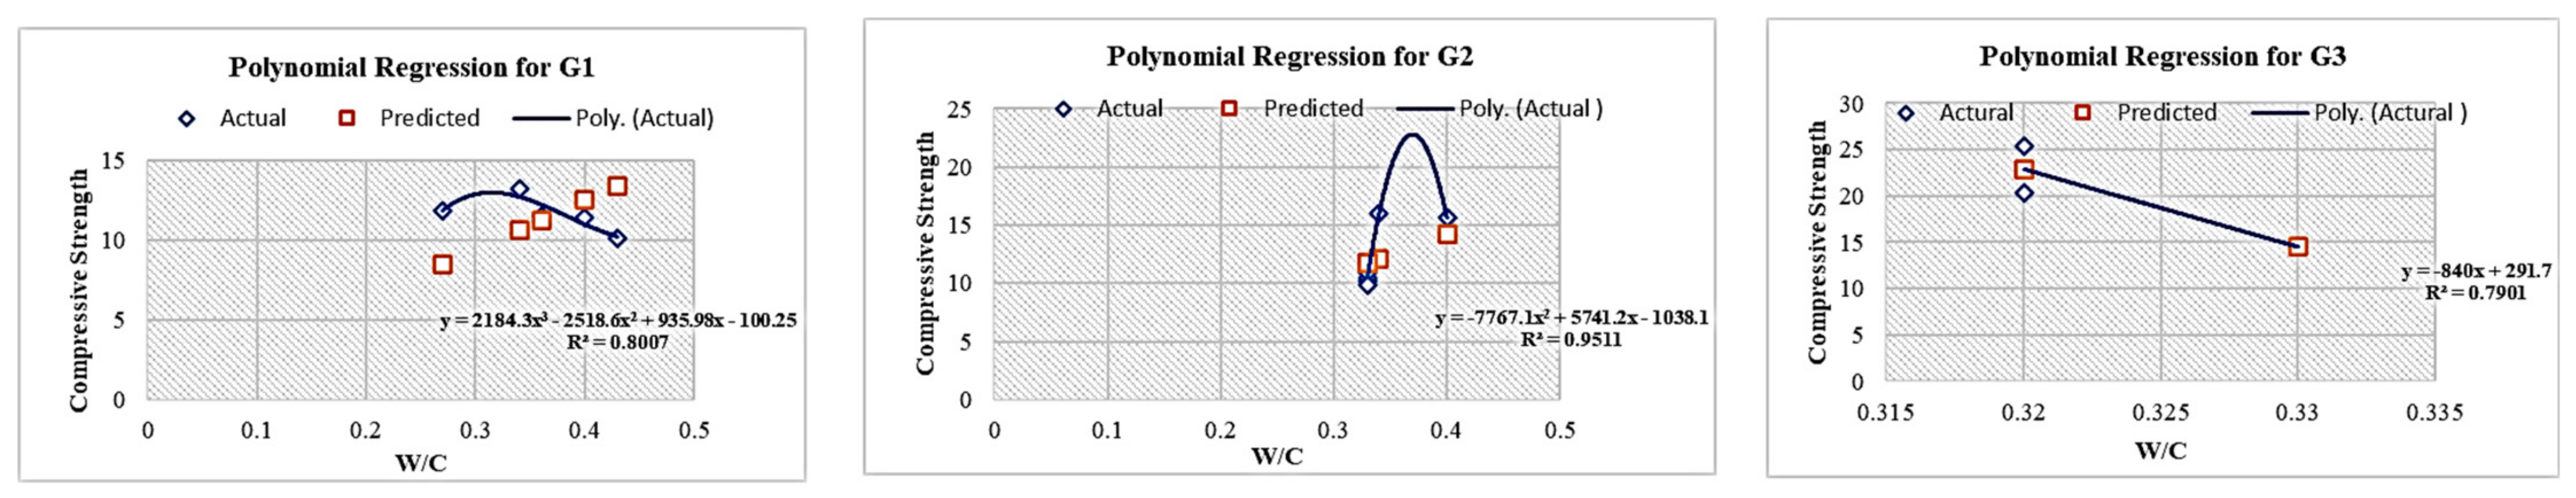
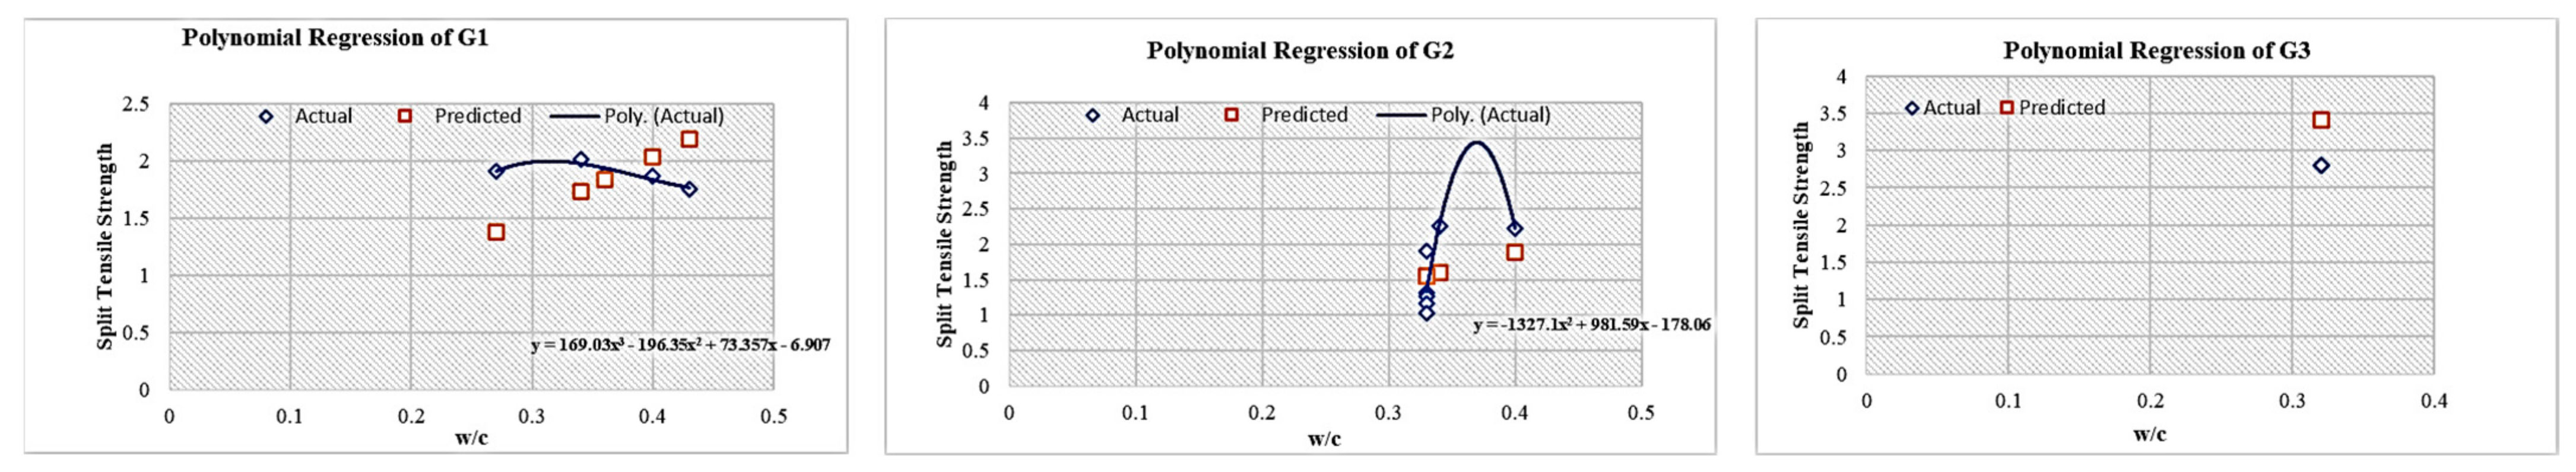
Polynomial Regression Analysis (PRA) for the given set of seven batches of mixes is performed in three groups. Batches I and II are considered the Group I category, batches III and IV are considered the Group II category, and batches V, VI, and VII are considered the Group III category.

4. Results and Discussion

4.1. Influence of Water-to-Cement (w/c) Ratio on Design Density

Consistency of the FC mix can be achieved with the proper dosage of the w/c ratio. Variation of the density ratio to the w/c is shown in Figure 6. From the graph, it is observed that most of the mixes achieved a density ratio of unit one. Additionally, it has been found that the density ratio is inversely proportional to foam volume and directly proportional to the w/c ratio.

4.2. Flow Behaviour

Using a typical flow cone, we can quantify the flow rate and hence learn about the flow characteristics of different mixtures [7]. The change in flow behavior of mixes with various w/c ratios and foam volumes has been examined. Figure 7 shows the relationship between the flow value of FC mixes with varying foam volumes and w/c ratios. From the graph, it is observed that the mix with 1% foam volume and 0.32% w/c has a lower flow value of 98.4%. The mix with 12% foam volume has a higher flow value of 140%, which is primarily due to the reduction of stiffness in FC with the increase in foam volume. A mix with a lower w/c ratio and low foam volume is generally found to have a low flow value and vice versa.

4.3. EDA. Results of Experimental Work

EDA was carried out for a total of 17 mix ratios to validate the experimental results of CS, TS, and FS. Table 7 shows the EDA of the material. The distribution of data is found to be positively skewed, as 50% of median values are less than the mean value. This distribution is primarily due to the addition of coarse aggregate and foam volume in the FC mixes. Additionally, it is noted that the coarse aggregate’s mean, median, and standard deviation are lower than that of the fine aggregate. This could be due to the fact that coarse aggregate is used in B3 to B7, whereas fine aggregate is used in B1–B7.
A correlation matrix was drawn between the parameters of the given dataset, and the results are shown in Figure 8. According to the results from the dataset, CS, TS, and FS were highly correlated with coarse aggregate (i.e., 0.76, 0.73, and 0.72, respectively). Moreover, a correlation has been observed between the cement to foam volume (i.e., 0.25), Fine Aggregate (FA) to foam volume (i.e., 0.33), and FA to w/c ratio (i.e., 0.41). Therefore, it can be said that the CS, TS, and FS are highly influenced by the addition of foam and coarse aggregate.

4.4. Statistical Analysis and Experimental Results of Compressive Strength of FC

Figure 9 represents the relation between CS, CA, and the w/c ratio. The highest compressive strength for varying batches B1, B2, B3, B4, B5, B6, and B7 were found to be 11.45 N/mm2 (M2), 13.18 N/mm2 (M5), 15.99 N/mm2 (M8), 15.82 N/mm2 (M10), 14.5 N/mm2 (M15), 20.4 N/mm2 (M16), and 25.6 N/mm2 (M17), respectively. Rendering to the findings, an increase in CS of FC was found with the addition of coarse aggregate. From the results, it has been observed that the CS of FC is higher for mixes with low foam volume.
The relationship between the 28-day CS, foam volume, and coarse aggregate is obtained based on the experimental results, where a non-linear curve has been observed in the results. Therefore, a polynomial regression analysis is performed between CS and the w/c ratio, and the results regarding the analysis are displayed in Figure 10 and Table 8. A good correlation is observed, with coefficient of determination (R2) values of 0.98, 0.95, and 0.79 for G1, G2, and G3, respectively. The polynomial regression analysis was carried out by an ANN, which resulted in a stronger correlation with the experimental data, simultaneously producing the lowest errors in terms of its ability to forecast the CS of FC.

4.5. Statistical Analysis and Experimental Results of Split Tensile Strength of FC

The tensile strength (TS) of FC was measured at 3, 7, and 28 days using different c/s ratios and was compared with statistical analysis using the ANN. The experimental results are depicted in Figure 11. The findings show that the highest TS was determined to be 1.95 N/mm2 (M3) for B1, 2.04 N/mm2 (M5) for B2, 2.43 N/mm2 (M9) for B3, 2.33 N/mm2 (M10) for B4, 2.45 N/mm2 (M15) for B5, 2.43 N/mm2 (M16) for B6, and 2.81 N/mm2 (M17) for B7. According to the results, the TS of FC increased with the addition of coarse aggregate [50,51]. It is also observed that the CS of FC is higher for mixes with a low foam volume.
Based on the experimental observations, the relationship between the 28-day TS, foam volume, and coarse aggregate is found to be non-linear. Therefore, a polynomial regression analysis between the CS and the w/c ratio was conducted, and the results of the analysis are shown in Figure 12 and Table 9. A strong correlation has been found, with coefficient of determination R2 values for G1, G2, and G3 of 0.96, 0.93, and 0.99, respectively.

4.6. Statistical Analysis and Experimental Results of Flexural Strength of FC

The Flexural Strength (FS) of FC was measured at 3, 7, and 28 days using different c/s ratios and was compared with statistical analysis using ANN. Figure 13 presents the outcomes of the experimental analysis. The findings show that the maximum FS values were determined to be 2.11 N/mm2 (M3) for B1, 2.26 N/mm2 (M5) for B2, 2.53 N/mm2 (M9) for B3, 3.01 N/mm2 (M10) for B4, 3.92 N/mm2 (M15) for B5, 4.2 N/mm2 (M16) for B6, and 4.5 N/mm2 (M17) for B7. According to the results, the FS increased with the addition of coarse aggregate [28,29]. It has been observed that CS is higher for mixes with a low foam volume.
With the help of experimental results, a polynomial regression analysis was performed between the FS and the w/c ratio. The analysis was performed in three groups based on the foam volumes, and the results of the analysis are displayed in Figure 14 and Table 10. From the results, it is observed that the FS and w/c show a great correlation, with R2 values of 0.96, 0.95, and 0.99 for G1, G2, and G3, respectively, and minimum error values were observed for RMSE, MSE, and MAE.

5. Conclusions

The results of the tests show that several aspects need to be observed to improve the properties of FC. The addition of coarse aggregate and reduction of foam volume shows a significant increase in strength. The application of ANN has shown reliable results when compared with the experimental results. Following are some essential observations that are noted from the study:
  • The rate of flow of FC is in proportion to the foam volume. Hence, it was observed that the flow value of FC is significantly lower for a low foam value and increases for a higher foam volume.
  • The density ratio for all mixes was observed to be near unit one, where the mix with 6% foam and a c/s ratio of 1:2 shows the highest density ratio of 1.06.
  • From the results of EDA, a stronger correlation was visualized between the coarse aggregate and the mechanical properties of the mixes.
  • The density of FC has a significant relationship with strength; as the density of FC, rises, so does its strength, and vice versa.
  • From the PRA, it is observed that predicted values are closer to the experimental values with lower R2 values for all the batches. It is also noted that the statistical errors derived from the ANN model were found to be minimum for all the batches.

Author Contributions

Conceptualization, Y.S.R.; methodology, Y.S.R.; investigation, Y.S.R.; resources, S.S.N.; data curation, S.S.N.; writing—original draft preparation, Y.S.R.; writing—review and editing, A.S. and S.S.N.; supervision, A.S.; project administration, A.S. and S.S.N. All authors have read and agreed to the published version of the manuscript.

Funding

This research received no external funding.

Data Availability Statement

Not applicable.

Acknowledgments

This work presents the results of ongoing experimental research conducted at SRM Institute of Science and Technology.

Conflicts of Interest

The authors declare no conflict of interest.

References

  1. Gowri, R.; Anand, K.B. Utilization of Fly Ash and Ultrafine GGBS for Higher Strength Foam Concrete Utilization of Fly Ash and Ultrafine GGBS for Higher Strength Foam Concrete. IOP Conf. Ser. Mater. Sci. Eng. 2018, 310, 012070. [Google Scholar] [CrossRef]
  2. Karl, S.; Wörner, J.D. Foamed Concrete Mixing and Workability, 1st ed.; Taylor Francis: London, UK, 1994. [Google Scholar]
  3. Falliano, D.; De Domenico, D.; Ricciardi, G.; Gugliandolo, E. Experimental Investigation on the Compressive Strength of Foamed Concrete: Effect of Curing Conditions, Cement Type, Foaming Agent and Dry Density. Constr. Build. Mater. 2018, 165, 735–749. [Google Scholar] [CrossRef]
  4. ASTM C 869-91; Standard Specification for Foaming Agents Used in Making Preformed Foam for Cellular Concrete. ASTM Standards: West Conshohocken, PA, USA, 1999; Volume 91, pp. 1–2.
  5. Ghorbani, S.; Ghorbani, S.; Tao, Z.; de Brito, J.; Tavakkolizadeh, M. Effect of Magnetized Water on Foam Stability and Compressive Strength of Foam Concrete. Constr. Build. Mater. 2019, 197, 280–290. [Google Scholar] [CrossRef]
  6. Panesar, D.K. Cellular Concrete Properties and the Effect of Synthetic and Protein Foaming Agents. Constr. Build. Mater. 2013, 44, 575–584. [Google Scholar] [CrossRef]
  7. Nambiar, E.K.K. Fresh State Characteristics of Foam Concrete. J. Mater. Civ. Eng. 2008, 20, 111–117. [Google Scholar] [CrossRef]
  8. Ghorbani, S.; Sharifi, S.; de Brito, J.; Ghorbani, S.; Jalayer, M.A.; Tavakkolizadeh, M. Using Statistical Analysis and Laboratory Testing to Evaluate the Effect of Magnetized Water on the Stability of Foaming Agents and Foam Concrete. Constr. Build. Mater. 2019, 207, 28–40. [Google Scholar] [CrossRef]
  9. Jhatial, A.A.; Goh, W.I.; Rind, T.A.; Kumar, A. Thermal Performance Simulation of Eco-Friendly Lightweight Foamed Concrete Incorporating Palm Oil Fuel Ash and Eggshell Powder Using ABAQUS. Silicon 2022, 14, 1263–1283. [Google Scholar] [CrossRef]
  10. Sekar, A.; Kandasamy, G. Study on Durability Properties of Coconut Shell Concrete with Coconut Fiber. Buildings 2019, 9, 107. [Google Scholar] [CrossRef] [Green Version]
  11. Junaid, M.F.; ur Rehman, Z.; Kuruc, M.; Medveď, I.; Bačinskas, D.; Čurpek, J.; Čekon, M.; Ijaz, N.; Ansari, W.S. Lightweight Concrete from a Perspective of Sustainable Reuse of Waste Byproducts. Constr. Build. Mater. 2022, 319, 126061. [Google Scholar] [CrossRef]
  12. She, W.; Du, Y.; Zhao, G.; Feng, P.; Zhang, Y.; Cao, X. Influence of Coarse Fly Ash on the Performance of Foam Concrete and Its Application in High-Speed Railway Roadbeds. Constr. Build. Mater. 2018, 170, 153–166. [Google Scholar] [CrossRef]
  13. Nambiar, E.K.K.; Ramamurthy, K. Influence of Filler Type on the Properties of Foam Concrete. Cem. Concr. 2006, 28, 475–480. [Google Scholar] [CrossRef]
  14. Xiao, J.; Hao, L.; Cao, W.; Ye, T. Influence of Recycled Powder Derived from Waste Concrete on Mechanical and Thermal Properties of Foam Concrete. J. Build. Eng. 2022, 61, 105203. [Google Scholar] [CrossRef]
  15. Ramamurthy, K.; Kunhanandan Nambiar, E.K.; Indu Siva Ranjani, G. A Classification of Studies on Properties of Foam Concrete. Cem. Concr. Compos. 2009, 31, 388–396. [Google Scholar] [CrossRef]
  16. Boukhatem, B.; Ghrici, M.; Kenai, S.; Tagnit-Hamou, A. Prediction of Efficiency Factor of Ground-Granulated Blastfurnace Slag of Concrete Using Artificial Neural Network. ACI Mater. J. 2011, 108, 55–63. [Google Scholar] [CrossRef]
  17. Chopra, P.; Sharma Professor, R.K.; Kumar Professor, M. Regression Models for the Prediction of Compressive Strength of Concrete with & without Fly Ash. Int. J. Latest Trends Eng. Technol. 2014, 3, 400. [Google Scholar]
  18. Nuruddin, M.F.; Khan, S.U.; Shafiq, N.; Ayub, T. Strength Prediction Models for PVA Fiber-Reinforced High-Strength Concrete. J. Mater. Civ. Eng. 2015, 27, 04015034. [Google Scholar] [CrossRef]
  19. Atici, U. Prediction of the Strength of Mineral Admixture Concrete Using Multivariable Regression Analysis and an Artificial Neural Network. Expert Syst. Appl. 2011, 38, 9609–9618. [Google Scholar] [CrossRef]
  20. Sadrmomtazi, A.; Sobhani, J.; Mirgozar, M.A. Modeling Compressive Strength of EPS Lightweight Concrete Using Regression, Neural Network and ANFIS. Constr. Build. Mater. 2013, 42, 205–216. [Google Scholar] [CrossRef]
  21. Bingöl, A.F.; Tortum, A.; Gül, R. Neural Networks Analysis of Compressive Strength of Lightweight Concrete after High Temperatures. Mater. Des. 2013, 52, 258–264. [Google Scholar] [CrossRef]
  22. Słoński, M. A Comparison of Model Selection Methods for Compressive Strength Prediction of High-Performance Concrete Using Neural Networks. Comput. Struct. 2010, 88, 1248–1253. [Google Scholar] [CrossRef]
  23. Ramana, K.V.S.; Anita, T.; Mandal, S.; Kaliappan, S.; Shaikh, H.; Sivaprasad, P.V.; Dayal, R.K.; Khatak, H.S. Effect of Different Environmental Parameters on Pitting Behavior of AISI Type 316L Stainless Steel: Experimental Studies and Neural Network Modeling. Mater. Des. 2009, 30, 3770–3775. [Google Scholar] [CrossRef]
  24. Madandoust, R.; Bungey, J.H.; Ghavidel, R. Prediction of the Concrete Compressive Strength by Means of Core Testing Using GMDH-Type Neural Network and ANFIS Models. Comput. Mater. Sci. 2012, 51, 261–272. [Google Scholar] [CrossRef]
  25. Tortum, A.; Yayla, N.; Gökdaǧ, M. The Modeling of Mode Choices of Intercity Freight Transportation with the Artificial Neural Networks and Adaptive Neuro-Fuzzy Inference System. Expert Syst. Appl. 2009, 36, 6199–6217. [Google Scholar] [CrossRef]
  26. Correia, S.L.; Partala, T.; Loch, F.C.; Segadães, A.M. Factorial Design Used to Model the Compressive Strength of Mortars Containing Recycled Rubber. Compos. Struct. 2010, 92, 2047–2051. [Google Scholar] [CrossRef]
  27. Yuan, Z.; Wang, L.N.; Ji, X. Prediction of Concrete Compressive Strength: Research on Hybrid Models Genetic Based Algorithms and ANFIS. Adv. Eng. Softw. 2014, 67, 156–163. [Google Scholar] [CrossRef]
  28. Deshpande, N.; Londhe, S.; Kulkarni, S. Modeling Compressive Strength of Recycled Aggregate Concrete by Artificial Neural Network, Model Tree and Non-Linear Regression. Int. J. Sustain. Built Environ. 2014, 3, 187–198. [Google Scholar] [CrossRef] [Green Version]
  29. Topçu, I.B.; Saridemir, M. Prediction of Compressive Strength of Concrete Containing Fly Ash Using Artificial Neural Networks and Fuzzy Logic. Comput. Mater. Sci. 2008, 41, 305–311. [Google Scholar] [CrossRef]
  30. Chithra, S.; Kumar, S.R.R.S.; Chinnaraju, K.; Alfin Ashmita, F. A Comparative Study on the Compressive Strength Prediction Models for High Performance Concrete Containing Nano Silica and Copper Slag Using Regression Analysis and Artificial Neural Networks. Constr. Build. Mater. 2016, 114, 528–535. [Google Scholar] [CrossRef]
  31. Gogtay, N.J.; Deshpande, S.P.; Thatte, U.M. Principles of Regression Analysis. J. Assoc. Physicians India 2017, 65, 48–52. [Google Scholar]
  32. IS 12269:2013; Ordinary Portland Cement, 53 Grade—Specification. Bureau of Indian Standard: New Delhi, India, 2013.
  33. IS 383:2016; Coarse and Fine Aggregate for Concrete—Specification. Bureau of Indian Standard: New Delhi, India, 2016.
  34. IS 2386; Part III Method of Test for Aggregate for Concrete. Part III-Specific Gravity, Density, Voids, Absorption and Bulking. Reaffirmed 2002. Bureau of Indian Standard: New Delhi, India, 1963.
  35. IS 456; Plain Concrete and Reinforced; Bureau of Indian Standard—Specification. Bureau of Indian Standard: New Delhi, India, 2000; pp. 1–114.
  36. IS 2185-4:2008; Concrete Masonry Units, Part 4: Preformed Foam Cellular Concrete Blocks—Specification. Bureau of Indian Standard: New Delhi, India, 2008.
  37. Mukkala, P.; Venkatesh, C.; Habibunnisa, S. Evaluation of Mix Ratios of Light Weight Concrete Using Geopolymer as Binder. Mater. Today Proc. 2022, 52, 2053–2056. [Google Scholar] [CrossRef]
  38. Yan, M.; Wang, Y.; Shen, X.; Dong, S.; Diao, M.; Zhao, Y.; Zhang, T. Enhanced Foaming Properties of Lactoferrin by Forming Functional Complexes with Ginsenoside Re and Rb1. Food Hydrocoll. 2022, 123, 107159. [Google Scholar] [CrossRef]
  39. Rastegar, M.M.; Bagheri, A. Effect of Foam Volume on Penetration Parameters of Foamed Concrete. Mag. Concr. Res. 2022, 74, 989–998. [Google Scholar] [CrossRef]
  40. Jones, M.R.; McCarthy, A. Preliminary Views on the Potential of Foamed Concrete as a Structural Material. Mag. Concr. Res. 2005, 57, 21–31. [Google Scholar] [CrossRef]
  41. Sivananda Reddy, Y.; Anandh, S.; Sindhu Nachiar, S.; Ravichandran, P.T. Use of Industrial Wastes as a Filling Materials in Foam Concrete: A Short Review. Mater. Today Proc. 2022, 68, 2026–2031. [Google Scholar] [CrossRef]
  42. Harith, I.K. Study on Polyurethane Foamed Concrete for Use in Structural Applications. Case Stud. Constr. Mater. 2018, 8, 79–86. [Google Scholar] [CrossRef]
  43. IS 516:2018; Method of Tests for Strength of Concrete. Bureau of Indian Standard: New Delhi, India, 2018.
  44. ASTM C 496 Standard Test Method for Splitting Tensile Strength of Cylindrical Concrete Specimens. Available online: https://www.astm.org/c0496-96.html (accessed on 26 November 2022).
  45. ASTM C78-02—Standard Test Method for Flexural Strength of Concrete (Using Simple Beam with Third-Point Loading). Available online: https://webstore.ansi.org/standards/astm/astmc7802 (accessed on 26 November 2022).
  46. Chou, J.S.; Truong, D.N.; Tsai, C.F. Solving Regression Problems with Intelligent Machine Learner for Engineering Informatics. Mathematics 2021, 9, 686. [Google Scholar] [CrossRef]
  47. Kavya, B.R.; Sureshchandra, H.S.; Prashantha, S.J.; Shrikanth, A.S. Prediction of Mechanical Properties of Glass and Basalt Fiber Reinforced Concrete Using ANN. Asian J. Civ. Eng. 2022, 23, 877–886. [Google Scholar] [CrossRef]
  48. Morgenthaler, S. Exploratory Data Analysis. Wiley Interdiscip. Rev. Comput. Stat. 2009, 1, 33–44. [Google Scholar] [CrossRef]
  49. Imran, H.; Al-Abdaly, N.M.; Shamsa, M.H.; Shatnawi, A.; Ibrahim, M.; Ostrowski, K.A. Development of Prediction Model to Predict the CompressiveStrength of Eco-Friendly Concrete Using MultivariatePolynomial Regression Combined with Stepwise Method. Materials 2022, 15, 317. [Google Scholar] [CrossRef]
  50. Jhatial, A.A.; Inn, G.W.; Mohamad, N.; Johnson Alengaram, U.; Hung Mo, K.; Abdullah, R. Influence of Polypropylene Fibres on the Tensile Strength and Thermal Properties of Various Densities of Foamed Concrete. IOP Conf. Ser. Mater. Sci. Eng. 2017, 271, 012058. [Google Scholar] [CrossRef]
  51. Tanveer, A.; Jagdeesh, K.; Ahmed, F. Foam Concrete. Int. J. Civ. Eng. Res. 2017, 8, 1–14. [Google Scholar]
Figure 1. Flow Diagram of Methodology.
Buildings 13 00218 g001
Figure 2. Radial Diagram of Mix Compositions.
Buildings 13 00218 g002
Figure 3. Materials used to Produce Foam Concrete.
Buildings 13 00218 g003
Figure 4. (a) Cube and Cylinder Specimens of FC., (b) Compressive Testing Machine.
Buildings 13 00218 g004
Figure 5. Artificial Neural Network Structure.
Buildings 13 00218 g005
Figure 6. Density Ratio vs. w/c Ratio of FC.
Buildings 13 00218 g006
Figure 7. Flow vs. Foam Volume vs. w/c Ratio of FC.
Buildings 13 00218 g007
Figure 8. Correlation of Parameters in FC.
Buildings 13 00218 g008
Figure 9. Compressive Strength vs. Coarse Aggregate vs. Foam Volume of FC.
Buildings 13 00218 g009
Figure 10. Actual vs. Predicted Concrete CS Values with Testing Dataset.
Buildings 13 00218 g010
Figure 11. Splitting Tensile Strength vs. Coarse Aggregate vs. Foam Volume of FC.
Buildings 13 00218 g011
Figure 12. Actual vs. Predicted Concrete Split Tensile Strength Values with Testing Dataset.
Buildings 13 00218 g012
Figure 13. Flexural Strength vs. Coarse Aggregate vs. Foam Volume of FC.
Buildings 13 00218 g013
Figure 14. Actual vs. Predicted Concrete Flexural Strength Values with Testing Dataset.
Buildings 13 00218 g014
Table 1. Physical Characteristics of Cement.
Test ConductedResultsLimiting Value
Consistency (%)3025–35%
Initial Setting Time (min)50≥30
Final Setting Time (min)510≤600
Density (g/cc)3.137-
Soundness by Le-Chatliers (mm)3≯10
Specific Surface (cm2/gm)2514≮2250
Table 2. Chemical Characteristics of Cement.
Test ConductedResultsLimiting Value
SiO221.6-
Al2O34.8-
Fe2O33.7-
CaO63.4-
MgO2.3Max 6
Na2O0.8-
K2O0.24-
Cl0.04 Max 0.1
P2O5 <0.05-
Loss of Ignition2.2Max 4
Insoluble Residue0.5Max 3
Table 3. Physical Characteristics of Fine Aggregate.
Characteristics of Fine AggregateTest FindingsLimiting Value
Specific Gravity2.65>2.1
Water Absorption (%)0.81%<5
ShapeGranular-
Aggregate ZoneZone II-
Table 4. Physical Characteristics of Coarse Aggregate.
Characteristics of Coarse AggregateTest FindingsI.S. Recommendations
Specific Gravity2.812.5 to 3
Fineness Modulus (%)4.29-
Elongation Index (%)8≯15%
ShapeGranular & Sub Angular-
Flakiness Index (%)11≯15%
Impact Resistance (%)16.22≯30%
Crushing strength (%)13.73≯30%
Abrasion Value (%)11.72≯30%
Table 5. Details of the Foaming Agent Used.
DescriptionDetails
NameSynthetic Foaming Agent (Foam Airen)
Codal ProvisionIS: 9103:1999, IS: 2185:2008
Mix Ratio1:20 (Foam Agent: Water)
Percentage of Foam Added (%)12, 6, 3, 2 & 1
pH6.5–8.5
Kinematic Viscosity (mm2/s)11
Table 6. Foam Concrete Mixing Proportions.
GROUPSBATCHESMIX NO’SMix RatioMATERIALSDESIGN DENSITY (kg/m3)REMARKS
C:FAFA:CACEMENT (kg/m3)SAND (kg/m3)COARSE (kg/m3)W/C (%)FOAM VOLUME (kg/m3)ADMIXTURE
G1B1M11:1-62571000.2985.2Adam Plast—1 kg/m3160012% Foam volume
M21:1.5-50085200.3668.161600
M31:2-41694600.4356.81600
B2M41:1-66771000.2742.616006% Foam volume
M51:1.5-53385200.3434.081600
M61:2-44594600.4028.41600
G2B3M71:11:16673553550.2742.616006% Foam volume & fine aggregate: coarse aggregate (1:1)
M81:1.51:15334264260.3434.081600
M91:21:14454734730.4028.41600
B4M101:1.550%:50%5334264260.3334.0816006% Foam & 50% fine aggregate, and 50% coarse aggregate
M111:1.560%:40%5335113400.3334.0816006% Foam & 60% fine aggregate, and 40% coarse aggregate
M121:1.570%:30%5335962550.3334.0816006% Foam & 70% fine aggregate, and 30% coarse aggregate
M131:1.580%:20%5336821700.3334.0816006% Foam & 80% fine aggregate, and 20% coarse aggregate
M141:1.590%:10%53376685.20.3334.0816006% Foam & 90% fine aggregate, and 10% coarse aggregate
G3B5M151:1.550%:50%5514264260.3317.04Sika 903—2 kg/m3 + Airen 1%16003% Foam & 50% fine aggregate, and 50% coarse aggregate
B6M161:1.550%:50%5574264260.3211.3616002% Foam & 50% fine aggregate, and 50% coarse aggregate
B7M171:1.550%:50%5624264260.325.6816001% Foam & 50% fine aggregate, and 50% coarse aggregate
Note: C—Cement, FA—Fine Aggregate, CA—Coarse Aggregate, A—Aggregate.
Table 7. Exploratory Data Analysis of Different Mix Proportions and their Strengths.
Material’sCountMeanStandard DeviationMedian
Minimum25%50%75%Max
Cement (kg/m3)1753968.7416533533557667
Sand (kg/m3)17624205.68355426596797946
Coarse Aggregate (kg/m3)17227192.71010255426473
w/c (%)170.330.040.270.320.330.340.43
Foam volume (kg/m3)173719.355.6828.4034.0842.6085.20
Age (days)172802828282828
CS (MPa)1713.610.894.0110.0711.6514.5352.20
Split Tensile Strength (MPa)171.960.711.031.331.902.234.02
Flexural Strength (MPa)172.661.411.491.972.142.537.20
Table 8. Compressive Strength Results of the ANN Model.
BatchesMultiple RR2Adjusted R2RMSEMSEMAE
B1 & 20.990.980.813.3711.353.37
B3 & 40.980.950.702.245.032.14
B5, 6 & 70.890.790.580.630.510.61
Table 9. Split Tensile Strength Results of ANN Model.
BatchesMultiple RR2Adjusted R2RMSEMSEMAE
B1 & 20.980.960.710.320.10.32
B3 & 40.960.930.760.360.130.32
B5, 6 & 70.990.99−0.0050.50.250.5
Table 10. Flexural Strength Results of ANN Model.
BatchesMultiple RR2Adjusted R2RMSEMSEMAE
B1 & 20.980.960.710.360.130.36
B3 & 40.970.950.790.290.090.24
B5, 6 & 70.990.99−0.0010.790.620.79
Disclaimer/Publisher’s Note: The statements, opinions and data contained in all publications are solely those of the individual author(s) and contributor(s) and not of MDPI and/or the editor(s). MDPI and/or the editor(s) disclaim responsibility for any injury to people or property resulting from any ideas, methods, instructions or products referred to in the content.

