Article

Seismic Performance Assessment of Low-Rise Unreinforced and Confined Brick Masonry School Buildings Using the Applied Element Method

by
Rohit Kumar Adhikari
*,
Ahsana Parammal Vatteri
and
Dina D’Ayala
Disaster Risk Reduction and Resilience Engineering, Department of Civil, Environmental and Geomatic Engineering, University College London, London WC1E 6BT, UK
*
Author to whom correspondence should be addressed.
Buildings 2023, 13(1), 159; https://doi.org/10.3390/buildings13010159
Submission received: 1 December 2022 / Revised: 23 December 2022 / Accepted: 3 January 2023 / Published: 8 January 2023

Abstract

:
Masonry buildings are generally vulnerable to seismic action, as evidenced extensively in past earthquakes. In order to improve their seismic performance, several modifications have been introduced, such as reinforcing or confining the masonry. This paper presents a seismic analysis and fragility assessment procedure for non-engineered masonry building typologies, employing the applied element method (AEM). Compared to buildings with stiff diaphragms, the conventional pushover-based procedure is challenging for the seismic assessment of masonry buildings with flexible diaphragms, due to the lack of a global box-like behaviour. This study first presents a novel and validated method for nonlinear pushover analysis, independent of the type of diaphragm action on the building, by applying incremental ground acceleration and by considering suitable engineering demand parameters for the assessment of lateral capacity. Based on the failure mechanisms, a seismic performance assessment and fragility evaluation approach is then proposed, for reliable accounting of both the in-plane and out-of-plane failure modes. Finally, the proposed methodology is applied to a number of unreinforced and confined masonry school buildings with different seismic detailing levels, as often found in the Himalayan belt and beyond.

1. Introduction

Schools are critical infrastructure, due to their high exposure value, as well as physical and human vulnerability. Masonry school buildings represent a significant proportion of the national school portfolio in many countries worldwide [1]. While unreinforced masonry (URM) is traditionally used in school buildings, improved designs such as confined masonry (CM) [2] have also become common in school construction in recent decades, e.g., in India [3], Indonesia [4], and El Salvador [1]. The present study thus deals with the URM and CM school construction types commonly found in developing countries such as Nepal and India. The focus is on existing non-engineered community-built constructions, although newly built school buildings follow current national seismic design codes.
Masonry is heterogeneous and anisotropic, being composed of units and mortar that usually display different stiffness and strength properties. Due to the large number of variables required for the reliable mechanical characterization and numerical simulation of masonry buildings, reliable seismic analysis and performance evaluation is challenging [5]. Due to the complexity of conducting full-scale experimental tests to characterize the seismic behaviour of buildings, analytical/numerical seismic assessment methods have been widely used within the engineering community for masonry buildings [6,7,8]. Three modelling approaches, i.e., detailed micro-modelling, simplified micro-modelling, or macro-modelling can be followed, to create numerical models of masonry [9]. In detailed micro-modelling, the units and mortar in the joints are represented by continuum elements, whereas the unit–mortar interface is represented by discontinuous elements [10]. In simplified micro-modelling, the expanded units are represented by continuum elements, whereas the behaviour of the mortar joints and unit–mortar interface is lumped into discontinuous elements [11,12]. In macro-modelling, the units, mortar, and unit–mortar interface are smeared out in the continuum as a single composite material and the focus is on the component behaviour [7,13,14]. The accuracy of the analysis results is generally reduced from the detailed micro- to the macro-modelling approach.
Limit analysis-based methods have been widely used for the analysis of masonry structures [6,15,16,17,18,19]. A state-of-the-art review on the limit analysis-based methods applied to masonry walls can be found in Casapulla, Giresini, and Lourenço [20]. In a recent work, Funari et al. [19] presented a new formulation to assess the frictional resistance adopted in a macro-block limit analysis formulation for historic masonry structures, focusing on the in-plane sliding–rocking failure mechanism. While most of the previous limit analysis studies on masonry were based on a regular pattern of masonry with equal sized units, Funari et al. [19] extended the formulation to irregular and non-periodic masonry, such as rubble stone masonry. Although simple and efficient, mechanism-based approaches usually do not consider the masonry morphology, the interaction among cross-walls, and local failures such as toe crushing, and they rely on several assumptions, such as the zero tensile strength of the masonry.
Since the early 1980s, finite element method (FEM)-based tools have been extensively used in the numerical modelling and analysis of masonry structures [10,21,22,23,24,25,26,27,28,29,30]. Although extensive models and solutions have been proposed for masonry modelling and analysis using FE techniques, most of these were limited to the study of the seismic behaviour of isolated masonry walls under in plane (IP) action. Moreover, reliable accounting of the post-elastic large displacement and detachment of units or masonry portions is difficult in the FEM environment.
Techniques based on the discrete element method (DEM) [31] have been applied for masonry structures, by assuming the material is a discontinuous medium composed of rigid or deformable blocks and with contact surfaces between the blocks for the simulation of the joints. Standard finite element codes mainly feature joint or interface elements, thus representing masonry as a continuous medium cut by joints. Discrete element models are generated from the inverse perspective than that of the FE method: the material is viewed as an assembly of distinct bodies, with the masonry units interacting along their boundaries [32]. Several studies have been performed based on DEM for the static and dynamic analysis of masonry structures [33,34,35,36,37,38,39].
In recent years, researchers have developed and applied a number of finite discrete element method (FDEM) numerical models, combining the advantages of FEM and DEM to analyse masonry structures [40,41,42,43,44,45]. Malomo and DeJong [45] developed a new macro-distinct element model (M-DEM) for the analysis of the in-plane (IP) behaviour of URM structures, aiming to combine the efficiency of simplified approaches with the accuracy of discontinuum-based micro-modelling methods.
In the applied element method (AEM), a variation of the DEM, a structure is modelled as an assembly of rigid elements connected to each other by means of distributed springs in both normal and tangential directions [46]. Each spring represent the stresses and deformations of certain portion of the applied elements. These springs can simulate the joint de-bonding, shear sliding, and direct tension; and partial connectivity between the elements is also allowed, i.e., when some springs fail, others are still effective [47]. Several studies [47,48,49,50,51,52] have proven the applicability of AEM in simulating the crack initiation, propagation, and large displacement response of masonry structures under static and dynamic loadings. More recently, several researchers have used this method for seismic fragility analysis of masonry buildings. Karbassi and Nollet [47] conducted an incremental dynamic analysis on a six-storey URM building, to develop seismic fragility curves. Guragain [50] applied AEM for non-linear dynamic analysis of low-rise Nepalese masonry building typologies. Using AEM, Malomo et al. [52] reproduced the dynamic behaviour of a shaking table test for a full-scale masonry building, and found a good agreement in the displacement profile, hysteretic response, and crack pattern. AEM is also proven to be suitable for modelling and analysing different masonry fabric and construction types. Adhikari and D’Ayala [53] employed the AEM for the modelling and analysis of several masonry typologies with a varied masonry fabric, ranging from rubble stone to brick masonry, while Vatteri and D’Ayala [3] explored the seismic as well as flood analysis of CM buildings using this approach. A detailed account of the constitutive models as well as micro-modelling strategy used for masonry modelling in AEM can be found in Malomo et al. [52] and is discussed further in Section 4.
Being a more efficient and relatively simpler method compared to micro-modelling, macro-modelling, i.e., the equivalent frame method (EFM), has been extensively used for the modelling and seismic analysis of masonry structures [7,54,55,56,57,58]. A EFM-based computer program called TREMURI [7] has been widely used for the pushover analysis of masonry buildings [59,60,61,62,63]. This method is also popular among practicing engineers, as a global analysis of masonry structures can be performed with a reasonable computational cost and modest level of modelling knowledge. However, the EFM procedures developed so far mainly capture the IP seismic response and assume that walls are well connected by stiff diaphragms, to develop a box-like behaviour. Thus, the use of EFM in the analysis of masonry buildings with poor cross-wall connections and flexible diaphragms, where the out of plane (OOP) seismic vulnerability is the major issue, cannot yield reliable outcomes.
In summary, although the FEM, DEM, F-DEM, and EFM approaches have been extensively used with reliable accuracy for the IP response of planar masonry walls, reliable prediction of the OOP response is still challenging and has not been investigated in detail using these approaches. In buildings with flexible type diaphragms, the OOP walls present the main vulnerability, due to the lack of a global box-like behaviour. Furthermore, modelling of non-engineered masonry typologies such as masonry school buildings in Nepal and India, demanding element-by-element modelling, is difficult with these approaches. On the other hand, the AEM approach offers the element-by-element modelling for masonry and has been successfully adopted by several researchers for modelling masonry buildings [47,50,52,64]. Using the AEM approach, reliable prediction of non-linear OOP response is possible, as this allows the failure and separation of joints in the discontinuous and large displacement regime. Furthermore, for CM, numerical models need to be able to overcome the challenges of simulating, not only the interaction between the unit and mortar, but also that between the masonry and the reinforced concrete (RC) confining elements. The application and reliability of AEM in the numerical modelling and lateral load analysis of experimentally tested masonry specimens are investigated in the present study in Section 4.
In the last two decades, the seismic performance assessment and fragility analysis of building structures with approaches based on the outputs of non-linear time history analysis (NLTHA), such as incremental dynamic analysis (IDA) [65], cloud analysis [66], and multiple stripe analysis [67] have evolved within the research community. Although reliable, these approaches are highly resource- and time-intensive and cannot be considered a viable solution if this approach was to be used in practice for determining the vulnerability and risk for a portfolio of building types. On the other hand, non-linear static procedures (NSP) [68,69], although less reliable compared to NLTHA-based approaches, are more efficient for assessing the seismic performance and consequent fragility evaluation of a portfolio of building types. Such methods have been widely used in the seismic assessment of masonry buildings [8,70,71,72]. Adhikari [64] recently conducted an extensive work on a range of masonry typologies, while also validating the NSP-based seismic performance and fragility outputs against the outputs of IDA, based on hundreds of NLTHA results.
For masonry buildings with stiff diaphragms, a pushover analysis can follow the standard procedure [73], as these meet the assumption of the redistribution of horizontal actions by the rigid slab, inducing uniform displacement of the vertical structures. However, there are variations in the pushover loading approach and patterns (inverse triangular, uniform, mode shape proportional, or mass proportional), resulting in significant variation in the pushover curves [74,75,76,77]. Moreover, in the case of three-dimensional element-by-element modelling of masonry assemblies, where the interfaces between bricks and mortar are realistically represented by springs with a strength and stiffness lower than the unit elements (see Section 4), the application of a lateral force or displacement pattern concentrated at particular locations (e.g., at floor/roof levels) might create a spurious localised failure and therefore is unsuitable for simulating the complete post-elastic behaviour of the whole structure. This is due to the stress/strain concentration at the point/region of the load/displacement application in the conventional pushover analysis. Moreover, during seismic actions, the inertia forces are distributed to all elements of the structure in proportion to their mass. In particular, in the case of masonry structures where the walls are heavier and stiffer than the floor structures, the concentration of forces or displacement at storey level is inappropriate. Hence, in this study, an innovative approach is implemented (Section 2.1), whereby the inertial forces follow the mass distribution in the building.
To date in the literature, no comprehensive strategy is available for dealing with the NSP-based seismic assessment of masonry buildings without a box-like behaviour and considering both the IP and OOP behaviours along with their interaction in three-dimensional configurations. Instead, in the assessment of the overall seismic behaviour of masonry structures with flexible diaphragms (FD), many researchers have neglected or given little importance to the OOP behaviour [13,78,79], because of the complexity in modelling, analysis, and interpretation of the OOP behaviour. Even when considering the IP behaviour only, the choice of the “master node” representing the displacement in the global pushover curve of a masonry building, consisting of walls with different opening configurations and stiffnesses, also causes uncertainty in the resulting output [80]. Widely used EFM approaches for masonry walls [7] usually focus on the global response, only considering the capacity and failure modes of IP walls, meaning that such an approach does not yield reliable results for buildings with flexible diaphragms. In the mechanics-based FaMIVE procedure [6], analysis is conducted with respect to pre-defined possible IP, OOP, and combined collapse mechanisms to identify the most likely collapse mechanisms in the building. However, the masonry fabric, post-elastic behaviour, and the interaction of the walls cannot be accounted for in this approach. Olivito and Porzio [81] recognising the lack of box-like behaviour in historic masonry buildings, proposed a seismic assessment based on a multi-control point pushover analysis approach. The global pushover curve is plotted with respect to an envelope of the maximum displacements observed at a number of control points, based on the building’s collapse mechanisms. Thus the ultimate control point is an average and fictious one, questioning its validity for a “global” pushover curve and also the subsequent application of NSP such as N2 method for seismic performance evaluation. In a recent work by Beconcini et al. [82], the issue of a flexible diaphragm and poor connection in masonry buildings, leading to a lack of box-like behaviour, was recognised, and a simplified 2D pushover analysis of individual walls was suggested. However, the walls in real masonry structures are rarely independent, as some level of cross-wall connection exists, even in community-built non-engineered constructions [64]. Therefore, in an element-by-element modelling and analysis environment, a reliable component-based strategy for dealing with the seismic performance and fragility assessment of masonry buildings without box-like behaviour, and considering the IP and OOP behaviours, as well as their interaction, is proposed in this study (Section 2.2).
The capacity curves, as well as the drift limits for different damage states are influenced by several factors, such as the masonry fabric, quality of masonry, level of gravity load, and the boundary conditions [83,84]. Thus, a single capacity curve and single-valued thresholds for damage states, such as those suggested in HAZUS [85] and in the literature [78] to represent a broader class of masonry, would not yield reliable results for non-engineered masonry typologies. Thus, specific building-based capacity curves and thresholds for damage states are computed in this study for the derivation of fragility functions, following the general methodology presented in Section 2.
The paper is organised as follows: The proposed methodology for the seismic performance assessment of masonry buildings, including a novel incremental ground acceleration (IGA) approach and component-based strategy for the buildings lacking box-like behaviour is presented in Section 2. Section 3 presents the characteristics of the case study buildings, and Section 4 details the masonry modelling using the AEM, along with several validation studies. Section 5 presents the development of AEM numerical models of the case study buildings and underlying assumptions, while Section 6 presents the results and discussion with respect to the failure mechanisms, capacity curves, fragility, and vulnerability functions. Finally, Section 7 presents some concluding remarks.

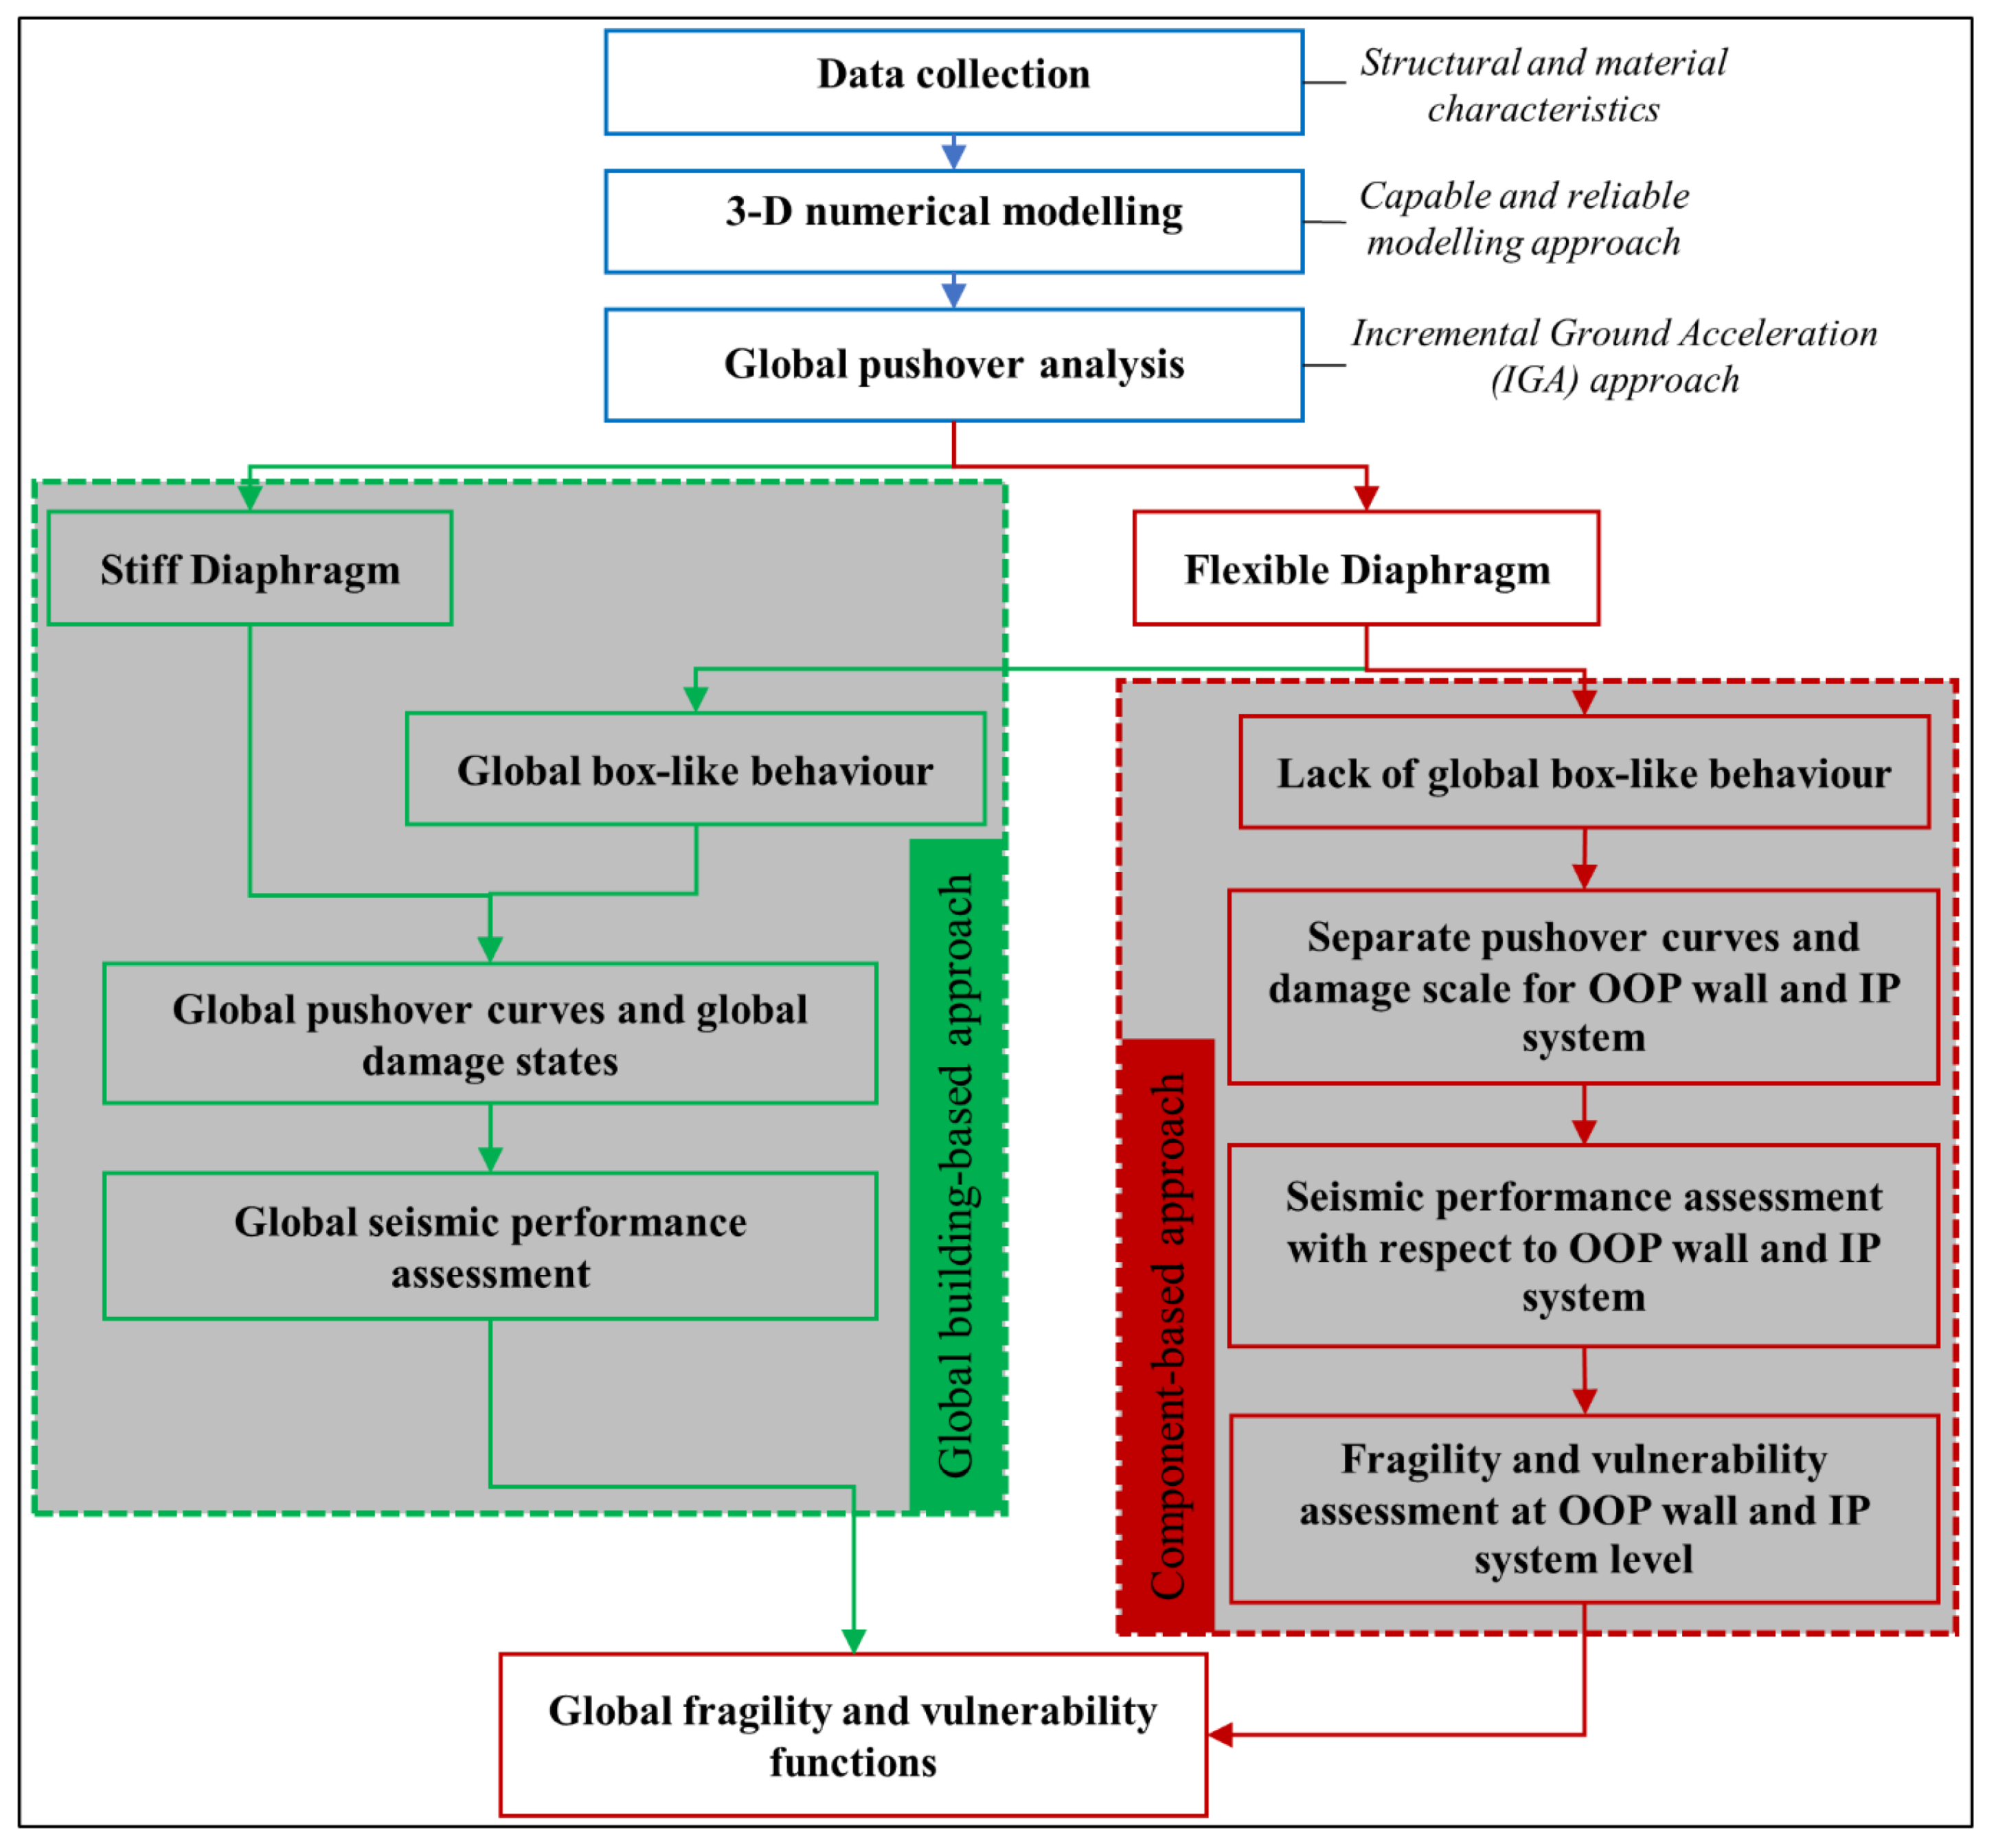
2. Proposed Methodology for Seismic Performance Assessment

The methodology developed in this work for the numerical seismic assessment and consequent fragility/vulnerability assessment of masonry structures is summarised in Figure 1, where alternative strategies are defined, depending on the construction characteristics of the considered building.
The first step involves the data collection of the structural and material characteristics of the case study building or an index building (IB) representative of a typology, which can be done via a field survey, testing, and/or from the literature (more details in Section 3). The next step is the adoption of a suitable and capable numerical modelling approach to create a three-dimensional numerical model of the selected building. Element-by-element models are preferred to continuum based or simplified models, because of the better representation of the heterogeneous nature of masonry. The next step is to carry out a seismic analysis of the numerical model, to determine the failure mechanisms and lateral load-deformation response. Although NLTHA is more reliable, the pushover analysis approach is followed in this methodology for two reasons: the pushover approach is efficient, and the selected buildings are low-rise, responding primarily in first mode under lateral loading.
However, as discussed in Section 1, the conventional pushover application, whether a displacement- or force-controlled scheme, is not reliable for masonry structures, which is more pronounced when modelling them by explicitly simulating the low cohesion between brick and mortar. If the building has a flexible diaphragm, thus lacking box-like behaviour, seismic analysis through the conventional pushover approach presents an additional challenge with respect to the application of lateral loads, due to the lack of a definitive control point. Therefore, a different loading approach is employed in this study, named the incremental ground acceleration (IGA) approach (see Section 2.1). With application of the IGA approach, and by observing the lateral failure mechanism developed through the pushover analysis, it can be determined whether a global box-like behaviour is developed, allowing for a global analysis, or whether this is not present, and therefore a component-level behaviour and analysis should be sought. Thus, there is no need to assume the lateral stiffness or response of horizontal structures.
The application of a pushover-based non-linear static procedure [8,69] for buildings with stiff diaphragms exhibiting box-like behaviour is well established. However, the extraction of global capacity curves for buildings without box-like behaviour is challenging, as the OOP and IP walls exhibit very different responses or local failure modes. The high vulnerability of the OOP gable walls in such URM buildings has frequently been recognised in literature [6,64,86,87]. Based on these considerations, it can be concluded that the seismic analysis of masonry buildings without box-like behaviour cannot be considered reliable without considering the OOP behaviour and associated failure modes in a three-dimensional interactive modelling environment. Hence, this paper proposes a component-based strategy for the seismic fragility and vulnerability assessment of masonry buildings lacking box-like behaviour (see Section 2.2).

2.1. Incremental Ground Acceleration (IGA) Approach

Although the conventional modelling assumptions and pushover application might yield reliable outputs for RC structures with stiff diaphragms, they might not be appropriate for masonry structures where the majority of the mass is uniformly distributed along the height of the structure. Furthermore, the conventional pushover presents issues with respect to the application of direct load/displacement in element-by-element models of masonry structures, as discussed in Section 1 (see further in Section 4). To overcome these issues, the present study proposes an innovative approach, in which the numerical model is subjected to incremental ground acceleration (IGA), rather than a force or displacement pattern on the structure, until collapse. With the application of the IGA approach, at each instant of loading, each of the elements (masonry units) in the element-by-element model has a mass-proportional lateral force exerted on it. Thus, the lateral force distribution is proportional to the mass distribution. In the IGA pushover approach, the loading application on the structure is automatic and realistic, compared to the conventional lateral load application patterns used in pushover analysis. Accordingly, there is no ambiguity about the choice of load pattern or location of the load/displacement application for their structures [80]. This also implies that the computational time taken by the analyses, considering different trial load patterns to find an appropriate loading pattern, is reduced. Moreover, IGA is equivalent to a monotonically increasing intensity of real ground motions. Consequently, by the end of the pushover analysis, the analyst has an estimate of the equivalent lateral acceleration capacity at which the structure collapses. This is quite useful to quickly compare the relative seismic capacity and vulnerability of different structures.
A validation study of the IGA approach is presented in Section 4.2, before applying it to analyse several masonry school buildings with flexible diaphragms in Section 5 and Section 6.

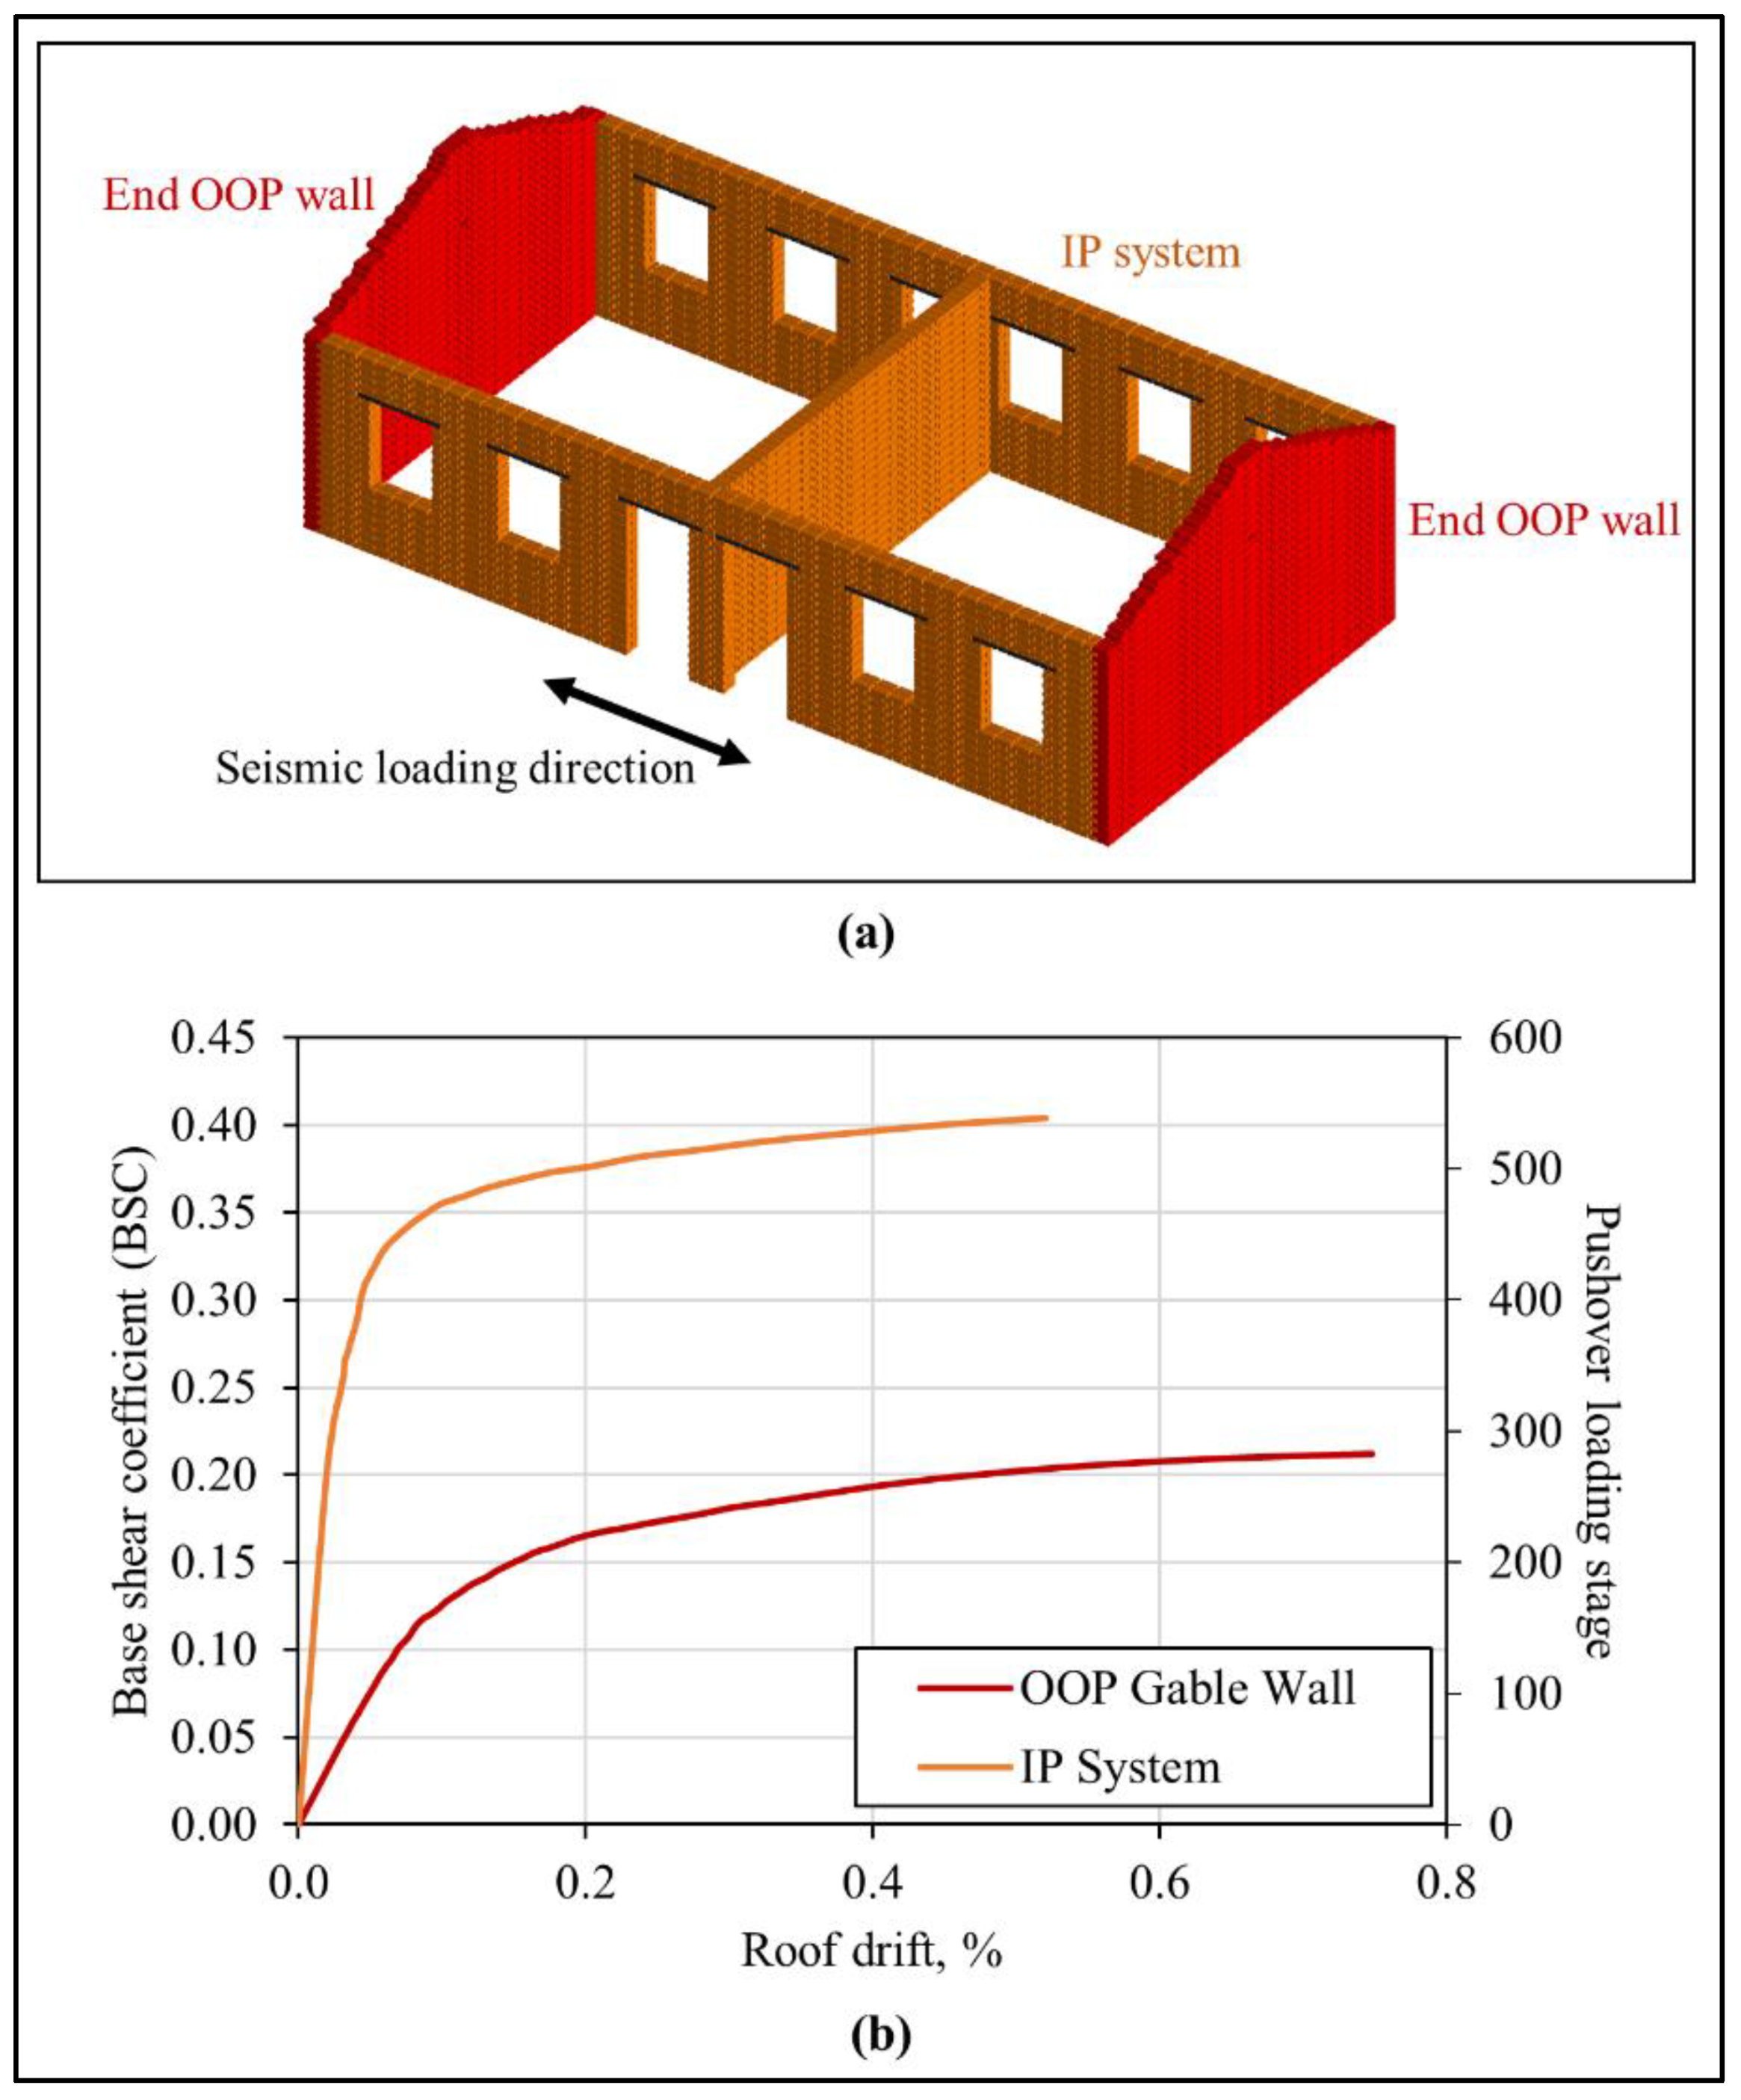
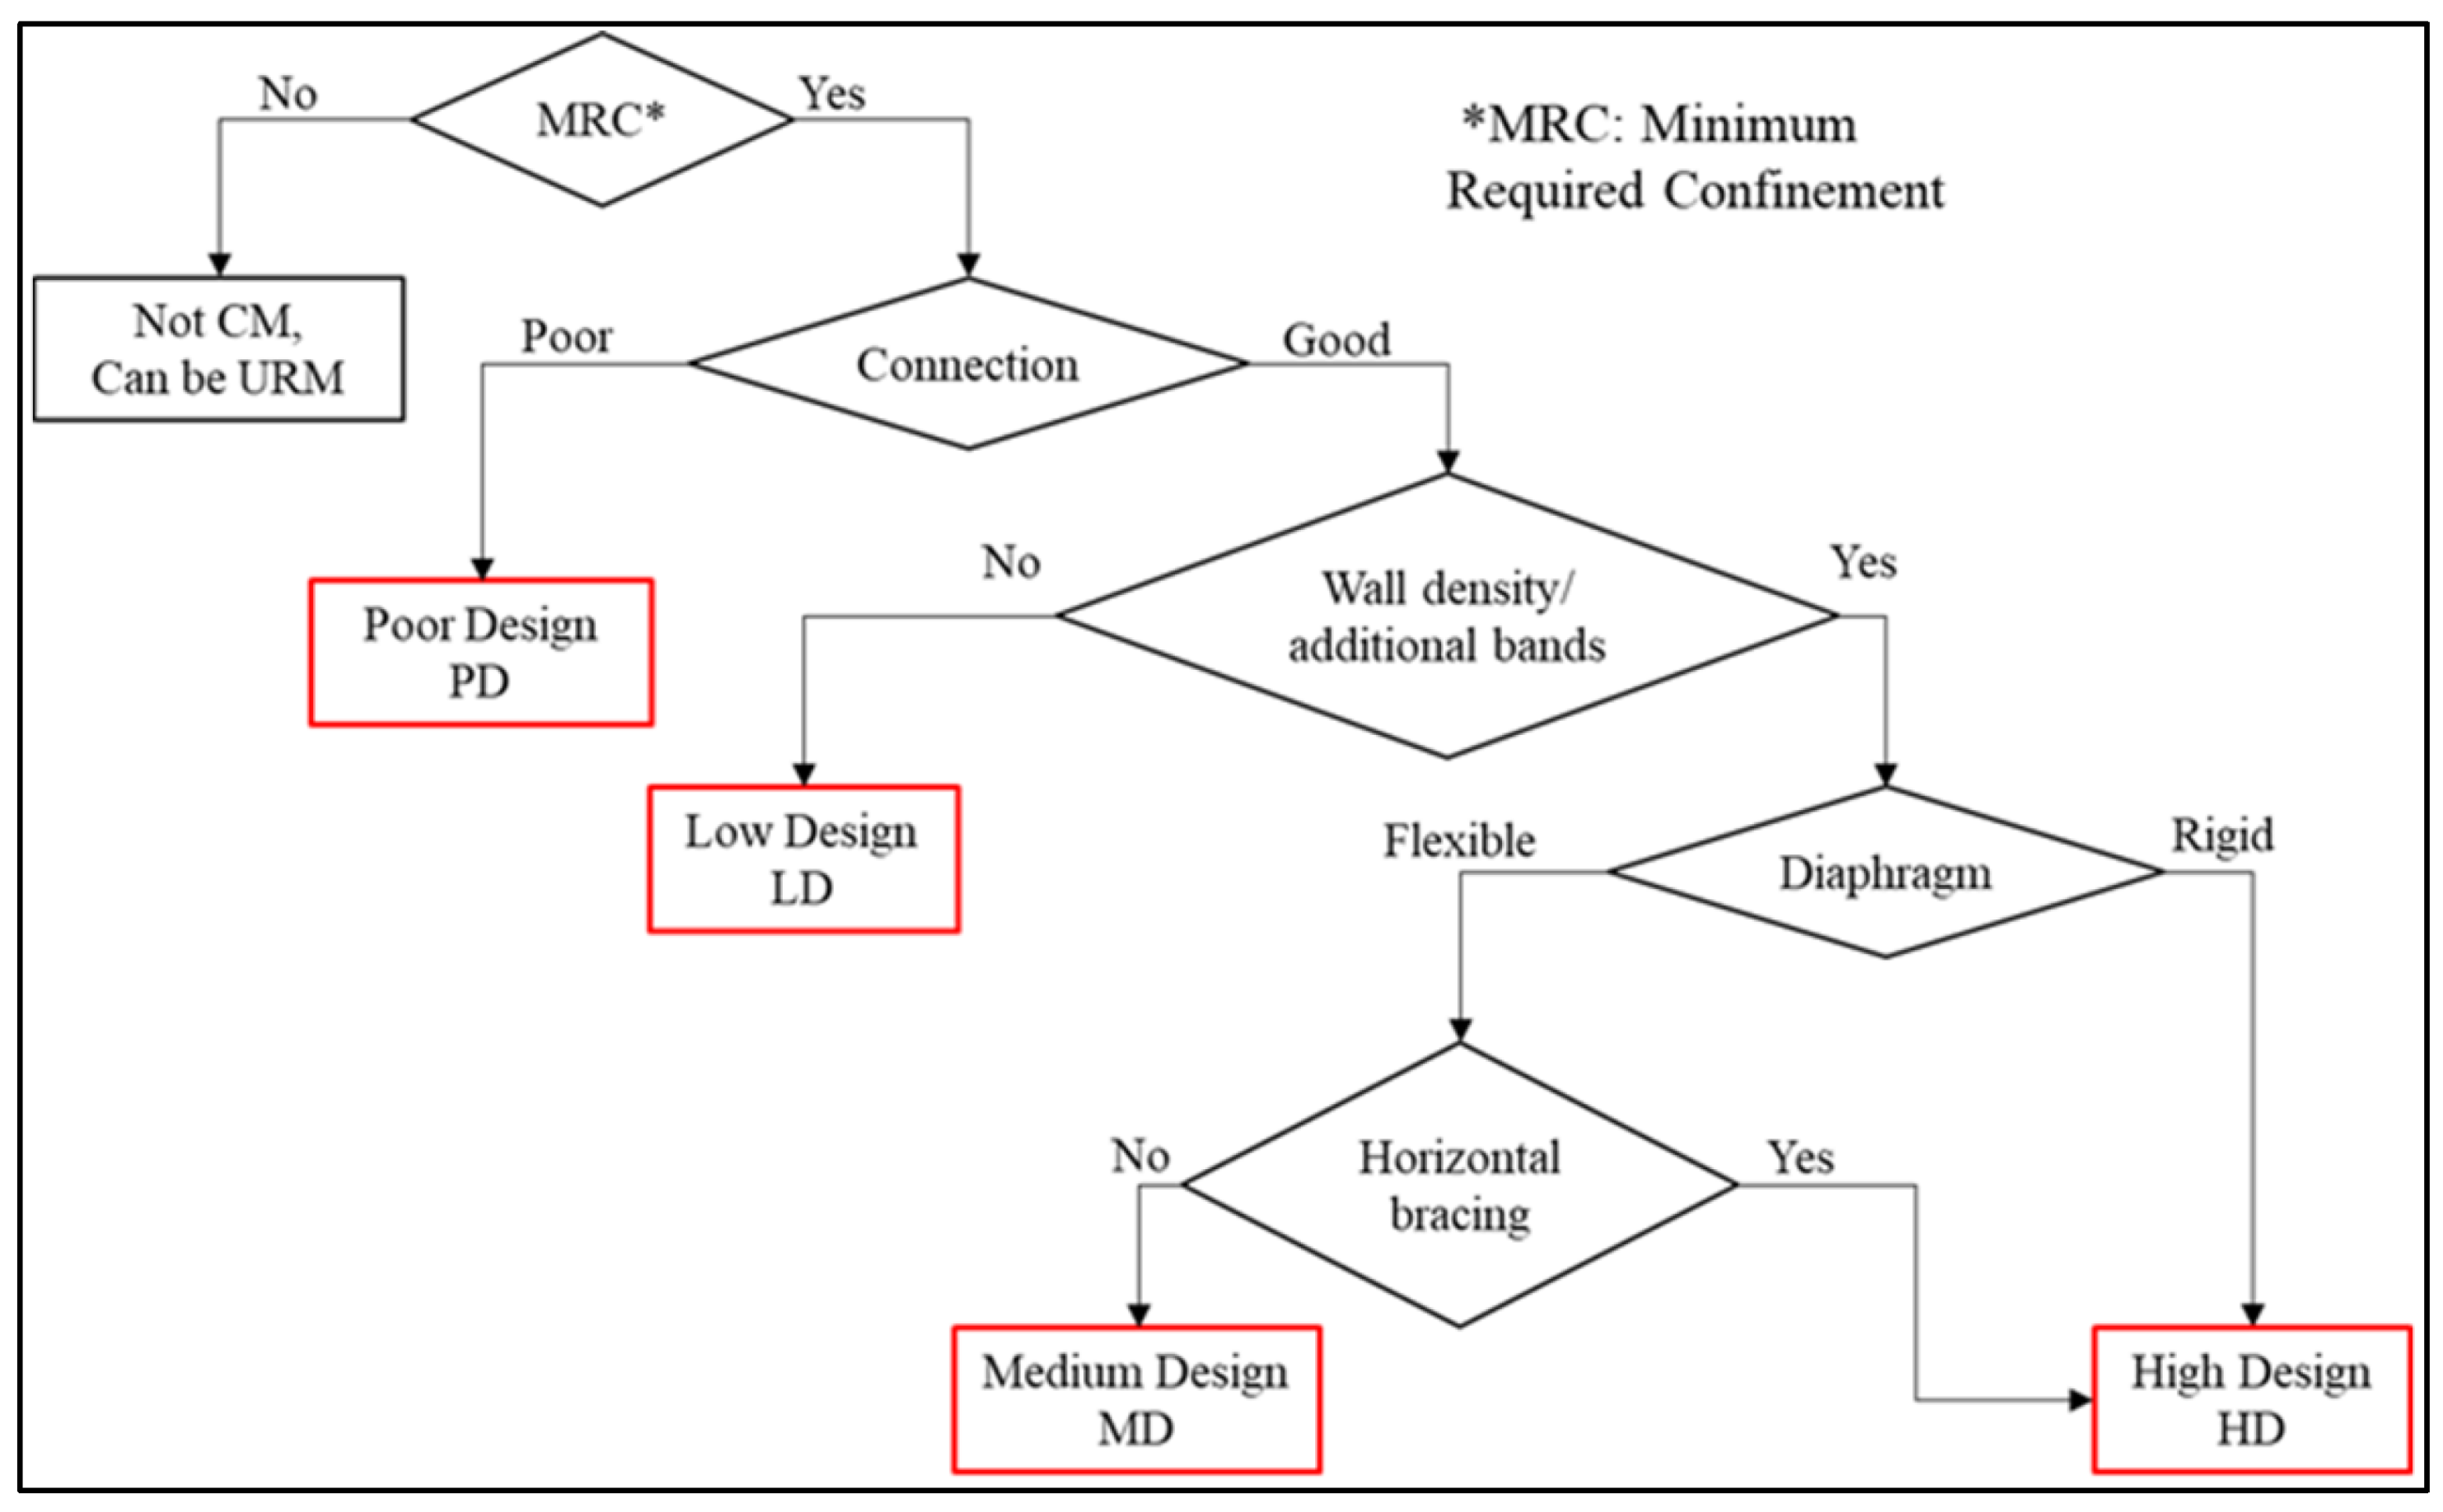
2.2. Strategy for Seismic Assessment of Masonry Buildings without Box-Like Behaviour

Following the discussions in Section 1 and Section 2.1, the commonly held assumption of the “equal displacement of all vertical elements at a storey level” does not hold true in masonry buildings without box-like behaviour. This has implications for the validity of the results obtained by performing a conventional global pushover-based analysis of such structures. In such buildings, the walls acting in the IP direction and those acting in the OOP direction under lateral loading act as different systems (see Figure 2a for an example case of a URM building, more details on this typology are given in Section 3). This is because the gable walls acting in OOP behaviour are flexible, due to the low stiffness in this direction, and are typically unrestrained in their outward bending. Furthermore, the flexural response of low bond strength masonry constructions is poor. Accordingly, the initial stiffness behaviour, rate of damage progression, and the ultimate capacity of these OOP gable walls are entirely different with respect to the response of the IP walls (referred to as the IP system). It is noted that an IP system might include internal OOP walls having good frictional interlocking (i.e., cross-wall connection) with the IP walls. Figure 2b compares the capacity curves for these two sub-systems of the considered URM building lacking box-like behaviour, when loaded in the longitudinal direction. Here, the base shear coefficient (BSC) represents the base shear resisted by the building (or wall) normalised by their seismic weight; thus, this is an independent parameter for comparison. The initial stiffness of the OOP gable wall is an order of magnitude lower than that of the IP system. The OOP gable walls start to lose linearity at 1/3rd of the acceleration capacity of the IP system. Although the OOP gable walls show a displacement capacity twice that of the IP system, these only reach half of the ultimate strength capacity of the IP system. Thus, averaging or combining these two completely different capacity curves to obtain a global capacity curve for the whole building is not meaningful. Furthermore, such average “global capacity curves” to represent the whole building are not reliable for seismic performance assessment using pushover-based procedures, such as the N2 method [69], as the structure is composed of substantially different SDoF systems: the OOP gable wall and the IP system.
A reliable strategy is thus proposed here for carrying out a component-based seismic performance assessment and consequent fragility and vulnerability derivation of such masonry buildings lacking box-like behaviour within the framework of a non-linear pushover-based procedure. This involves identifying the OOP and IP components of the building, i.e., each gable wall acting in the OOP direction, as well as the IP system formed by the walls in the IP direction and any well-connected cross walls. When a global pushover analysis using the IGA method (Section 2.1) is conducted for such buildings, the force–deformation behaviour for both components can be generated by recording the base shear resisted by the respective wall or system and the corresponding top displacement along the pushover loading direction at each step of loading. This ensures the effects of interactions among the walls, depending on the strength of the cross-wall connection, are included in the pushover curves. From the global pushover analysis results, the physical damage states of the OOP gable wall and the IP system can also be observed, to identify the thresholds of different damage states in terms of the top drift. With these capacity curves and thresholds of damage states, capacity spectrum methods, e.g., the N2 method [69] can be employed to carry out seismic performance assessment under a number of ground motions, at the sub-system level of the OOP gable wall and IP system separately, to arrive at the respective fragility and vulnerability functions.
The proposed IGA approach and component-based strategy for seismic performance assessment of masonry buildings with flexible diaphragms were applied in this study (Section 5 and Section 6) to selected case study school buildings, as introduced in Section 3.

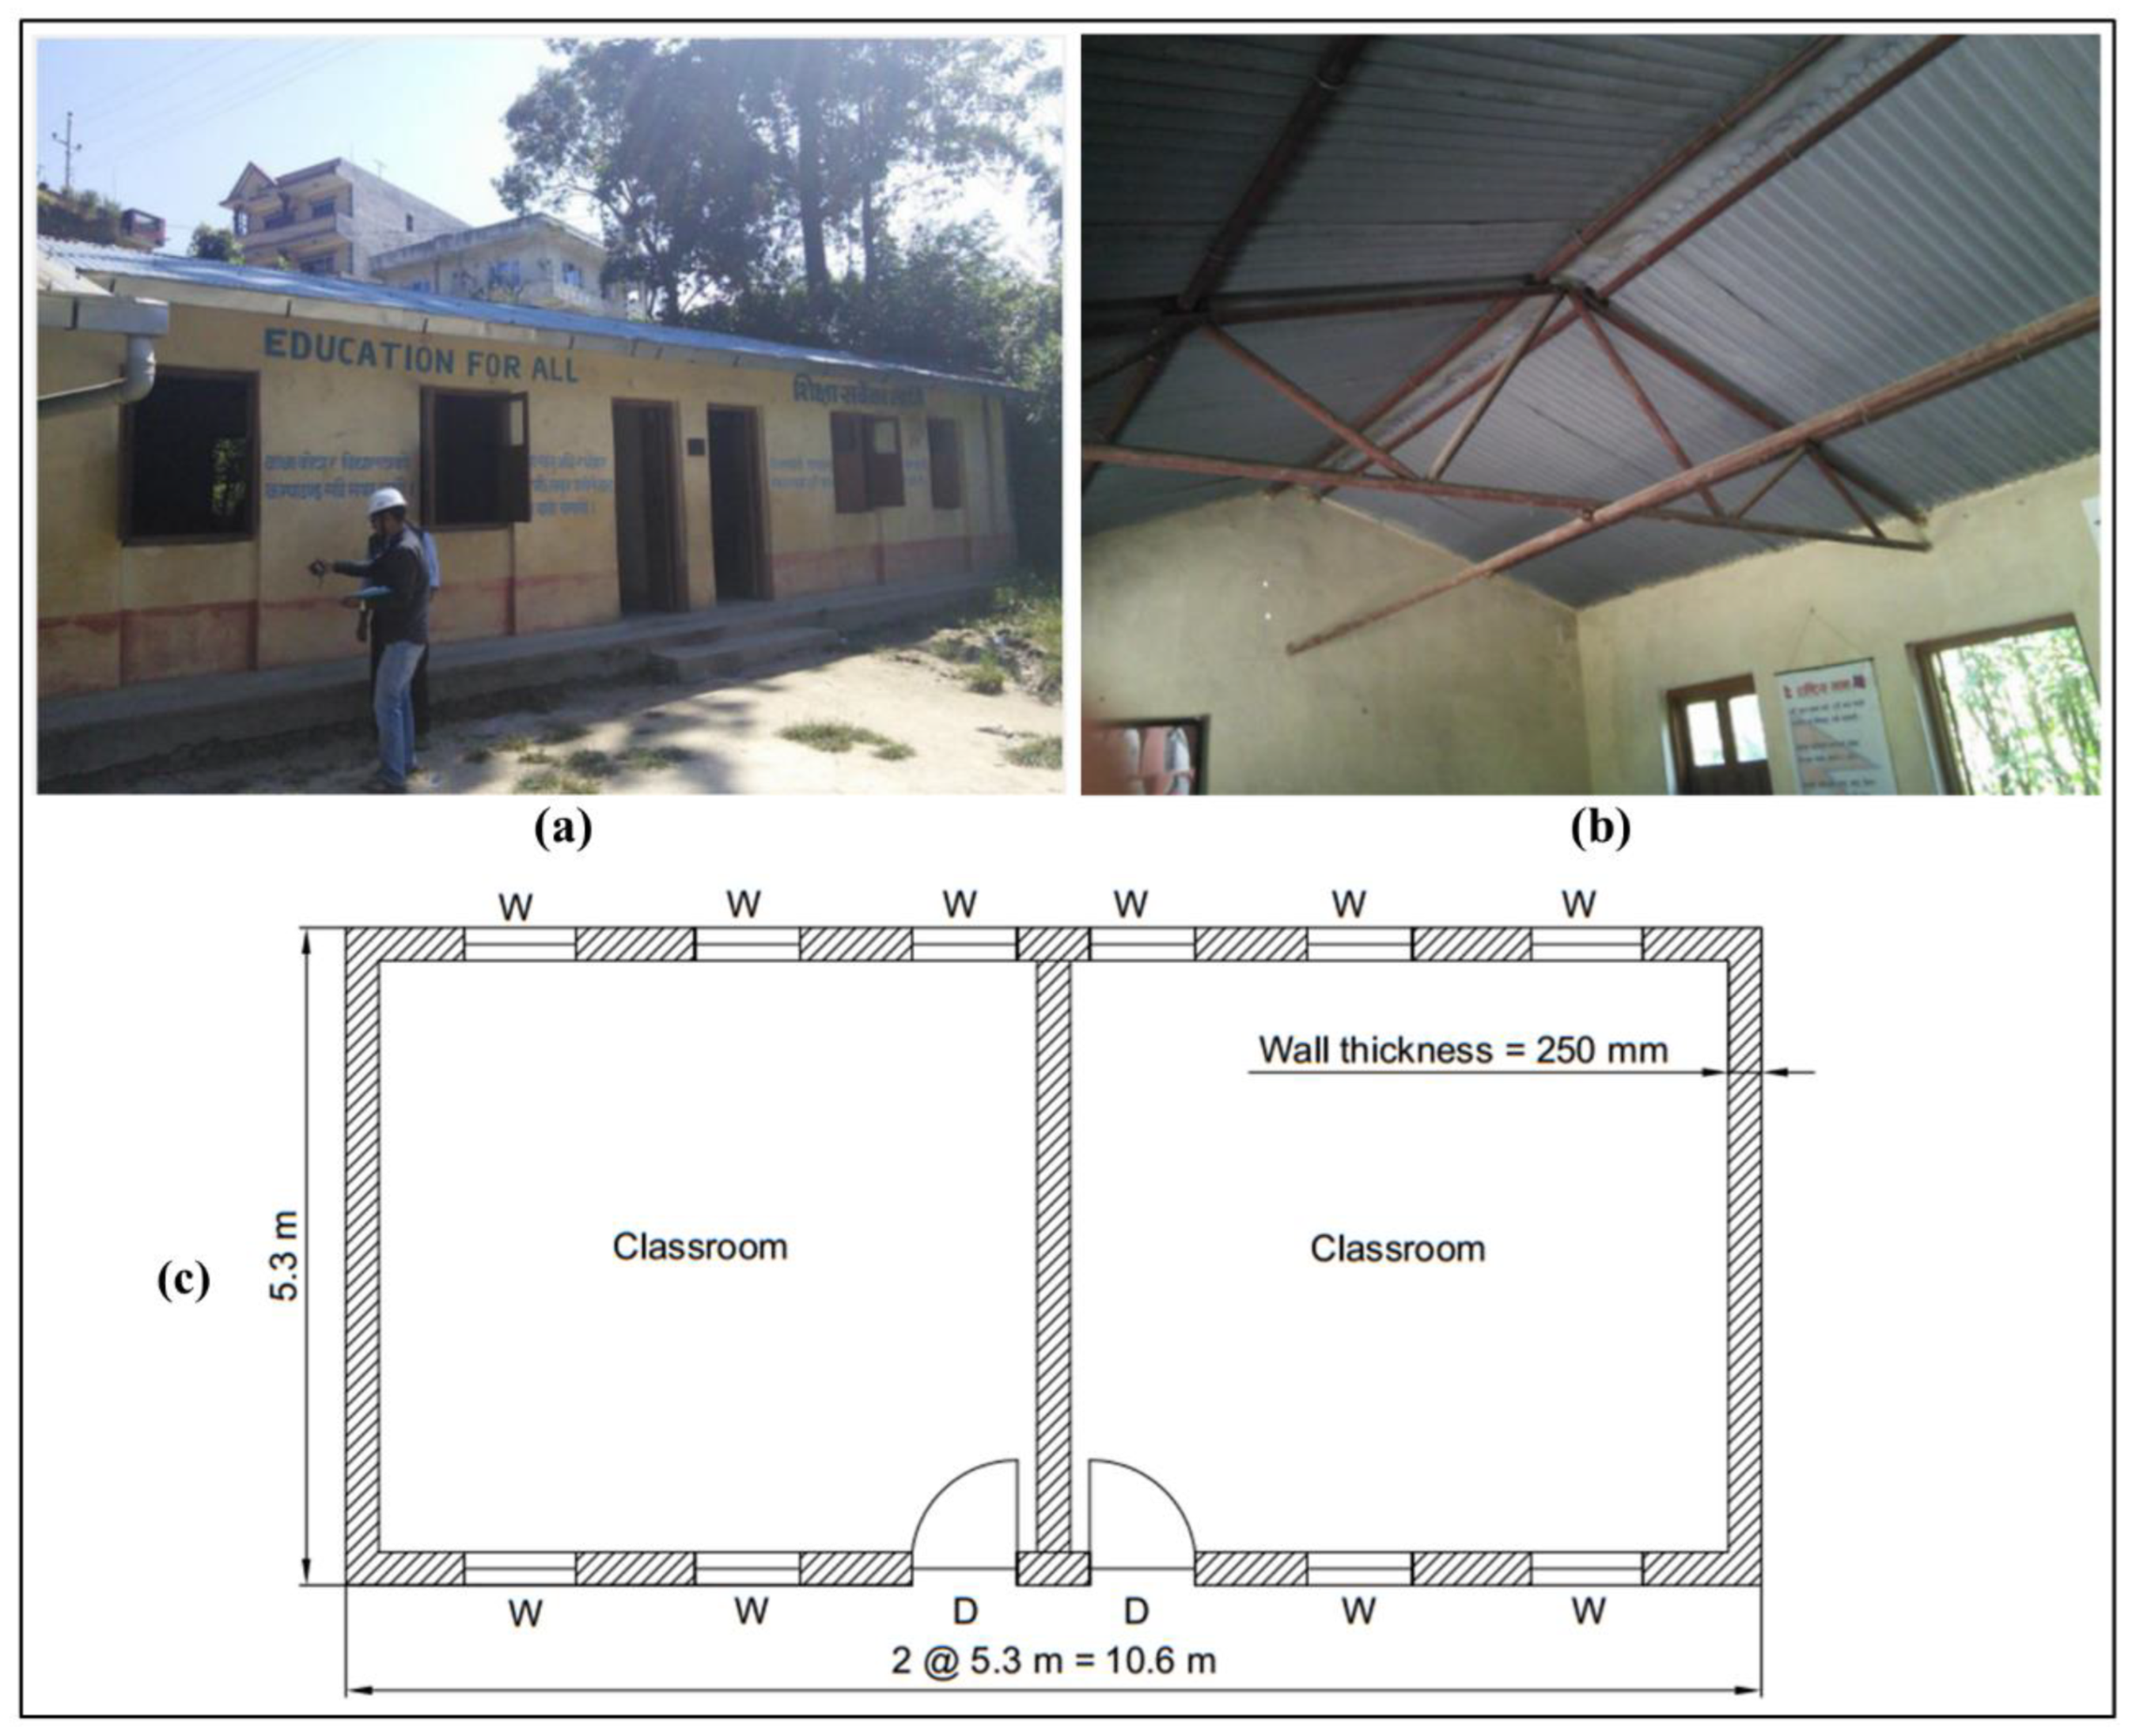
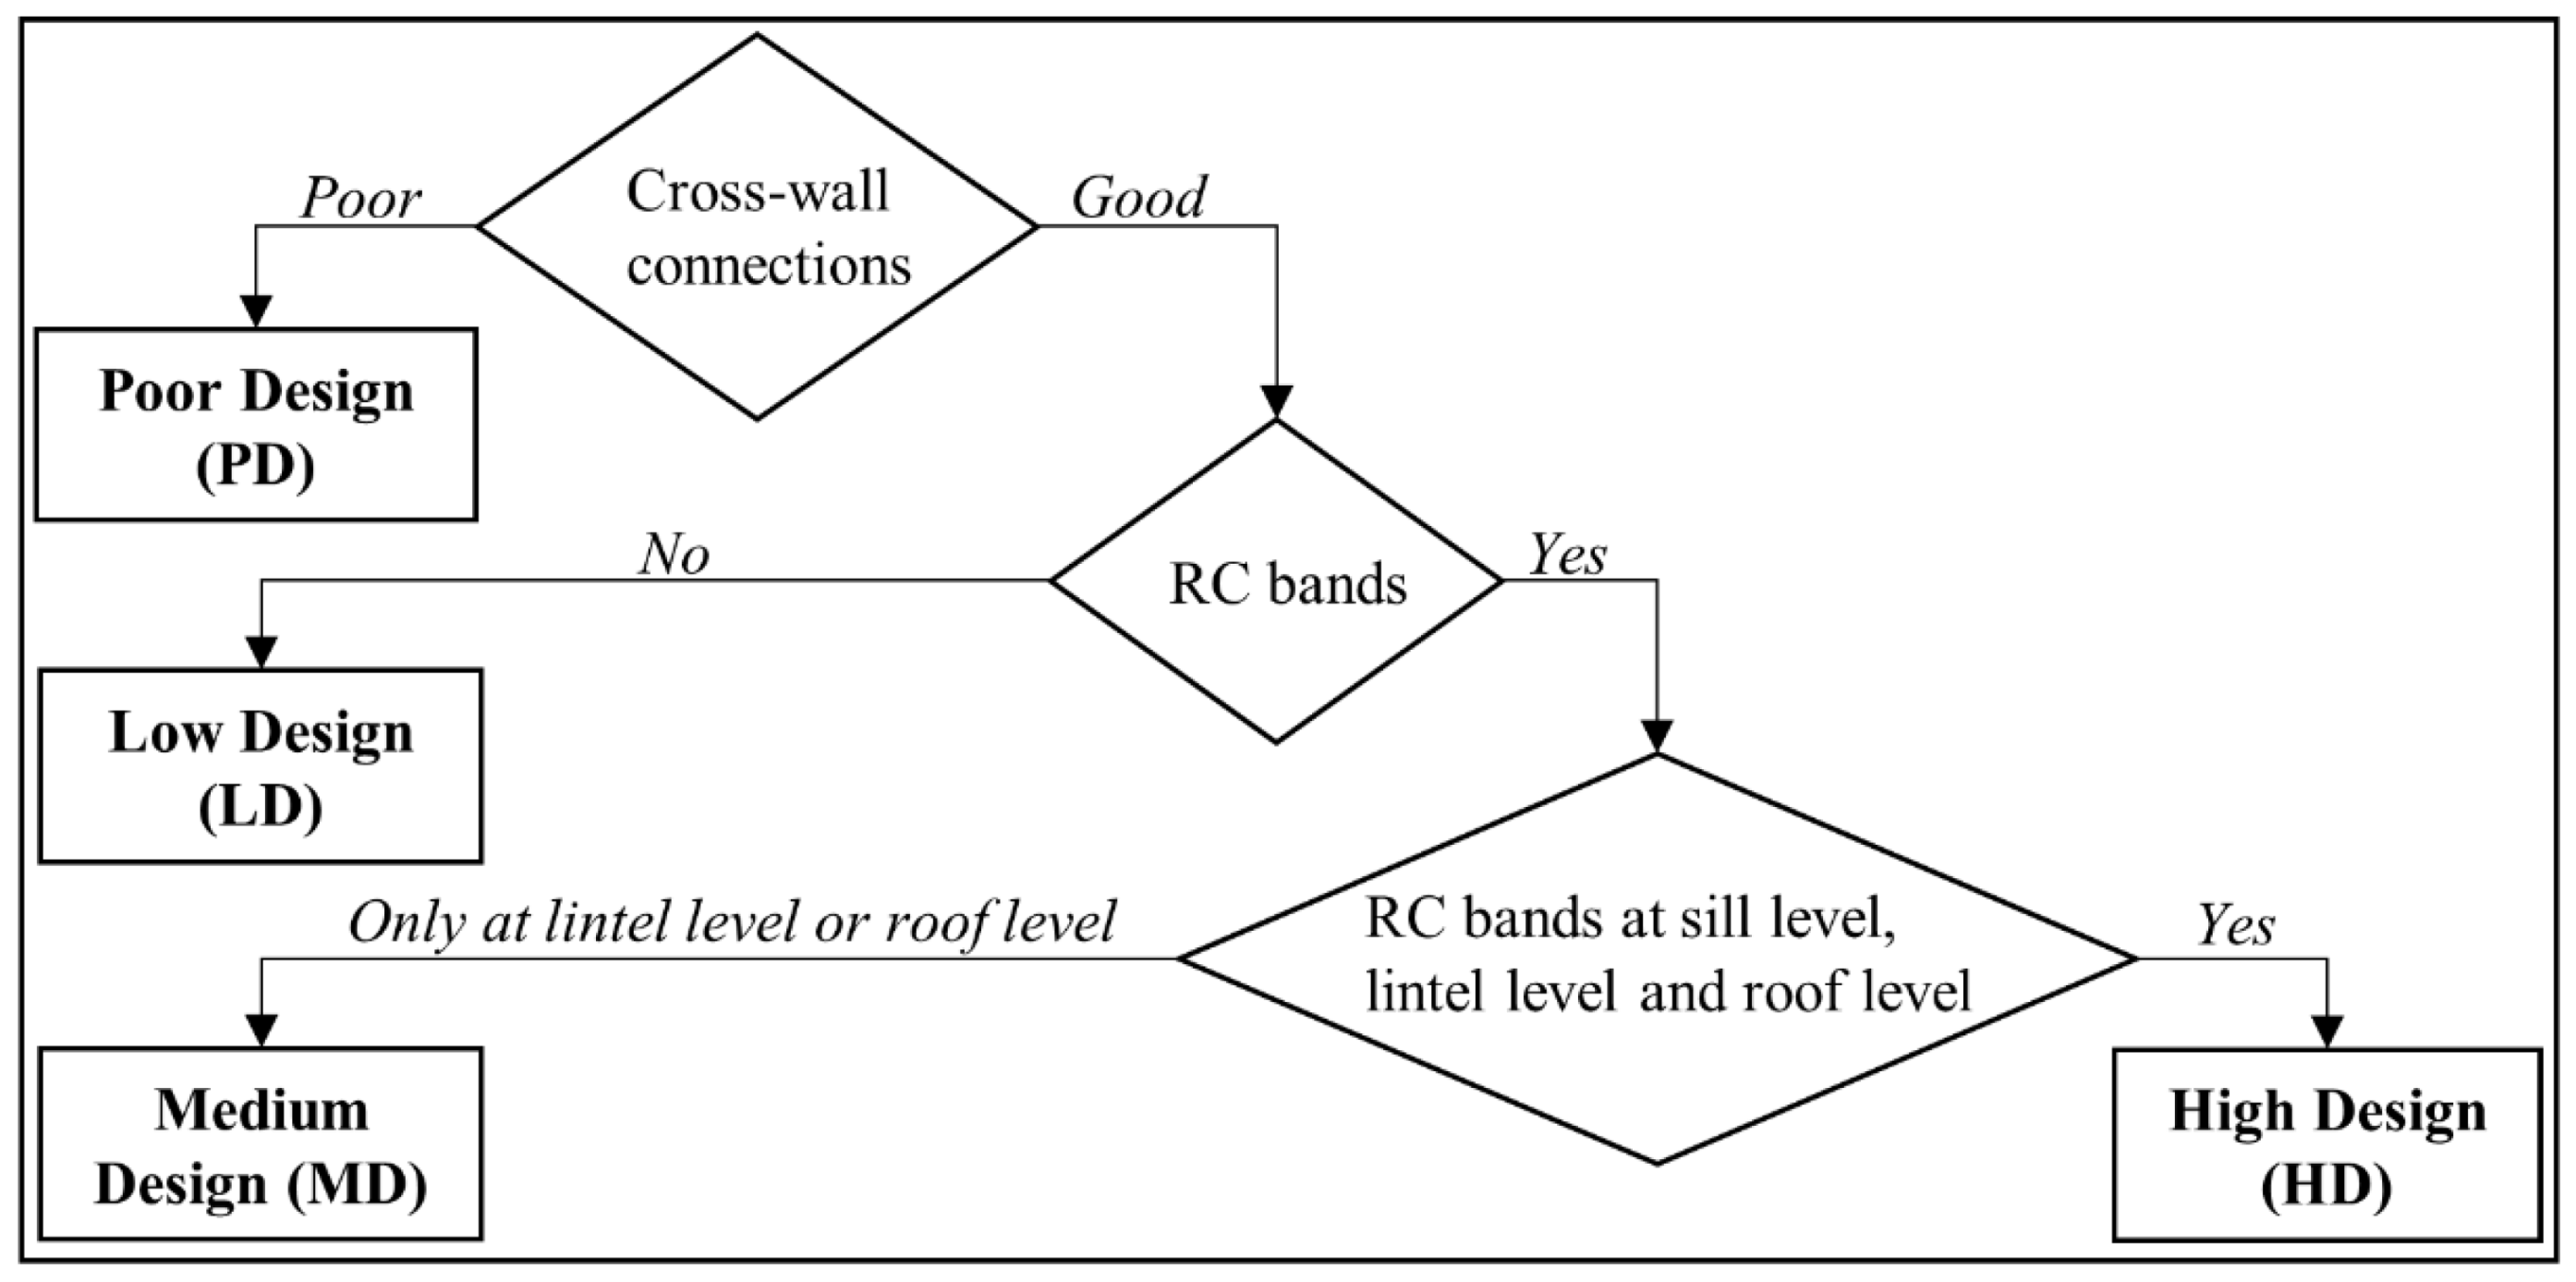
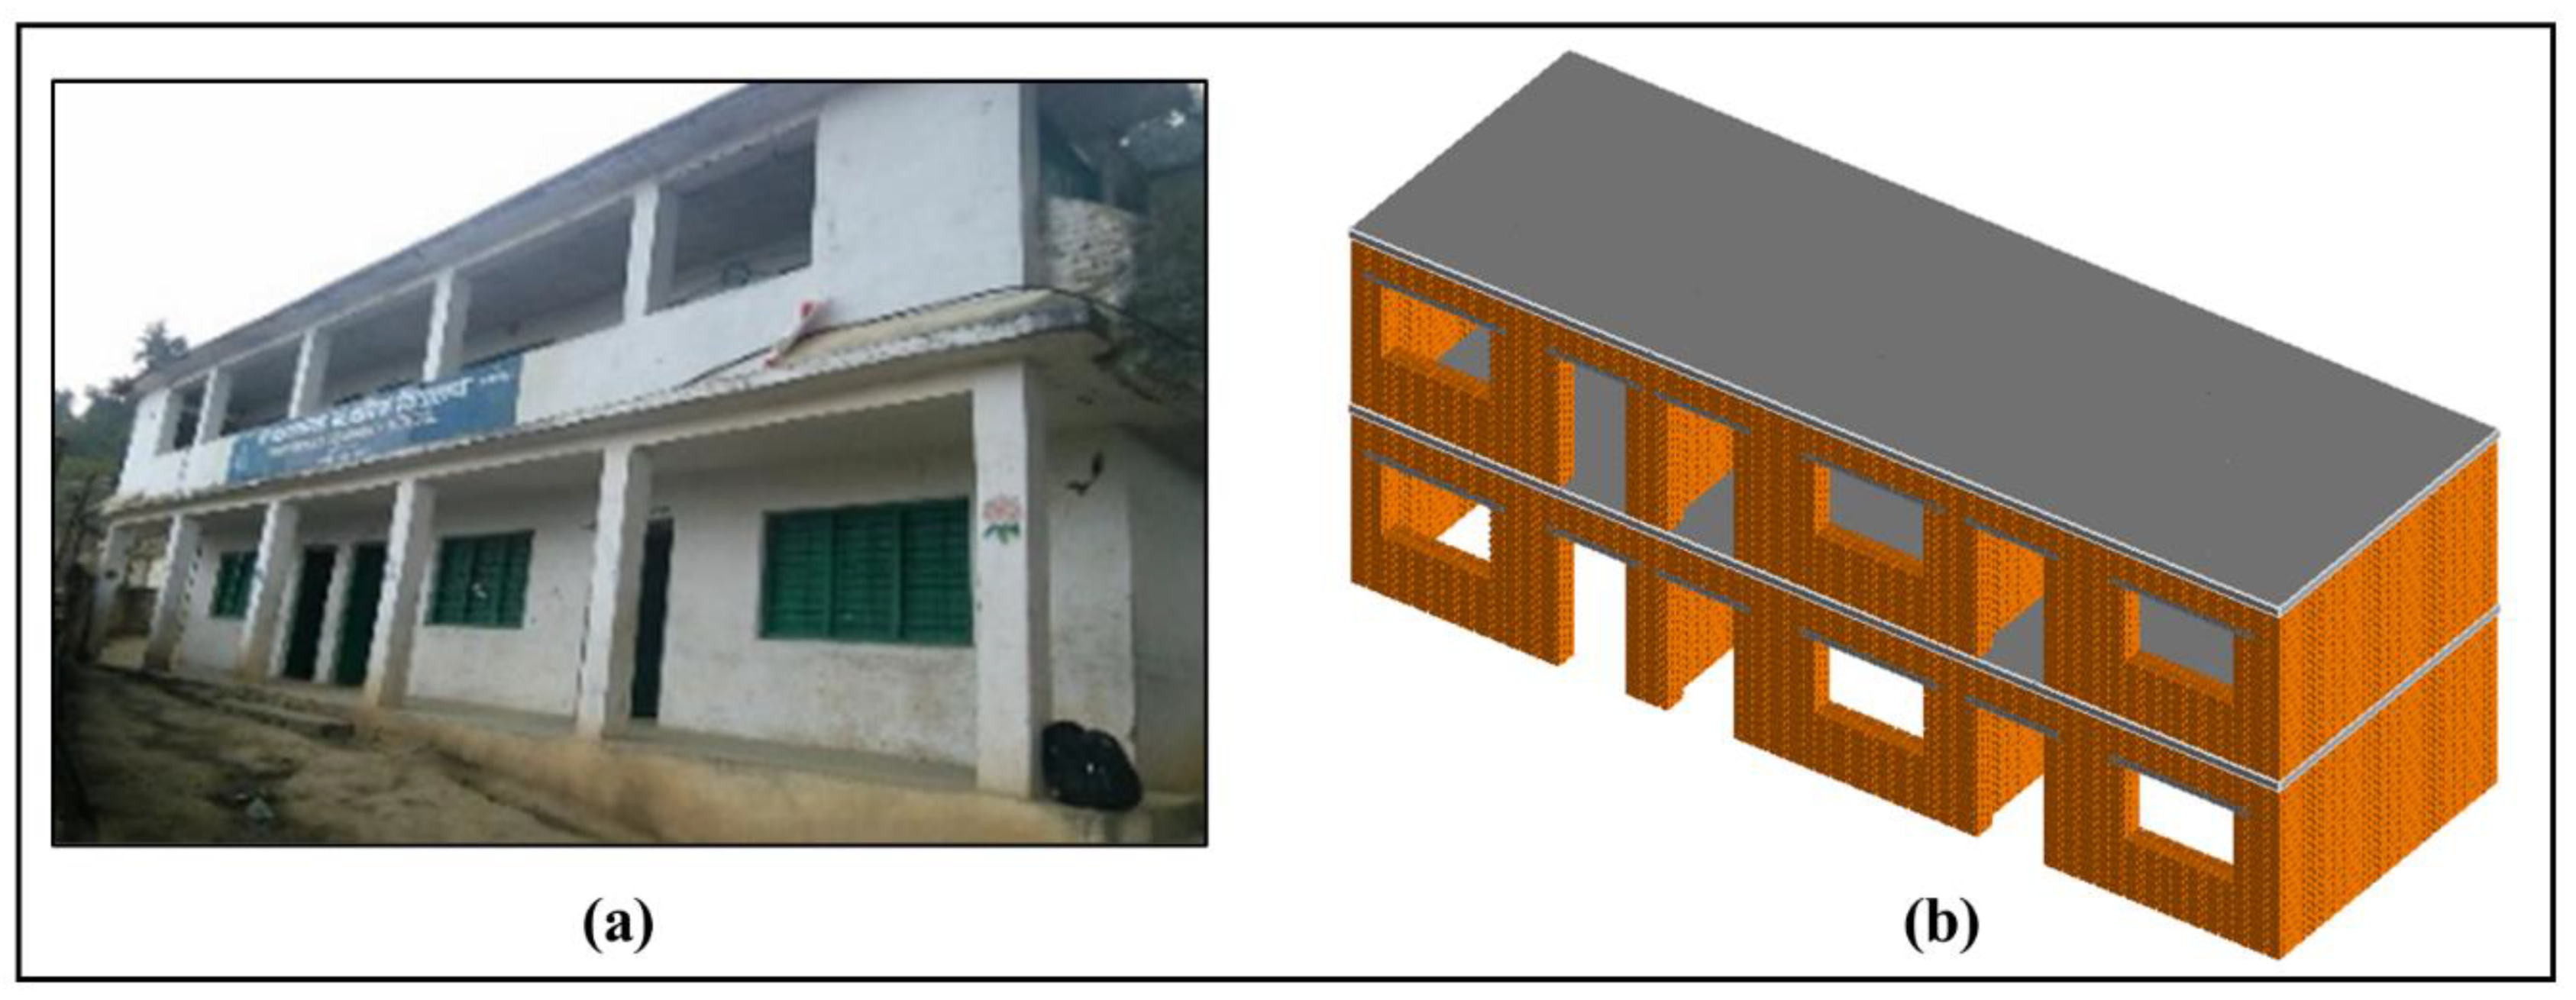
3. Case Study Buildings

To demonstrate the application of the methodology outlined in Section 2, two different masonry typologies are considered: URM and CM. Within each typology, further variations in their construction features are also considered, in order to show the need for different assessment strategies, to reflect the variation in construction features. A globally applicable classification system known as the GLOSI Taxonomy [1,88] is applied to recognize seismically relevant features of the case study buildings and to highlight the differences between them, thus identifying the generic typology they represent. The GLOSI taxonomy system is a comprehensive taxonomy that is tailored to all the major school building types; including RC, URM, and CM [3,88] typologies and incorporating both engineered and non-engineered construction features. The taxonomy includes twelve different parameters, which include three primary parameters (main structural system, height range, and seismic design level) and nine secondary parameters (e.g., diaphragm type, irregularity, and opening type, among others). Readers are referred to Adhikari et al. [88] for more details on the GLOSI taxonomy. Applying such a taxonomy in the seismic analysis of different typologies of buildings can provide a uniform language and clarity during comparison of the vulnerability and risk within and across typologies. In this work, for brevity, only the primary parameters up to the seismic design level are used to represent the case study buildings.
Descriptions of the case study buildings, identified using their GLOSI taxonomy strings, are presented in Section 3.1 and Section 3.2.

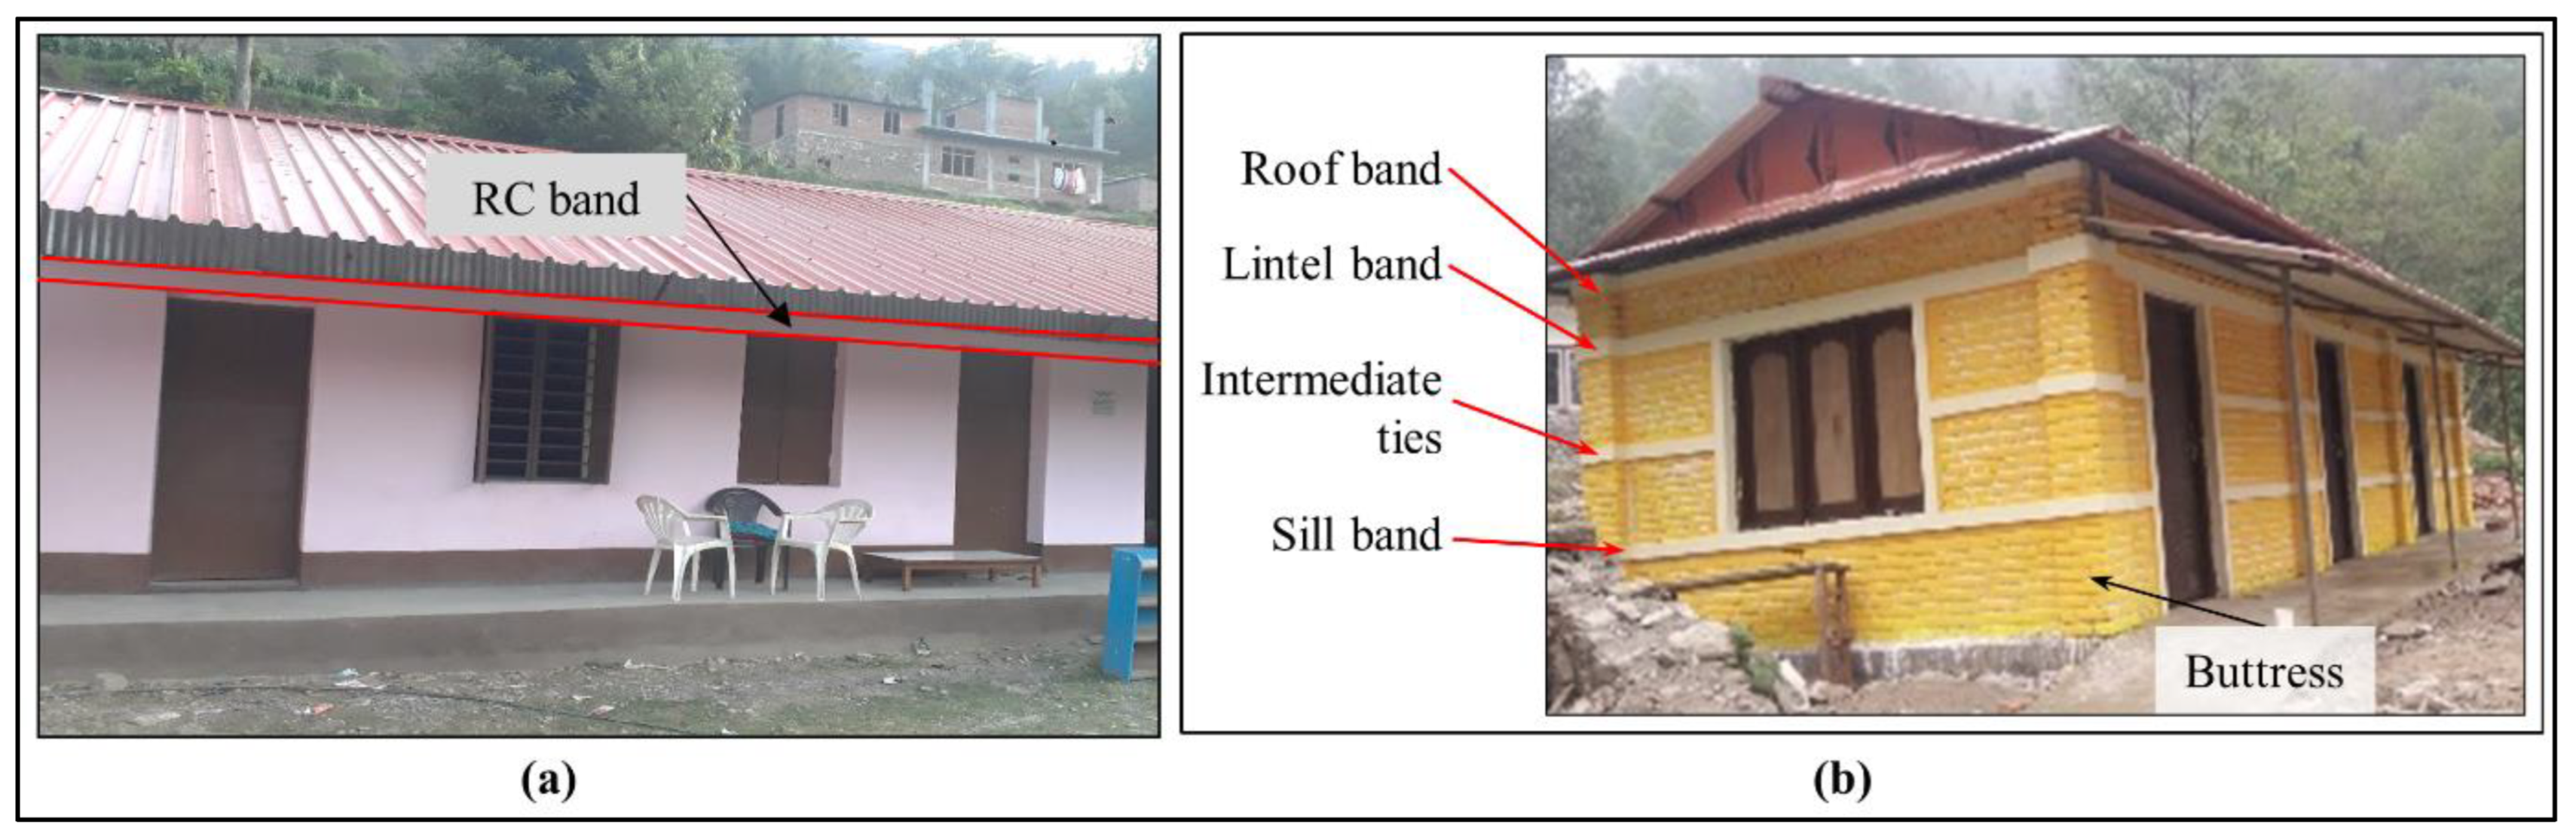
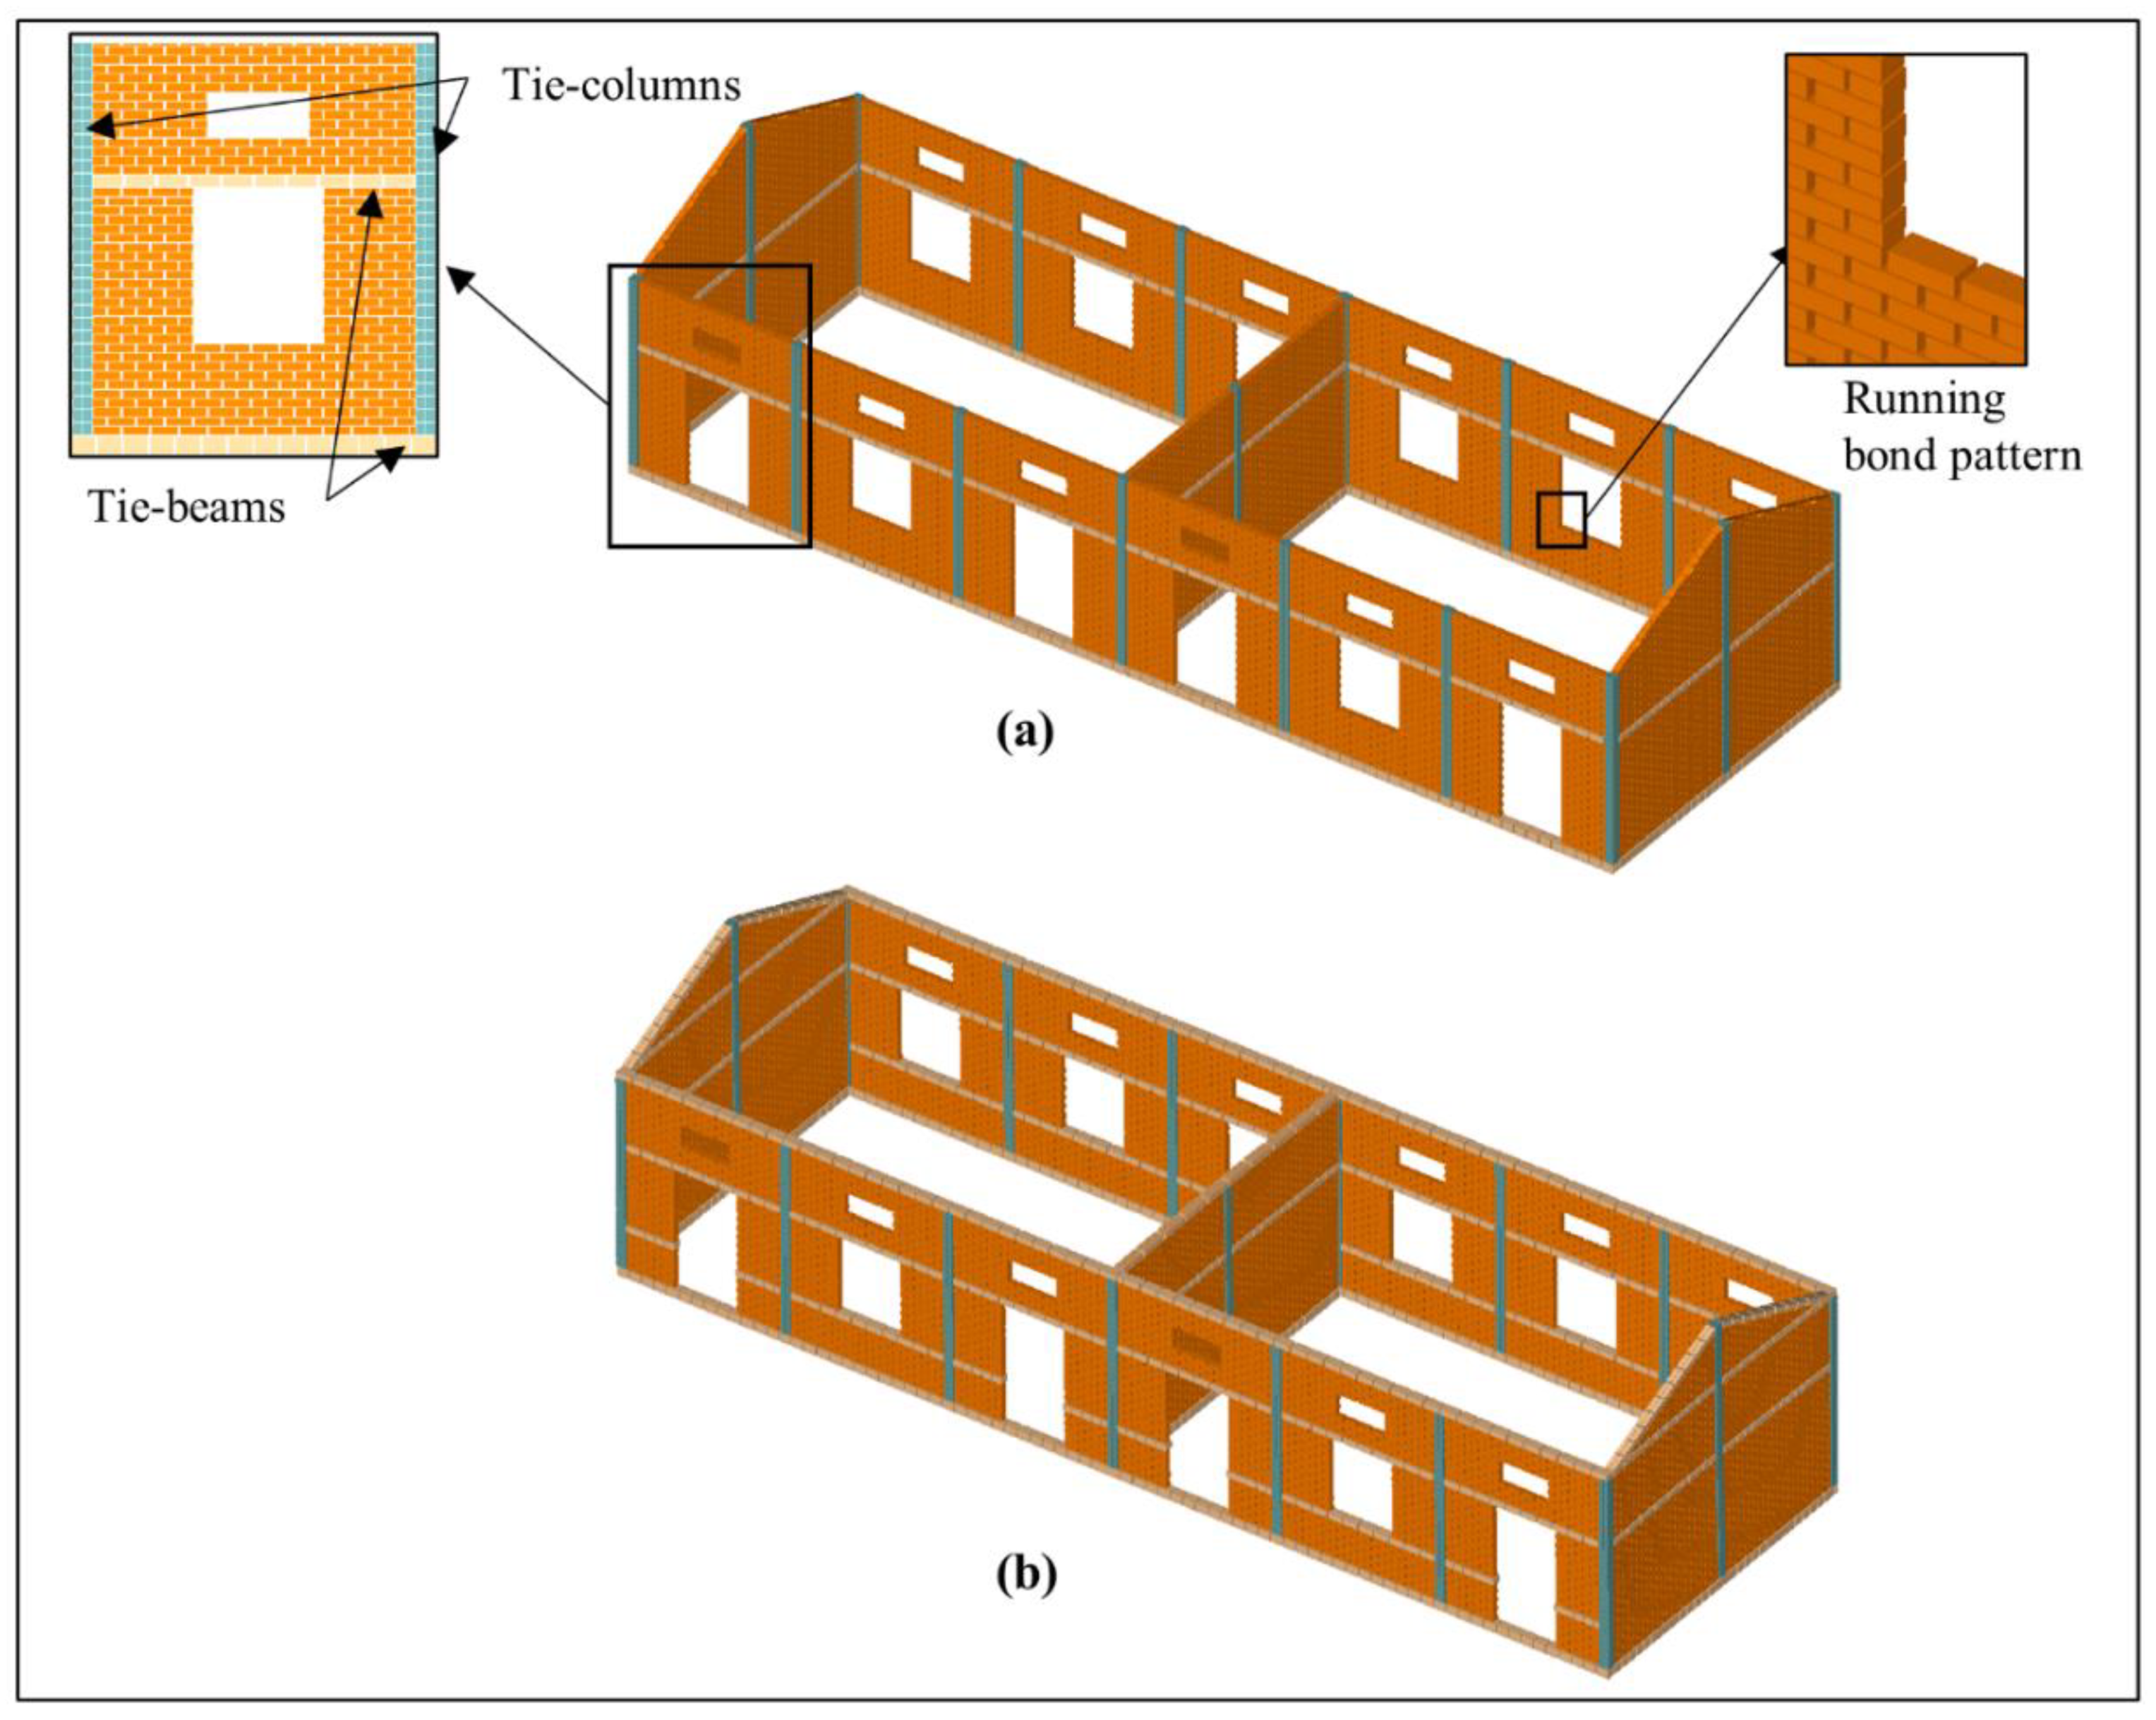
3.1. Unreinforced Masonry

The case study buildings for the URM were taken from the Nepalese school database collected by The World Bank [89] after the 2015 Gorkha earthquake. Although building plans and configurations vary across schools, a generic IB representative of the brick in cement mortar typology (Figure 3) was chosen. The storey height is 2.8 m. This typology represents about 11% of the total portfolio of Nepalese schools and also represents more than 90% of the masonry school buildings, in terms of the plan configuration and expected lateral behaviour, as influenced by the flexible type of roof structure [64]. These URM walls were built in an English bond pattern. In order to investigate the effect of different construction features on the seismic response, three different cases with different seismic design levels were considered, with the criteria for choosing a particular design level given in Figure 4. The first case, i.e., baseline IB, is the low design case (Figure 3), whose taxonomy string is given as URM7/LR/LD, as per the GLOSI taxonomy [88], where URM7 represents a specific masonry typology, i.e., brick in cement mortar masonry, LR represents low-rise, and LD represents a low level of seismic design.
The second case, URM7/LR/MD IB, is a medium design (MD) level, due to the presence of a roof band. This IB can also represent a retrofitted structure, strengthened (see Figure 5a) by removing the light roof structure, adding the RC band, and reinstalling the roof with the trusses anchored in it. Such retrofitting also provides opportunities to improve the roof condition and the connections to the vertical structures. The third case considered is URM7/LR/HD IB (Figure 5b), a high design level (HD) case, as it includes all the seismic bands recommended by the NBC 203 code [90], i.e., at window sill level, lintel level, and roof level, along with intermediate ties (see also Figure 4). It is noted that these URM IBs do not, however, possess any RC vertical elements.

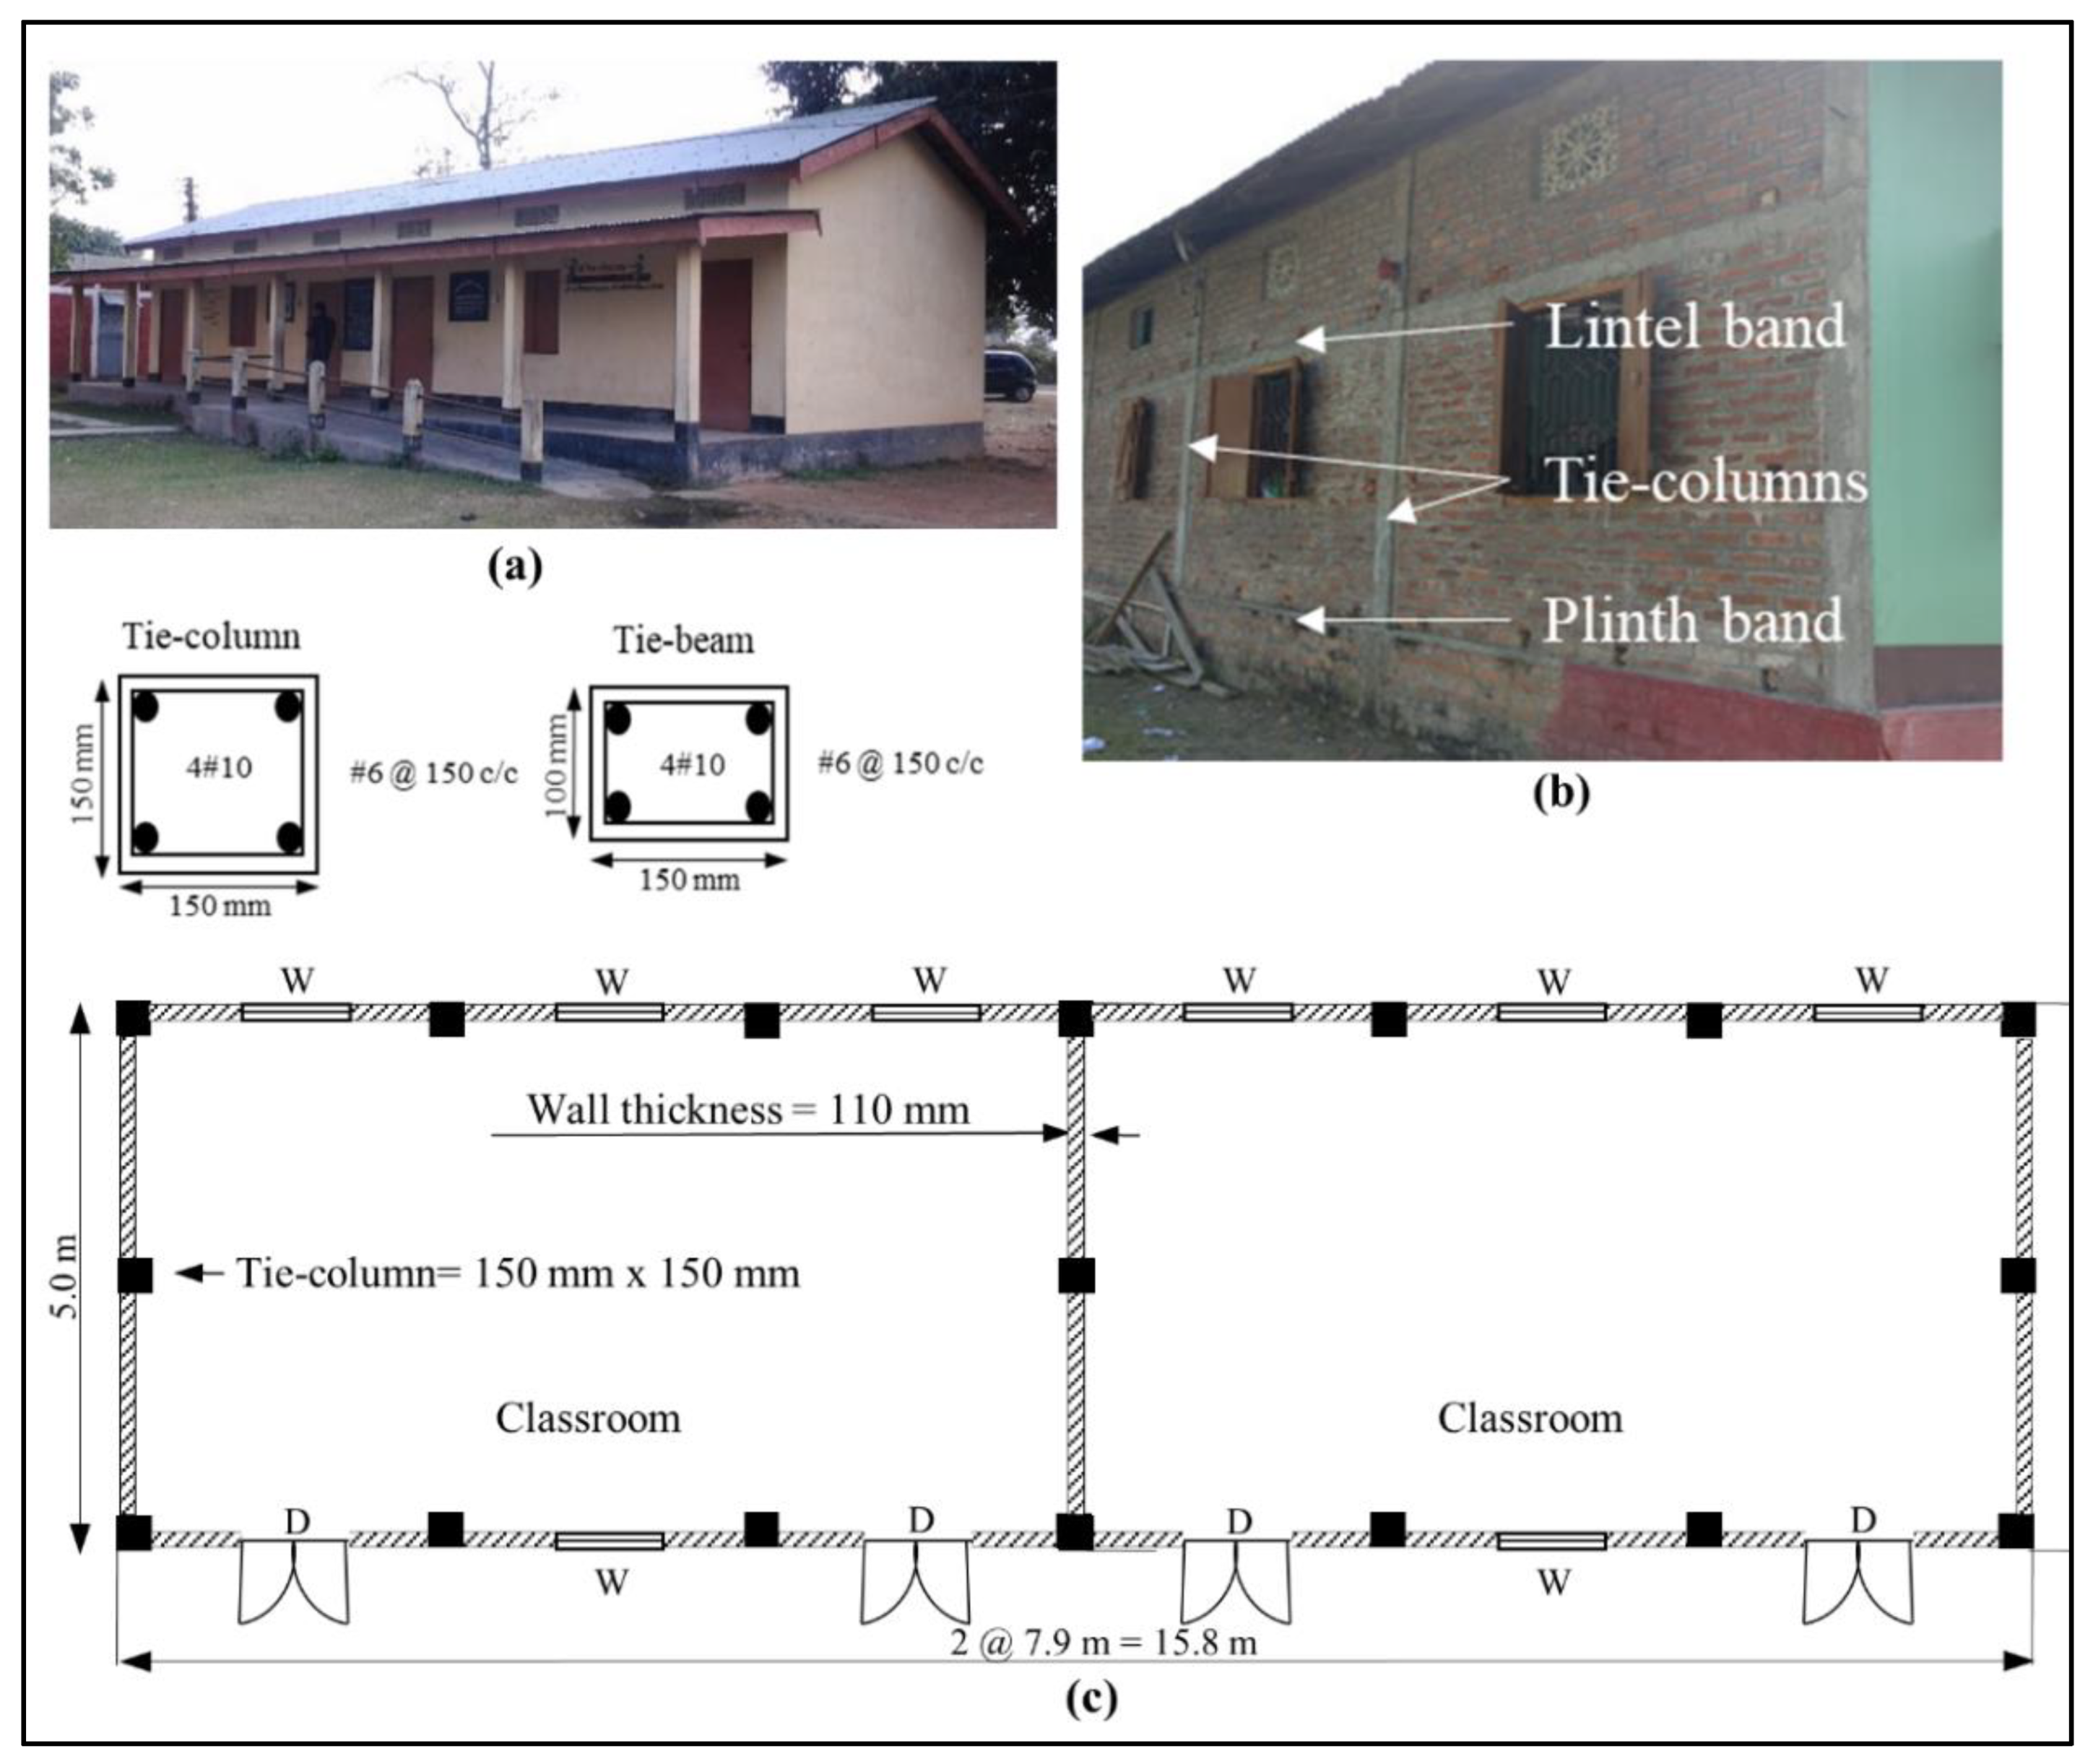
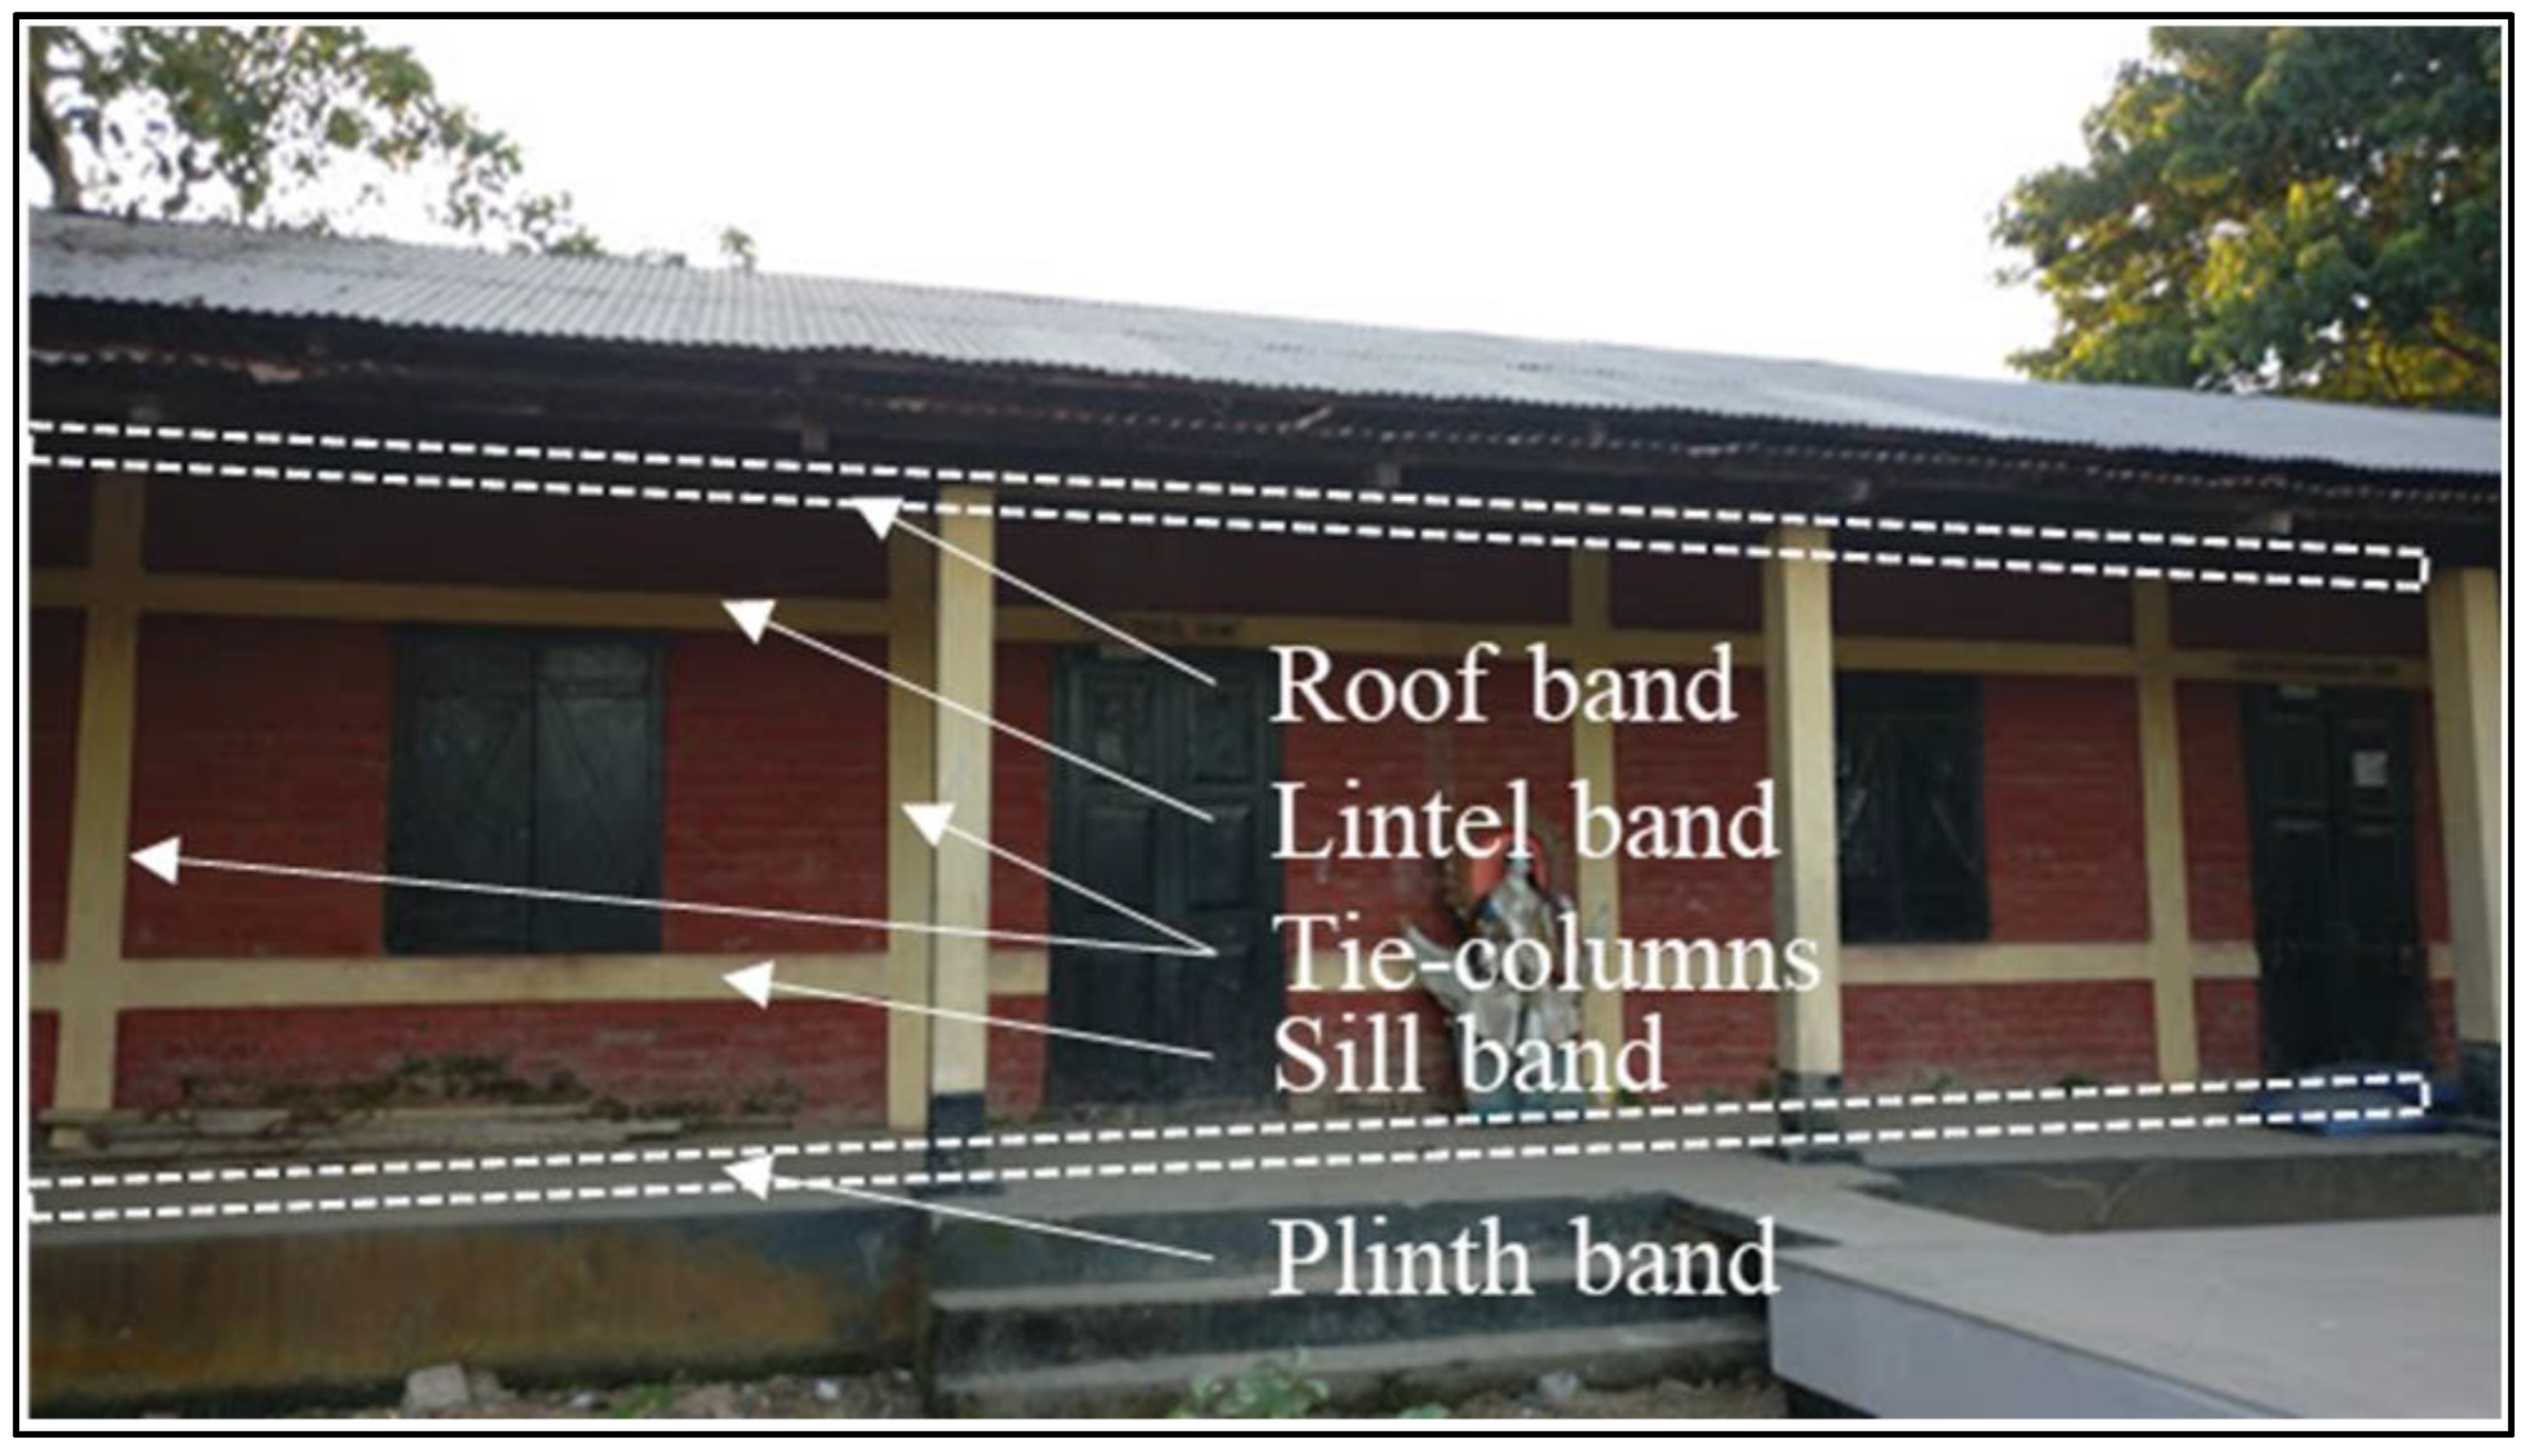
3.2. Confined Masonry

The seismic performance of CM buildings mainly depends on the wall density, confinement density, and the quality of connections, which collectively define the level of seismic design. A classification system for CM school buildings, including partially confined typologies, presented in Vatteri and D’Ayala [3], was utilised to identify the seismic design level of the case study CM buildings (Figure 6).
The CM case study buildings were identified through desk study of a school database [91], complemented by a field survey of selected school buildings in Guwahati, India [92]. A baseline IB, CM1/LR/LD (Figure 7), representative of a CM school buildings with flexible roof structure was selected, where CM1 represents the masonry fabric in brick with cement mortar; LR represents low rise, i.e., single storied; and LD represents a low seismic design (LD) level, following the criteria in Figure 6 (i.e., presence of good connections at the masonry–RC interface and the minimum required confinement in the form of plinth and lintel tie-beams and corner and intermediate tie-columns). A complete description of the design levels and classification of non-engineered CM school buildings can be found in Vatteri and D’Ayala [3].
In order to compare the effect of improved construction practices on the seismic behaviour, a second CM building case with medium design level (CM1/LR/MD) was also considered (Figure 8). The MD level is achieved by additional confinement, in the form of tie-bands at sill and at roof levels, either included in the initial construction or through retrofitting. All geometric features of this model were considered the same as in the baseline model.

3.3. Material Properties

For numerical modelling and analysis, the input values of different material properties for the masonry material, i.e., elastic modulus, shear modulus, compressive strength, tensile strength, cohesion, and coefficient of friction, are necessary. In this study, the values of the material properties were established from the literature. Although specific studies on the materials constituting existing school buildings are not available, recent experimental works [93,94,95,96] showed that the minimum compressive strength for Nepalese bricks and cement-sand mortar are in the order of 5.0 MPa and 3.0 MPa, respectively. Key material properties for the URM IBs were taken from Guragain [50], who carried out an in situ mechanical characterization test on existing brick masonry buildings in Nepal (Table 1). Most of the existing Nepalese masonry schools built before the 2015 Gorkha earthquake are community-built constructions, without any formal quality control or input from trained engineers [97]. Accordingly, it is noted that the material properties of these buildings can exhibit significant variability.
Material properties of the CM were adopted from Choudhury and Pathak [98] and Kaushik et al. [99], who provided experimental results on Indian clay brick masonry. Other influential material parameters not reported in that study were established from a general review of the literature and a sensitivity analysis carried out in a related study [92], and are listed in Table 1. Concrete with 20 MPa compressive strength and steel rebars of grade Fe415 were used for the concrete elements.
As per the flow chart in Figure 1, the case study IBs described in this section were modelled with the AEM approach, as detailed in Section 4 and Section 5.

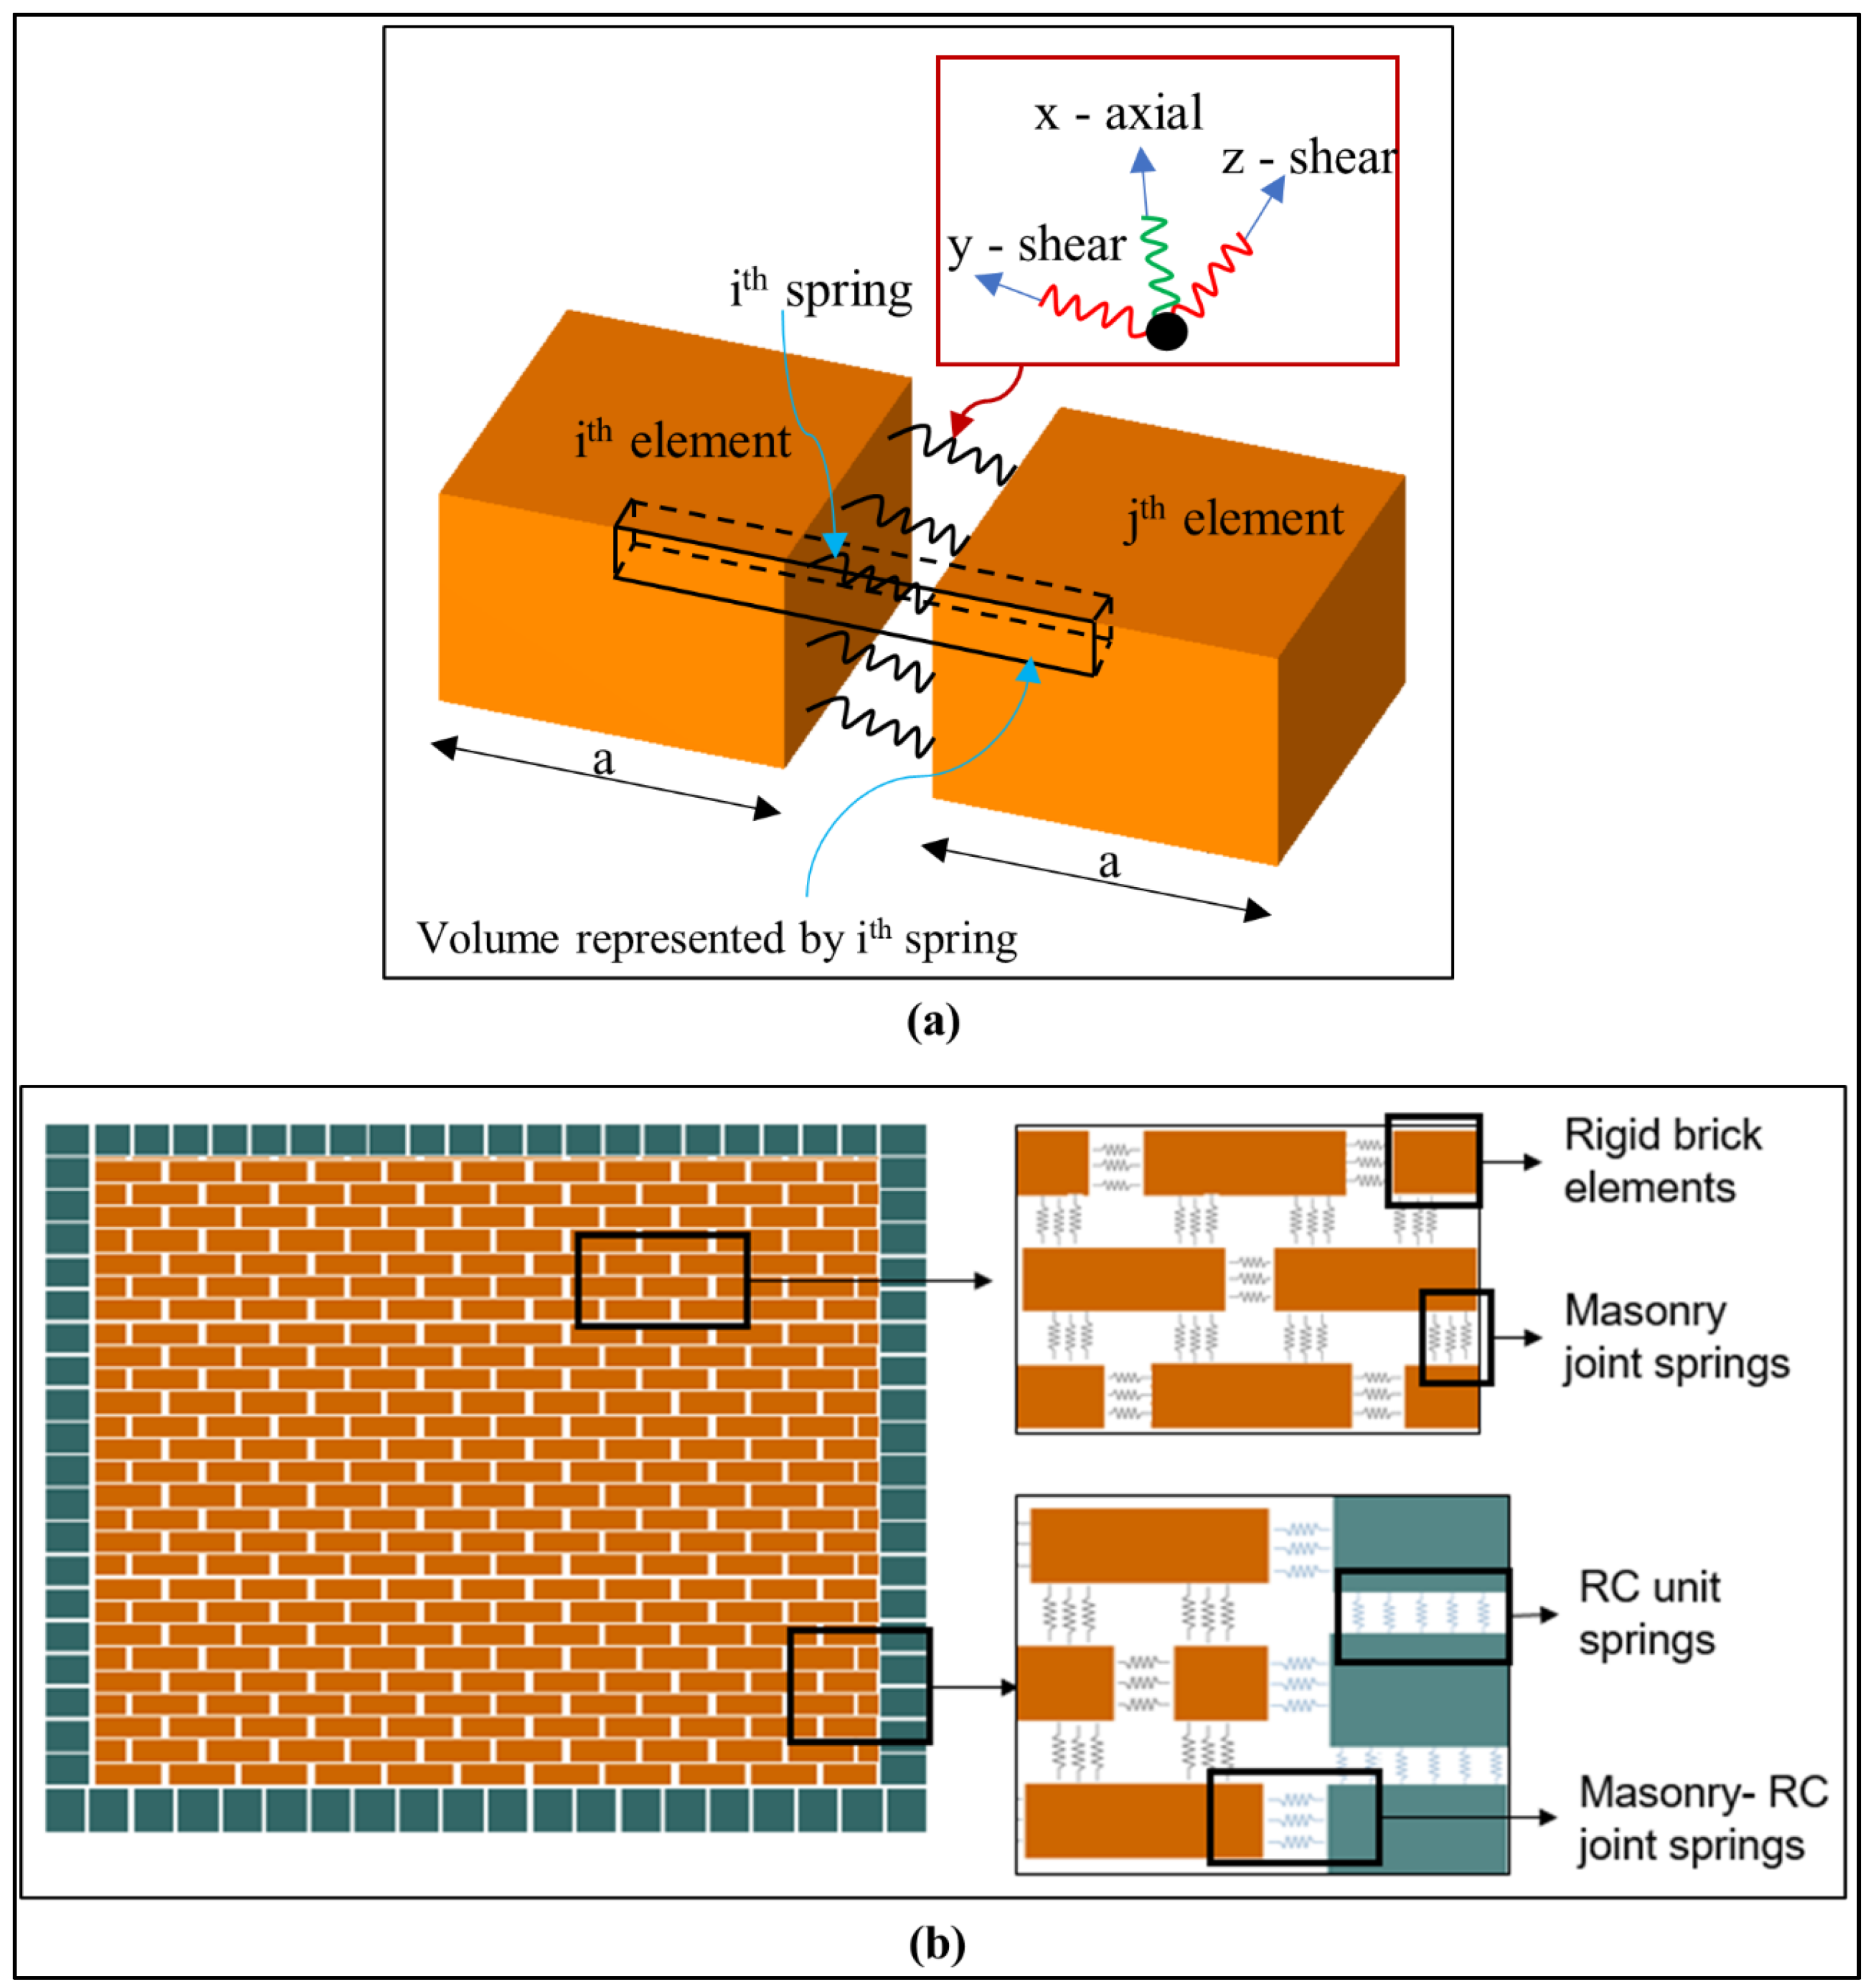
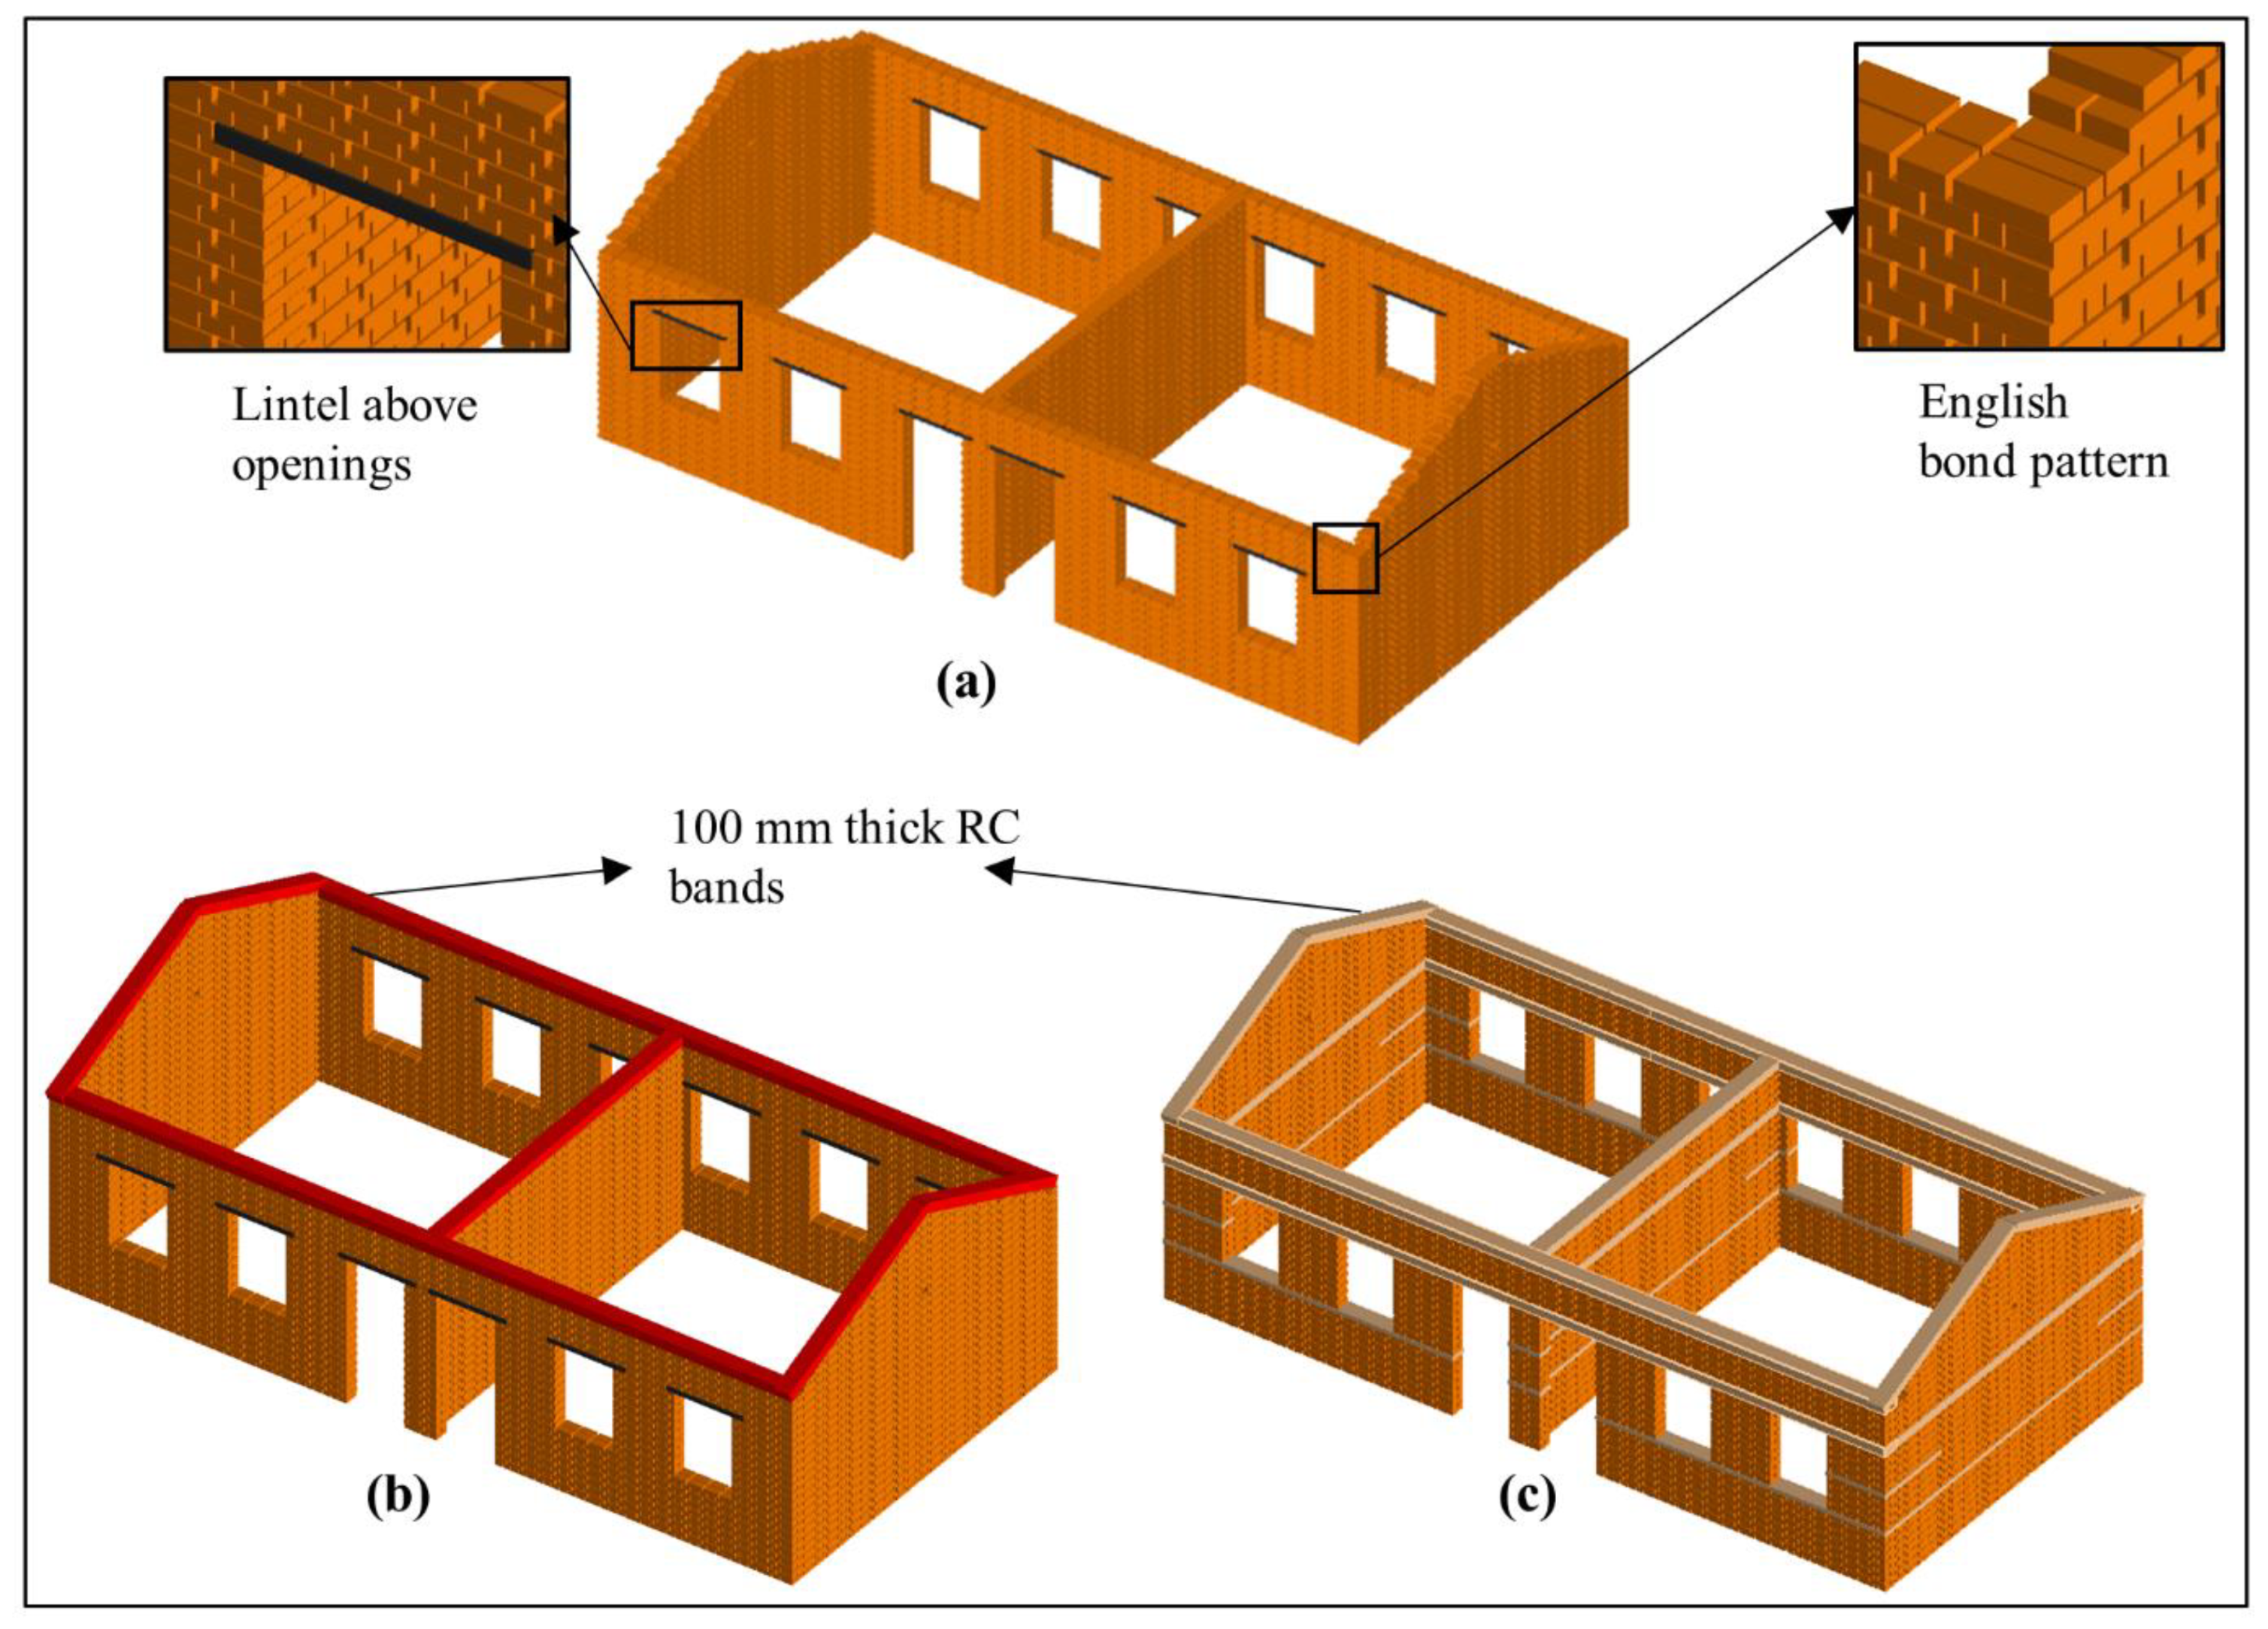
4. Masonry Modelling Using the AEM Approach

Modelling of masonry in AEM can be carried out through a simplified micro-element approach, where the applied elements, i.e., units, are connected by a set of normal and shear springs known as “joint springs”, in which the mechanical properties of the mortar and the unit–mortar interface are lumped [52]. The units can also be discretised, to include simulated damage through the bricks, in which case “unit” springs connect the applied elements of the units. The springs in AEM capture the stresses and linear/nonlinear deformations due to loading of the volume of material of the elements that these springs connect (Figure 9a). Equivalent properties for joint springs were derived from the respective portions of the unit and mortar thickness [49,51,52,64]. The Extreme Loading for Structures® (ELS) software V7.0 [105] was employed in this study to model and analyse the case study buildings.
Figure 9b illustrates the modelling of CM using the AEM approach, following the real configuration of the CM walls. The mortar joints and the interface between the mortar and the brick units were lumped and modelled using a zero-thickness interface spring known as a “joint spring”. Similarly, the RC-masonry interface was also modelled using such joint springs, as illustrated in Figure 9b, whose stiffness and strength properties were derived based on the properties of the RC and masonry elements, as well as the level of connectivity at the interface (see further details in Section 5). Non-linear material models for concrete, steel, and masonry, implemented in the ELS software were utilised in this study, details of which can be found elsewhere in the literature [46,48,52,64].

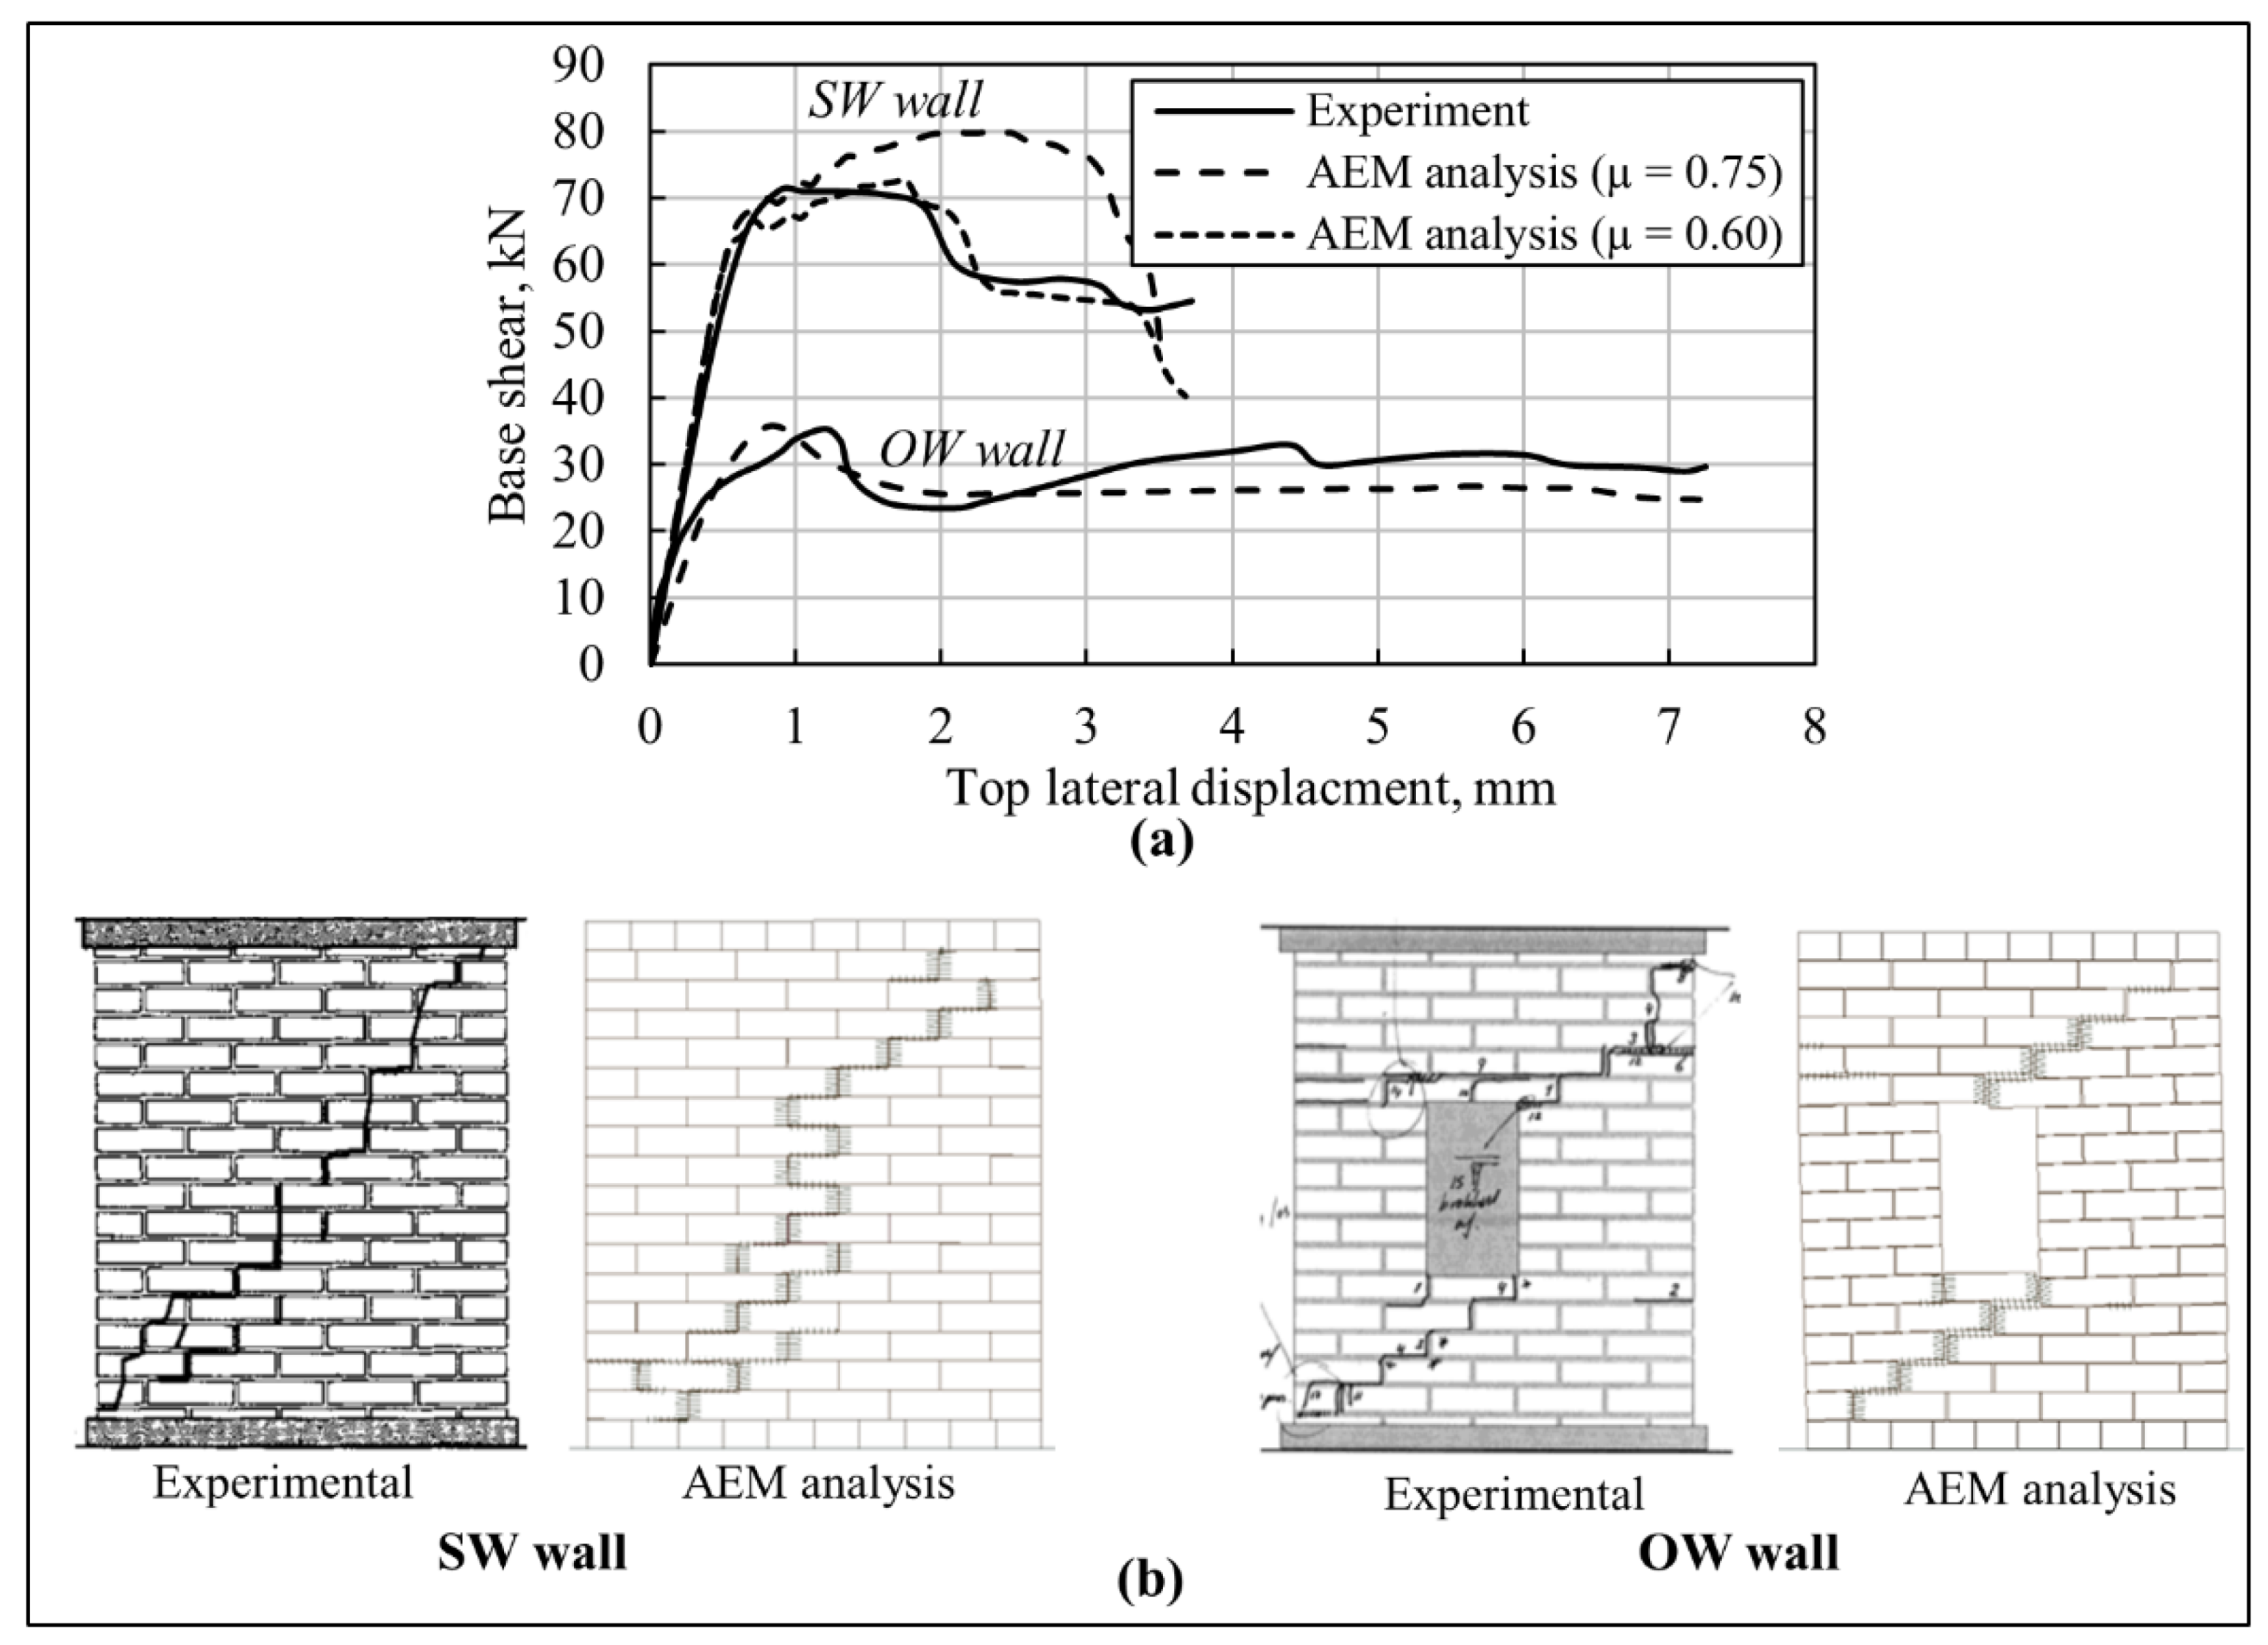
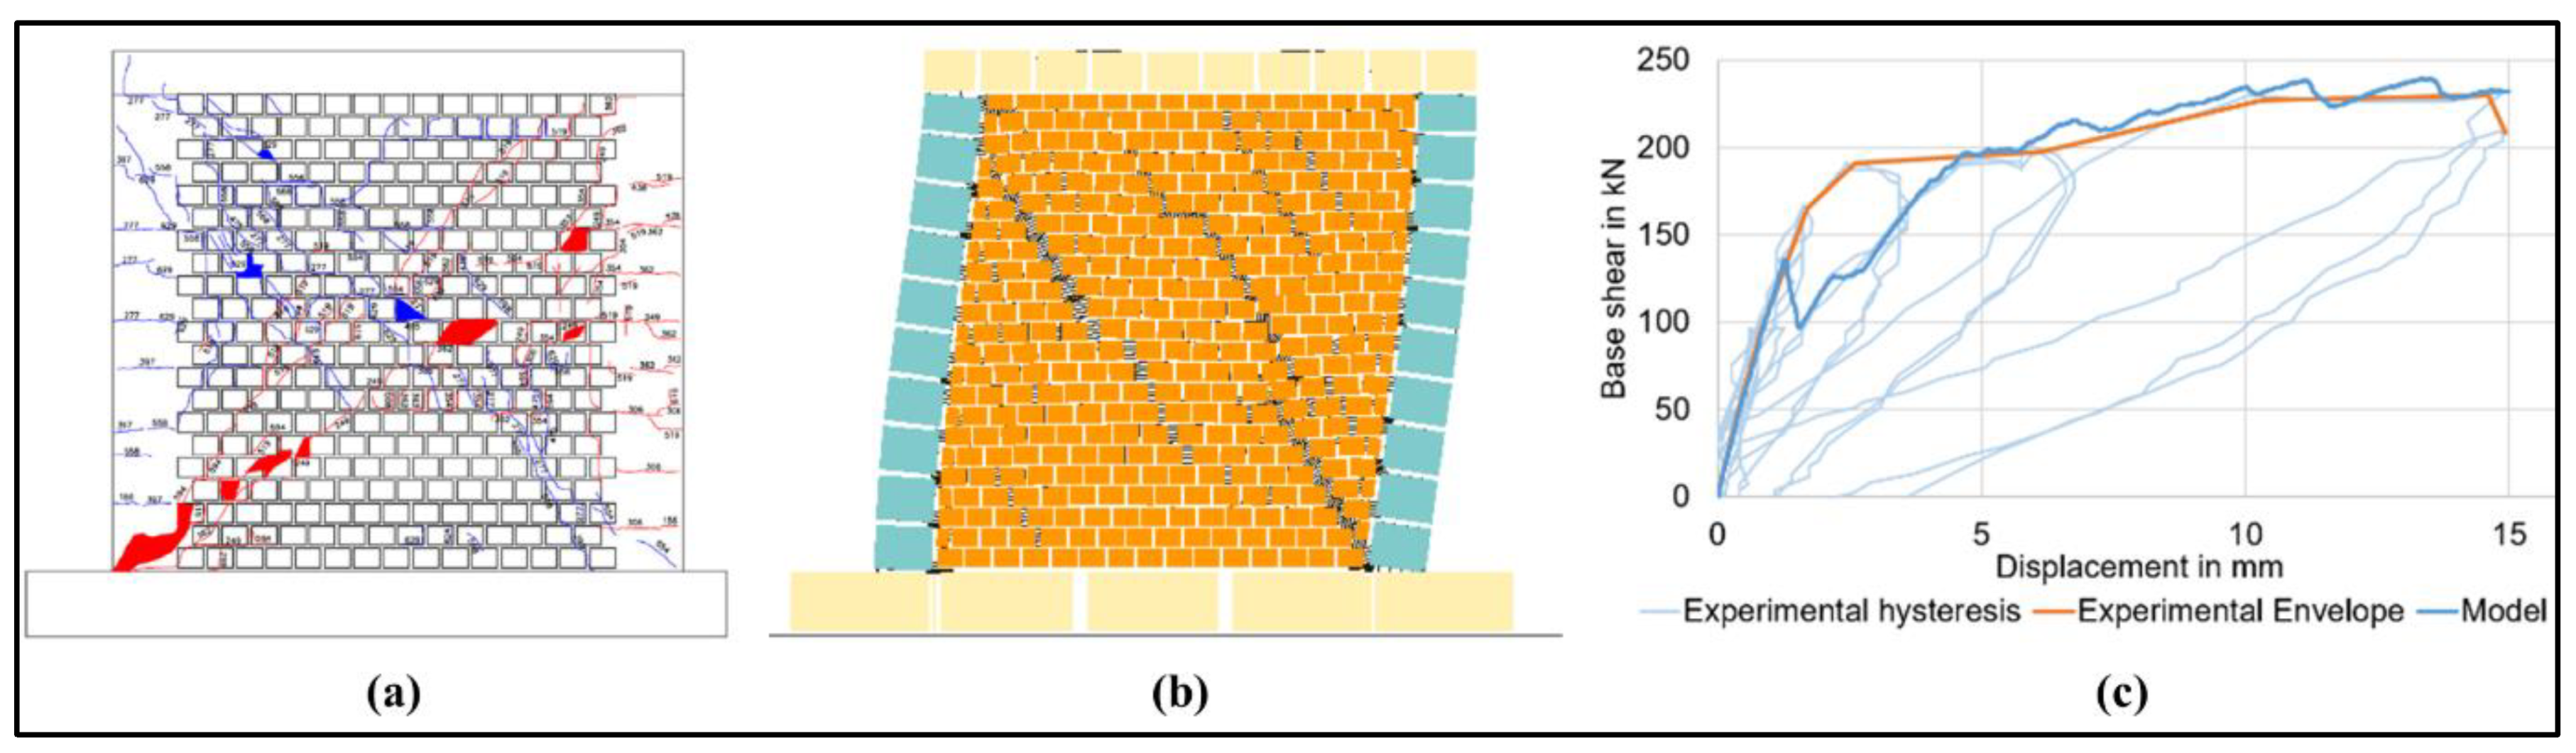
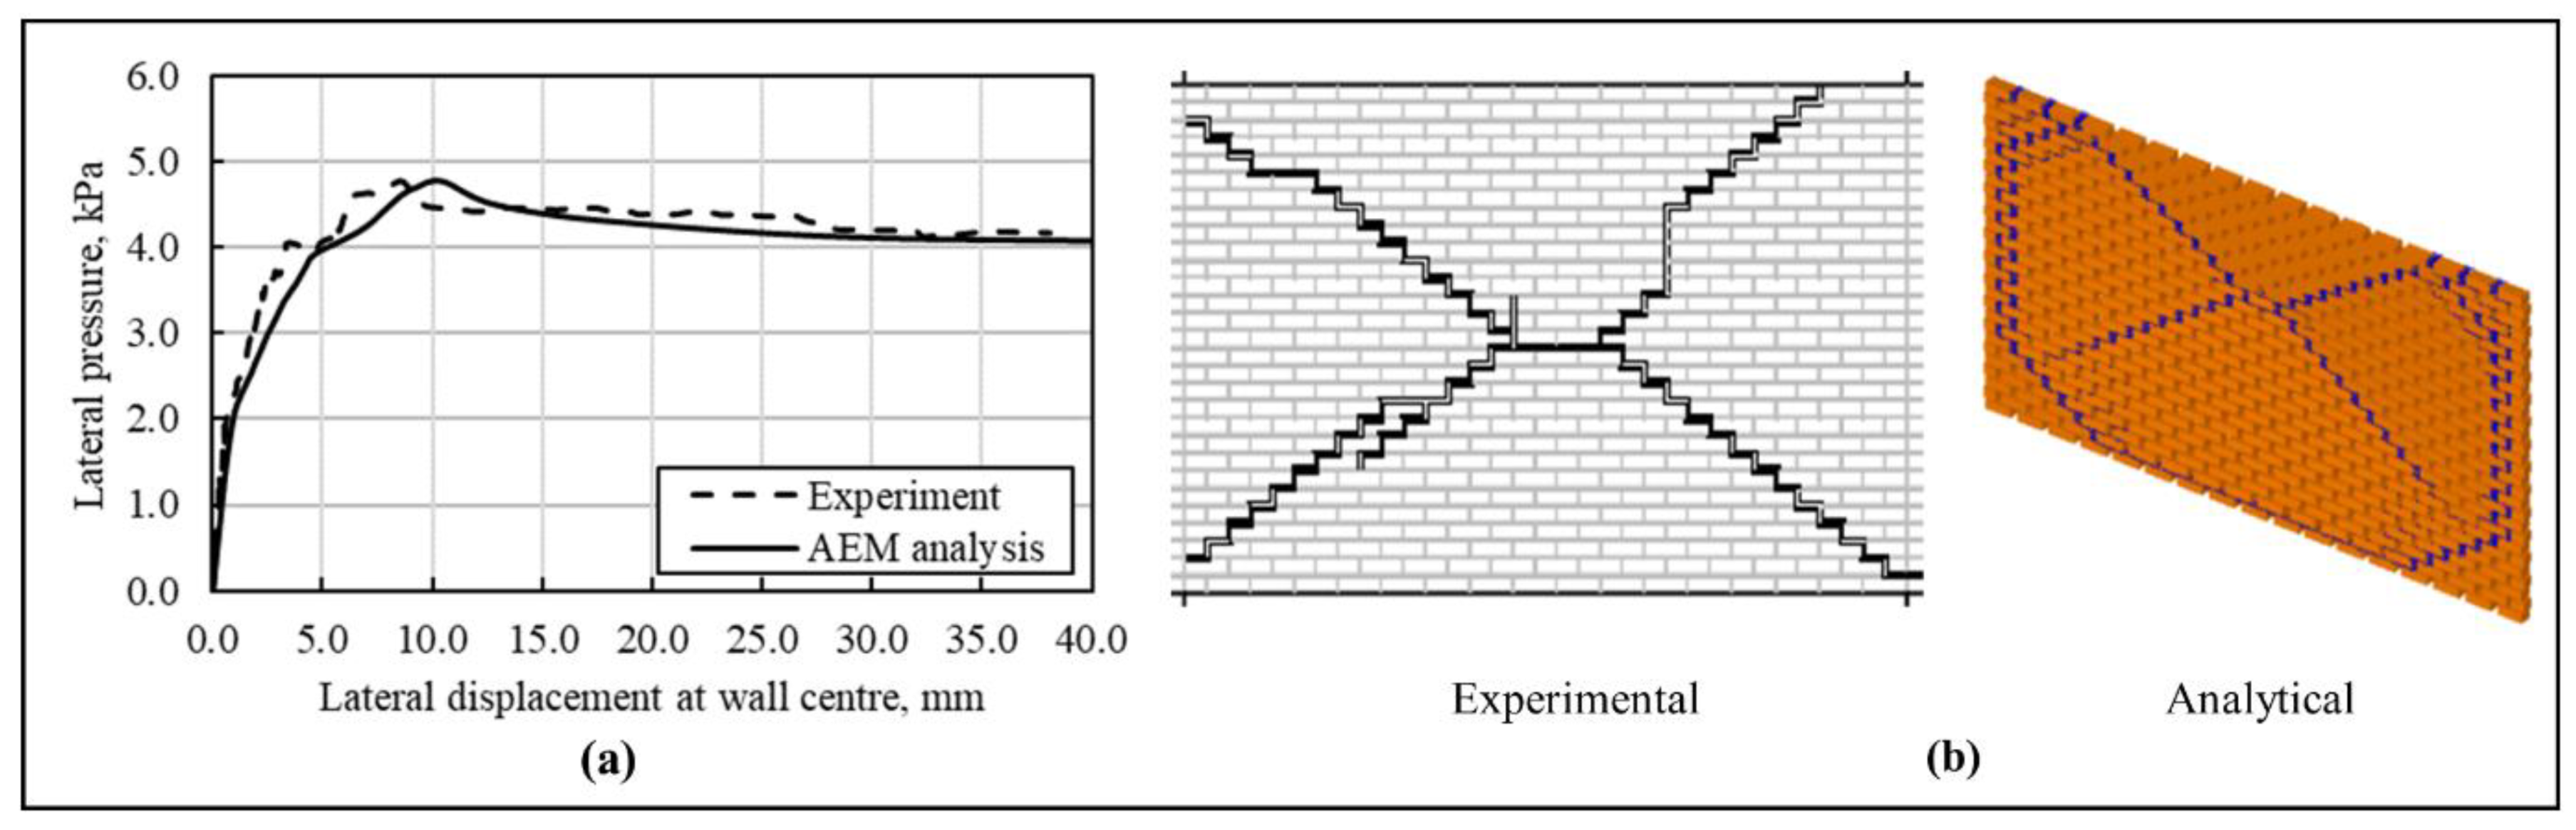
4.1. Modelling Validation Using Experimental Results

In order to verify the applicability of the AEM modelling approach, a number of validation studies were conducted on experimentally tested walls from the literature, prior to its application to the case study URM and CM buildings described in Section 3.
For the validation and calibration of the IP behaviour of URM walls, the shear tests conducted by Vermeltfoort et al. [106] were used. The tests from these experimental campaigns were selected because a detailed material characterization of the masonry used was also available. Two cases were considered, both with a surface area of 1 m2: the first was a solid wall (SW), the second was a wall with an 8% opening (OW).
More details on the experimental setup and test protocol can be found in Vermeltfoort et al. [106]. The material properties reported in the same work were used in the numerical modelling.
Figure 10a compares the load–deformation curves from the AEM numerical analyses with the experimental curves. Overall, the experimental behaviour was well reproduced by the AEM analyses. For the SW wall, a high value of coefficient of friction (i.e., 0.75) was reported from the experiment and the shear failure mode was predominant, while the AEM analysis showed strength hardening after tensile cracking and debonding, unlike the experimental behaviour, in which strength degradation started earlier. Lourenco and Rots [10] also reported comparatively longer hardening using FEM analyses. However, an AEM analysis with a reduced value of coefficient of friction (0.60) produced better results that matched well with the experimental results in the post-peak range. This suggests that the values of masonry parameters reported from experimental campaigns might not always be reliable [37].
Figure 10b compares the crack patterns obtained from the AEM analysis with the experimental damage patterns. Since the numerical model considers each single unit as an applied element (i.e., discretization of bricks is not considered), in order to reduce the computation time, the damage through the bricks (although very few, see Figure 10b) could not be reproduced. For both cases, the crack pattern was well reproduced, the dominant failure mode in both cases being the stair-step-like shear failure mode. The OW wall also exhibited a flexural behaviour allowing a larger post-peak displacement, due to the division into two slender piers imposed by the opening. Due to such behaviour, the sensitivity to the value of friction coefficient was less important in the OW wall model.
A CM wall specimen tested under cyclic loading by Quiroz et al. [107] was taken to validate the ELS modelling approach for this typology. Details of the wall dimensions and material properties were taken from the same study, with calibration factors estimated as given in Table 2.
The walls were adequately fixed to the floor of shake table, to simulate a fully fixed base. The toothed interface between the masonry panel and tie-columns was modelled with the properties of the concrete, in order to simulate the correct sequence of construction, i.e., casting RC elements after erecting the masonry panel. This assumption was also followed in developing the numerical models of the CM buildings presented in Section 4.
The crack pattern after a bidirectional experimental analysis was compared with the AEM numerical pushover analysis in Figure 11. The numerical load–displacement curve obtained after the calibration was compared with the experimental envelope curve derived from the hysteresis curve, as shown in Figure 11c, which shows a good agreement with the initial stiffness and the peak lateral strength. However, the unidirectional pushover loading led to a sudden drop in stiffness and a shift from elastic to inelastic behaviour, as compared to a smooth transition observed in the bidirectional hysteretic loading, which can be seen in the displacement range below 5 mm (Figure 11c).
For the validation and calibration of the OOP seismic behaviour of masonry walls, the two-way bending wall with mixed boundary conditions (two sides fixed, top and bottom simply supported) tested by Vaculik [108] was considered. In particular, this was selected for validation because both the inputs (i.e., model geometry, boundary conditions, loadings, material properties) and the outputs (i.e., load-deformation behaviour and failure modes) are clearly reported. Moreover, since the top and bottom are simply supported, these represent the URM connections, while the fixed sides, being strongly built, simulate the toothing connection in poorly confined masonry. More details on the experimental setup and test protocol can be found in Vaculik [108]. The material properties reported in the same literature work were used in the numerical modelling.
Figure 12a compares the load–deformation behaviour from the experiment and the AEM numerical analysis. The initial stiffness, peak strength, as well as the ultimate displacement capacity obtained from the numerical analysis were all well correlated with those obtained from the experiments. Similarly, as shown in b, the experimental crack patterns, i.e., X-shaped diagonal cracks, were well reproduced by the numerical analyses. Although the final failure involved vertical cracks at the fixed sides, as seen in the numerical collapse mechanism (Figure 12b), the experimental crack pattern shown corresponds to an earlier state [108] before the moment capacity was reached at the fixed sides. As the X-shaped diagonal cracks appeared first, these allowed parts of the walls to rotate, allowing a considerable displacement at the centre of the wall (Figure 12a), until the moment capacity at the fixed ends was reached.
In summary, the validation and calibration studies on both the IP and OOP walls revealed that the direct use of most of the experimentally reported material characteristics provided an overestimation of the strength and ductility. The outcomes and recommendations from the validation studies are summarised in Table 2.
With reference to Table 2, although the compressive strength does not need any calibration, because its role in the lateral response was not that significant; the tensile strength, cohesion, and the coefficient of friction reported in the experimental material characterization tests needed to be reduced by 15% to 30%, as also reported by researchers [109] who adopted other modelling approaches, such as FEM and DEM. Moreover, as the value of shear modulus along the bed joint is not usually characterised from this experiment but is rather assumed simply as 40% of the elastic modulus, the validation studies showed that an estimation of 10% to 15% of the elastic modulus was applicable in the case of brick masonry. These values are in line with the ranges reported by Tomazevic [110] and Bosiljkov et al. [111] for masonry with low-strength mortar. Accordingly, for the case study buildings in this work, the relevant material properties reported from literature were reduced as per the outcomes in Table 2. Although the outputs shown in Table 2 are not conclusive, due to the very small number of validation cases considered herein, further discussions on the calibration and validation of numerical modelling of masonry in AEM can be found in Adhikari [64].
Within the AEM modelling environment, the proposed IGA approach of pushover analysis (Section 2.1) for seismic analysis of masonry buildings was tested through a rigorous comparative analysis, with discussions in Section 4.2.

4.2. Validation of the IGA Approach

To validate the IGA method of pushover analysis, a two storied brick masonry building with low seismic design (URM7/MR/LD) and stiff diaphragms was considered (Figure 13). More details on this building type can be found in Adhikari [64]. Although the case study IBs considered in this work (Section 3) are single storied without stiff diaphragms, a building with stiff diaphragms (hence showing global box-like behaviour) was considered for validation because of the direct applicability of the established analysis procedures such as force-based pushover or NLTHA in such building types. The numerical model (Figure 13) was subjected to NLTHAs under the FEMA P-695 [112] suite of 22 far-field ground motion records, as well as a number of pushover analyses in the long direction. The different pushover analyses in the investigation included the proposed IGA approach, as well as different lateral force patterns, i.e., triangular, 1st mode shape proportional, uniform, and mass proportional. It is worth noting that the triangular, 1st mode shape proportional and uniform lateral load patterns were discretised at the floor/roof level, while the mass proportional loading was applied as a distributed pattern over the height of the building. The resulting capacity curves are compared in Figure 14 against the mean NLTHA backbone curve.
With the inverse triangular and the 1st mode shape proportional load patterns, the lateral load was mostly concentrated on the first storey. As seen, the damage was mostly concentrated at the roof slab–wall interface, where the lateral load was applied (i.e., premature model failure). Accordingly, the first storey suffered extensive damage compared to the ground storey (Figure 15a). This is also seen in the capacity curve: the stiffness of the building was highly underestimated, and the maximum capacity achieved was only about 65–70% of the mean NLTHA ultimate capacity. Similarly, in the case of uniform loading, the stiffness and the ultimate capacity were underestimated, but the results were better (ultimate capacity was about 85% of the median NLTHA ultimate capacity) compared to the 1st mode shape or inverse triangular loading cases. The damage behaviour (Figure 15b) was also similar to the previous ones, except that there was slightly more shear damage in the ground storey piers. Thus, if existing masonry buildings were assessed with the pushover curves obtained from these load patterns (i.e., inverse triangular, 1st mode shape proportional, or uniform), the capacity of the buildings would be greatly underestimated. Moreover, if used in the design of new masonry buildings, the resulting design would be highly conservative. However, in the case of the mass proportional and the IGA approach, both of which are essentially the same, differing only in the application approach, the initial stiffness, yield, and post-yield behaviour (except for the degradation) matched well with the median NLTHA backbone curves. The post-yield strength degradation (about 10%) in the median NLTHA backbone curves was due to the effect of dynamic and hysteretic behaviour, which were not simulated in the static pushover analyses. Furthermore, at an ultimate drift of 0.5%, the shear/flexural cracks had a width of about 10–15 mm, which is less than half of the interlocking between the units in English bond masonry, thus no strength degradation was seen in the capacity curves, because of the available frictional resistance.
The collapse mechanism with the IGA method or the mass proportional load pattern (Figure 15c) involved damage mostly being concentrated at the ground storey, matching well with the NLTHA collapse mechanism [64]. For multi-storied URM7 buildings, similar collapse mechanisms (i.e., involving ground storey IP shear damage) were observed during the 2015 Gorkha earthquake [64], as well as in the shake table tests [113]. Thus, the uncertainties related to the load characterization, as well as in the resulting failure mechanism and capacity curve, were greatly minimized by using the proposed IGA method. Other researchers [76,77,81,114,115] also reached similar conclusions with respect to the outcomes associated with different load patterns: with mass proportional load pattern resulting in close comparison with the NLTHA envelopes.
Thus, it can be concluded that the proposed IGA method is a reliable pushover analysis method, resulting in close comparison with the NLTHA backbone curves and collapse mechanisms. For these reasons, the IGA approach was followed in this study, to conduct the non-linear pushover analysis of the case study school buildings introduced in Section 3.

5. Modelling Assumptions and AEM Numerical Models

An element-by-element AEM numerical model of each IB was created based on their structural, geometric, and material characterization (Section 3), using the simplified micro-modelling technique discussed in Section 4. For the URM IBs, masonry walls and the cross-wall connections were modelled exactly as in the English bond pattern, to represent the actual construction (Figure 16). The bricks were not discretised in the models, because of the difference in strength of the brick and mortar in existing Nepalese masonry construction, as discussed in Section 3. The RC bands were discretised such that the elements were roughly the same size as the brick elements. The interface between the masonry and RC elements was modelled with the properties of the mortar material. In all the models, with the roof being a lightweight and flexible type with poor connection to walls, roof modelling was excluded. Numerical studies conducted by the authors [64] showed that there is no significant difference in the collapse mechanism and capacity curves with or without the poorly connected roof elements in such buildings.
The confined masonry IBs were built with one-brick-thick (110 mm) masonry in a running bond, as shown in Figure 17, confined with RC elements on the perimeter of the walls. The CM IBs in this study had two types of RC-masonry interface, corresponding to the good and bad connections, as defined by the seismic design level discussed in Section 3. When there was no toothing (or poor connection), connection between tie-column and masonry panel was achieved by filling the gap with mortar. Whereas, when there was toothing (or good connection), the gaps were filled with concrete, having a higher tensile and bond strength than mortar. Hence, in the numerical model, the interface was modelled with the properties of the respective materials, i.e., either mortar or concrete, as found in each case. This assumption simulated the correct sequence of construction if available, i.e., casting RC elements after erecting the masonry panel, thus achieving a good connection and vice versa.

6. Analysis Results and Discussions

For the seismic analysis of the IB models presented in Section 5, the IGA method of pushover analysis discussed in Section 2.1 was adopted. The URM and CM buildings analysed in this study had different levels of seismic design within the typology. The AEM analysis was intended to estimate and compare the collapse mechanisms and lateral capacity of these models within each typology and between the two basic typologies. It is noted here that all the IBs were analysed and assessed in the long direction, as these IBs are weaker in this direction [64].

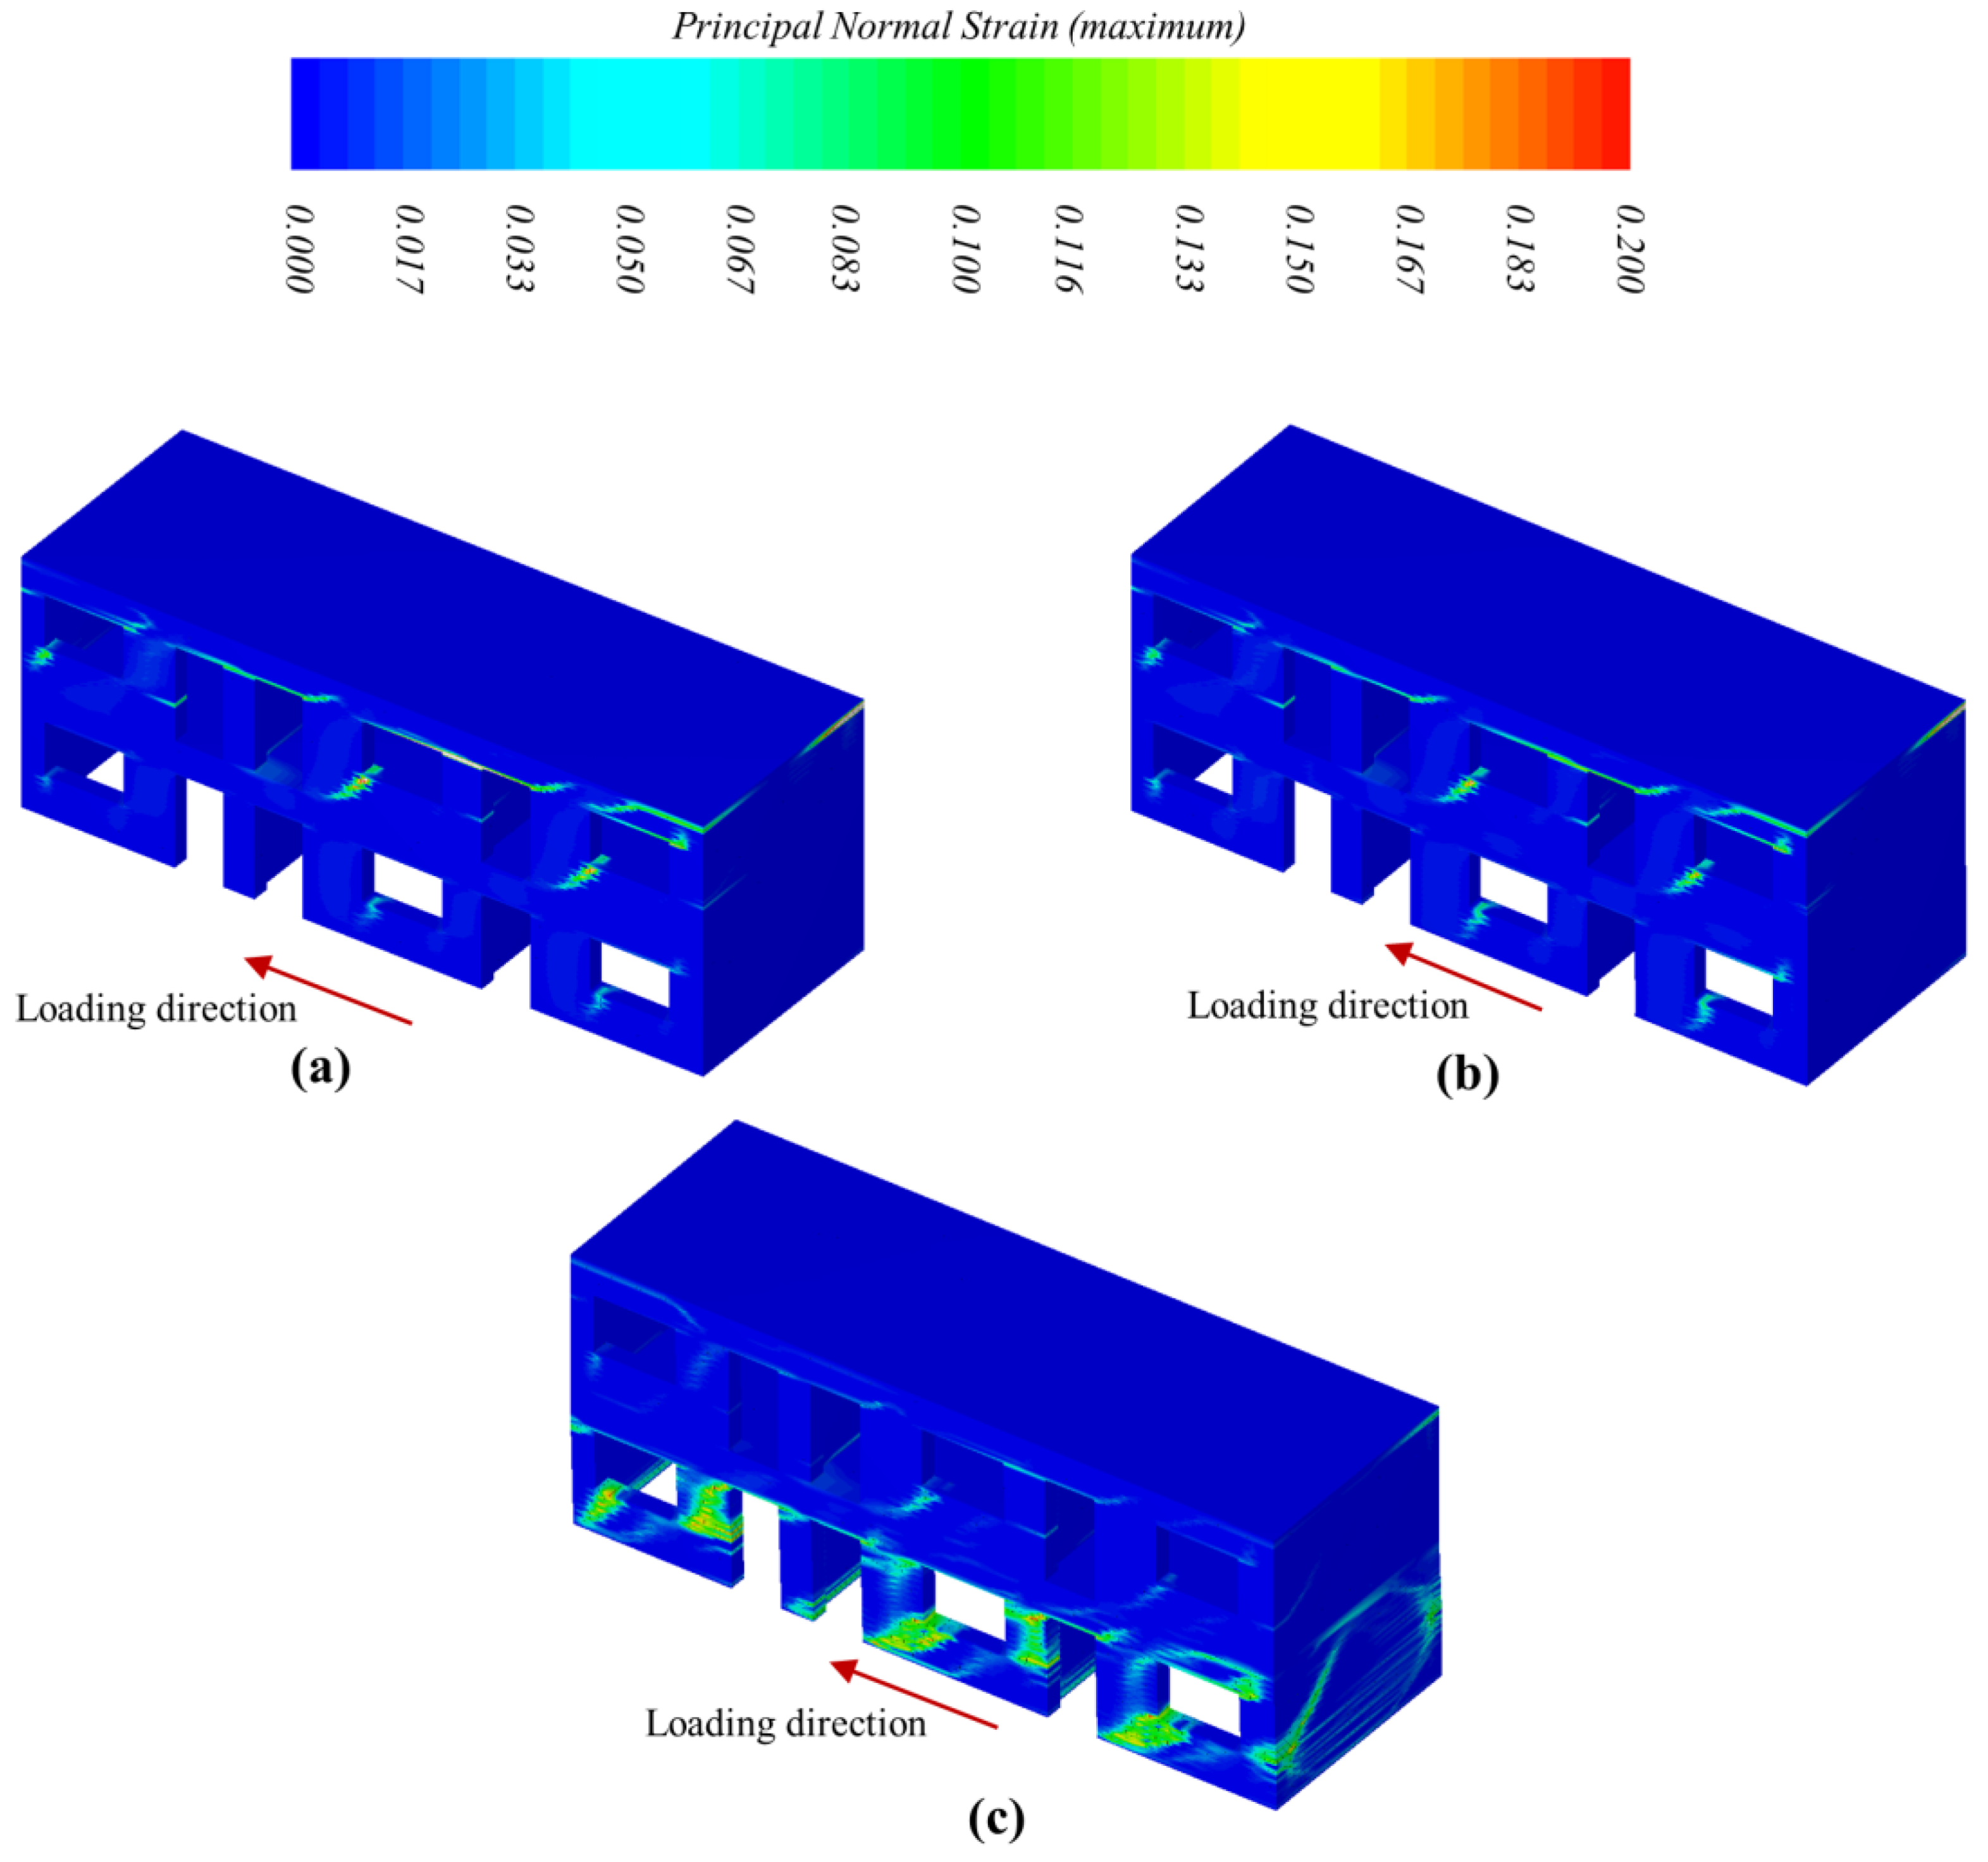
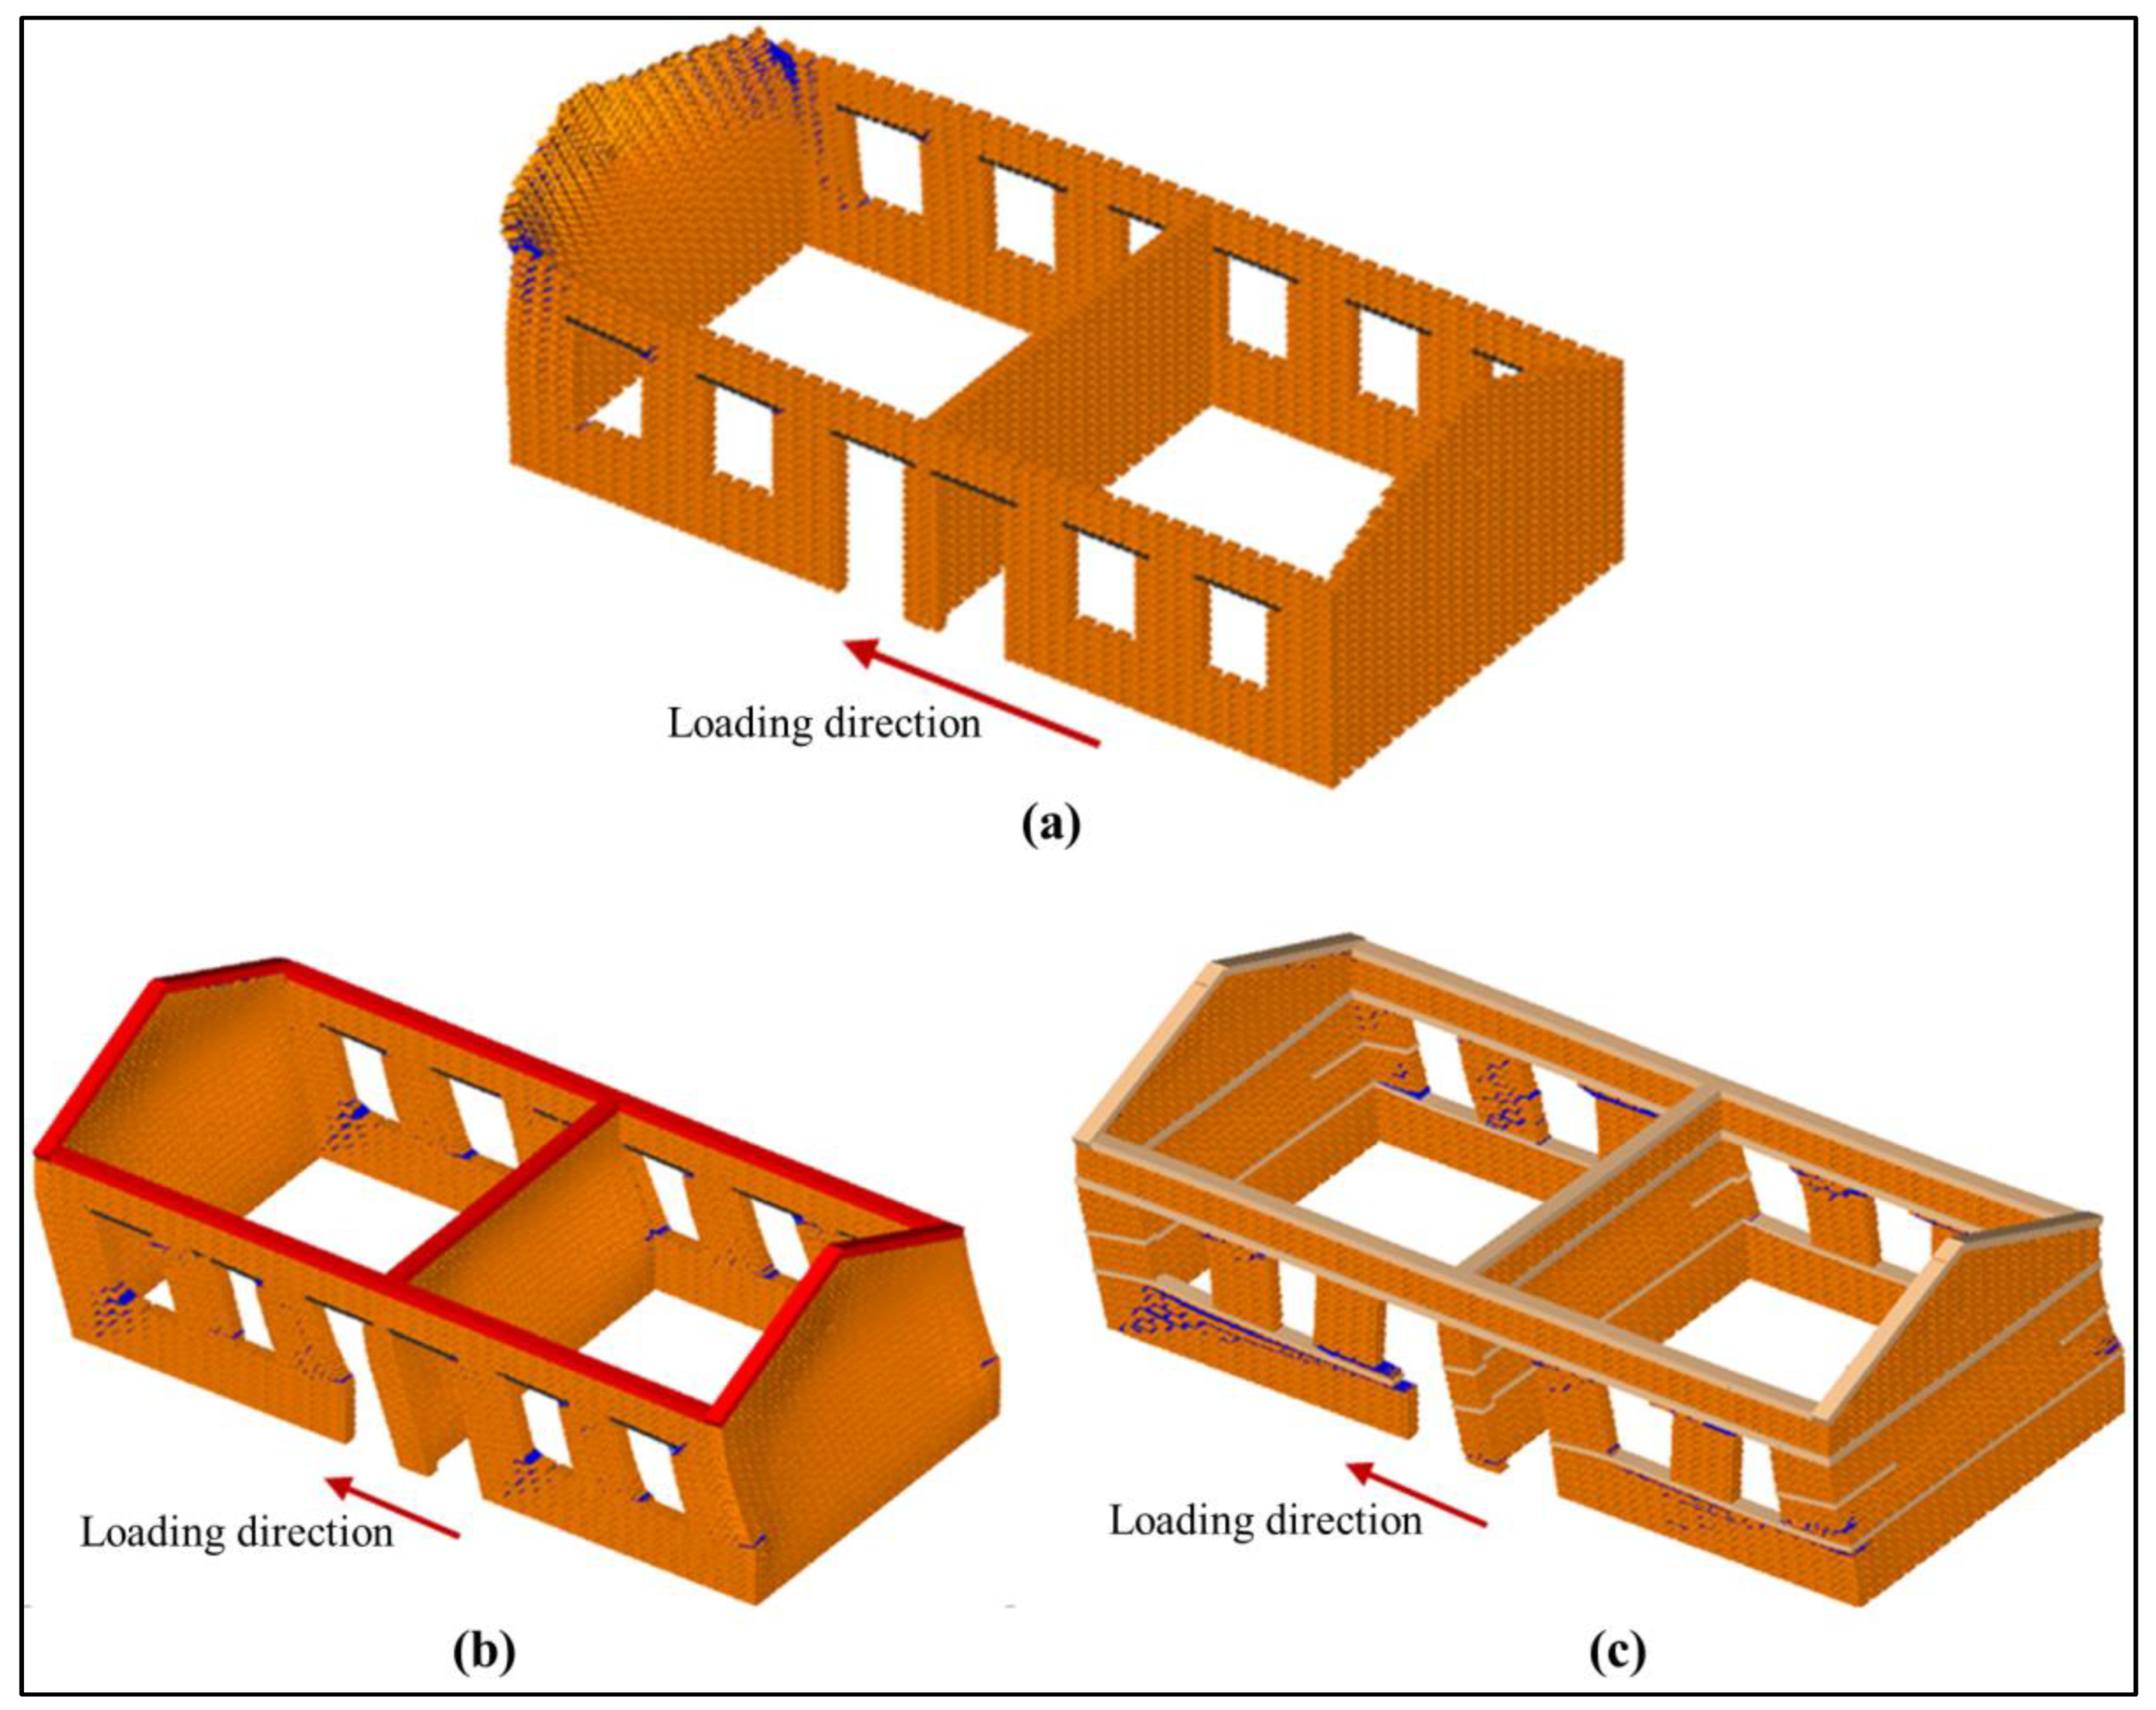
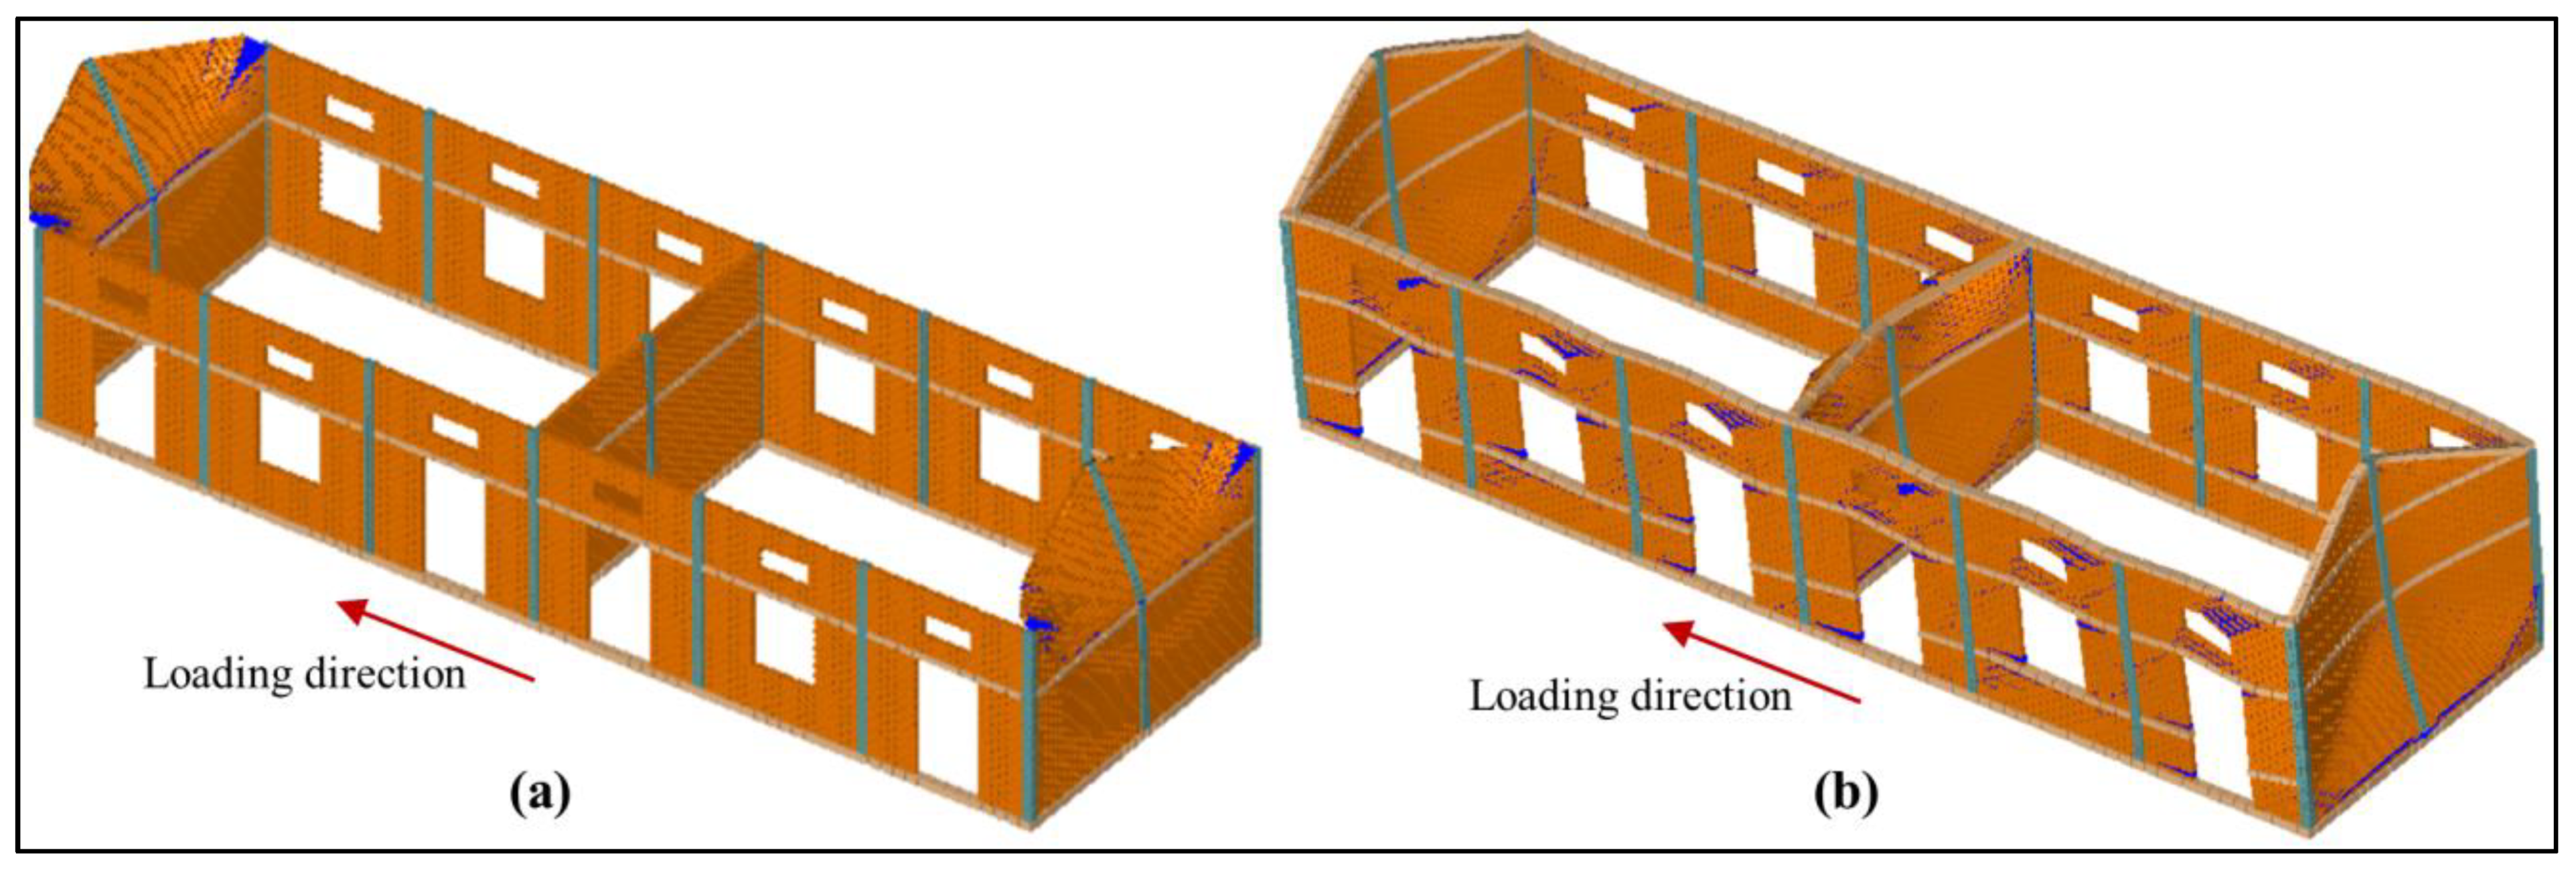
6.1. Failure Mechanisms

The collapse mechanisms for the three different cases of URM7 with different design levels are shown in Figure 18. The URM7/LR/LD model (Figure 18a) clearly showed a lack of global box-like behaviour. Consequently, the OOP walls were highly vulnerable, detaching easily from the cross-wall connections and overturning well in advance of any damage observed in the IP walls. On the other hand, in the case of the URM7/LR/MD model, the global seismic behaviour was improved due to the box-like action provided by the RC roof band (Figure 18b). In the case of the URM7/LR/HD model, the global box-like behaviour was significantly enhanced by the presence of the other horizontal bands, mitigating all the failure modes of the gables and OOP walls. In both the URM7/LR/MD and URM7/LR/HD models, the collapse was due to the shear/flexure failure of the IP piers. Accordingly, the peak equivalent lateral capacity achieved was as high as 0.46 g and 0.80 g for the URM7/LR/MD and URM7/LR/HD models, respectively, compared to the 0.25 g of the URM7/LR/LD model [64]. These values represent the equivalent PGA levels at which the respective damage levels presented in Figure 18 (i.e., the collapse of the OOP wall in LD case and the global collapse in case of the MD and HD model) were observed, thus providing a comparison of lateral capacity. The collapse mechanisms observed for the three cases clearly demonstrated the contribution of the seismic bands to improving the seismic performance of URM structures.
In the CM1/LR/LD model, the flexural horizontal out-of-plane mechanism developed under lateral loading, before the overturning of wall portions above the lintel, due to the better connectivity with the confining elements compared to the URM baseline model. The collapse stage showed the formation of significant major cracks in the end OOP wall portions above the lintel band, while the IP system remained intact (Figure 19a). This happened with a relatively low level of seismic input, without mobilising the full capacity of the IP walls, as evident from the negligible damage within the IP walls.
As compared to the local failure in the CM1/LR/LD model, the CM1/LR/MD model showed a far better performance, as the additional confinement was able to effectively tie the IP and OOP walls together. The failure mechanism in this case was a combination of IP diagonal shear mechanism in spandrels, rocking of piers around openings, and vertical bending of OOP walls (Figure 19b). The additional RC bands at the roof and sill levels proved adequate in effectively mobilising the full capacity of all the IP and OOP walls. The cracks first develop on the IP walls (shown in blue in Figure 19b), and then at the base of end-OOP walls, which developed two-way bending, allowing improved ductility for the whole system, while preventing local failure. However, the absolute displacements of OOP walls and the IP system were still substantially different, hence the assumption of equal displacement of all walls at a storey level, as in the case of global box-like behaviour being not applicable in this building, as further discussed in Section 6.2. It is noted that the crack patterns included in Figure 19 only show the major cracks wider than 10 mm. The assumptions of a good connection at the RC–masonry interfaces, lack of restraint at the roof level, together with the complete confinement of the slender OOP walls, enabled significant overall OOP deflection. However, after the formation of the horizontal cracks, most of the lateral load was taken by the IP system. Such high OOP deflections were also reported in literature, for CM as well as URM walls [116,117].
The behaviour of CM1/LR/LD was comparable to URM7/LR/LD, except for the fact that the end OOP walls did not completely detach from the IP walls, owing to the connectivity at lintel and plinth levels. Hence, the OOP walls were able to transfer inertial forces to the IP walls, sustaining larger deformation compared to their URM counterparts. CM1/LR/MD was comparable to URM/LR/MD and URM/LR/HD in its lateral damage behaviour, with an improved box-like response, mobilising both IP and OOP walls. However, because of the rotational stiffness at the vertical edges provided by the tie-column confinement, the OOP walls in the CM model were able to deform more than in the URM models. The lintel, top, and gable bands, together with the plinth band also provided flexural restraint along the horizontal edges, which allowed the gable to also bend in the vertical plane. Therefore, the gable wall had double bending, which means a substantial capacity for lateral forces, as it was comparatively stiffer. The OOP gables walls in the CM1/LR/MD model achieved up to an equivalent lateral capacity of 0.89 g, which was between the maximum capacity of the URM MD and HD models. The IP system, however, could sustain a much larger base shear, as quantified in Section 6.2.

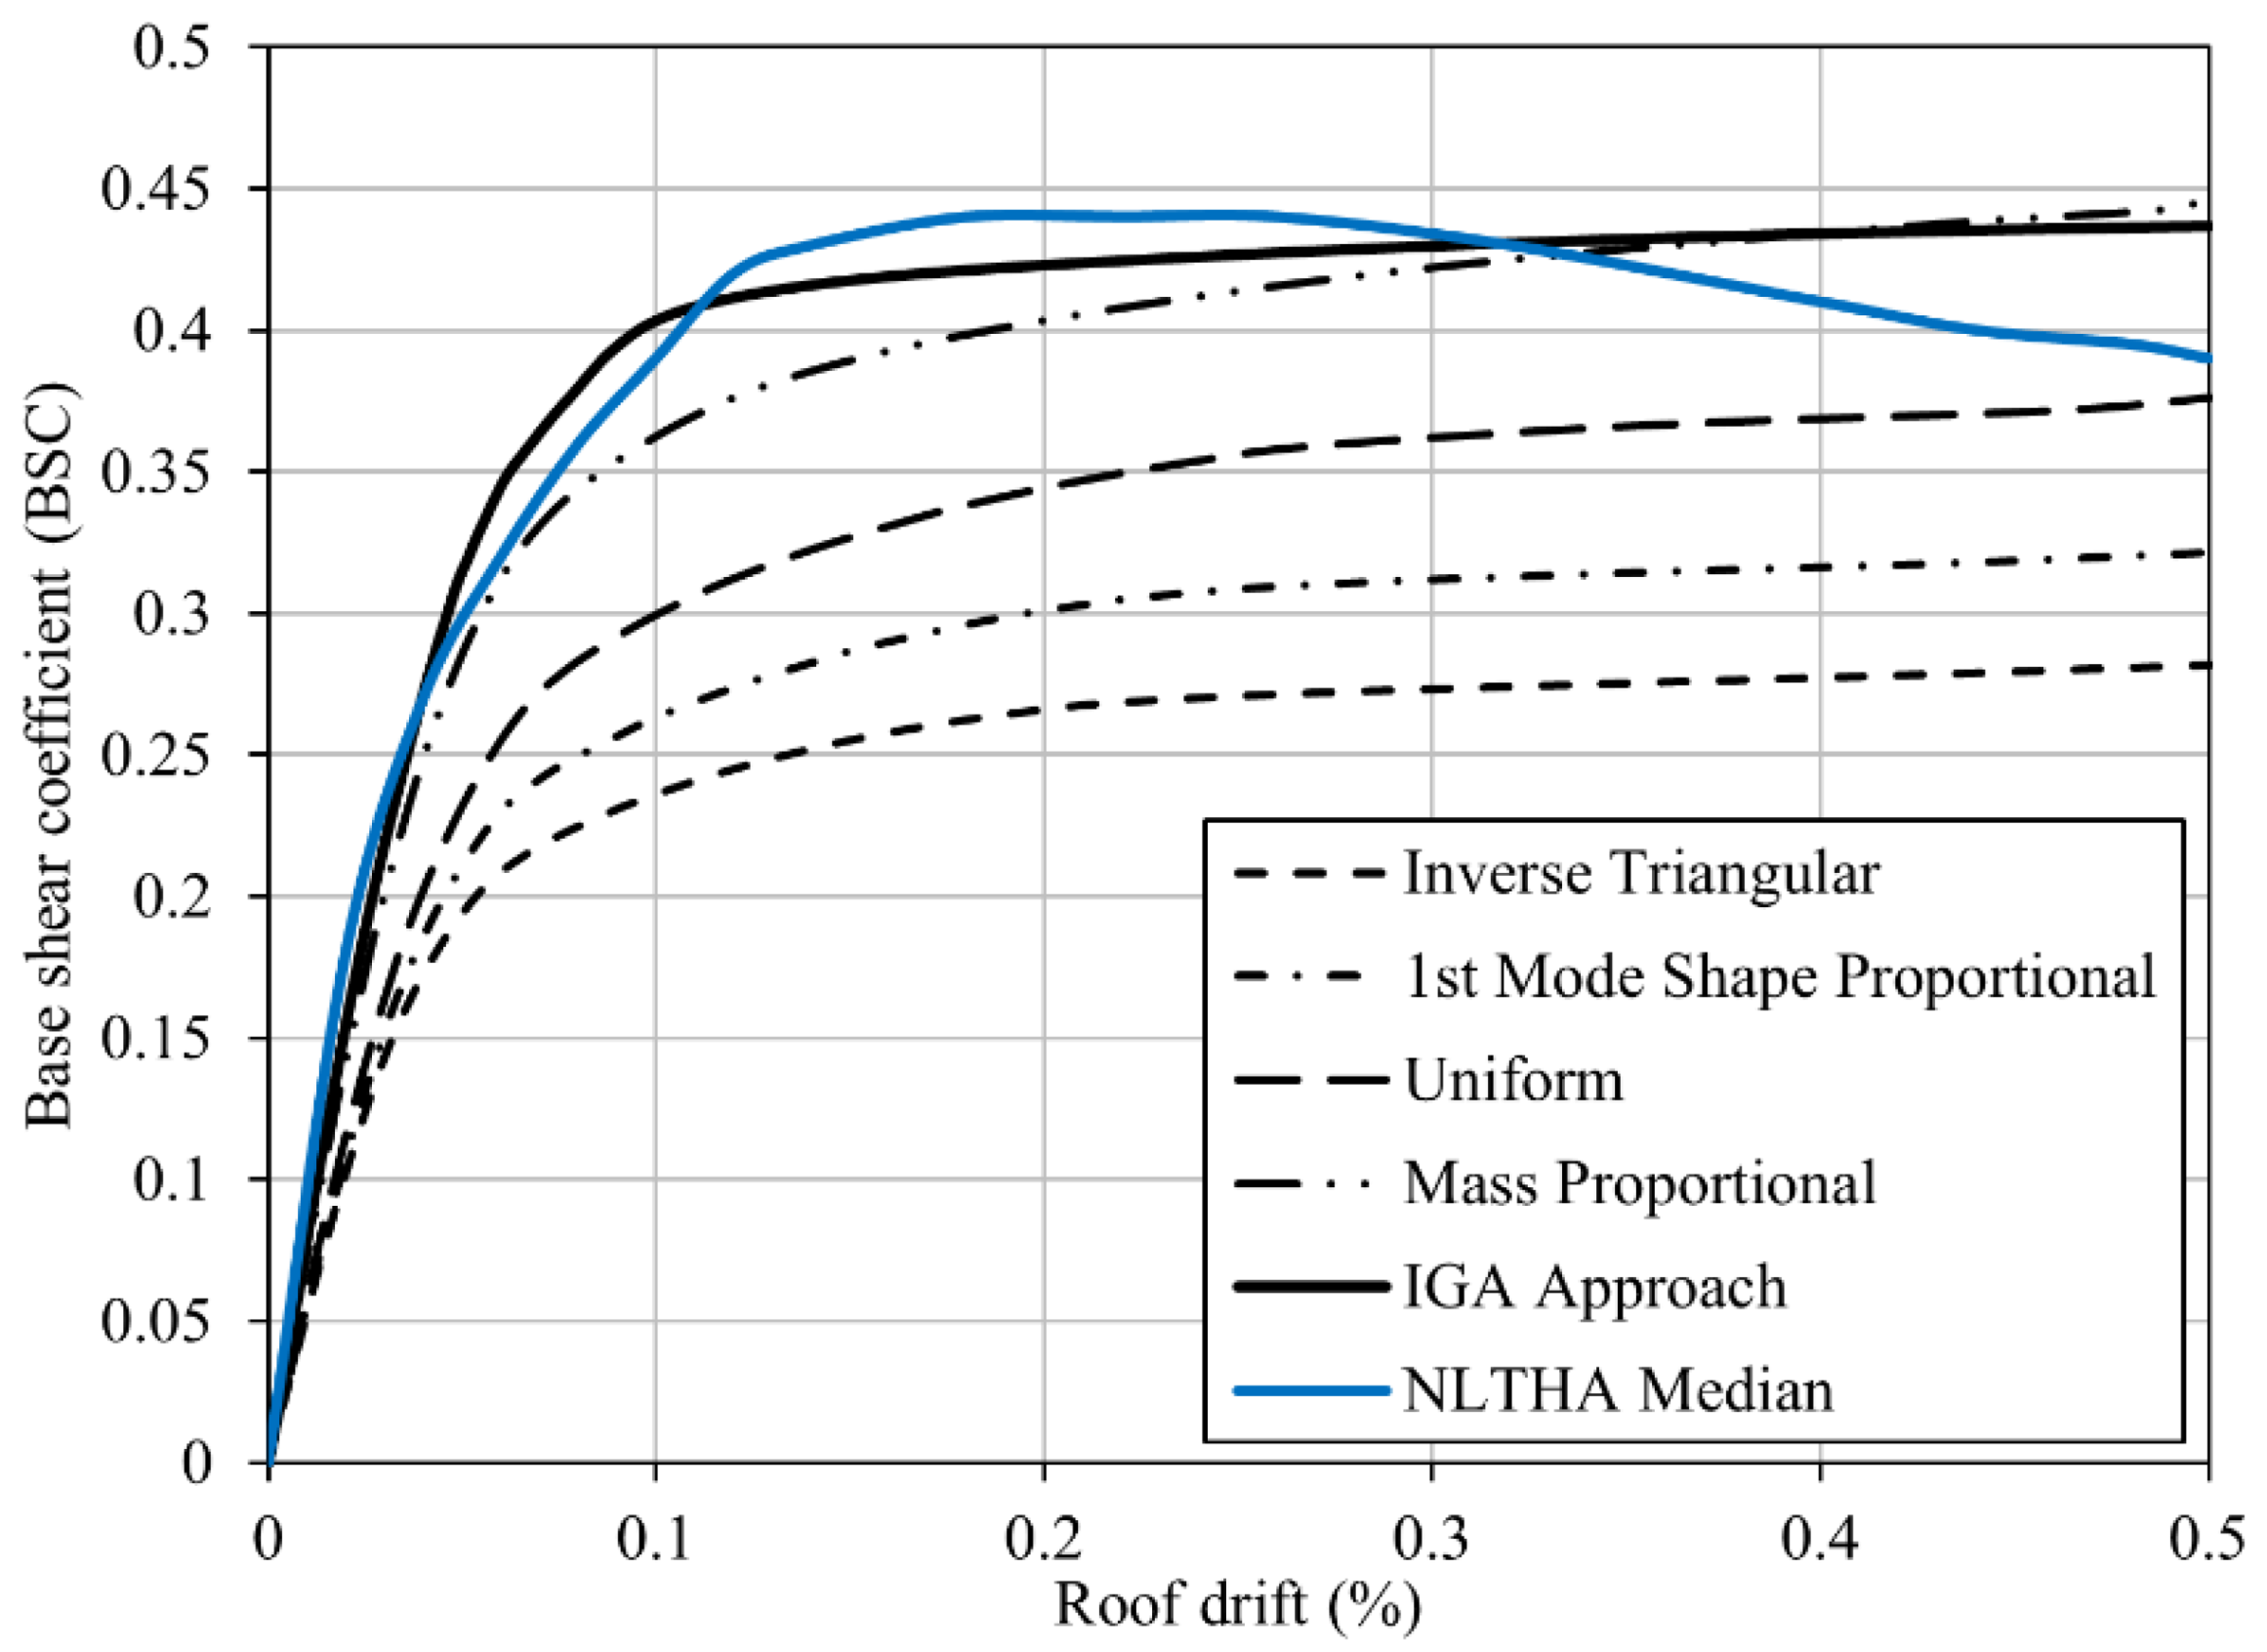
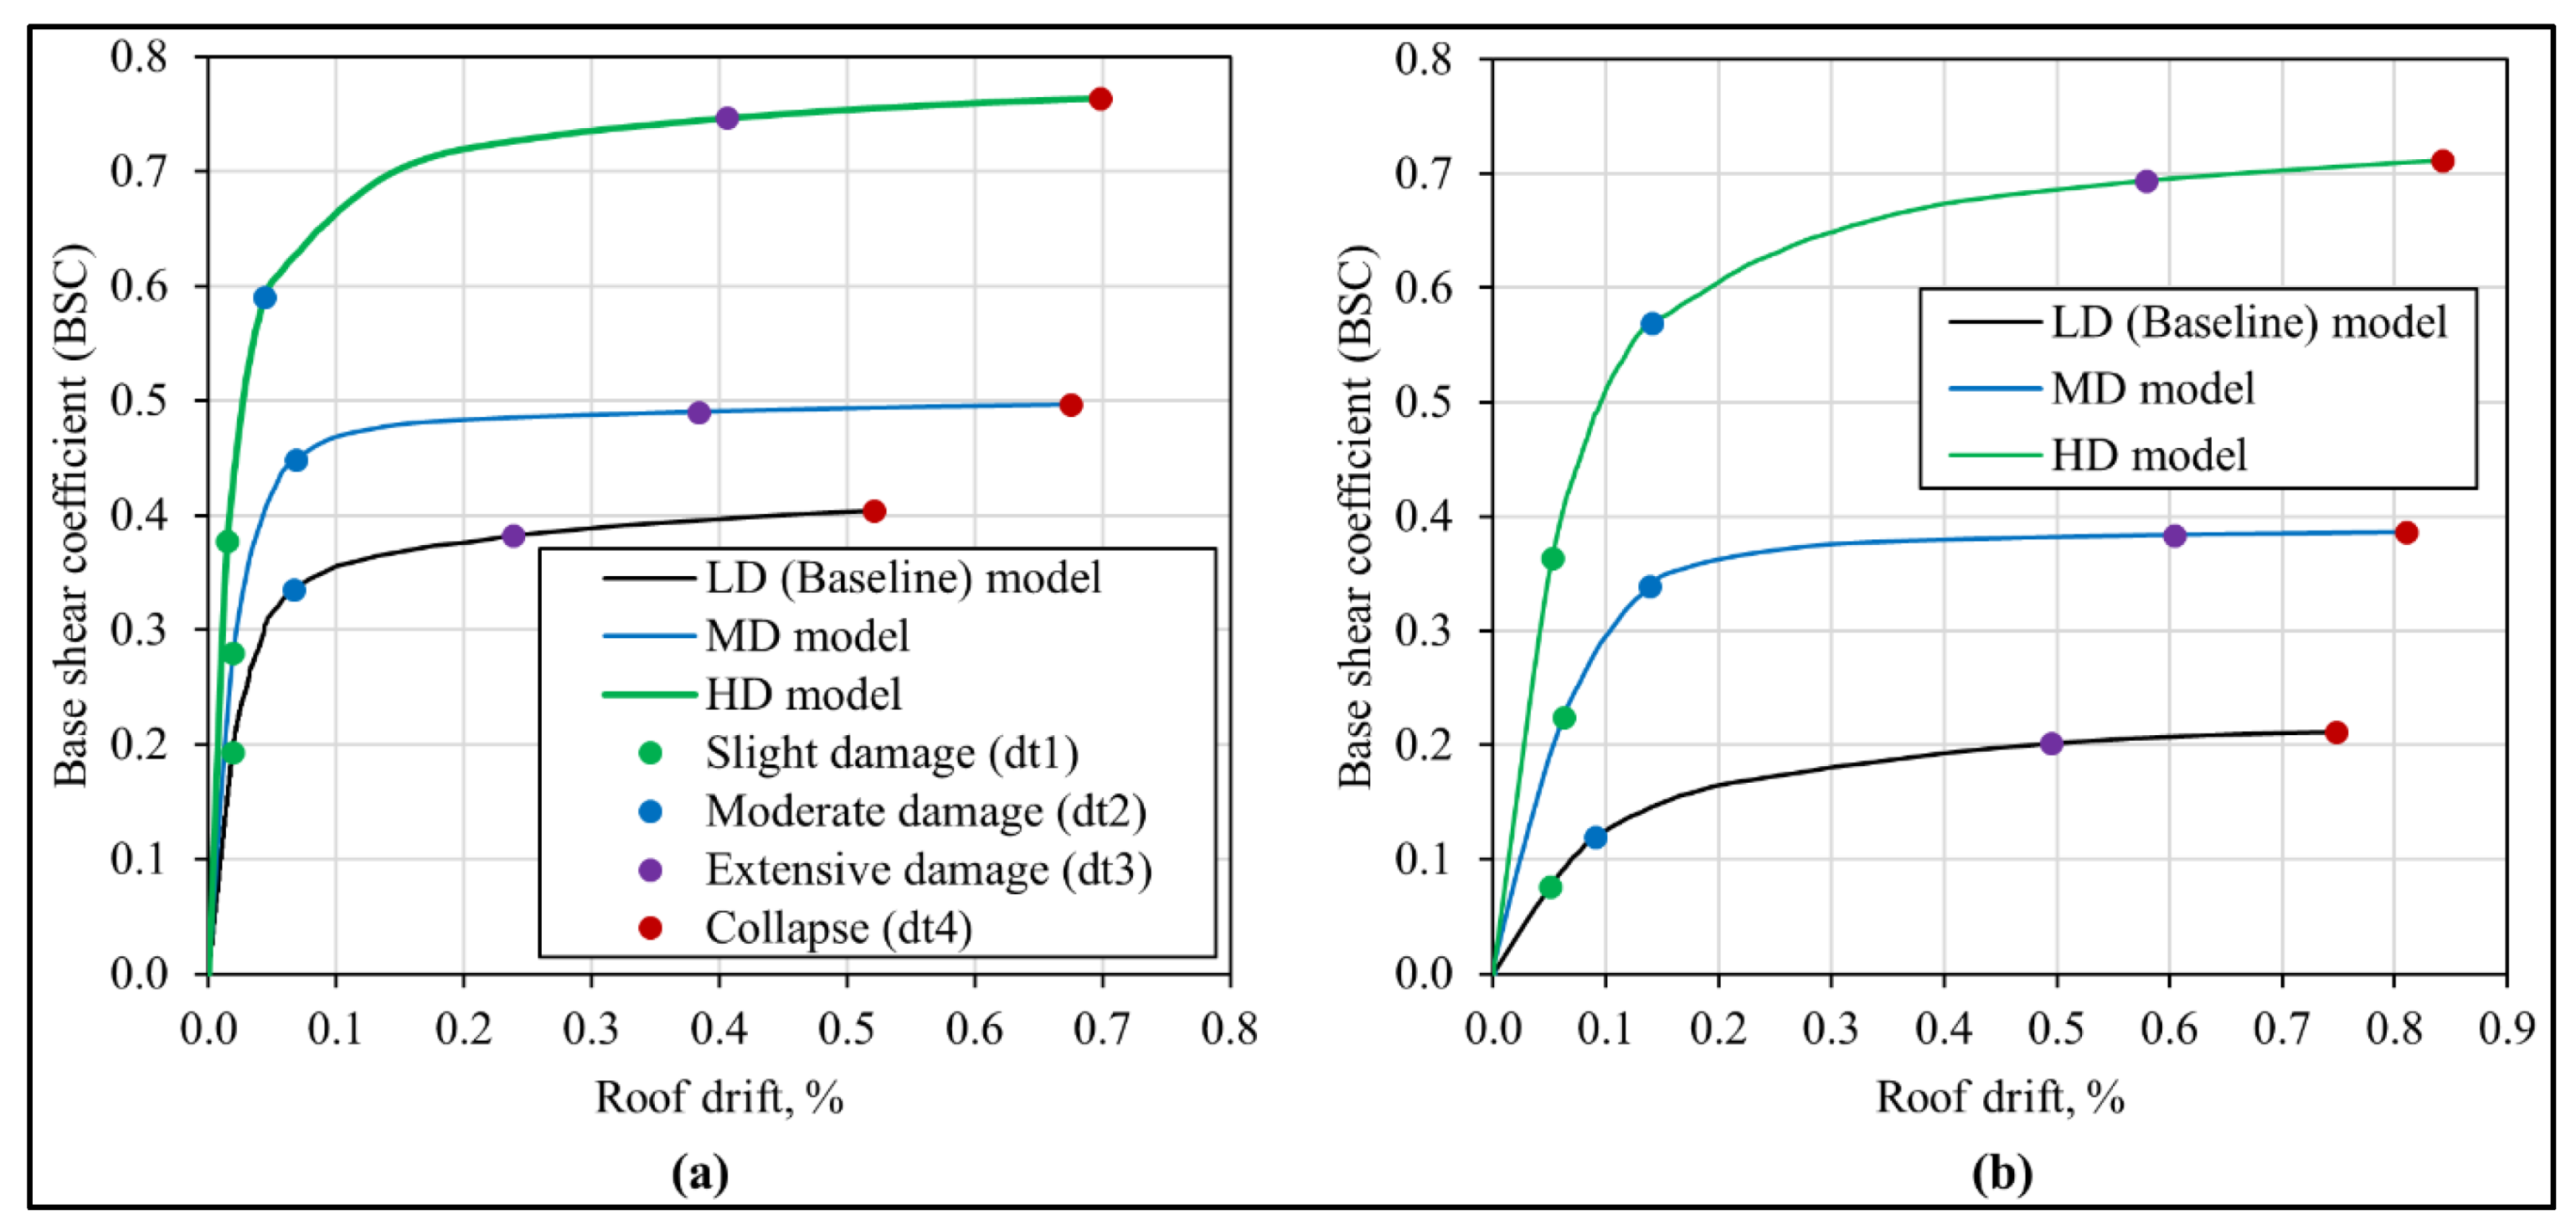
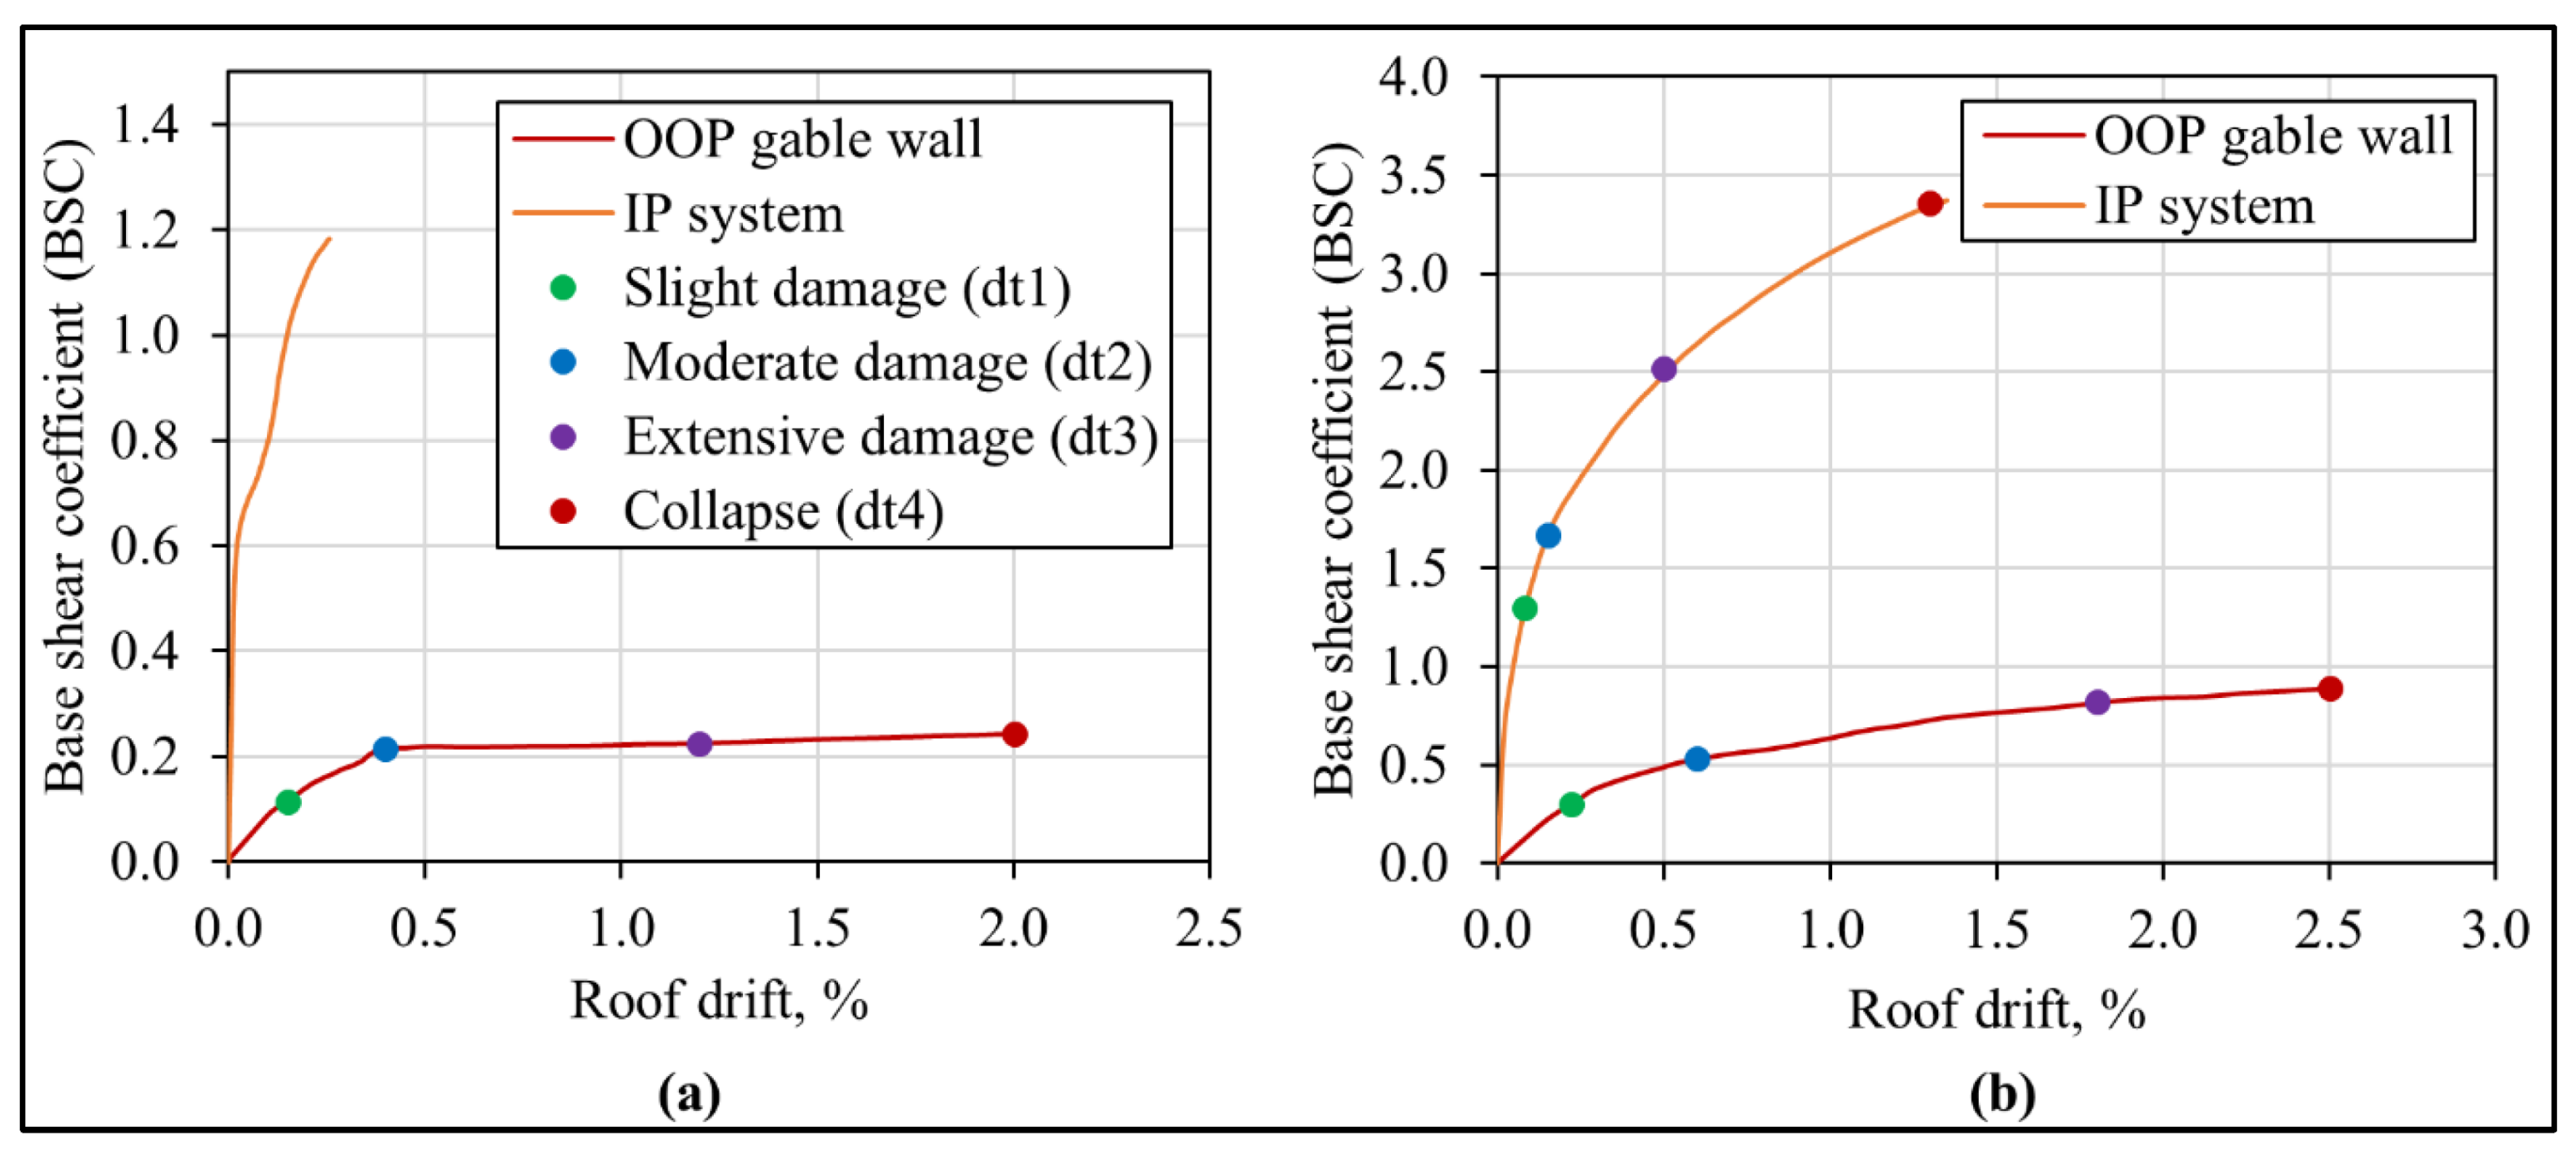
6.2. Capacity Curves and Damage States

Following the methodology presented in Section 2, Figure 20 compares the capacity curves for the sub-systems, i.e., OOP gable walls and the IP system, along with different damage state thresholds marked along the capacity curves. While the HAZUS (FEMA, 2015) damage scale with five different damage states, i.e., none, slight, moderate, extensive, and collapse states was considered in this work, readers are referred to Adhikari (2021) for a detailed discussion of the definition of different damage scales, performance levels, and limit states, with respect to URM buildings. In this study, the ultimate drift in the capacity curve was taken as the collapse threshold (dt4), i.e., the onset of the collapse state. This was defined from the pushover analysis, corresponding to the state of the building (or a wall) at which a complete collapse mechanism had formed, such that the rate of incremental displacement for further incremental acceleration became excessive. Since the frictional shear was still active, as the interlocking between the units was not exceeded, a drop in the capacity is not observed in Figure 20. The ultimate capacity and drift limits presented in Figure 20 are in line with the experimental results reported in the literature [55,118,119,120]. Although the MD and HD models developed global box-like behaviour and a global capacity curve can well represent their global behaviour, for consistency of comparison, the IP system and OOP gable wall capacity curves were generated separately and compared with those of the LD models. With respect to the IP system behaviour (Figure 20a), the MD model showed about a 25% and 10% increment in its strength capacity and displacement capacity, respectively, compared to the LD model. On the other hand, the increase in the strength capacity and displacement capacity from the LD to HD models was substantial, i.e., 100% and 40%, respectively. For the OOP gable wall (Figure 20b), the MD and HD models showed a substantial increment over the LD model, with respect to both the stiffness and strength capacity, i.e., the peak strength increased by as much as 50% and 250%, respectively for the MD and HD models, compared to the LD model.
The capacity curves for both the CM models (Figure 21) display the displacement vs. base shear coefficient of the IP system and OOP walls separately, from the initiation to termination of loading with respect to these two systems. At any instant of loading, there was substantial difference between the top drifts in the OOP gable walls and IP system, in both the models. The CM1/LR/LD building showed a strictly local behaviour, where the OOP wall deformed and collapsed at relatively low acceleration capacity, with negligible participation of the in-plane system. The failure of these end-OOP walls governed the overall failure of the building, irrespective of the in-plane capacity. Hence, the capacity curve corresponding to the OOP walls were further considered in a fragility and vulnerability analysis of the CM1/LR/LD model. In the CM1/LR/MD model, both the IP system and OOP walls were able to mobilise their displacement capacity, as seen in Figure 21. However, the IP system had a much higher acceleration capacity than the OOP walls. The IP maximum capacity was comparable to the experimental results of full scale CM buildings with a global IP behaviour [121]. Observations from past earthquakes also indicated the good performance of well-built confined masonry buildings where the IP mechanism was ensured, due to the high in-plane capacity of these buildings [2]. On the other hand, it was also observed during past seismic events that OOP failure dominates in poorly built confined masonry buildings, due to the lack of good connections, inadequate confinement, and flaws in design and construction [4]. The capacity curves corresponding to the IP and OOP systems for the CM1/LR/MD model are shown in Figure 21b. Since the IP and OOP systems had significant difference in their strength and displacement capacity, a component-based vulnerability assessment was employed for this building.
A comparison of the capacity curves suggested that both the CM IBs had comparable displacement capacity to the OOP walls. However, the confinement improved the strength capacity of OOP wall in the CM1/LR/MD building by over 375% at the collapse stage. Even though this building showed global engagement of the IP and OOP walls (Figure 19), the base shear resisted by the IP system was higher than the OOP walls, by a factor of 6.6, due to the effective load transfer from the OOP to IP systems, while maintaining the overall integrity of the building. When compared with the URM typologies, the OOP walls of the CM1/LR/LD performs were close to those of the URM7/LR/LD model in terms of strength capacity, while having a four-times better displacement capacity, as expected from the vertical tie-columns and toothed interfaces at the wall joints providing better ductility. The displacement capacity was hence consistently improved for both the CM models as compared to all the URM7 models. The OOP walls of CM1/LR/MD showed significant improvement in ultimate strength as well, being increased by about 100% and 11% compared to the URM7/LR/MD and URM7/LR/HD models, respectively.

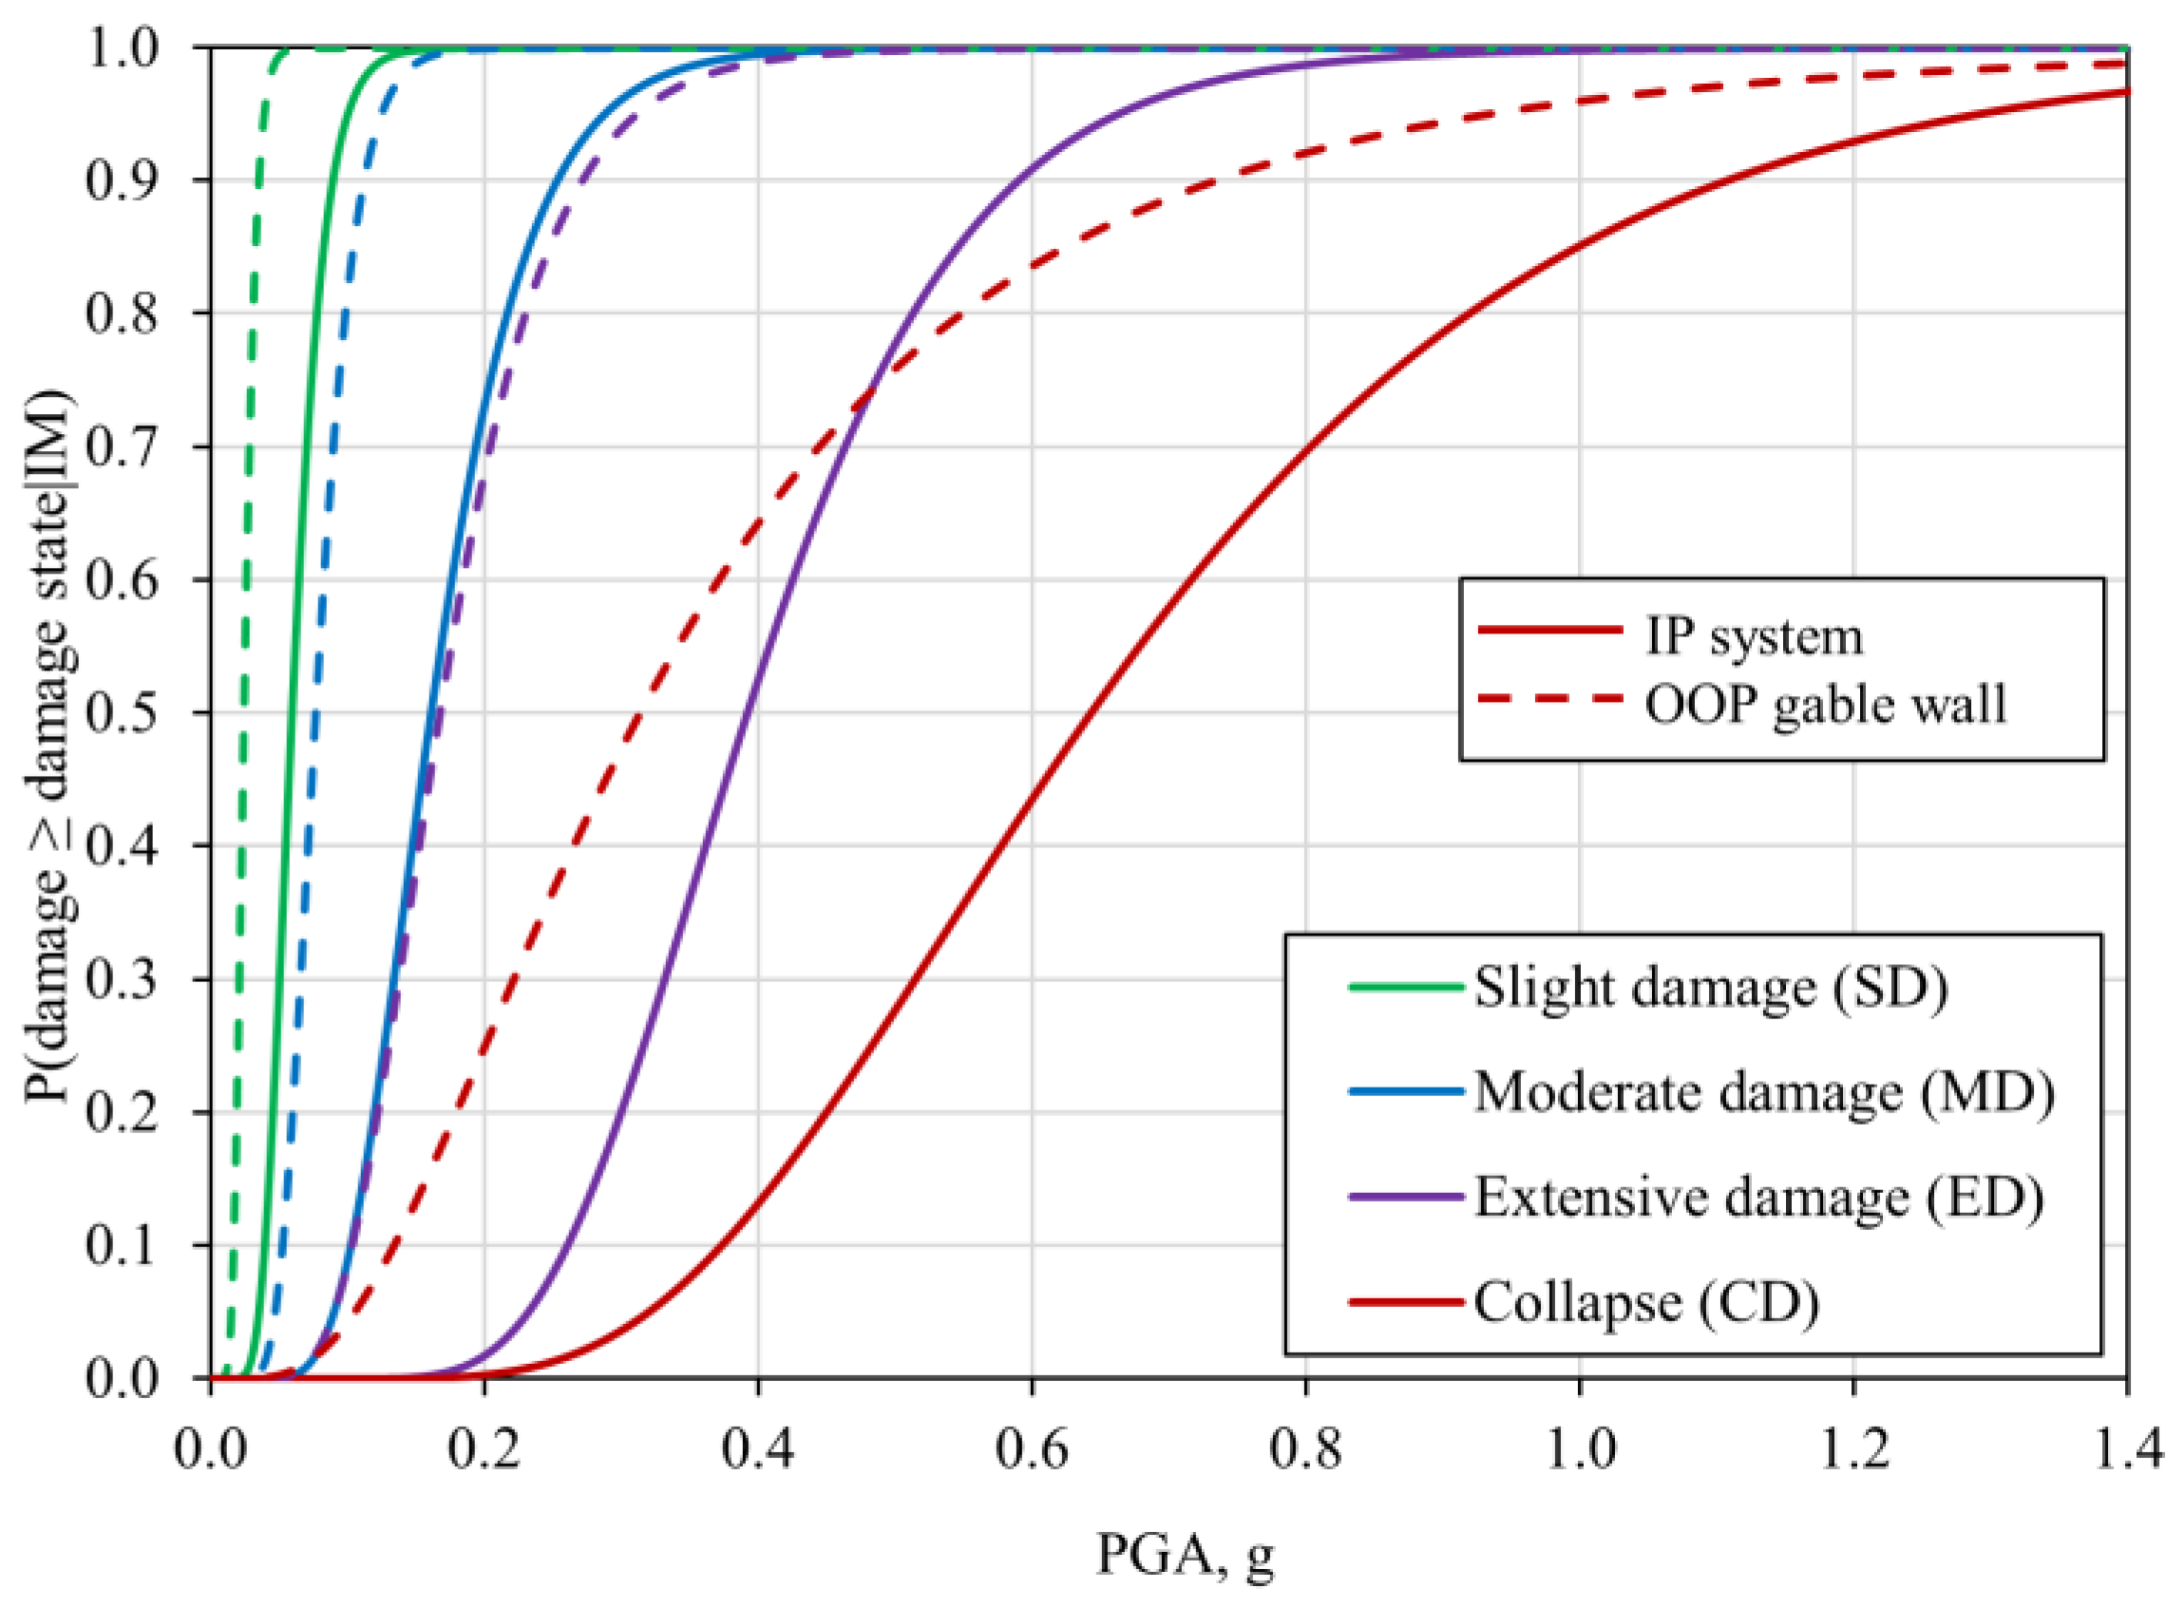
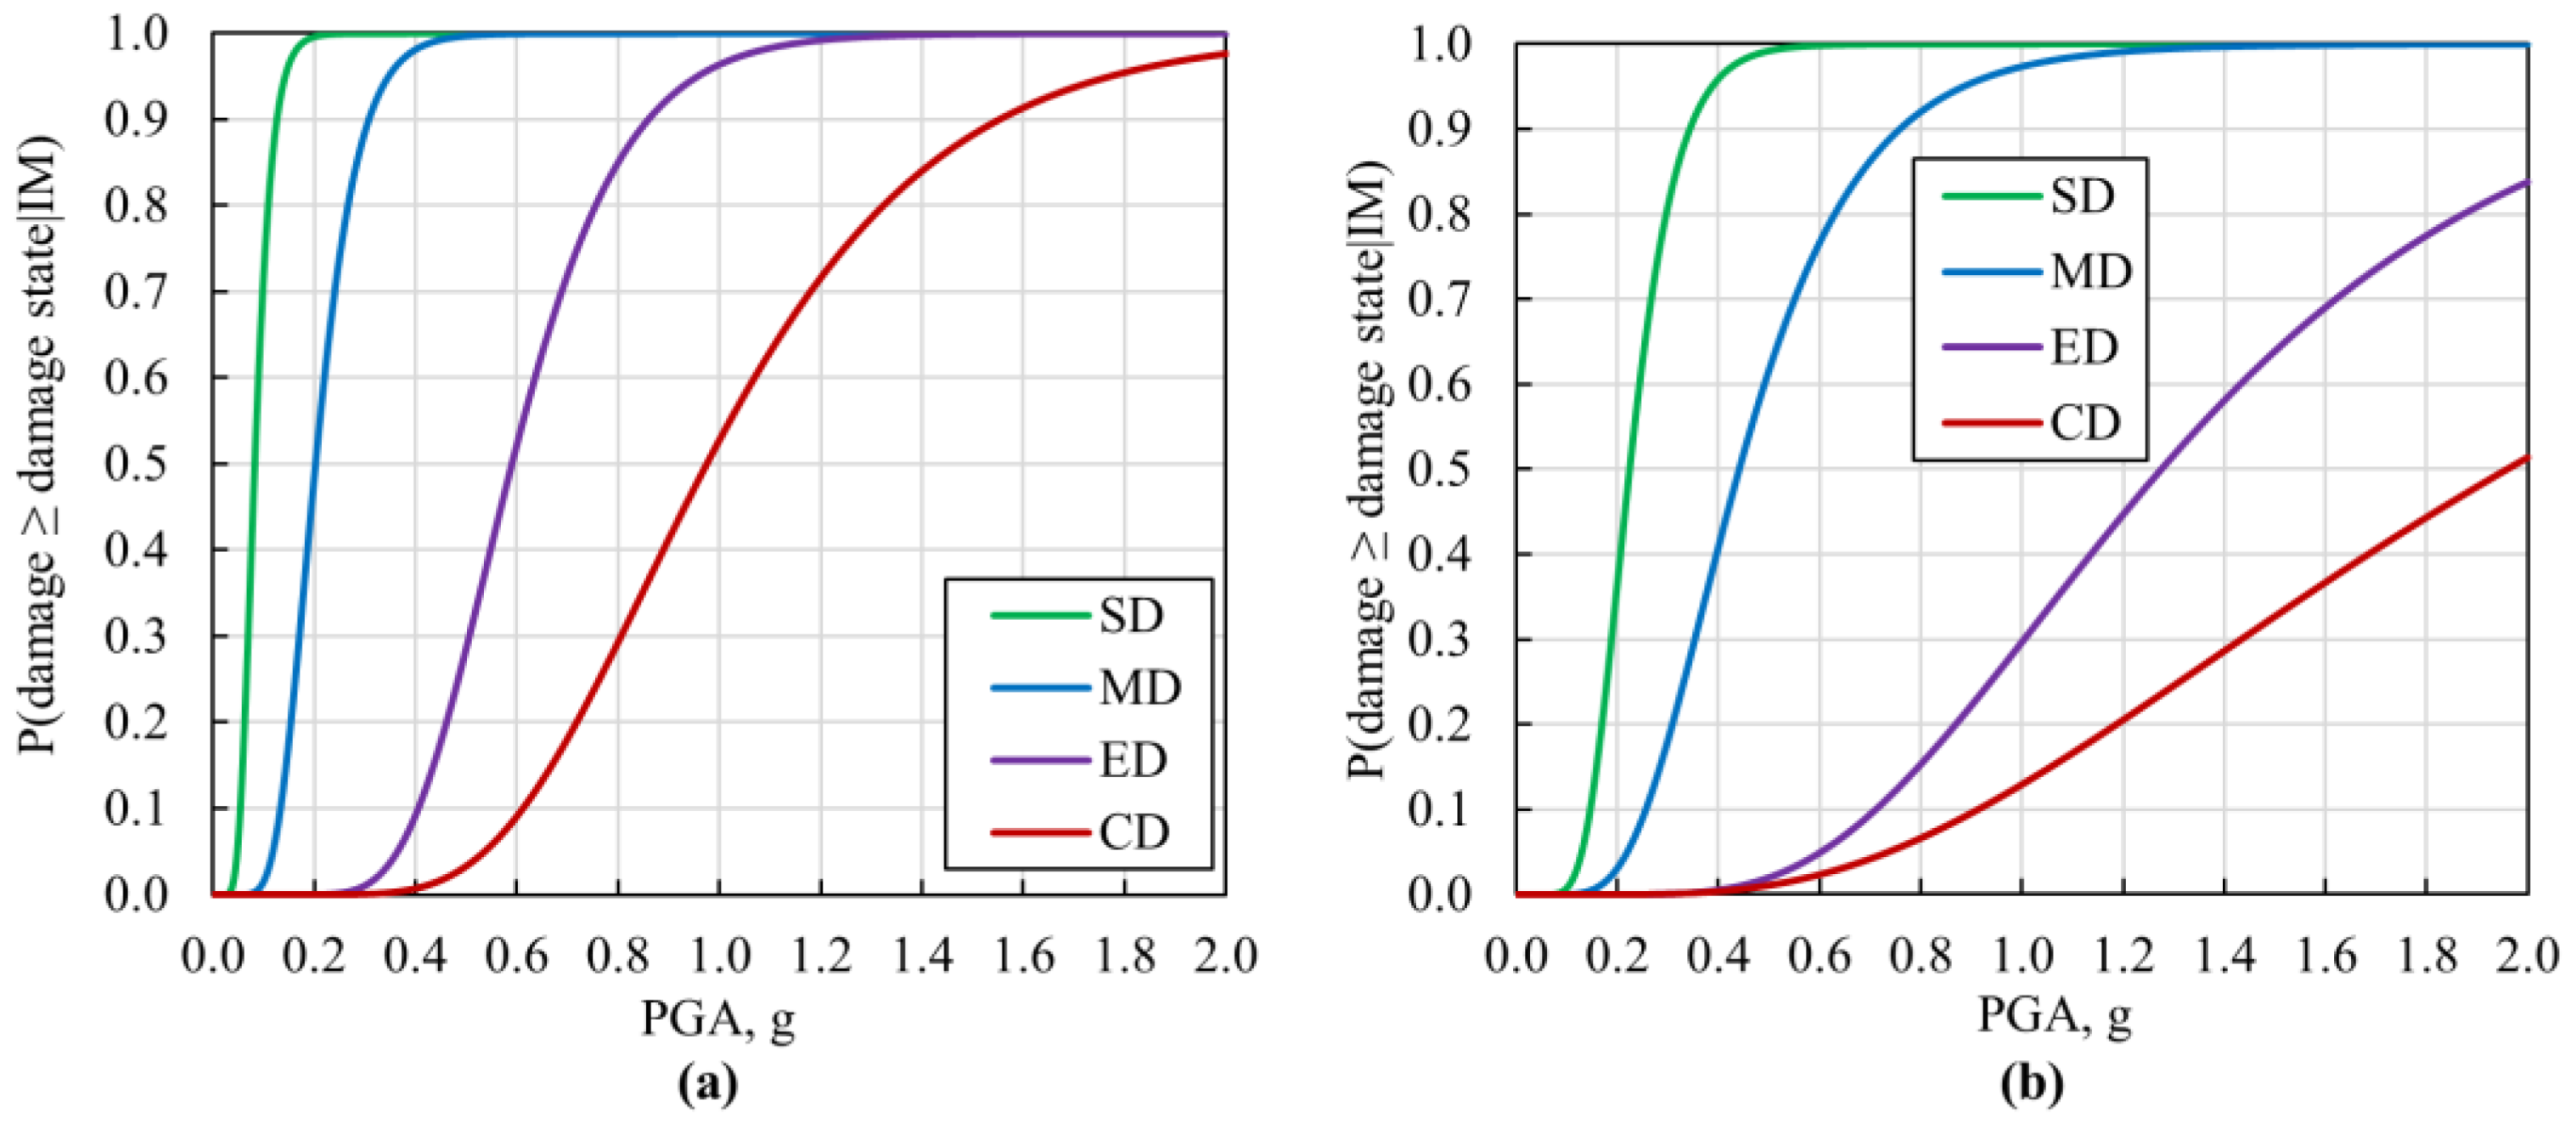
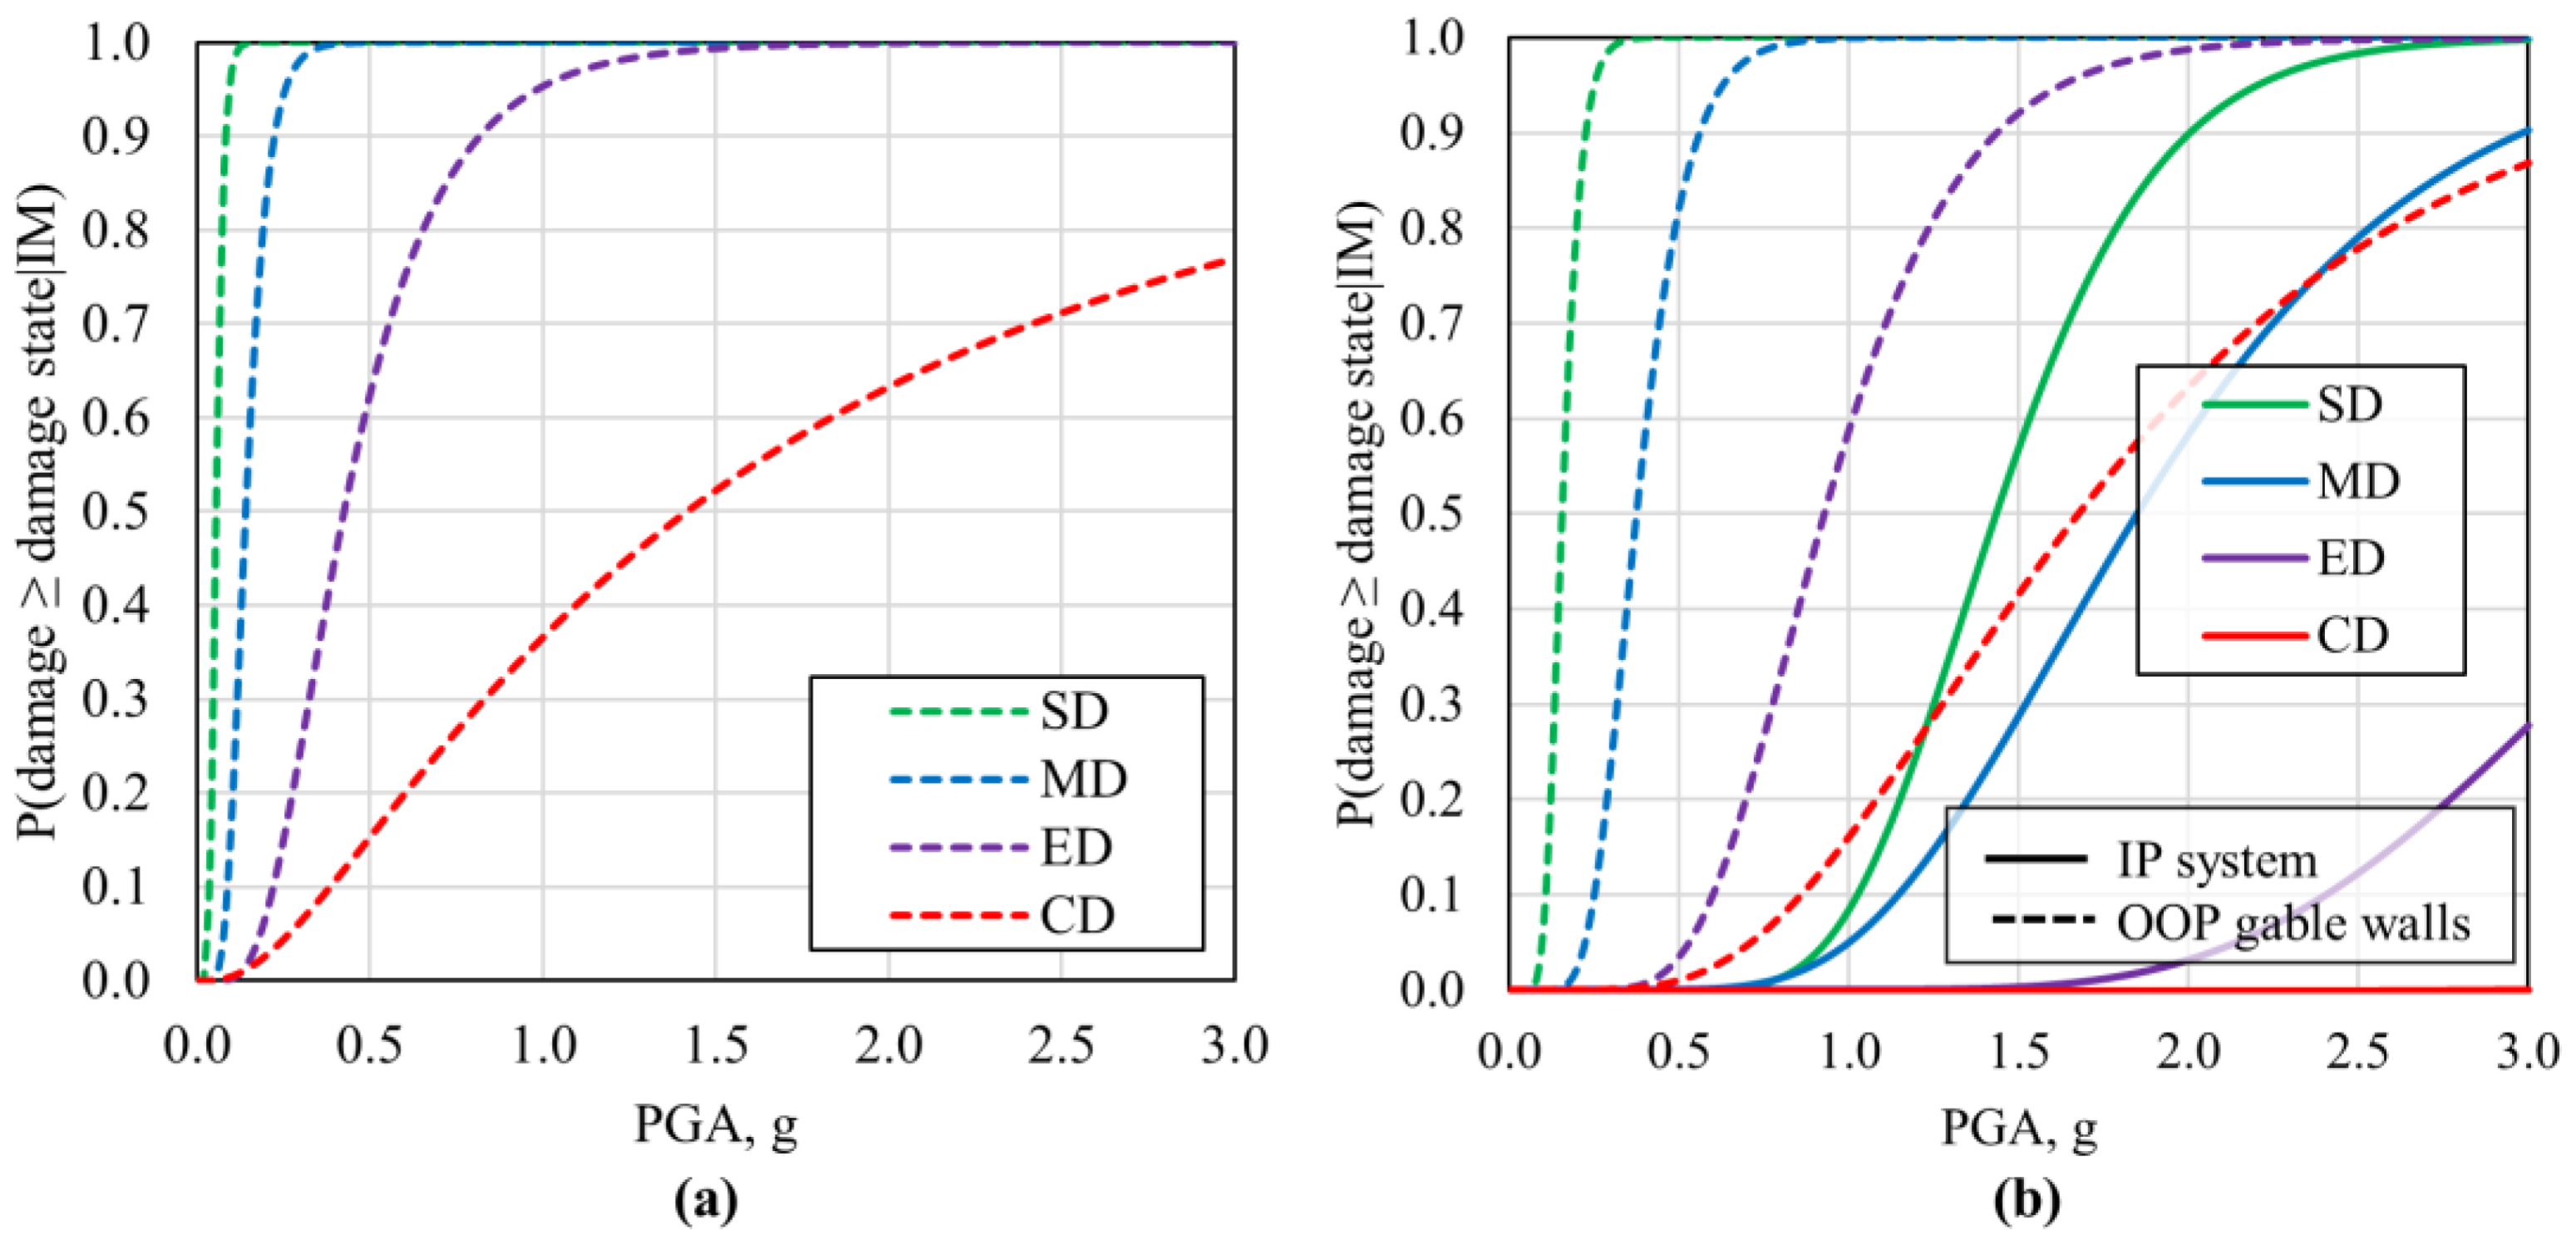
6.3. Fragility and Vulnerability Analysis

The global earthquake model (GEM) guidelines documented in D’Ayala et al. [8] were followed in this study, to conduct a NSP-based seismic performance assessment using the capacity curves and damage state thresholds presented in Section 6.2 and subsequently for the derivation of fragility functions and vulnerability functions. The N2 method [69] was used to generate performance points under the far-field ground motion records suite recommended by FEMA P–695 [112], thereby including record-to-record variability. Each of these ground motions were further scaled up and down so that the entire range of performance (i.e., from slight damage to collapse) was observed. Such a large cloud of data points is necessary for statistical fitting of analytical fragility functions. A least square regression of the performance points with respect to each damage state was then performed, to derive the fragility function. The reader is referred to D’Ayala et al. [8] for further reading on this procedure.
Following the discussion in Section 2.2 on the component-based seismic performance assessment approach, for the IBs that lacked a box-like behaviour, the fragility functions were derived with respect to the IP system and the OOP gable walls, respectively, using the respective capacity curves and thresholds of damage states (Figure 20 and Figure 21). Such component level fragility functions for the URM7/LR/LD case are presented in Figure 22, which clearly show that the median PGA capacity of the OOP gable walls for each damage state was significantly lower than those for the IP system. This means that the OOP gable walls had a much lower capacity and were more vulnerable than the IP system. For the IBs that showed global box-like behaviour and hence comparable capacities for both the IP system and OOP gable walls, a global fragility function was derived instead, using the global capacity curve. This was the case for the URM7/LR/MD and URM7/LR/HD models (see Figure 20), and their global fragility functions are shown in Figure 23a,b. A clear improvement in performance can be seen with the improvement in the seismic design level of the URM typologies. For example, 40% and 180% increases in the median PGA capacity for the collapse state were observed for the URM7/LR/HD and URM7/LR/HD models compared to the URM7/LR/LD model. Fragility functions for the two CM typologies with low and medium design levels are shown in Figure 24. As mentioned in Section 6.2, the fragility functions of CM1/LR/LD building were derived based only on the OOP wall capacity curves, while the component-based approach was applied to CM1/LR/MD, generating two sets of fragility functions, corresponding to OOP walls and the IP system. The large difference in strength capacities of these two components (as seen in Figure 21b) of CM1/LR/MD is reflected in the resulting fragility functions. Averaged over the four damage states, the median PGA capacity of the IP system was 7.5 times greater than the OOP gable walls. A comparison between the OOP gable walls of CM1/LR/LD and CM1/LR/MD suggested that the latter had an up to two times higher median PGA capacity than the former.
Once the set of fragility functions is generated, the mean (i.e., expectation) and variance of the vulnerability functions could be derived using the method of moments [122]. Although more complex methods incorporating the dispersion in the loss value corresponding to each damage state are available in the literature [8], the method of moments was used in this study because the quantification of the dispersion in the loss value for each damage state for specific regional scenario was beyond the scope of this study. The mean of the vulnerability function, also called the mean damage ratio (MDR), represents the ratio of the building repair cost to the replacement cost. The HAZUS consequence model [85] for school building class was used in this study, as country-specific damage-to-loss functions would be dependent on factors whose quantification was beyond the scope of this study, such as the cost of materials, labour costs, policies [8,123,124]. While the authors are aware of the limitations of such a choice, the HAZUS consequence model has been used by other researchers for seismic loss assessment in developing countries, e.g., Pakistan [125], and can be used for comparison of the relative vulnerability among different IBs within the same scenario.
For buildings where a component-based fragility assessment was carried out (see Figure 22), the vulnerability functions were also derived separately for the IP system and the OOP gable walls. These were subsequently combined, based on their relative mass contribution in the building, to finally generate a global building level mean vulnerability function, wherever applicable. Mass was considered herein for combining the vulnerability functions, as it represents the damage through the volume (both the surface as well as internal cracks through the masonry). Since the relative mass contribution also accounts for the mass of the floor and roof supported by the respective walls, the vulnerability of the horizontal structures was also accounted for in the global vulnerability functions. For example, for the URM7/LR/LD IB, the mass ratios of the IP system and the OOP gable walls were computed as 0.6 and 0.4, respectively. Thus, the individual component levels, as well as the resulting global vulnerability function, for the URM7/LR/LD IB are shown in Figure 25. With reference to Figure 22 and Figure 25, given an IM, the two systems (IP system and the OOP gable wall) contributed to the vulnerability with different damage states, and hence with different mean damage ratios. Thus, the global vulnerability function was the convolution of the fragility (with a different probability of being in different damage states) and vulnerability (with different mean damage ratio) of the two different systems. With these local level and global level fragility and vulnerability functions, the analyst has more clarity and can use these results in different scenarios, as per their requirements or preferences.
A comparison of building level vulnerability functions derived for all the case study buildings, shown in Figure 26, enabled the evaluation of their relative vulnerabilities within a specific typology and across the URM7 and CM typologies. PGA50% MDR, defined as the PGA capacity corresponding to 50% MDR, of the three URM7 IBs (LD, MD, and HD IBs) were 0.40 g, 0.75 g, and 1.10 g, respectively, showing a significant improvement in the seismic performance with improved seismic design levels. This also proves the necessity of considering different seismic design levels based on distinct construction features, as proposed in the GLOSI taxonomy developed by the authors. During the 2015 Nepal earthquake, a PGA distribution in the range of 0.5 g to 1.0 g was estimated in hard-hit regions. In line with the results of this work, most of the URM7/LR/LD buildings in these regions suffered collapse, while URM7/LR/MD and URM7/LR/HD buildings sustained only slight damage [64]. With respect to the CM IBs, Figure 26 shows a PGA50% MDR of 0.60 g and 2.7 g for the LD and MD models, respectively, which also demonstrates the improvement towards a global box-like response, as well as the enhanced seismic performance contributed by the additional seismic detailing in the MD model. Among the different typologies considered, URM7/LR/LD and CM1/LR/MD were the most and the least vulnerable typologies, respectively, as clearly shown in their construction types and the different seismic features. While the vulnerability of CM1/LR/LD was comparable to its URM counterpart at low PGA levels, its improved deformability contributed to a lower vulnerability in the higher intensity range. Throughout the PGA range, the vulnerability of the CM1/LR/MD was significantly lower compared to all three URM IBs, because of the improved stiffness, strength, and ductility provided by the RC tie-columns and toothing at the masonry–RC interfaces.

7. Conclusions

This study presented and illustrated a comprehensive strategy for a pushover-based seismic assessment methodology for masonry buildings, with or without box-like behaviour, and considering both the IP and OOP response along with their interaction during seismic loading. Applied element modelling, a discrete element approach, was employed for the numerical modelling and analysis, as it allows element-by-element modelling of low strength masonry. In terms of the novelty and scholarly contribution, the present work responds to two prevalent challenges in the seismic analysis of masonry buildings: the mechanism of effective pushover application for seismic analysis, and the strategy for reliable seismic performance assessment, especially when buildings lack global box-like behaviour. The IGA approach of pushover analysis was proposed and validated to address the first challenge, which ensured a mass-proportionate distribution of lateral load on the structural model and also overcame several issues associated with the conventional pushover approaches. It is noteworthy that this method can also be employed in the pushover analysis of RC or steel framed buildings. In order to address the second challenge, a component-based methodology was proposed, where a building was sub-divided into OOP walls and IP systems, depending on their failure mechanisms. A convolution of such component-based fragility functions then provides a more realistic global vulnerability function for such buildings, compared to a conventional “global capacity curve” based results.
The proposed methodology was applied to two major types of masonry construction: URM and CM, both with varying seismic design levels. For the URM IBs, the LD model showed a lack of global box-like behaviour and hence high vulnerability of the OOP gable wall. On the other hand, the provision of the roof band alone in the MD model proved to be effective in improving the global response, indicating that even low-cost seismic measures can yield seismic-resistant designs. The HD model showed full global response, realising the full capacity of both the IP and OOP walls, due to the provision of several seismic bands as well as buttresses.
In both the URM and CM typologies, the LD models showed a lack of box-like behaviour and hence a high vulnerability of the OOP walls. However, due the provision of seismic bands, the MD and HD models showed a gradual improvement in the global box-like behaviour. Although the CM/LR/LD case compared well to its URM7 counterpart at low PGA levels, the additional deformability proved beneficial in lowering the vulnerability at higher PGA levels. The CM1/LR/MD case exhibited a significantly lower vulnerability compared to all three URM IBs, mainly due to the provision of tie-columns and toothed connections.
Since the models in this study were developed using the material properties available in the literature, they possess uncertainties associated with their material characterisation and variability. In addition, the roof structure, which was not modelled in this study, could contribute to a partial connectivity among the vertical elements and hence imposing some diaphragm action. Consideration of these factors in future works could further improve the results presented in this study.

Author Contributions

Conceptualization, R.K.A., D.D. and A.P.V.; Methodology, R.K.A., D.D. and A.P.V.; Analysis and Validation, R.K.A. and A.P.V.; Writing—Original Draft Preparation, R.K.A. and A.P.V.; Writing—Review & Editing, R.K.A., D.D. and A.P.V.; Supervision, D.D. All authors have read and agreed to the published version of the manuscript.

Funding

The research presented in this paper is part of the PhD research works of Rohit Kumar Adhikari and Ahsana Parammal Vatteri, which were funded by the Overseas Research Scholarship (ORS) and Graduate Research Scholarship (GRS) Awards from University College London.

Institutional Review Board Statement

Not applicable.

Informed Consent Statement

Not applicable.

Data Availability Statement

The data presented in this study are available on request from the corresponding author.

Acknowledgments

We want to gratefully acknowledge the World Bank for granting access to their database on school buildings from Nepal.

Conflicts of Interest

The authors declare no conflict of interest.

References

  1. The World Bank. Global Library of School Infrastructure (GLOSI), Global Program for Safer Schools (GPSS). 2022. Available online: https://gpss.worldbank.org/en/glosi (accessed on 5 November 2022).
  2. EERI. Seismic Design Guide for Low-Rise Confined Masonry Buildings; Earthquake Engineering Research Institute: Oakland, CA, USA, 2011. [Google Scholar]
  3. Vatteri, A.P.; D’Ayala, D. Classification and seismic fragility assessment of confined masonry school buildings. Bull. Earthq. Eng. 2021, 19, 2213–2263. [Google Scholar] [CrossRef]
  4. Lagesse, R.; Rossetto, T.; Raby, A.; Brennan, A.; Robertson, D.; Adhikari, R.K.; Rezki-Hr, M.; Meilianda, E.; Idris, Y.; Rusdy, I.; et al. Observations from the EEFIT-TDMRC Mission to Sulawesi, Indonesia to Investigate the 28th September 2018 Central Sulawesi Earthquake. In SECED 2019 Conference: Earthquake Risk and Engineering towards a Resilient World; Society for Earthquake and Civil Engineering Dynamics (SECED): London, UK, 2019. [Google Scholar]
  5. D’Altri, A.M.; Sarhosis, V.; Milani, G.; Rots, J.; Cattari, S.; Lagomarsino, S.; Sacco, E.; Tralli, A.; Castellazzi, G.; de Miranda, S. Modeling Strategies for the Computational Analysis of Unreinforced Masonry Structures: Review and Classification. Arch. Comput. Methods Eng. 2020, 27, 1153–1185. [Google Scholar] [CrossRef]
  6. D’Ayala, D.; Speranza, E. Definition of Collapse Mechanisms and Seismic Vulnerability of Historic Masonry Buildings. Earthq. Spectra 2003, 19, 479–509. [Google Scholar] [CrossRef]
  7. Lagomarsino, S.; Penna, A.; Galasco, A.; Cattari, S. TREMURI program: An equivalent frame model for the nonlinear seismic analysis of masonry buildings. Eng. Struct. 2013, 56, 1787–1799. [Google Scholar] [CrossRef]
  8. D’Ayala, D.; Meslem, A.; Vamvastikos, D.; Porter, K.; Rossetto, T.; Crowley, H.; Silva, V. Guidelines for Analytical Vulnerability Assessment, Vulnerability Global Component Project; Global Earthquake Model (GEM) Foundation: Pavia, Italy, 2015. [Google Scholar]
  9. Lourenço, B. Computational strategies for masonry structures. Ph.D. Thesis, Delft University of Technology, Delft, Netherlands, 1996. [Google Scholar]
  10. Lourenco, P.B.; Rots, J.G. Multisurface Interface Model for Analysis of Masonry Structures. J. Eng. Mech. 1997, 123, 660–668. [Google Scholar] [CrossRef]
  11. Aref, A.J.; Dolatshahi, K.M. A three-dimensional cyclic meso-scale numerical procedure for simulation of unreinforced masonry structures. Comput. Struct. 2013, 120, 9–23. [Google Scholar] [CrossRef]
  12. Minga, E.; Macorini, L.; Izzuddin, B.A.; Calio, I. 3D macroelement approach for nonlinear FE analysis of URM components subjected to in-plane and out-of-plane cyclic loading. Eng. Struct. 2020, 220, 110951. [Google Scholar] [CrossRef]
  13. Pasticier, L.; Amadio, C.; Fragiacomo, M. Non-linear seismic analysis and vulnerability evaluation of a masonry building by means of the SAP2000 V.10 code. Earthq. Eng. Struct. Dyn. 2008, 37, 467–485. [Google Scholar] [CrossRef]
  14. Addessi, D.; Marfia, S.; Sacco, E.; Toti, J. Modeling approaches for masonry structures. Open Civ. Eng. J. 2014, 8, 288–300. [Google Scholar] [CrossRef] [Green Version]
  15. Heyman, J. The Stone Skeleton: Structural Engineering of Masonry Architecture; Cambridge University Press: Cambridge, UK, 1996; Volume 3. [Google Scholar]
  16. Sinha, B.P. A simplified ultimate load analysis of laterally loaded model orthotropic brickwork panels of low tensile strength. Struct. Eng. Part B 1978, 56, 81–84. [Google Scholar]
  17. D’Ayala, D.F. Numerical Modelling of Masonry Structures. In Structures & Construction in Historic Building Conservation; John Wiley & Sons, Inc.: New York, NY, USA, 2007; pp. 151–172. [Google Scholar] [CrossRef]
  18. Putrino, V. Multi-Hazard Vulnerability Assessment of Unreinforced Masonry Structures. Ph.D. Thesis, University College London, London, UK, 2021. [Google Scholar]
  19. Funari, M.F.; Pulatsu, B.; Szabó, S.; Lourenço, P.B. A solution for the frictional resistance in macro-block limit analysis of non-periodic masonry. Structures 2022, 43, 847–859. [Google Scholar] [CrossRef]
  20. Casapulla, C.; Giresini, L.; Lourenço, P.B. Rocking and kinematic approaches for rigid block analysis of masonry walls: State of the art and recent developments. Buildings 2017, 7, 69. [Google Scholar] [CrossRef] [Green Version]
  21. Page, A.W. Finite element model for masonry. J. Struct. Div. 1978, 104, 1267–1285. [Google Scholar] [CrossRef]
  22. Ali, S.; Page, A. 1987. Non-Linear Finite Element Analysis of Masonry Subjected to Concentrated Load. Proc. Inst. Civ. Eng. 1987, 83, 815–832. [Google Scholar]
  23. D’Ayala, D.; Carriero, A. Definition of the Mechanical Features of Historic Masonry and Assessment of Its Seismic Behaviour Through Analytical Tools. In Structural Studies of Historical Buildings IV. Volume 2: Dynamics, Repairs & Restoration; WIT Press: Southampton, UK, 1995; pp. 283–290. [Google Scholar]
  24. Gambarotta, L.; Lagomarsino, S. Damage Models for the Seismic Response of Brick Masonry Shear Walls. Part I: The Mortar Joint Model and Its Applications. Earthq. Eng. Struct. Dyn. 1997, 26, 423–439. [Google Scholar] [CrossRef]
  25. Milani, G.; Lourenço, B.; Tralli, A. Homogenised limit analysis of masonry walls, Part I: Failure surfaces. Comput. Struct. 2006, 84, 166–180. [Google Scholar] [CrossRef] [Green Version]
  26. Lourenco, P.; Milani, G.; Tralli, A.; Zucchini, A. Analysis of masonry structures: Review of and recent trends in homogenization techniques. Can. J. Civ. Eng. 2007, 34, 1443–1457. [Google Scholar] [CrossRef] [Green Version]
  27. Akhaveissy, A.H. Lateral strength force of URM structures based on a constitutive model for interface element. Lat. Am. J. Solids Struct. 2011, 8, 445–461. [Google Scholar] [CrossRef] [Green Version]
  28. Ferreira, C.F.; D’Ayala, D. Seismic Assessment and Retrofitting of Peruvian Earthen Churches by Means of Numerical Modelling. In Proceedings of the 15th World Conference on Earthquake Engineering, Lisbon, Portugal, 24–28 September 2012. [Google Scholar]
  29. Noor-E-Khuda, S.; Dhanasekar, M.; Thambiratnam, D. An explicit finite element modelling method for masonry walls under out-of-plane loading. Eng. Struct. 2016, 113, 103–120. [Google Scholar] [CrossRef] [Green Version]
  30. Silva, L.C.; Lourenço, P.B.; Milani, G. Nonlinear Discrete Homogenized Model for Out-of-Plane Loaded Masonry Walls. J. Struct. Eng. 2017, 143, 04017099. [Google Scholar] [CrossRef] [Green Version]
  31. Cundall, P.A. Formulation of a three-dimensional distinct element model-Part I. A scheme to detect and represent contacts in a system composed of many polyhedral blocks. Int. J. Rock Mech. Min. Sci. Géoméch. Abstr. 1988, 25, 107–116. [Google Scholar] [CrossRef]
  32. Lemos, J.V. Discrete Element Modeling of Masonry Structures. Int. J. Archit. Herit. 2007, 1, 190–213. [Google Scholar] [CrossRef]
  33. Shabrawi, A.E.; Verdel, T. Failure modes of old masonry walls and arches under seismic loading, analysed by the Distinct Element Method. In European Seismic Design Practice: Research and Application; CRC Press: Boca Raton, FL, USA, 1995; pp. 463–468. [Google Scholar]
  34. Azevedo, J.; Sincraian, G.; Lemos, J.V. Seismic behavior of blocky masonry structures. Earthq. Spectra 2000, 16, 337–365. [Google Scholar] [CrossRef]
  35. Alexandris, A.; Protopapa, E.; Psycharis, I. 2004 Collapse mechanisms of masonry buildings derived by the distinct element method. In Proceedings of the 13th World Conference on Earthquake Engineering, Vancouver, BC, Canada, 1–6 August 2004; Volume 548. [Google Scholar]
  36. Calio, I.; Marletta, M.; Panto, B. A new discrete element model for the evaluation of the seismic behaviour of unreinforced masonry buildings. Eng. Struct. 2012, 40, 327–338. [Google Scholar] [CrossRef]
  37. Sarhosis, V.; Sheng, Y. Identification of material parameters for low bond strength masonry. Eng. Struct. 2014, 60, 100–110. [Google Scholar] [CrossRef] [Green Version]
  38. Bui, T.; Limam, A.; Sarhosis, V.; Hjiaj, M. Discrete element modelling of the in-plane and out-of-plane behaviour of dry-joint masonry wall constructions. Eng. Struct. 2017, 136, 277–294. [Google Scholar] [CrossRef] [Green Version]
  39. Godio, M.; Stefanou, I.; Sab, K. Effects of the dilatancy of joints and of the size of the building blocks on the mechanical behavior of masonry structures. Meccanica 2018, 53, 1629–1643. [Google Scholar] [CrossRef]
  40. Smoljanović, H.; Živaljić, N.; Nikolić, Ž. A combined finite-discrete element analysis of dry stone masonry structures. Eng. Struct. 2013, 52, 89–100. [Google Scholar] [CrossRef]
  41. Smoljanović, H.; Živaljić, N.; Nikolić, Ž.; Munjiza, A. Numerical analysis of 3D dry-stone masonry structures by combined finite-discrete element method. Int. J. Solids Struct. 2018, 136–137, 150–167. [Google Scholar] [CrossRef]
  42. AlShawa, O.; Sorrentino, L.; Liberatore, D. Simulation Of Shake Table Tests on Out-of-Plane Masonry Buildings. Part (II): Combined Finite-Discrete Elements. Int. J. Archit. Herit. 2017, 11, 79–93. [Google Scholar] [CrossRef]
  43. Baraldi, D.; Emanuele, R.; Antonella, C. In plane loaded masonry walls: DEM and FEM/DEM models. A critical review. Meccanica 2018, 53, 1613–1628. [Google Scholar] [CrossRef]
  44. Pappas, A.; D’Ayala, D.; Dassanayake, D.T.; Antonini, A.; Raby, A. Rocking of offshore lighthouses under extreme wave impacts: Limit analysis, analytic formulations and distinct element method. Eng. Struct. 2021, 228, 111534. [Google Scholar] [CrossRef]
  45. Malomo, D.; DeJong, M.J. A Macro-Distinct Element Model (M-DEM) for simulating the in-plane cyclic behavior of URM structures. Eng. Struct. 2020, 227, 111428. [Google Scholar] [CrossRef]
  46. Meguro, K.; Tagel-Din, H. Applied element method for structural analysis: Theory and application for linear materials. Struct. Eng. Earthq. Eng. JSCE 2000, 17, 21–35. [Google Scholar] [CrossRef] [PubMed] [Green Version]
  47. Karbassi, A.; Nollet, M.J. Performance-based seismic vulnerability evaluation of masonry buildings using applied element method in a nonlinear dynamic-based analytical procedure. Earthq. Spectra 2013, 29, 399–426. [Google Scholar] [CrossRef]
  48. Mayorca, P.; Meguro, K. Modeling Masonry Structures using the Applied Element Method. Seisan Kenkyu 2003, 55, 581–584. [Google Scholar]
  49. Pandey, B.H.; Meguro, K. Simulation of Brick Masonry Wall Behaviour Under In-Plane Lateral Loding Using Applied Element Method. In Proceedings of the 13th World Conference on Earthquake Engineering, Vancouver, BC, Canada, 1–6 August 2004. [Google Scholar]
  50. Guragain, R. Development of Earthquake Risk Assessment System for Nepal. Ph.D. Thesis, The University of Tokyo, Tokyo, Japan, 2015. [Google Scholar]
  51. Malomo, D.; Pinho, R.; Penna, A. Using the Applied Element Method to simulate the dynamic response of full-scale URM houses tested to collapse or near-collapse conditions. In Proceedings of the 16th European Conference on Earthquake Engineering (16ECEE), Thessaloniki, Greece, 18–21 June 2018. [Google Scholar]
  52. Malomo, D.; Pinho, R.; Penna, A. Applied Element Modelling of the Dynamic Response of a Full-Scale Clay Brick Masonry Building Specimen with Flexible Diaphragms. Int. J. Archit. Herit. 2019, 14, 1484–1501. [Google Scholar] [CrossRef]
  53. Adhikari, R.K.; D’Ayala, D. 2015 Nepal earthquake: Seismic performance and post-earthquake reconstruction of stone in mud mortar masonry buildings. Bull. Earthq. Eng. 2020, 18, 3863–3896. [Google Scholar] [CrossRef] [Green Version]
  54. Gambarotta, L.; Lagomarsino, S. On the dynamic response of masonry panels. In Proceedings of the Italian Conference La meccanica delle murature tra teoria e Progetto; Pitagora: Bologna, Italy, 1996; pp. 451–462. (In Italiano) [Google Scholar]
  55. Magenes, G.; Della Fontana, A. Simplified Non-linear Seismic Analysis of Masonry Buildings. Proc. Br. Mason. Soc. 1998, 8, 190–195. [Google Scholar] [CrossRef]
  56. Kappos, A.J.; Penelis, G.G.; Drakopoulos, C.G. Evaluation of simplified models for lateral load analysis of unreinforced masonry buildings. J. Struct. Eng. 2002, 128, 890–897. [Google Scholar] [CrossRef]
  57. Roca, P.; Molins, C.; Marí, A.R. Strength Capacity of Masonry Wall Structures by the Equivalent Frame Method. J. Struct. Eng. 2005, 131, 1601–1610. [Google Scholar] [CrossRef]
  58. Belmouden, Y.; Lestuzzi, P. An equivalent frame model for seismic analysis of masonry and reinforced concrete buildings. Constr. Build. Mater. 2009, 23, 40–53. [Google Scholar] [CrossRef]
  59. Petry, S.; Beyer, K. Influence of boundary conditions and size effect on the drift capacity of URM walls. Eng. Struct. 2014, 65, 76–88. [Google Scholar] [CrossRef] [Green Version]
  60. Penna, A. Seismic assessment of existing and strengthened stone-masonry buildings: Critical issues and possible strategies. Bull. Earthq. Eng. 2015, 13, 1051–1071. [Google Scholar] [CrossRef]
  61. Marino, S.; Cattari, S.; Lagomarsino, S.; Ingham, J.; Dizhur, D. Modelling of two damaged unreinforced masonry buildings following the Canterbury earthquakes. In Proceedings of the 2016 NZSEE Conference, Christchurch, New Zealand, 1–3 April 2016. [Google Scholar]
  62. Nakamura, Y.; Derakhshan, H.; Magenes, G.; Griffith, M.C. Influence of Diaphragm Flexibility on Seismic Response of Unreinforced Masonry Buildings. J. Earthq. Eng. 2017, 21, 935–960. [Google Scholar] [CrossRef] [Green Version]
  63. Davino, A.; Longobardi, G.; Meglio, E.; Dallari, A.; Formisano, A. Seismic Energy Upgrading of an Existing Brick Masonry Building by a Cold-Formed Steel Envelope System. Buildings 2022, 12, 1918. [Google Scholar] [CrossRef]
  64. Adhikari, R.K. A Methodological Framework for Seismic Vulnerability Assessment of Masonry School Buildings: Application to Nepal. Ph.D. Thesis, University College London, London, UK, 2021. [Google Scholar]
  65. Vamvatsikos, D.; Cornell, C.A. Incremental dynamic analysis. Earthq. Eng. Struct. Dyn. 2002, 31, 491–514. [Google Scholar] [CrossRef]
  66. Jalayer, F. Direct probabilistic seismic analysis: Implementing non-linear dynamic assessments. Ph.D. Thesis, Stanford University, Stanford, CA, USA, 2003. [Google Scholar]
  67. Jalayer, F.; Cornell, C.A. Alternative non-linear demand estimation methods for probability-based seismic assessments. Earthq. Eng. Struct. Dyn. 2009, 38, 951–972. [Google Scholar] [CrossRef]
  68. Freeman, S.A. The Capacity Spectrum Method. In Proceedings of the 11th European Conference on Earthquake Engineering, Paris, France, 6–11 September 1998. [Google Scholar]
  69. Fajfar, P. A non-linear analysis method for performance-based seismic design. Earthq. Spectra 2000, 16, 573–592. [Google Scholar] [CrossRef]
  70. Ademovic, N.; Hrasnica, M.; Oliveira, D.V. Pushover analysis and failure pattern of a typical masonry residential building in Bosnia and Herzegovina. Eng. Struct. 2013, 50, 13–29. [Google Scholar] [CrossRef] [Green Version]
  71. Lagomarsino, S.; Cattari, S. Fragility Functions of Masonry Buildings. Geotech. Geol. Earthq. Eng. 2014, preprint. [Google Scholar] [CrossRef]
  72. Gonzalez-Drigo, R.; Avila-Haro, J.A.; Barbat, A.H.; Pujades, L.G.; Vargas, Y.F.; Lagomarsino, S.; Cattari, S. Modernist unreinforced masonry (URM) buildings of Barcelona: Seismic vulnerability and risk assessment. Int. J. Archit. Herit. 2015, 9, 214–230. [Google Scholar] [CrossRef]
  73. FEMA-440 Improvement of Nonlinear Static Seismic Analysis Procedures; Federal Emergency Management Agency: Washington, DC, USA, 2005.
  74. Parisi, F.; Augenti, N. Uncertainty in seismic capacity of masonry buildings. Buildings 2012, 2, 218–230. [Google Scholar] [CrossRef] [Green Version]
  75. Bucchi, F.; Arangio, S.; Bontempi, F. Seismic Assessment of an Historical Masonry Building Using Nonlinear Static Analysis. In Proceedings of the Fourteenth International Conference on Civil, Structural and Environmental Engineering Computing, Cagliari, Italy, 3–6 September 2013; p. 72. [Google Scholar] [CrossRef]
  76. Endo, Y.; Pelà, L.; Roca, P. Review of Different Pushover Analysis Methods Applied to Masonry Buildings and Comparison with Nonlinear Dynamic Analysis. J. Earthq. Eng. 2017, 21, 1234–1255. [Google Scholar] [CrossRef] [Green Version]
  77. Lourenco, P.; Karanikoloudis, G. Seismic behavior and assessment of masonry heritage structures. Needs in engineering judgement and education. RILEM Tech. Lett. 2019, 3, 114–120. [Google Scholar] [CrossRef] [Green Version]
  78. Calvi, G.M. A displacement-based approach for vulnerability evaluation of classes of buildings. J. Earthq. Eng. 1999, 3, 411–438. [Google Scholar] [CrossRef]
  79. Lang, K. Seismic Vulnerability of Existing Buildings; Hochschulverlag AG.: Zurich, Switzerland, 2002. [Google Scholar]
  80. Galasco, A.; Lagomarsino, S.; Penna, A. On the use of pushover analysis for existing masonry buildings. In Proceedings of the First European Conference on Earthquake Engineering and Seismology, Geneva, Switzerland, 3–8 September 2006. [Google Scholar]
  81. Olivito, R.S.; Porzio, S. A new multi-control-point pushover methodology for the seismic assessment of historic masonry buildings. J. Build. Eng. 2019, 26, 100926. [Google Scholar] [CrossRef]
  82. Beconcini, M.L.; Formichi, P.; Giresini, L.; Landi, F.; Puccini, B.; Croce, P. Modeling Approaches for the Assessment of Seismic Vulnerability of Masonry Structures: The E-PUSH Program. Buildings 2022, 12, 346. [Google Scholar] [CrossRef]
  83. D’Ayala, D.F. Force and displacement based vulnerability assessment for traditional buildings. Bull. Earthq. Eng. 2005, 3, 235–265. [Google Scholar] [CrossRef]
  84. Penna, A.; Rota, M.; Mouyiannou, A.; Magenes, G.; Papadrakakis, M. Issues on the use of time-history analysis for the design and assessment of masonry structures. In Proceedings of the 4th International Conference on Computational Methods in Structural Dynamics and Earthquake Engineering, Thematic Conferences, COMPDYN 2013, Kos Island, Greece, 12–14 June 2013; pp. 669–686. [Google Scholar] [CrossRef] [Green Version]
  85. FEMA. Earthquake Loss Estimation Methodology—HAZUS MH 2.1; Federal Emergency Management Agency: Washington, DC, USA, 2015. [Google Scholar]
  86. Bhagat, S.; Buddika, H.A.D.S.; Adhikari, R.K.; Shrestha, A.; Bajracharya, S.; Joshi, R.; Singh, J.; Maharjan, R.; Wijeyewickrema, A.C. Damage to Cultural Heritage Structures and Buildings Due to the 2015 Nepal Gorkha Earthquake. J. Earthq. Eng. 2018, 22, 1861–1880. [Google Scholar] [CrossRef]
  87. Adhikari, R.K.; D’Ayala, D. Applied Element Modelling and Pushover Analysis of Unreinforced Masonry Buildings with Flexible Roof Diaphragm. In Proceedings of the 7th International Conference on Computational Methods in Structural Dynamics and Earthquake Engineering; European Community on Computational Methods in Applied Sciences (ECCOMAS): Crete, Greece, 2019. [Google Scholar]
  88. Adhikari, R.K.; D’Ayala, D.; Fernandez, R.; Yamin, L.; Nassirpour, A.; Vatteri, A.; Ferreira, C.F.; Cortes, F.R. GLOSI Taxonomy: A tool for ‘seismic risk assessment’ oriented classification of school buildings. Int. J. Disaster Risk Reduct. 2022, accepted. [Google Scholar]
  89. The World Bank. Structural Integrity and Damage Assessment for Educational Infrastructure in Nepal: Results and Findings (Phase I and II); The World Bank: Washington, DC, USA, 2016. [Google Scholar]
  90. NBC 203 Guidelines for Earthquake Resistant Building Construction: Low Strength Masonry; Nepal National Building Code, Department of Urban Development and Building Construction: Kathmandu, Nepal, 2015.
  91. Pathak, J. Status Survey of School and Hospital Buildings in Guwahati City Vol-I; Assam State Disaster Management Authority (ASDMA): Guwahati, India, 2014.
  92. Vatteri, A.P. Performance Assessment of Masonry School Buildings to Seismic and Flood Hazards Using Bayesian Networks. Ph.D. Thesis, University College London, London, UK, 2022. [Google Scholar]
  93. Parajuli, H.R. Determination of mechanical properties of the Kathmandu World Heritage brick masonry buildings. In Proceedings of the 15th World Conference on Earthquake Engineering, Lisbon, Portugal, 24–28 September 2012. [Google Scholar]
  94. Phaiju, S.; Pradhan, P.M. Experimental work for mechanical properties of brick and masonry panel. J. Sci. Eng. 2018, 5, 51–57. [Google Scholar] [CrossRef]
  95. Shrestha, S. A Case Study of Brick Properties Manufacture in Bhaktapur. J. Sci. Eng. 2019, 7, 27–33. [Google Scholar] [CrossRef]
  96. Endo, Y.; Yamaguchi, K.; Hanazato, T.; Mishra, C. Characterisation of mechanical behaviour of masonry composed of fired bricks and earthen mortar. Eng. Fail. Anal. 2020, 109, 104280. [Google Scholar] [CrossRef]
  97. Dixit, A.M.; Yatabe, R.; Dahal, R.K.; Bhandary, N.P. Public school earthquake safety program in Nepal. Geomat. Nat. Hazards Risk 2013, 5, 293–319. [Google Scholar] [CrossRef]
  98. Choudhury, C.P.; Pathak, J. Analytical study of seismic response of traditional Assam-type housing in north-east India. In Proceedings of the 15th Symposium on Earthquake Engineering, Roorkee, India, 11–13 December 2014. [Google Scholar]
  99. Kaushik, H.B.; Rai, D.C.; Jain, S.K. Stress-Strain Characteristics of Clay Brick Masonry under Uniaxial Compression. J. Mater. Civ. Eng. 2007, 19, 728–739. [Google Scholar] [CrossRef]
  100. Riahi, Z. Backbone Model for Confined Masonry Walls for Performance-Based Seismic Design; The University of British Columbia: Vancouver, BC, Canada, 2007. [Google Scholar] [CrossRef]
  101. Tomaževič, M. Shear resistance of masonry walls and Eurocode 6: Shear versus tensile strength of masonry. Mater. Struct. 2009, 42, 889–904. [Google Scholar] [CrossRef]
  102. Singhal, V.; Rai, D.C. Suitability of Half-Scale Burnt Clay Bricks for Shake Table Tests on Masonry Walls. J. Mater. Civ. Eng. 2014, 26, 644–657. [Google Scholar] [CrossRef]
  103. Pluijm, R. Shear Behaviour of Bed Joints. In Proceedings of the 6th North American Masonry Conference, Philadelphia, PA, USA, 6–9 June 1993. [Google Scholar]
  104. Tripathy, D.; Singhal, V. Estimation of in-plane shear capacity of confined masonry walls with and without openings using strut-and-tie analysis. Eng. Struct. 2019, 188, 290–304. [Google Scholar] [CrossRef]
  105. ASI. Extreme Loading for Structures® (ELS) Software and User Manual; Applied Science International: Durham, NC, USA, 2022.
  106. Vermeltfoort, A.T.; Raijmakers, T.; Janssen, H.J.M. Shear Tests on Masonry Walls. In Proceedings of the 6th North American Masonry Conference, Philadelphia, PA, USA, 6–9 June 1993; Hamid, A.A., Harris, H., Eds.; Technomic Publishing Company: Lancaster, PA, USA; pp. 1183–1193. [Google Scholar]
  107. Quiroz, L.G.; Maruyama, Y.; Zavala, C. Cyclic behavior of Peruvian confined masonry walls and calibration of numerical model using genetic algorithms. Eng. Struct. 2014, 75, 561–576. [Google Scholar] [CrossRef]
  108. Vaculik, J. Unreinforced masonry walls subjected to out-of-plane seismic actions. Ph.D. Thesis, University of Adelaide, Singapore, 2012. [Google Scholar]
  109. Galvez, F.; Segatta, S.; Giaretton, M.; Walsh, K.; Giongo, I.; Dizhur, D. FE and DE modelling of out-of-plane two way bending behaviour of unreinforced masonry walls. In Proceedings of the 16th European Conference on Earthquake Engineering, Thessaloniki, Greece, 18–21 June 2018. [Google Scholar]
  110. Tomaževič, M. Earthquake-Resistant Design of Masonry Buildings; Imperial College Press: London, UK, 1999; Volume 1. [Google Scholar]
  111. Bosiljkov, V.Z.; Totoev, Y.Z.; Nichols, J.M. Shear modulus and stiffness of brickwork masonry: An experimental perspective. Struct. Eng. Mech. 2005, 20, 21–43. [Google Scholar] [CrossRef] [Green Version]
  112. FEMA P695 Quantification of Building Seismic Performance Factors; Federal Emergency Management Agency: Washington, DC, USA, 2009.
  113. Tomaževič, M. Damage as a measure for earthquake-resistant design of masonry structures: Slovenian experience. Can. J. Civ. Eng. 2007, 34, 1403–1412. [Google Scholar] [CrossRef]
  114. Galasco, A.; Lagomarsino, S.; Penna, A. Non linear macro-element dynamic analysis of masonry buildings. In Proceedings of the ECCOMAS Thematic Conference on Computational Methods in Structural Dynamics and Earthquake Engineering, Crete, Greece, 13–16 June 2007; pp. 13–16. [Google Scholar]
  115. Ahmadi, S.S.; Karanikoloudis, G.; Mendes, N.; Illambas, R.; Lourenço, B. Appraising the Seismic Response of a Retrofitted Adobe Historic Structure, the Role of Modal Updating and Advanced Computations. Buildings 2022, 12, 1795. [Google Scholar] [CrossRef]
  116. Varela-Rivera, J.; Navarrete-Macias, D.; Fernandez-Baqueiro, L.; Moreno, E. Out-of-plane behaviour of confined masonry walls. Eng. Struct. 2011, 33, 1734–1741. [Google Scholar] [CrossRef]
  117. Griffith, M.C.; Magenes, G.; Melis, G.; Picchi, L. Evaluation of out-of-plane stability of unreinforced masonry walls subjected to seismic excitation. J. Earthq. Eng. 2003, 7, 141–169. [Google Scholar] [CrossRef]
  118. Bothara, J.K.; Dhakal, R.P.; Mander, J.B. Seismic performance of an unreinforced masonry building: An experimental investigation. Earthq. Eng. Struct. Dyn. 2009, 39, 45–68. [Google Scholar] [CrossRef]
  119. Salmanpour, A.H.; Mojsilović, N.; Schwartz, J. Displacement capacity of contemporary unreinforced masonry walls: An experimental study. Eng. Struct. 2015, 89, 1–16. [Google Scholar] [CrossRef]
  120. Ahmad, N.; Ali, Q.; Javed, M. Force reduction factor R for shear dominated low-rise brick masonry structures. Numer. Methods Civ. Eng. J. 2018, 2, 14–29. [Google Scholar] [CrossRef]
  121. Zavala, C.; Honma, C.; Gibu, P.; Gallardo, J.; Huaco, G. Full scale on line test on two story masonry building using handmade bricks. In Proceedings of the 13th World Conference on Earthquake Engineering, Vancouver, BC, Canada, 1–6 August 2004. [Google Scholar]
  122. Yamin, L.E.; Hurtado, A.I.; Barbat, A.H.; Cardona, O.D. Seismic and wind vulnerability assessment for the GAR-13 global risk assessment. Int. J. Disaster Risk Reduct. 2014, 10, 452–460. [Google Scholar] [CrossRef] [Green Version]
  123. Hill, M.; Rossetto, T. Comparison of building damage scales and damage descriptions for use in earthquake loss modelling in Europe. Bull. Earthq. Eng. 2008, 6, 335–365. [Google Scholar] [CrossRef]
  124. Bal, İ.E.; Crowley, H.; Pinho, R.; Gülay, F.G. Detailed assessment of structural characteristics of Turkish RC building stock for loss assessment models. Soil Dyn. Earthq. Eng. 2008, 28, 914–932. [Google Scholar] [CrossRef]
  125. Ahmad, N.; Ali, Q.; Ashraf, M.; Alam, B.; Naeem, A. Seismic vulnerability of the Himalayan half-dressed rubble stone masonry structures, experimental and analytical studies. Nat. Hazards Earth Syst. Sci. 2012, 12, 3441–3454. [Google Scholar] [CrossRef]
Figure 1. Methodological approach for the seismic performance assessment of masonry buildings.
Buildings 13 00159 g001
Figure 2. (a) Illustration of OOP gable walls and IP system for an URM lacking box-like behaviour, and (b) capacity curves for the OOP gable wall and the IP system.
Buildings 13 00159 g002
Figure 3. Construction characteristics of the case study URM school building: (a) outside longitudinal view, (b) inside view showing the short gable wall and light steel roof structure, and (c) building plan with dimensions.
Buildings 13 00159 g003
Figure 4. Criteria for assigning the seismic design level in a URM building.
Buildings 13 00159 g004
Figure 5. (a) A masonry school building in Nepal retrofitted with a roof band after the 2015 Gorkha earthquake (URM7/LR/MD IB), and (b) A newly built school building in Nepal (URM7/LR/HD).
Buildings 13 00159 g005
Figure 6. Criteria for assigning the seismic design level of confined masonry buildings.
Buildings 13 00159 g006
Figure 7. Photographs representative of the case study CM school building (CM1/LR/LD): (a) isometric view, (b) typical longitudinal view, and (c) typical plan dimensions.
Buildings 13 00159 g007
Figure 8. A CM building representative of the CM1/LR/MD typology.
Buildings 13 00159 g008
Figure 9. AEM modelling: (a) principle of element connectivity, and (b) discretisation and connectivity of elements in CM walls.
Buildings 13 00159 g009
Figure 10. Comparisons of the (a) load-deformation behaviour and (b) experimental [106] and numerical damage patterns obtained in this study.
Buildings 13 00159 g010
Figure 11. (a) Experimental crack pattern at the end of push and pull cycles—Case 1 [23] (b) AEM numerical crack pattern at the end of push cycle, and (c) load–displacement curves from experiment and ELS model.
Buildings 13 00159 g011
Figure 12. (a) Comparisons of load–deformation curves, and (b) comparison of crack patterns.
Buildings 13 00159 g012
Figure 13. URM7/MR/LD building: (a) isometric view and (b) AEM numerical model.
Buildings 13 00159 g013
Figure 14. Capacity curves obtained from pushover analysis using the IGA method and different lateral load patterns, against the median NLTHA backbone curves.
Buildings 13 00159 g014
Figure 15. Collapse mechanism of the URM7/MR/LD IB under different pushover loading schemes: (a) triangular and 1st mode proportional, (b) uniform, and (c) mass proportional and the IGA approach.
Buildings 13 00159 g015
Figure 16. Numerical models of URM buildings: (a) URM7/LR/LD, (b) URM7/LR/MD, and (c) URM-URM7/LR/HD IBs.
Buildings 13 00159 g016
Figure 17. Numerical model of confined masonry buildings: (a) CM1/LR/LD and (b) CM1/LR/MD.
Buildings 13 00159 g017
Figure 18. Collapse mechanism of the URM buildings (a) URM7/LR/LD model, (b) URM7/LR/MD model, and (c) URM7/LR/HD model. Blue colour represents 5–10 mm wide cracks.
Buildings 13 00159 g018
Figure 19. Collapse mechanisms of the CM IBs: (a) CM1/LR/LD (no global box-like behaviour; OOP overturning of the gable is limited to the portion above lintel band), and (b) CM1/LR/MD (Global engagement of IP and OOP walls). Blue colour represents cracks wider than 10 mm.
Buildings 13 00159 g019
Figure 20. Comparison of capacity curves and damage state thresholds for the URM7 models with different seismic design levels: (a) IP system, and (b) OOP gable wall.
Buildings 13 00159 g020
Figure 21. Capacity curves for the OOP gable wall and the IP system of the (a) CM1/LR/LD and (b) CM1/LR/MD IBs.
Buildings 13 00159 g021
Figure 22. Component level fragility functions for the URM7/LR/LD model.
Buildings 13 00159 g022
Figure 23. Fragility functions for the (a) URM7 LD/MD and (b) URM7 LD/HD models.
Buildings 13 00159 g023
Figure 24. Fragility functions for the (a) CM1/LD/LD (OOP gable walls) and (b) CM1/LD/MD models.
Buildings 13 00159 g024
Figure 25. Vulnerability functions of the OOP gable walls, IP system, and the global building level for the URM7/LR/LD building type, derived from their respective fragility functions.
Buildings 13 00159 g025
Figure 26. Vulnerability functions for the different seismic design levels of the URM7/LR and CM1/LR building types.
Buildings 13 00159 g026
Table 1. Material properties used for the AEM modelling of URM and CM buildings.
PropertyValue Per TypologyUnits
URMReferenceCMReference
Unit weight of masonry1920.00[50]1920.00[98]kg/m3
Compressive strength of masonry4.144.63[98]MPa
Young’s modulus of masonry872.002546.00[99]MPa
Cohesion0.170.40[100]MPa
Tensile strength of masonry0.070.20[101,102]MPa
Friction coefficient0.600.60[103,104]
Table 2. Outcomes of the AEM validation studies on the URM and CM cases.
Material PropertyCalibration in Numerical Modelling
Modulus of elasticity (E)None
Shear modulus (G)(10–15%) of E
Compressive strengthNone
Tensile strength and cohesion15–25% reduction
Friction coefficient20–30% reduction
Disclaimer/Publisher’s Note: The statements, opinions and data contained in all publications are solely those of the individual author(s) and contributor(s) and not of MDPI and/or the editor(s). MDPI and/or the editor(s) disclaim responsibility for any injury to people or property resulting from any ideas, methods, instructions or products referred to in the content.

