
Mechanical Properties and Microstructure Analysis of Cement Mortar Mixed with Iron Ore Tailings

Abstract
:1. Introduction
2. Materials and Test Methods
2.1. Materials
2.2. Test Methods
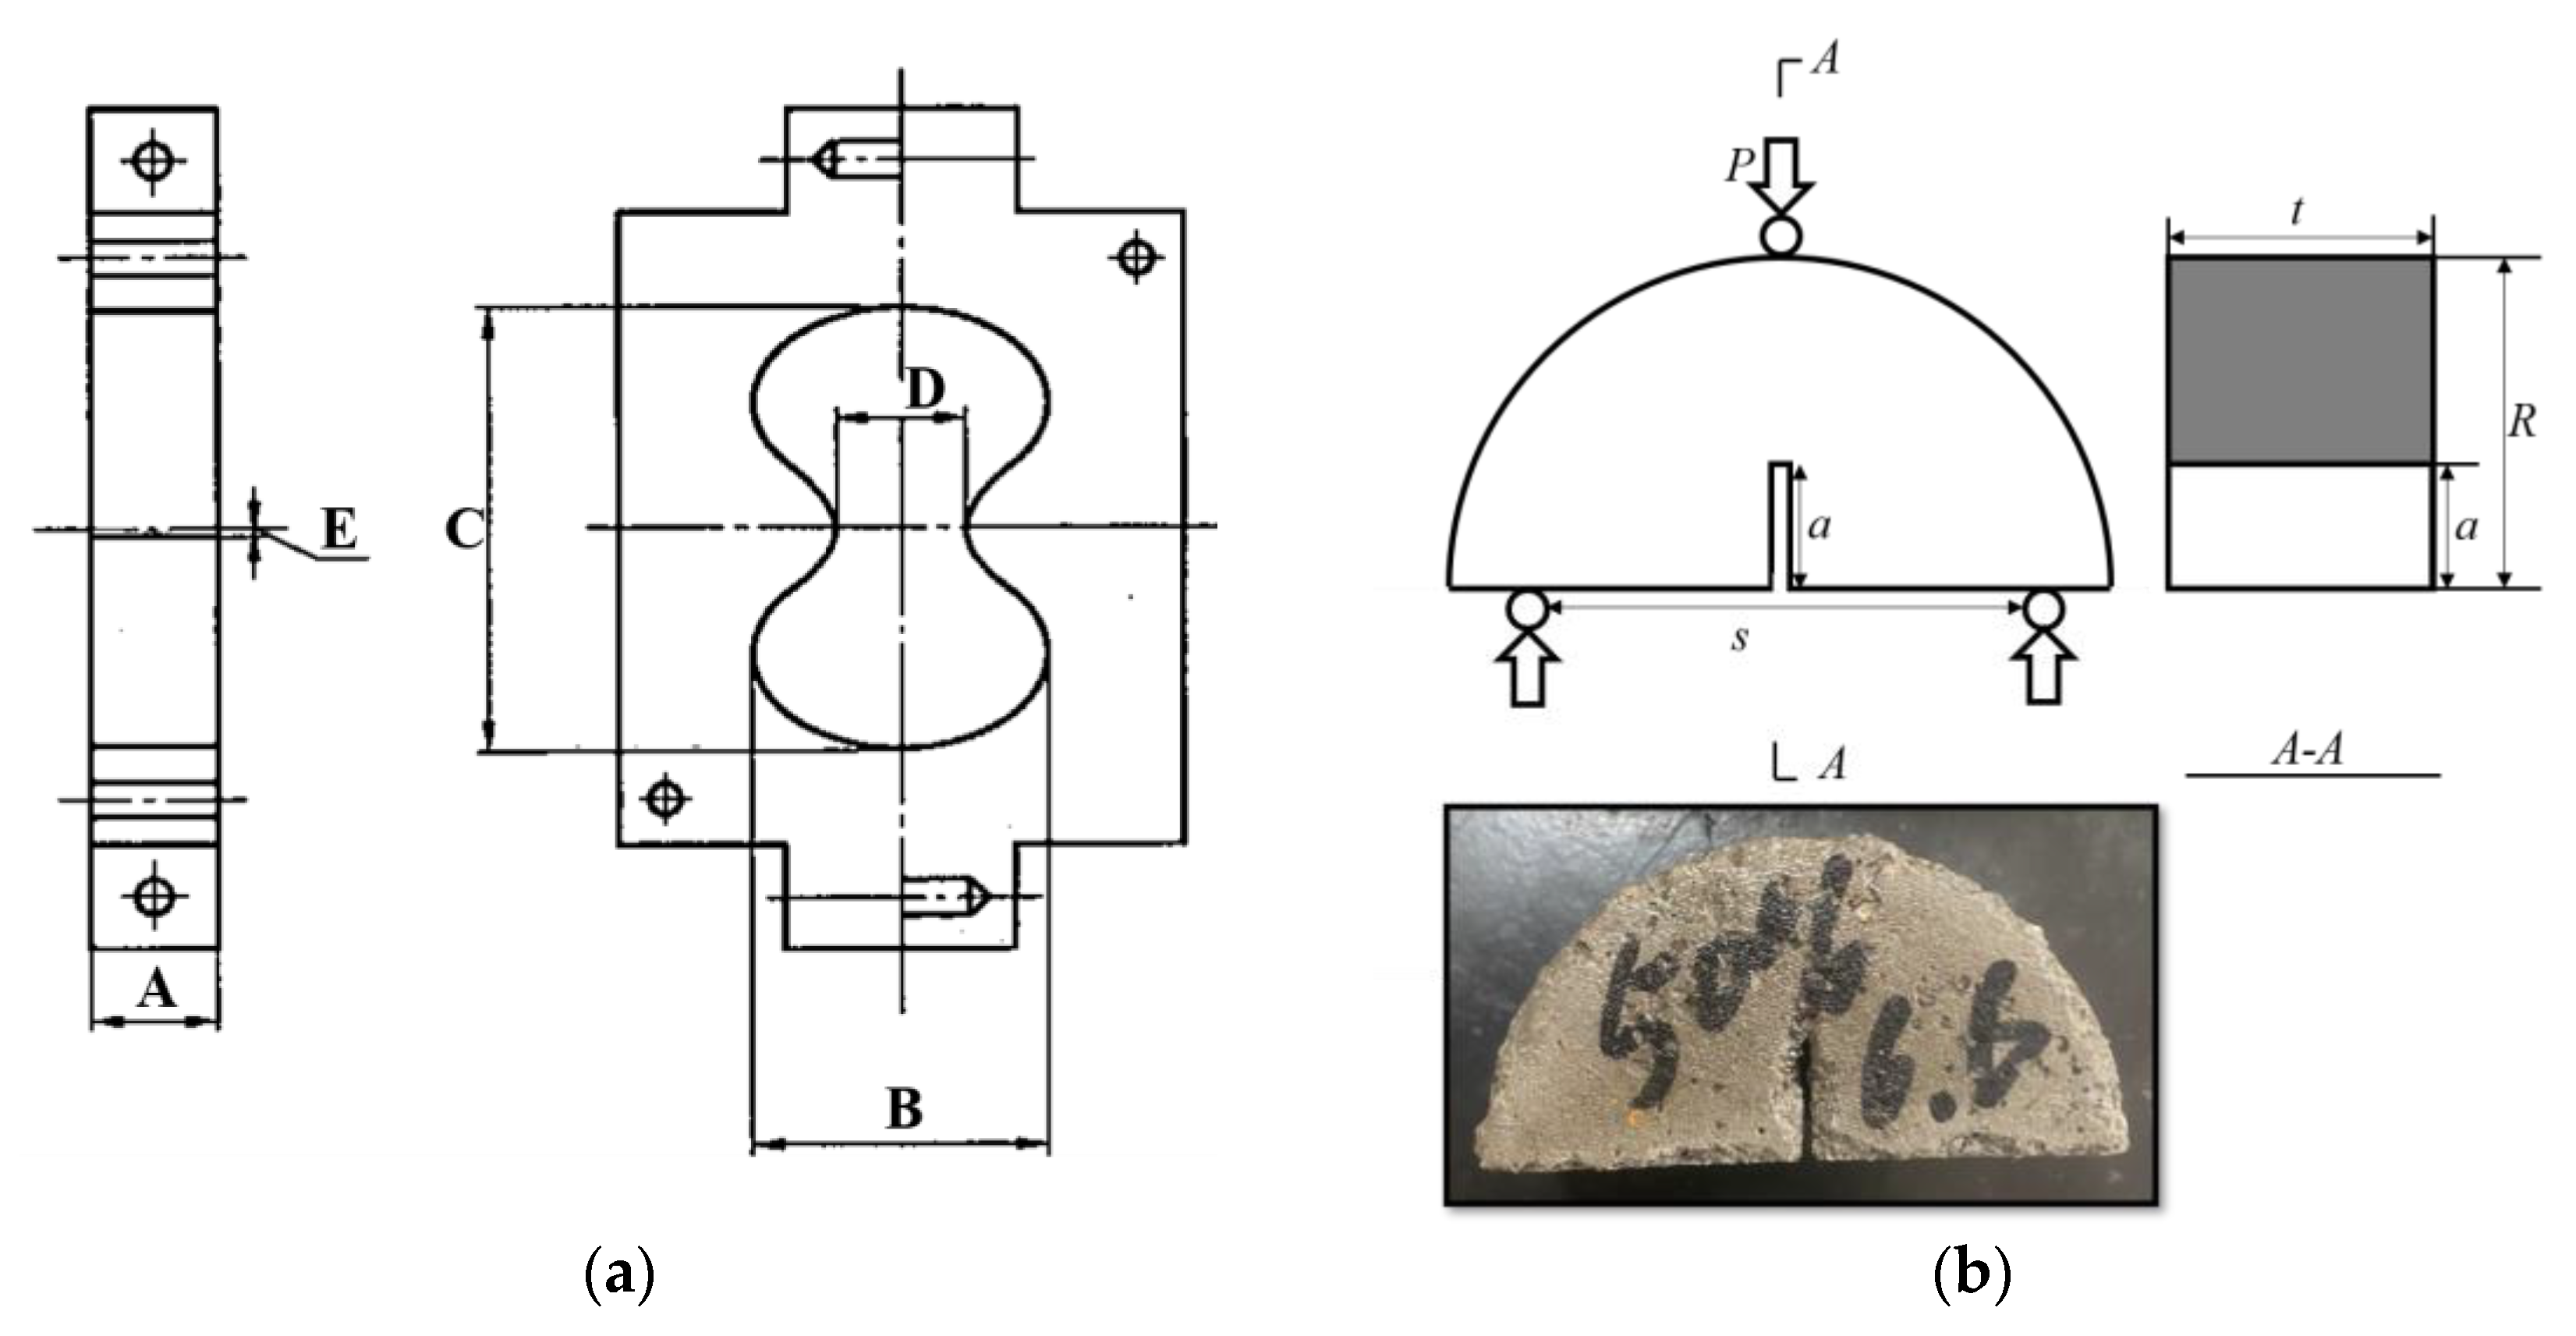
2.2.1. Mechanical Tests
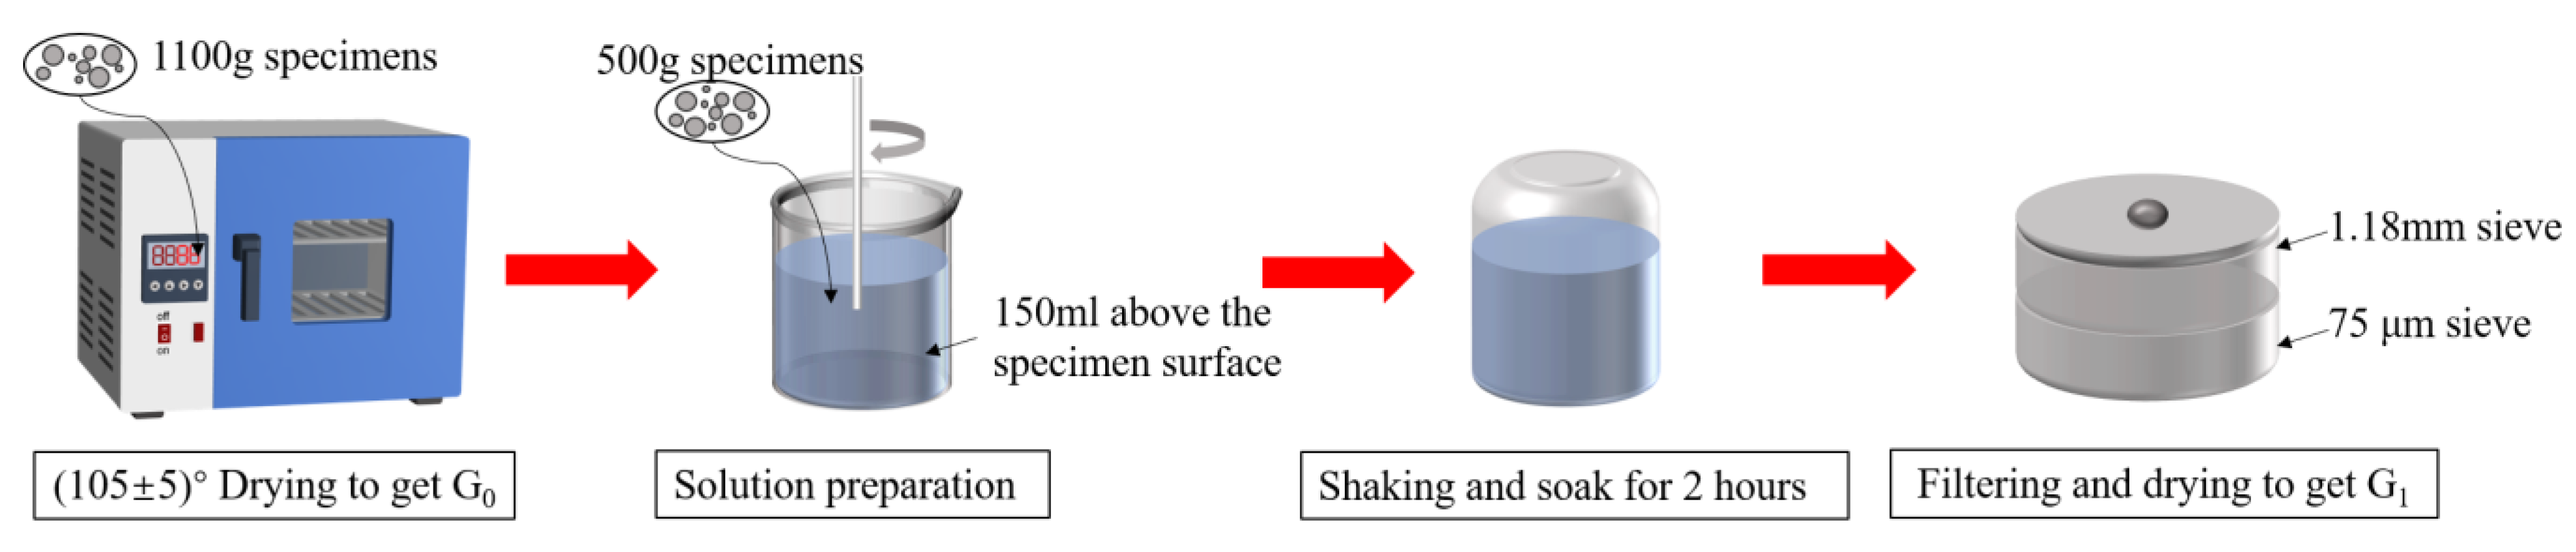
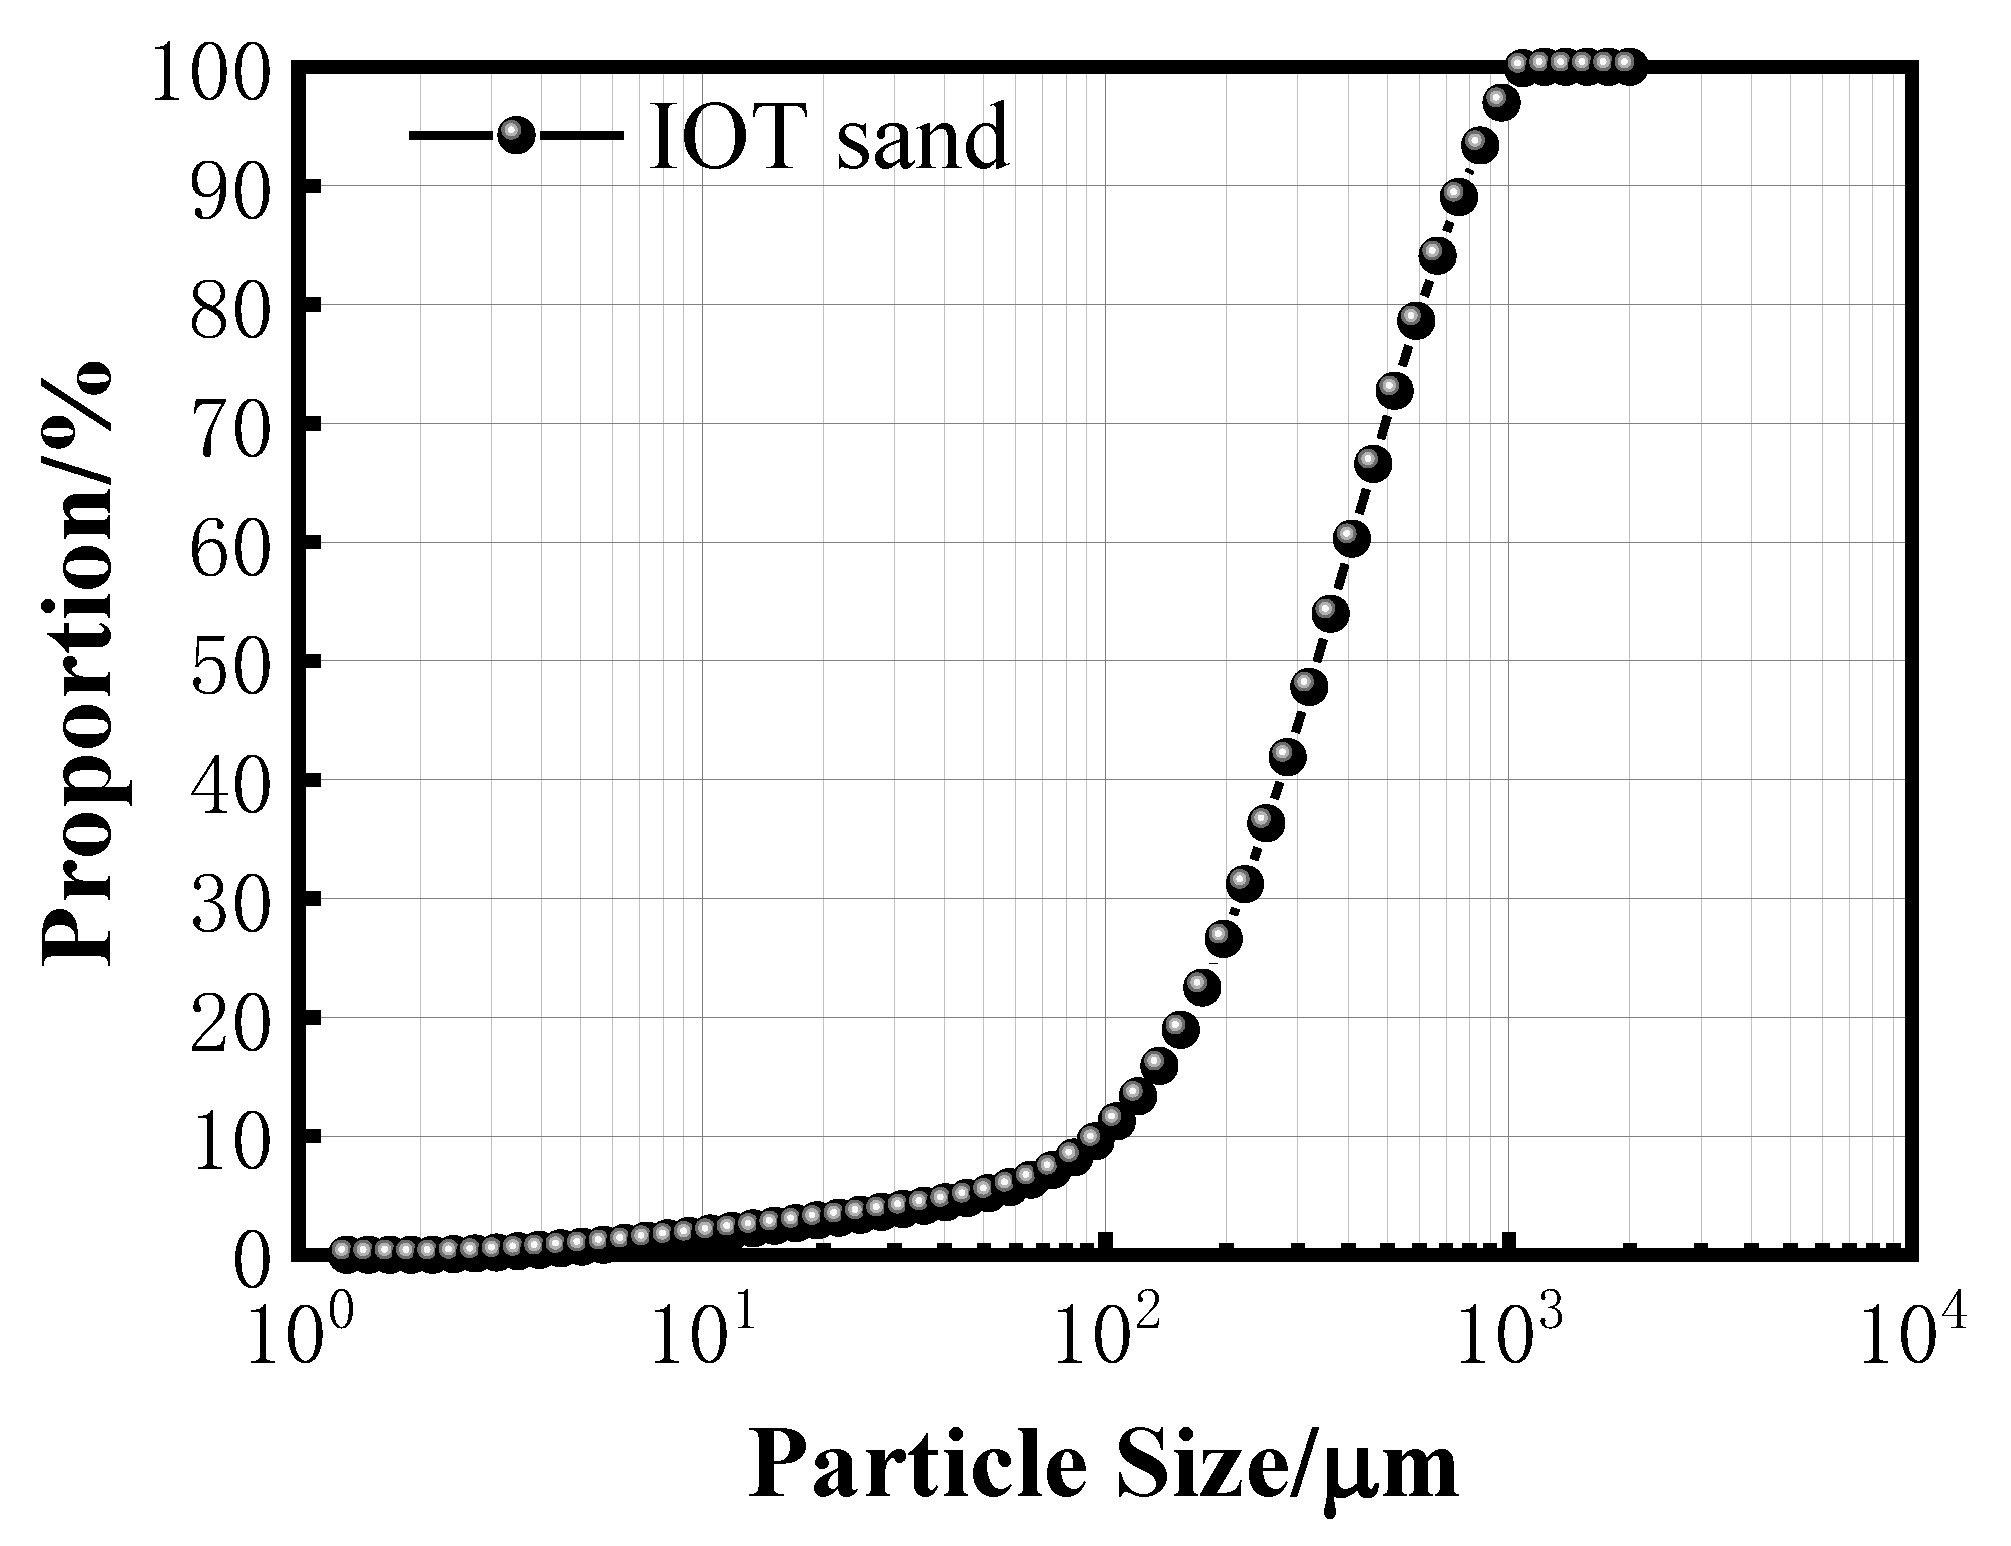
2.2.2. IOT Characteristics
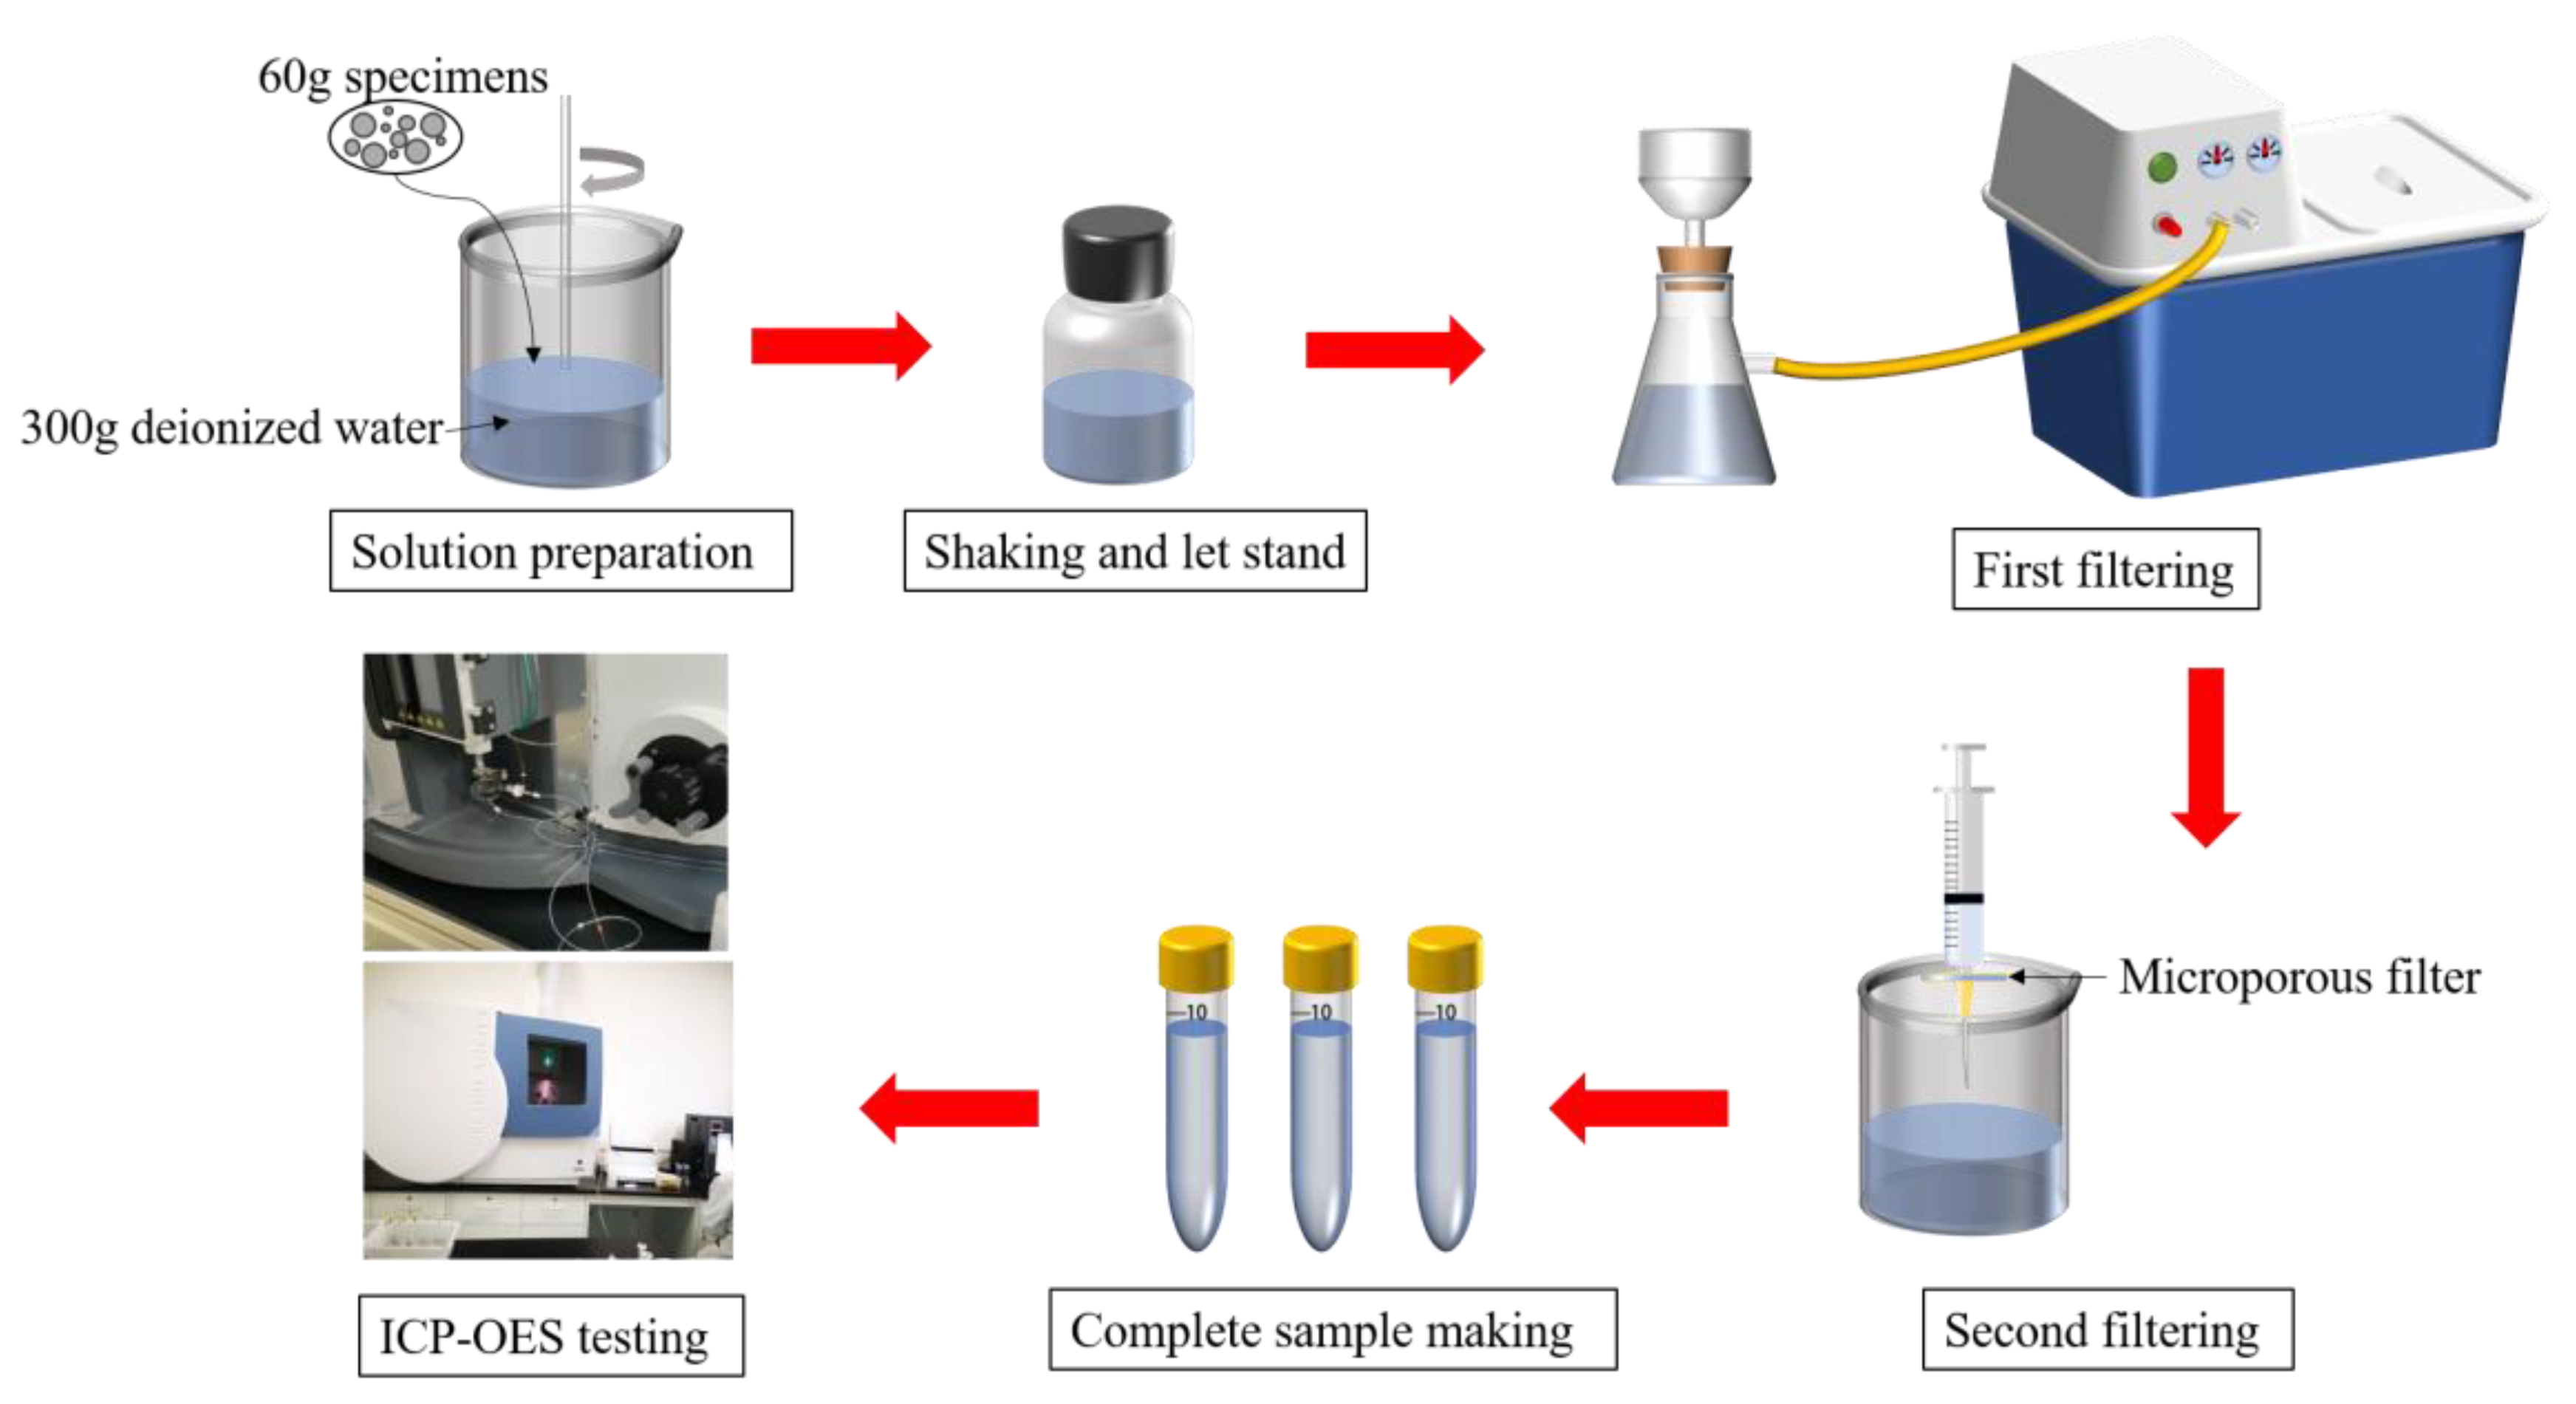
2.2.3. Inductively Coupled Plasma Atomic Emission Spectrometer (ICP-OES)
2.2.4. X-ray Diffraction (XRD)
2.2.5. Nuclear Magnetic Resonance (NMR)
2.2.6. Scanning Electron Microscopy and Energy-Dispersive Spectroscopy (SEM-EDS)
3. Results and Analysis
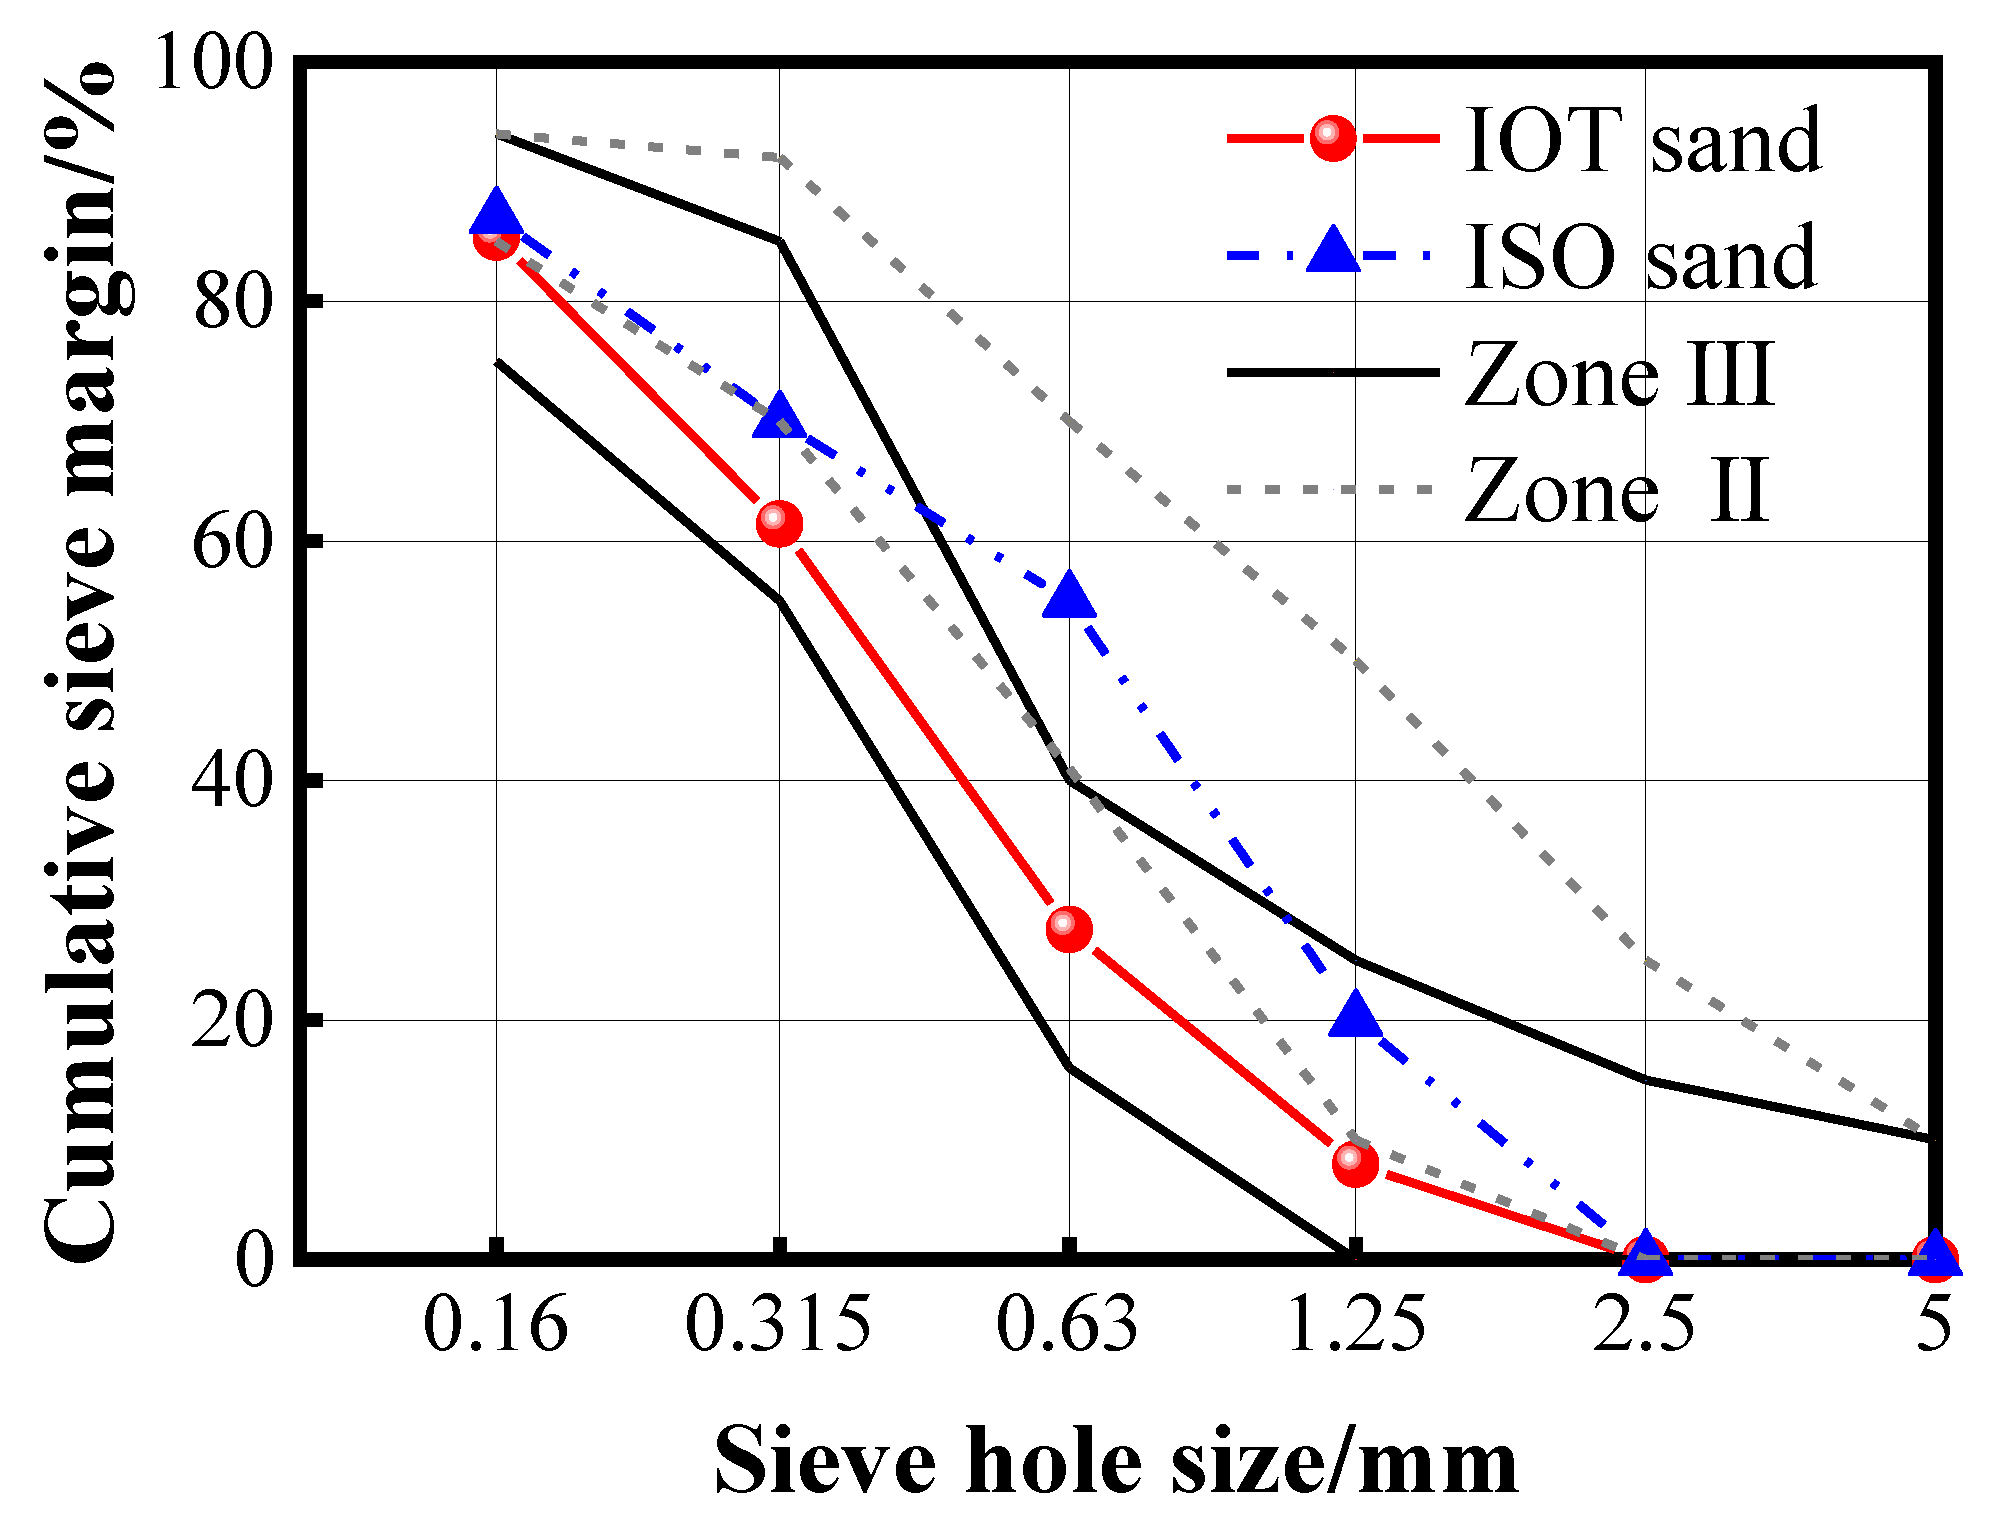
3.1. IOT Analysis
3.2. Mechanical Tests
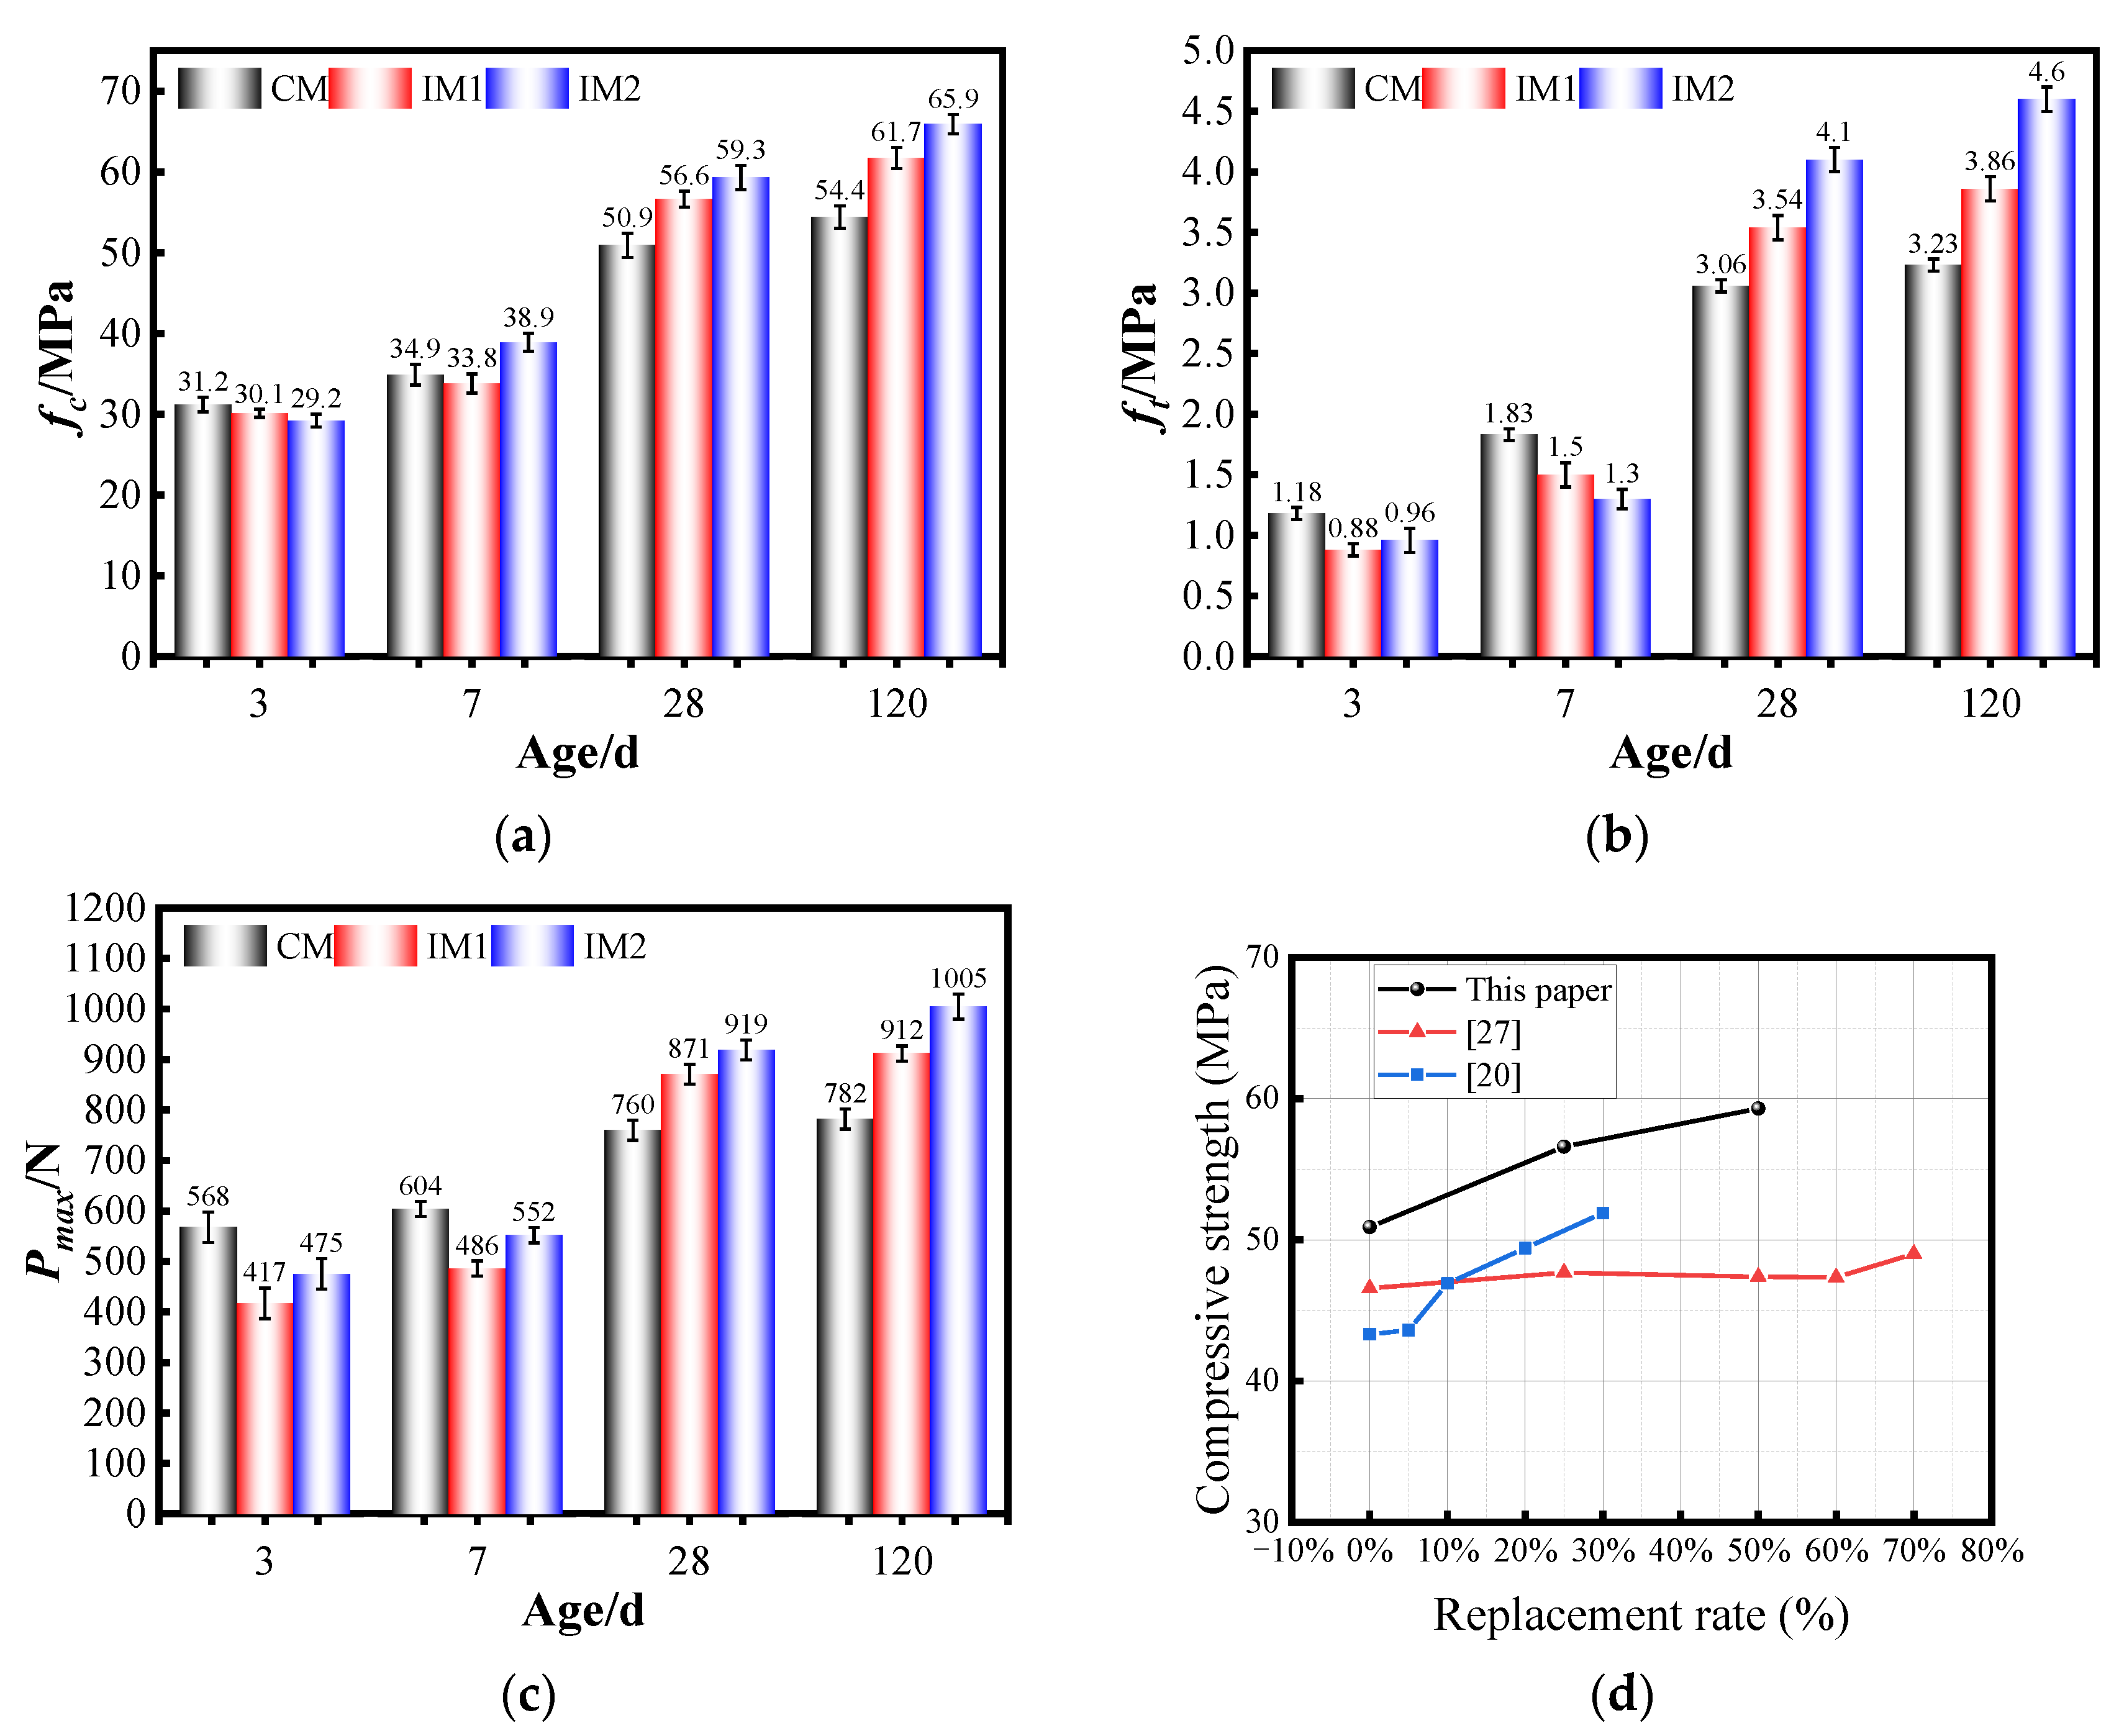
3.2.1. Mechanical Tests Analysis
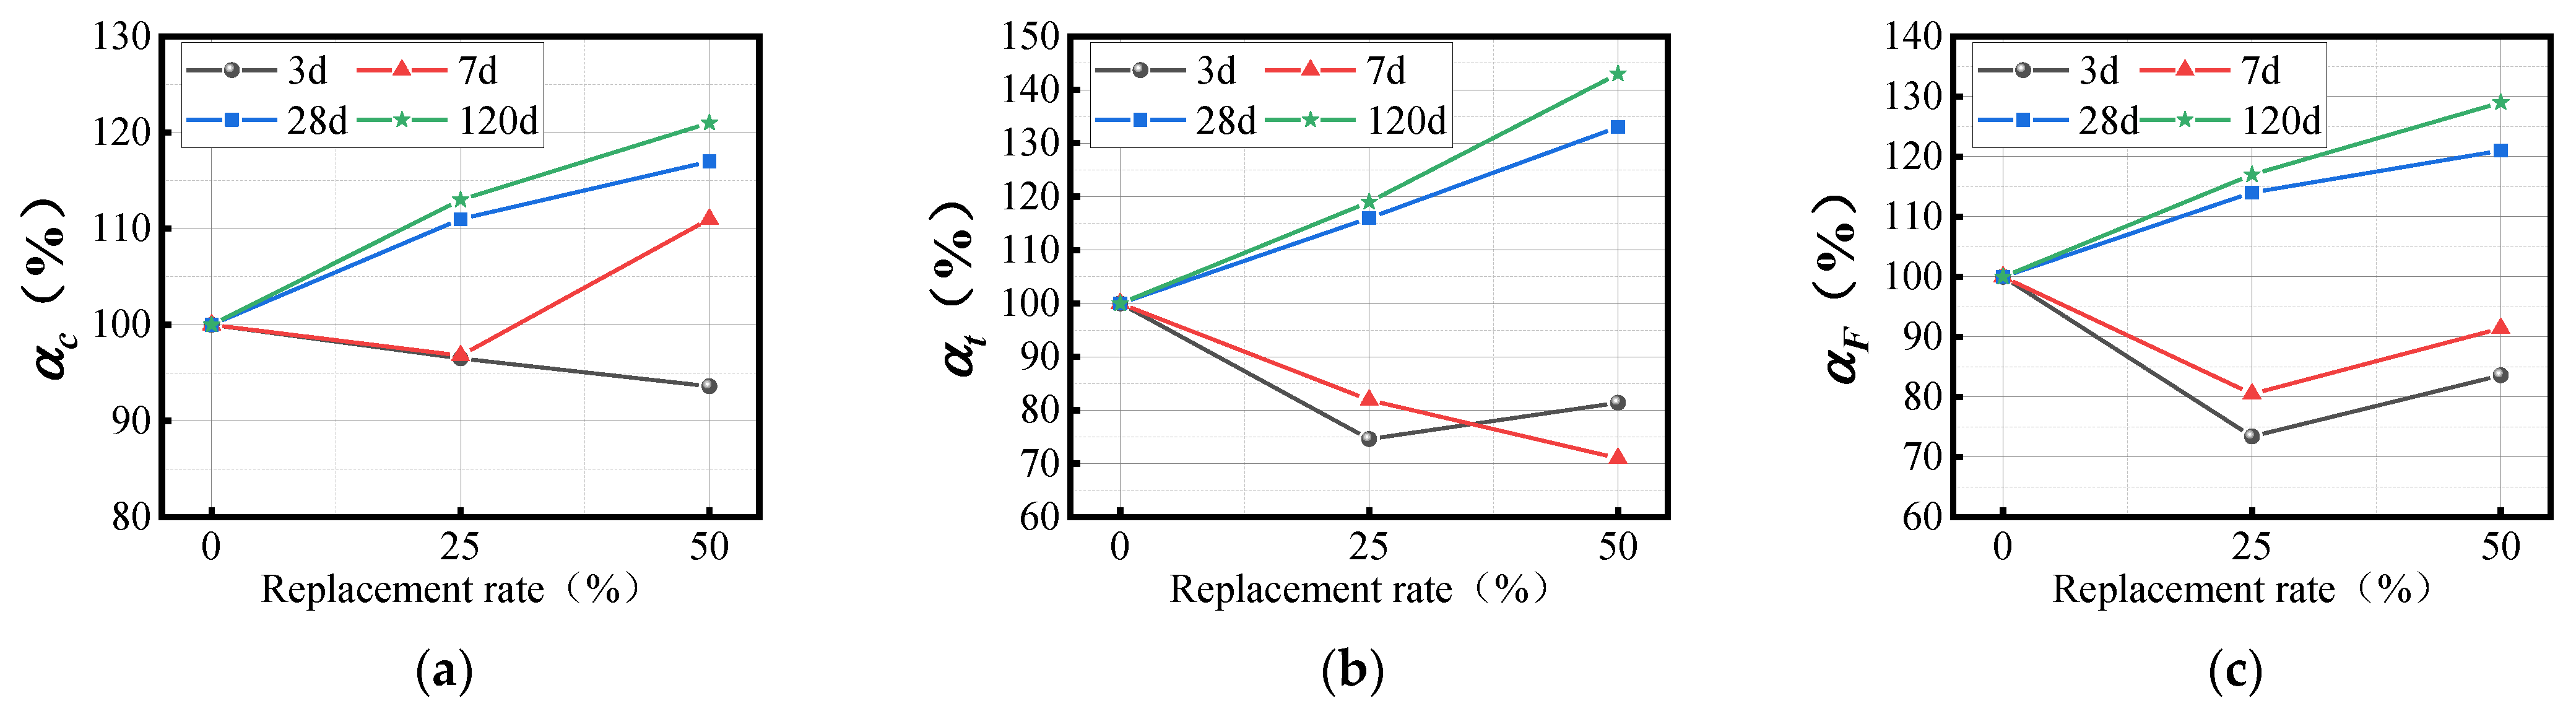
3.2.2. The Strength Activity Index a
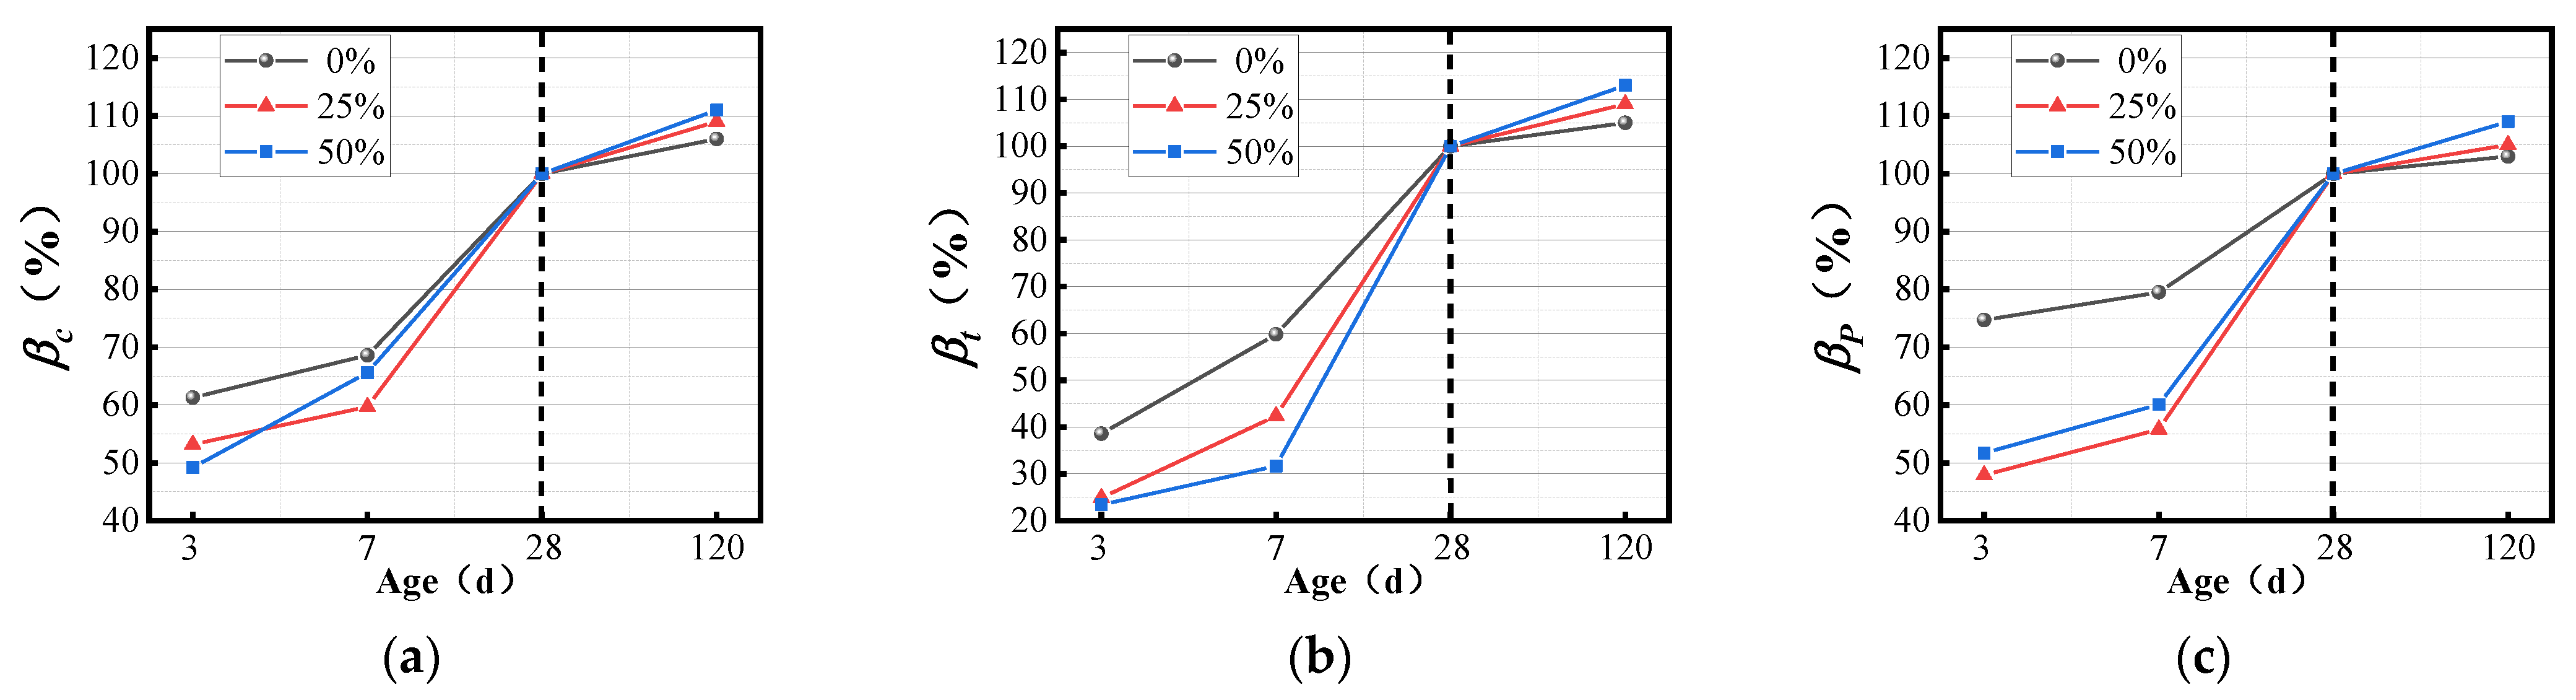
3.2.3. The Strength Development Coefficient Index β
3.3. Chemical, Mineralogical, and Microstructural Tests
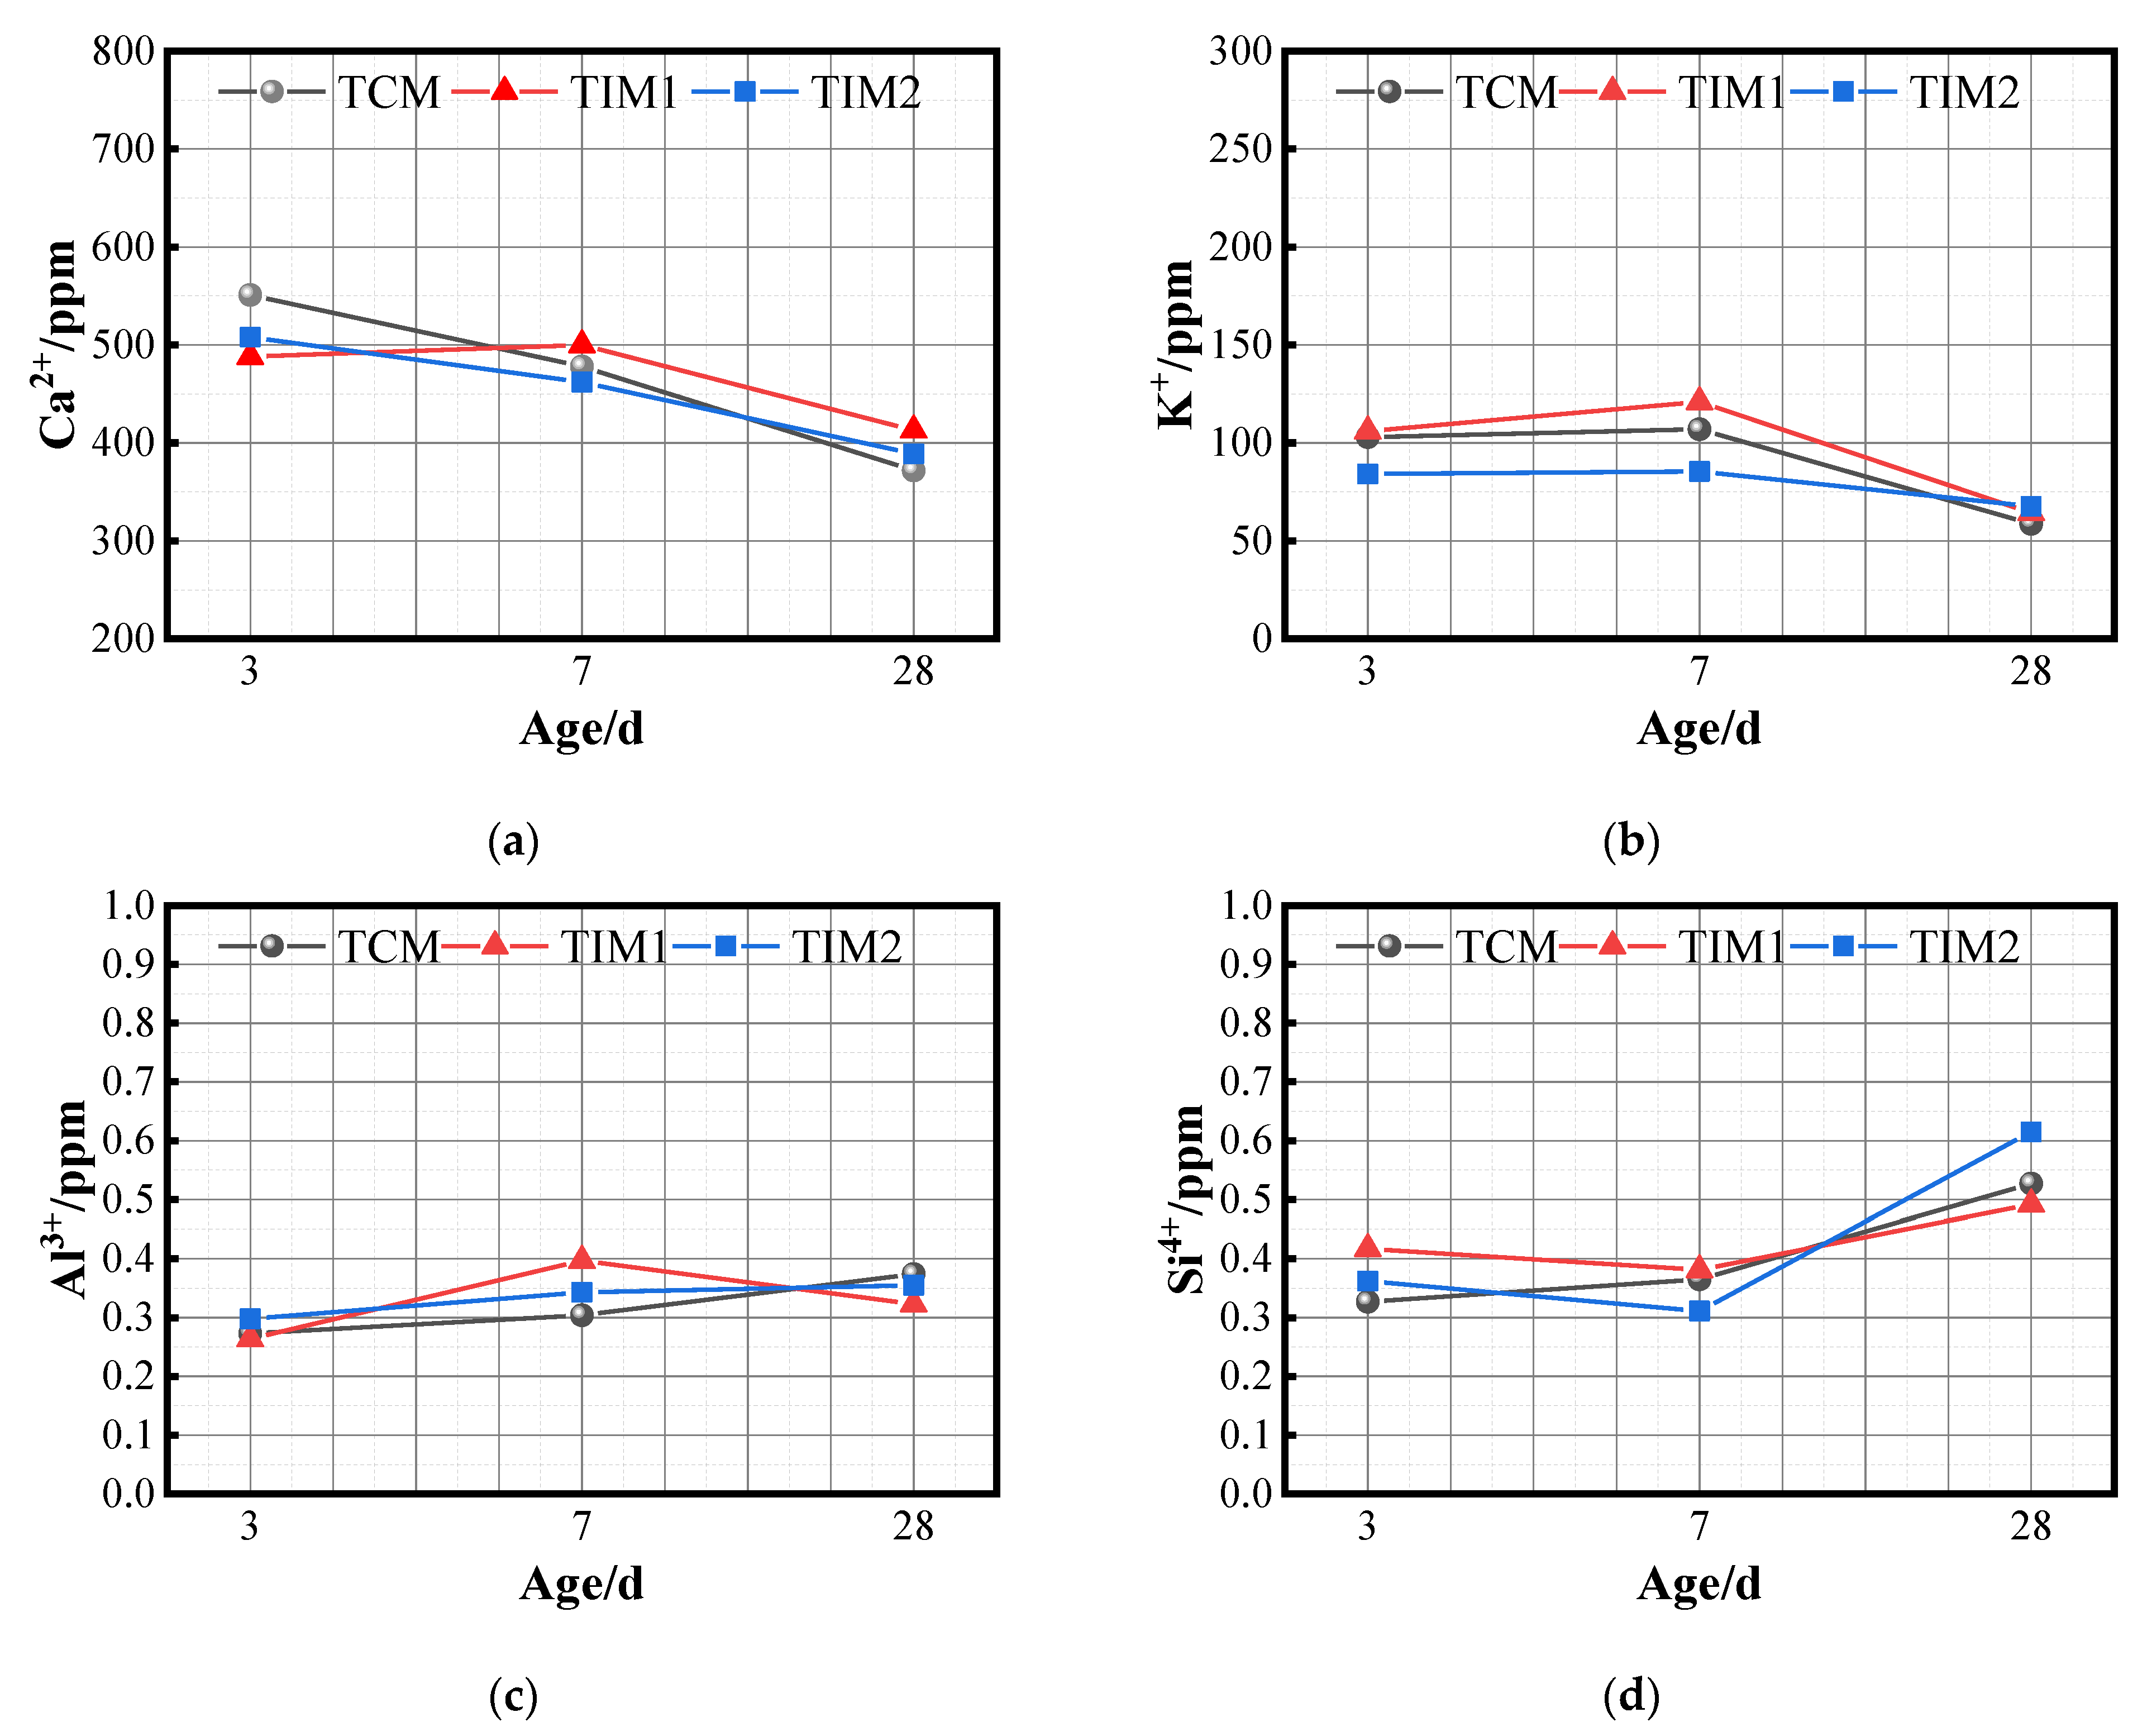
3.3.1. Chemical Test
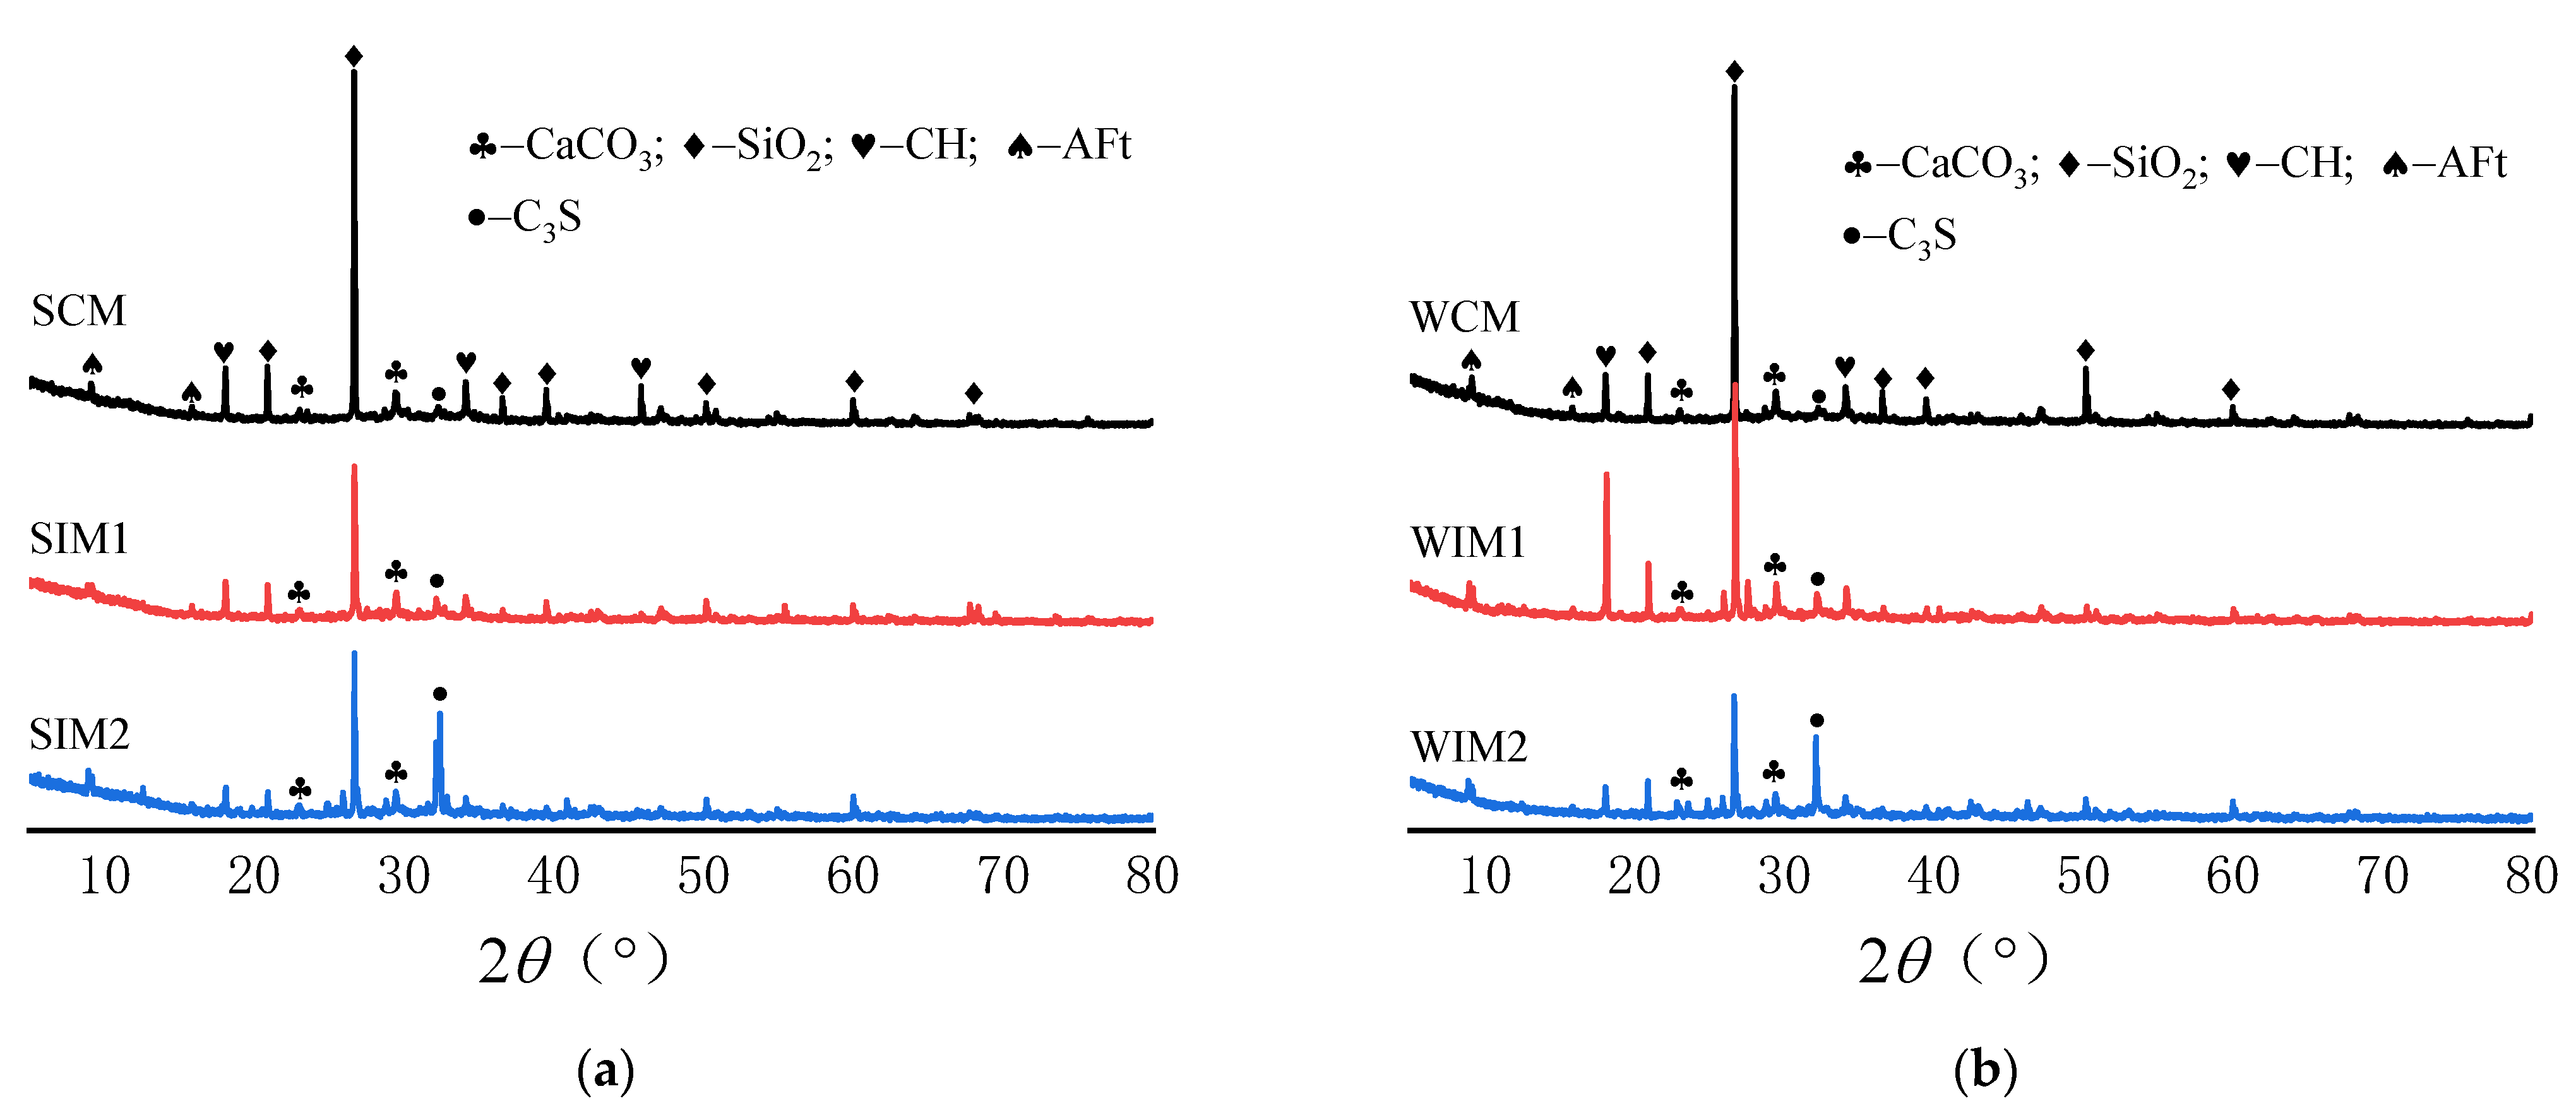
3.3.2. Mineralogical Test
3.3.3. Microstructural Tests
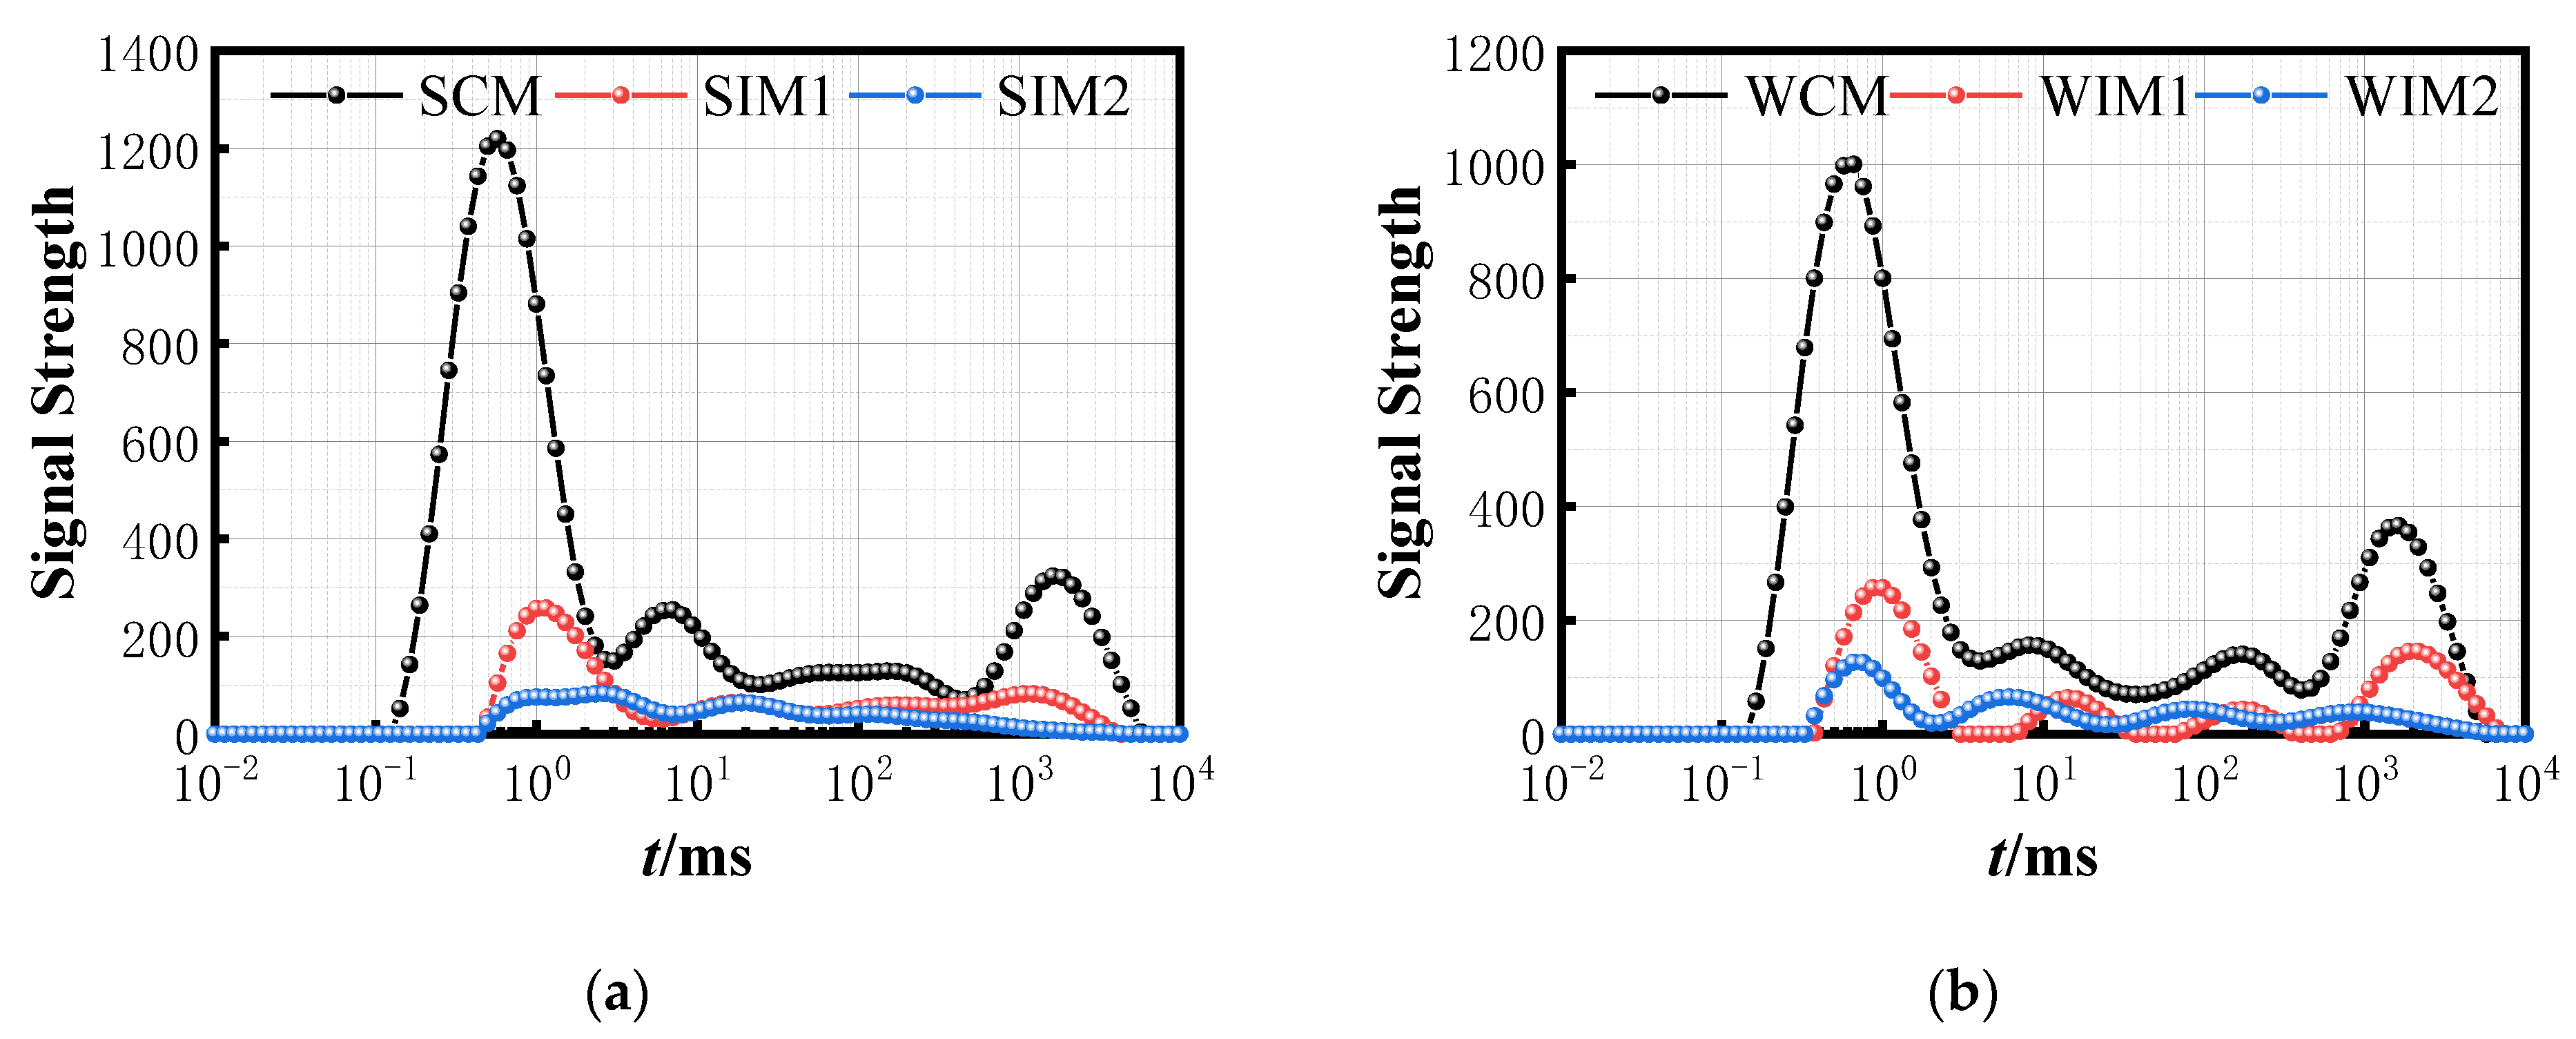
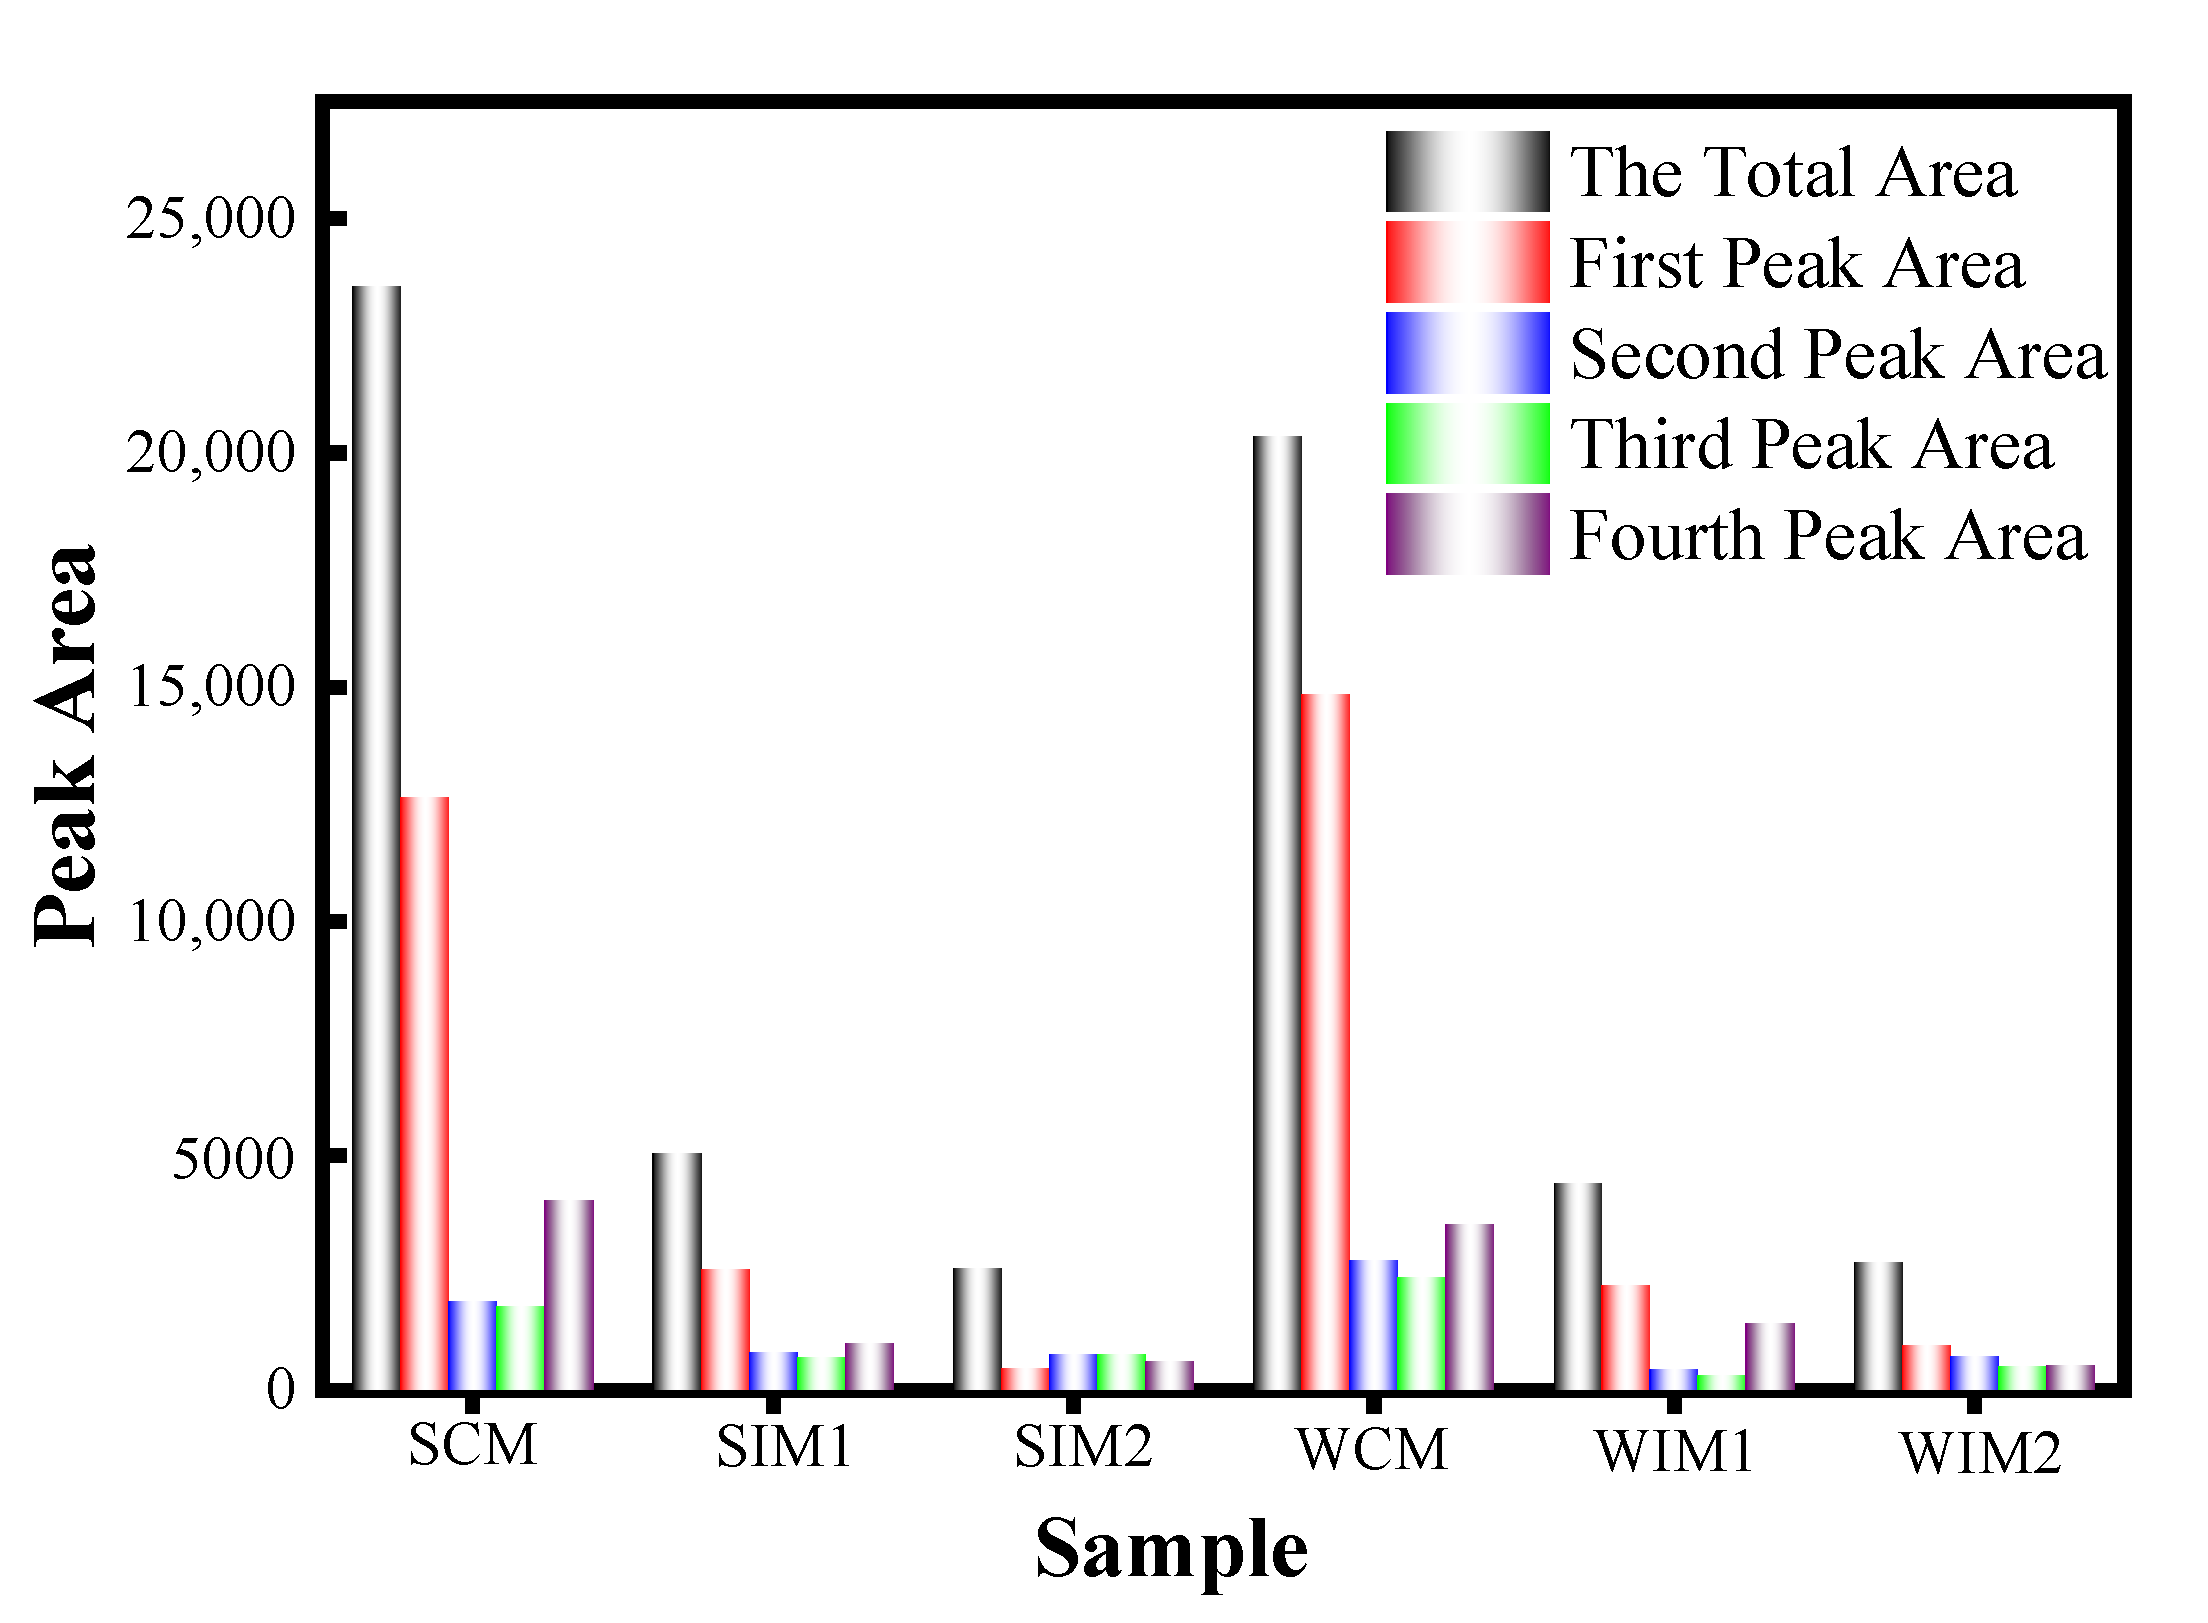
NMR Test
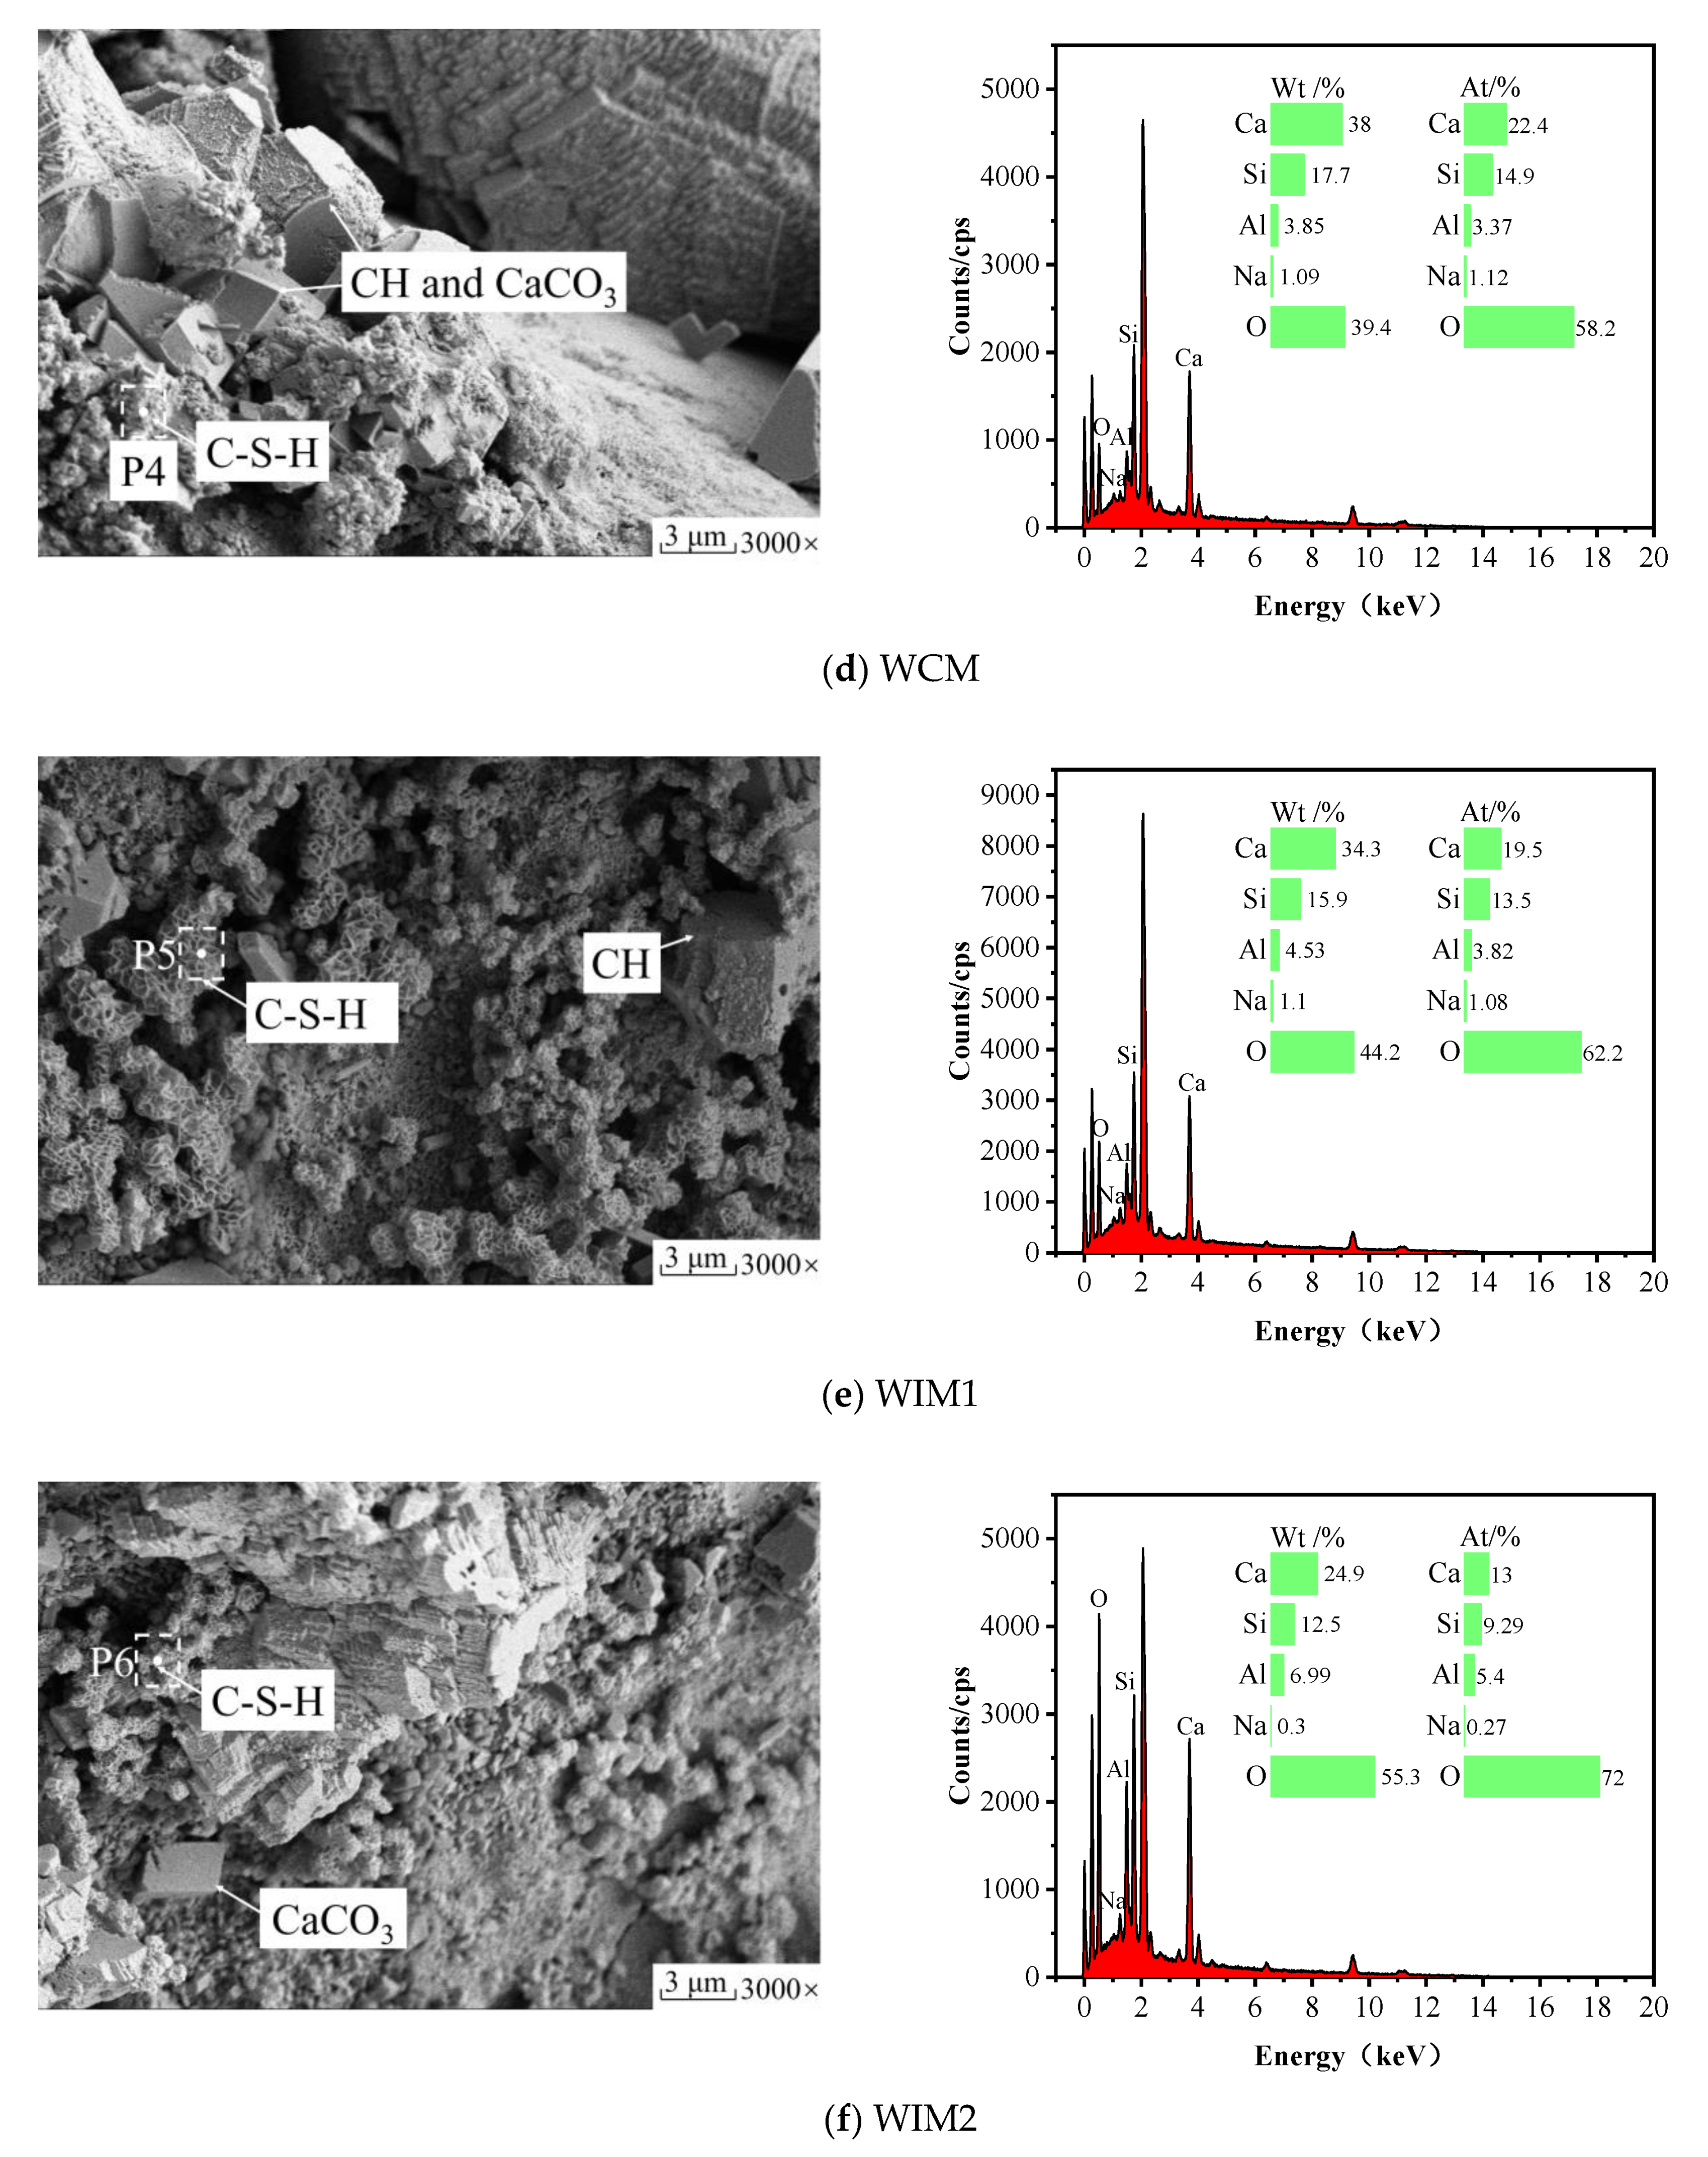
SEM-EDS Test
4. Conclusions
- (1)
- The IOT sand belongs to the category of fine sand and can partly substitute river sand to produce cement mortar and concrete.
- (2)
- In the 0–50% IOT substitution rate tested in this paper, though the early strength was not enhanced by IOT incorporation, the potential strength improvement was obvious, especially for curing ages of 28 d and 120 d.
- (3)
- Though limited chemical effect was found by adding IOT, in comparison with ISO sand mortar, the pore size distribution was changed for IOTC, which corresponds to its mechanical improvement.
- (4)
- It is feasible to use IOT as construction material, with benefits both for solid waste utilization and engineering construction cost reduction.
Author Contributions
Funding
Institutional Review Board Statement
Informed Consent Statement
Data Availability Statement
Conflicts of Interest
Abbreviations
| μf | Fineness modulus |
| fc | Uniaxial compressive strength (unit: MPa) |
| ft | Uniaxial tensile strength (unit: MPa) |
| Pmax | Ultimate fracture load (unit: N) |
| ac | Uniaxial compressive strength activity index (unit: %) |
| at | Uniaxial tensile strength activity index (unit: %) |
| af | Ultimate fracture load activity index (unit: %) |
| βc | Coefficient of development of uniaxial compressive strength (unit: %) |
| βt | Coefficient of development of uniaxial tensile strength (unit: %) |
| βf | Coefficient of development of ultimate fracture load (unit: %) |
| T2 | Relaxation time (unit: ms) |
| ρ | Relaxation strength (unit: μm/s) |
| S | Pore surface area (unit: mm) |
| V | Pore volume (unit: mm3) |
| R | Pore body radius (unit: μm) |
| Vi | The percentage of pore volume occupied by pores of a given pore size (unit: %) |
| Ai | NMR signal intensity corresponding to a certain T2 value |
| ms, md | The quality of saturated sample, the quality of dried samples, respectively (unit: g) |
| ρw | The density of water (unit: g/cm3) |
References
- Gou, M.; Zhou, L.; Then, N.W.Y. Utilization of tailings in cement and concrete: A review. Sci. Eng. Compos. Mater. 2019, 26, 449–464. [Google Scholar] [CrossRef]
- Gayana, B.C.; Chandar, K.R. Sustainable Use of Mine Waste and Tailings with Suitable Admixture as Aggregates in Concrete Pavements—A Review. Adv. Concr. Constr. 2018, 6, 221–243. [Google Scholar] [CrossRef]
- Han, F.; Song, S.; Liu, J.; Huang, S. Properties of steam-cured precast concrete containing iron tailing powder. Powder Technol. 2019, 345, 292–299. [Google Scholar] [CrossRef]
- Ruidong, W.; Yu, S.; Juanhong, L.; Linian, C.; Guangtian, Z.; Yueyue, Z. Effect of Iron Tailings and Slag Powders on Workability and Mechanical Properties of Concrete. Front. Mater. 2021, 8, 723119. [Google Scholar] [CrossRef]
- Zhao, J.; Ni, K.; Su, Y.; Shi, Y. An evaluation of iron ore tailings characteristics and iron ore tailings concrete properties. Constr. Build. Mater. 2021, 286, 122968. [Google Scholar] [CrossRef]
- Cheng, Y.; Huang, F.; Li, W.; Liu, R.; Li, G.; Wei, J. Test research on the effects of mechanochemically activated iron tailings on the compressive strength of concrete. Constr. Build. Mater. 2016, 118, 164–170. [Google Scholar] [CrossRef]
- Gao, S.; Cui, X.; Zhang, S. Utilization of Molybdenum Tailings in Concrete Manufacturing: A Review. Appl. Sci. 2019, 10, 138. [Google Scholar] [CrossRef] [Green Version]
- Li, T.; Wang, S.; Xu, F.; Meng, X.; Li, B.; Zhan, M. Study of the basic mechanical properties and degradation mechanism of recycled concrete with tailings before and after carbonation. J. Clean. Prod. 2020, 259, 120923. [Google Scholar] [CrossRef]
- Jiang, Y.; Wang, H.; Chen, Y.; Ruan, M.; Li, W. Preparations of composite concretes using iron ore tailings as fine aggregates and their mechanical behavior. Mater. Teh. 2019, 53, 467–472. [Google Scholar] [CrossRef]
- Arbili, M.M.; Alqurashi, M.; Majdi, A.; Ahmad, J.; Deifalla, A.F. Concrete Made with Iron Ore Tailings as a Fine Aggregate: A Step towards Sustainable Concrete. Materials 2022, 15, 6236. [Google Scholar] [CrossRef]
- Chen, Z.; Chen, S.; Zhou, Y.; Zhang, C.; Meng, T.; Jiang, S.; Liu, L.; Hu, G. Effect of incorporation of rice husk ash and iron ore tailings on properties of concrete. Constr. Build. Mater. 2022, 338, 127584. [Google Scholar] [CrossRef]
- Huang, X.; Ranade, R.; Ni, W.; Li, V.C. Development of green engineered cementitious composites using iron ore tailings as aggregates. Constr. Build. Mater. 2013, 44, 757–764. [Google Scholar] [CrossRef]
- Siddique, S.; Jang, J.G. Assessment of molybdenum mine tailings as filler in cement mortar. J. Build. Eng. 2020, 31, 101322. [Google Scholar] [CrossRef]
- Wu, R.; Liu, J. Experimental Study on the Concrete with Compound Admixture of Iron Tailings and Slag Powder under Low Cement Clinker System. Adv. Mater. Sci. Eng. 2018, 2018, 9816923. [Google Scholar] [CrossRef] [Green Version]
- Zhang, Y.; Yang, D.; Gu, X.; Chen, H.; Li, Z. Application of Iron Tailings-Based Composite Supplementary Cementitious Materials (SCMs) in Green Concrete. Materials 2022, 15, 3866. [Google Scholar] [CrossRef]
- Fontes, W.C.; Mendes, J.C.; Da Silva, S.N.; Peixoto, R.A.F. Mortars for laying and coating produced with iron ore tailings from tailing dams. Constr. Build. Mater. 2016, 112, 988–995. [Google Scholar] [CrossRef]
- Zhao, Y.; Gu, X.; Qiu, J.; Zhang, W.; Li, X. Study on the Utilization of Iron Tailings in Ultra-High-Performance Concrete: Fresh Properties and Compressive Behaviors. Materials 2021, 14, 4807. [Google Scholar] [CrossRef] [PubMed]
- Yang, L.; Xu, F. Experimental Study on the Effect of Fine Powder in Iron Tailings on the Durability of Ordinary Dry Mixed Mortar. Integr. Ferroelectr. 2021, 213, 1–11. [Google Scholar] [CrossRef]
- Borges, P.H.R.; Ramos, F.C.R.; Caetano, T.R.; Panzerra, T.H.; Santos, H. Reuse of iron ore tailings in the production of geopolymer mortars. REM Int. Eng. J. 2019, 72, 581–587. [Google Scholar] [CrossRef]
- Cui, L.; Chen, P.; Wang, L.; Xu, Y.; Wang, H. Reutilizing Waste Iron Tailing Powders as Filler in Mortar to Realize Cement Reduction and Strength Enhancement. Materials 2022, 15, 541. [Google Scholar] [CrossRef]
- GB/T 17671-2021; China Building Materials Academy. Method of Testing Cements-Determination of Strength. Standards Press of China: Beijing, China, 2021.
- SL/T 352-2020; Ministry of Water Resources of the People’s Republic of China. Test Code for Hydraulic Concrete. China Water&Power Press: Beijing, China, 2020.
- Kuruppu, M.D.; Obara, Y.; Ayatollahi, M.R.; Chong, K.P.; Funatsu, T. ISRM-Suggested Method for Determining the Mode I Static Fracture Toughness Using Semi-Circular Bend Specimen. Rock Mech. Rock Eng. 2014, 47, 267–274. [Google Scholar] [CrossRef] [Green Version]
- GB/T 14684-2022; State Administration for Market Regulation and Standardization Administration of the People’s Republic of China. Sand for Construction. Standards Press of China: Beijing, China, 2022.
- GB/T 2419-2005; State Administration for Market Regulation and Standardization Administration of the People’s Republic of China. Test Method for Fluidity of Cement Mortar. Standards Press of China: Beijing, China, 2005.
- GB/T 50123-2019; Ministry of Water Resources of the People’s Republic of China. Standard for Soil Test Method China Planning Press: Beijing, China, 2019.
- Wang, Y.; Gu, X.W.; Zhang, Y.N.; Yin, S.Q.; Xu, X.C.; Wang, Q. Analysis of Compressive Strength and Microstructure of Iron Tailings Sand Cement Mortar. Metal Mine. 2022, 51, 60–64. [Google Scholar] [CrossRef]
- Song, J.; Wang, L.; Liu, S.; Zhu, J.; Ouyang, Y. Comparison Study of Hydration Characteristics Between Cements with 50% and 85% Slag. Mater. Sci. 2018, 24, 421–427. [Google Scholar] [CrossRef] [Green Version]
- Papadakis, V.; Tsimas, S. Supplementary cementing materials in concrete: Part I: Efficiency and design. Cem. Concr. Res. 2002, 32, 1525–1532. [Google Scholar] [CrossRef]
- Thomas, B.S.; Damare, A.; Gupta, R. Strength and durability characteristics of copper tailing concrete. Constr. Build. Mater. 2013, 48, 894–900. [Google Scholar] [CrossRef]
- Cheng, Y.; Huang, F.; Qi, S.; Li, W.; Liu, R.; Li, G. Durability of concrete incorporated with siliceous iron tailings. Constr. Build. Mater. 2020, 242, 118147. [Google Scholar] [CrossRef]
- Esmaeili, J.; Aslani, H.; Onuaguluchi, O. Reuse Potentials of Copper Mine Tailings in Mortar and Concrete Composites. J. Mater. Civ. Eng. 2020, 32, 04020084. [Google Scholar] [CrossRef]
- Song, J.W.; Zhu, J.L.; Liu, F.H.; Feng, S.L. Influence of Copper Tailing Powder on the Compressive Strength and Microscopic Structure of Complex Binder. J. Build. Mater. 2019, 22, 846–852. [Google Scholar] [CrossRef]
- Zhang, W.; Gu, X.; Qiu, J.; Liu, J.; Zhao, Y.; Li, X. Effects of iron ore tailings on the compressive strength and permeability of ultra-high performance concrete. Constr. Build. Mater. 2020, 260, 119917. [Google Scholar] [CrossRef]
- Zhang, N.; Tang, B.; Liu, X. Cementitious activity of iron ore tailing and its utilization in cementitious materials, bricks and concrete. Constr. Build. Mater. 2021, 288, 123022. [Google Scholar] [CrossRef]
- Maglad, A.M.; Zaid, O.; Arbili, M.M.; Ascensão, G.; Șerbănoiu, A.A.; Grădinaru, C.M.; García, R.M.; Qaidi, S.M.A.; Althoey, F.; de Prado-Gil, J. A Study on the Properties of Geopolymer Concrete Modified with Nano Graphene Oxide. Buildings 2022, 12, 1066. [Google Scholar] [CrossRef]
- Malathy, R.; Sentilkumar, S.R.R.; Prakash, A.R.; Das, B.B.; Chung, I.-M.; Kim, S.-H.; Prabakaran, M. Use of Industrial Silica Sand as a Fine Aggregate in Concrete—An Explorative Study. Buildings 2022, 12, 1273. [Google Scholar] [CrossRef]
- Churata, R.; Almirón, J.; Vargas, M.; Tupayachy-Quispe, D.; Torres-Almirón, J.; Ortiz-Valdivia, Y.; Velasco, F. Study of Geopolymer Composites Based on Volcanic Ash, Fly Ash, Pozzolan, Metakaolin and Mining Tailing. Buildings 2022, 12, 1118. [Google Scholar] [CrossRef]
- Song, F.; Yu, Z.; Yang, F.; Lu, Y.; Liu, Y. Microstructure of amorphous aluminum hydroxide in belite-calcium sulfoaluminate cement. Cem. Concr. Res. 2015, 71, 1–6. [Google Scholar] [CrossRef]
- Li, H.; Xu, C.; Dong, B.; Chen, Q.; Gu, L.; Yang, X. Enhanced performances of cement and powder silane based waterproof mortar modified by nucleation C-S-H seed. Constr. Build. Mater. 2020, 246, 118511. [Google Scholar] [CrossRef]
- Justnes, H.; Skocek, J.; Østnor, T.A.; Engelsen, C.J.; Skjølsvold, O. Microstructural changes of hydrated cement blended with fly ash upon carbonation. Cem. Concr. Res. 2020, 137, 106192. [Google Scholar] [CrossRef]
- Yi, Z.-L.; Sun, H.-H.; Li, C.; Sun, Y.-M.; Li, Y. Relationship between polymerization degree and cementitious activity of iron ore tailings. Int. J. Miner. Met. Mater. 2010, 17, 116–120. [Google Scholar] [CrossRef]
- Peng, Y.; Liu, Y.; Zhan, B.; Xu, G. Preparation of autoclaved aerated concrete by using graphite tailings as an alternative silica source. Constr. Build. Mater. 2021, 267, 121792. [Google Scholar] [CrossRef]
- Wu, C.; Yang, S.; Cai, J.; Zhang, Q.; Zhu, Y.; Zhang, K. Activated Microporous Carbon Derived from Almond Shells for High Energy Density Asymmetric Supercapacitors. ACS Appl. Mater. Interfaces 2016, 8, 15288–15296. [Google Scholar] [CrossRef] [PubMed]
- Al-Qodah, Z.; Shawabkah, R. Production and characterization of granular activated carbon from activated sludge. Braz. J. Chem. Eng. 2009, 26, 127–136. [Google Scholar] [CrossRef] [Green Version]
- Xue, S.; Meng, F.; Zhang, P.; Bao, J.; Wang, J.; Zhao, K. Influence of water re-curing on microstructure of heat-damaged cement mortar characterized by low-field NMR and MIP. Constr. Build. Mater. 2020, 262, 120532. [Google Scholar] [CrossRef]
- Li, T.G.; Kong, L.W.; Wang, J.T.; Wang, F.H. Trimodal pore structure evolution characteristics and mechanical effects of expan- sive soil in seasonally frozen areas based on NMR test. Rock Soil Mech. 2021, 42, 2741–2754. [Google Scholar] [CrossRef]
- Kumar, R.; Bhattacharjee, B. Study on some factors affecting the results in the use of MIP method in concrete research. Cem. Concr. Res. 2003, 33, 417–424. [Google Scholar] [CrossRef]


| Sample | Water | Cement | Sand | Tailings | Substitution Rate | Flow Value (mm) |
|---|---|---|---|---|---|---|
| CM | 205 | 455.56 | 1366.67 | 0.00 | 0% | 210 |
| IM1 | 205 | 455.56 | 1025.00 | 341.27 | 25% | 185 |
| IM2 | 205 | 455.56 | 683.33 | 683.33 | 50% | 160 |
| Element | Mg | Ca | K | S | Na | Fe | Mn | Zn | Cu | B | Al | |
|---|---|---|---|---|---|---|---|---|---|---|---|---|
| Content | Unit | ppm | ppm | ppm | ppm | ppm | ppb | ppb | ppb | ppb | ppb | ppb |
| Value | 14.7 | 7 | 168 | 24.7 | 2.496 | 145 | 132 | 57.5 | 10.7 | 860 | 82.19 |
| SiO2 | Fe2O3 | Al2O3 | CaO | MgO | K2O | Na2O | SO3 | MnO2 | LOI | |
|---|---|---|---|---|---|---|---|---|---|---|
| IOT | 59.3 | 12.86 | 11.93 | 4.95 | 4.3 | 2.34 | 1.21 | 0.58 | 0.34 | 2.14 |
| ISO sand | >96 | <0.2 | <0.2 | <0.2 | <0.2 | <0.2 | <0.2 | <0.2 | <0.2 | <0.4 |
| Apparent Density (kg/m3) | Bulk Density (kg/m3) | Clay Content (%) | |
|---|---|---|---|
| ISO sand | 2630 | 1480 | <0.2 |
| IOT | 3110 | 1590 | 1.2 |
| AFt | Ca(OH)2 | CaCO3 | C3S | SiO2 | ||||
|---|---|---|---|---|---|---|---|---|
| Sample | 9.1° | 15.5° | 18.1° | 34.2° | 23.1° | 29.4° | 32.1° | 26.7° |
| SCM | 574 | 301 | 782 | 609 | 264 | 481 | 300 | 4491 |
| SIM1 | 592 | 311 | 613 | 423 | 258 | 476 | 401 | 2218 |
| SIM2 | 672 | 333 | 535 | 405 | 312 | 485 | 1461 | 2052 |
| WCM | 622 | 298 | 705 | 552 | 265 | 496 | 295 | 4310 |
| WIM1 | 595 | 279 | 1956 | 534 | 269 | 589 | 459 | 3077 |
| WIM2 | 749 | 299 | 542 | 499 | 357 | 456 | 1167 | 1682 |
| Group | Porosity (%) | |
|---|---|---|
| 7 d | SCM | 11.40 |
| SIM1 | 10.87 | |
| SIM2 | 8.99 | |
| 28 d | WCM | 10.94 |
| WIM1 | 9.42 | |
| WIM2 | 8.94 | |
| Group | The Pore Size of First Peak | The Pore Size of Second Peak | The Pore Size of Third Peak | The Pore Size of Fourth Peak | MIN | MAX | |
|---|---|---|---|---|---|---|---|
| 7 d | SCM | 0.01–0.05 | 0.15–0.78 | 2.72–12.64 | 25.40–135.54 | 0.01 | 206.01 |
| SIM1 | 0.02–0.09 | 0.34–1.36 | 2.72–10.99 | 22.10–89.17 | 0.02 | 179.17 | |
| SIM2 | 0.02–0.05 | 0.06–0.17 | 0.34–1.36 | 2.37–9.56 | 0.02 | 155.84 | |
| 28 d | WCM | 0.01–0.04 | 0.11–0.59 | 1.79–8.31 | 29.20–135.54 | 0.005 | 272.33 |
| WIM1 | 0.02–0.01 | 0.29–0.89 | 3.60–10.99 | 38.60–155.83 | 0.01 | 236.86 | |
| WIM2 | 0.02–0.04 | 0.13–0.44 | 1.56–6.29 | 16.71–67.46 | 0.01 | 236.86 | |
Disclaimer/Publisher’s Note: The statements, opinions and data contained in all publications are solely those of the individual author(s) and contributor(s) and not of MDPI and/or the editor(s). MDPI and/or the editor(s) disclaim responsibility for any injury to people or property resulting from any ideas, methods, instructions or products referred to in the content. |
© 2023 by the authors. Licensee MDPI, Basel, Switzerland. This article is an open access article distributed under the terms and conditions of the Creative Commons Attribution (CC BY) license (https://creativecommons.org/licenses/by/4.0/).
Share and Cite
Li, J.; Ren, W.; Zhang, A.; Li, S.; Tan, J.; Liu, H. Mechanical Properties and Microstructure Analysis of Cement Mortar Mixed with Iron Ore Tailings. Buildings 2023, 13, 149. https://doi.org/10.3390/buildings13010149
Li J, Ren W, Zhang A, Li S, Tan J, Liu H. Mechanical Properties and Microstructure Analysis of Cement Mortar Mixed with Iron Ore Tailings. Buildings. 2023; 13(1):149. https://doi.org/10.3390/buildings13010149
Chicago/Turabian StyleLi, Junsheng, Wenyuan Ren, Aijun Zhang, Shuangcun Li, Jianping Tan, and Hongtai Liu. 2023. "Mechanical Properties and Microstructure Analysis of Cement Mortar Mixed with Iron Ore Tailings" Buildings 13, no. 1: 149. https://doi.org/10.3390/buildings13010149