Article

Optimization of the Seismic Performance of a Steel-Concrete Wind Turbine Tower with the Tuned Mass Damper

School of Human Settlements and Architecture and Engineering, Xi’an Jiaotong University, Xi’an 710049, China
*
Author to whom correspondence should be addressed.
Buildings 2022, 12(9), 1474; https://doi.org/10.3390/buildings12091474
Submission received: 7 August 2022 / Revised: 10 September 2022 / Accepted: 12 September 2022 / Published: 17 September 2022
(This article belongs to the Special Issue Improvement Technology on Building Seismic Toughness)

Abstract

:
To optimize the seismic performance of a new type of steel-concrete tower, a 120 m steel-concrete composite tower model with a tuned mass damper (TMD) was constructed in ABAQUS for simulation analysis. Firstly, a time history analysis was conducted to study the towers with and without a TMD to determine the difference in their accelerations, velocities, and displacements. Then, a frequency spectrum analysis was performed to determine the tower vibration reduction effect of TMDs with different mass ratios. Five different cases were considered to explore the impact of different layouts on the dynamic performance of the tower. The results showed that the TMD had a significant vibration reduction effect on the tower accelerations, velocities, and displacements. The acceleration was reduced the most, while the vibration reduction effect in the middle of the tower was more significant than that at the top of the tower. For the steel-concrete tower studied in this paper, the optimal mass ratio of TMD was found to be 0.01. Placing one TMD at the top and another in the middle of the tower was found to be the optimal TMD arrangement for tower vibration reduction.

1. Introduction

Using wind energy is one of the most competitive large-scale ways to utilize clean and renewable energy to help solve the major contradiction that affects the sustainable development of humankind: the rapid economic development on the one hand, and the aggravation of environmental pollution, the increase in energy demand, and the depletion of fossil fuels on the other. Wind energy has attracted increased attention all over the world [1], and numerous countries have adopted wind power generation as an important source of renewable energy and developed a large number of wind power generation systems.
The tower is the main structural component of a wind turbine. As the main load-bearing component of a wind turbine, its structural form and materials adopted are the major factors in improving the wind turbine capacity and reducing the project costs. Modern large-scale wind power systems usually adopt tapered towers [2,3]. Experience with large-scale towers reveals that there are still some challenges in using the steel. For example, the cost of the steel tower increases exponentially with the height. Steel corrodes easily and needs regular inspections and maintenance. As the tower height increases, its diameter must also increase, but the steel towers of a very large size can no longer be transported by road [4,5,6]. Therefore, many different structural forms have been proposed [7,8,9,10,11,12,13] to avoid the transportation and manufacturing challenges of all steel towers. The steel-concrete tower, whose lower portion is made of concrete and upper portion is made of steel, can not only make full use of the advantages of convenient installation of steel towers and low maintenance cost of concrete towers, but also solve the problem of excessive bottom tower diameter prohibiting efficient transport. Thus, it is one of the future development directions of large-scale wind turbines.
For large-scale wind turbine towers, although the economic design encourages increasing the outer diameter, the transportation restrictions permit only increasing the wall thickness, thus increasing the cost [14]. Kang et al. [15] pointed out that concrete towers have obvious transportation advantages and larger economic benefits compared to steel towers, especially for taller towers. Because of the higher structural requirements of large wind turbine towers, Kaldellis et al. [16] suggested that the use of steel-concrete towers was economical and effective because of the full utilization of the advantages of the convenient installation of steel towers and low maintenance cost of concrete towers. Pons et al. [17] compared the advantages and disadvantages of traditional steel towers, concrete towers, and steel-concrete towers and concluded that the advantages of steel-concrete towers were more pronounced in large-scale wind turbines.
Moreover, numerous researchers have studied the structural connections of steel-concrete towers. The concrete part is generally prefabricated and then installed at the construction site. To facilitate transportation, it is divided into several sections along the tower height, and each section is further divided into several segments along the longitudinal direction. Kang et al. [15] analyzed the behavior of concrete tower joints under the action of torque by combining existing theory and finite element simulations, pointed out that the reliability of horizontal joints would affect the mechanical characteristics of the prefabricated concrete towers, and demonstrated the inaccuracy of the current theory by studying the torsional strength of a segmented tower structure in detail. Song and Cong [18,19] used ANSYS to analyze the mechanical performance of the horizontal and longitudinal joints of a prefabricated concrete tower. The results showed that adequate design of the horizontal and vertical joints can ensure a good mechanical performance of the tower. Kim et al. [20] proposed a new design method for the steel-concrete connection, and carried out a fatigue load test and a static load test on connection specimens. The experimental results verified that the connection section had not only good fatigue resistance, but also high static strength.
The steel-concrete composite tower is a cantilever structure, and its seismic response characteristics have a significant influence on the structural performance. However, most of the existing seismic performance analyses consider the steel tower structures [21,22,23,24], and there are only limited studies on the seismic performance of the steel-concrete towers. On the other hand, many studies have shown that a tuned mass damper (TMD) may significantly reduce the dynamic response of high-rise structures [25,26,27,28,29,30,31,32]. Therefore, this study analyzes the effects of TMDs on the seismic response of the new steel-concrete tower. Furthermore, this study varies the TMD mass ratio and layouts, including multiple TMDs, to examine the resultant changes in the tower displacement, velocity, and acceleration seismic response spectra, as well as optimizes the seismic performance of the new tower using TMDs to provide suggestions for the application of this kind of tower in practical projects.
The reminder of the paper is organized into four sections: Section 2 presents a simplified model of the steel-concrete tower with a TMD created in ABAQUS; Section 3 investigates the TMD impact on the tower dynamic characteristics using the time history analysis method; Section 4 optimizes the TMD structural parameters and layout for the improvement of the dynamic characteristics of the steel-concrete tower using spectral analysis. The final section provides conclusions from the analyses presented in the paper. The results show that the TMD could significantly reduce the accelerations, velocities, and displacements of the tower. The best TMD mass ratio and optimal arrangement for the vibration reduction of the steel-concrete tower were also identified.

2. Establishment and Simplification of Finite Element Model

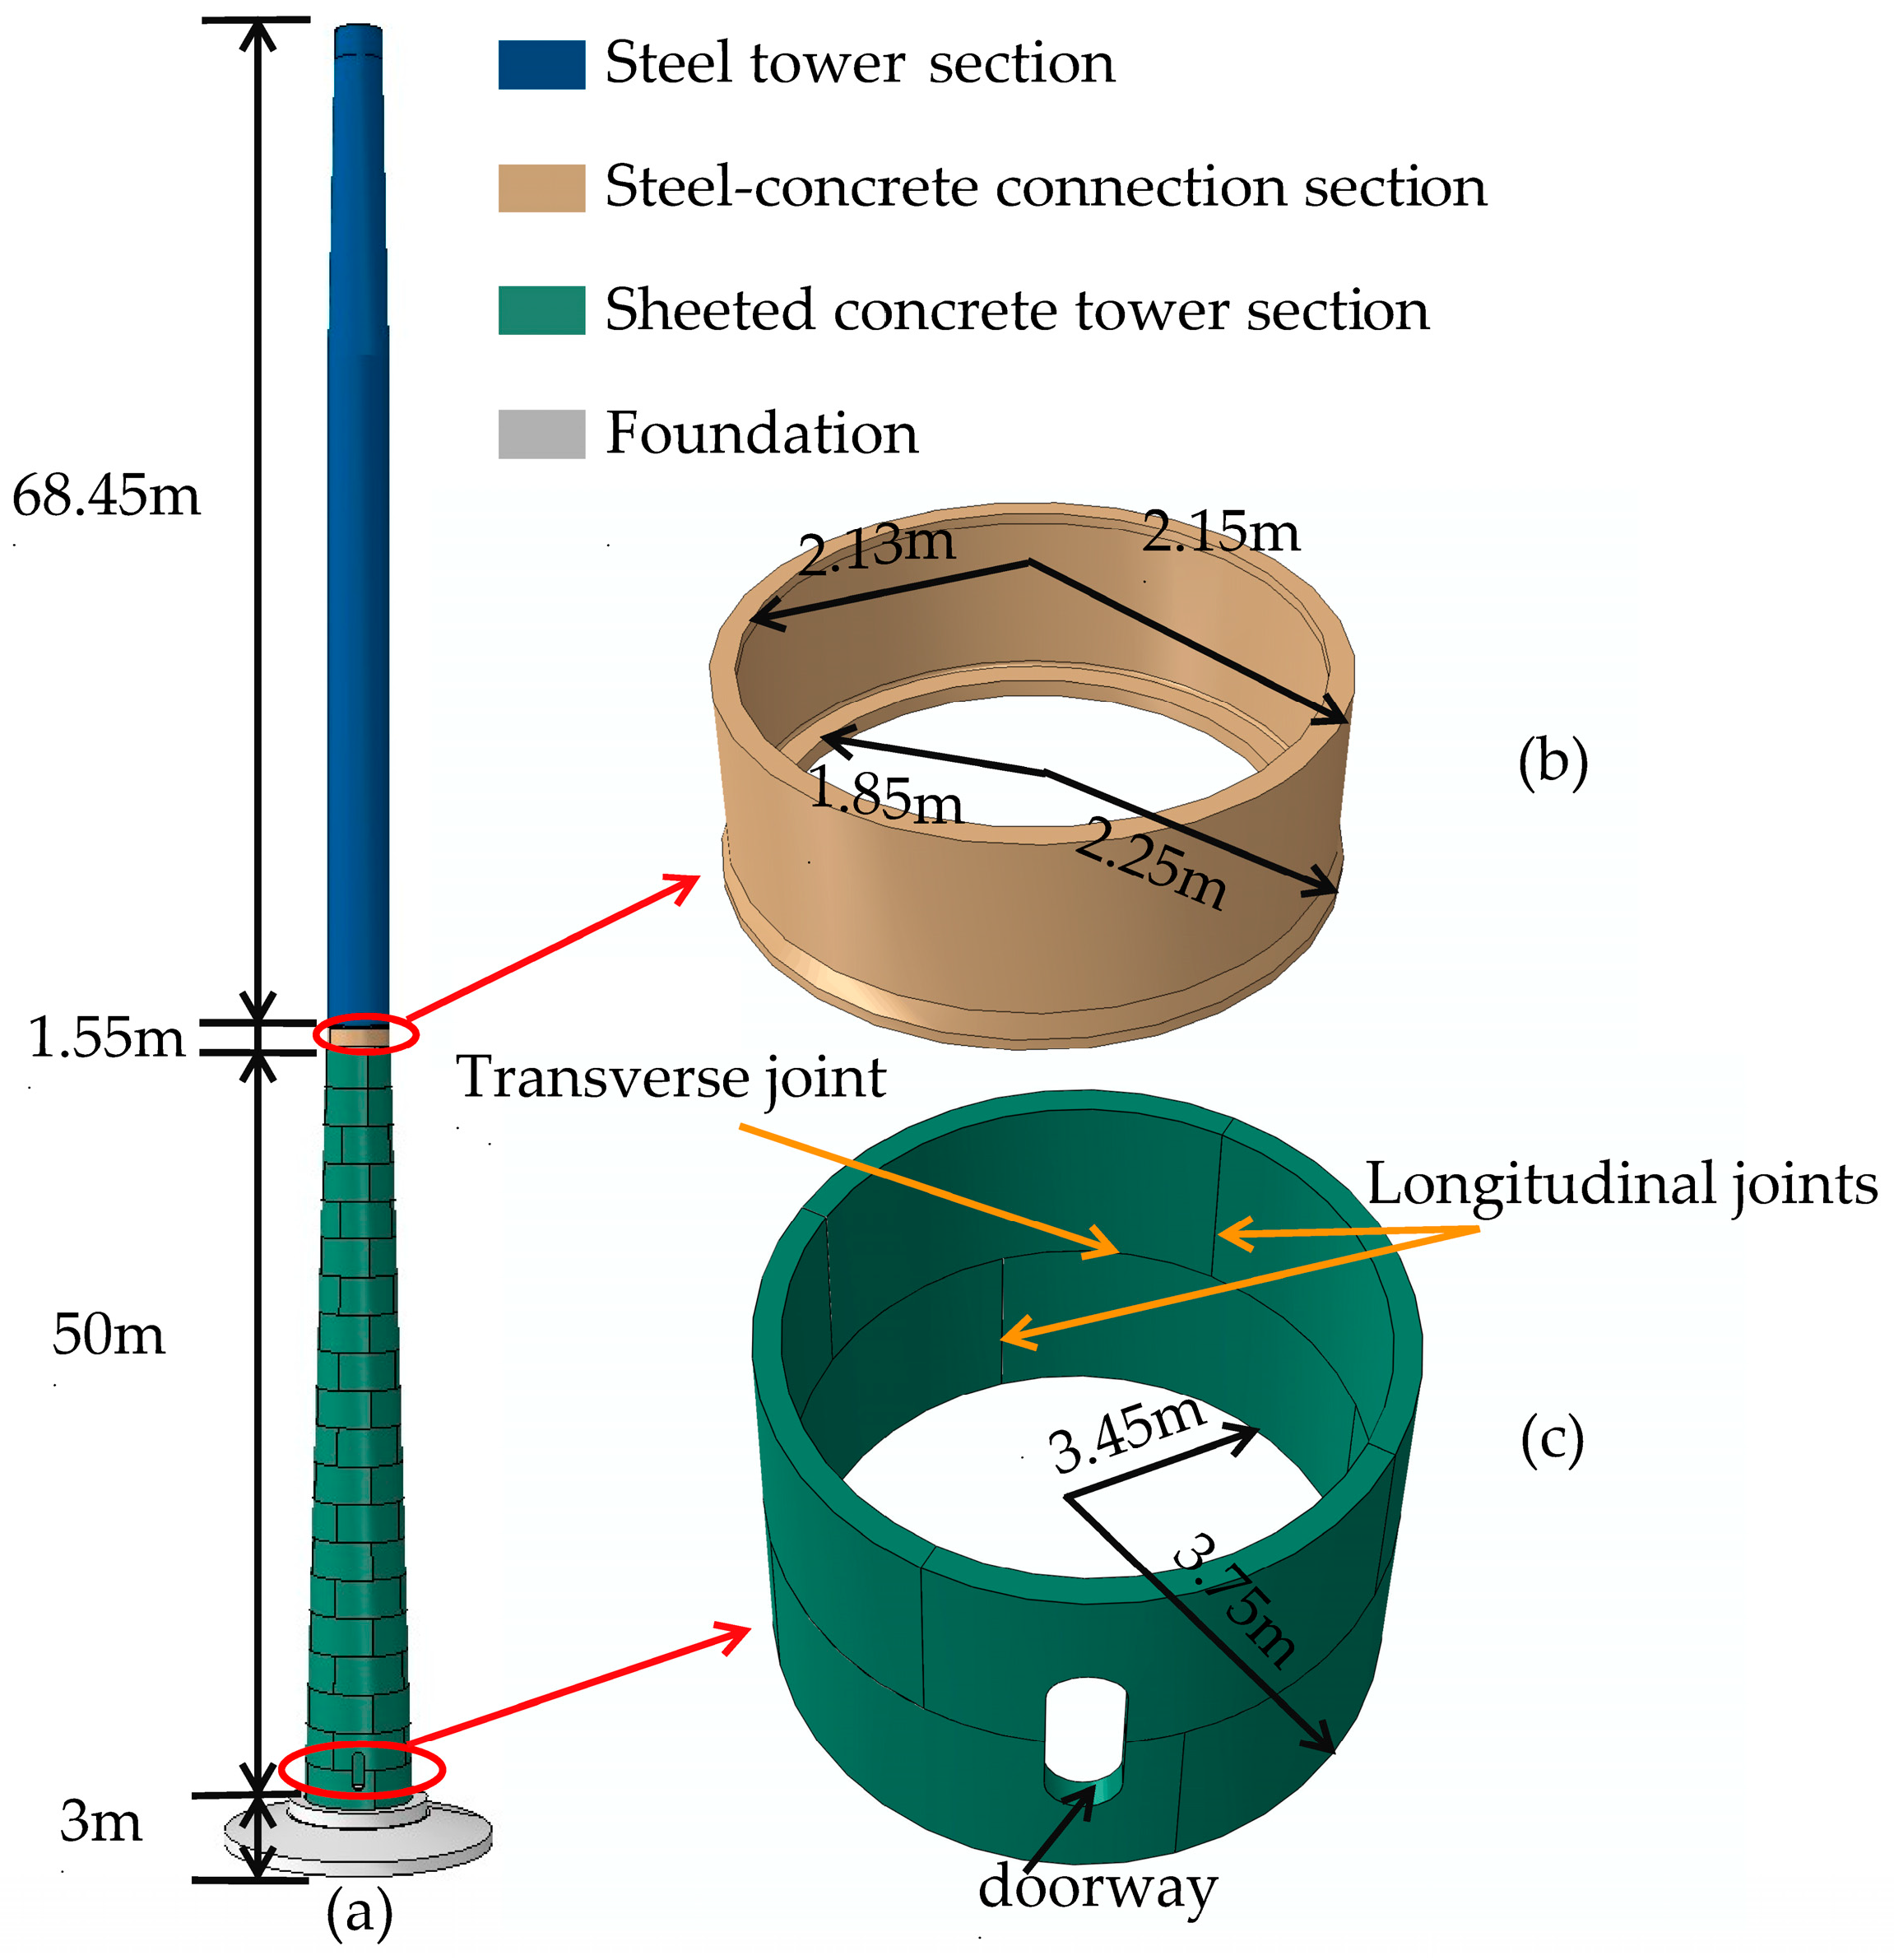
2.1. Steel-Concrete Composite Tower

2.1.1. Model

As Figure 1a shows, the wind turbine tower established in this paper was composed of a steel tower, steel-concrete connection section, concrete tower, and independent foundation. The design of the steel tower was a circular tower, identical to a traditional steel tower [33]. The steel-concrete connection section was used to connect the steel tower and the concrete tower, as shown in Figure 1b. The concrete tower was divided into 20 sections, and each section was divided into 4 pieces. There were longitudinal and transversal joints between each piece, as depicted in Figure 1c. The 20 concrete sections were connected by 31 prestressed anchor cables, and pieces of the same tower section were connected by the cast-in-place concrete.

2.1.2. Materials

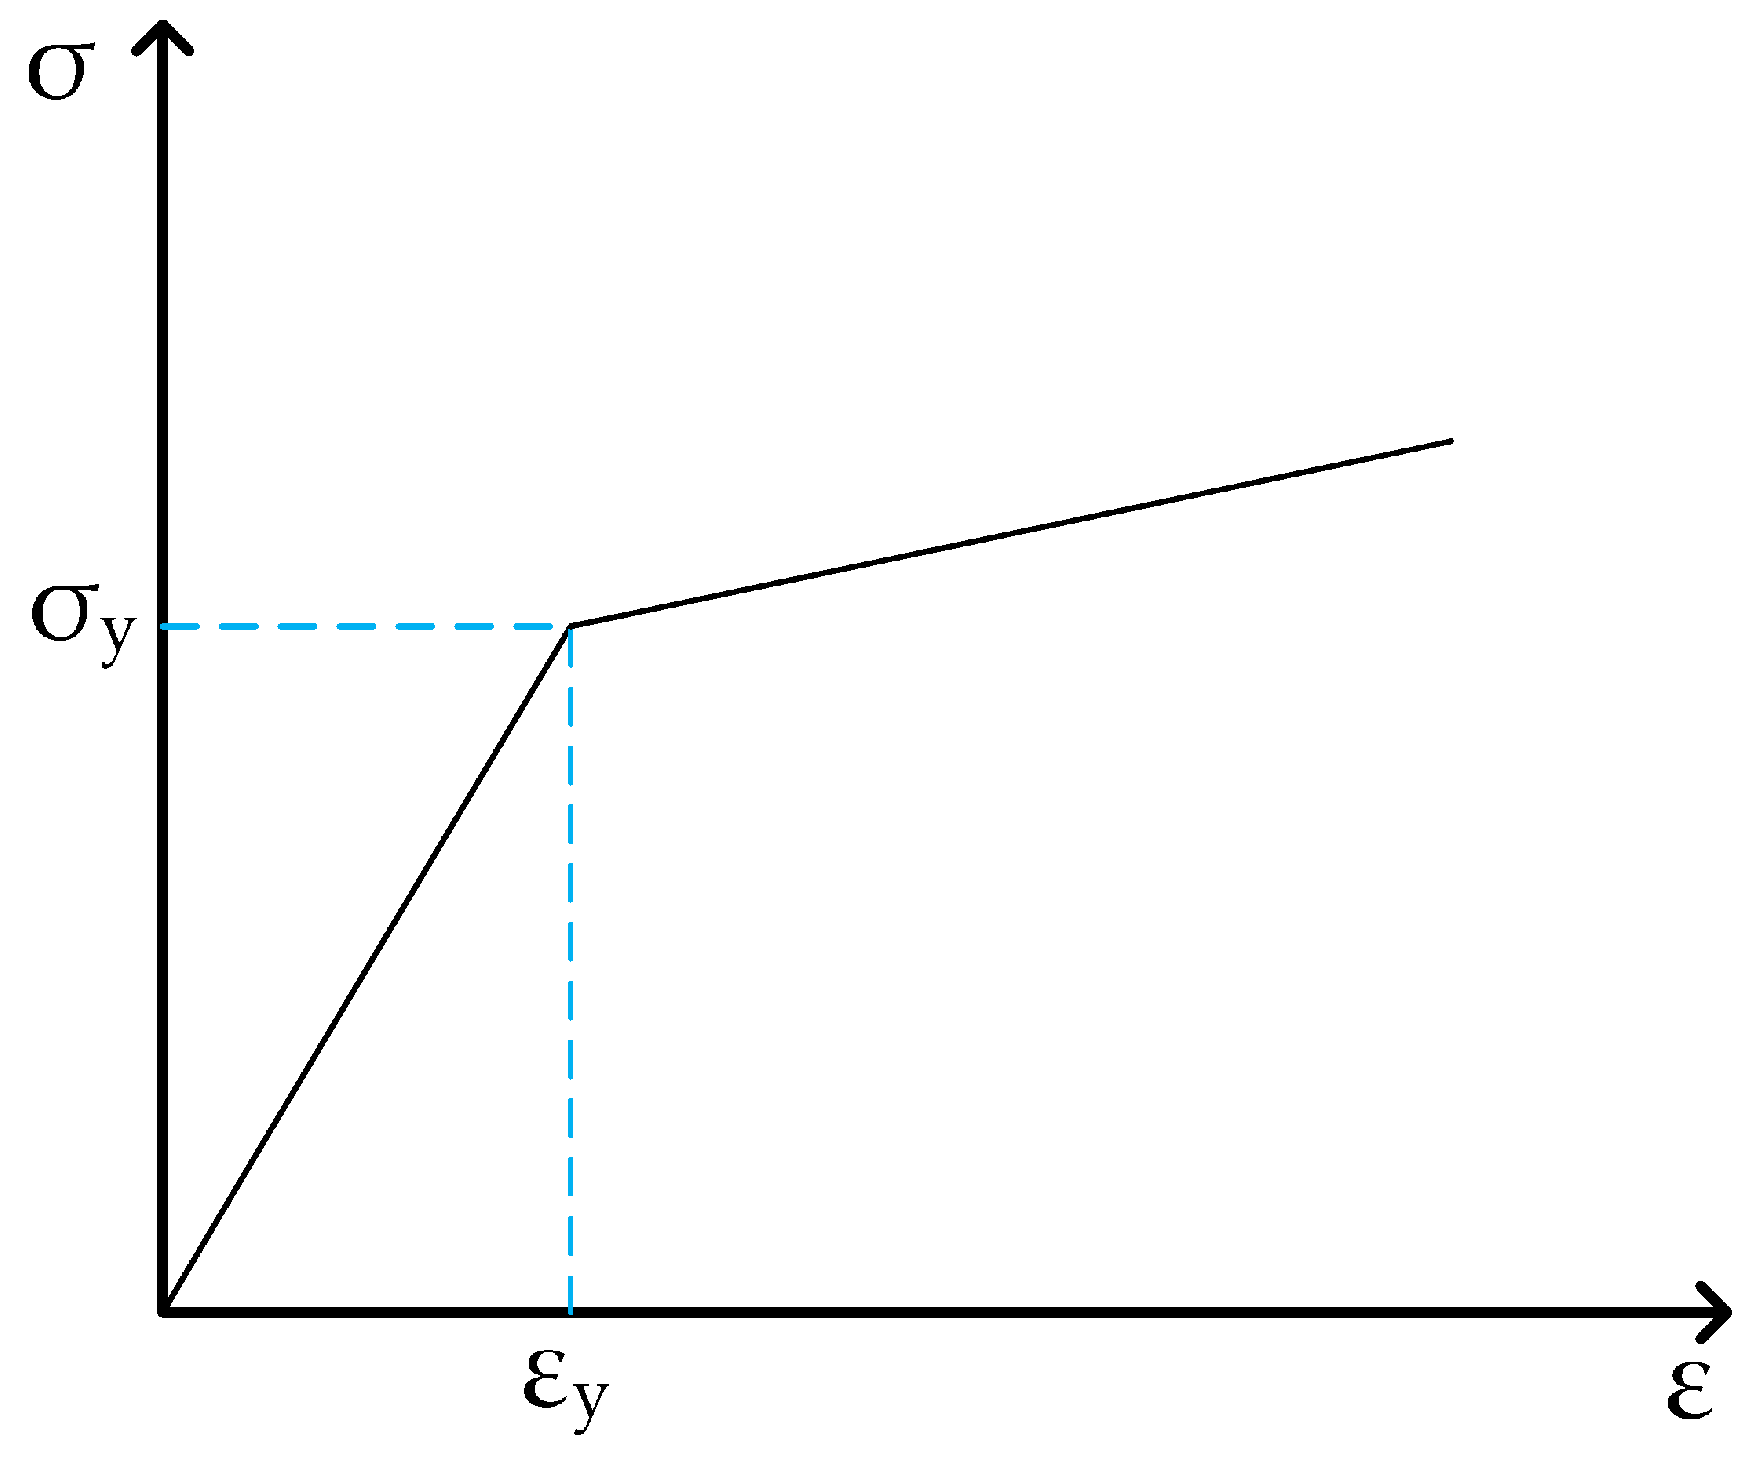
Steel Tower and Conversion Section
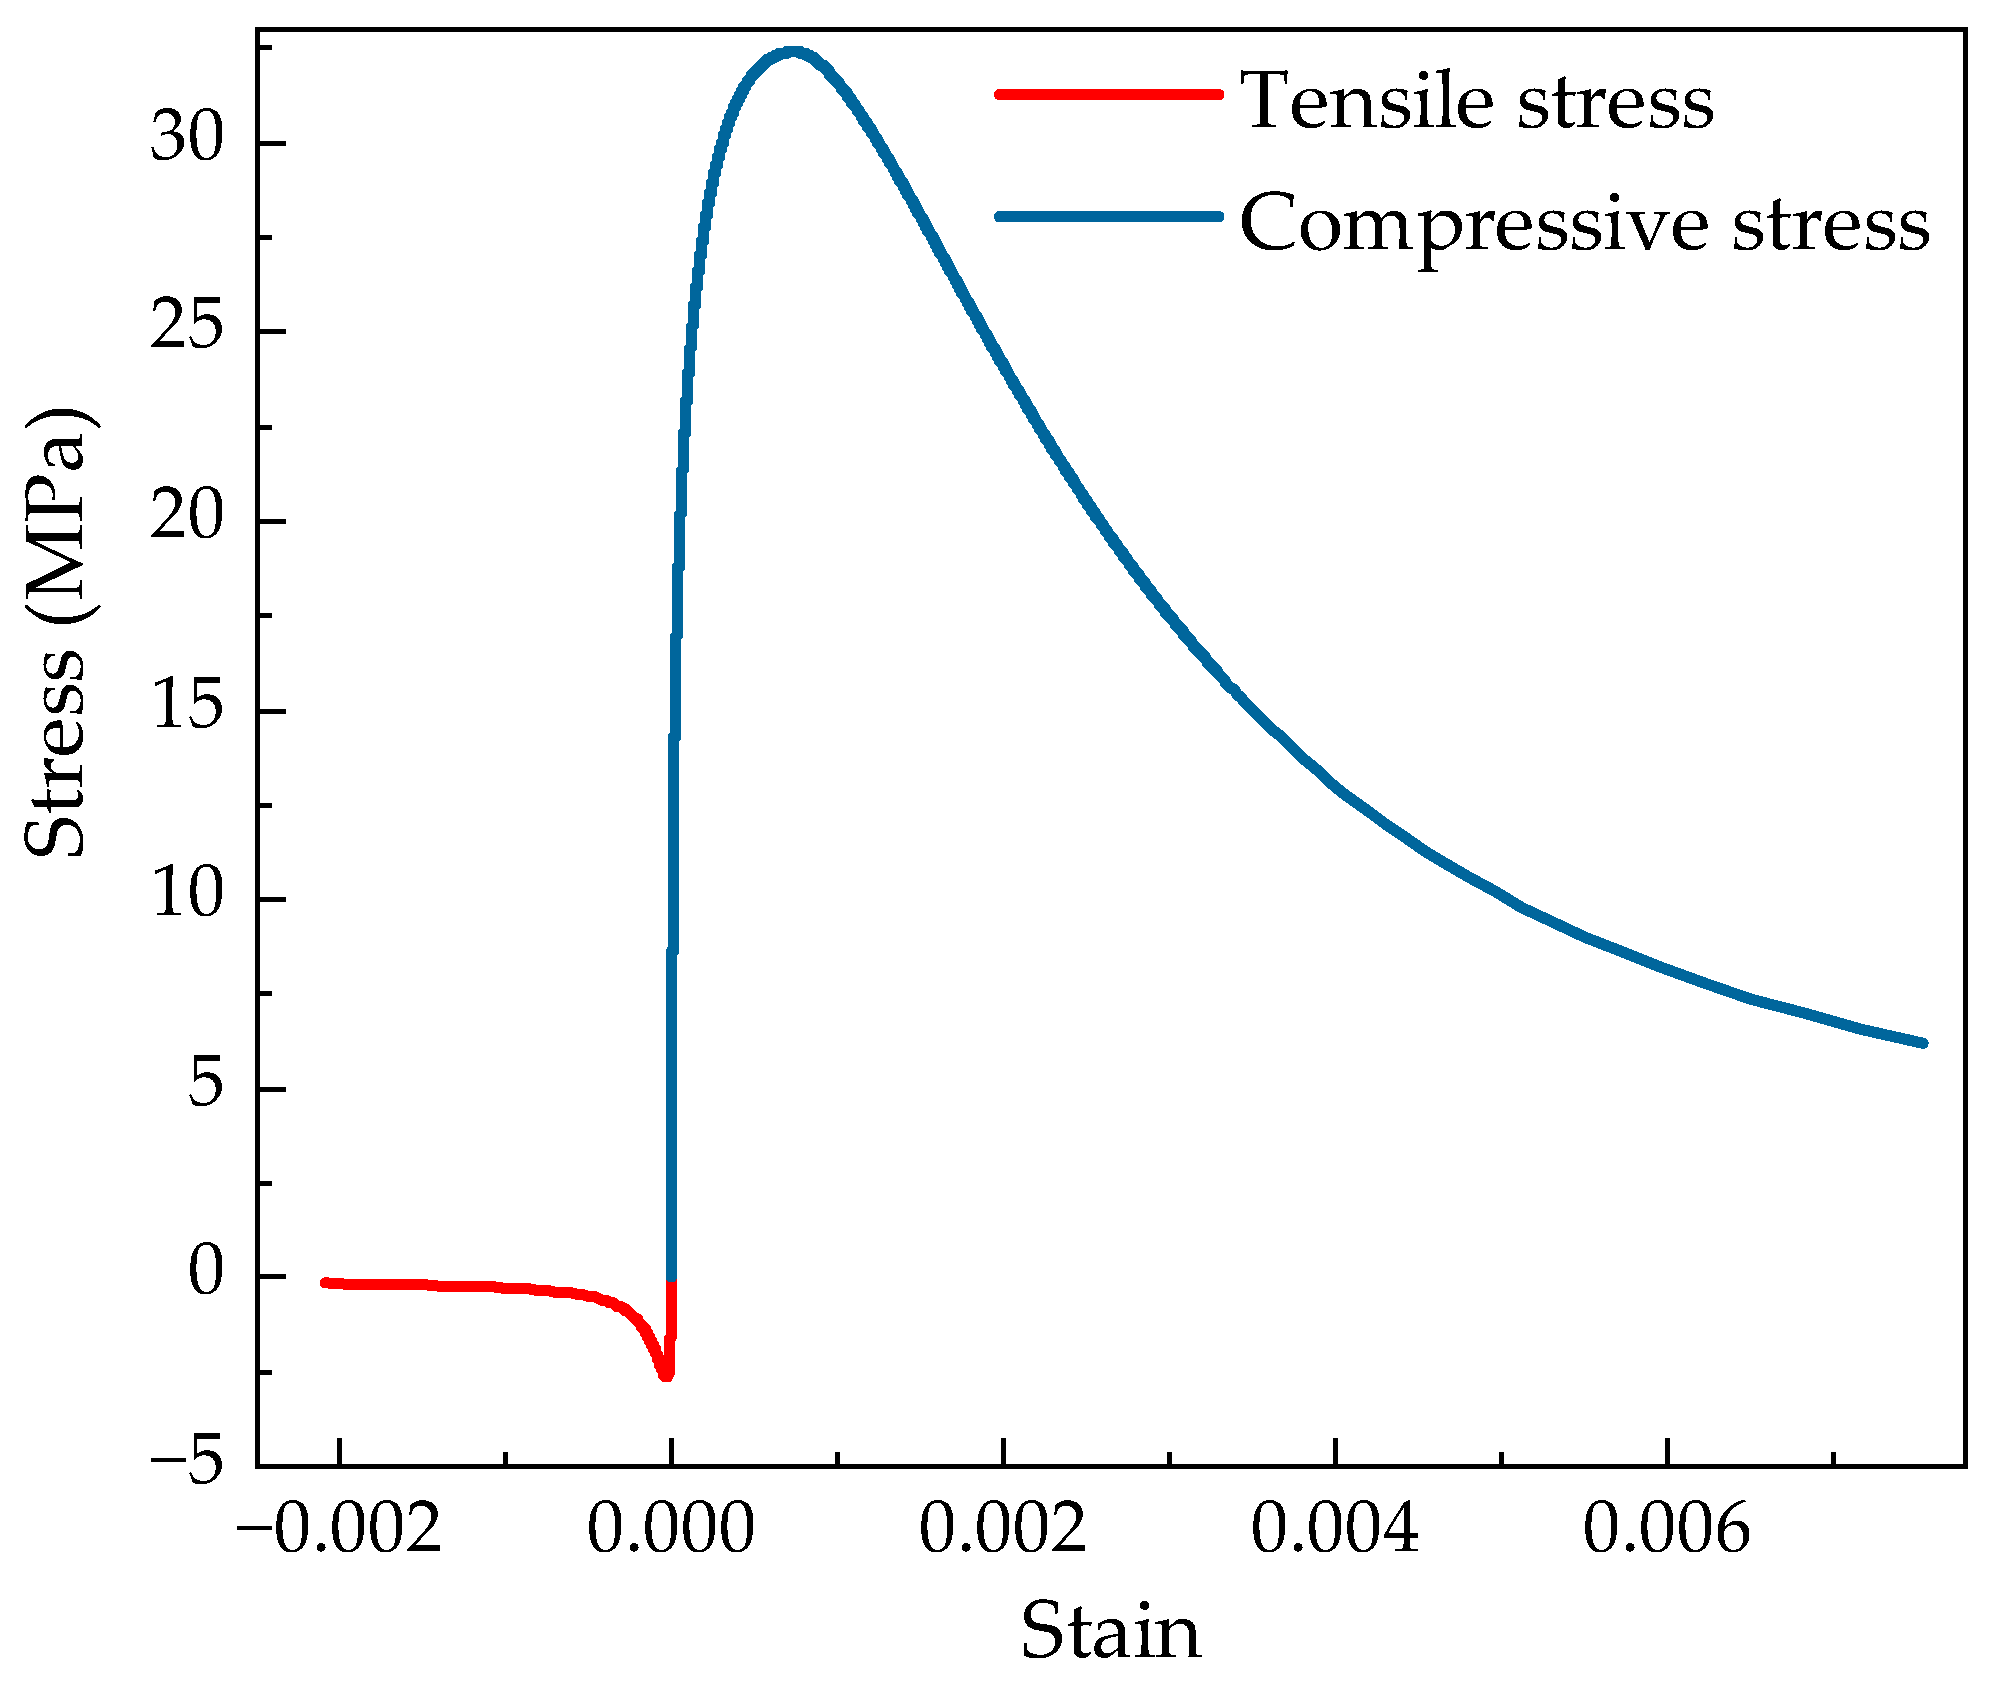
The steel tower and steel-concrete connection section were made of Q355 steel, with a Poisson’s ratio of 0.3, a yield stress of 355 MPa, and an elastic modulus of 206 GPa. The constitutive model was based on the bilinear kinematic hardening model, as shown in Figure 2. The elastic modulus of Q355 is represented by the slope of the first straight line in the figure. The slope of the second straight line is 1% of the slope of the first straight line [34], indicating that the steel entered the strengthening stage.

Concrete Tower

The concrete damaged plasticity (CDP) model was used to simulate the tensile and compressive behavior of concrete under seismic conditions, where the dilation angle was 38°, eccentricity is 0.1, fb0/fc0 ratio was 1.16, K was 0.6667, and viscosity parameter was 0.005. In the concrete section, C50 concrete was used, and the corresponding stress–strain curve was obtained in accordance with GB50010-2010 [35], as shown in Figure 3.

Prestressed Anchor Cables

For the prestressed anchor cables, the linear elastic model was used, and the expansion coefficient was set to 0.0001.

The Foundation

The foundation was not the primary research topic. To simplify the calculation, the C50 concrete linear elastic model was used.

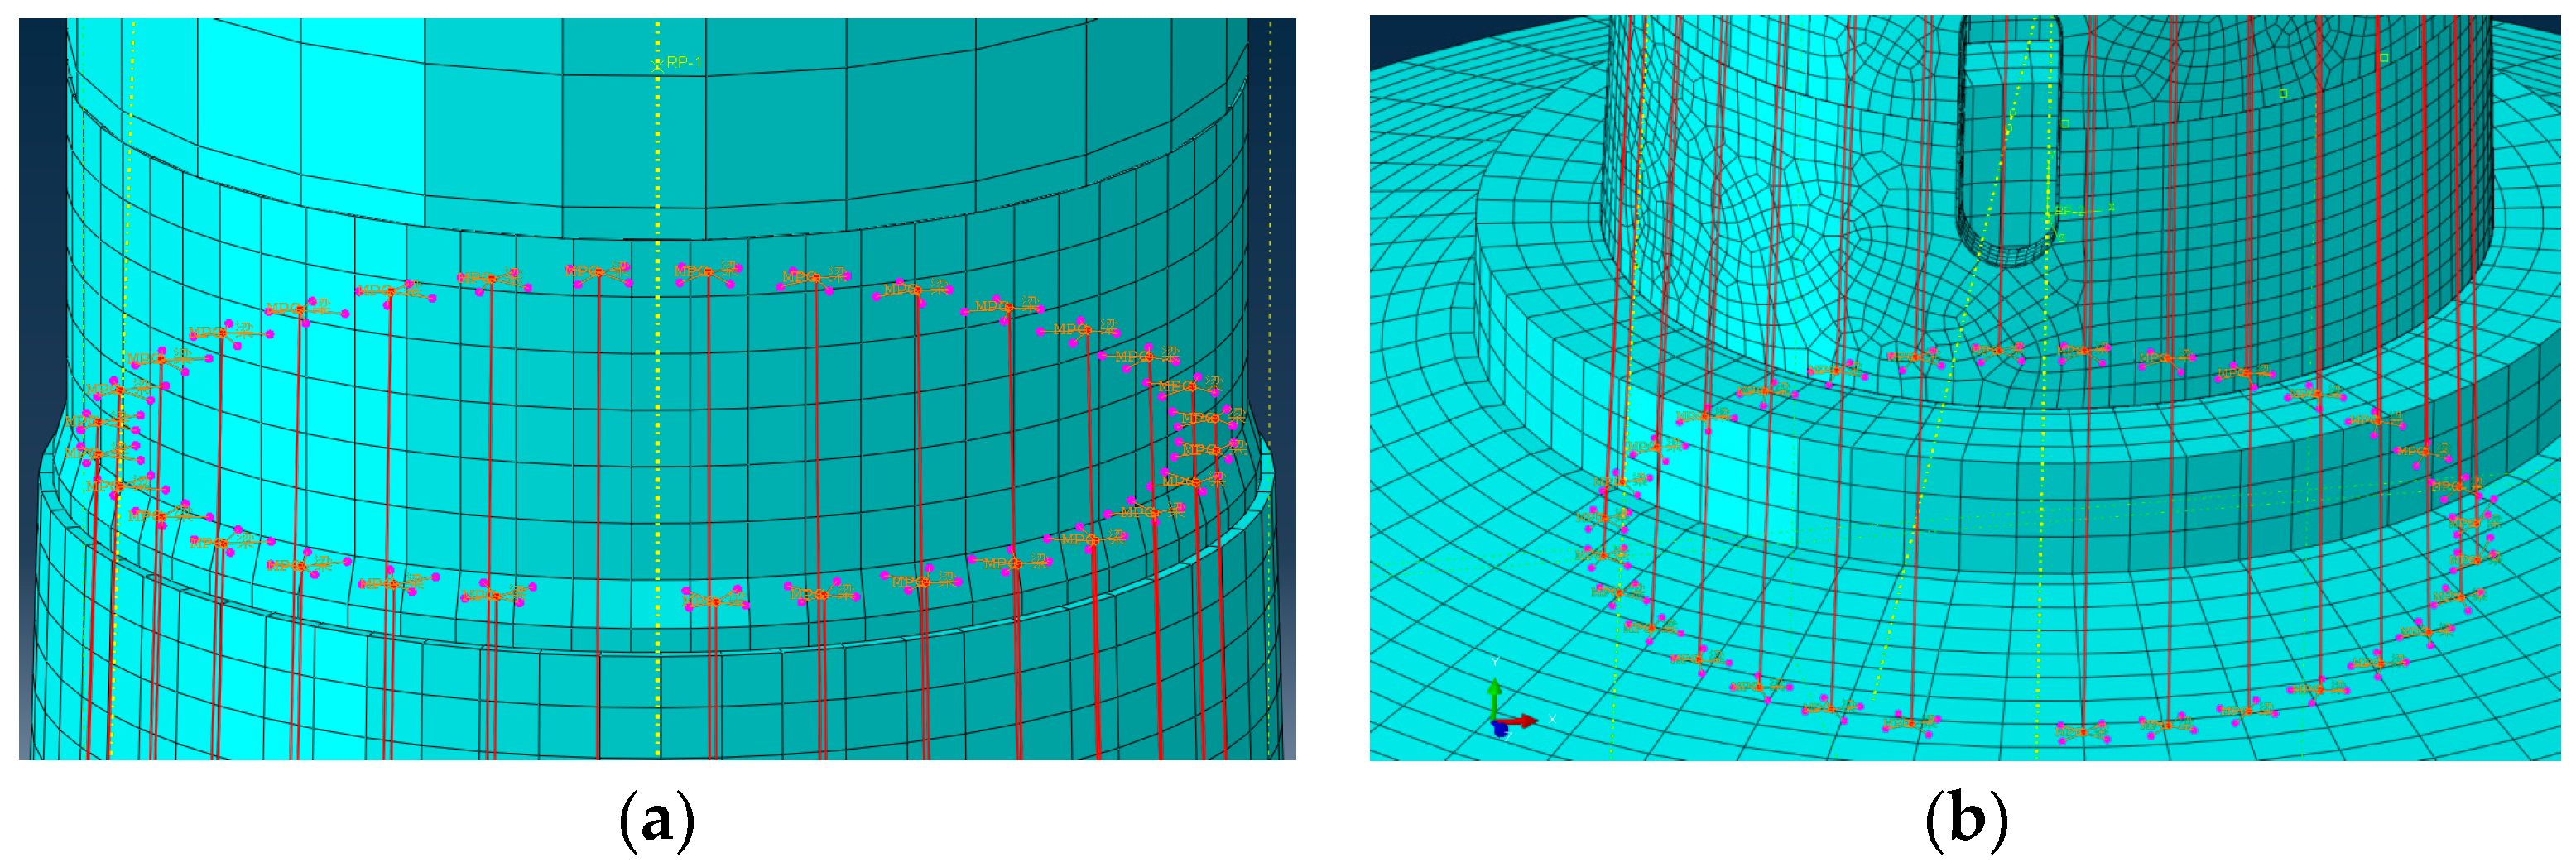
2.1.3. Interaction between Components of Wind Turbine Tower

Between Concrete Pieces

As mentioned above, the 20 concrete sections were connected by 31 prestressed anchor cables, and pieces of the same tower section were connected by the cast-in-place concrete. Thus, surface-to-surface contact friction was utilized in transversal joints, and the model allowed the joint surface to develop a small elastic deformation to simulate relative movement between concrete parts. The friction model of penalty function was adopted [36], and the friction coefficient was taken as 0.4. Hard contact was defined in the normal direction. The contact surfaces would come under pressure if they remained in contact. When there was a gap between contact surfaces, the contact pressure would vanish and no interaction would occur. To simplify the calculations, the binding constraints were used in this study to simulate the cast-in-place concrete connection at the longitudinal joints of the concrete pieces

Prestressed Anchor Cables

There was no bond between the prestressed anchor cables and the concrete sections. As a result, as shown in Figure 4, the MPC multipoint constraint was used to simulate the interaction among the anchor cables, the upper conversion section, and the lower foundation.

The Steel Conversion Section

Flanges connected the steel-concrete connection section to the concrete tower and the steel tower. Tie constraints were used instead of flange connections to simplify the model [37].

Concrete Tower and Foundation

Because the concrete tower and foundation were connected by cast-in-place concrete, the tie constraint was used to simulate the connection.

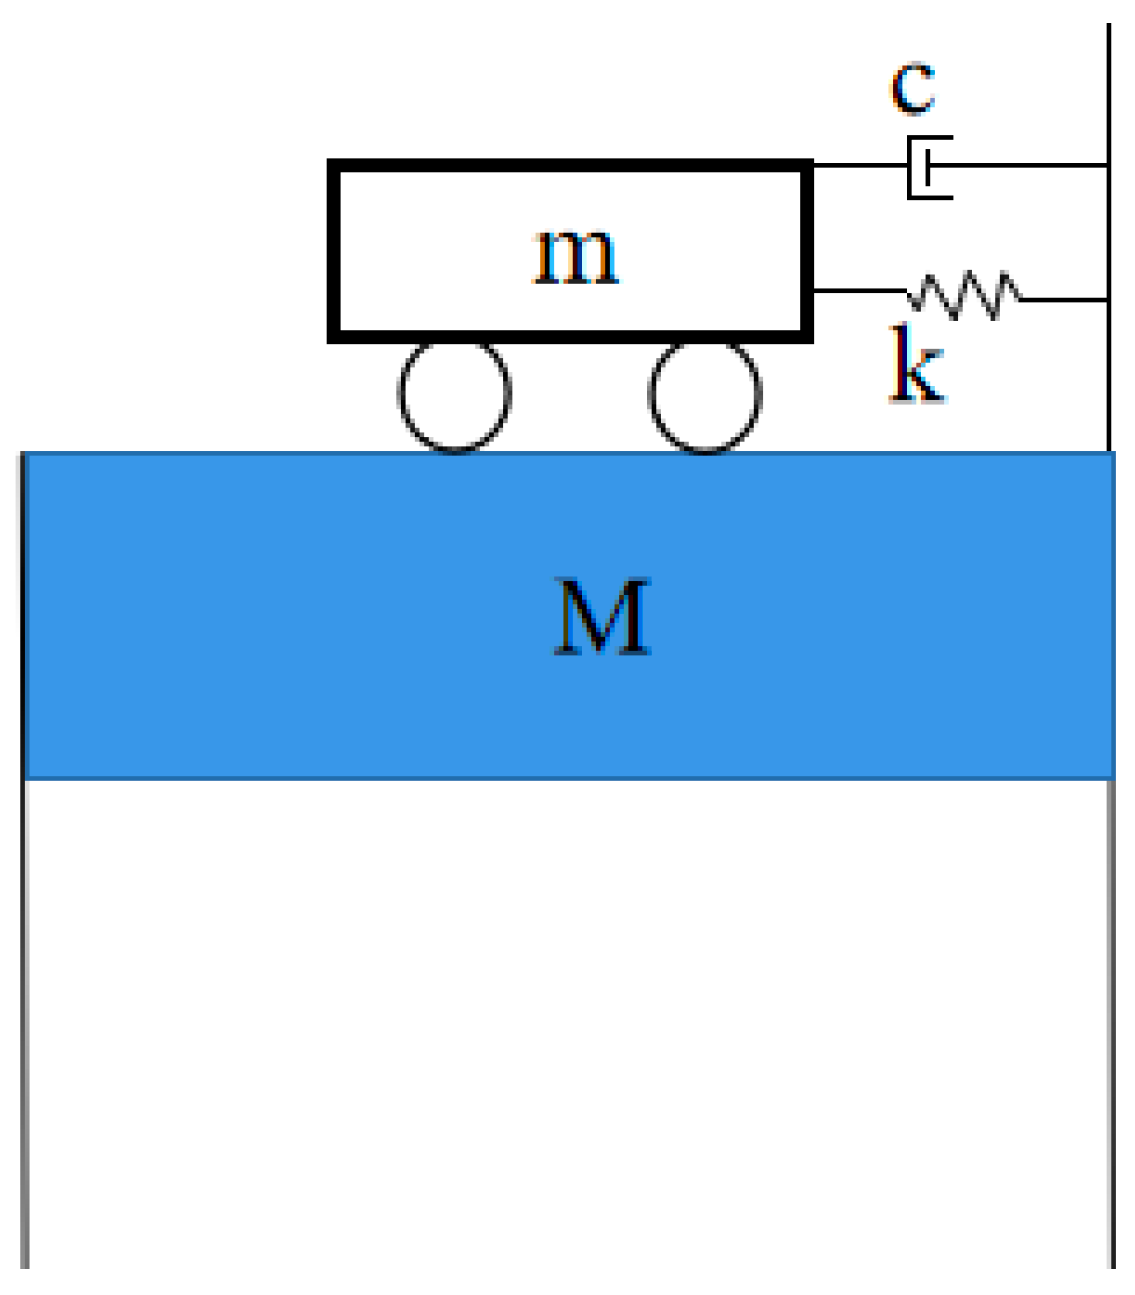
2.2. Tuned Mass Damper (TMD)

2.2.1. Model Parameters

The mechanical model of a TMD is shown in Figure 5. A TMD model must specify the three most important parameters: mass, stiffness, and damping. The mass of a TMD changes with the mass of the main structure. Considering the ease of installation, the TMD mass should not be excessive. The typical range of mass ratios between TMD and the main structure is usually 0.25–2% [38] and generally not more than 5% [39]. In this study, the mass TMD ratios remained within this range.
There are numerous optimization principles for determining the optimal value of TMD stiffness and damping. The three most common are the maximum effective damping, the minimum displacement, and the minimum acceleration [40,41,42,43]. The maximum effective damping optimization principle seeks to maximize the equivalent damping of the TMD and main structure, the minimum displacement optimization principle seeks to minimize the main structure displacements, and the minimum acceleration optimization principle seeks to minimize the main structure accelerations. The most widely used optimization principle of maximum effective damping was adopted in this study.
The following procedure was used to calculate the optimal TMD stiffness and damping values [38]: first, the TMD and primary system mass ratio m = md/m was determined, where md is the mass of the TMD, and m is the mass of the main structure. The empirical formula for the TMD optimal frequency ratio is as follows:
λ d = 1 1 + 1.5 μ .
The TMD vibration frequency is calculated using the following formula:
ω d = λ d ω 0 ,
where λ d is the TMD to primary system optimal frequency ratio, ω d is the TMD vibration frequency, and ω 0 represents the vibration frequency of the main structure. Then, the optimal TMD spring stiffness can be determined as follows:
k d = m d ω d 2 .
The empirical formula for the TMD optimal damping ratio is as follows:
ξ d = μ ( 1 0.75 μ ) 4 ,
and the optimal TMD damping is as follows:
c d = 2 m d ω d ξ d .

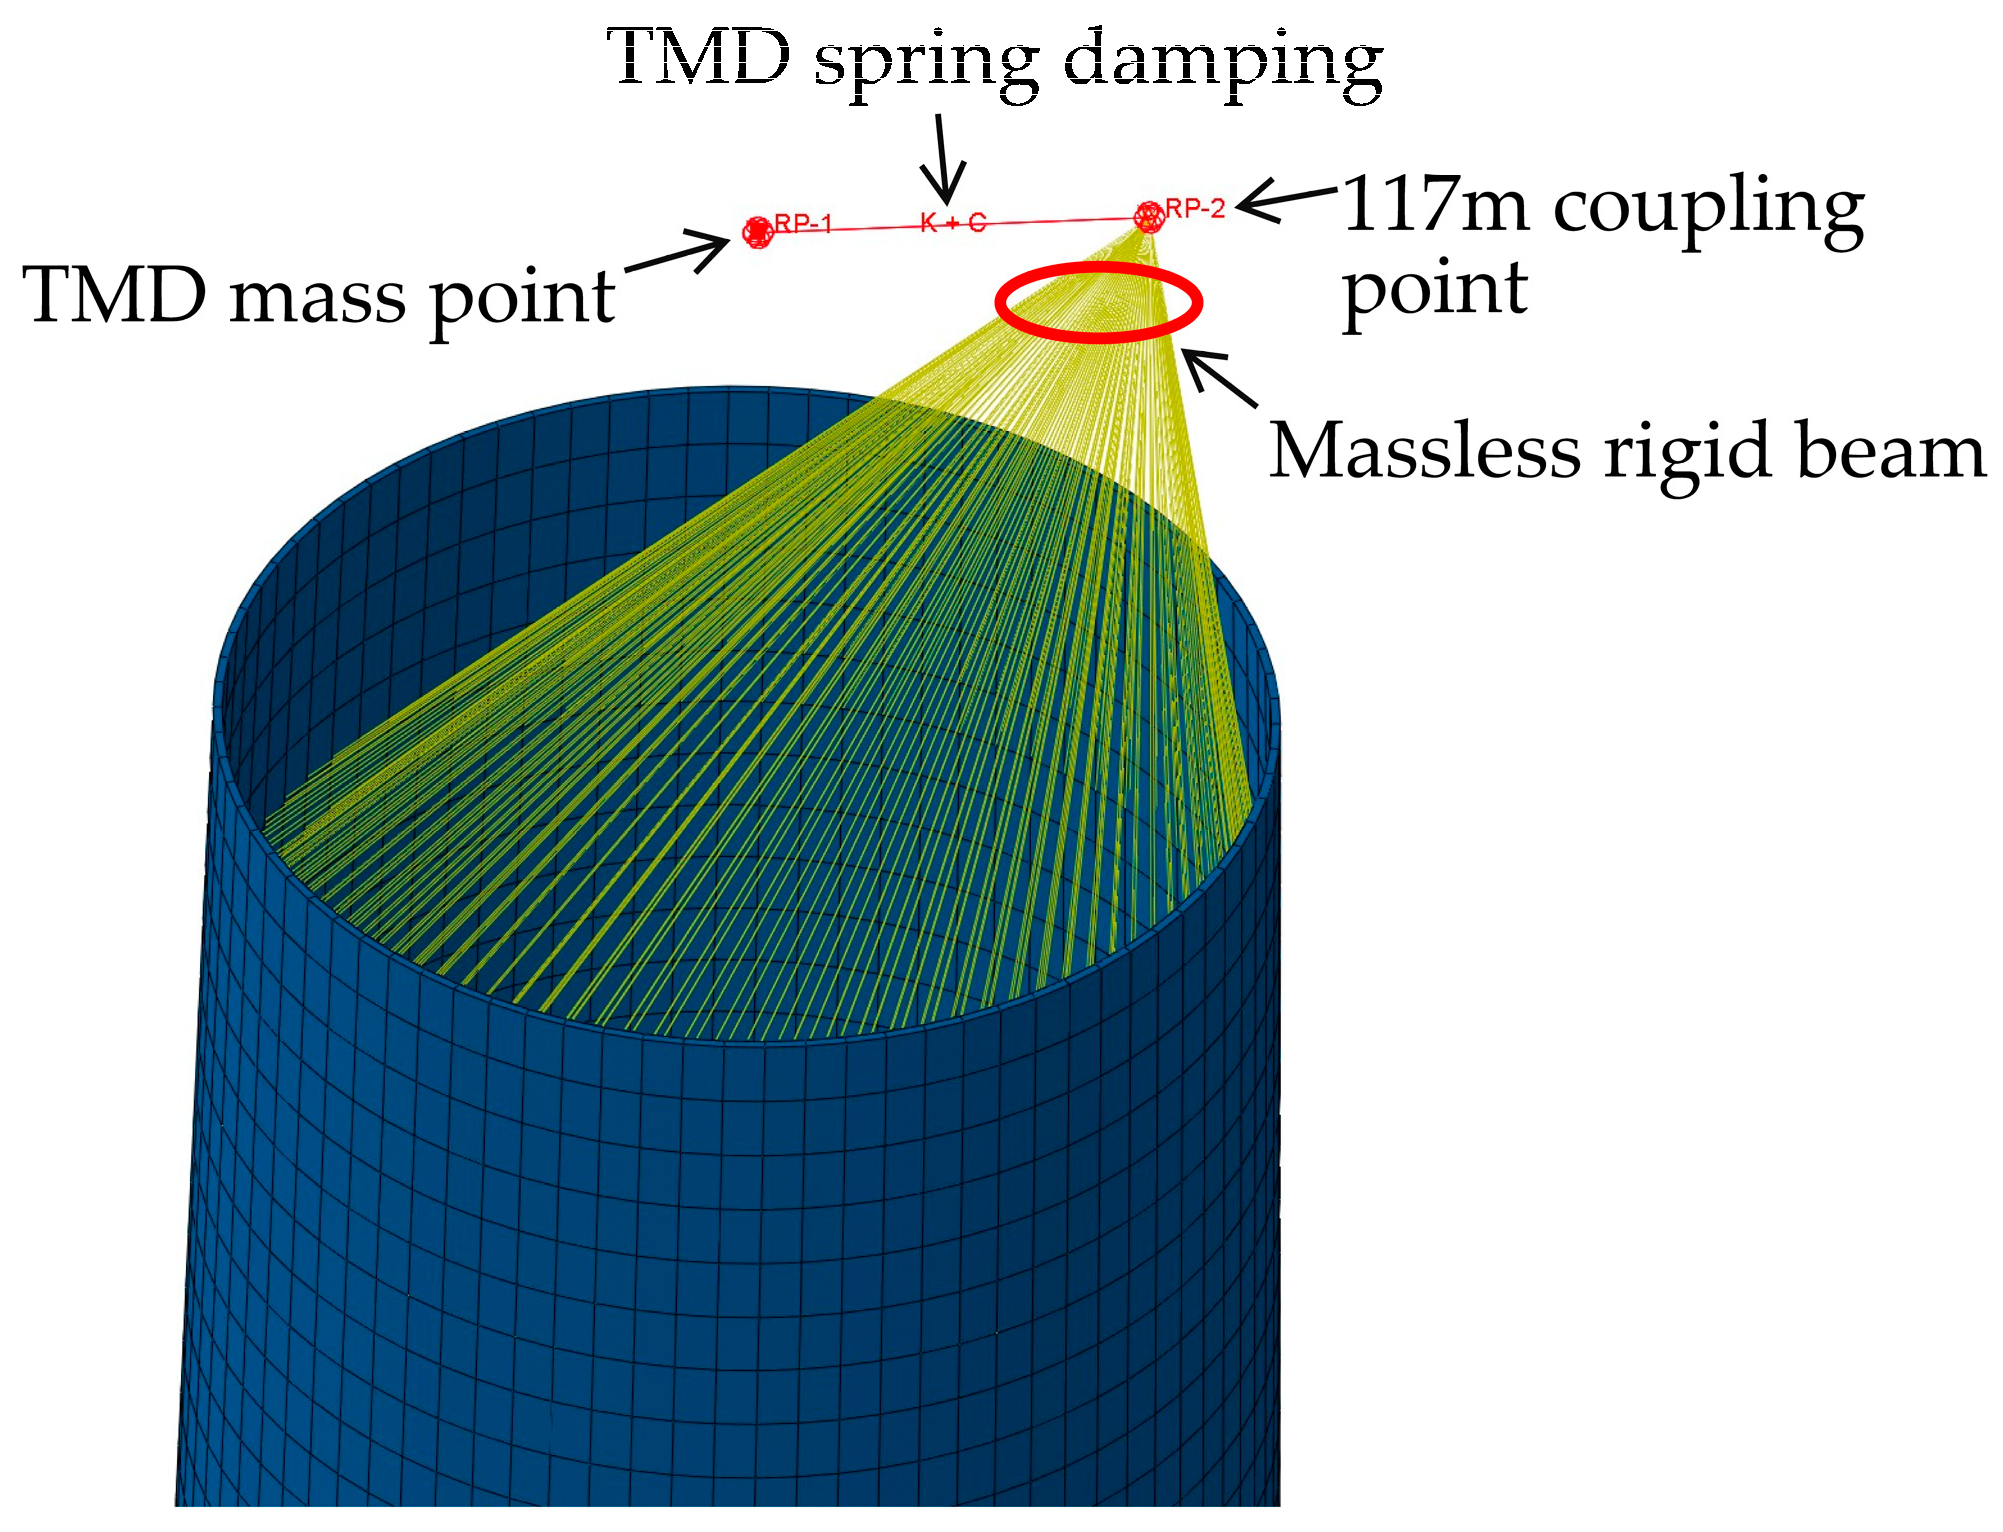
2.2.2. TMD Simplified Model

The TMD was made up primarily of a mass block, a spring, and a damper. These three components could be simplified when modeling the TMD. The mass block could be broken down into lump mass points, each assigned a mass. One end of a spring or damper was linked to the lump mass point, while the other was linked to the tower [44]. To avoid excessive deformation at the point (117 m coupling point) where the TMD connected with the tower, an additional point was defined and coupled with the entire section of the tower using rigid beam elements, causing the TMD to act on the entire tower section rather than a single point. Figure 6 shows the model.

2.3. Nacelle and Rotor

This study established a detailed model for the tower only to simplify the analysis, and the nacelle and rotor were simplified as a lumped mass added to the top of the tower. The nacelle and rotor effects on the tower included their gravity, as well as the bending moment, torque, and shear force generated during operation, as shown in Table 1.

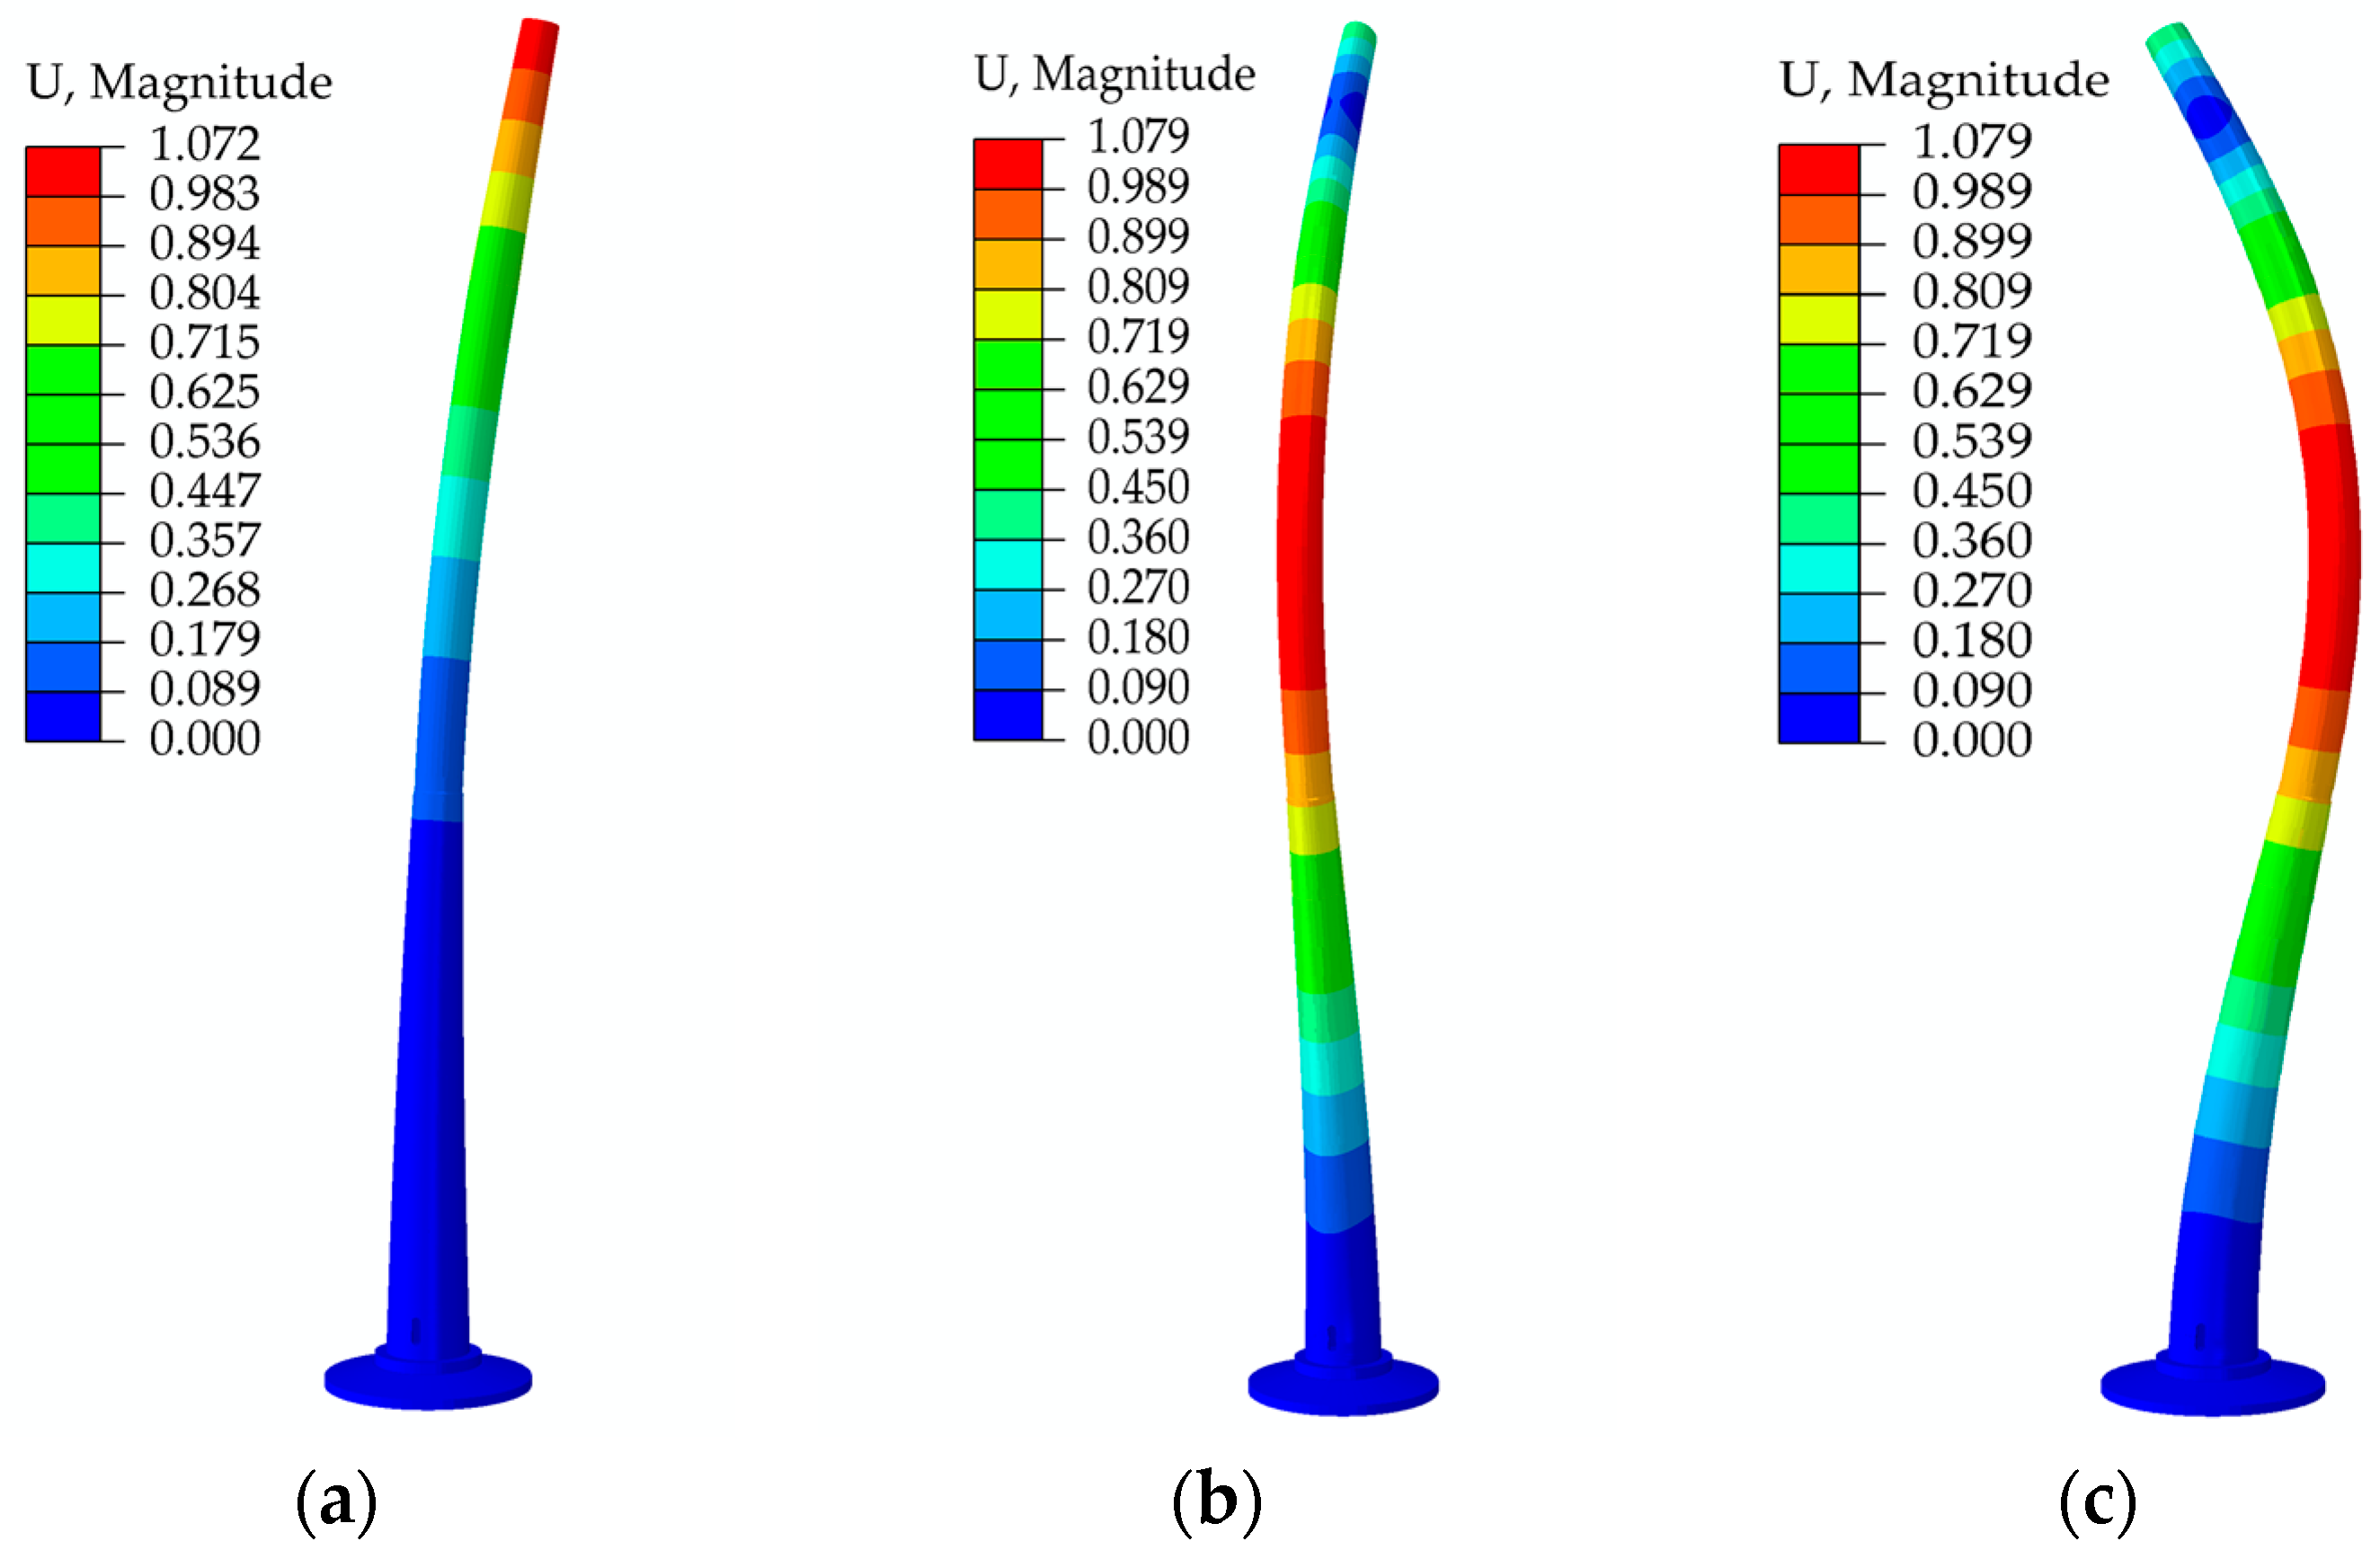
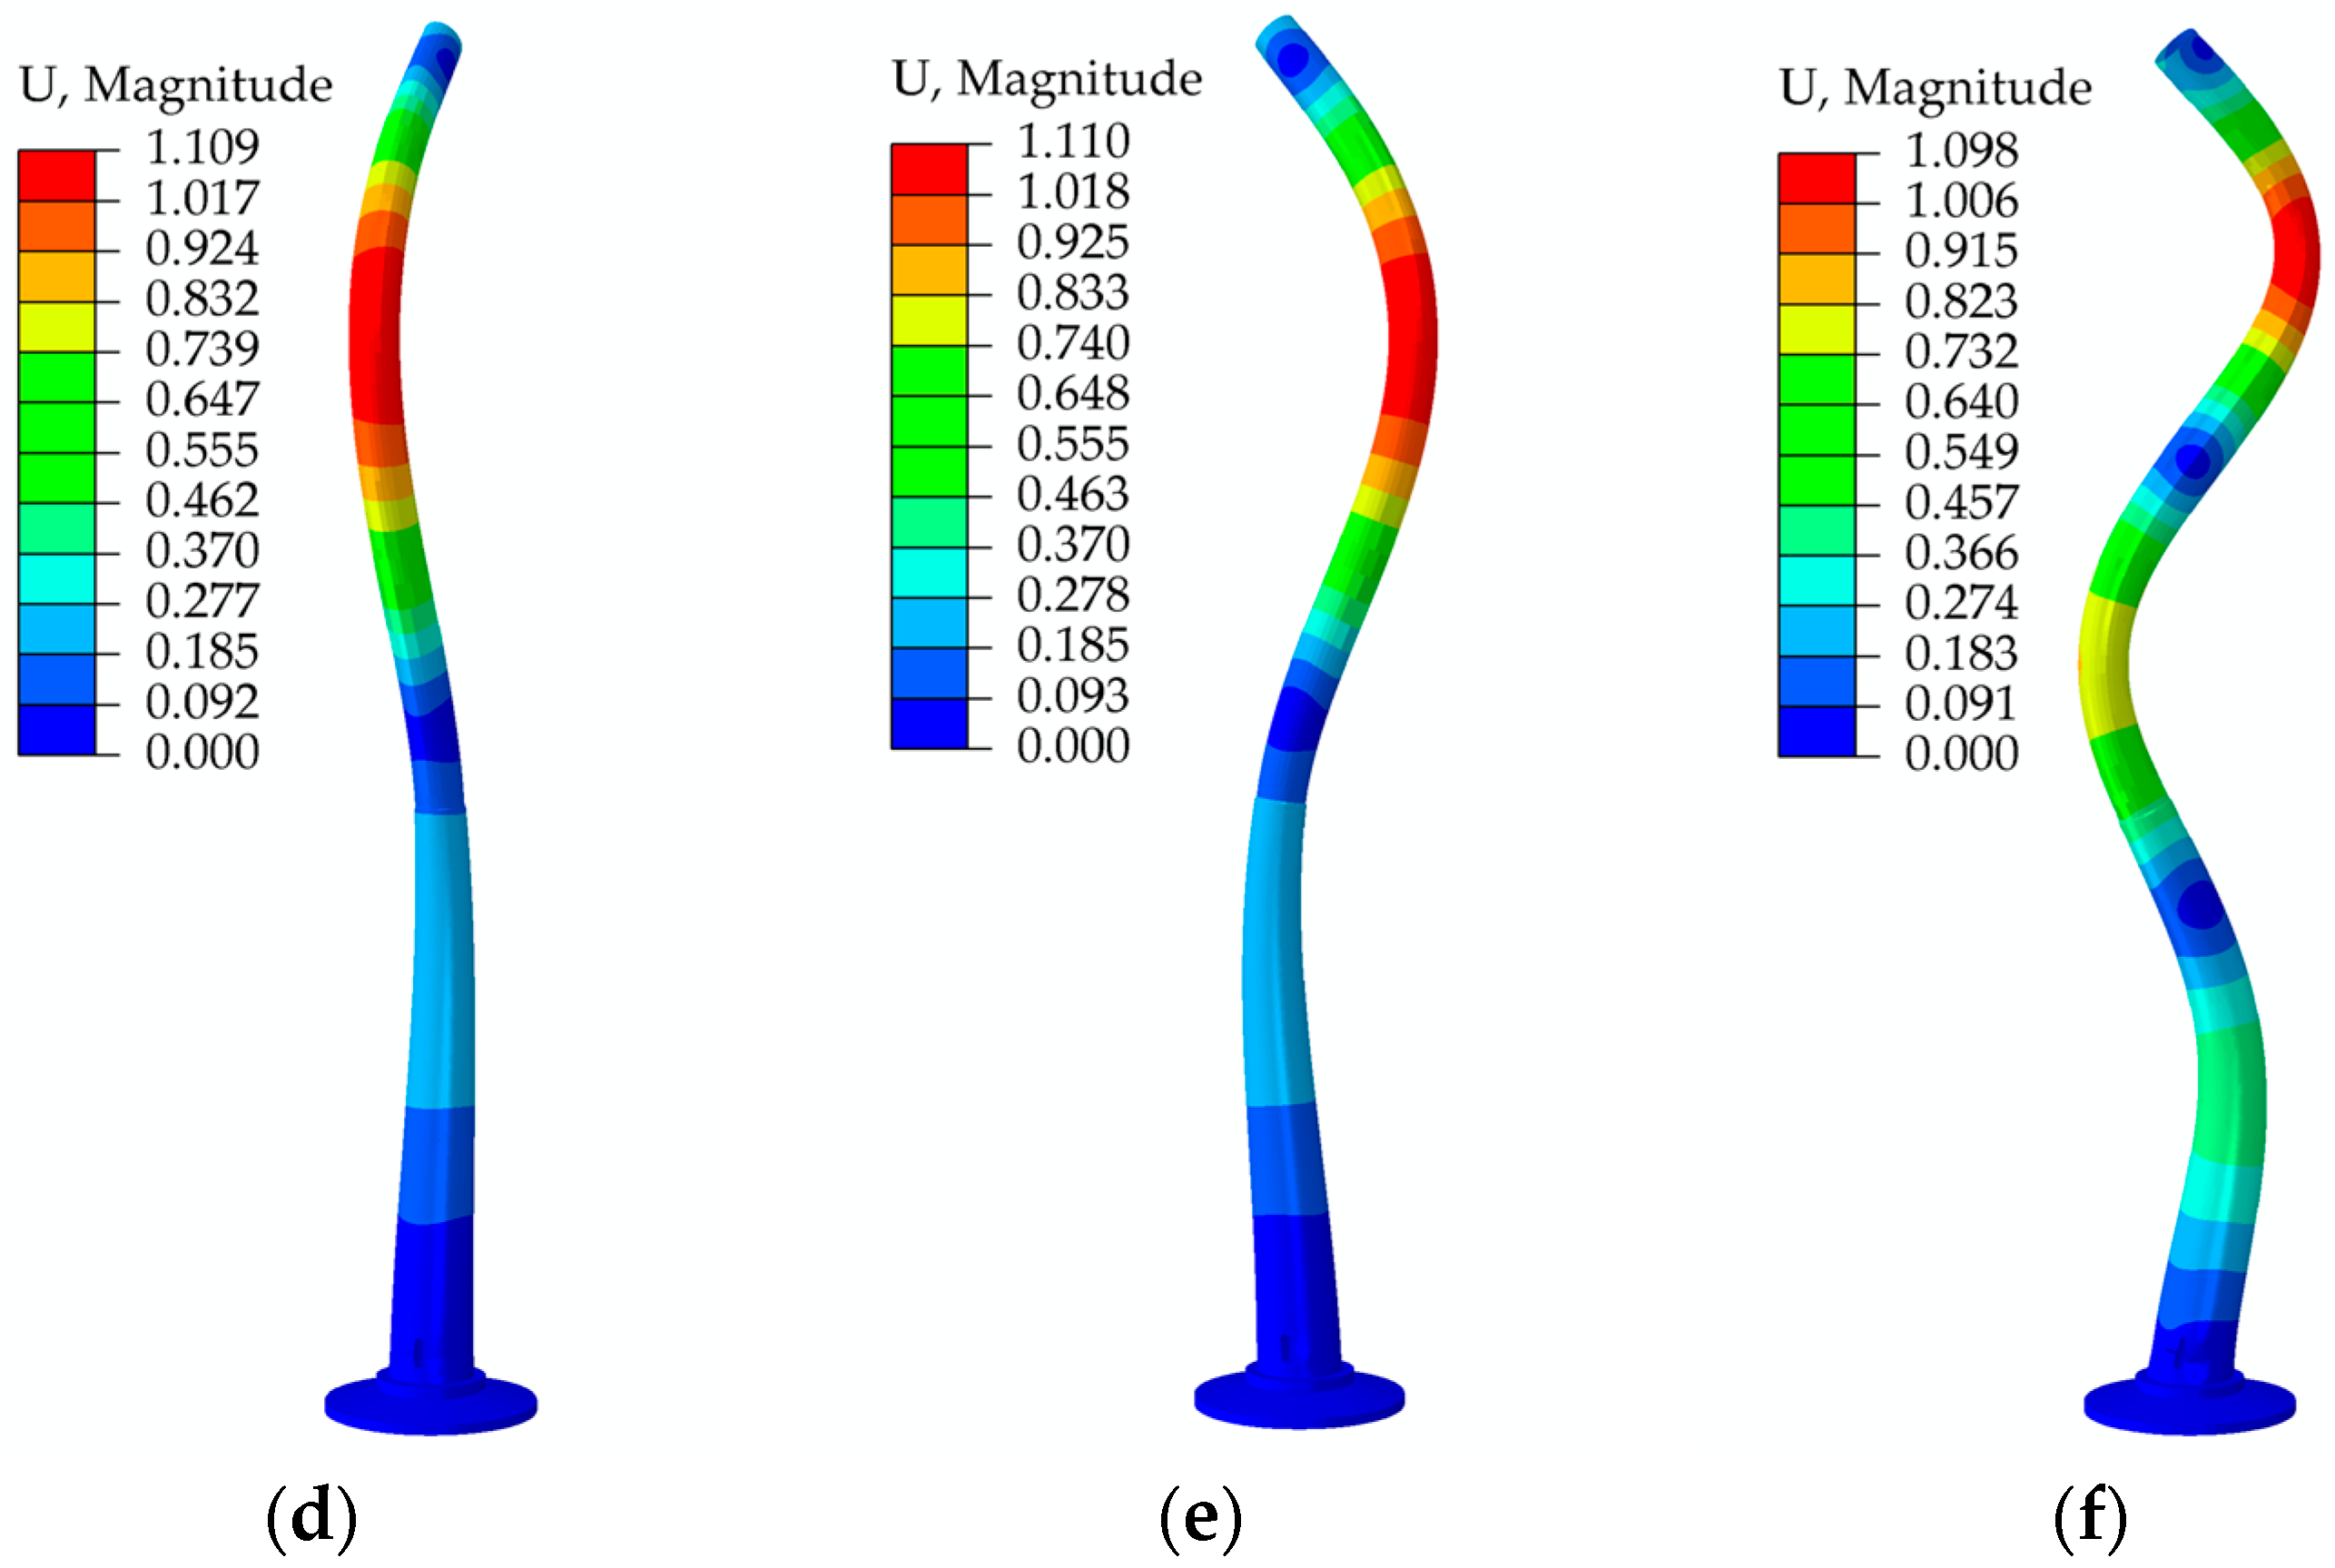
3. Influence of TMD on Dynamic Characteristics of the Tower

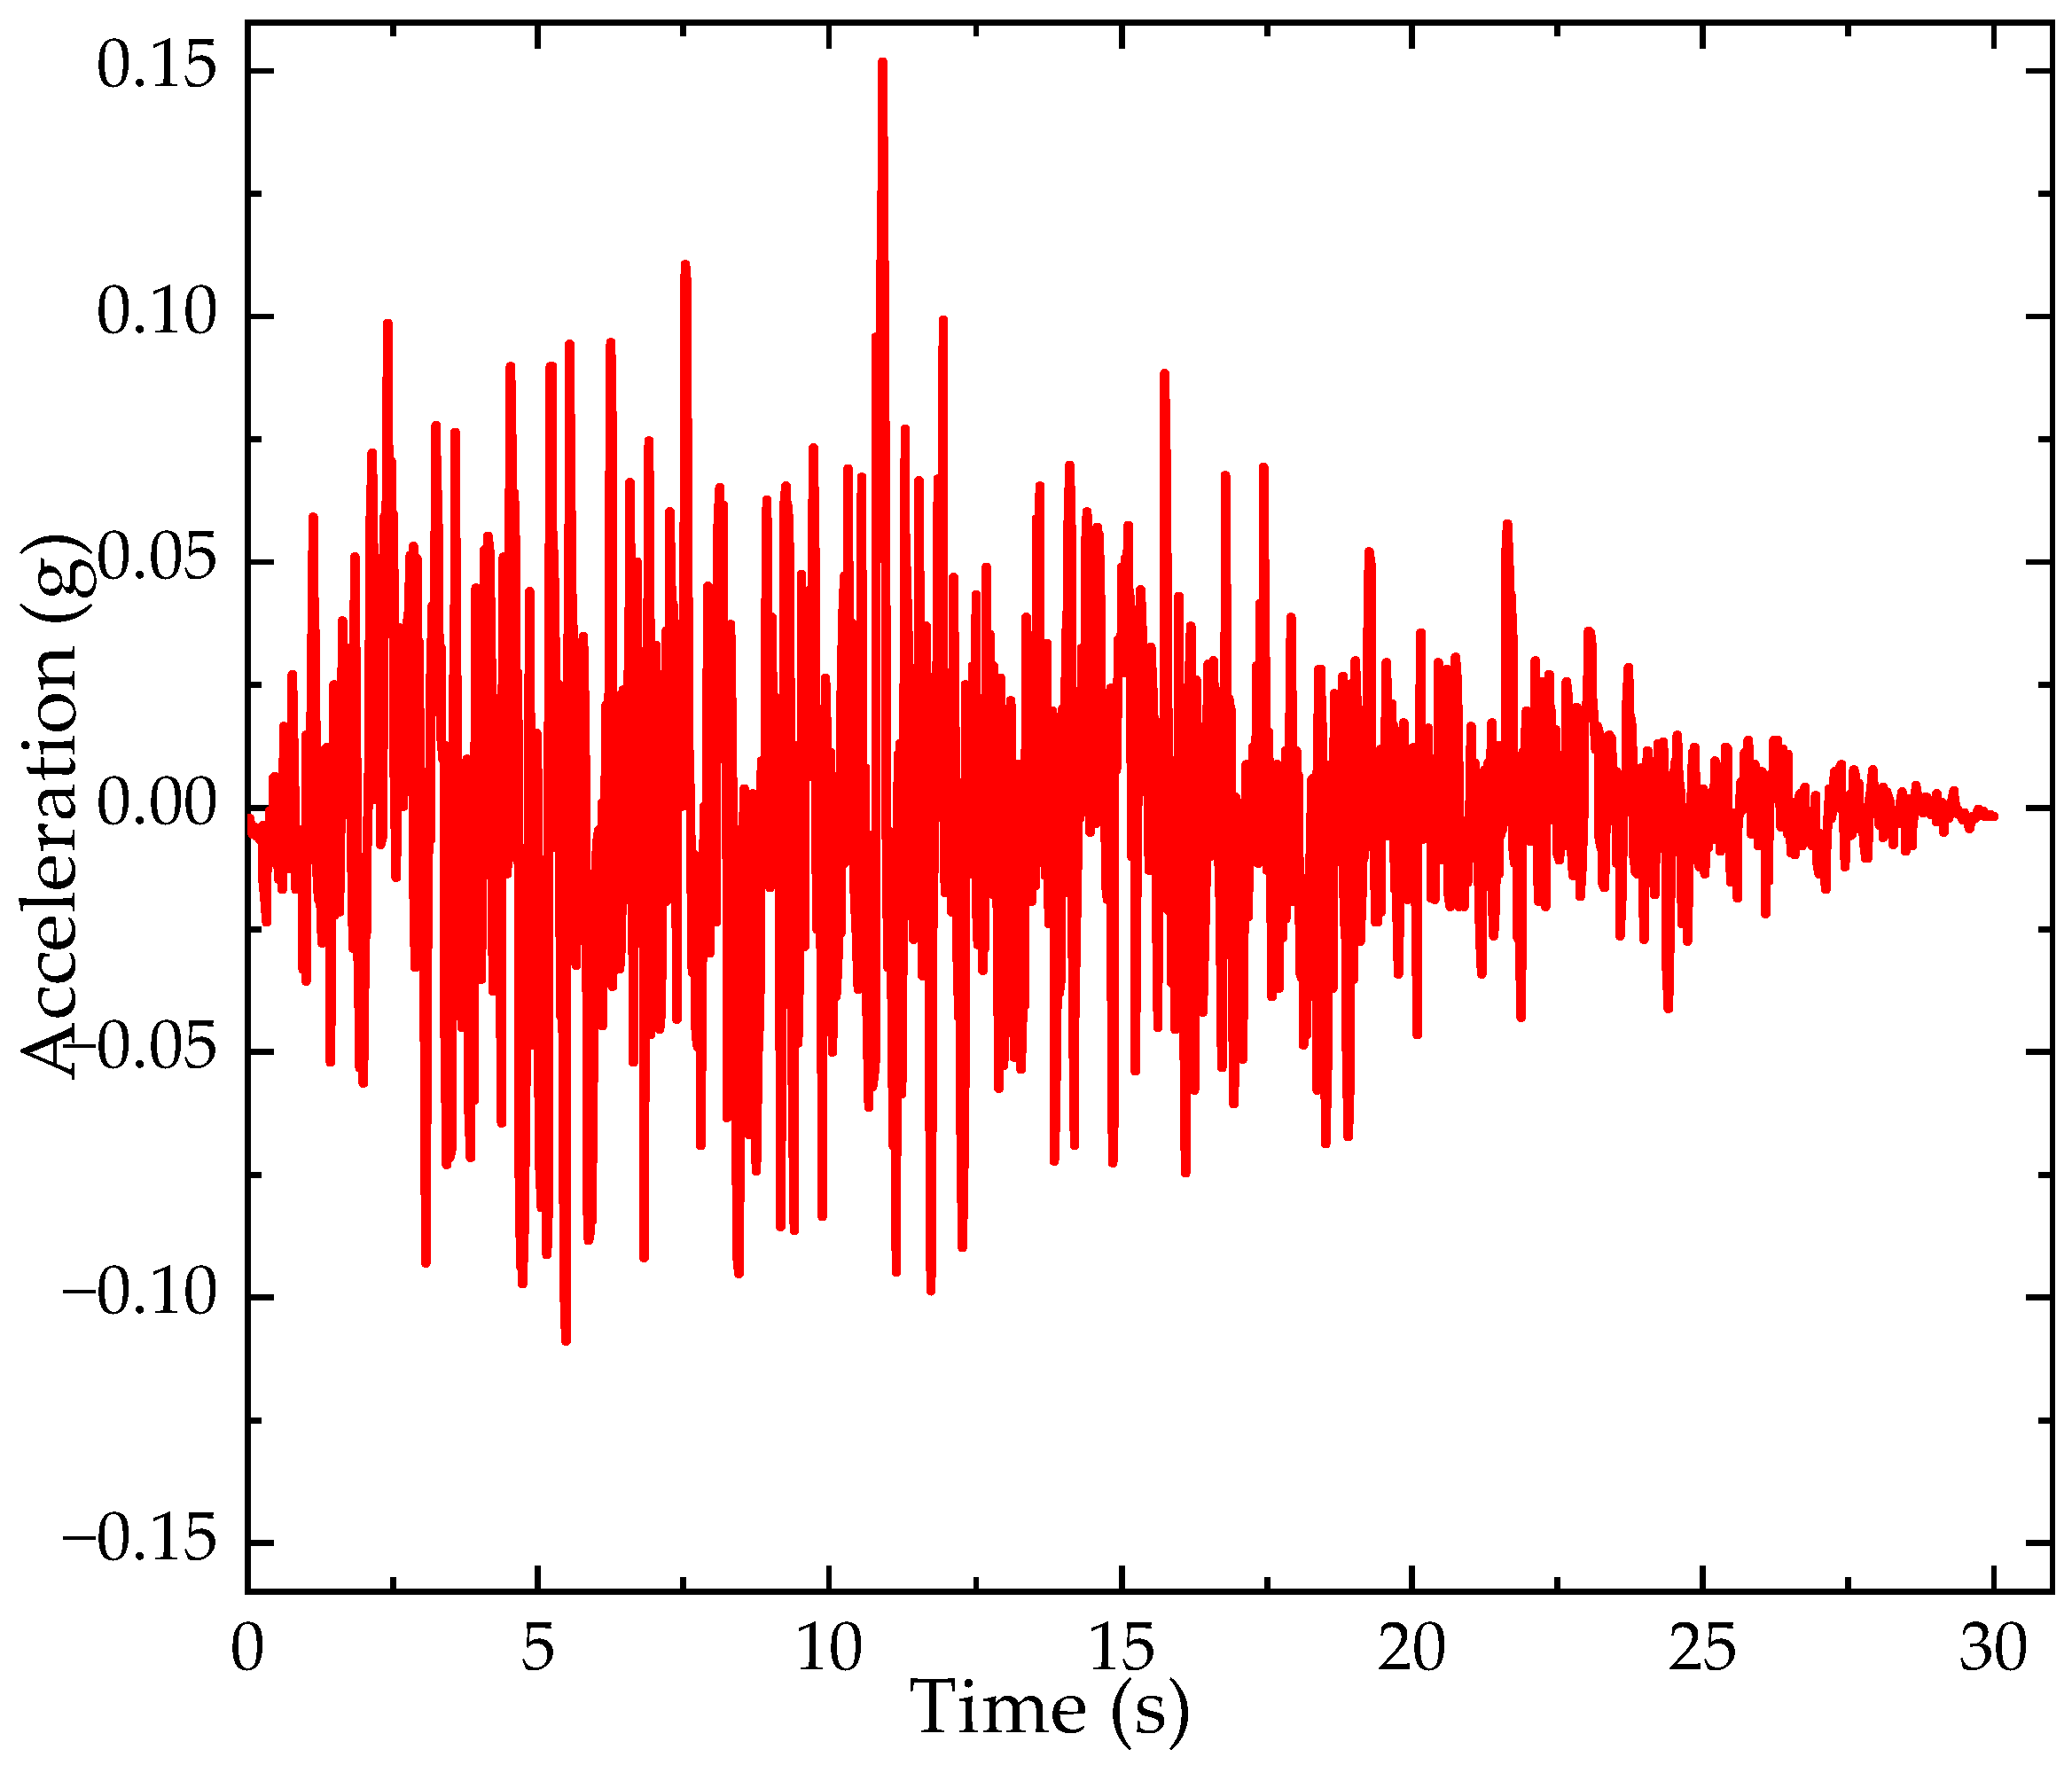
3.1. Analysis Method

The first six modes of the tower without a TMD are shown in Figure 7. As can be seen, the top of the tower and its middle section developed the largest lateral displacements. Hence, TMDs were assumed to be installed at the top of the tower (at a height of 117 m) and at a height of 75 m, to investigate their impact on the dynamic properties of the tower structure. The mass ratio of a TMD to the tower structure was assumed as 0.01, and the mass of the main structure was assumed as 1,068,023.13 kg, including the tower mass of 898,205.13 kg and the nacelle and rotor mass of 169,818 kg (see Table 2).
The dynamic characteristics of the tower were evaluated using time history analysis. Gravity, anchor cable prestress, and seismic load were the main actions. The seismic load was generated artificially, and the design peak value of the seismic base acceleration was 0.15 g. The input seismic wave was adjusted according to the following formula to make its peak acceleration value equal to the design value:
α ( t ) = α m a x α m a x α ( t ) ,
where α ( t ) represents the time history after adjustment, α ( t ) represents the time history before adjustment, and α max is the input seismic wave peak acceleration; α m a x is the design peak acceleration. Figure 8 shows the adjusted time history of seismic excitation.
A time history analysis of the models with and without TMDs was performed, comparing the displacements, velocities, and accelerations of the two to determine the rate of vibration reduction.

3.2. Results and Discussion

The dynamic responses at the TMD location are compared in Figure 9 and Figure 10, which show the velocities, accelerations, and displacements at the height of 75 m and at the top of the tower. The displacement, velocity, and acceleration were reduced at the top and at the height of 75 m when TMDs were installed, indicating that the TMDs effectively improved the dynamic performance of the tower.
The tower acceleration and velocity were greater at the 75 m height than at the top. The lower steel section of the tower was thicker and stiffer than the upper steel section. Furthermore, the stiffness and frequency at 75 m were greater than those of the entire tower, and the vibration period was shorter. A smaller period led to greater acceleration, greater stiffness, less energy absorbed, and greater velocity, according to the relationships between period and acceleration and between energy and velocity. As a result, the acceleration and velocity in the middle section of the tower were greater than those at the top.
Furthermore, the effect of the TMDs on the accelerations, velocities, and displacements of tower gradually decreased, which is consistent with the results reported in [41]. This demonstrates that controlling the accelerations of the tower and reducing the intensity of vibrations are the key considerations for improving the dynamic performance of the tower when using TMDs.
The vibration attenuation rate that reflects the damping effect of the TMD is defined as follows:
η = ( D N D T ) D N × 100 % ,
where D N is the peak dynamic response of the structure without a TMD, and D T is the structure peak dynamic response with a TMD.
The peak accelerations, velocities, and displacements from the time history analysis were used to calculate the structural vibration attenuation rates shown in Table 3. The results clearly demonstrate that the vibration reduction rate at 75 m was greater than that at the top of the tower after TMDs were installed at 75 m and the top of the tower. This is because the flexibility in the middle of the tower was low, and the vibration energy was high. The energy consumption of the TMD at 75 m was larger than that at the top.

4. Optimization of TMD Structural Parameters and Layouts
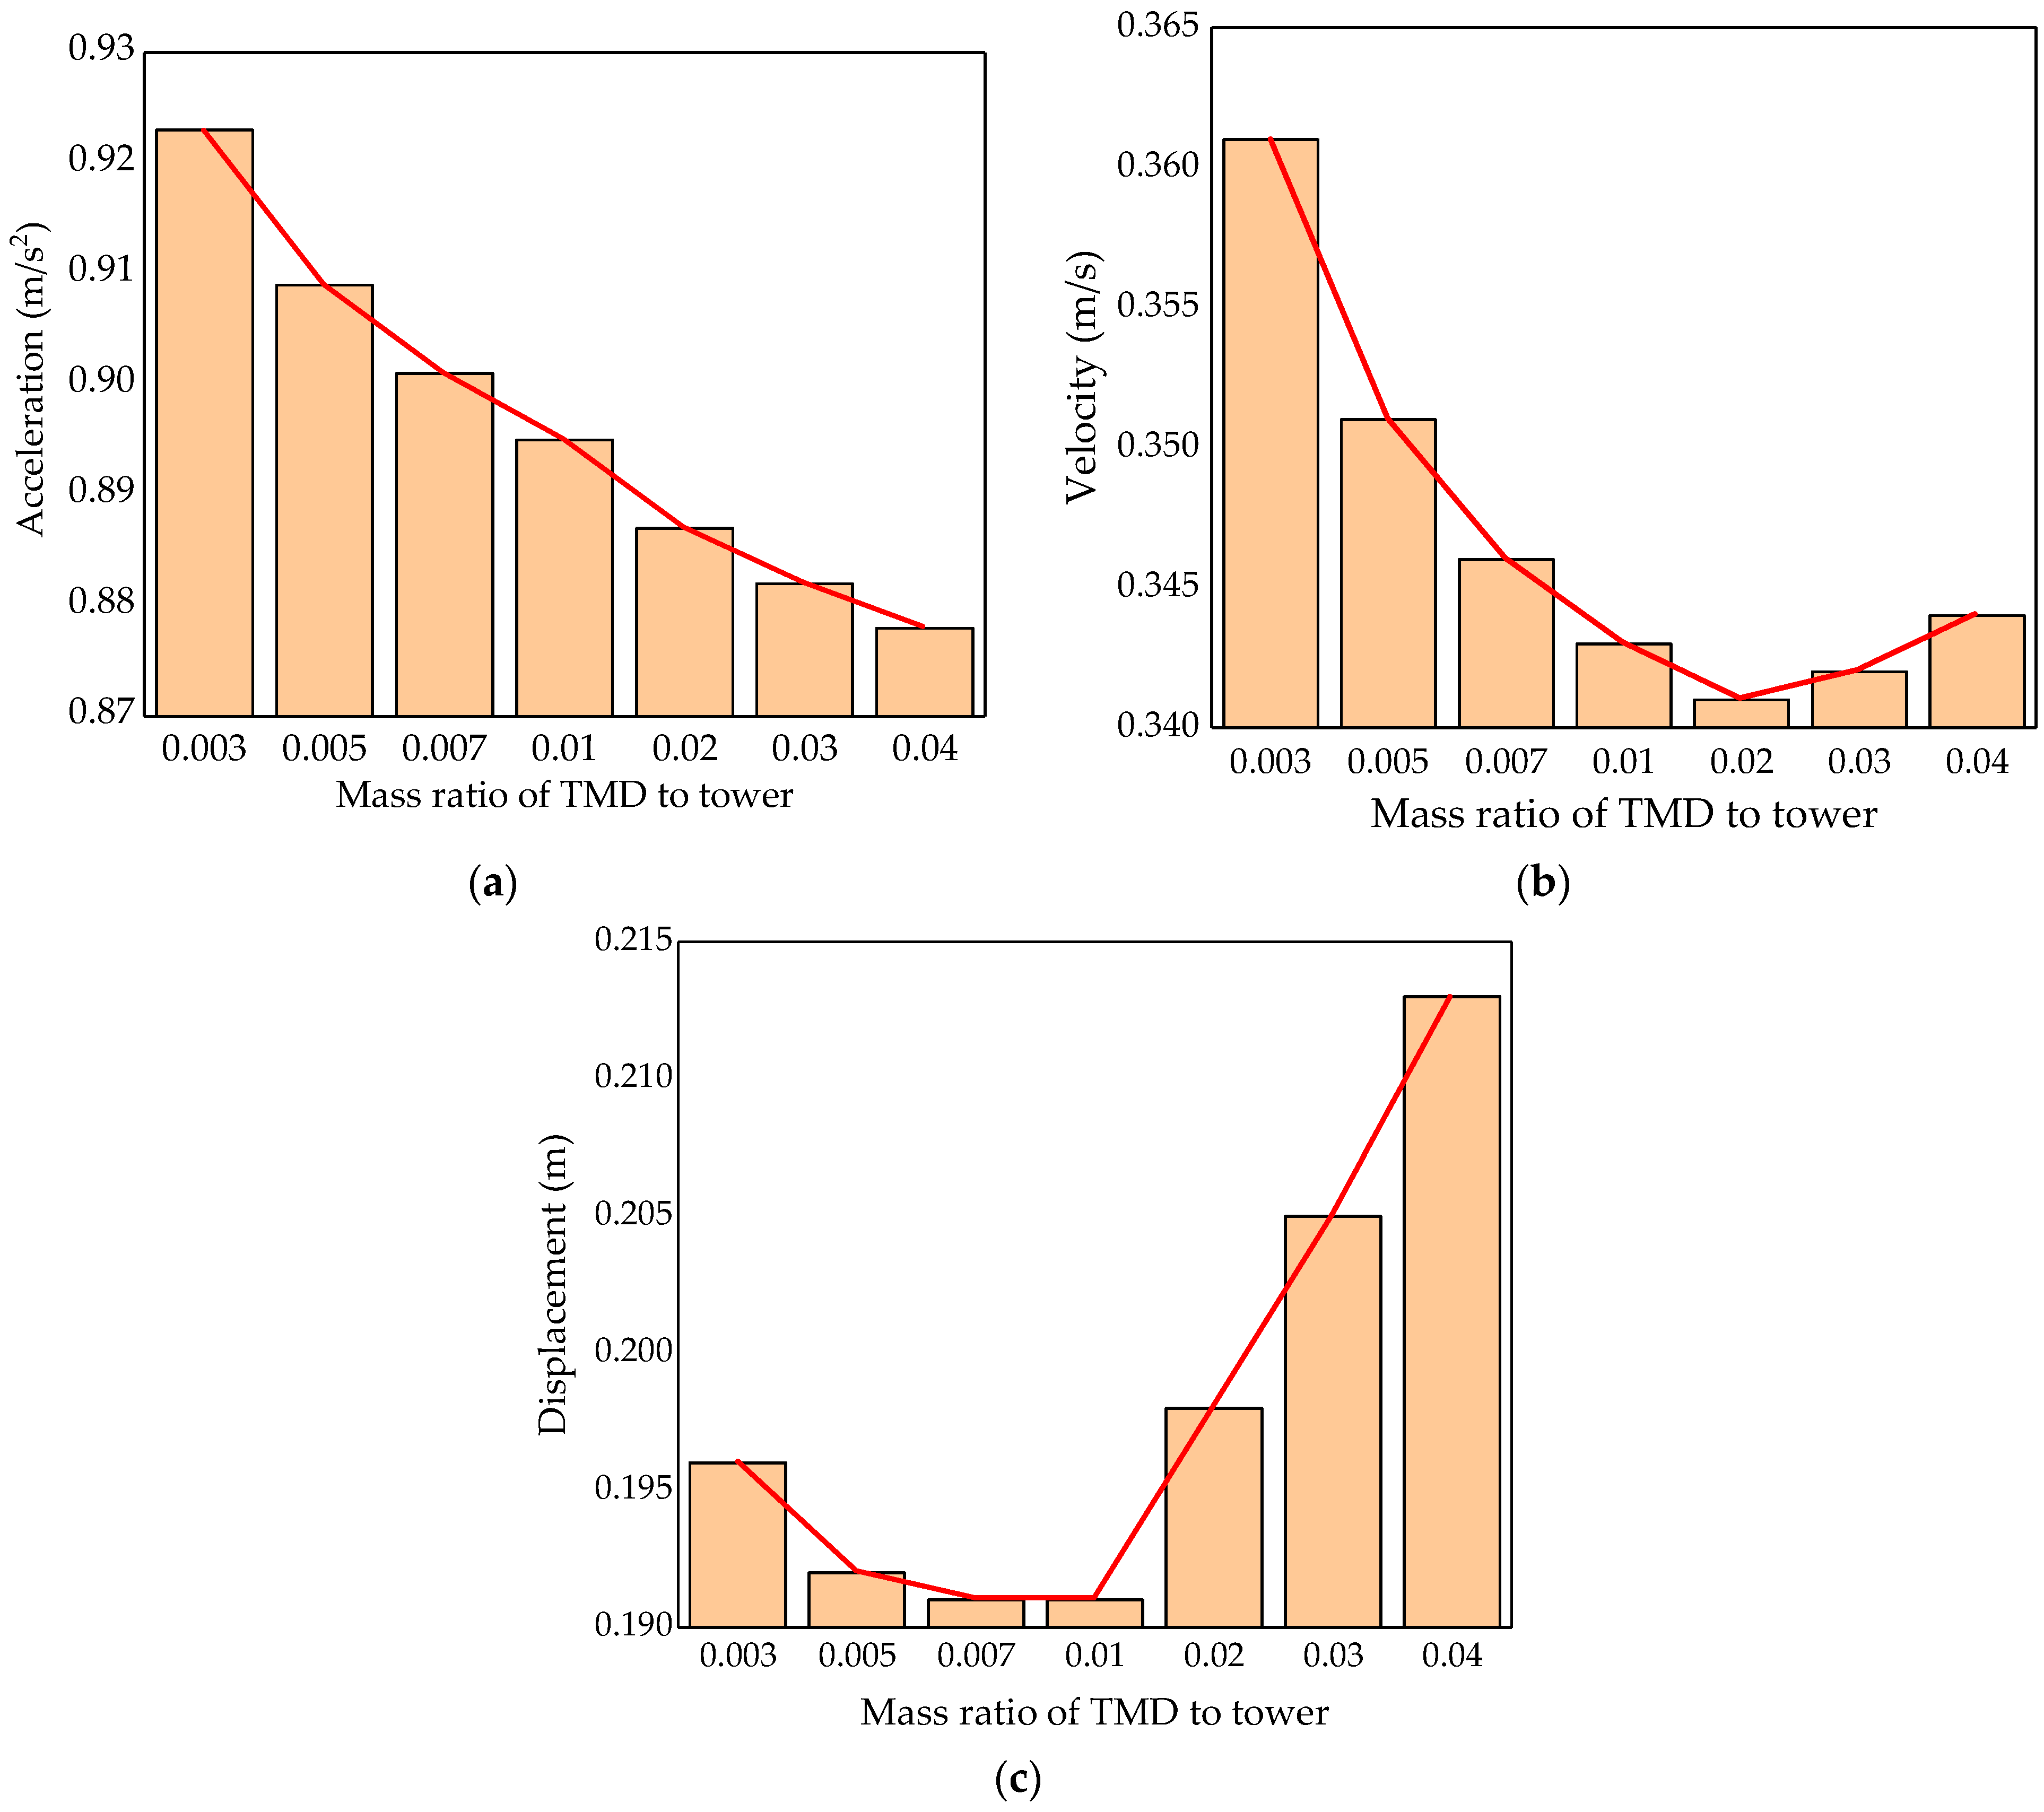
This section examines the influence of TMD parameters and layout on their vibration reduction effect using the spectral analysis method, optimizes the TMDs on the basis of the seismic performance of the tower, and further investigates whether the selection principle of the TMD optimal parameters is applicable to the steel-concrete tower.
Assuming that the tower was located at a class II site, the design earthquake was the second group, the damping ratio was 0.03, the peak value of the seismic influence coefficient was 0.34, and the characteristic period, Tg, was 0.40 s, the acceleration response spectrum used for the analysis was determined in accordance with the specifications and is shown in Figure 11.

4.1. Mass Ratio

Because the TMD mass determines its optimal stiffness and damping, its mass ratio is also the most critical parameter influencing its vibration reduction performance. To investigate the effect of TMD mass on the vibration reduction performance, seven different tower models with TMDs of varying masses were established. The adopted TMD-to-tower structure mass ratios were 0.003, 0.005, 0.007, 0.01, 0.02, 0.03, and 0.04, respectively. The stiffness and damping coefficient of the TMD were the optimal theoretical values corresponding to the mass ratios adopted in the models, and the TMD was assumed to be installed at the top of the tower. Figure 12 shows the vibration reduction rates derived from the spectral analysis.
The acceleration at the top of the tower gradually decreased as the TMD mass ratio increased, but the rate of change also gradually decreased, indicating that, when the TMD mass ratio reached a certain value, the acceleration level gradually stabilized. However, as the TMD mass ratio increased, the velocity and displacement at the tower top first decreased and then increased. The velocity started to rise slowly when the TMD mass ratio reached about 0.02, while the displacement started to rise quickly when the TMD mass ratio reached about 0.01, eventually approaching the largest displacement without a TMD. This demonstrates that, when the TMD mass ratio was within a certain range, increasing the mass could effectively enhance the vibration reduction effect of the TMD; however, when it exceeded a certain value, increasing the TMD mass ratio diminished the inhibitory effect of the TMD on the dynamic responses of the structure, particularly displacements.
The above results were due to the vibration reduction effect of the TMD on the structure on the one hand, and because TMD belonged to the tower structure on the other hand. With the increase in the TMD mass ratio, the acceleration of the structure under constant external load decreased. However, with the increase in the top mass of the tower, the inertia force also increased. When the mass of the TMD reached a certain value, the influence of inertia on the vibration level became greater than the suppression vibrations by the TMD damping and energy consumption. This restricted the TMD effectiveness in reducing the velocities and displacements of the structure only to a certain mass ratio range.

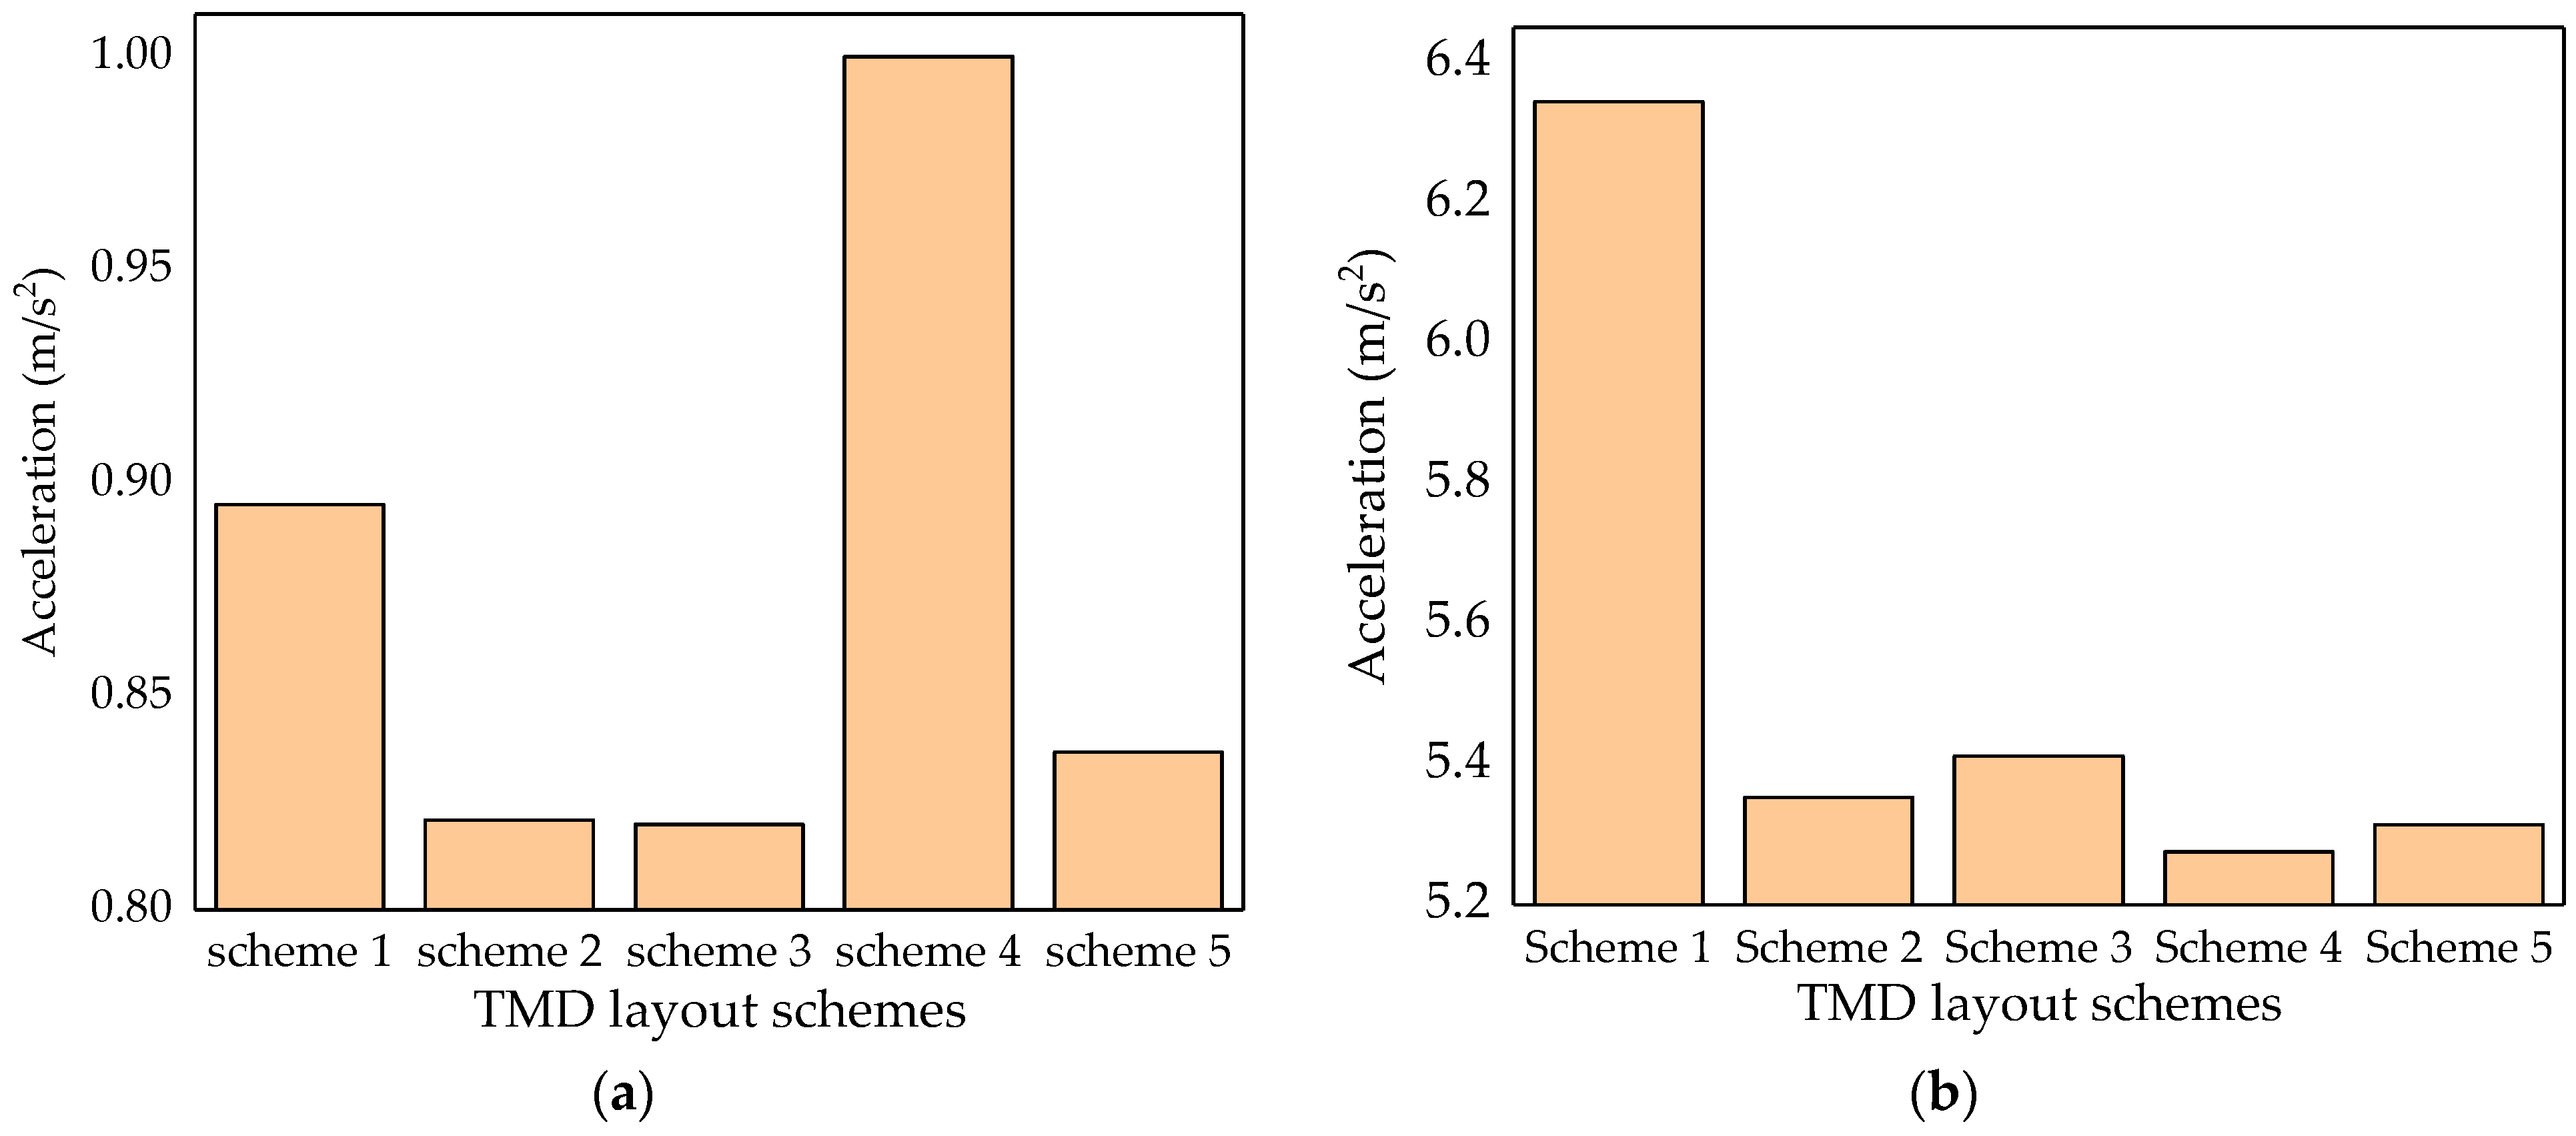
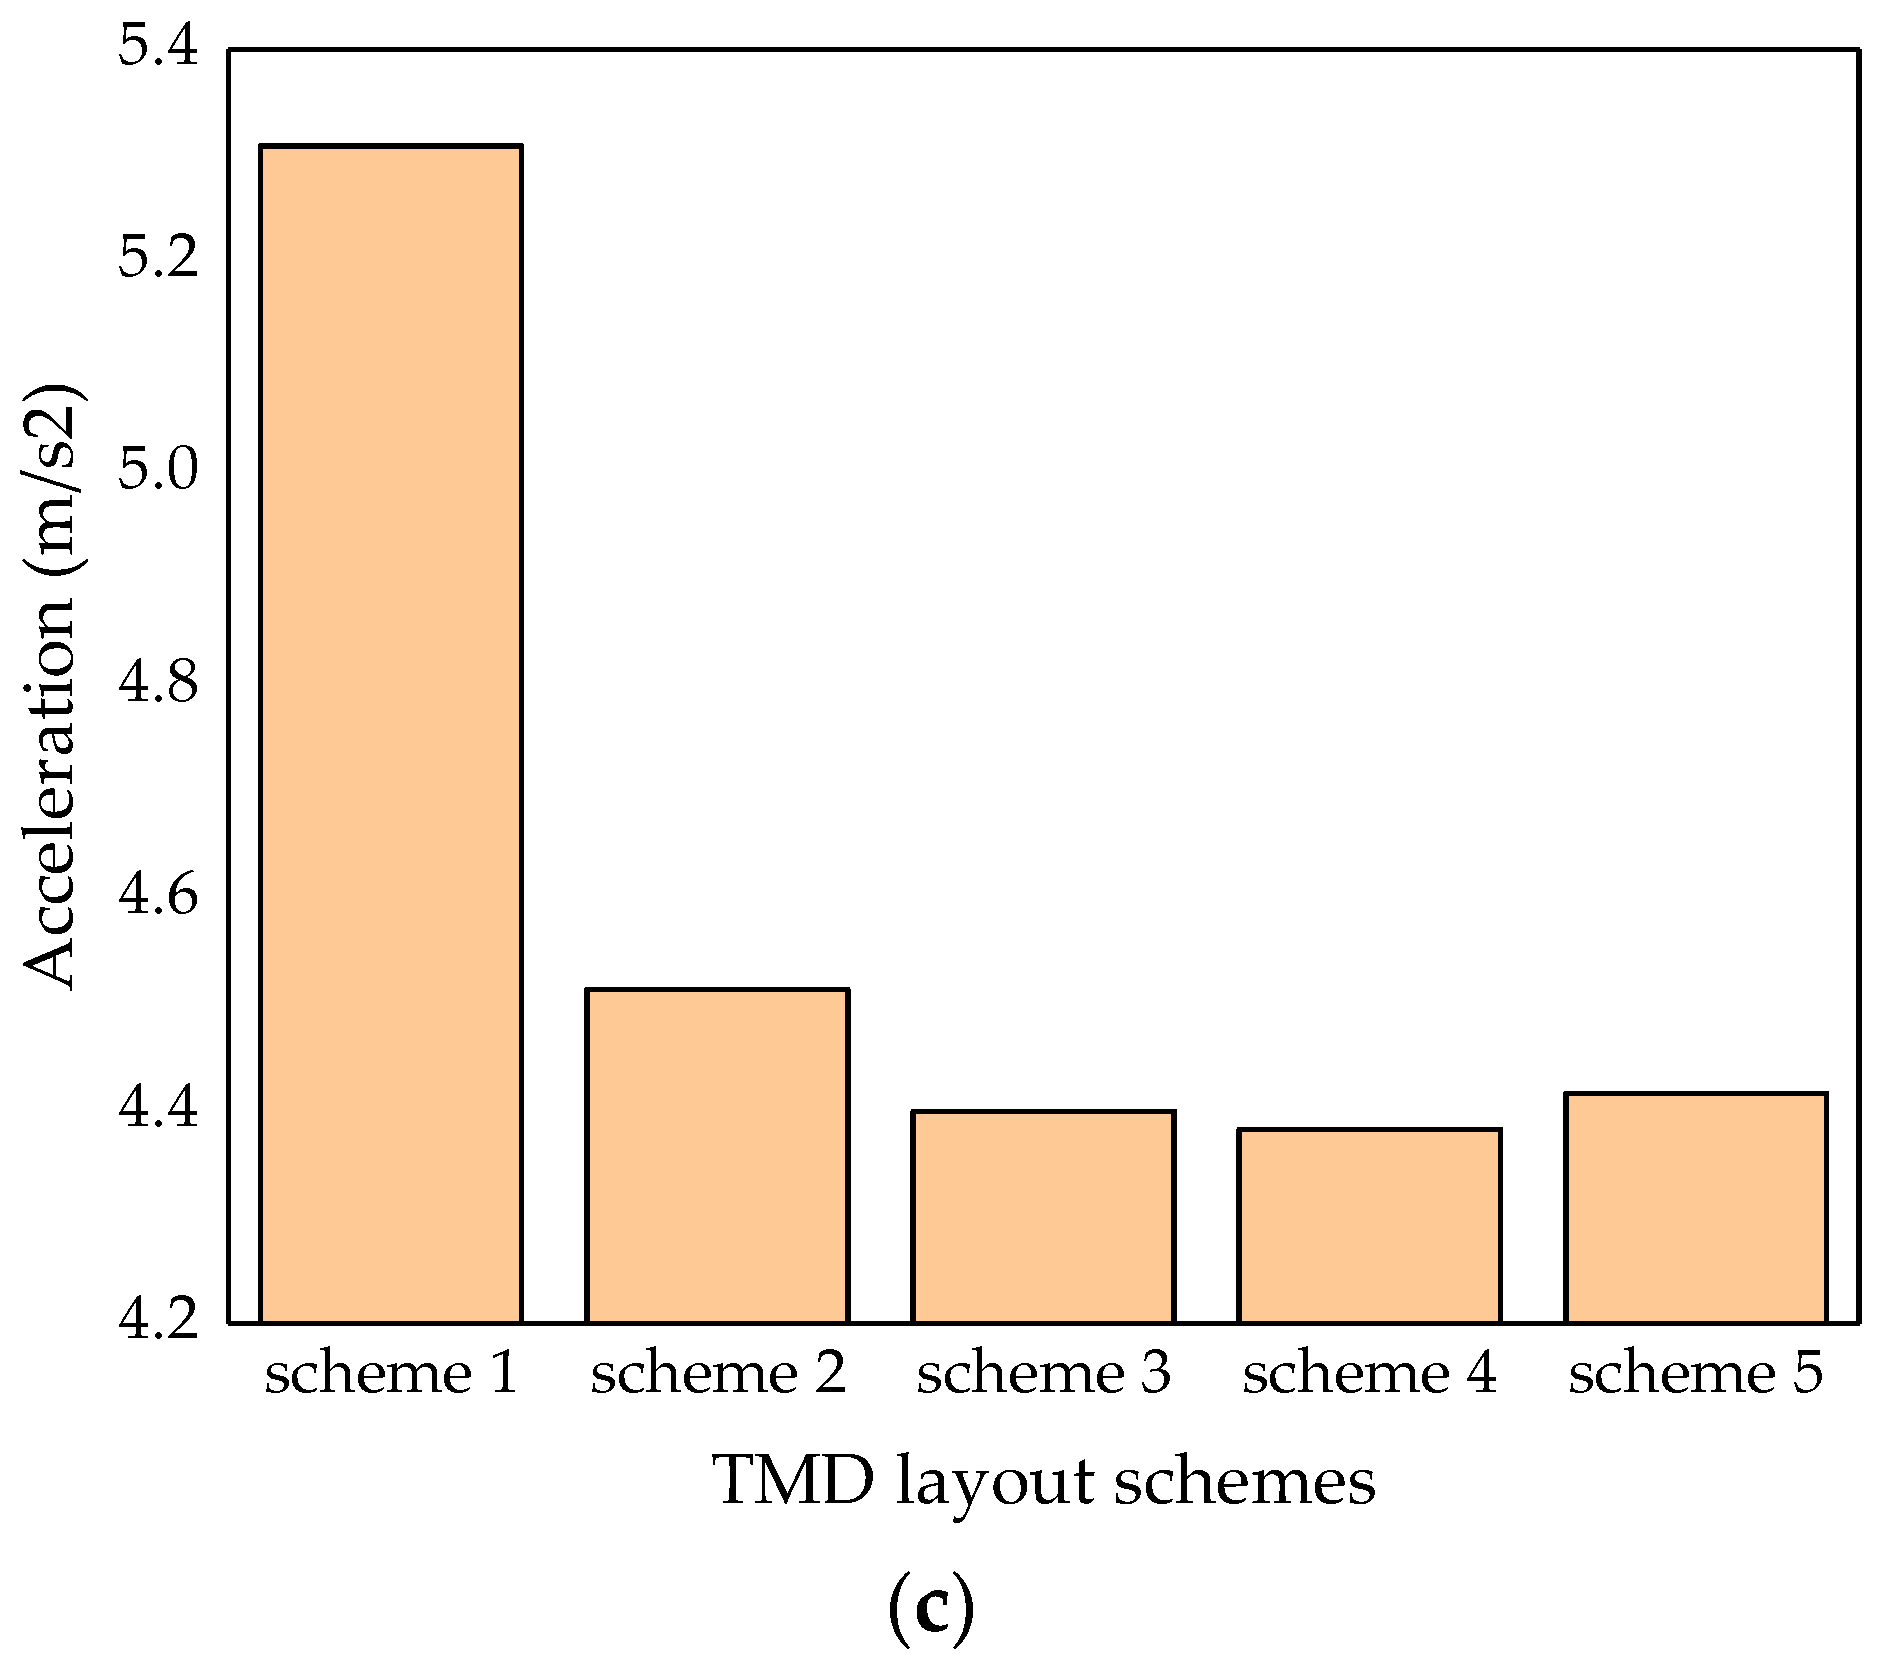
4.2. TMD Layout Schemes

Single or multiple TMDs were installed at the locations of large modal displacements of the first six vibration modes shown in Section 3.2 to further investigate the influence of the TMD location on the tower vibration reduction. Three installation heights were considered: 75 m, 91 m and 117 m, respectively. Table 4 shows the five configurations that were examined. The total TMD mass ratio was 0.01, and the stiffness and damping coefficients were the optimal theoretical values. The impact of various TMD layouts on the dynamic performance of the tower was determined using spectral analysis. Figure 13 shows the accelerations of the various TMD installation positions for different TMD layouts.
At the height of 117 m, the acceleration reduction effects of Layouts 2, 3, and 5 were slightly better than that of Layout 1, while Layout 4 had the weakest acceleration reduction effect. This is because Layouts 1, 2, and 3 all had a TMD at 117 m, whereas, for Layout 1, only one TMD was installed; hence, the vibration reduction effect was slightly worse than the case of another TMD installed at 75 m or 91 m. When TMDs were located at all three locations and the total mass ratio of the TMDs remained constant, the mass of the TMD at the top of the tower decreased and acceleration increased, but the dynamic performance could not be improved further. As a result, the TMDs at the top and in the middle (or upper) part of the tower had the strongest effect on the dynamic response of the tower top.
At the height of 91 m, the control effects of Layouts 2, 3, 4, and 5 on accelerations were clear, whereas the control effect of Layout 1 was extremely poor. Because Layout 1 had only one TMD at 117 m but not at 91m, the dynamic responses could not be effectively suppressed. A TMD was installed at 91 m in Layouts 2, 4, and 5, while two TMDs were located at 75 m and 117 m in Layout 3, i.e., the 91 m location was between the two TMDs and, thus, within their control range. Accordingly, a TMD could be positioned in the middle and upper part, in the middle (or at the top), or in the middle and at the top to effectively control the dynamic responses of the tower middle and upper part.
Layouts 3, 4, and 5 had a good vibration reduction effect at 75 m, while Layouts 1 and 2 had a poor vibration reduction effect, and Layout 1 had the weakest control effect. This is because Layouts 3, 4, and 5 had a TMD at 75 m, which could effectively control the vibrations there, whereas Layouts 1 and 2 had no TMD at 75 m, and Layout 1 had only one TMD at 117 m, which was the furthest away from 75 m, resulting in the worst effect. Therefore, installing a TMD in the middle, as well as in the middle and upper part or at the top, could significantly reduce the dynamic response in the tower middle.
In summary, for the whole steel-concrete tower, setting TMDs in the middle and at the top of the tower (Layout 3) represented the arrangement with a vibration reduction effect.

5. Conclusions

The vibration reduction effect of a TMD on the wind turbine tower was studied using the time history analysis method. Then, the influence of different TMD parameters and layouts on the tower vibrations was studied using the spectrum analysis method to provide suggestions for the optimization of TMDs to control steel-concrete wind turbine towers.
The following conclusions can be drawn from the analyses presented in this study:
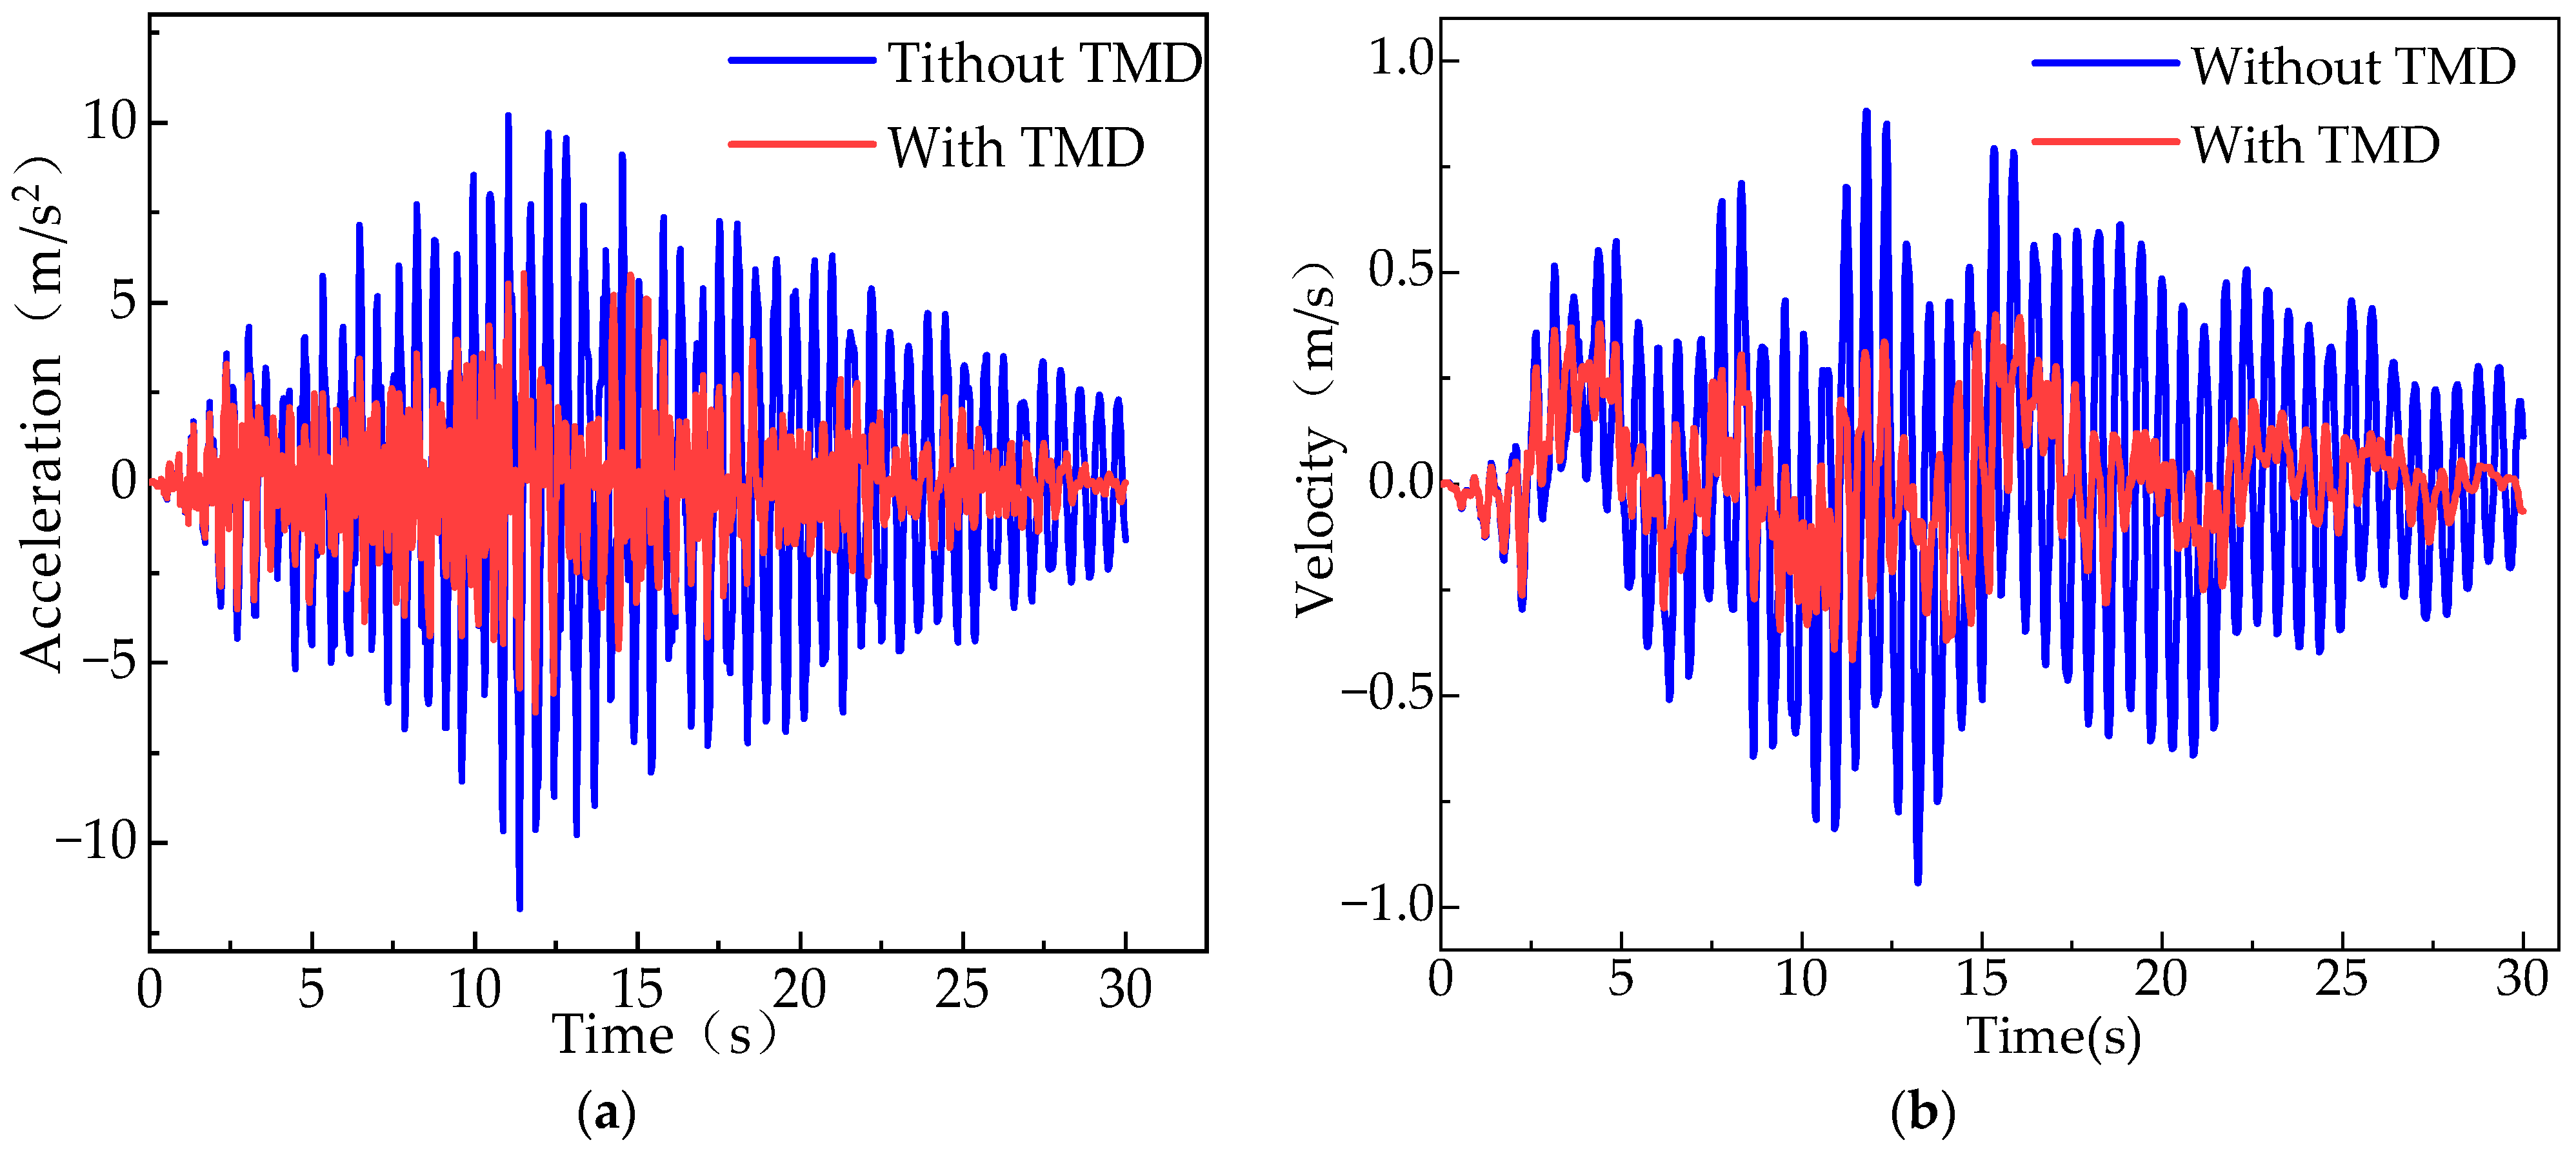
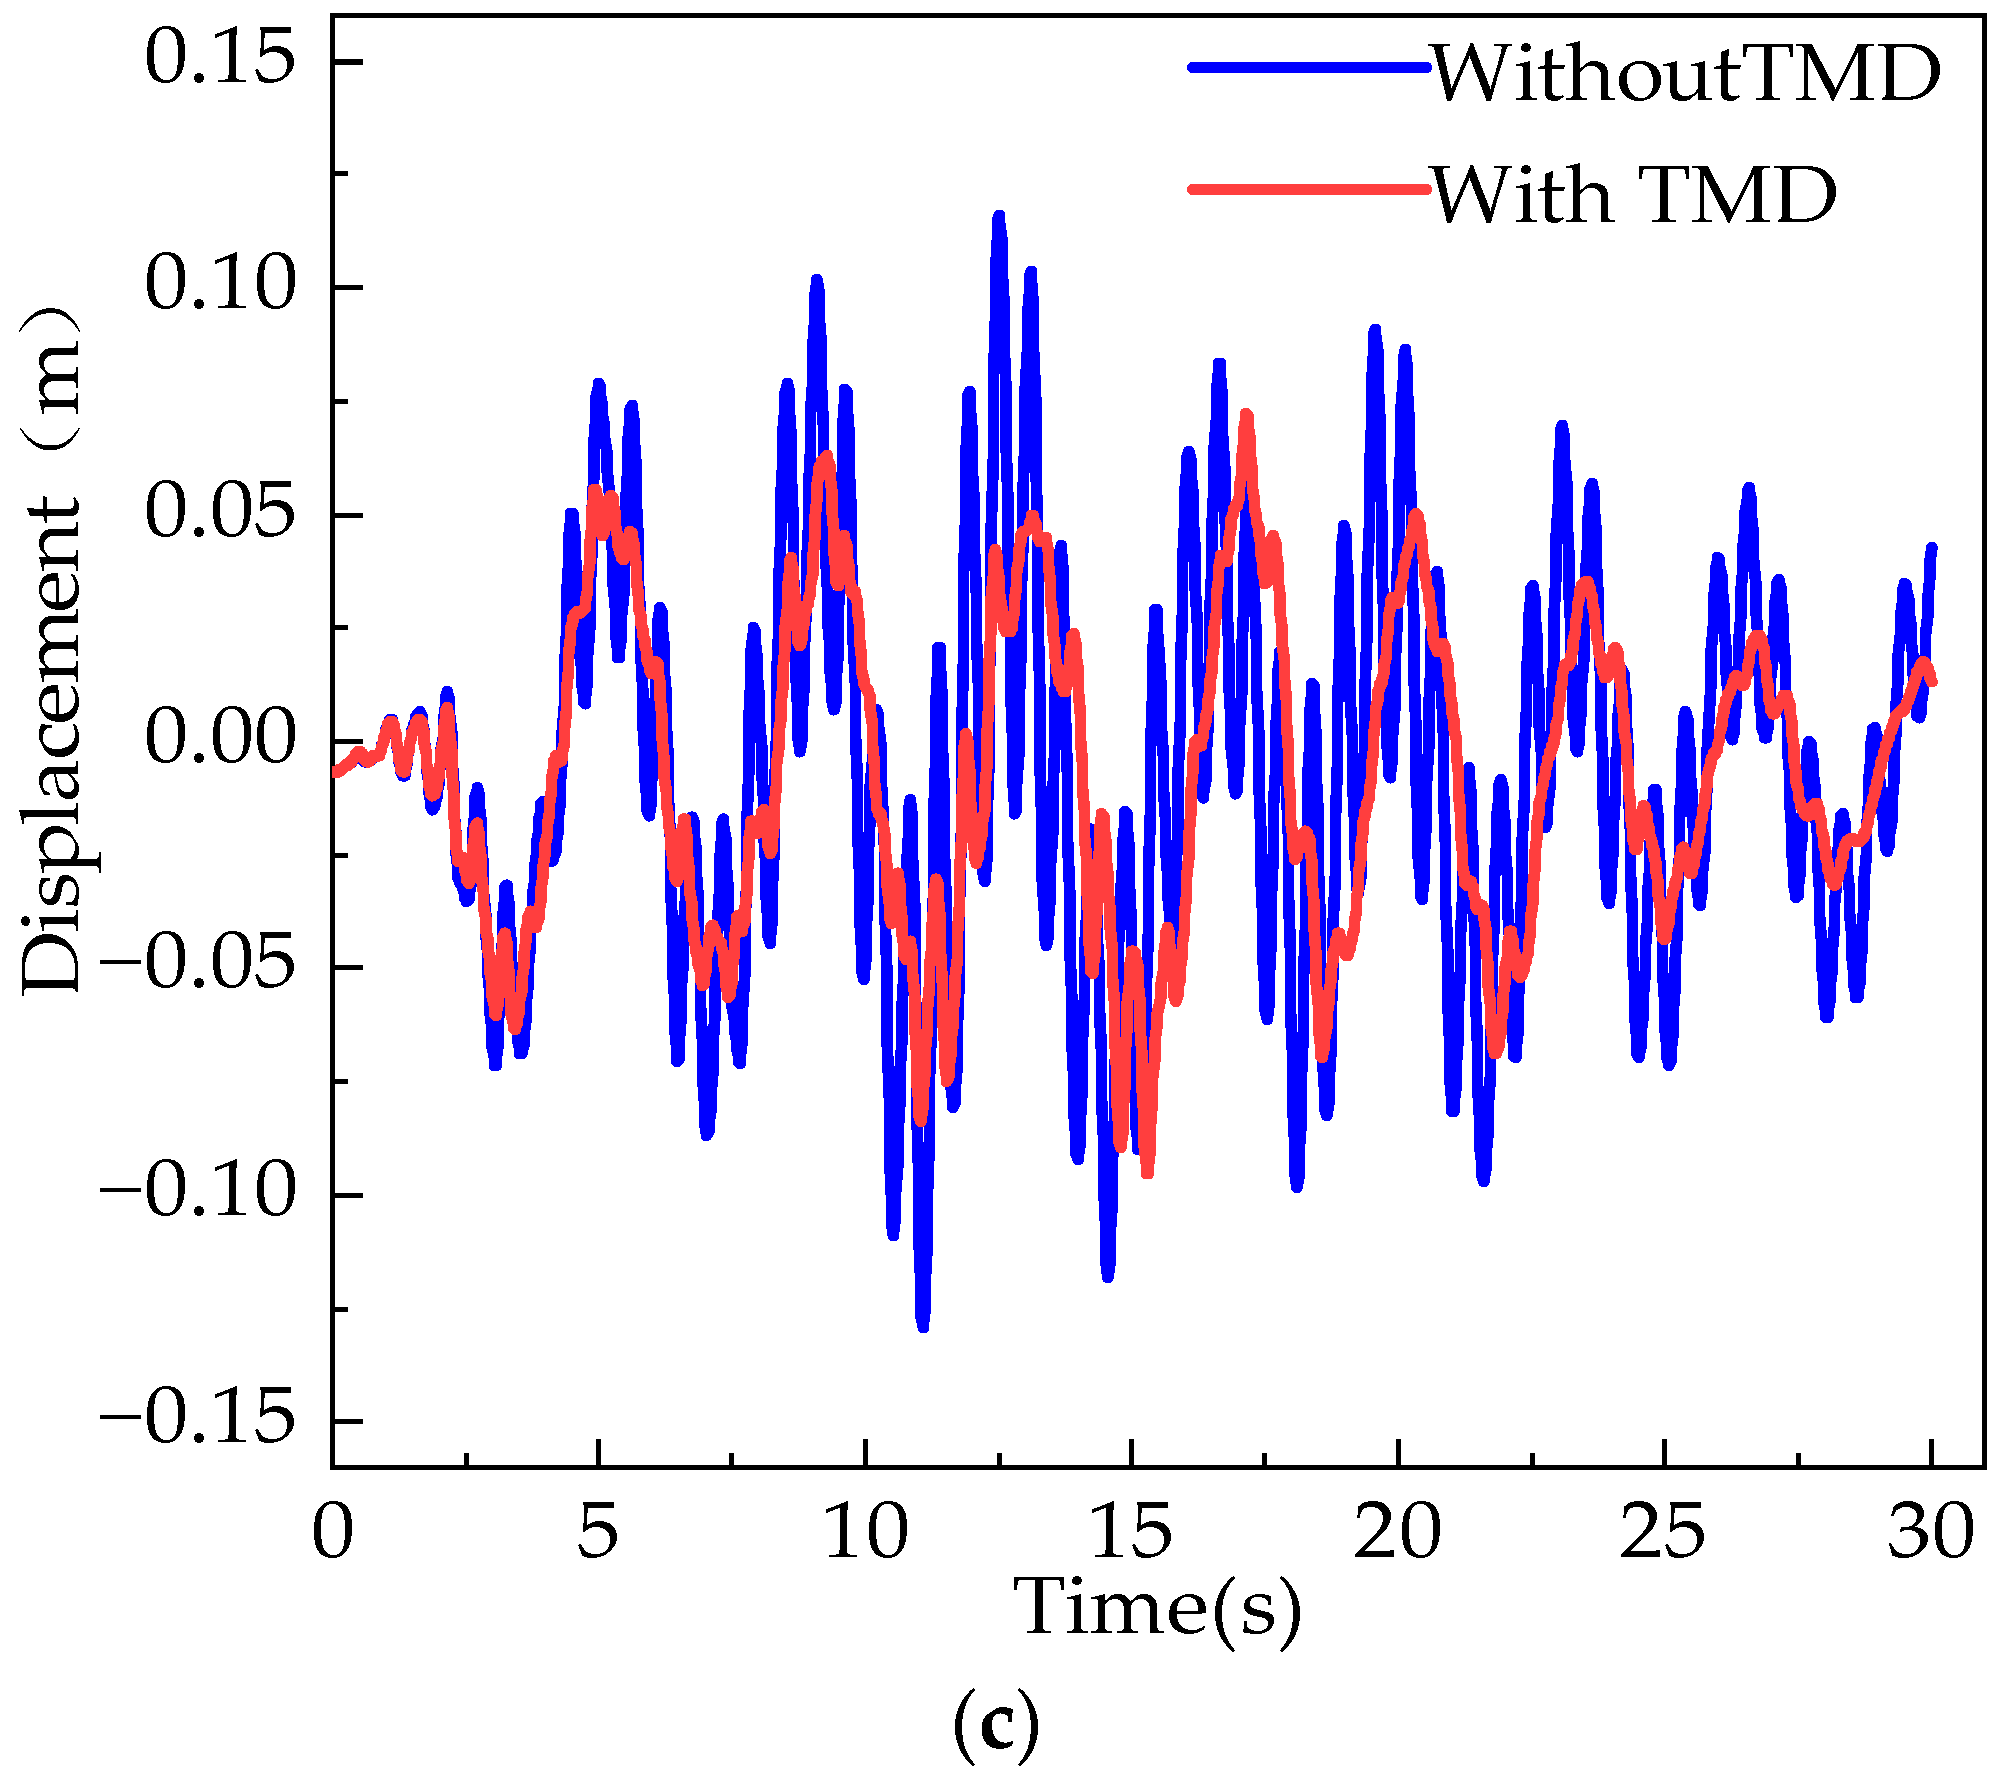
  • Comparing the results with and without a TMD, after a TMD was installed, the dynamic responses of the steel-concrete tower were significantly reduced Moreover, the acceleration reduction effect of the TMD was the most obvious, indicating that controlling the accelerations of the tower was critical for the TMD to improve the dynamic performance of the tower.
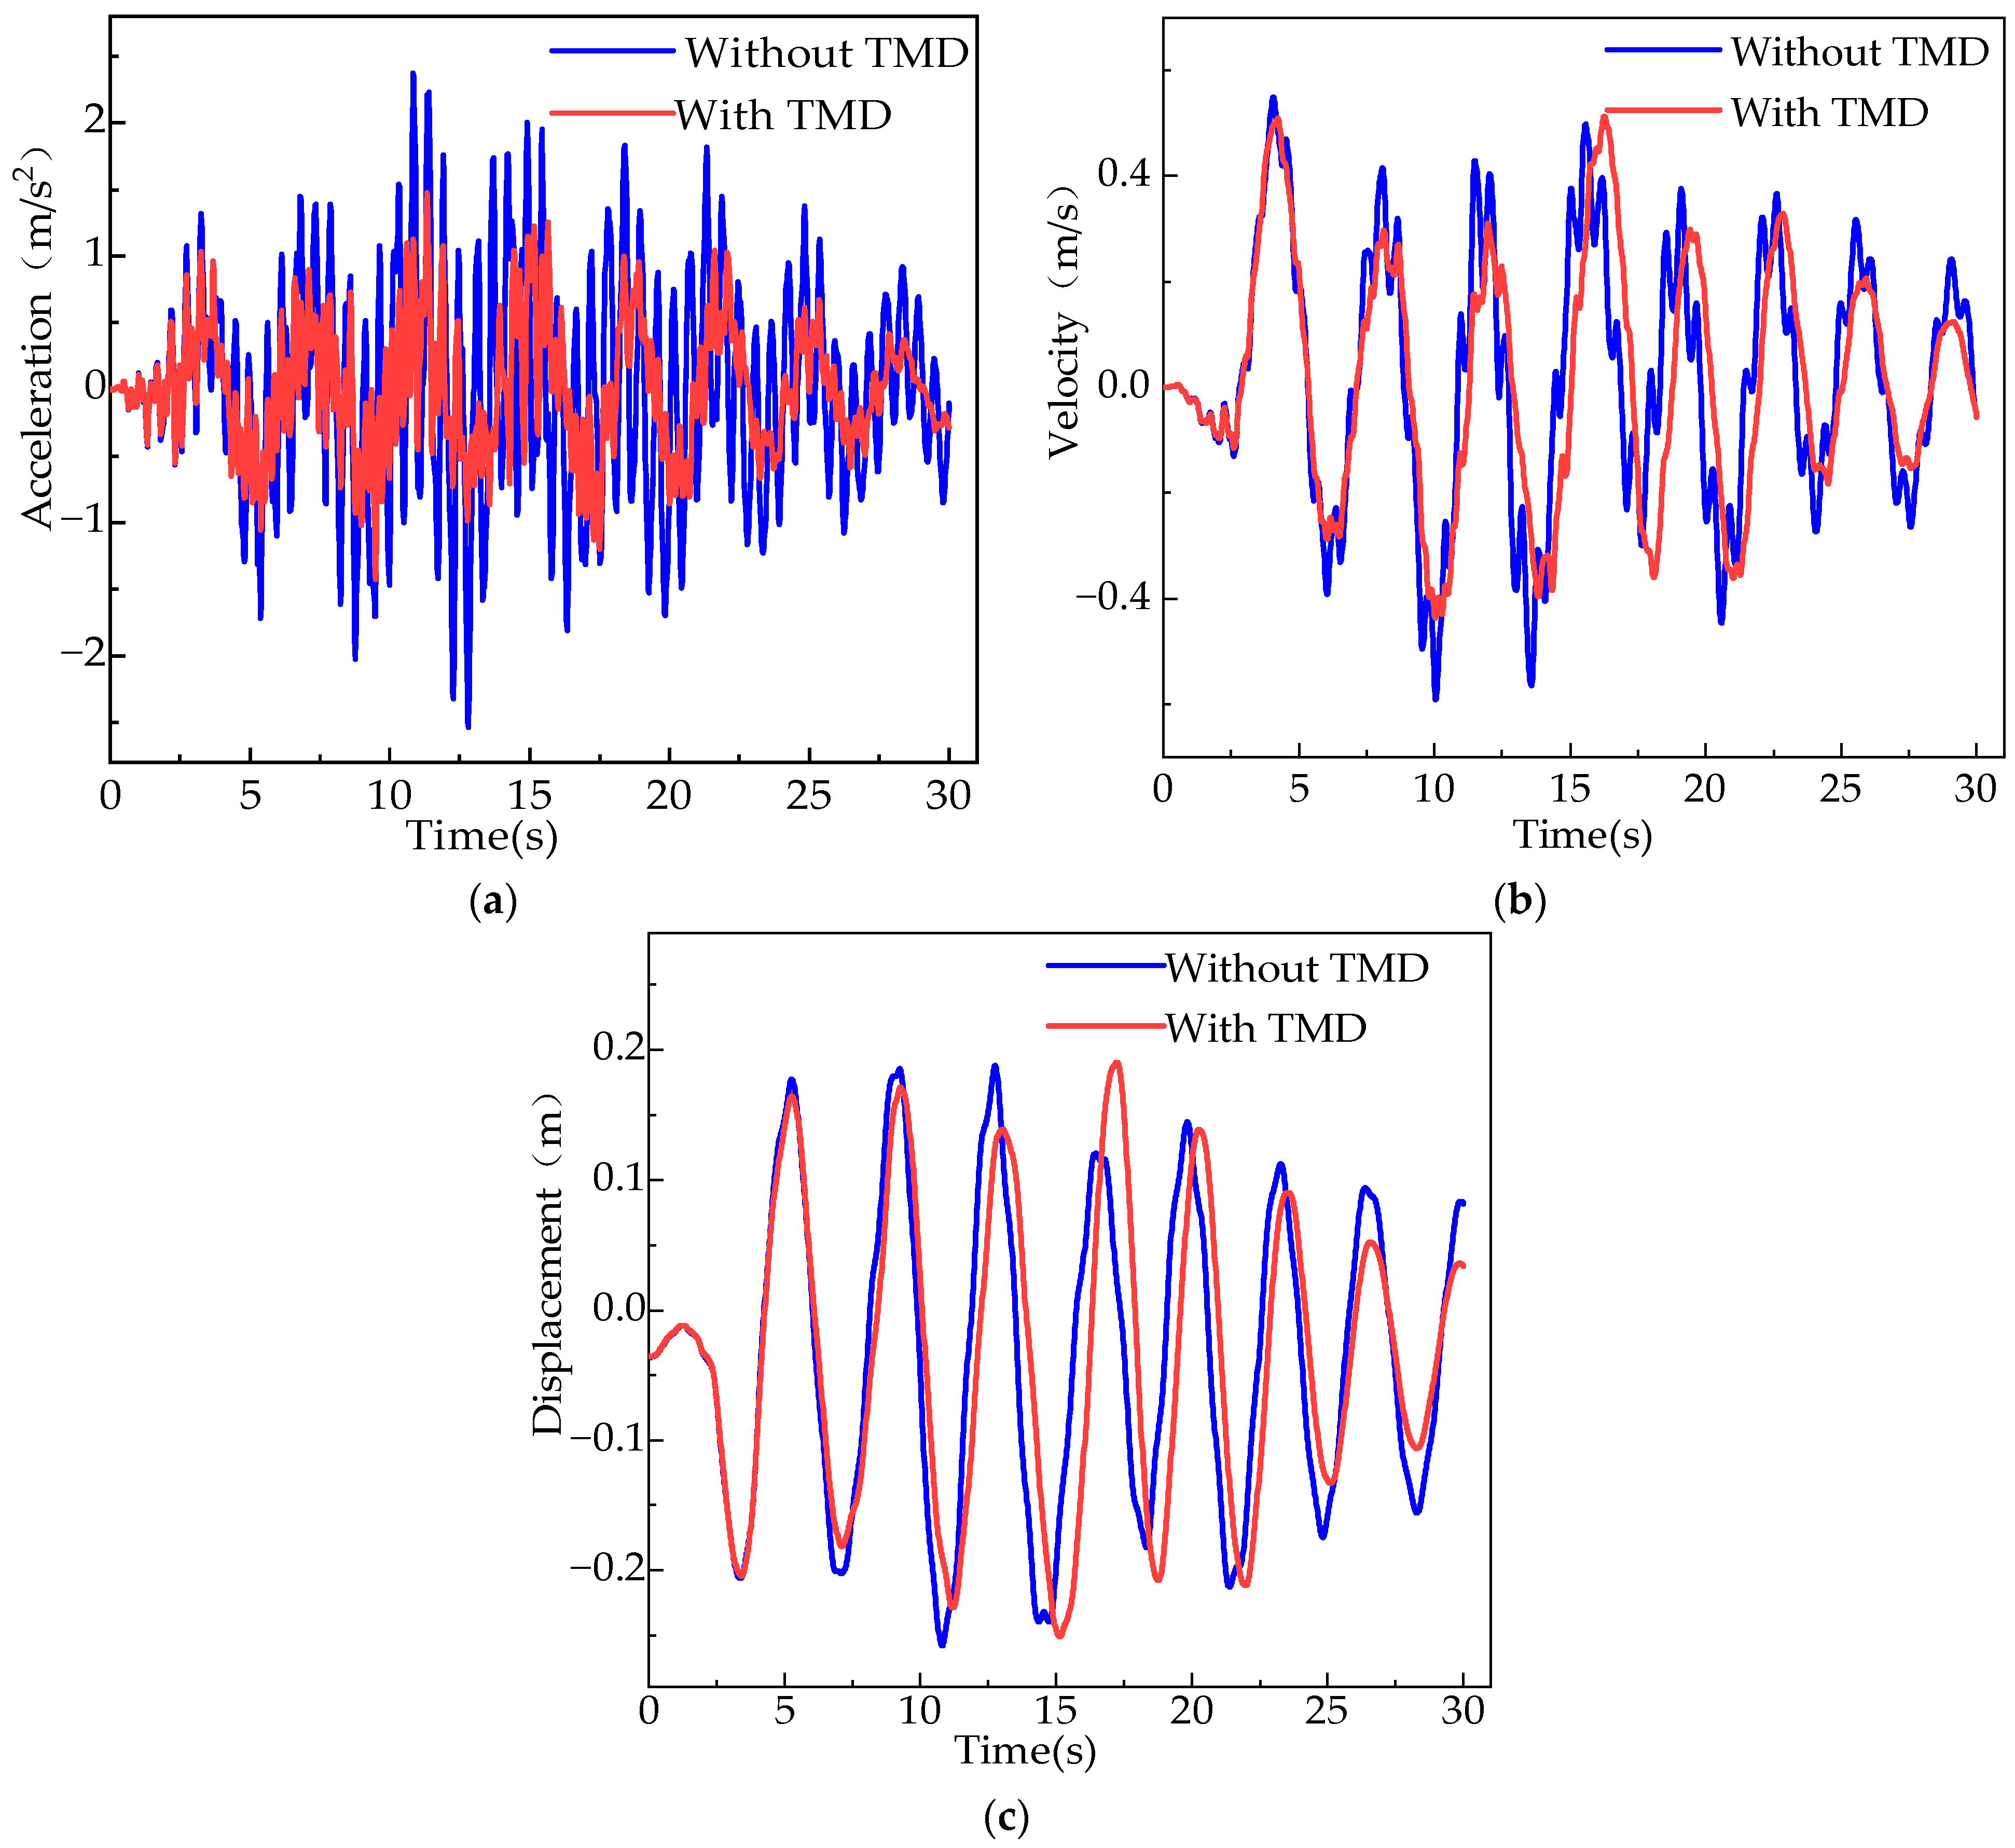
  • If a TMD was installed in the middle and at the top of the steel-concrete tower, the vibration reduction effect of the TMD located in the middle was better than that at the top.
  • With the increase in TMD mass ratio, the acceleration at the top of the tower decreased and eventually stabilized, the velocity decreased first and then increased slightly, and the displacement decreased first and then increased significantly. Therefore, the TMD mass ratio is recommended to be 0.01.
  • It was found that the vibration reduction effect of a TMD decreased with the distance from the TMD installation point.
  • The optimal TMD installation locations to reduce the seismic responses of the steel-concrete tower were in the middle and at the top of the tower, respectively. In an actual project, conclusions 3 and 4 can be considered comprehensively.

Author Contributions

Conceptualization, Y.Y. and J.T.; methodology, K.J.; software, C.L.; validation, C.L.; formal analysis, C.L.; investigation, Y.Z.; data curation, K.J.; writing—original draft preparation, C.L.; writing—review and editing, Y.Y.; visualization, Y.Y.; supervision, Y.Y.; project administration, Y.Y. All authors have read and agreed to the published version of the manuscript.

Funding

This research received no external funding.

Conflicts of Interest

The authors declare no conflict of interest.

References

  1. Joselin Herbert, G.M.; Iniyan, S.; Sreevalsan, E.; Rajapandian, S. A review of wind energy technologies. Renew. Sustain. Energy Rev. 2007, 11, 1117–1145. [Google Scholar] [CrossRef]
  2. Yan, K.; Wan, J.; Ren, W.; Wei, Y.; Feng, X.; Wang, H. The status and development of materials of large-scale wind turbine tower. Wind Energy 2013, 3, 102–105. [Google Scholar]
  3. Agbayani, N.A.; Vega, R.E. The rapid evolution of wind turbine tower structural systems: A historical and technical overview. In Proceedings of the Structures Congress, Chicago, IL, USA, 29–31 March 2012. [Google Scholar]
  4. Cotrell, J.; Stehly, T.; Johnson, J.; Roberts, J.O.; Parker, Z.; Scott, G.; Heimiller, D. Analysis of Transportation and Logistics Challenges Affecting the Deployment of Larger Wind Turbines: Summary of Results. Available online: https://permanent.fdlp.gov/gpo110145/61063.pdf____%60.pdf (accessed on 2 September 2022).
  5. Sin, S.; Xu, Q.; Yun, H.; Pan, H. Status of corrosion and protection for offshore wind towers. Corros. Prot. 2010, 31, 875–877, 885. [Google Scholar]
  6. Ungkurapinan, N. Development of Wind Turbine Towers Using Fiber Reinforced Polymers. Ph.D. Thesis, University of Manitoba, Winnipeg, MB, Canada, 2005. [Google Scholar]
  7. Quilligan, A.; O’Connor, A.; Pakrashi, V. Fragility analysis of steel and concrete wind turbine towers. Eng. Struct. 2012, 36, 270–282. [Google Scholar] [CrossRef]
  8. Zhang, Y.; Cai, X.; Gao, Q.; Ding, W.X. Research summary of wind turbine tower structure. Chin. J. Eng. Des. 2016, 23, 108–115, 123. [Google Scholar]
  9. Polyzois, D.J.; Raftoyiannis, I.G.; Ungkurapinan, N. Static and dynamic characteristics of multi-cell jointed GFRP wind turbine towers. Compos. Struct. 2009, 90, 34–42. [Google Scholar] [CrossRef]
  10. Alshurafa, S.A. Development of Meteorological Towers Using Advanced Composite Materials. Ph.D. Thesis, University of Manitoba, Winnipeg, MB, Canada, 2012. [Google Scholar]
  11. Sami, A.; Hanan, A.; Dimos, P. Finite element method for the static and dynamic analysis of FRP guyed tower. J. Comput. Des. Eng. 2019, 3, 436–446. [Google Scholar]
  12. Deng, R.; Zhou, X.H.; Deng, X.W.; Ke, K.; Bai, J.L.; Wang, Y.H. Compressive behaviour of tapered concrete-filled double skin steel tubular stub columns. J. Constr. Steel Res. 2021, 184, 106771. [Google Scholar] [CrossRef]
  13. Rebelo, C.; Moura, A.; Gervásio, H.; Veljkovic, M.; Simões da Silva, L. Comparative life cycle assessment of tubular wind towers and foundations—Part 1: Structural design. Eng. Struct. 2014, 74, 283–291. [Google Scholar] [CrossRef]
  14. McKenna, R.; Ostman v.d. Leye, P.; Fichtner, W. Key challenges and prospects for large wind turbines. Renew. Sustain. Energy Rev. 2016, 53, 1212–1221. [Google Scholar] [CrossRef]
  15. Kang, C.; Hartwig, S.; Marx, S. Behavior of externally prestressed segmental towers’ dry joint under torsion effects. Struct. Concr. 2019, 20, 1350–1357. [Google Scholar] [CrossRef]
  16. Kaldellis, J.K.; Zafirakis, D. The wind energy (r)evolution: A short review of a long history. Renew. Energy 2011, 36, 1887–1901. [Google Scholar] [CrossRef]
  17. Pons, O.; Fuente, A.; Armengou, J. Towards the sustainability in the design of wind towers. Energy Procedia 2017, 115, 41–49. [Google Scholar] [CrossRef]
  18. Song, H.; Cong, O.; Hao, H.; Xu, Y. Research on mechanical behaviors of horizontal joint connection of prefhbricated concrete towers. Build. Struct. 2016, 46, 16–20. [Google Scholar]
  19. Song, H.; Cong, O.; Hao, H.; Xu, Y. Research on mechanical behaviors of vertical connection node in prefabricated concrete tower. Build. Struct. 2018, 48, 679–683. [Google Scholar]
  20. Kim, M.O.; Kim, T.M.; Lee, D.Y.; Kim, M.K. Experimental Investigation of the Steel-Concrete Joint in a Hybrid Tower for a Wind Turbine under Fatigue Loading. KSCE J. Civ. Eng. 2019, 23, 2971–2982. [Google Scholar] [CrossRef]
  21. Huang, S.; Huang, M.; Lyu, Y.; Xiu, L. Effect of sea ice on seismic collapse-resistance performance of wind turbine tower based on a simplified calculation model. Eng. Struct. 2021, 227, 111426. [Google Scholar] [CrossRef]
  22. Takeuchi, T.; Nakamura, T.; Matsui, R.; Ogawa, T.; Imamura, A. Seismic performance of tubular truss tower structures focusing on member fracture. J. Struct. Constr. Eng. 2011, 76, 1971–1980. [Google Scholar] [CrossRef]
  23. Vca, B.; Sns, A. Seismic performance of offshore wind turbine in the vicinity of seamount subduction zone. Structures 2021, 34, 423–432. [Google Scholar]
  24. Bin, L.I.; Yang, X.; Gao, C. Experimental research and comparative analysis on seismic performance of wind turbine frustum tower drum and latticed tower. J. Build. Struct. 2013, 34, 161–166. [Google Scholar]
  25. Bian, Y.; Liu, X.; Sun, Y.; Zhong, Y. Optimized Design of a Tuned Mass Damper Inerter (TMDI) Applied to Circular Section Members of Transmission Towers. Buildings 2022, 12, 1154. [Google Scholar] [CrossRef]
  26. Henriques, J.M.; Barros, R.C. Design of a Lattice Wind Tower and a Comparison of the Structural Response with and without a TMD. In Proceedings of the Fourteenth International Conference on Civil Structural and Environmental Engineering Computing, Cagliari, Italy, 3–6 September 2013. [Google Scholar]
  27. Chen, J.; Georgakis, C.T. Tuned rolling-ball dampers for vibration control in wind turbines. J. Sound Vib. 2013, 332, 5271–5282. [Google Scholar] [CrossRef]
  28. Wang, L.; Zhao, X.; Zheng, Y.M. A combined tuned damper and an optimal design method for wind-induced vibration control for super tall buildings. Struct. Des. Tall Spec. Build. 2016, 25, 468–502. [Google Scholar] [CrossRef]
  29. Kalehsar, H.E.; Khodaie, N. Wind-induced vibration control of super-tall buildings using a new combined structural system. J. Wind. Eng. Ind. Aerodyn. 2018, 172, 256–266. [Google Scholar] [CrossRef]
  30. Fujita, T.; Matsumoto, Y.; Masaki, N.; Suizu, Y. Tuned mass damper using multistage rubber bearing for vibration control of tall buildings (1st report. fundamental study of the vibration characteristics). Trans. Jpn. Soc. Mech. Eng. 1990, 56, 634–639. [Google Scholar] [CrossRef]
  31. Zhang, Z.; Li, A.; Chen, Y. Research on wind-induced vibration hybrid control of Hefei TV Tower. In Proceedings of the 2011 International Conference on Electric Technology and Civil Engineering (ICETCE), Lushan, China, 22–24 April 2011. [Google Scholar]
  32. Fitzgerald, B.; Sarkar, S.; Staino, A. Improved reliability of wind turbine towers with active tuned mass dampers (ATMDs). J. Sound Vib. 2018, 419, 103–122. [Google Scholar] [CrossRef]
  33. Kottenstette, R.; Cotrell, J. Hydrogen storage in wind turbine towers. Int. J. Hydrog. Energy 2004, 29, 1277–1288. [Google Scholar] [CrossRef]
  34. Liu, J.; Liu, H. ABAQUS finite element analysis of reinforced concrete. Equip. Manufactring Technol. 2009, 6, 69–70. [Google Scholar]
  35. Code for Design of Concrete Structures; China Architecture & Building Press: Beijing, China, 2010.
  36. Liu, Q.; Fu, W.; Li, M.; Chen, Z. Numerical simulation on the process of multi-point forming for tube. J. Harbin Inst. Technol. 2010, 17, 858–886. [Google Scholar]
  37. Du, J.; Xu, Y.; Xie, S.; Yang, R. Research on vibration control of wind turbine tower based on TMD. Acta Energ. Sol. Sin. 2021, 42, 157–162. [Google Scholar]
  38. Li, Y. Application research of TMD in civil engineering field in China. Shanxi Archit. 2020, 46, 41–43. [Google Scholar]
  39. Luft, R.W. Optimal tuned mass dampers for buildings. J. Struct. Div.-ASCE 1979, 105, 2766–2772. [Google Scholar] [CrossRef]
  40. Li, B.; Zhang, Y.; Yan, G.; Gu, H. Optimal design method for structures with viscous dampers in base isolation layer. J. Harbin Inst. Technol. 2022, 54, 101–110. [Google Scholar]
  41. Wei, Y.; Chen, G. Modal damping optimization for general damped structures. J. Vib. Eng. 2006, 19, 433–437. [Google Scholar]
  42. Hoang, N.; Fujino, Y.; Warnitchai, P. Optimal tuned mass damper for seismic applications and practical design formulas. Eng. Struct. 2008, 30, 707–715. [Google Scholar] [CrossRef]
  43. Zhang, M.; Xu, F. Tuned mass damper for self-excited vibration control: Optimization involving nonlinear aeroelastic effect. J. Wind. Eng. Ind. Aerodyn. 2022, 220, 104836. [Google Scholar] [CrossRef]
  44. Huang, Z.; Ni, L.; Qiu, H. Comparative study on four TMD vibration control simulation methods of wind turbine tower. J. Henan Polytech. Univ. 2020, 39, 85–90. [Google Scholar]
Figure 1. Model of the tower’s geometric parameters. (a) Model of steel-concrete wind turbine tower; (b) Steel-concrete connection section; (c) Concrete pieces of 1st and 2nd sections.
Buildings 12 01474 g001
Figure 2. Bilinear kinematic hardening model of Q355.
Buildings 12 01474 g002
Figure 3. Plastic damage model of C50.
Buildings 12 01474 g003
Figure 4. Interaction of prestressed anchor cables. (a) MPC constraint of conversion section and prestressed anchor cables; (b) MPC constraint of foundation and prestressed anchor cables.
Buildings 12 01474 g004
Figure 5. TMD structure diagram.
Buildings 12 01474 g005
Figure 6. TMD model diagram.
Buildings 12 01474 g006
Figure 7. First six order modes of the tower without TMD: (a) first order mode; (b) second order mode; (c) third order mode; (d) fourth order mode; (e) fifth order mode; (f) sixth order mode.
Buildings 12 01474 g007aBuildings 12 01474 g007b
Figure 8. Adjusted time history curve.
Buildings 12 01474 g008
Figure 9. Comparison of acceleration, velocity and displacement at 75 m with and without TMD towers: (a) acceleration comparison; (b) velocity comparison; (c) displacement comparison.
Buildings 12 01474 g009aBuildings 12 01474 g009b
Figure 10. Comparison of acceleration, velocity and displacement at 117 m with and without TMD towers: (a) acceleration comparison; (b) velocity comparison; (c) displacement comparison.
Buildings 12 01474 g010
Figure 11. Acceleration response spectrum curve.
Buildings 12 01474 g011
Figure 12. Dynamic response of tower top with different TMD mass ratios: (a) acceleration; (b) velocity; (c) displacement.
Buildings 12 01474 g012
Figure 13. The acceleration of the different installation positions of TMD under various schemes: (a) acceleration at 117 m of the tower; (b) acceleration at 91 m of the tower; (c) acceleration at 75 m of the tower.
Buildings 12 01474 g013aBuildings 12 01474 g013b
Table 1. Effect of the wind turbine on the tower.
Load Application Position (m)Mz (N·m)My (N·m)Fx (N)Fy (N)
118.19614,049,710 919,540214,5202,361,460
Table 2. Parameters of TMD.
Layout LocationMass (kg)Spring Stiffness (N/m)Damping RatioDamping Coefficient cd(N·s/m)
75 m 5340.12633,525.120.0354105.13
117 m5340.1217,597.920.035684.19
Table 3. Vibration reduction rate at different positions of the tower.
LocationAcceleration Vibration Attenuation RateVelocity Vibration
Attenuation Rate
Displacement Vibration Attenuation Rate
75 m 70%64%60%
Top of tower51%35%9%
Table 4. TMD-specific parameters of different layout schemes.
Layout
Scheme
Position of TMDMass of TMD
(kg)
Stiffness of TMD (N/m)Damping of TMD (N·s/m)
Scheme 1117 m10,680.231334,935.772311924.379674
Scheme 2117 m5340.1156517,597.92005684.1875557
91 m611,867.75294034.347311
Scheme 3117 m5340.1156517,597.92005684.1875557
75 m611,867.75294034.347311
Scheme 491 m5340.11565611,867.75294034.347311
75 m
Scheme 5117 m3560.077111,761.13065373.1213188
91 m408,926.54132200.129155
75 m408,926.54132200.129155
Publisher’s Note: MDPI stays neutral with regard to jurisdictional claims in published maps and institutional affiliations.

