3.1. Strength Development of Mortar
Table 2 presents the compressive strength
fcm,t and flexural strength
ftm,t of mortar at different curing ages. Generally, due to a rich content of tricalcium silicate, dicalcium silicate and tetracalcium aluminate at the early ages [
9,
10,
11,
12], the quick hydration caused a rapid increase in the strength of mortar. With the increase in curing age, the growth of the strength became slower with a decreased hydration rate due to the gradual consumption of tricalcium silicate and other substances involved in the hydration [
26,
27].
Meanwhile, the strength development of mortar related to the water to binder ratio and the mineral admixture content. With the fly ash as the mineral admixture, the mortars M40 and M31 presented a similar development of compressive strength that was lower at the early curing age and a bit of higher growth at a later curing age. The compressive strength
fcm,7 only reached 31.3% and 42.7% of the
fcm,360, and the
fcm,28 just reached 54.8% and 65.3%. This is a typical characteristic of strength development of cement matrix mixed with fly ash [
28,
29]. The activity of fly ash can be excited after the hydration of cement which provides enough Ca (OH)
2 to generate the secondary hydration. With the GGBS and silica fume as mineral admixture, the mortar M24 presented a higher compressive strength at early age and a slow growth at latter. The compressive strength
fcm,7 and
fcm,28 reached 62.6% and 81.7% of the
fcm,360, respectively. This came from a higher activity of GGBS to participate the hydration of cementitious to promote the strength growth. Silica fume has the functions of filling and hydration to optimize the interfacial transition zone, refine the pore structure, and significantly improves the early strength of matrix [
16]. Moreover, the binary addition of silica fume and GGBS can promote the strength development at early and later ages [
30].
Compared with the compressive strength, the flexural strength seems to increase faster in the early age, while undergoing lower growth in the latter. The flexural strength ftm,7 was more than 80% of the ftm,360 for M31 and M24, and could reach 56.3% for M40.
Referring to the compressive strength development of concrete [
10,
11], the long-term compressive strength of mortar can be predicted by Formula (14).
where,
c is the regression coefficient determined by tests data. It is 0.800 for M40 with Adj. R
2 of 0.989, 0.478 for M31 with Adj. R
2 of 0.990, and 0.213 for M24 with Adj. R
2 of 0.905.
Figure 4 presents the comparison of the calculated to the test compressive strength. Good fitness can be obtained from these curves with the experimental results.
The relationship between the tensile and compressive strengths of concrete is always described by the power function, and it was not affected by the curing age [
31]. Thus, the relationship of flexural strength and compressive strength of mortar is expressed as Formula (15) in this study. Where the regression coefficients of 1.491 and 0.476 are determined by the fitted test data.
Figure 5 presents the comparison of the fitted curve with test data.
Then, the Formula (16) is obtained as follow,
As shown in
Figure 6, the calculated curves fit well with the test data; the average ratios of calculated to test values of
ftm,t for M40, M31 and M24 are 0.999, 1.060 and 0.965 with variation coefficients of 0.064, 0.057 and 0.046, respectively.
3.2. Characteristics on PL-S Curves of Steel Fiber at Different Curing Ages
Figure 7 shows the characteristic
PL-S curves of steel fiber in M40, M31 and M24 at different curing age. Similar shapes are presented on all characteristic curves. The peak pull-out loads, the slopes of ascending and descending portions gradually increase with the curing age. Especially the
PL-S curves of M40 and M31 in 7 days are significantly flatting with lower peak loads compared with the curves after 28 days. This is consistent with the mortar strength development discussed above.
In the characteristic PL-S curves of M40, the pull-out load and slip varies continuously, corresponding to the failure of fibers pulled out with the whole-fiber hook ends being straightened. The descending portion of curves after 28 days have an obvious “step” shape.
The pull-out load and slip of M31 varies continuously at 7 to 180 days with the steel fibers which were basically pulled out with straightened fiber ends. The pull-out load drops abruptly in the descending portion of the curves at 270 and 360 days, corresponding to the failure of one or two fibers fractured at the first corner of the hook-end.
With continuous variation in the pull-out load and slip, the characteristic PL-S curves of M24 were basically pulled out with straightened fiber hook ends at 7 and 28 days. While the pull-out load drops abruptly in the descending portion after 60 days, corresponding to the fracture of one or two fibers.
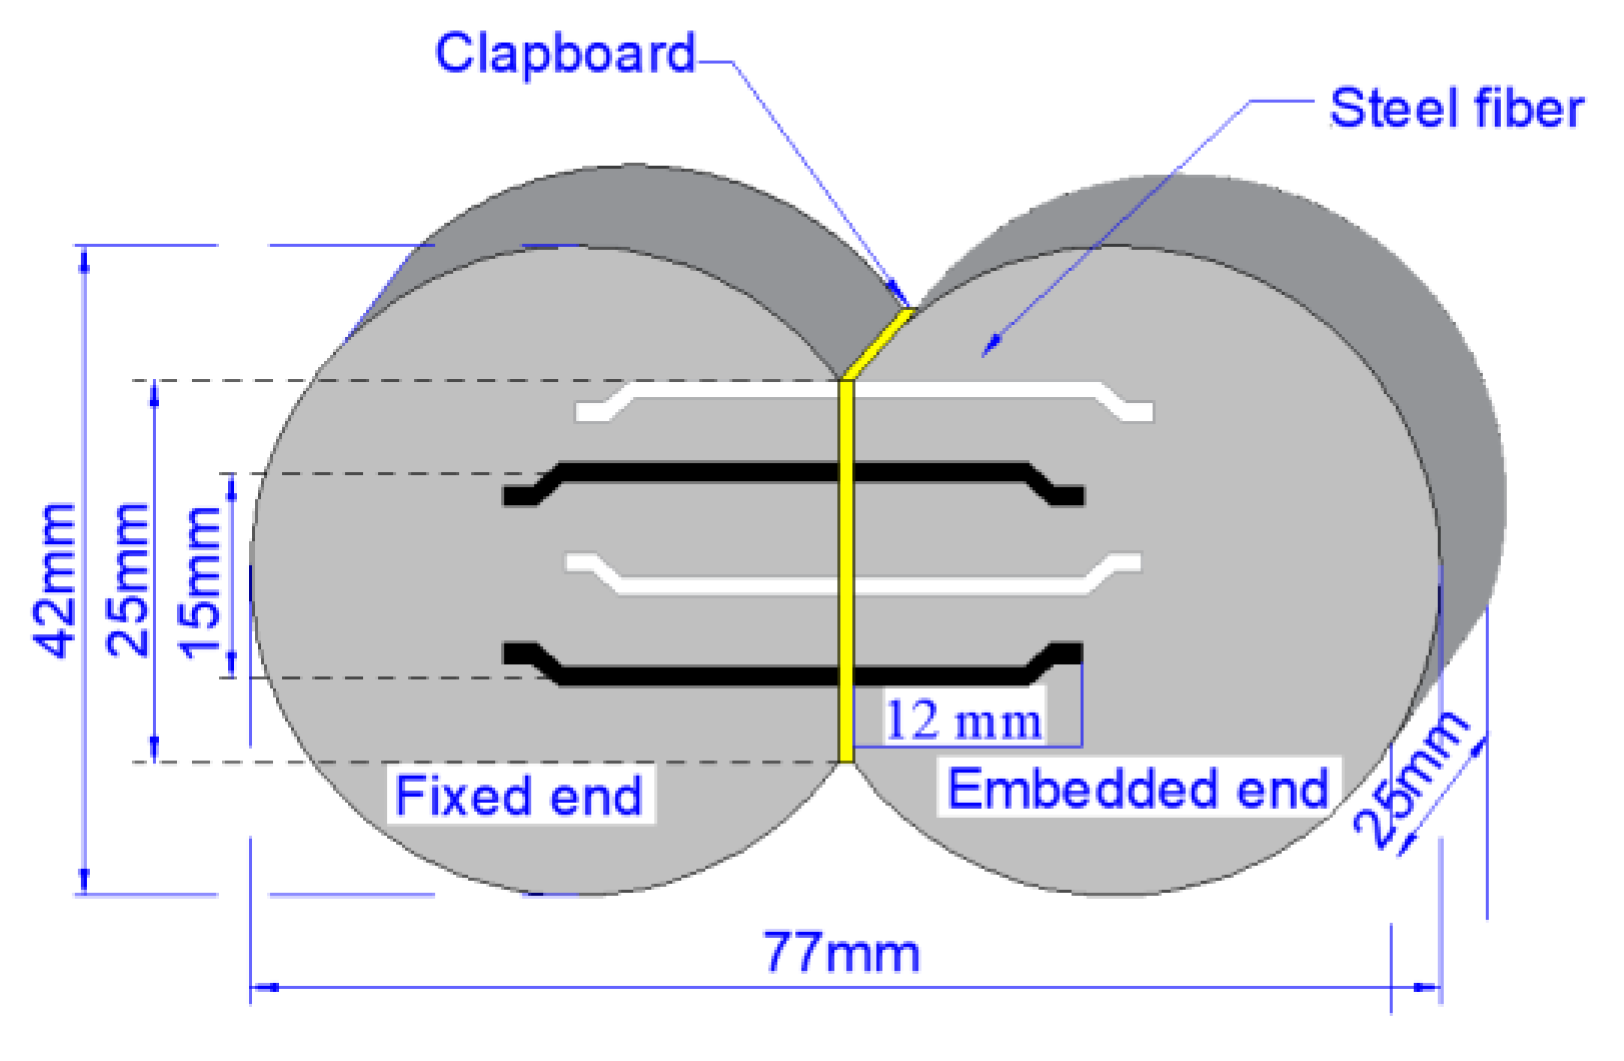
The fiber is aligned embedded in the mortar in this study, while the hook-end has a certain angle of 45° with the fiber length. It means that the hook-end of fiber is inclined with the pull-out load direction. The hook-end of fiber is not only subjected to the bond stress of the mortar at the contact surface, but also subjected to the local pressure stress of the mortar [
32] during the pull-out process. Therefore, the maximum local tensile stress of the fiber will appear at the hook-end. In this study, the mortar strength gradually increases with the curing age. When the strength of mortar is higher than a certain value, the local tensile stress of the fiber hook-end may reach its tensile strength, and a fracture occurs. At this time, the pull-out load slip curve will be sharply reduced.
The loads and slips extracted for three points D, P and R presented in
Figure 3 are listed in
Table 3. The curing age and mortar strength has little influence on the debonding slip, except that the
sd,t at 7 days to 60 days increase with the decrease in mortar strength
. sp,t and
sr,t of all tests decrease with the increasing curing age and mortar strength.
3.3. Bond Strength Development of Steel Fiber in Mortar
Test results of debonding strength
τd,t, bond strength
τmax,t and residual bond strength
τres,t related to the compressive strength of mortar are presented in
Figure 8. Power function can be used for describing the relationships. By fitting regression with Adj. R
2 of 0.839, 0.814 and 0.645, respectively, formulas are expressed as follow,
Combined with Formula (14), Formulas (20)–(22) are obtained. The average ratios and corresponding variation coefficients of tested to the calculated values of bond strengths for M40, M31 and M24 are listed in
Table 4.
It is noted that the bond strengths of the same steel fiber in mortar with the same strength were smaller in a previous study [
8]. This is due to the different characteristics of river sand and manufactured sand used for mortars in the previous study and this experiment. Due to the rough surface of manufactured sand [
33,
34], the density and the interfacial transition zone of matrix is improved [
35,
36], which is beneficial to the bond performance of steel fiber to mortar.
3.4. The Strength Ratios Development of Steel Fiber in Mortar
Figure 9 displays the strength use efficiency
usf,t of steel fibers in M40, M31 and M24.The
usf,t of steel fiber in M40 ranged from 41.4% to 68.5% with the curing age from 7 to 360 days. The
usf,t of steel fiber in M31 increased from 62.4% to 88.8% from 7 to 180 days, and were higher than 90% at 270 days and 360 days. The
usf,t of steel fiber in M24 ranged from 85.7% to 88.1% with the curing age from 7 to 28 days, and are above 90% from 60 to 360 days. Compared with the failure modes, when the strength use efficiency reaches 90%, the possibility of fiber fracture increases.
Figure 10 displays the strength ratios
ude,t and
ures,t of steel fibers in M40, M31 and M24, which reflects the debonding resistance of steel fiber during the ascending loading portion and the loss rate of bond strength during the descending loading portion, respectively. The
ude,t of steel fiber in M40 tended to increase with the curing age from 7 to 360 days. The
ude,t of steel fiber in M31 increased from 7 to 28 days, and ranged from 58.0% to 68.3% at the curing age from 60 to 360 days. No obvious regularity was observed in the
ude,t of steel fiber in M24, which ranged from 53.1% to 75.5% with the curing age from 7 to 360 days. The
ude,t increase with the decrease in water to binder ratio
w/b at the same curing age, which means steel fiber will have better debonding resistance in mortar with low
w/b. The increase in chemical adhesion with the decrease in
w/b is greater than that of mechanical anchorages and physical fraction in this study. The
ures,t of steel fibers in M40, M31 and M24 are ranged from 63.5 to 77.9 %, 57.7 to 74.1% and 68.6 to 85.9% with the curing age from 7 to 360 days, successively. No obvious influence of curing age was observed on the
ures,t. The
ures,t of steel fiber in M24 are higher than those in M31 and M24 at same curing age. It may be due to the addition of silica fume in M24.
Based on the Formulars (21)–(23), the formulas of
ude,t and
ures,t can be expressed as Formulas (23) and (24). The average ratios and corresponding variation coefficients of calculated to the tested values of the strength ratios for steel fibers in M40, M31 and M24 are listed in
Table 5.
3.5. Energy Dissipation in the Process of the Pull-Out Test
Table 6 presents the debonding work
Wd,t, the slipping work
Wp,t and the pull-out work
Wr,t and their corresponding energy ratio
Rd,t,
Rdp,t and
Rpr,t of steel fibers in M40, M31 and M24.
The Wd,t of steel fiber in M40 increased from 7 to 60 days, then kept constant at 41.2 N.mm with a variation coefficient of 0.38 after 60 days. The Wd,7 and Wd,28 are 29.4% and 52.9% of those at 360 days. The Wd,t of steel fiber in M31 increased from 7 days to 28 days, then kept constant of 70.3 N.mm with a variation coefficient of 0.08 after 28 days. The Wd,7 is 25.7% of the Wd,360, Wd,28 reaches 94.6% of the Wd,360. The Wd,t of steel fiber in M24 shows opposite regularity, which decreases from 7 to 360 days.
The curing age has little influence on the Wp,t. The Wp,t for M40, M31 and M24 kept constant at 403 N.mm, 421 N.mm and 395 N.mm, with variation coefficients of 0.13, 0.19 and 0.13, respectively. The Wp,t is slightly influenced by the mortar strength..
The Wr,t of M40 and M31 increased from 7 days to 28 days, then kept constant at 1166 N.mm with a variation coefficient of 0.13 and 1495 N.mm with a variation coefficient of 0.11 after 28 days. The Wr,t of M24 was constant at 1208 N.mm with a variation coefficient of 0.07. M31 had a higher Wr,t compared to that of M40 and M24 at the same curing age.
The relationship of bond works and the compressive strength of mortar are presented in
Figure 11. The debonding work
Wd,t is sensitive to the mortar strength, which increased with the compressive strength with Adj-R
2 of 0.502. The slipping work
Wp,t shows a slight decrease with the increase in the mortar strength. The pull-out work
Wr,t shows a tendency to increase with the compressive strength in large discreteness.
The Rd,t of M40 and M31 increased from 7 days to 90 days, then kept constant at 3.8% and 5.15% with a variation coefficient of 0.48 and 0.06 after 90 days. The Rd,t of M24 decreased from 7 days to 28 days, then kept constant at 5.73 with a variation coefficient of 0.28. The Rd,t at the same curing age tended to increase with the increase in mortar strength. However, all the Rd,t were smaller than 9% and with a high variation coefficient. This means that the energy dissipation capacity of steel fiber at the cracking resistance of SFRC plays a small part and is unstable in the whole pull-out process.
The Rdp,t of M40 and M31 decreased from 7 days to 90 days, then kept constant at 30.4% and 22.8% with a variation coefficient of 0.10 and 0.17 after 90 days. The Rdp,t of M24 kept constant at 24.4% with a variation coefficient of 0.11. The Rdp,t of M40 were higher than those of M31 and M24 at the same curing age.
The curing age has little influence on the Rpr,t. The Rpr,t of M40, M31 and M24 kept constant of 64.3%, 71.2% and 69.5% with variation coefficient of 0.05, 0.07 and 0.06 from 7 to 360 days, successively. The Rpr,t of M31 was higher than those of M40 and M24 at the same curing age. This indicates the energy dissipation capacity of steel fiber at the bearing capacity of SFRC plays an important role in the whole pull-out process.
The relationship of energy ratios and the compressive strength of mortar are presented in
Figure 12. The
Rd,t and the
Rpr,t increased with the mortar compressive strength. The
Rdp,t decreased with the increase in mortar compressive strength, which reflects the increase in bond brittleness with the mortar strength. This phenomenon needs to be paid attention in the normal serviceability of SFRC structures.

 ,
, 


