
Seismic Performance of a Novel Precast Beam-Column Joint Using Shape Memory Alloy Fibers-Reinforced Engineered Cementitious Composites

Abstract
:1. Introduction
2. Experimental Program
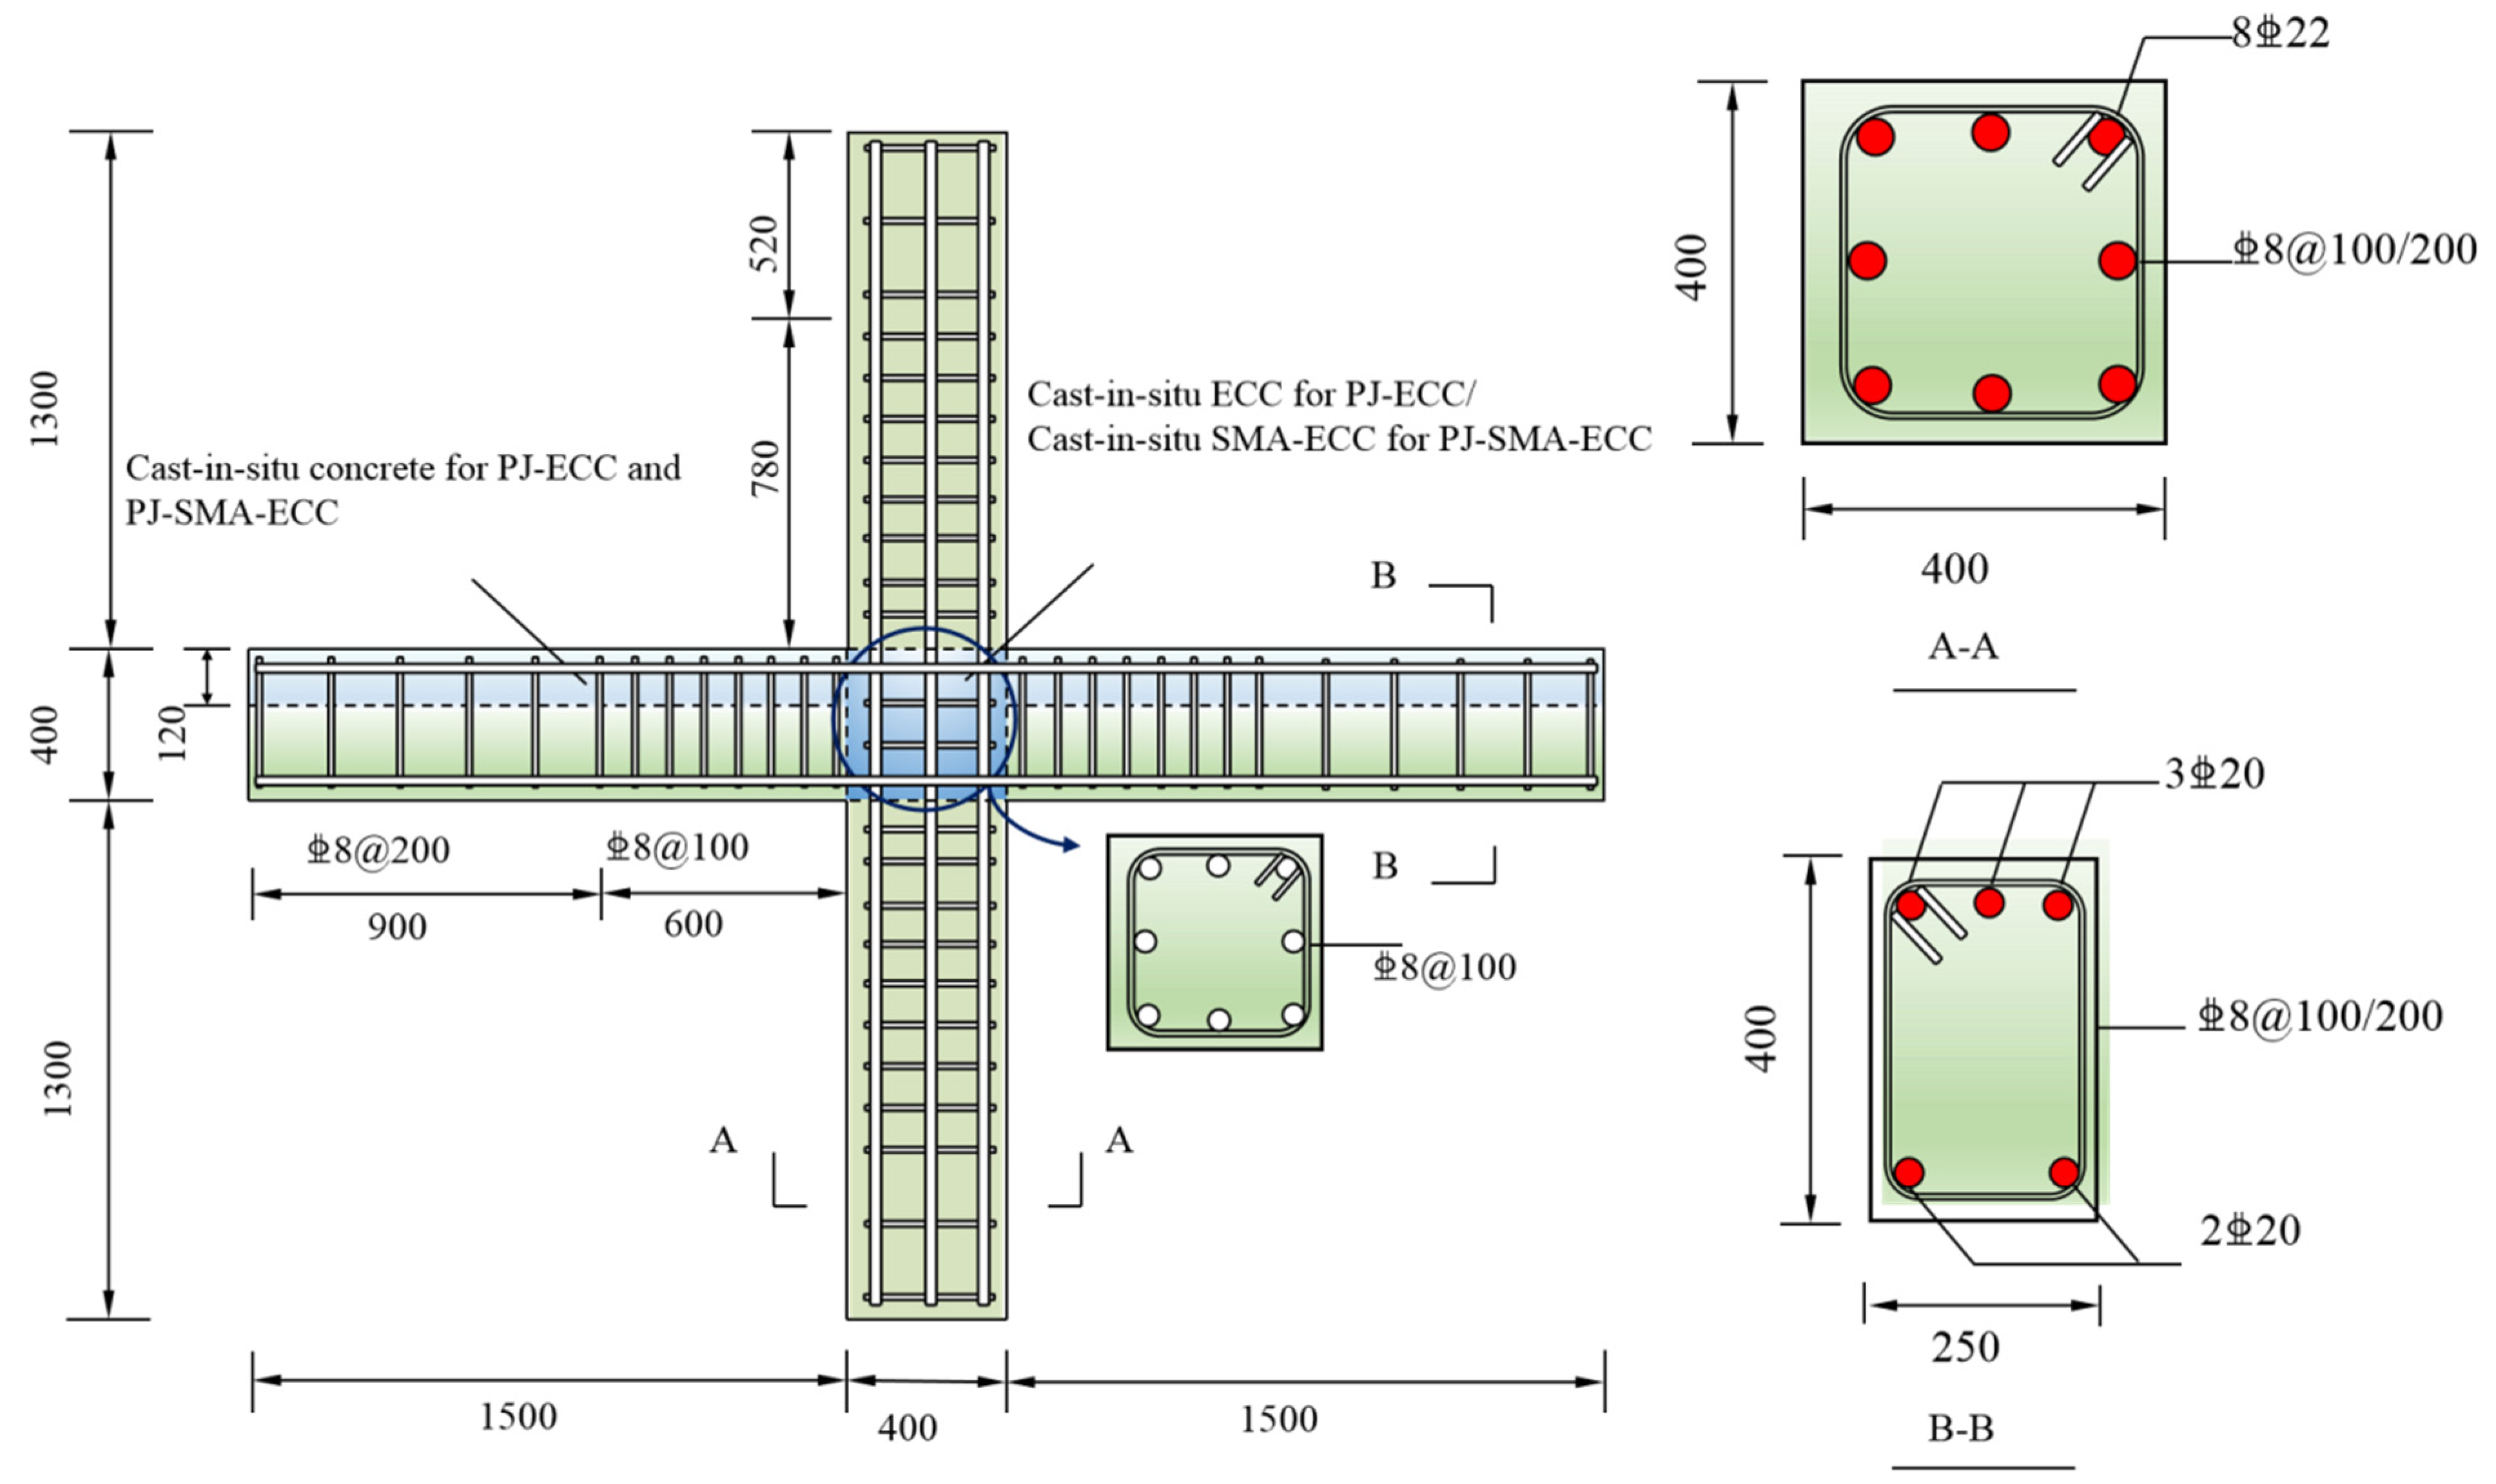
2.1. Specimen Design
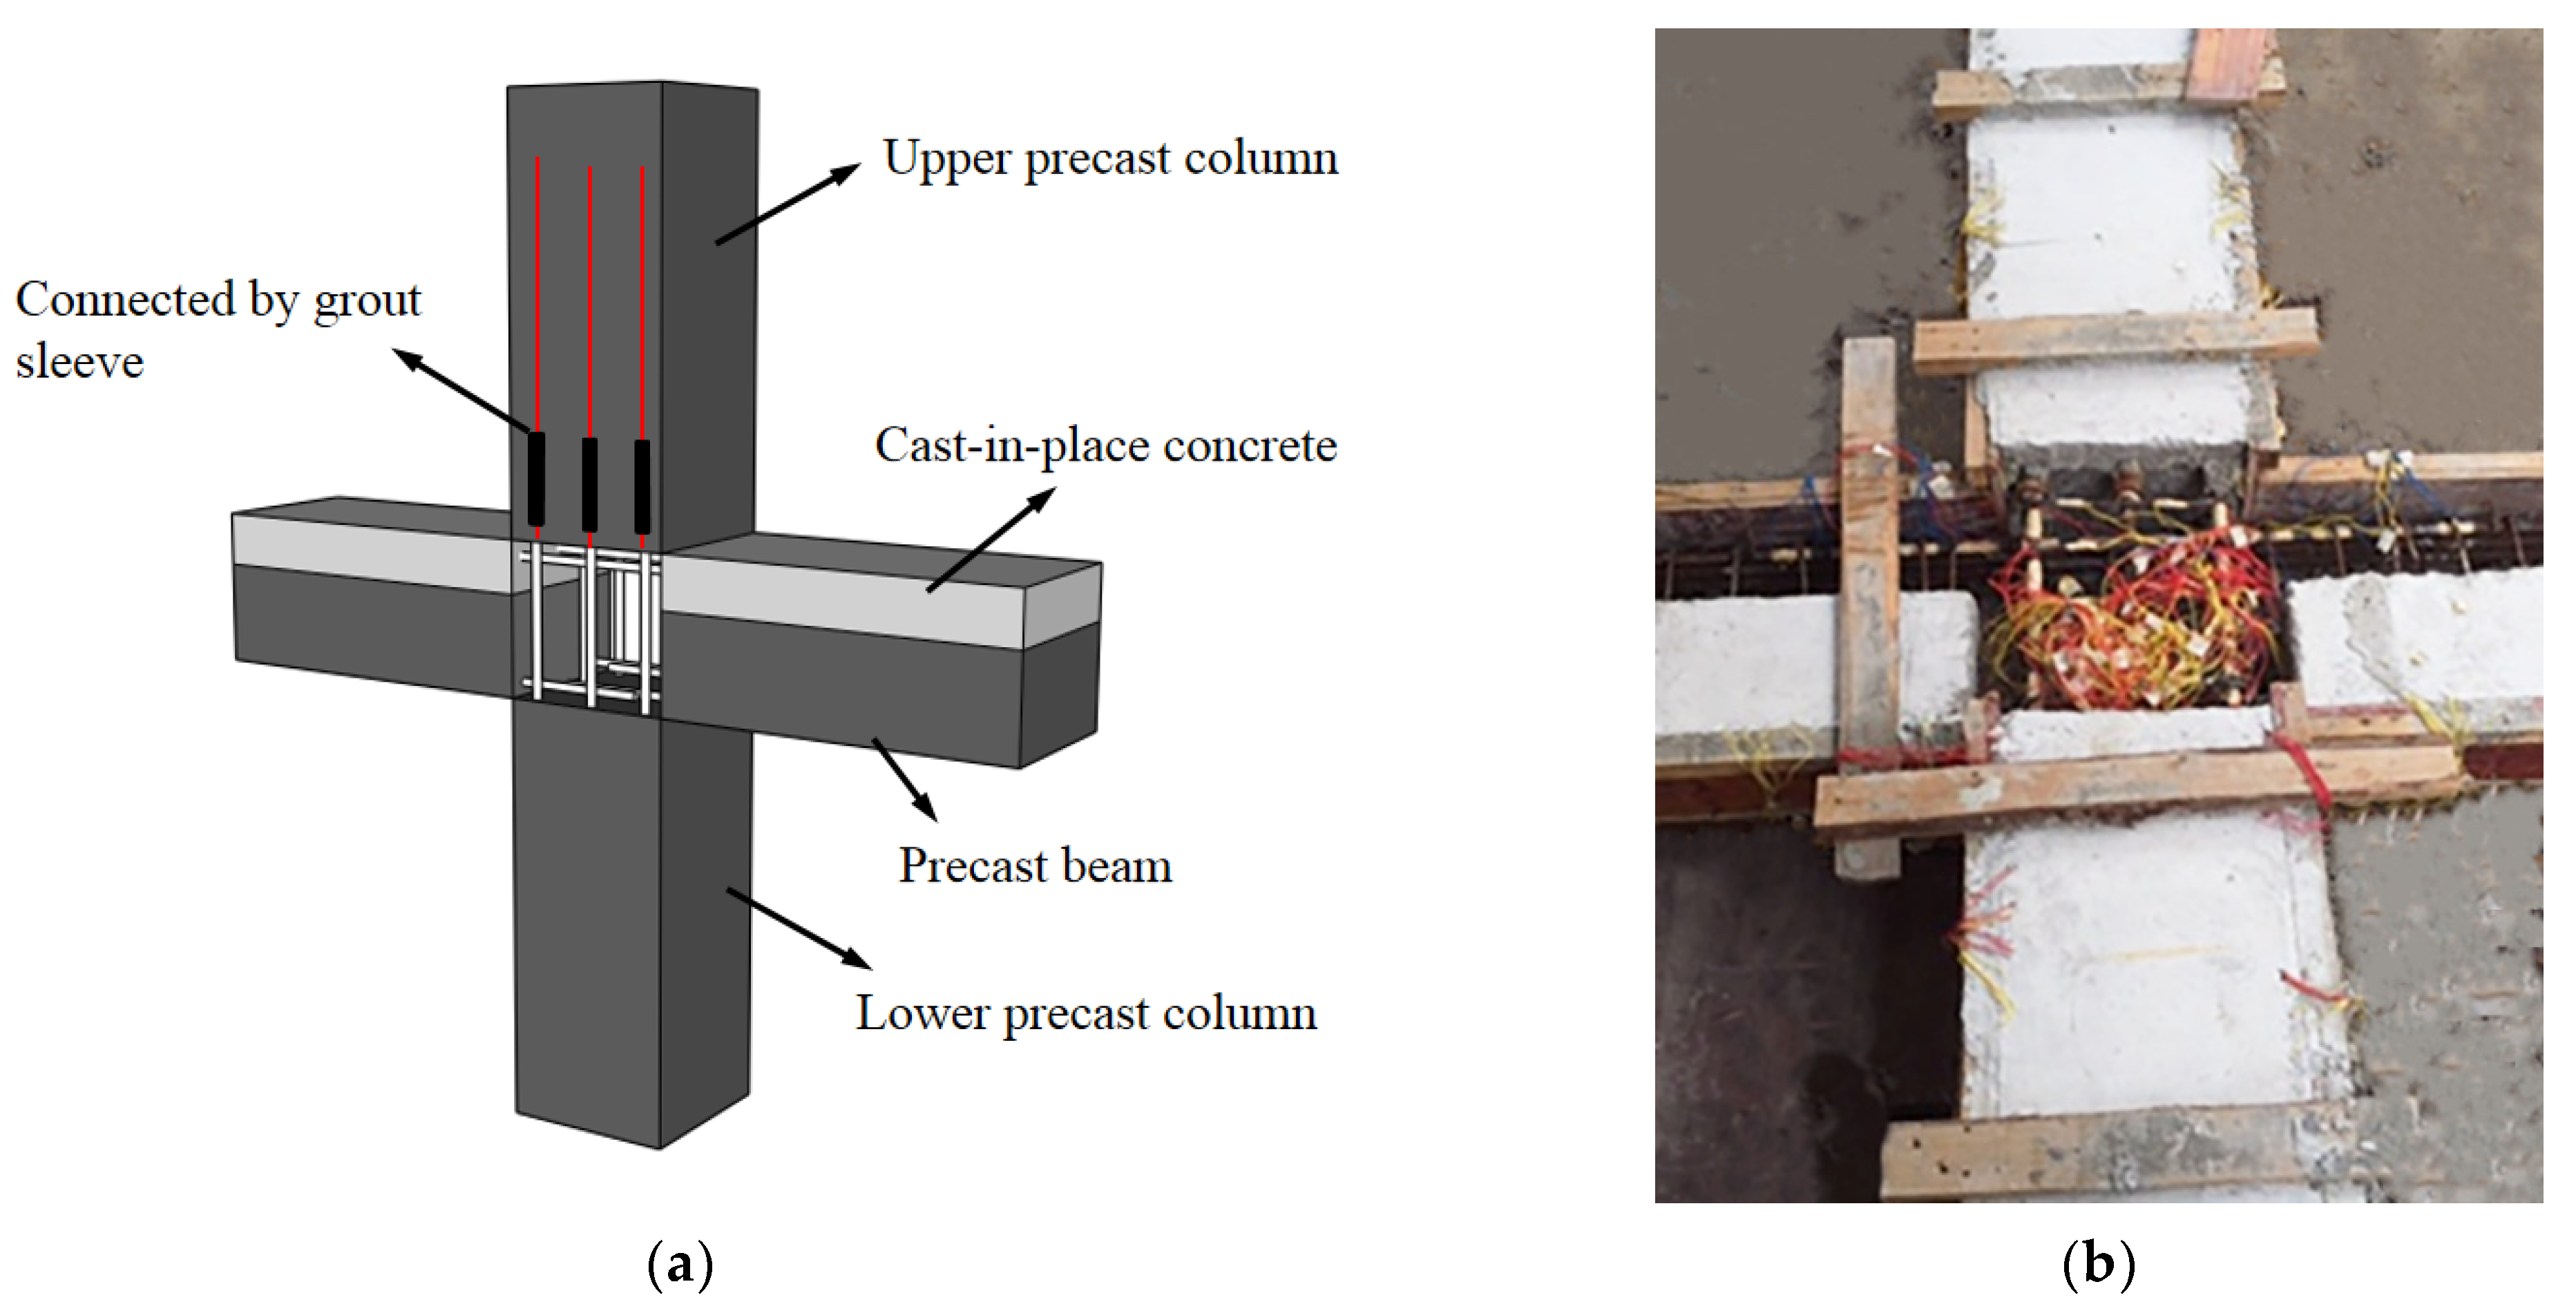
2.2. Specimen Fabrication
2.3. Materials Properties
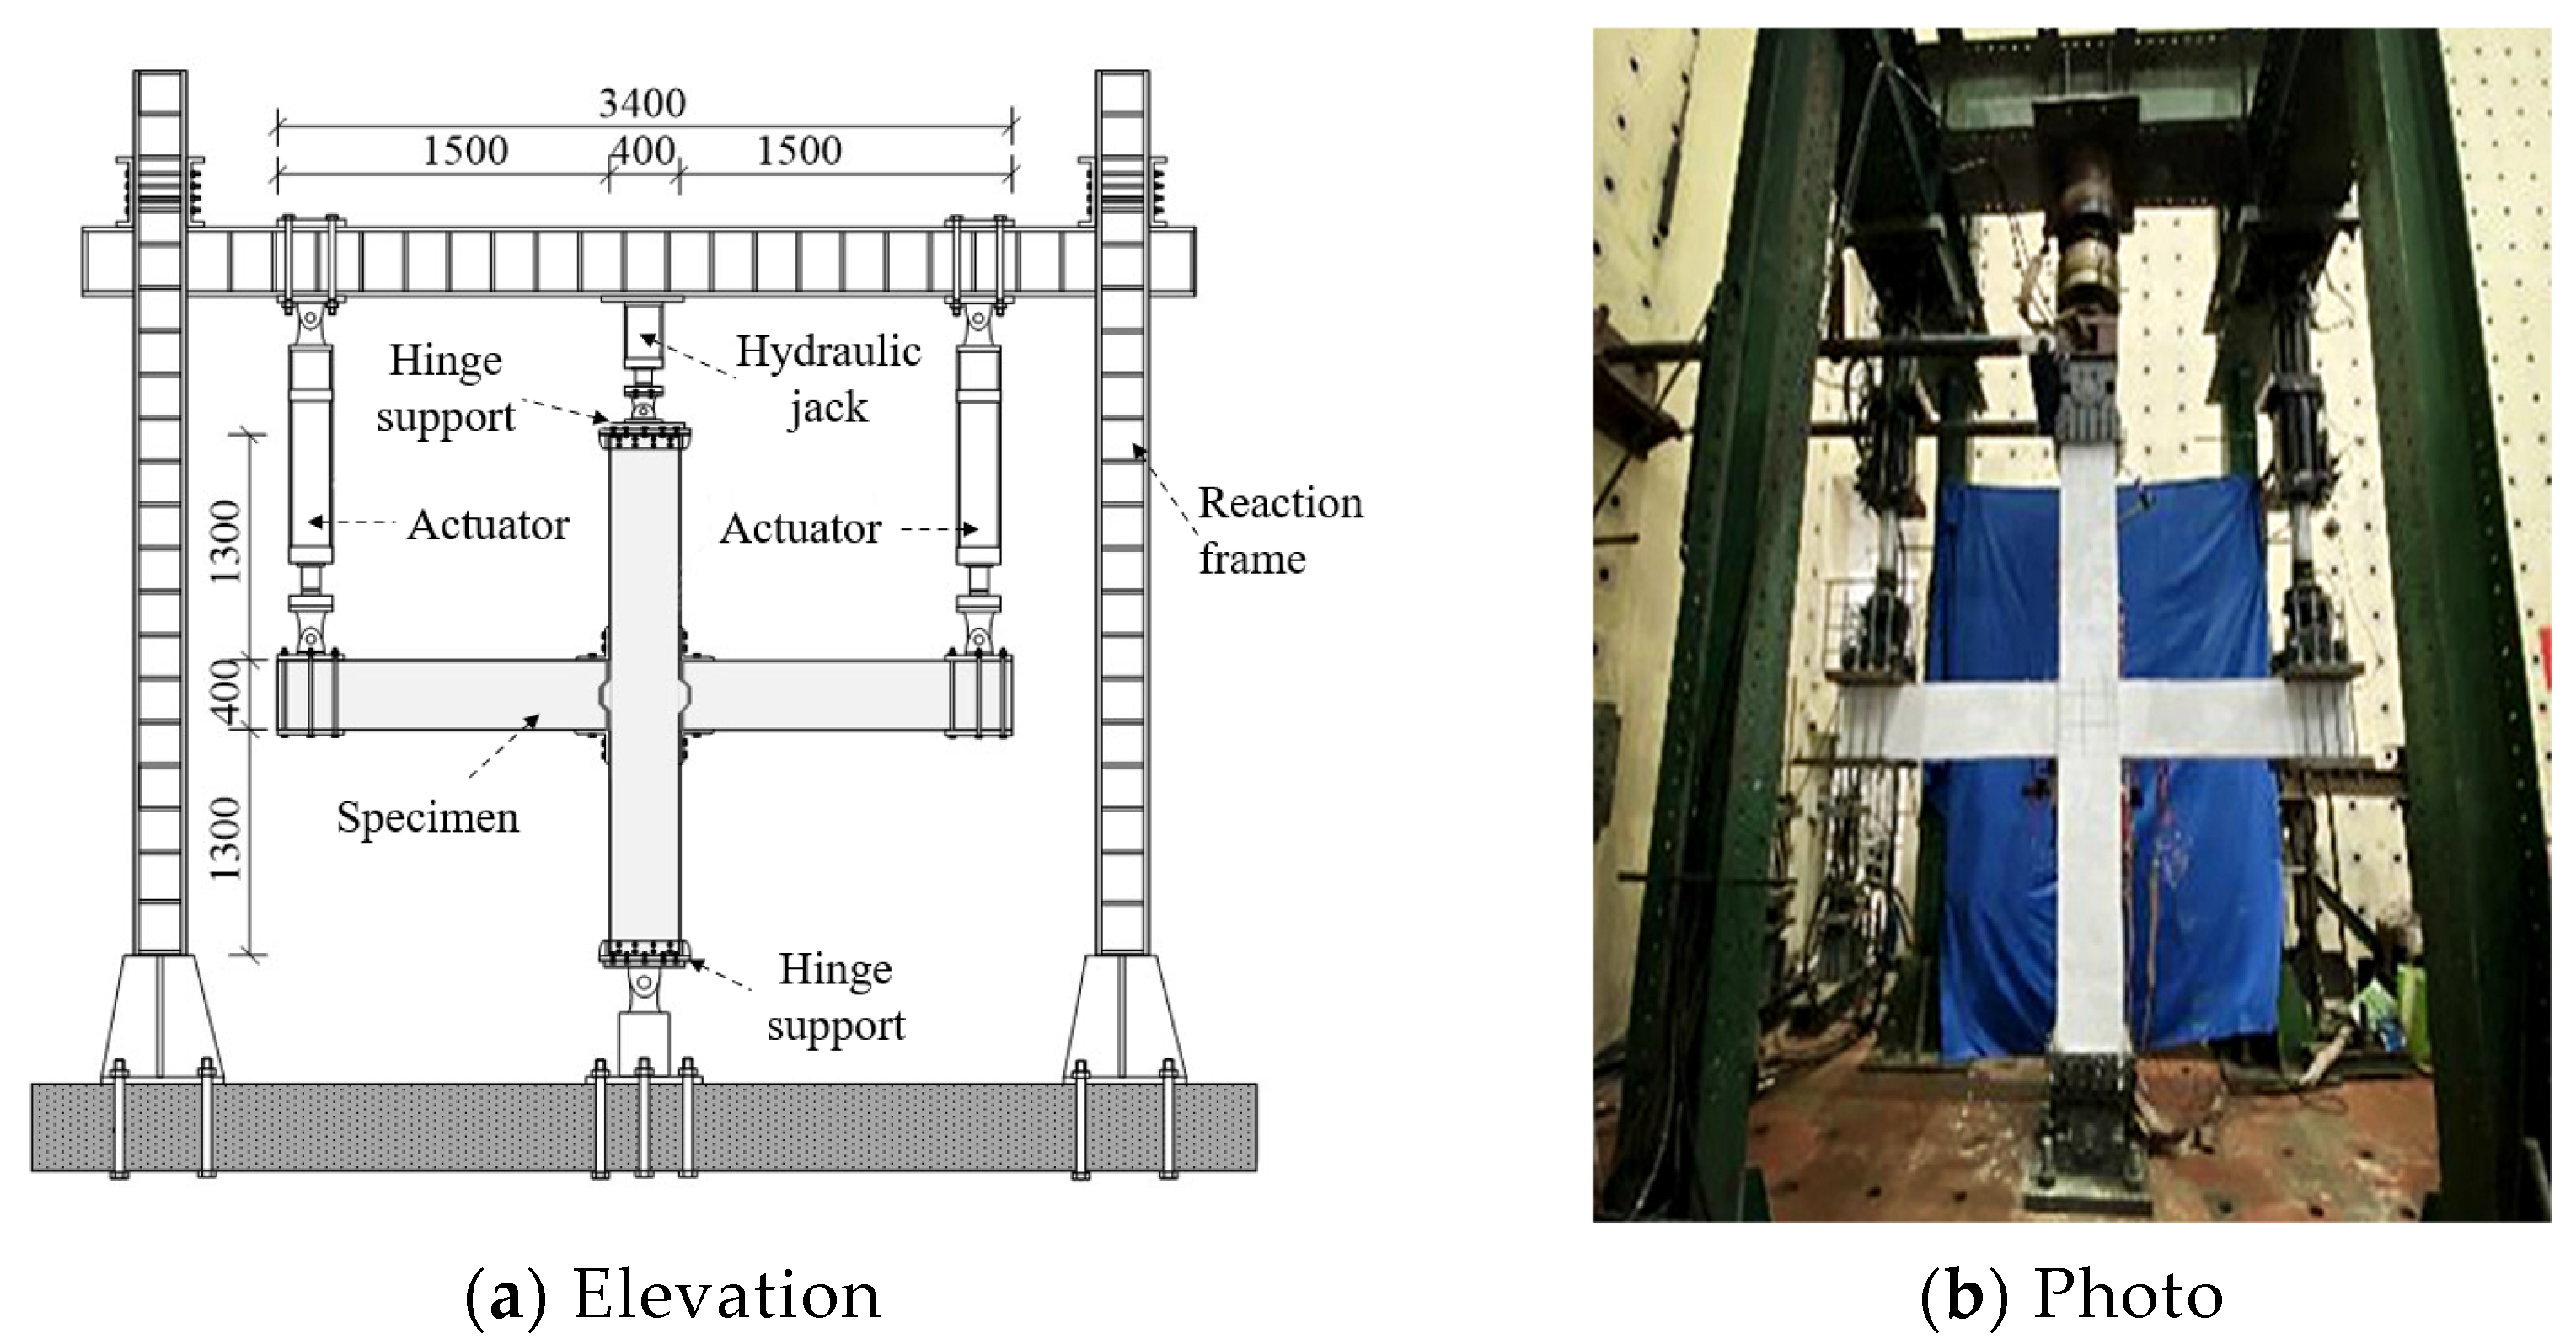
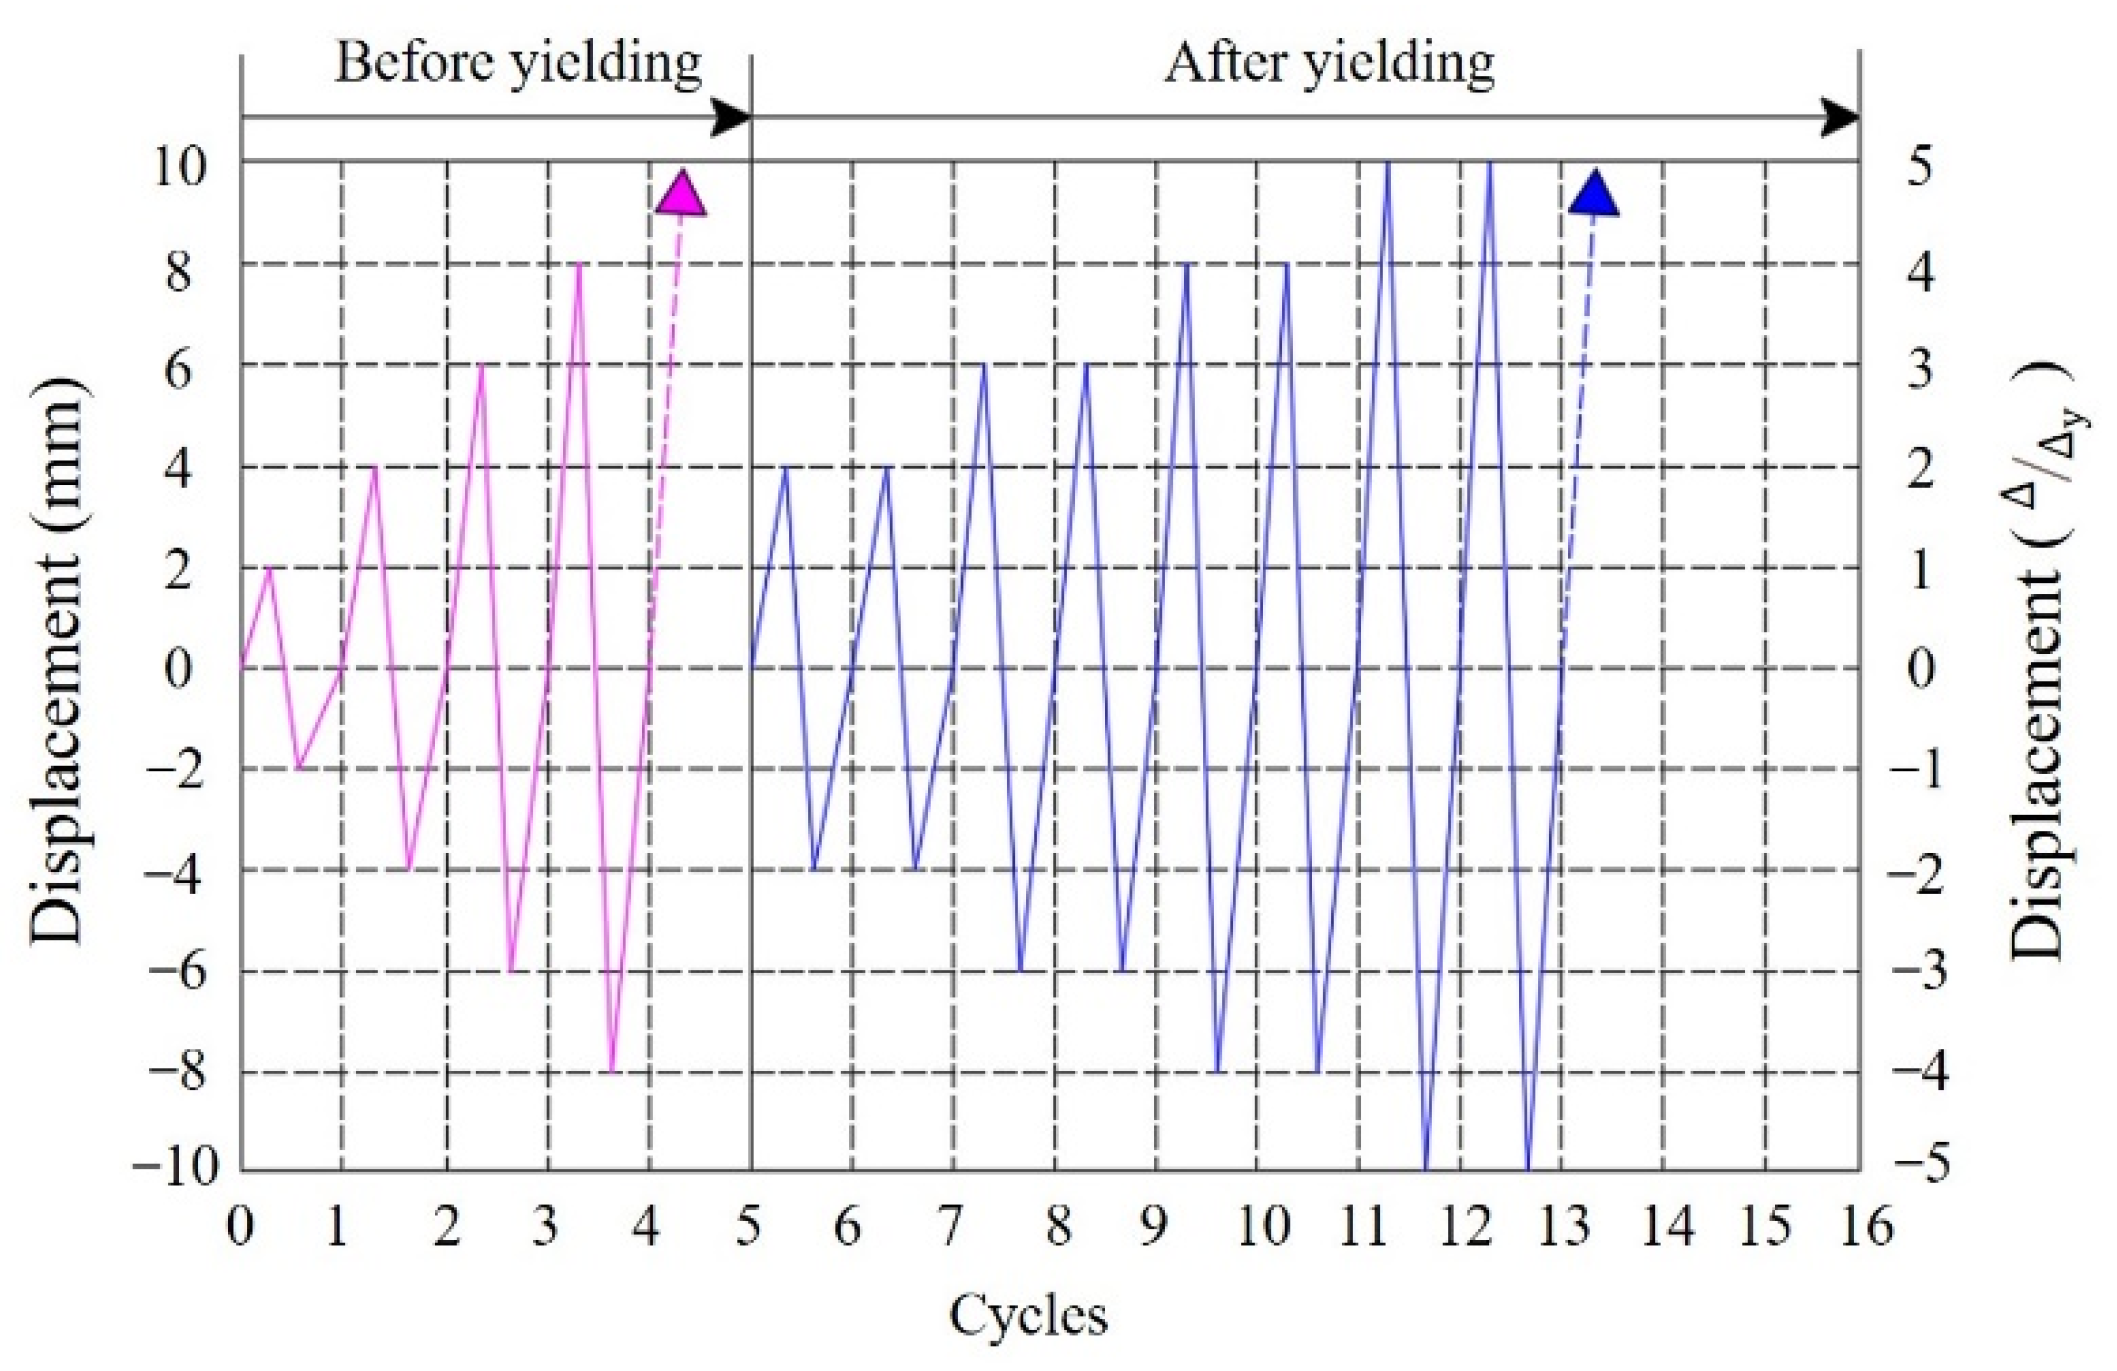
2.4. Test Setup and Loading Procedure
3. Test Results
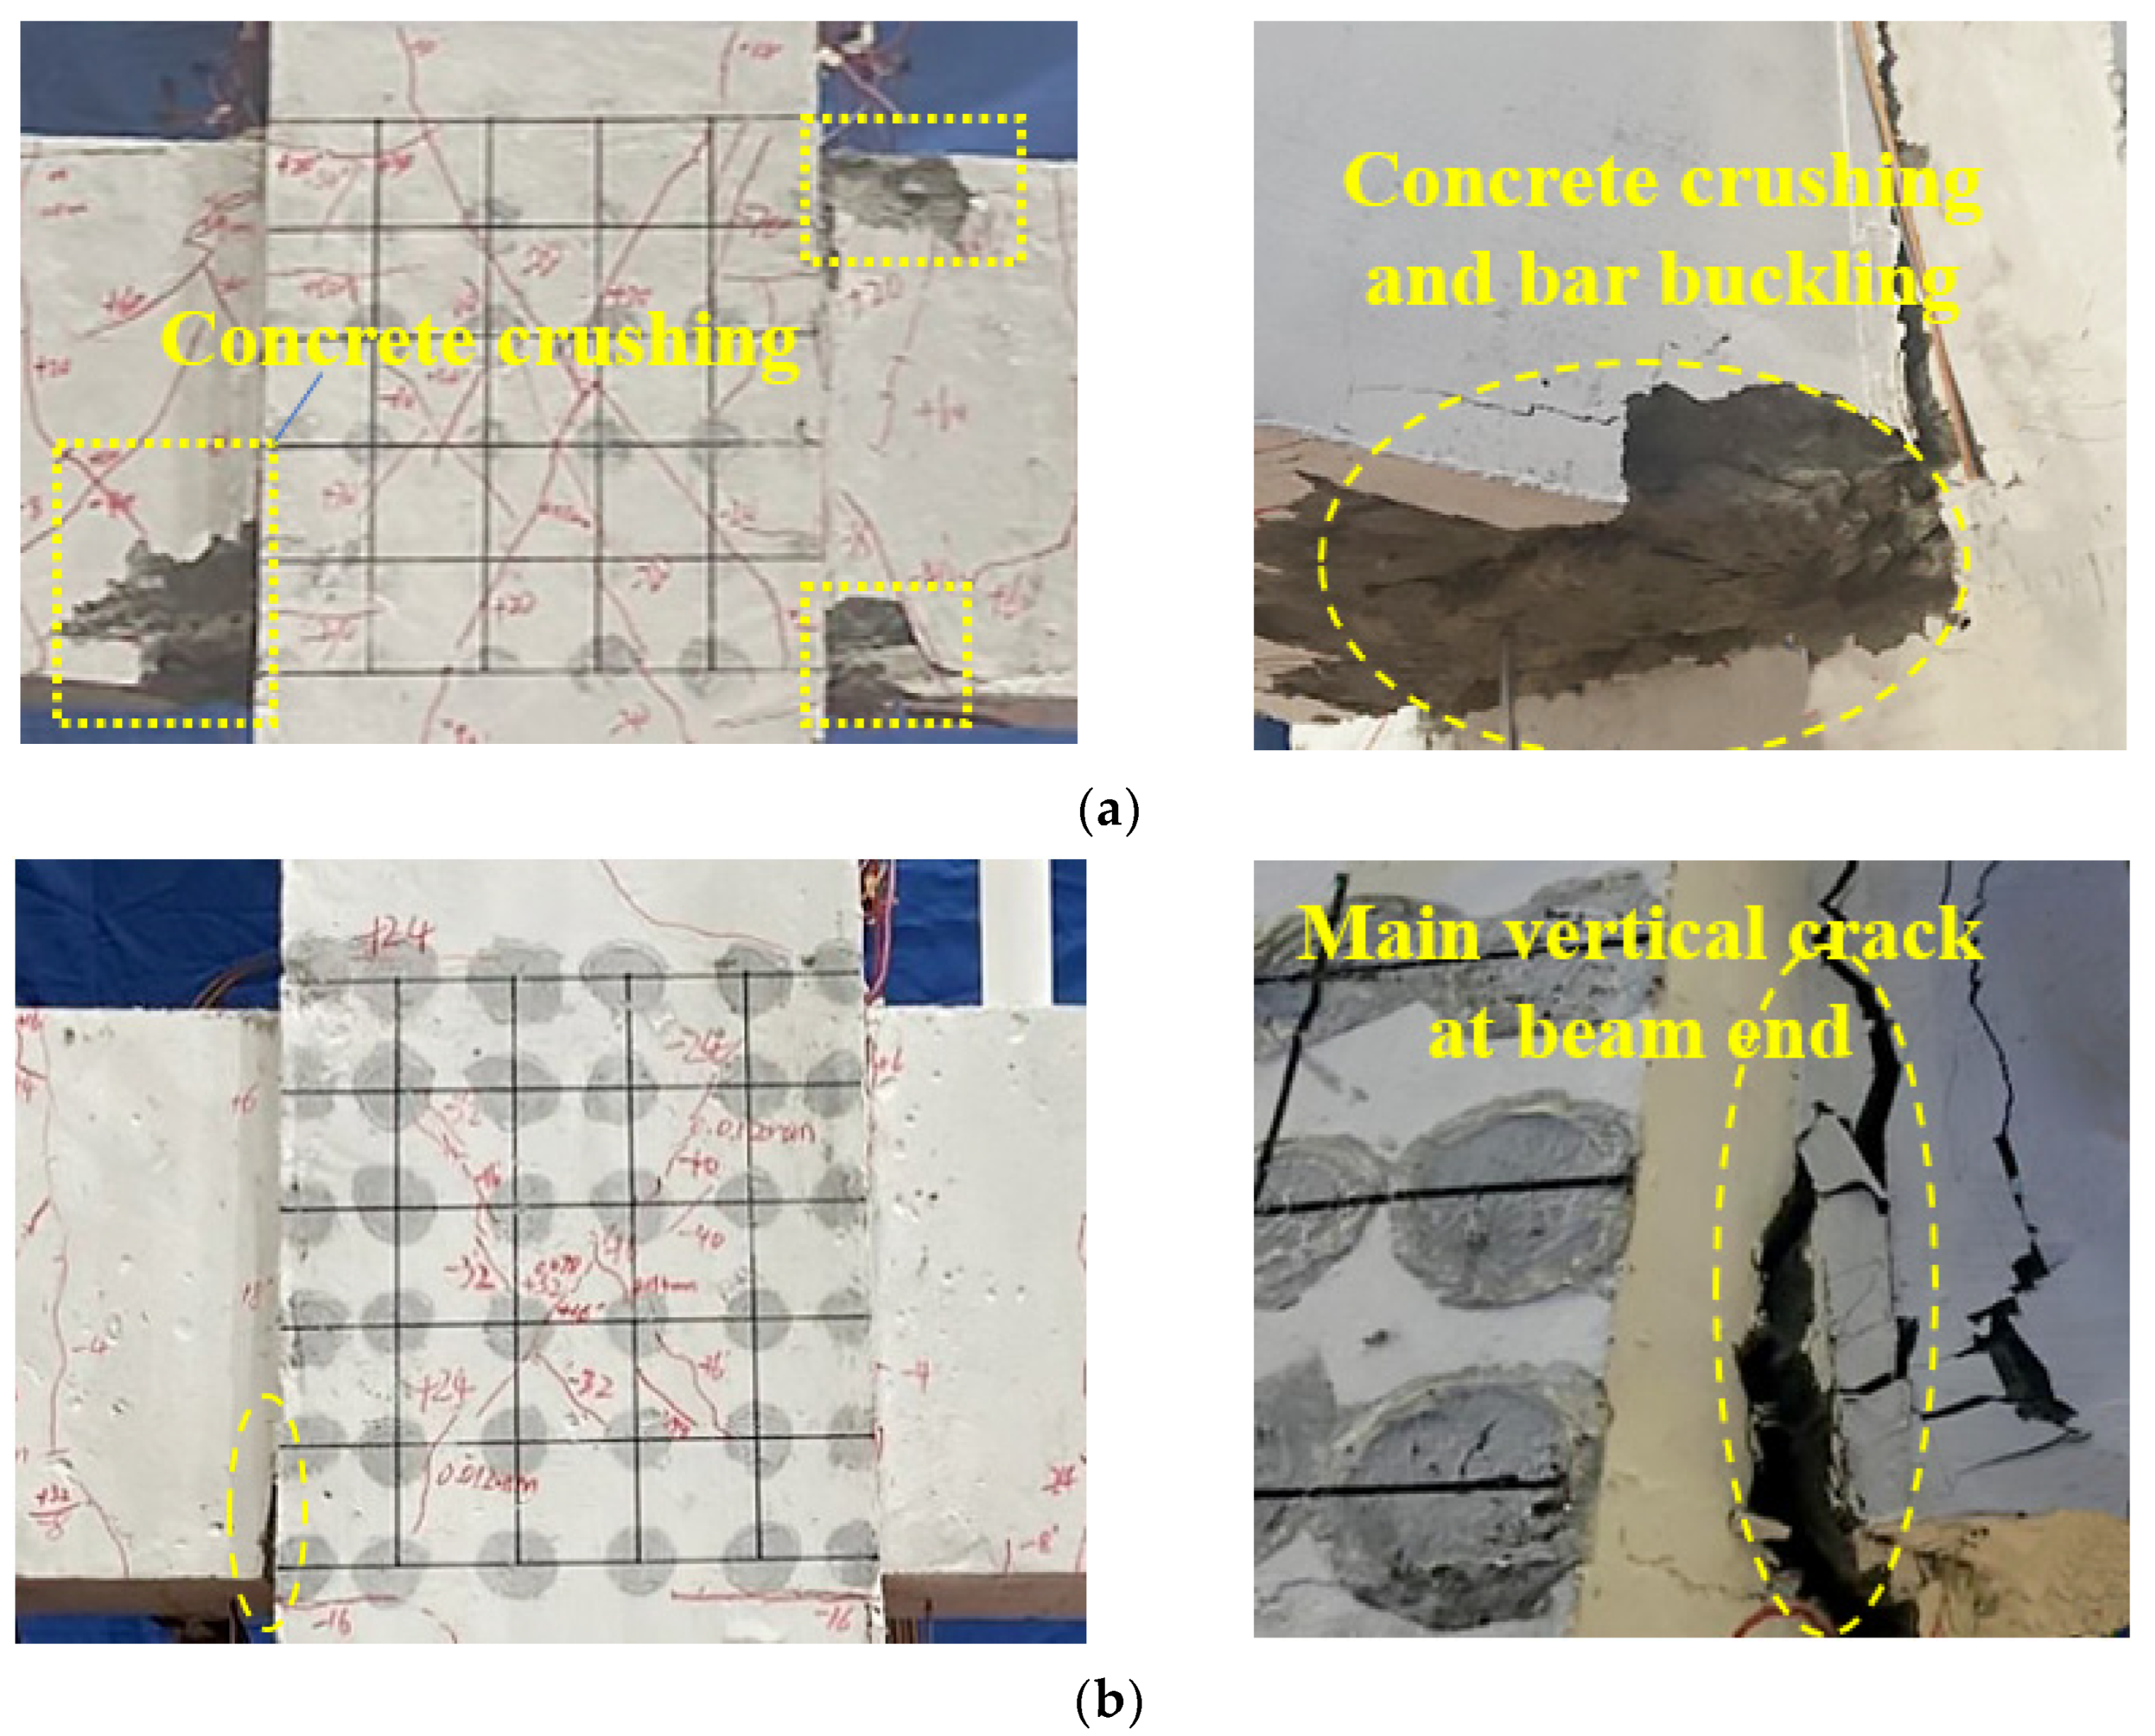
3.1. General Observations
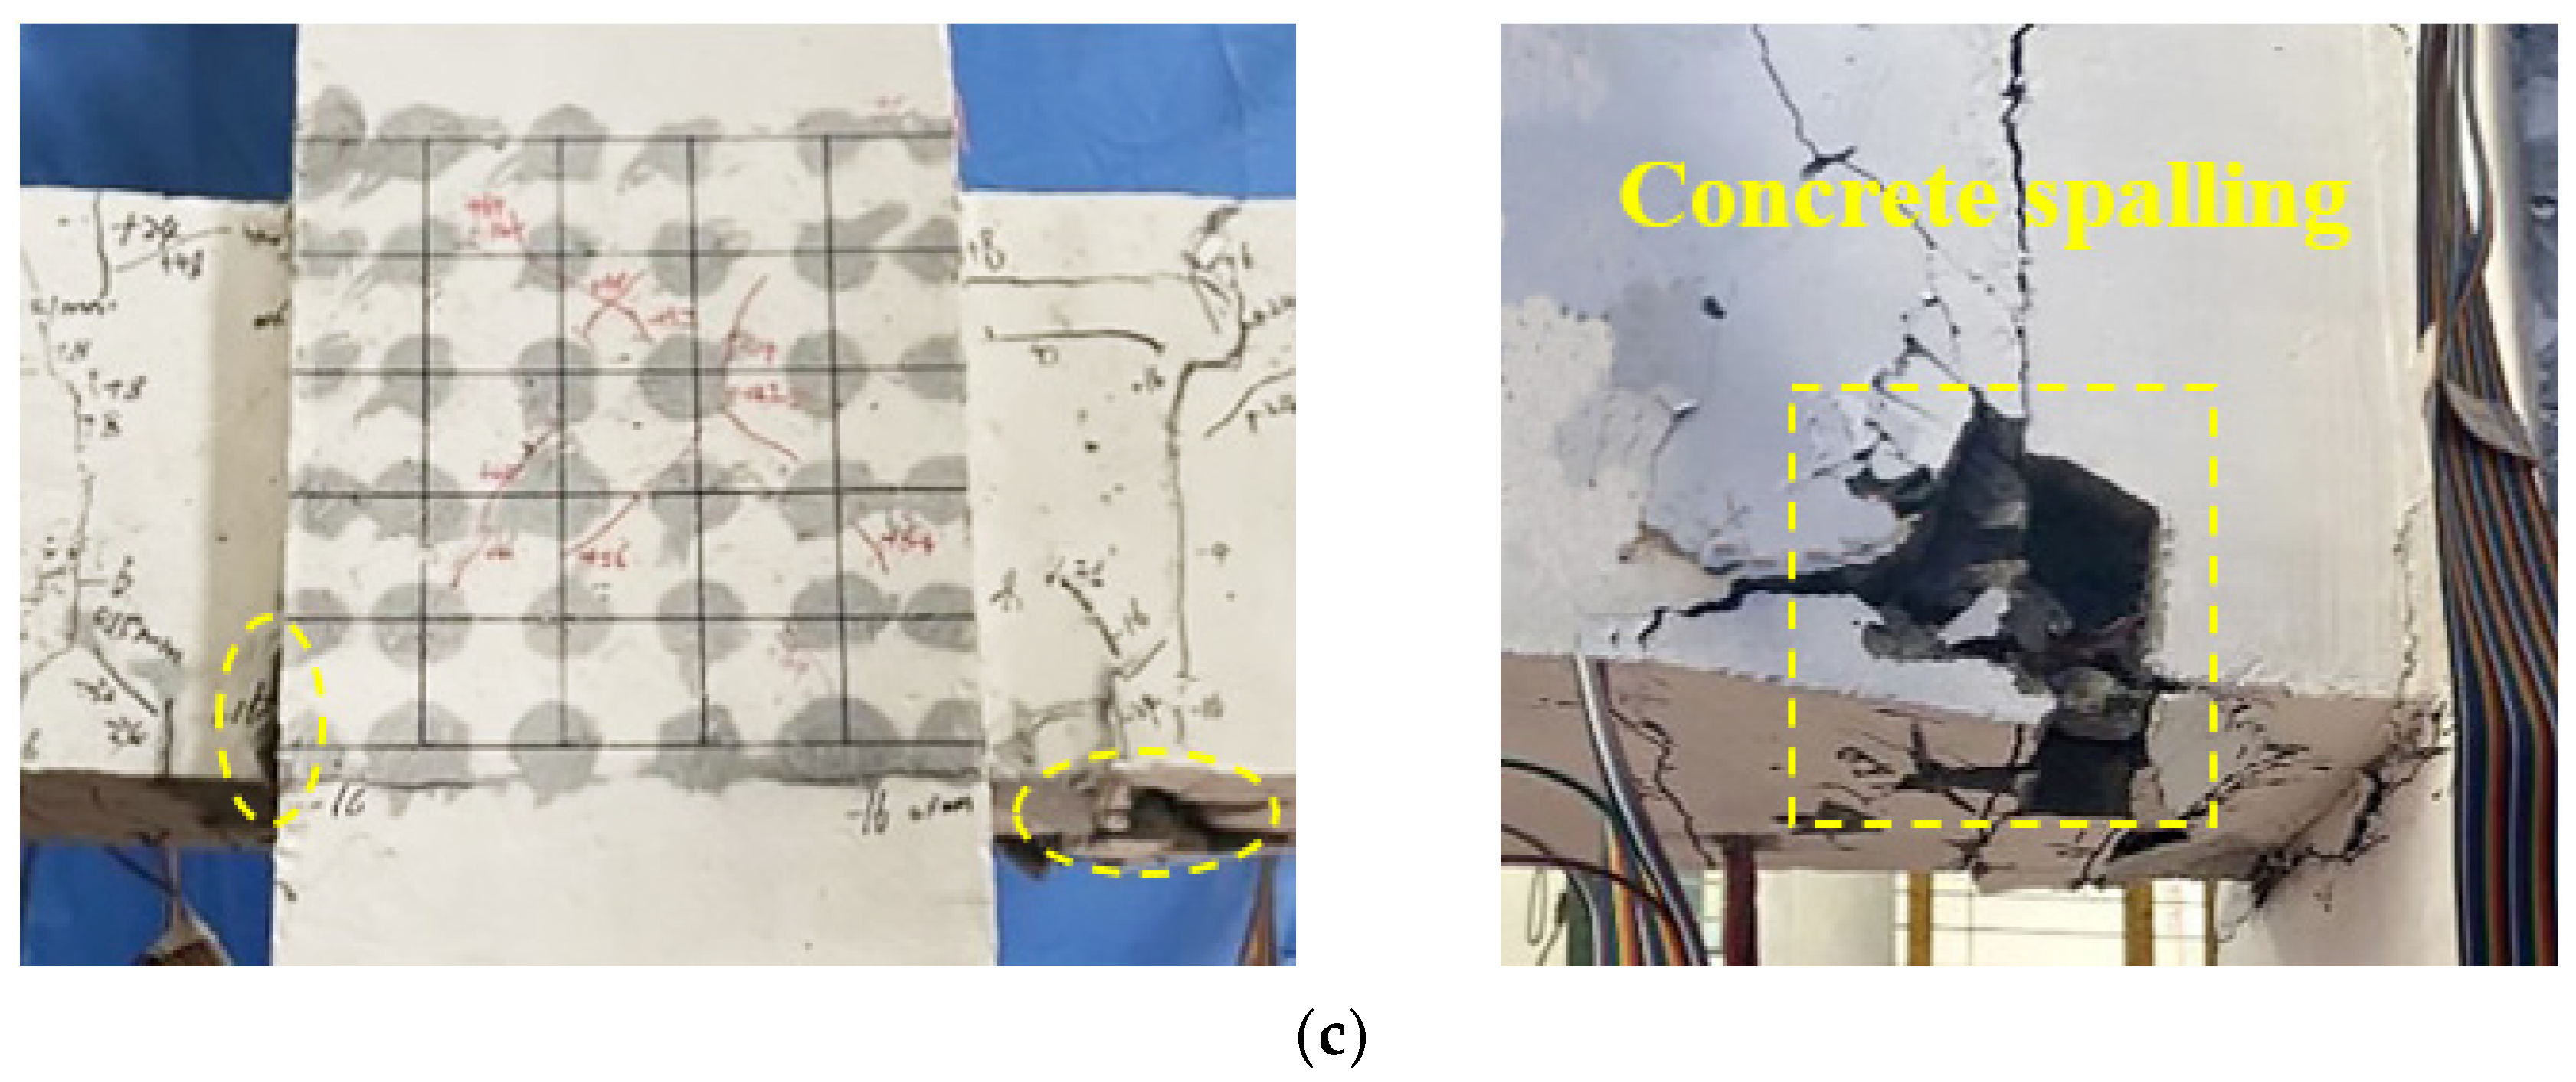
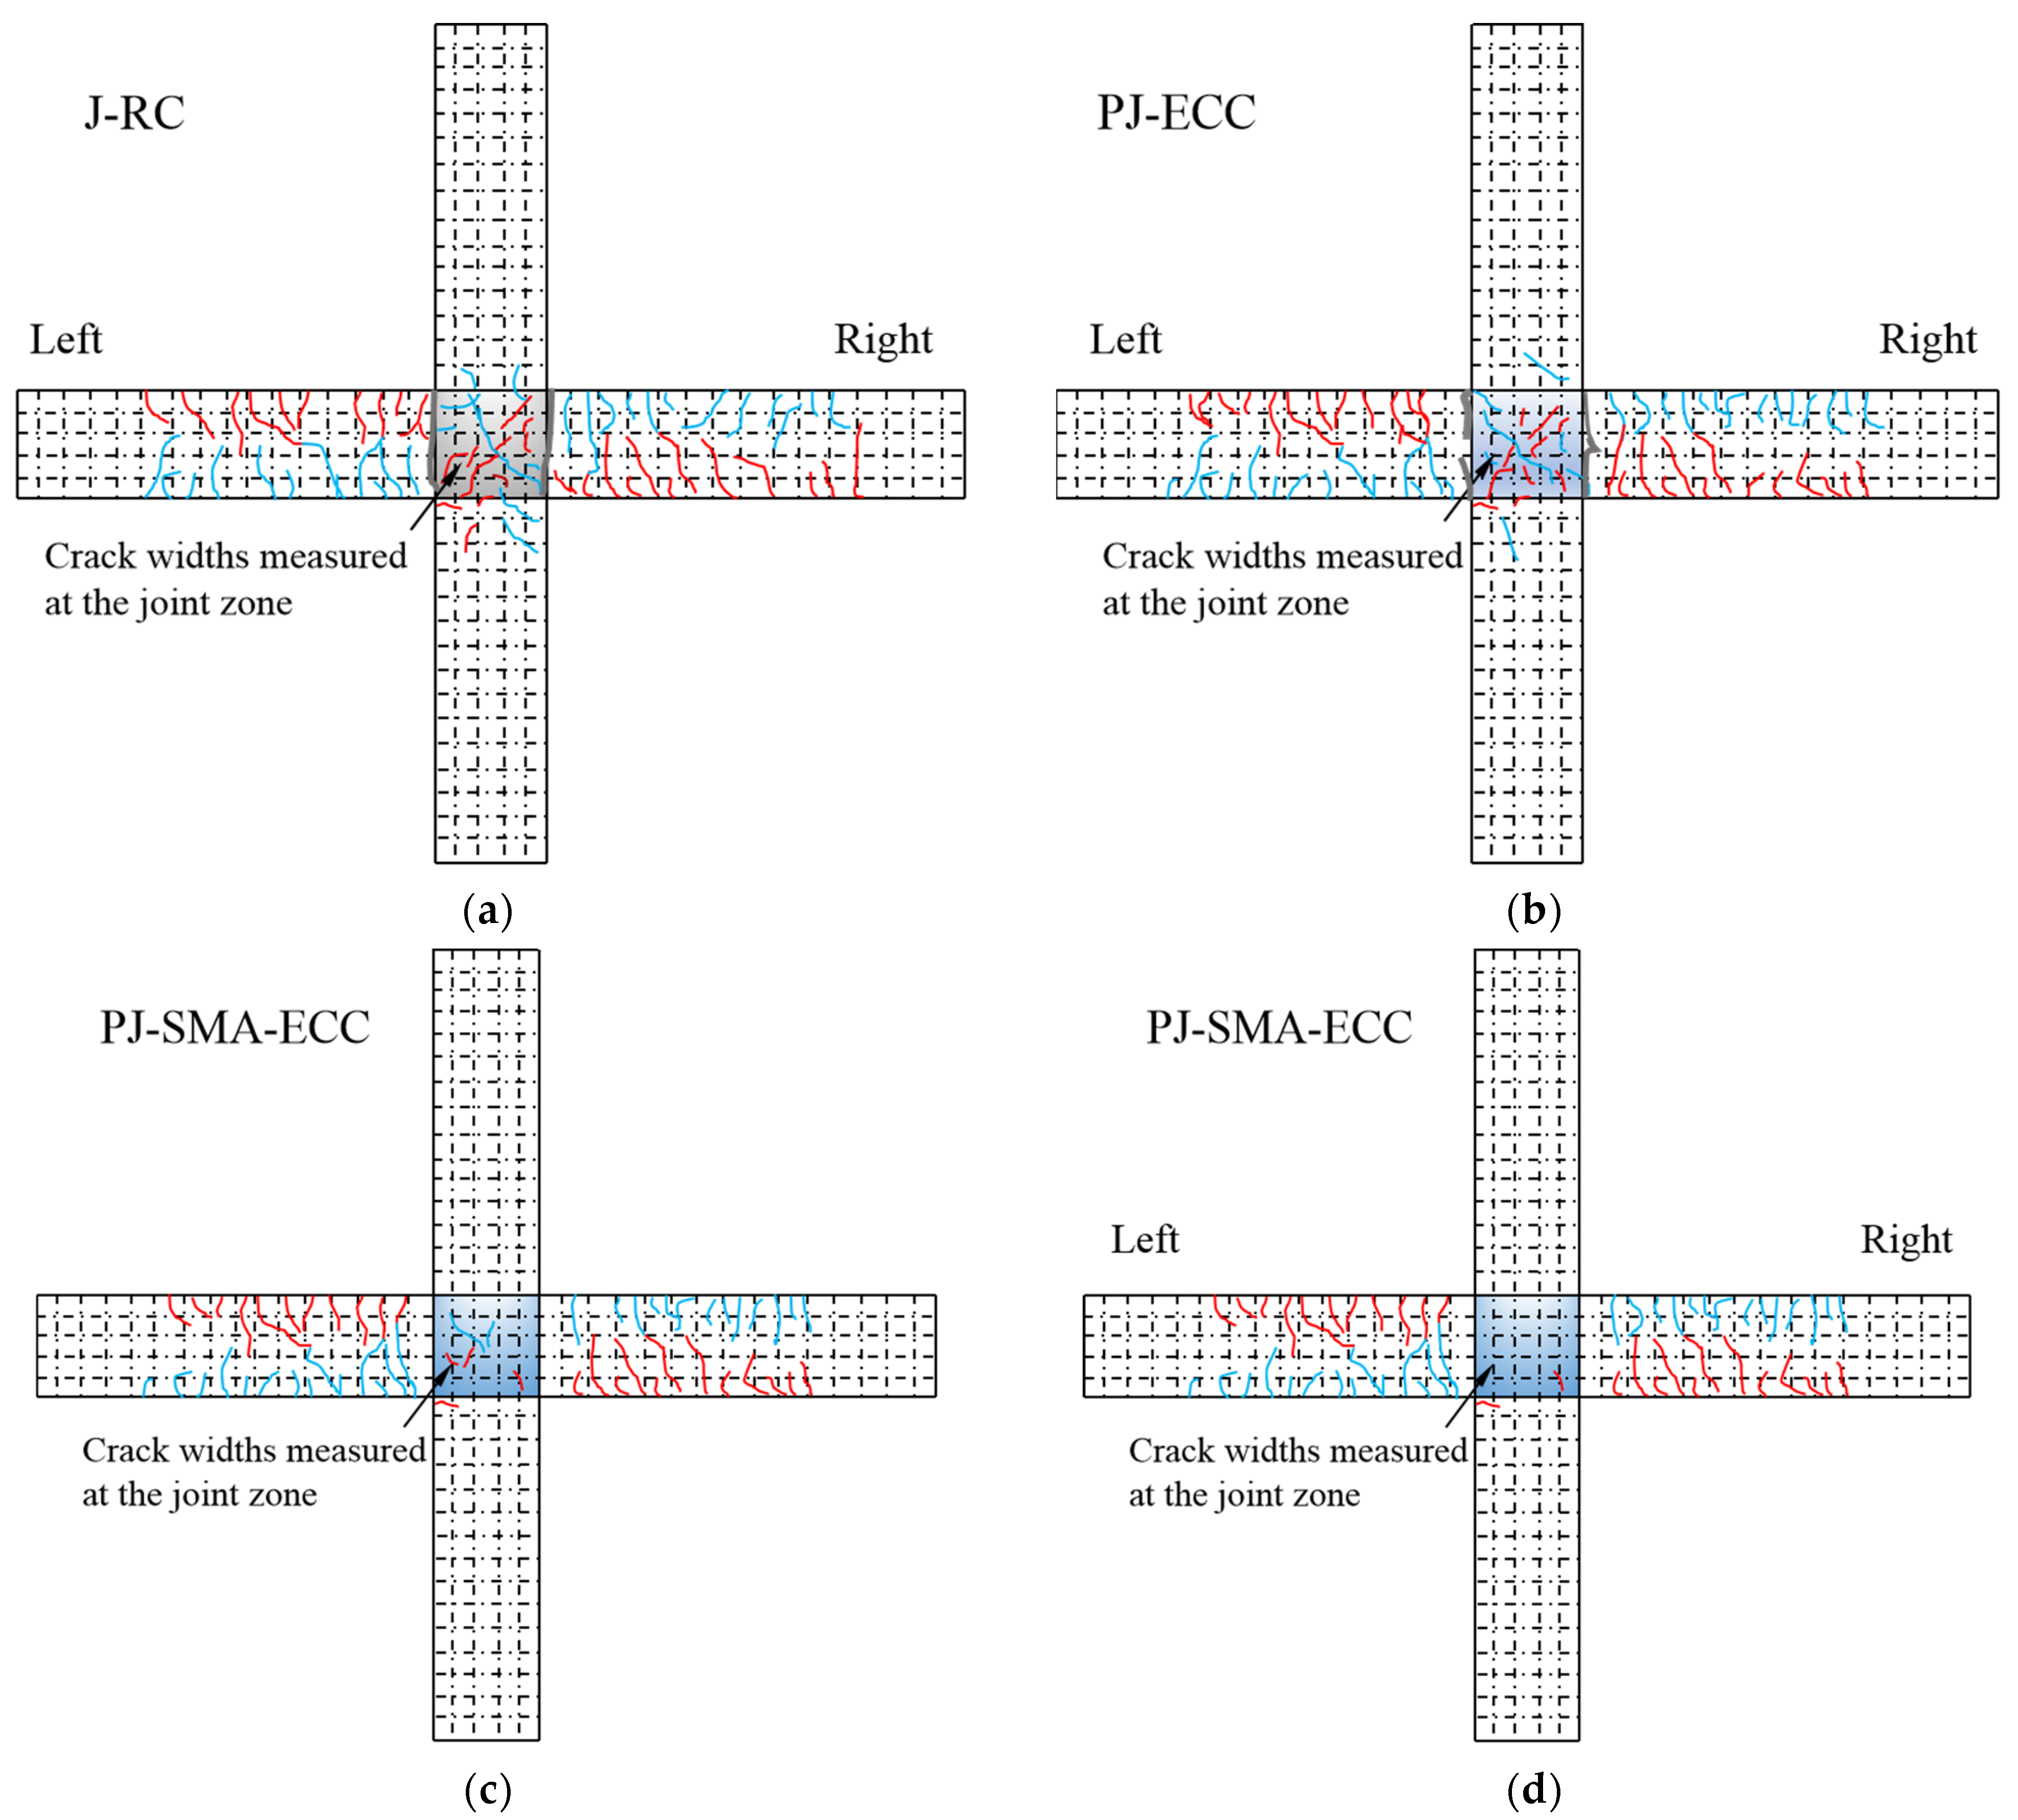
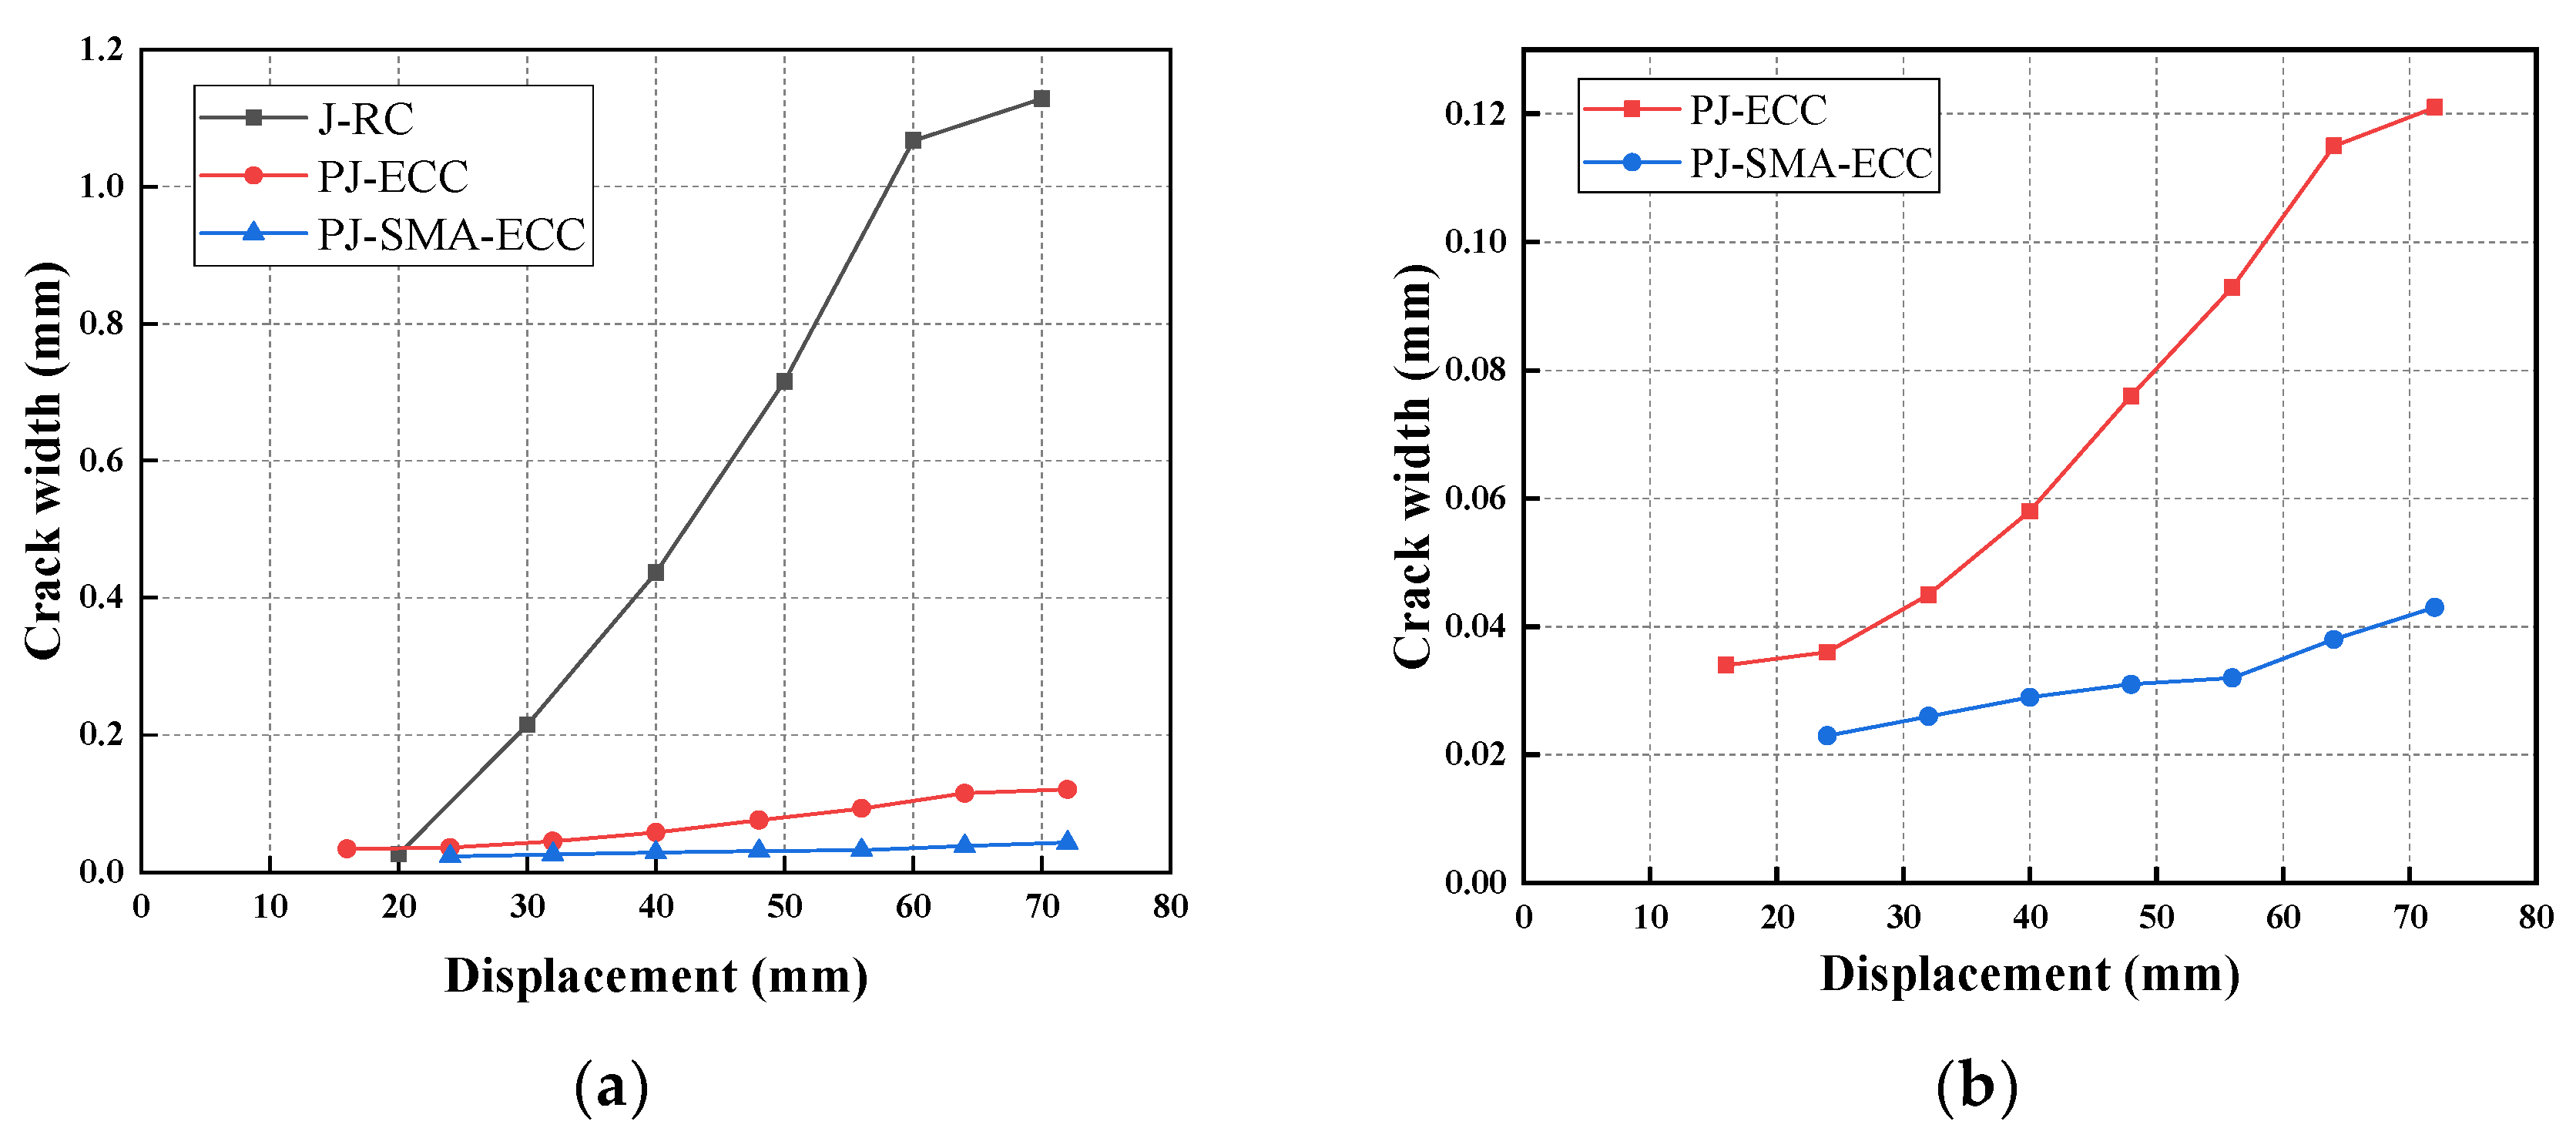
3.2. Crack Pattern
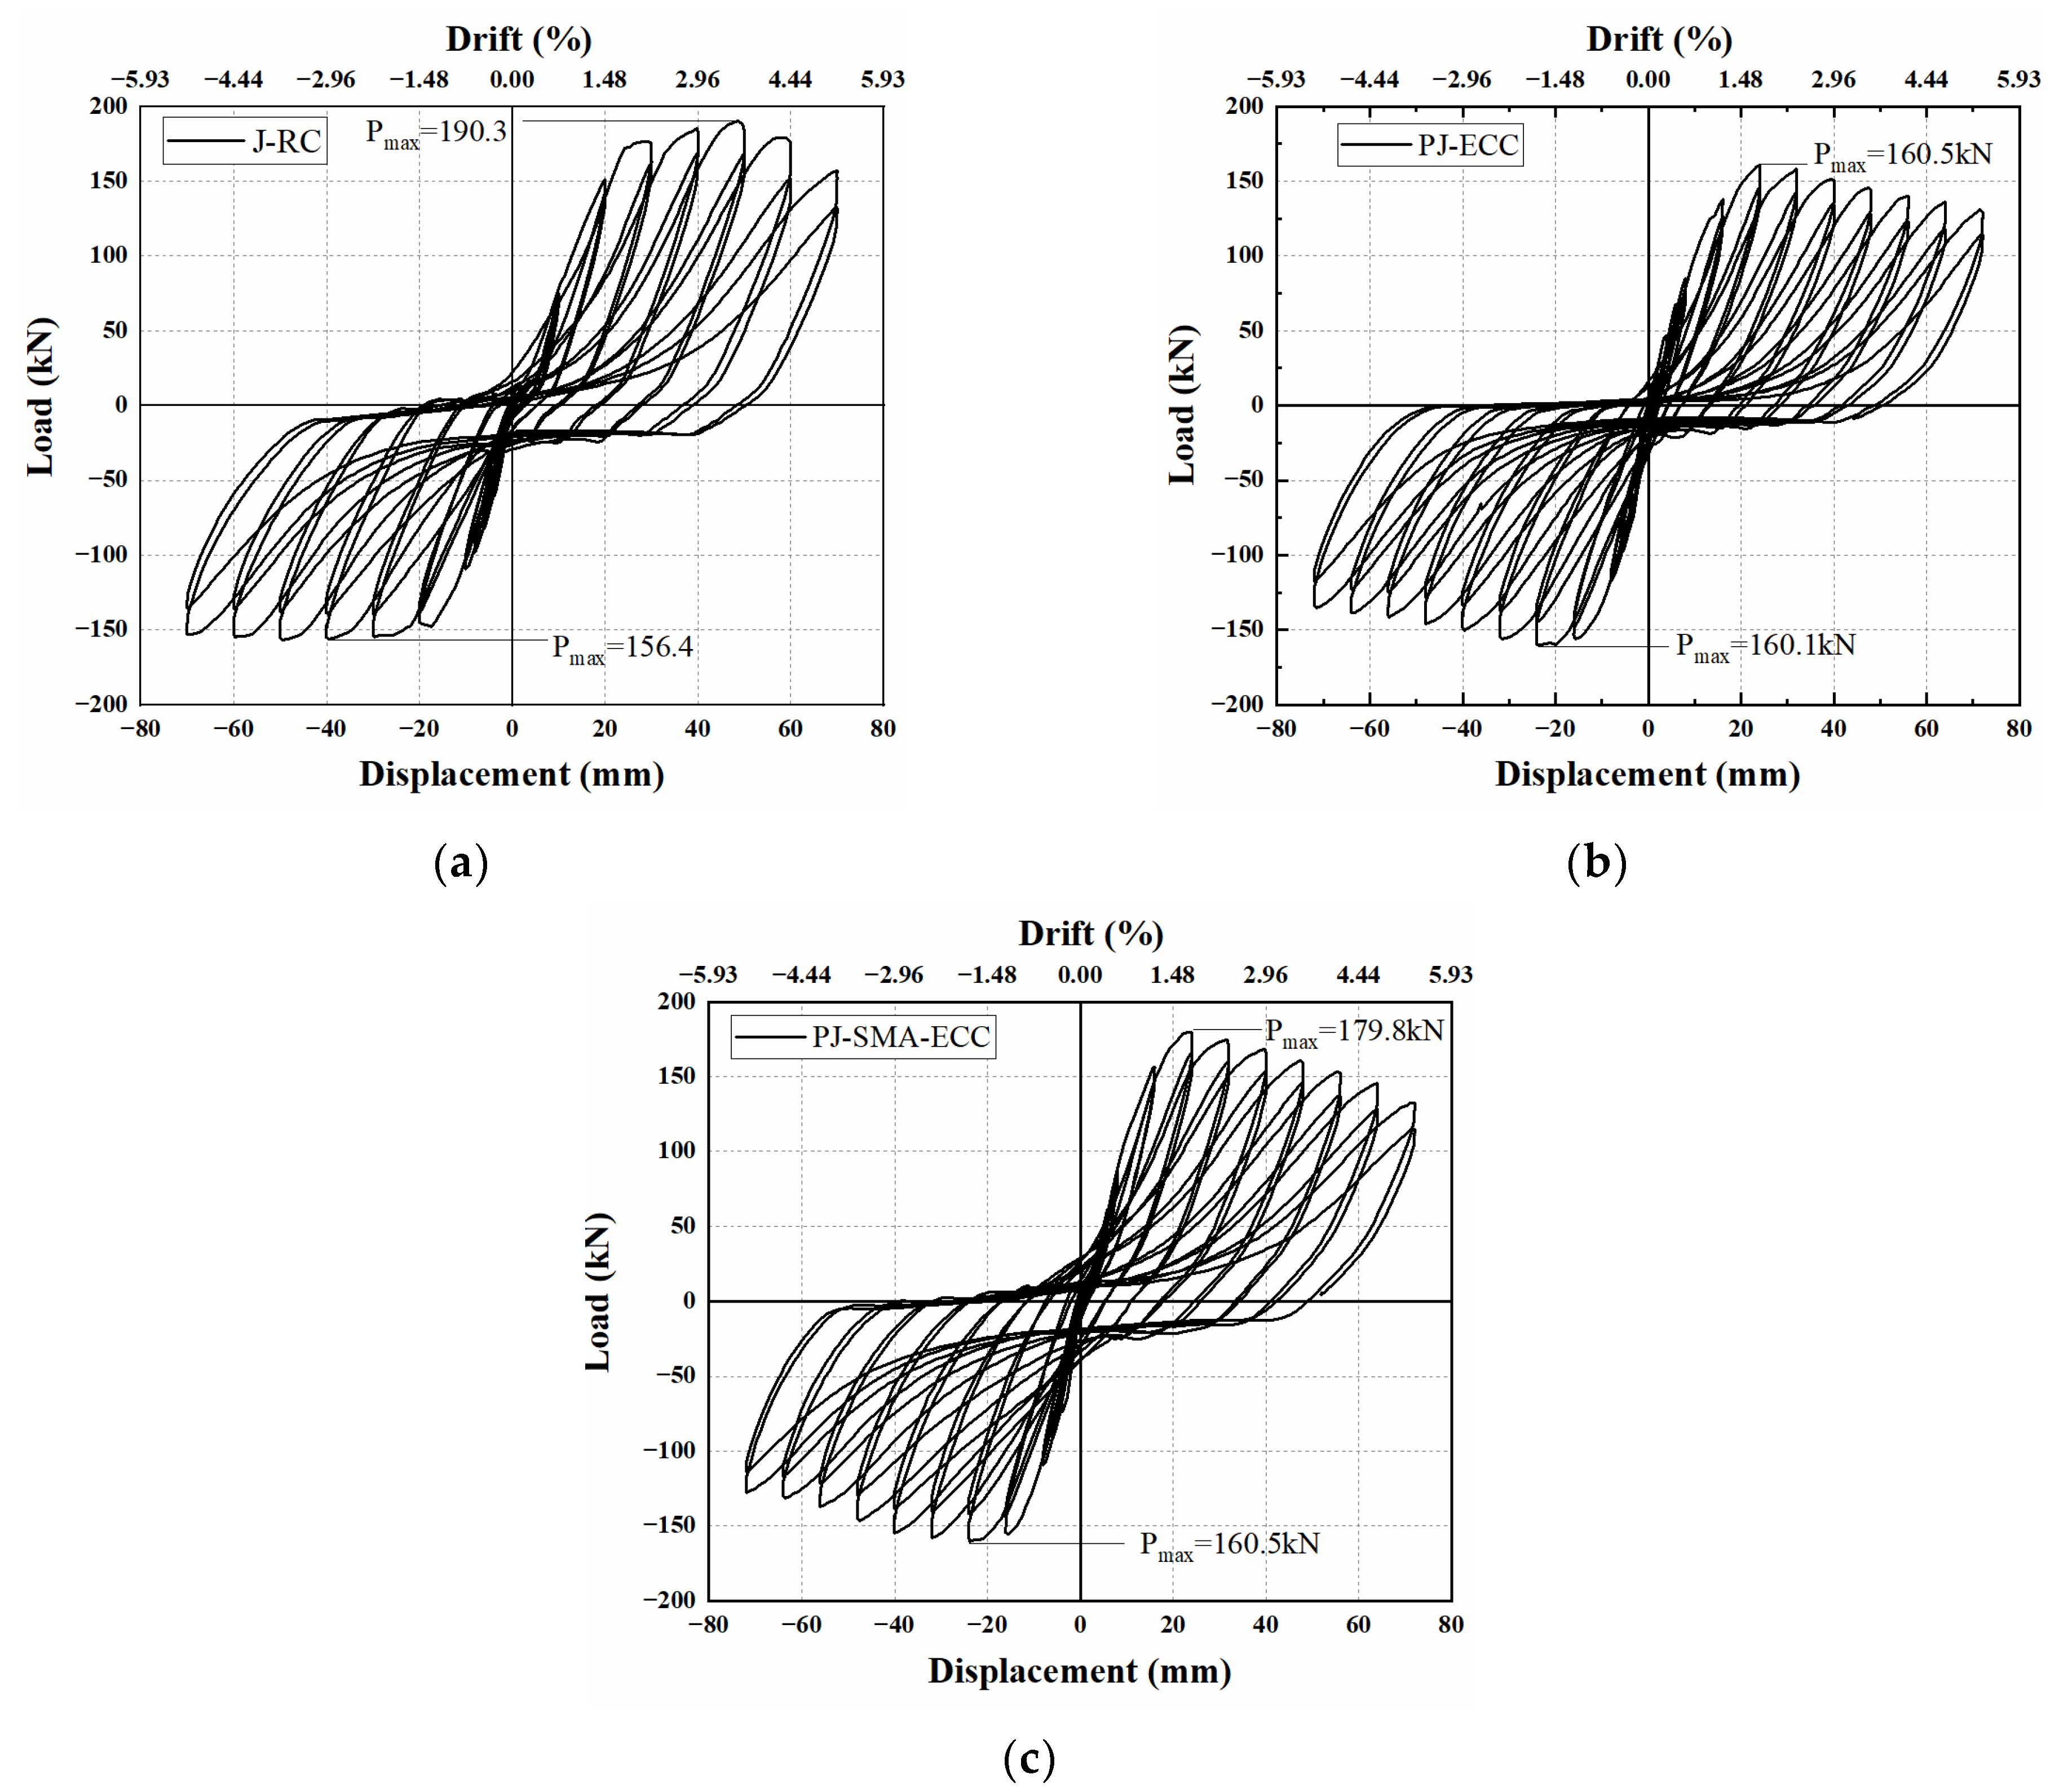
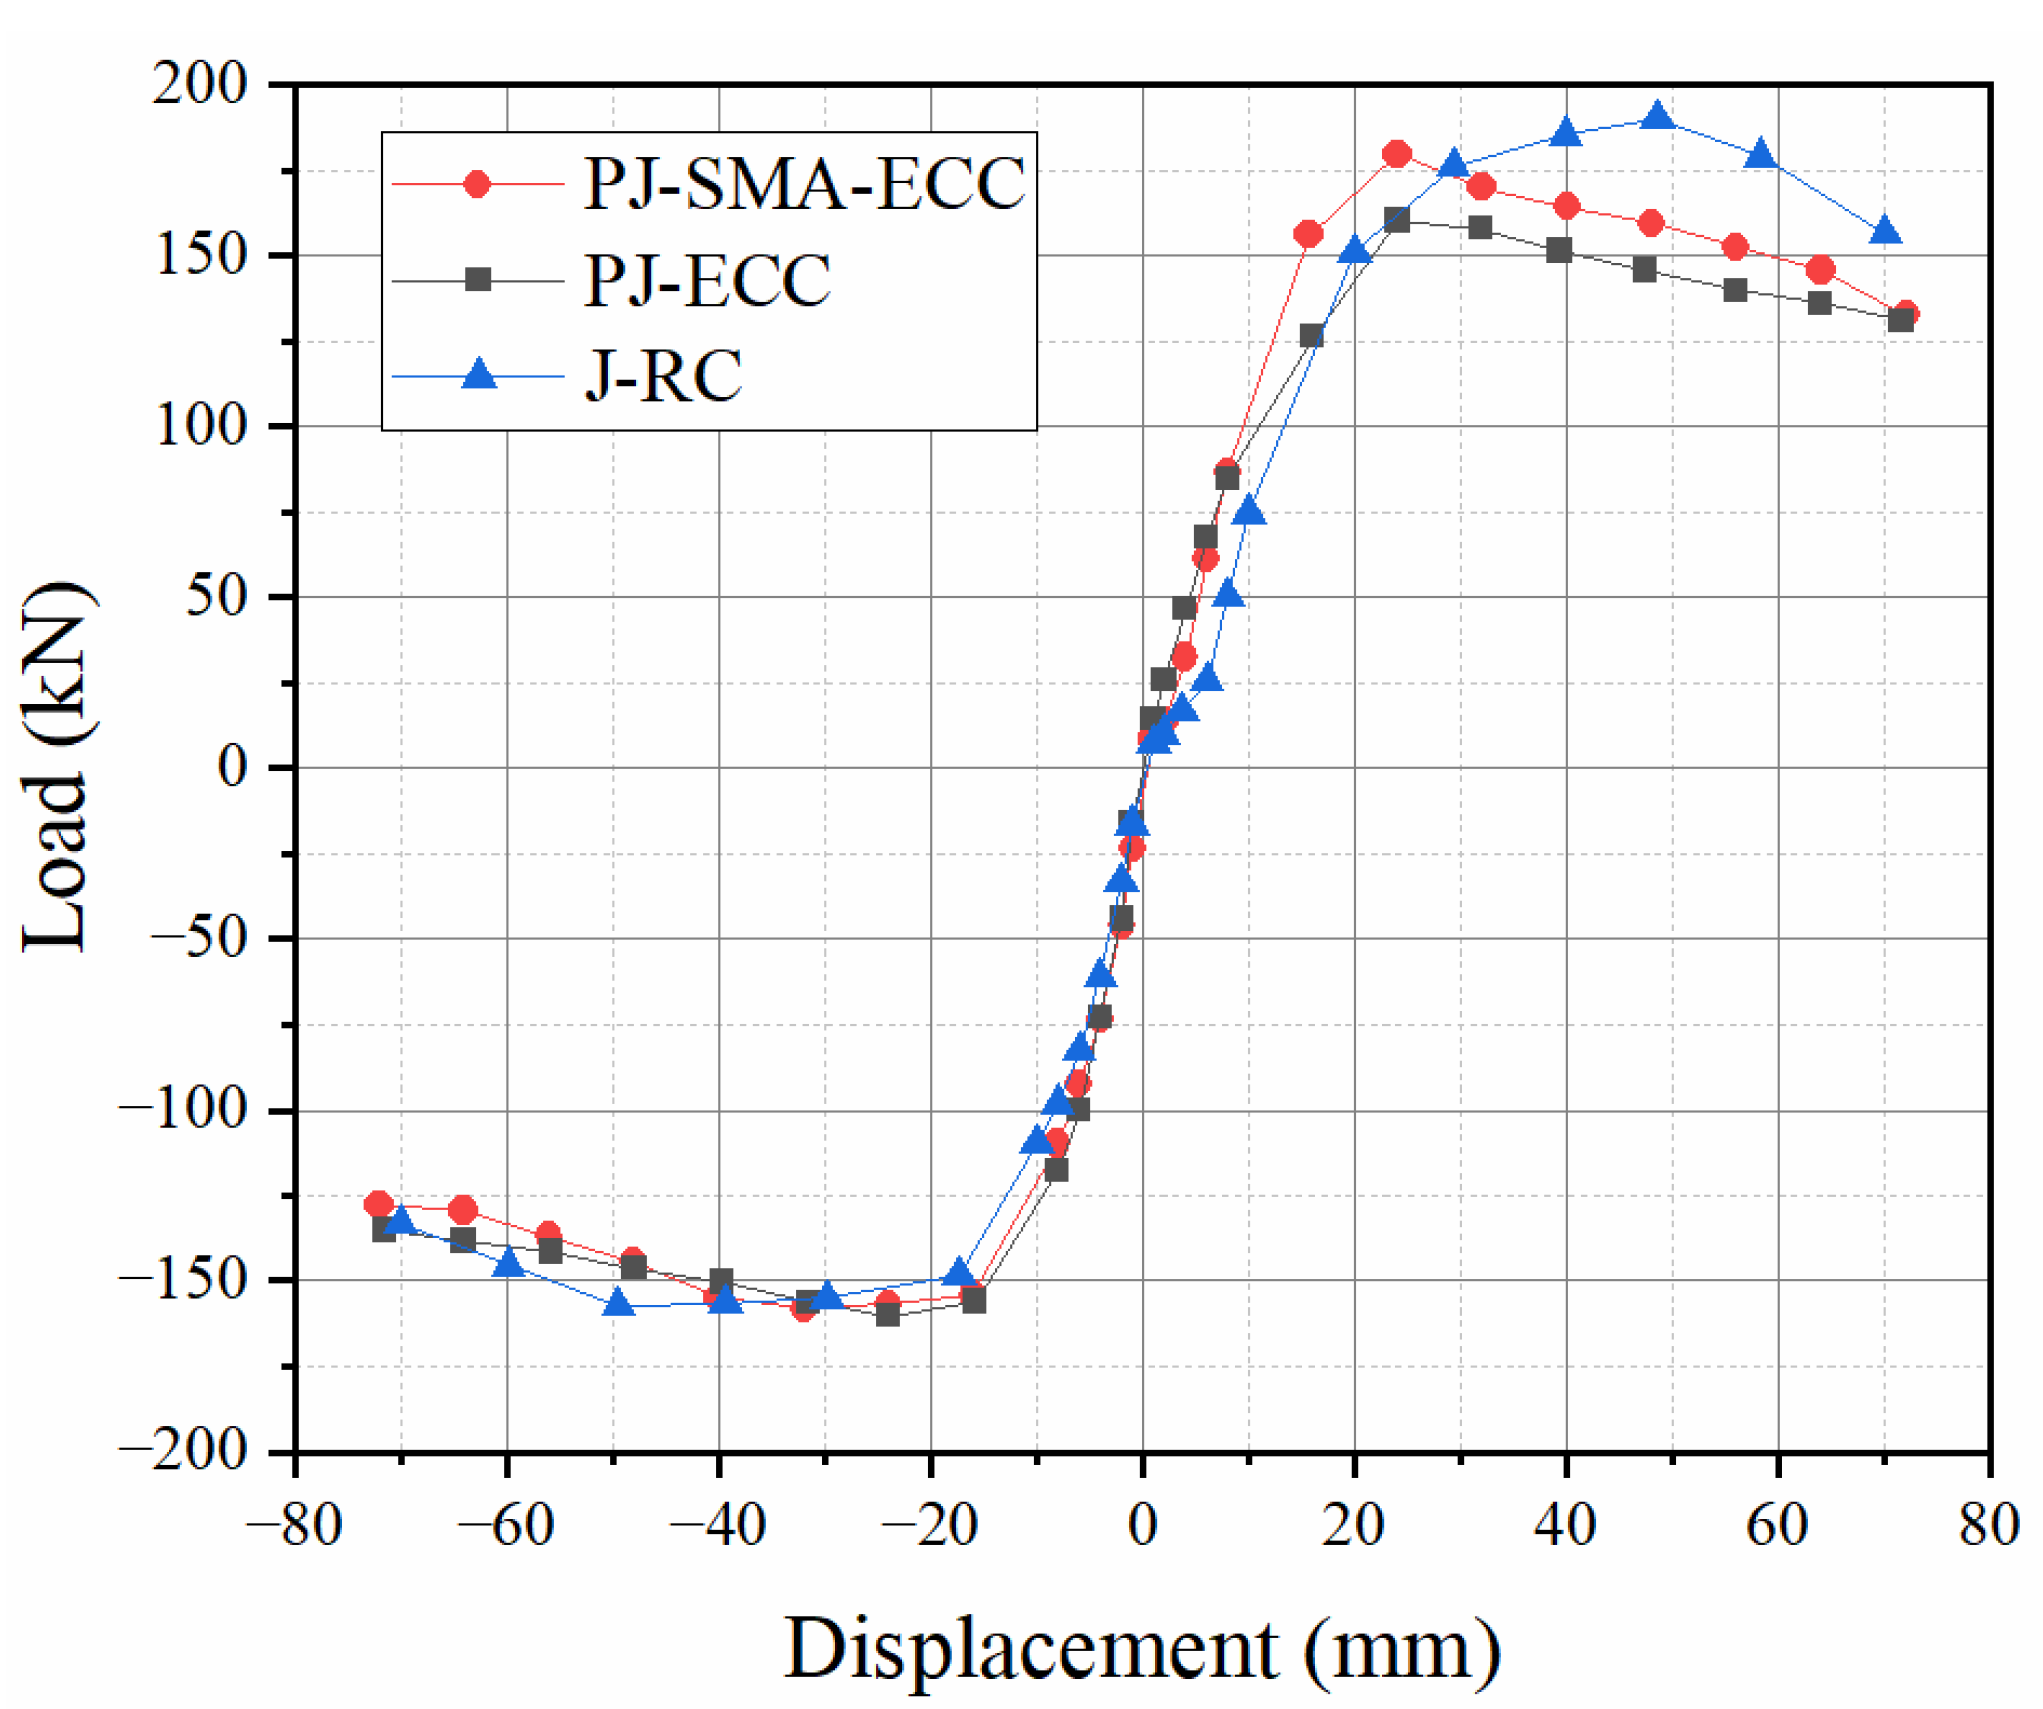
3.3. Load-Displacement Curves
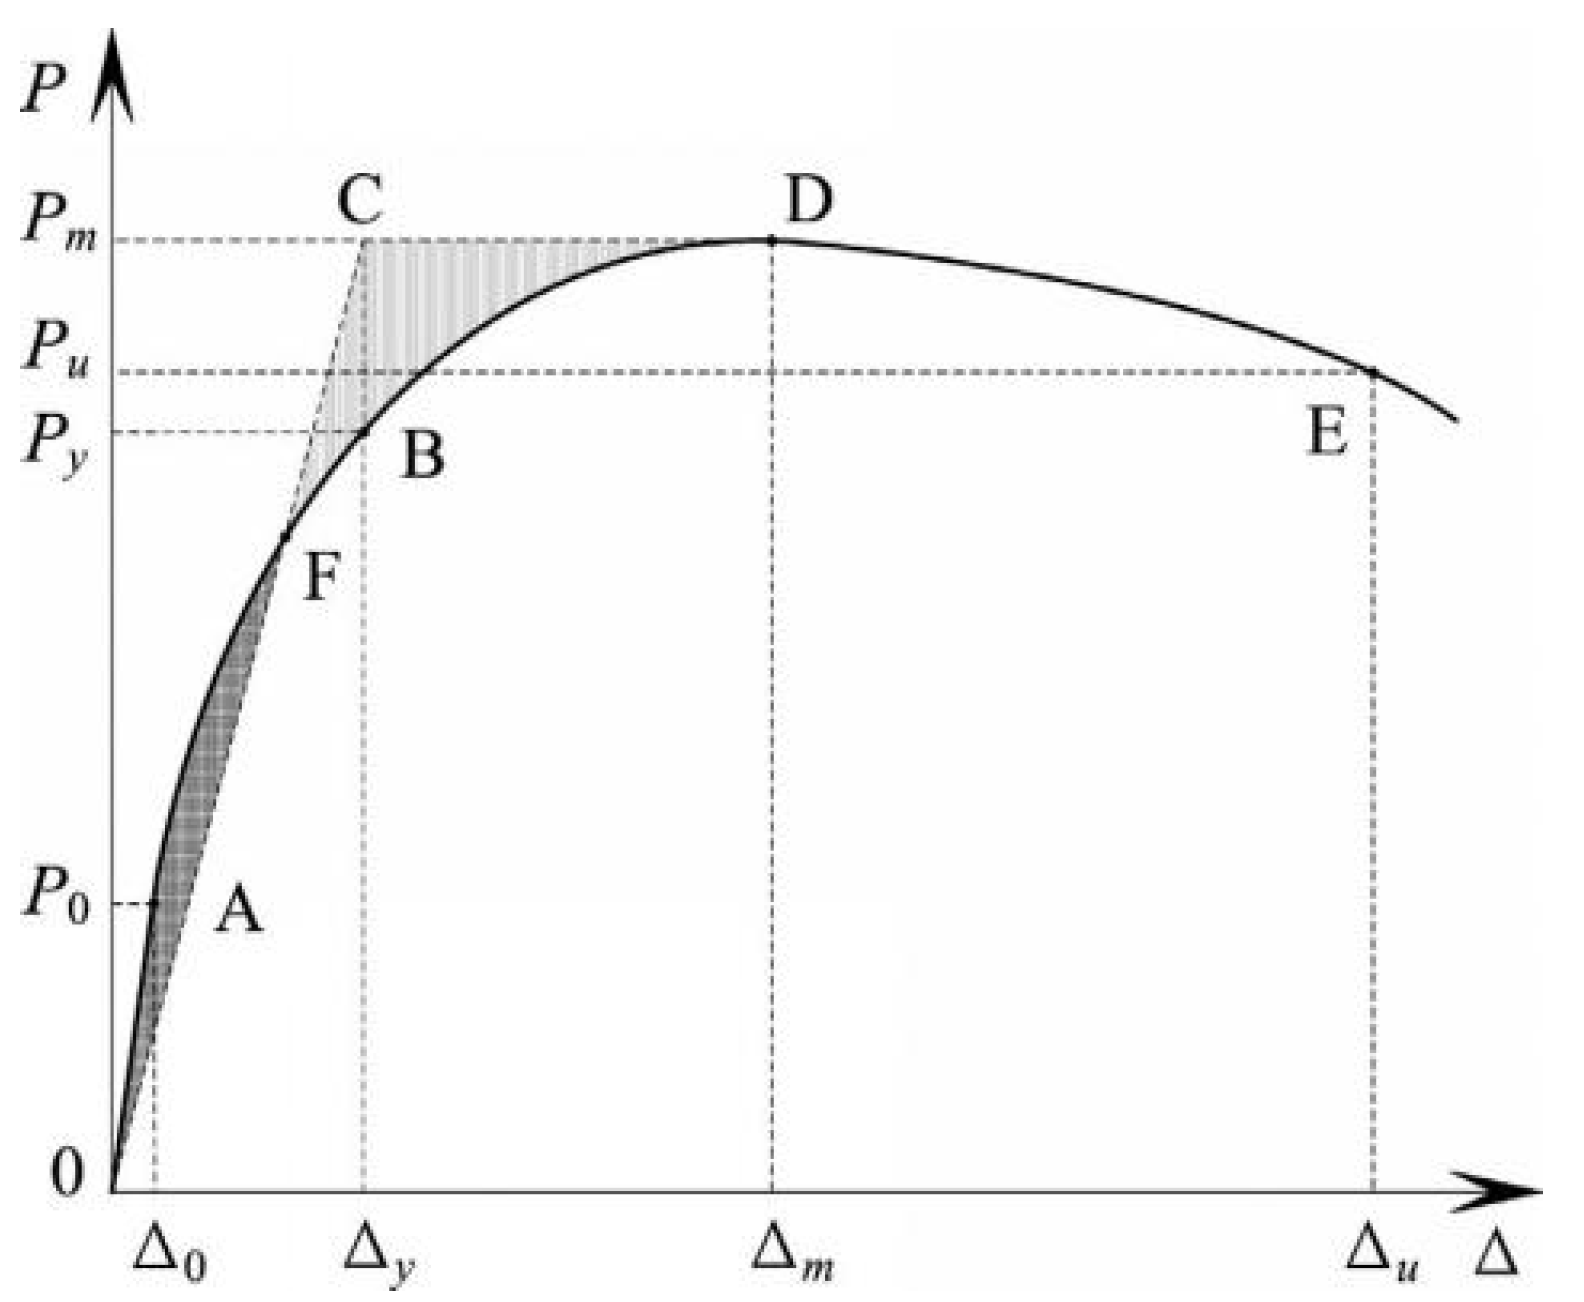
3.4. Strength, Displacement, and Ductility
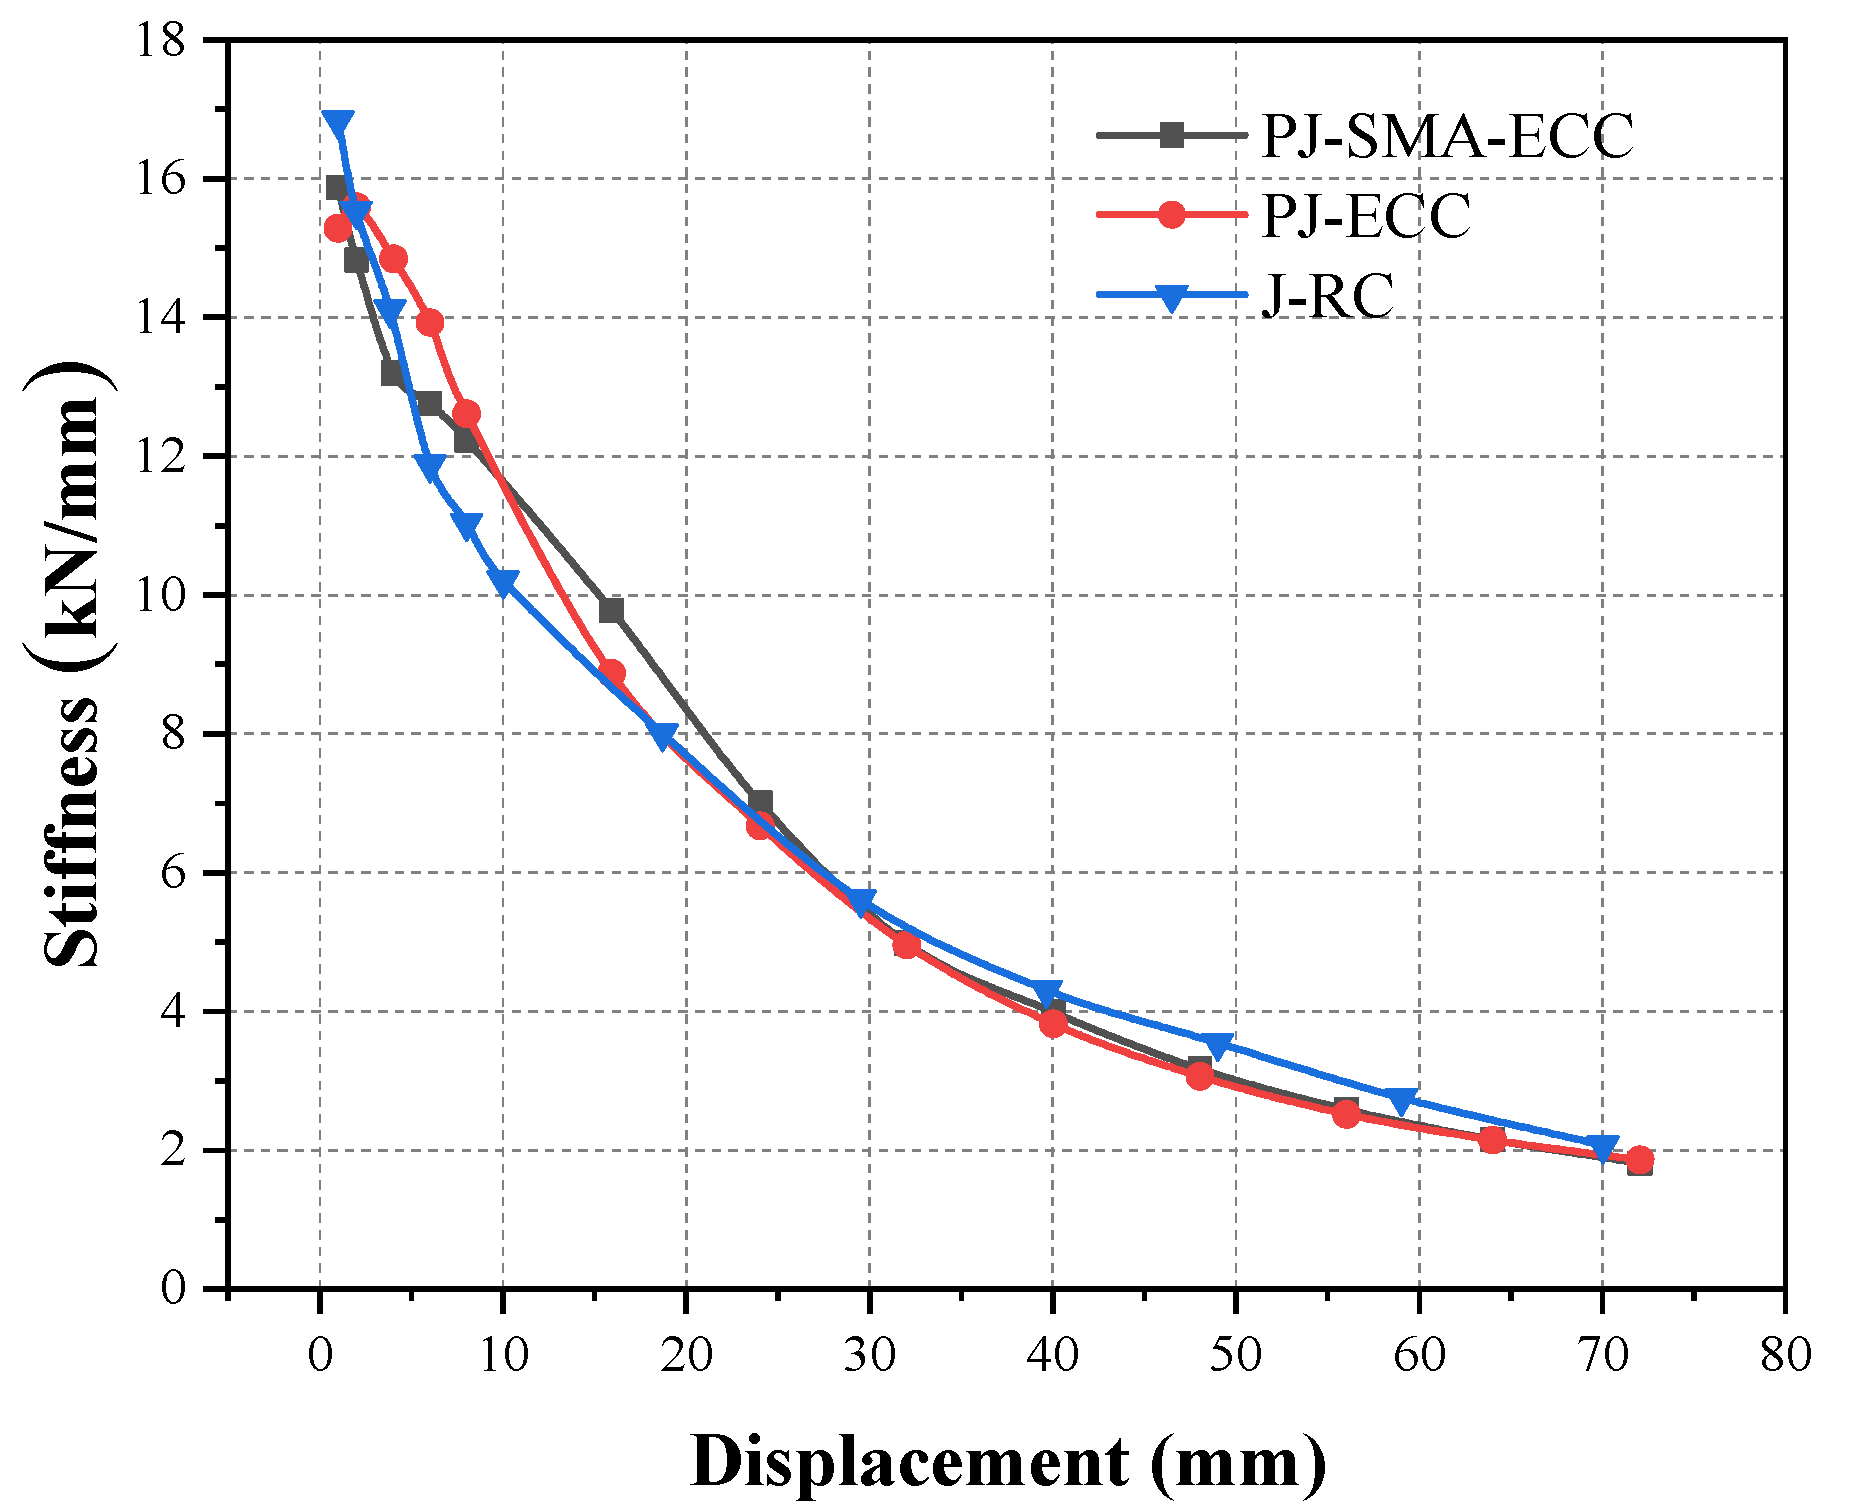
3.5. Stiffness Degradation
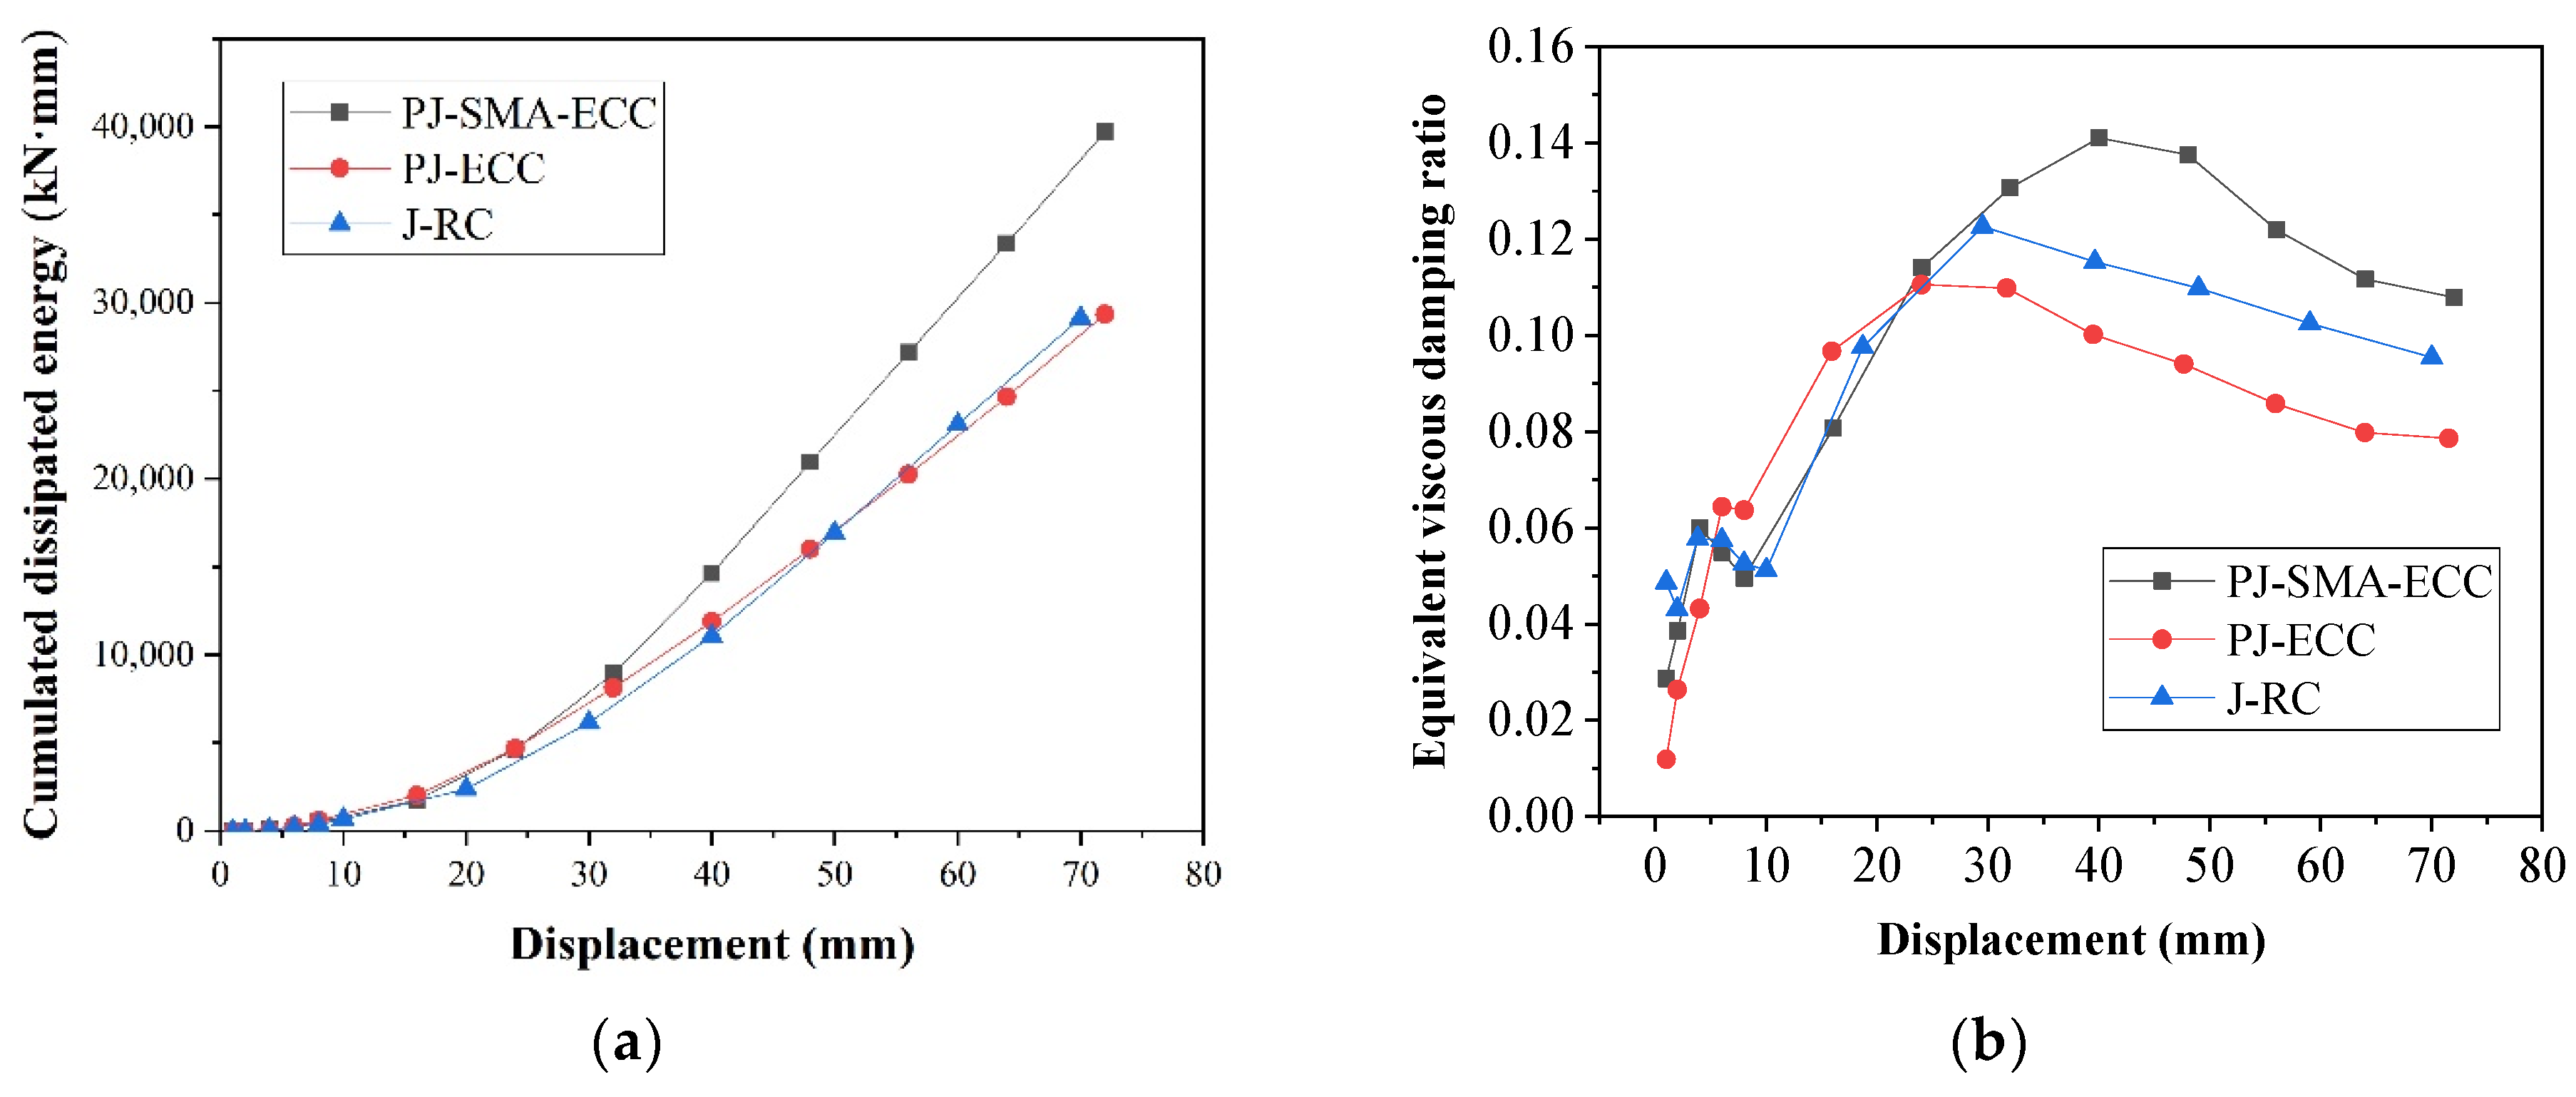
3.6. Energy Dissipation and Damping Ratio
4. Evaluation of Self-Healing Performance
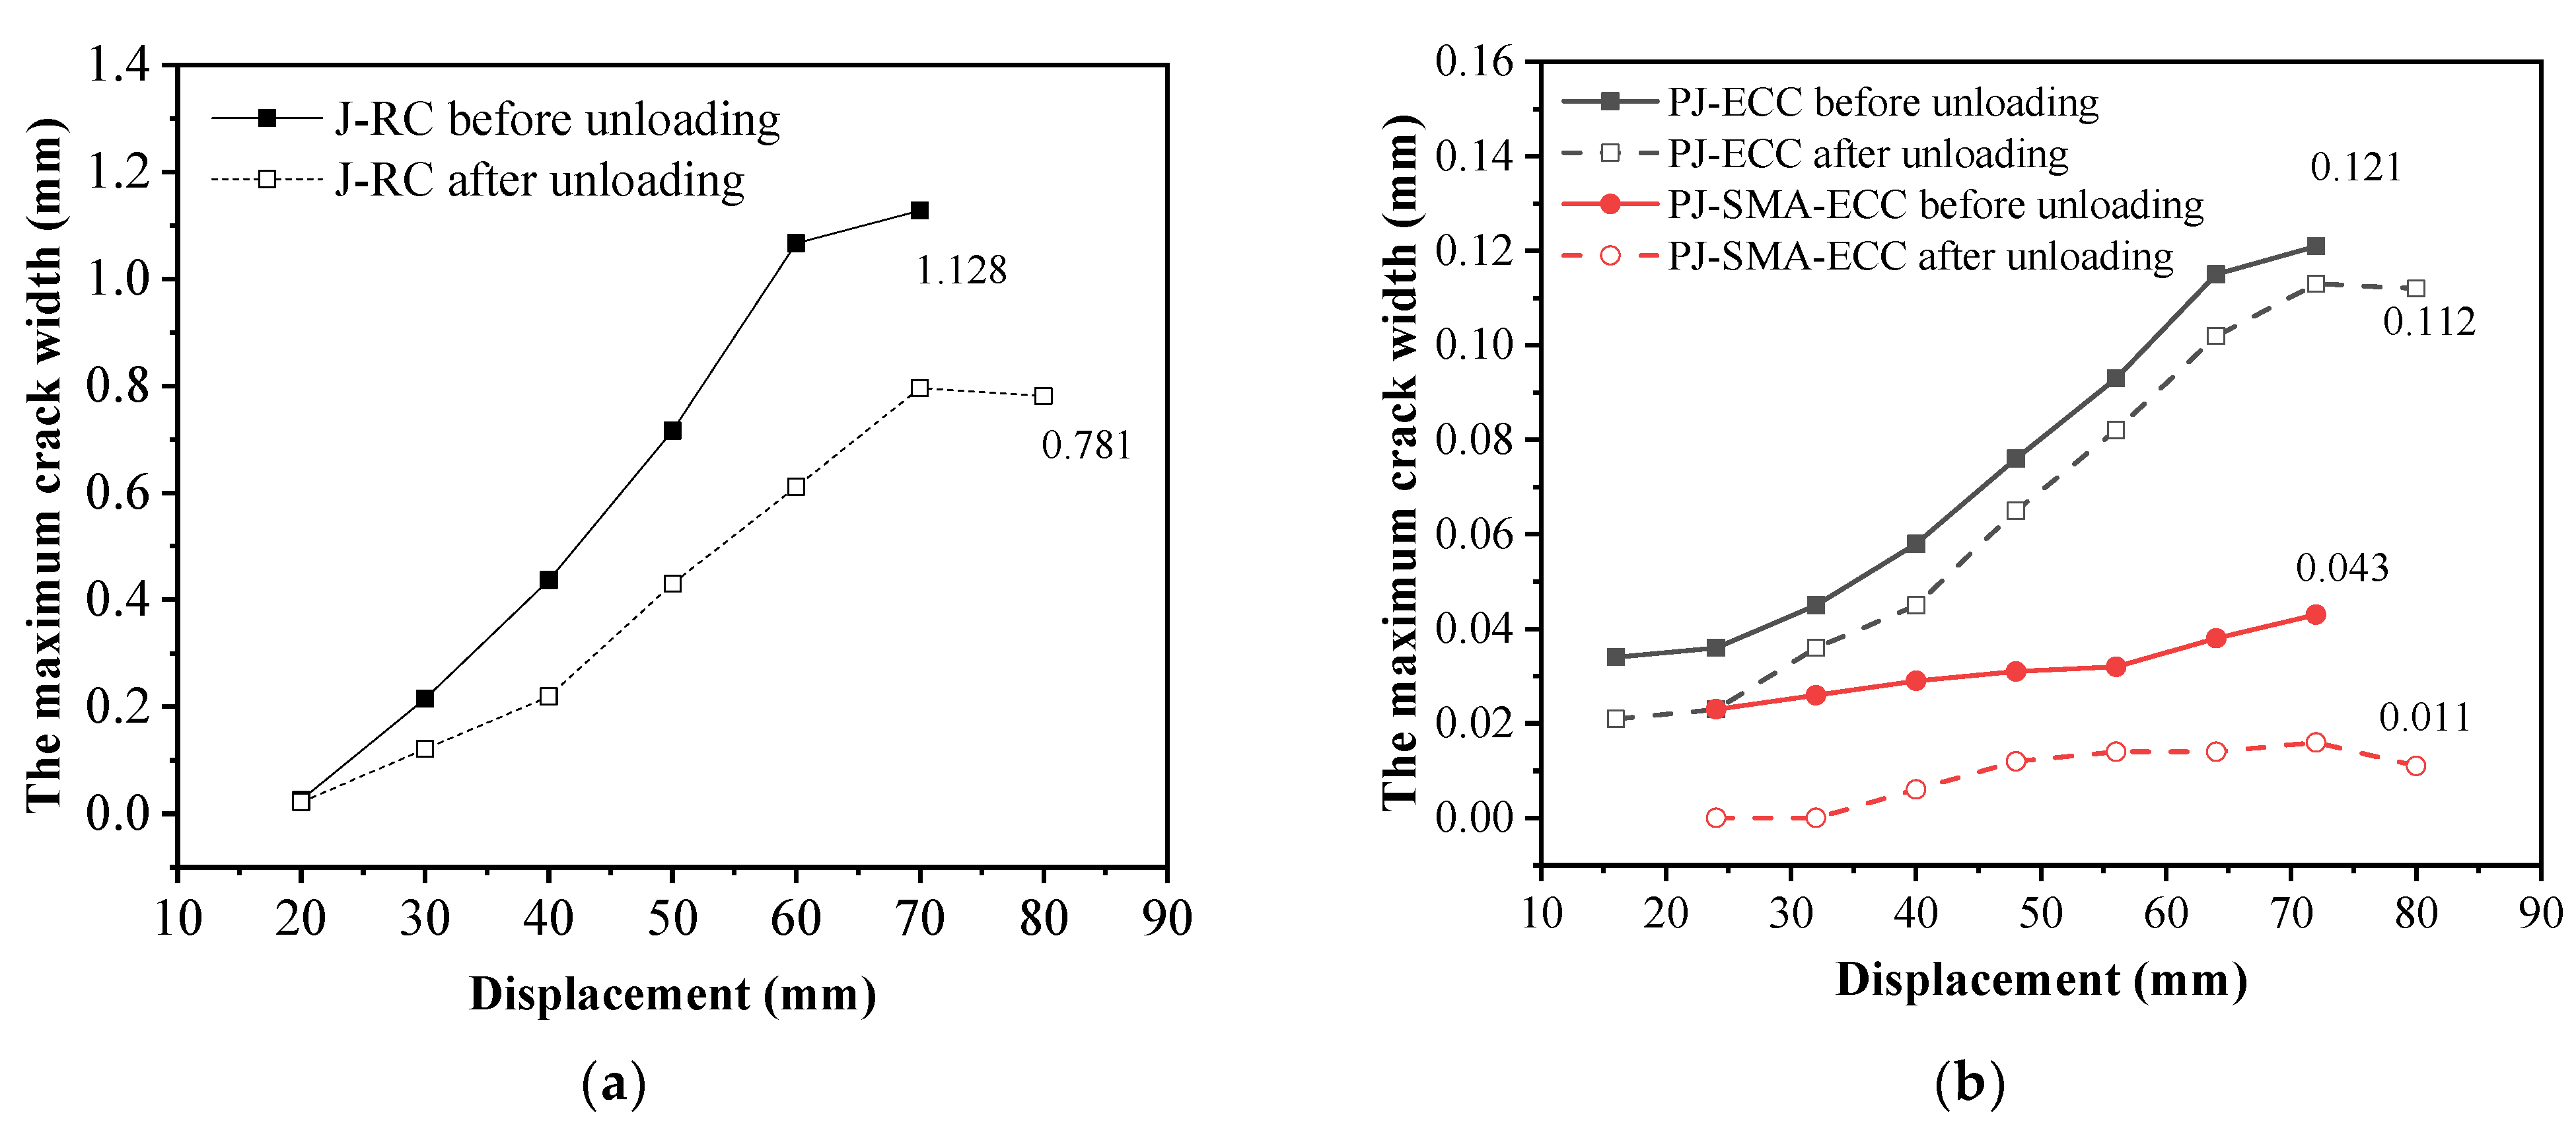
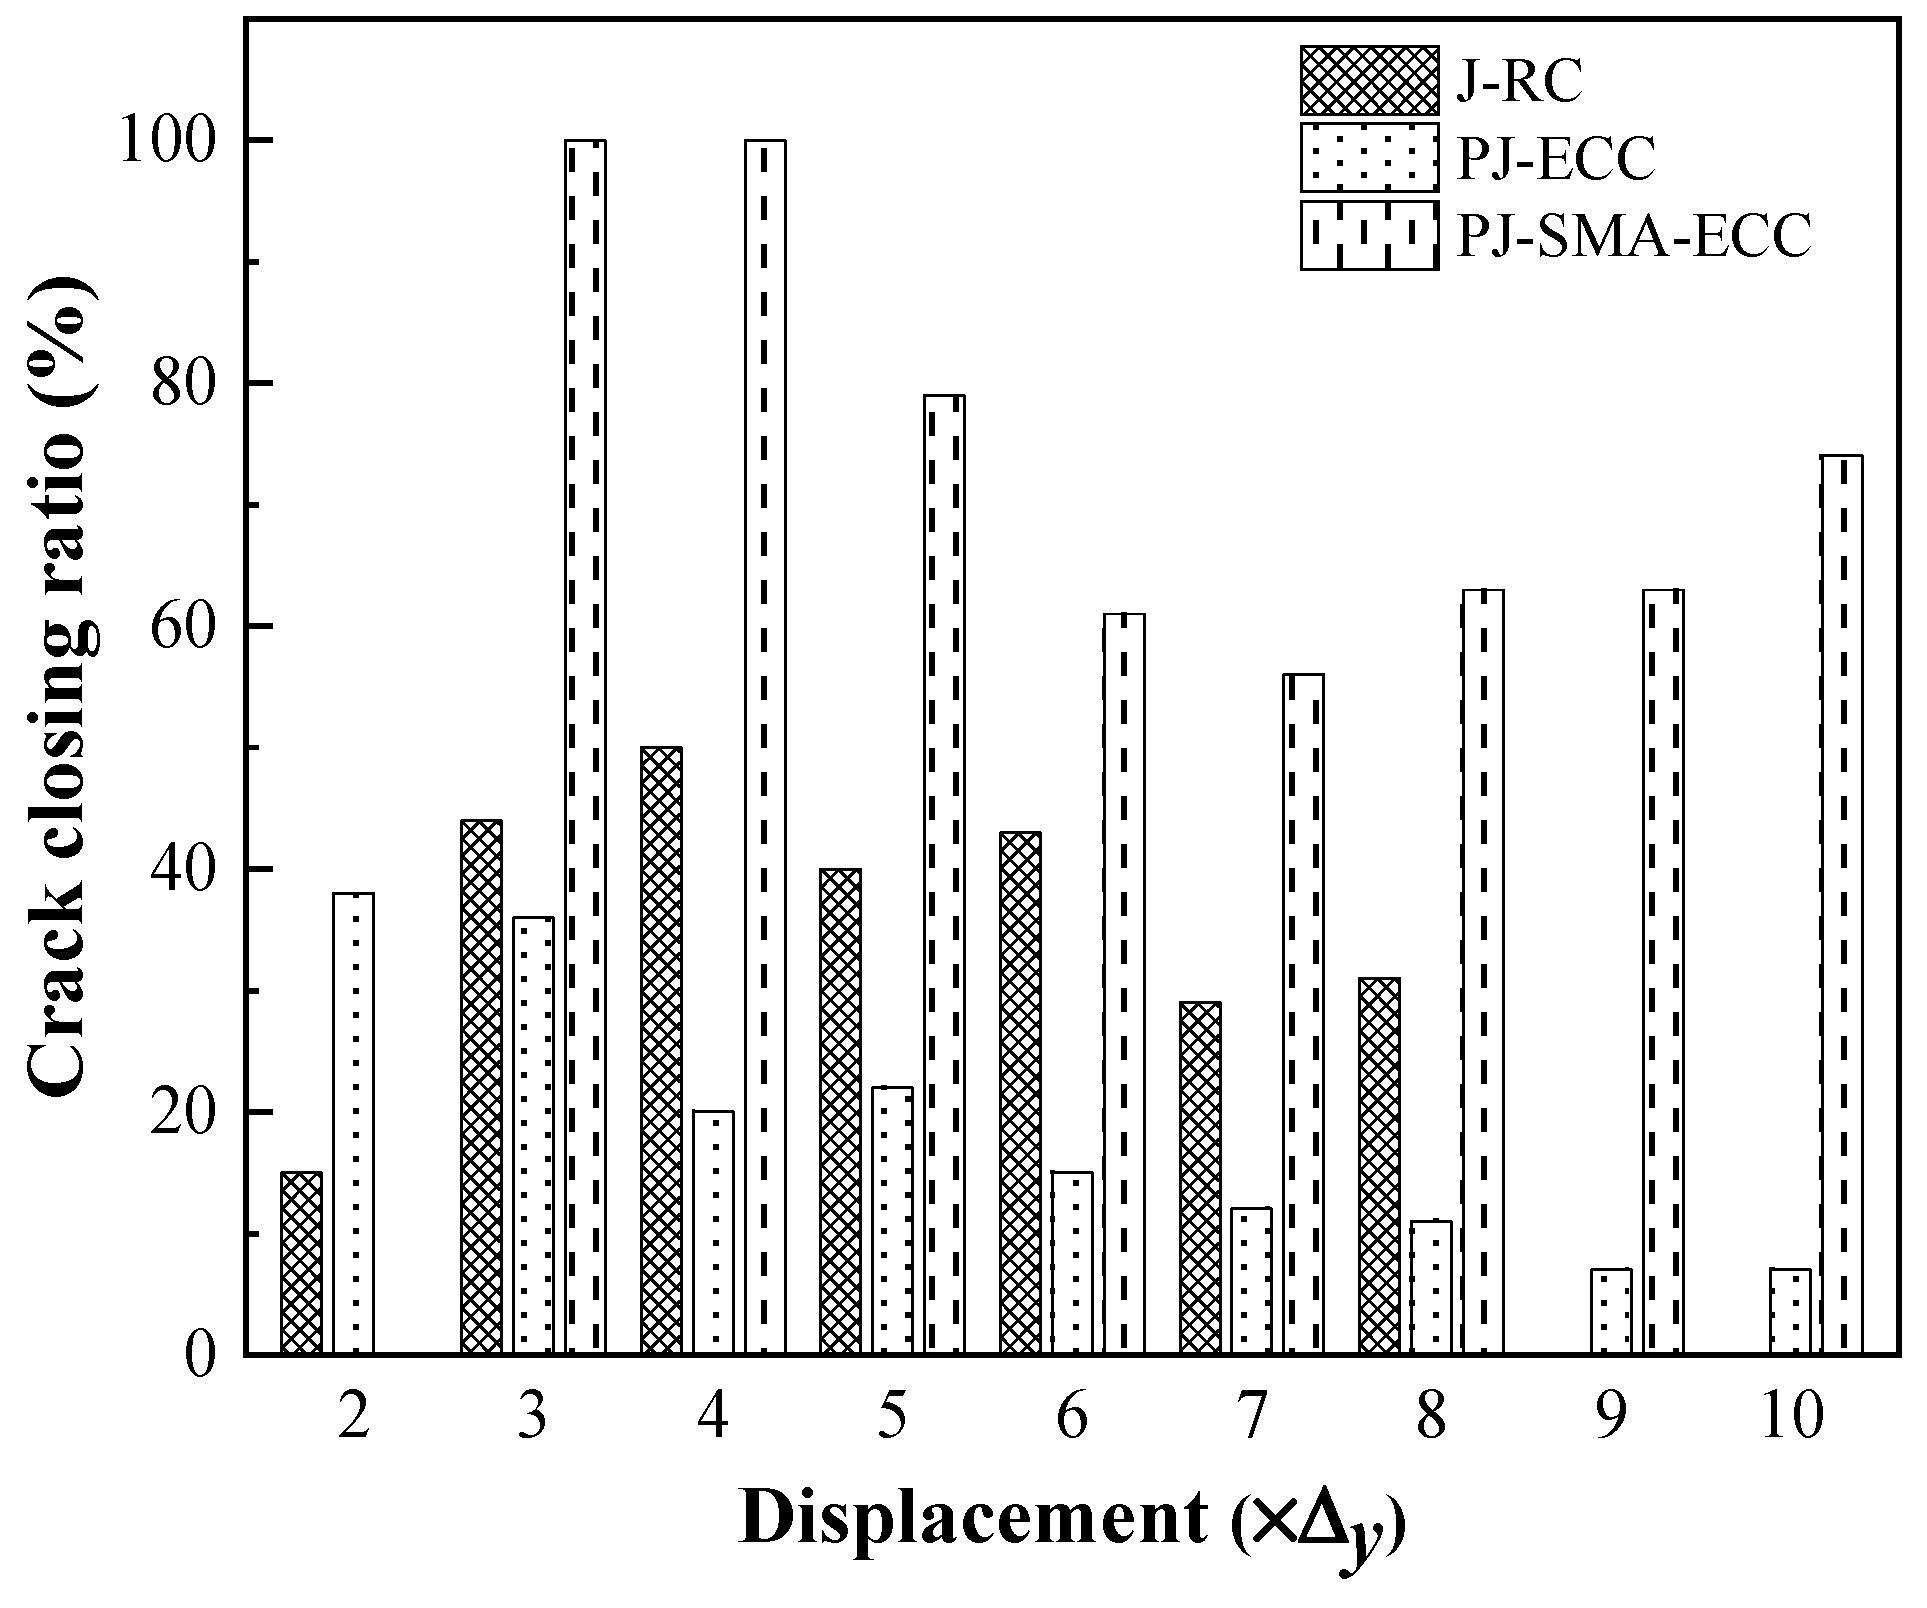
4.1. Maximum Crack Width at Each Cycle before and after Unloading
4.2. Ultrasonic Pulse Test
4.2.1. Testing Method
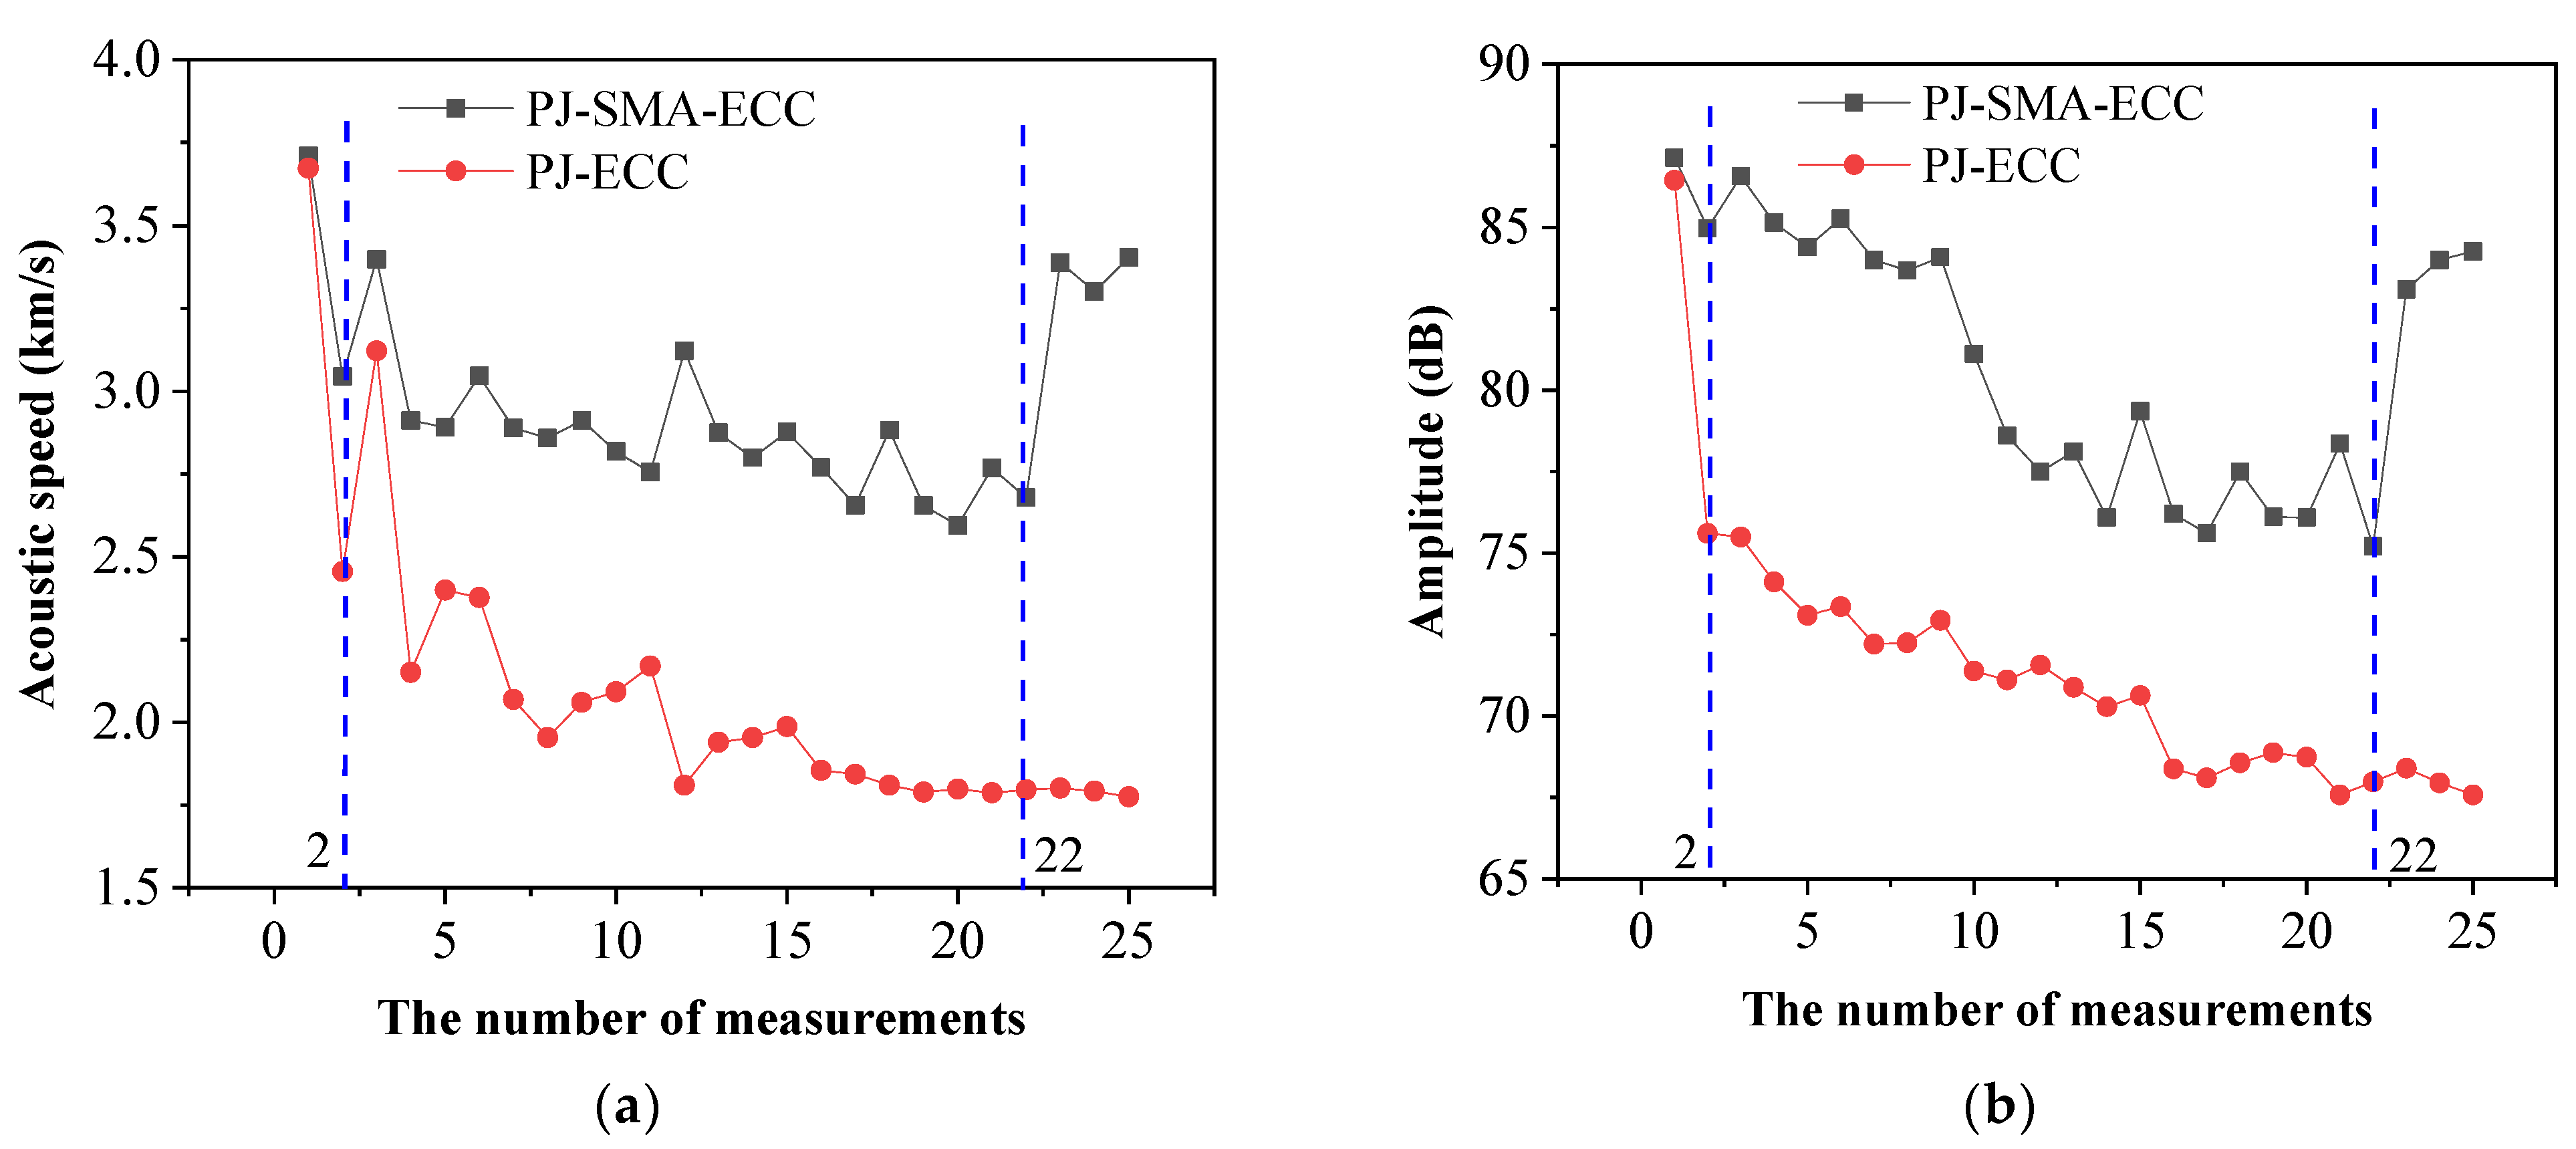
4.2.2. Variation in Acoustic Speed and Amplitude before and after Unloading
5. Conclusions
- (1)
- The seismic performance of Specimen PJ-SMA-ECC was comparable to (even better in certain aspects, such as the ability to maintain structural integrity, displacement ductility, and energy dissipation capacity) the monolithically cast Specimen J-RC. The two precast joints experienced flexural failure at the beam ends and maintained good integrity at failure.
- (2)
- Specimen PJ-SMA-ECC exhibited superior crack-healing capacity by reducing the crack number and width. Almost all cracks in the joint zone of Specimen PJ-SMA-ECC were closed after the test was terminated. Super-elastic SMA fibers were beneficial in repairing cracks after load removal.
- (3)
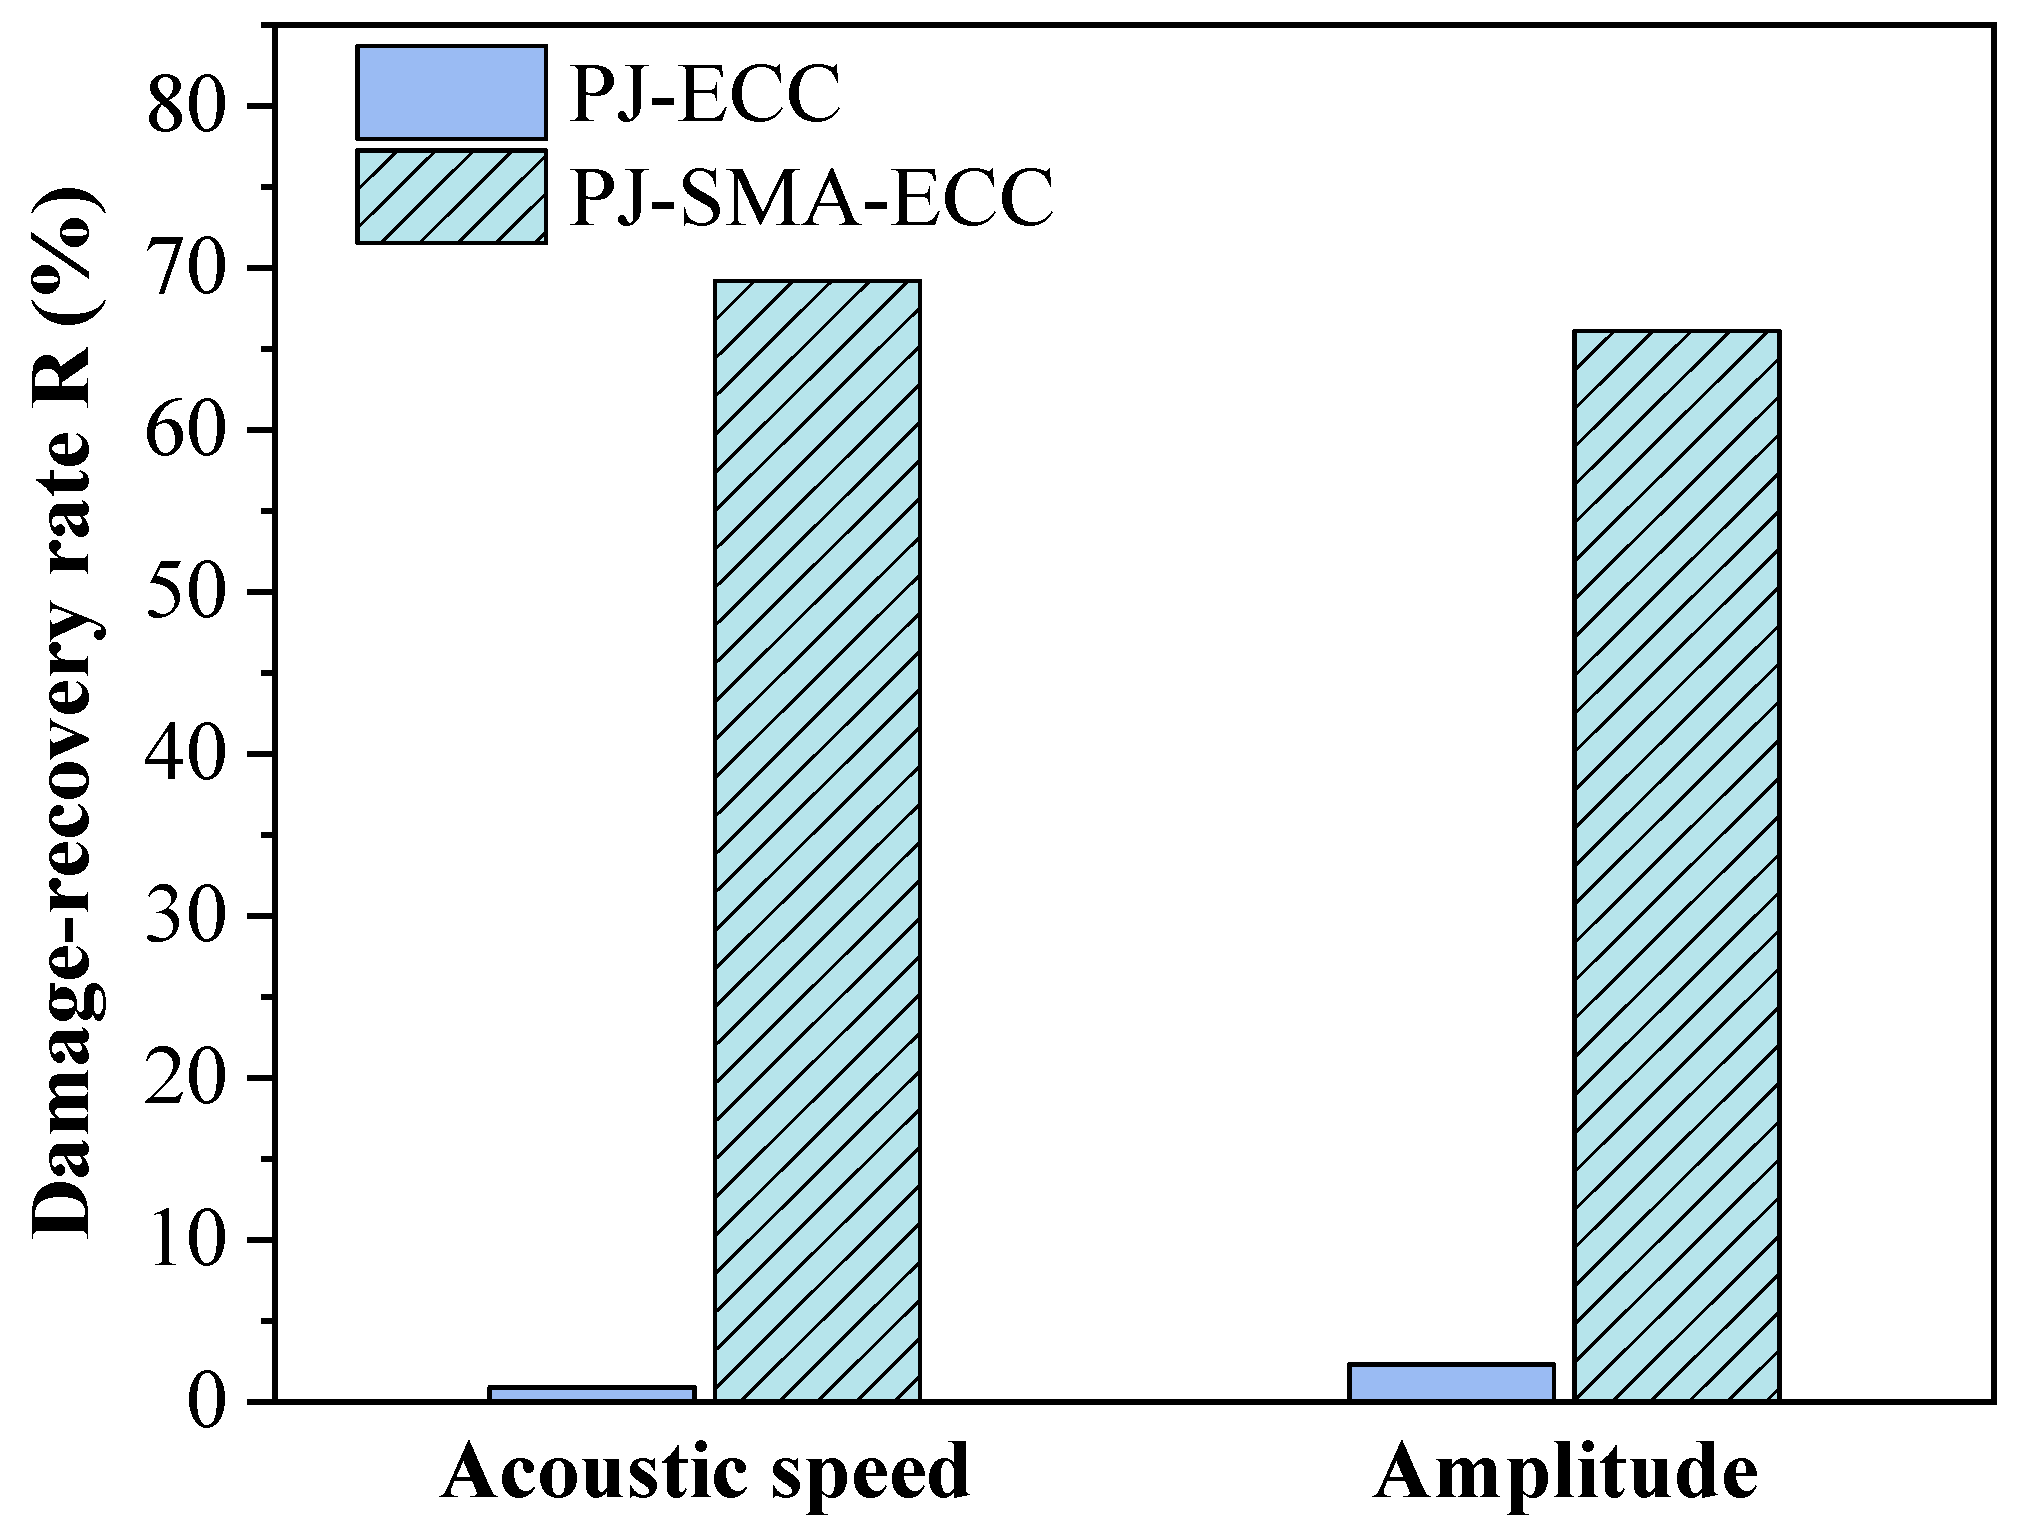
- An ultrasonic pulse test showed that the acoustic speed and amplitude of Specimen PJ-SMA-ECC decreased slowly with increasing displacement. Additionally, the acoustic speed and amplitude in the joint zone of Specimen PJ-SMA-ECC recovered to 91.3% and 96.7% of their initial values after the test was terminated, while the acoustic properties of Specimen PJ-ECC were barely recovered.
Author Contributions
Funding
Institutional Review Board Statement
Informed Consent Statement
Data Availability Statement
Conflicts of Interest
References
- Kurama, Y.C.; Sritharan, S.; Fleischman, R.B.; Restrepo, J.I.; Henry, R.S.; Cleland, N.M.; Ghosh, S.K.; Bonelli, P. Seismic-resistant precast concrete structures: State of the art. J. Struct. Eng. 2018, 144, 03118001. [Google Scholar] [CrossRef]
- Yan, Q.; Chen, T.; Xie, Z. Seismic experimental study on a precast concrete beam-column connection with grout sleeves. Eng. Struct. 2018, 155, 330–344. [Google Scholar] [CrossRef]
- Palanci, M.; Senel, S.M. Earthquake damage assessment of 1-story precast industrial buildings using damage probability matrices. B Earthq. Eng. 2019, 17, 5241–5263. [Google Scholar] [CrossRef]
- Belleri, A.; Brunesi, E.; Nascimbene, R.; Pagani, M.; Riva, P. Seismic performance of precast industrial facilities following major earthquakes in the Italian territory. J. Perform. Constr. Fac. 2015, 29, 04014135. [Google Scholar] [CrossRef]
- Xu, Y.L.; Gong, Y.N. Investigation of collapse of teaching building during the Wenchuan Earthquake: Third anniversary memorial of 5·12 Wenchuan Earthquake. J. Build Struct. 2011, 32, 9–16. (In Chinese) [Google Scholar]
- Bruneau, M. Building damage from the Marmara, Turkey Earthquake of August 17, 1999. J. Seismol. 2002, 6, 357–377. [Google Scholar] [CrossRef]
- Senel, S.M.; Palanci, M.; Kalkan, A.; Yılmaz, Y. Investigation of shear and overturning safety of hinged connections in existing precast buildings. Tek. Dergi. 2013, 24, 6505–6528. [Google Scholar]
- Bazant, Z.P.; Kazemi, M.T. Size dependence of concrete fracture energy determined by RILEM work-of-fracture method. Int. J. Fract. 1991, 51, 121–138. [Google Scholar] [CrossRef]
- Khan, M.S. Seismic performance of deficient RC frames retrofitted with SMA-reinforced ECC column jacketing. Innov. Infrastruct. Solut. 2021, 6, 1–20. [Google Scholar] [CrossRef]
- Şahmaran, M.; Li, V. De-icing salt scaling resistance of mechanically loaded engineered cementitious composites. Cem. Concr. Res. 2007, 37, 1035–1046. [Google Scholar] [CrossRef]
- Yu, K.; Li, L.; Yu, J.; Wang, Y.; Ye, J.; Xu, Q. Direct tensile properties of engineered cementitious composites: A review. Constr. Build. Mater. 2018, 165, 346–362. [Google Scholar] [CrossRef]
- Haber, Z.B.; De la Varga, I.; Graybeal, B.A.; Nakashoji, B.; El-Helou, R. Properties and Behavior of UHPC-Class Materials; FHWA-HRT-18-036; Federal Highway Administration, Office of Infrastructure Research and Development: McLean, VA, USA, 2018. [Google Scholar]
- Shao, Y.; Nguyen, W.; Bandelt, M.J.; Ostertag, C.P.; Billington, S.L. Seismic performance of high-performance fiber-reinforced cement-based composite structural members: A review. J. Struct. Eng. 2022, 148, 03122004. [Google Scholar] [CrossRef]
- Pokhrel, M.; Bandelt, M.J. Plastic hinge behavior and rotation capacity in reinforced ductile concrete flexural members. Eng. Struct. 2019, 200, 109699. [Google Scholar] [CrossRef]
- Shao, Y.; Hung, C.C.; Billington, S.L. Gradual crushing of steel reinforced HPFRCC beams, experiments and simulations. J. Struct. Eng. 2021, 147, 04021114. [Google Scholar] [CrossRef]
- Kesner, K.E.; Billington, S.L.; Douglas, K.S. Cyclic response of highly ductile fiber-reinforced cement-based composites. ACI Mater. J. 2003, 100, 381–390. [Google Scholar]
- Khlef, F.L.; Barbosa, A.R.; Ideker, J.H. Tension and cyclic behavior of high-performance fiber-reinforced cementitious composites. J. Mater. Civil Eng. 2019, 31, 04019220. [Google Scholar] [CrossRef]
- Del Vecchio, C.; Di Ludovico, M.; Balsamo, A.; Prota, A. Seismic retrofit of real beam-column joints using fiber-reinforced cement composites. J. Struct. Eng. 2018, 144, 04018026. [Google Scholar] [CrossRef]
- Filiatrault, A.; Pineau, S.; Houde, J. Seismic behavior of steel-fiber reinforced-concrete interior beam-column joints. ACI Struct. J. 1995, 92, 543–552. [Google Scholar]
- Zhang, Z.; Ding, R.; Nie, X.; Fan, J. Seismic performance of a novel interior precast concrete beam-column joint using ultra-high performance concrete. Eng. Struct. 2020, 222, 111145. [Google Scholar] [CrossRef]
- Parra-Montesinos, G.J.; Peterfreund, S.W.; Chao, S.H. Highly damage-tolerant beam-column joints through use of high-performance fiber-reinforced cement composites. ACI Struct. J. 2005, 102, 487–495. [Google Scholar]
- Qudah, S.; Maalej, M. Application of engineered cementitious composites (ECC) in interior beam–column connections for enhanced seismic resistance. Eng. Struct. 2014, 69, 235–245. [Google Scholar] [CrossRef]
- Gou, S.; Ding, R.; Fan, J.; Nie, X.; Zhang, J. Seismic performance of a novel precast concrete beam-column connection using low-shrinkage engineered cementitious composites. Constr. Build. Mater. 2018, 192, 643–656. [Google Scholar] [CrossRef]
- Gou, S.; Ding, R.; Fan, J.; Nie, X.; Zhang, J. Experimental study on seismic performance of precast LSECC/RC composite joints with U-shaped LSECC beam shells. Eng. Struct. 2019, 189, 618–634. [Google Scholar] [CrossRef]
- Ismail, M.K.; Abdelaleem, B.H.; Hassan, A.A. Effect of fiber type on the behavior of cementitious composite beam-column joints under reversed cyclic loading. Constr. Build. Mater. 2018, 186, 969–977. [Google Scholar] [CrossRef]
- Tazarv, M.; Saiid, M. Low-damage precast columns for accelerated bridge construction in high seismic zones. J. Bridge Eng. 2016, 21, 04015056. [Google Scholar] [CrossRef]
- Mahmoud, M.A.E.; Nehdi, M.L. Exploring the synergy of ECCs and SMAs in creating resilient civil infrastructure. Mag. Concr. Res. 2018, 70, 172–188. [Google Scholar] [CrossRef]
- Del Vecchio, C.; Di Ludovico, M.; Pampanin, S.; Prota, A. Repair costs of existing RC buildings damaged by the L’Aquila earthquake and comparison with FEMA P-58 predictions. Earthq. Spectra. 2018, 34, 237–263. [Google Scholar] [CrossRef]
- Baker, T.; Saiidi, M.S.; Nakashoji, B.; Bingle, J.; Moore, T.; Khaleghi, B. Precast concrete spliced-girder bridge in Washington State using superelastic materials in bridge columns to improve seismic resiliency, From research to practice. PCI J. 2018, 63, 57–71. [Google Scholar] [CrossRef]
- Ghodke, S.; Jangid, R.S. Influence of high austenite stiffness of shape memory alloy on the response of base isolated benchmark building. Struct. Control. Hlth. 2017, 24, e1867. [Google Scholar] [CrossRef]
- Li, X.; Li, M.; Song, G. Energy-dissipating and self-repairing SMA-ECC composite material system. Smart Mater. Struct. 2015, 24, 025024. [Google Scholar] [CrossRef]
- Qian, H.; Zhang, Q.; Zhang, X.; Deng, E.; Gao, J. Experimental investigation on bending behavior of existing RC beam retrofitted with SMA-ECC composites materials. Materials 2021, 15, 12. [Google Scholar] [CrossRef] [PubMed]
- Varela, S.; Saiidi, M. Dynamic performance of innovative bridge columns with superelastic Cu-Al-Mn shape memory alloy and ECC. Intl. J. Bridge Eng. 2014, 1, 29–58. [Google Scholar]
- Hosseini, F.; Gencturk, B.; Lahpour, S.; Gil, D.I. An experimental investigation of innovative bridge columns with engineered cementitious composites and Cu-Al-Mn super-elastic alloys. Smart Mater. Struct. 2015, 24, 085029. [Google Scholar] [CrossRef]
- Cruz Noguez, C.A.; Saiidi, M.S. Shake-table studies of a four-span bridge model with advanced materials. J. Struct. Eng. 2012, 138, 182–191. [Google Scholar] [CrossRef]
- Qian, H.; Li, Z.; Pei, J.; Kang, L.; Li, H. Seismic performance of self-centering beam-column joints reinforced with superelastic shape memory alloy bars and engineering cementitious composites materials. Compos Struct. 2022, 294, 115782. [Google Scholar] [CrossRef]
- Ali, M.A.E.M.; Nehdi, M.L. Innovative crack-healing hybrid fiber reinforced engineered cementitious composite. Constr. Build. Mater. 2017, 150, 689–702. [Google Scholar] [CrossRef]
- Ali, M.A.E.M.; Soliman, A.M.; Nehdi, M.L. Hybrid-fiber reinforced engineered cementitious composite under tensile and impact loading. Mater. Des. 2017, 117, 139–149. [Google Scholar] [CrossRef]
- Chen, W.; Feng, K.; Wang, Y.; Lin, Y.; Qian, H. Evaluation of self-healing performance of a smart composite material (SMA-ECC). Constr. Build. Mater. 2021, 290, 123216. [Google Scholar] [CrossRef]
- Chen, W.; Lin, B.; Feng, K.; Cui, S.; Zhang, D. Effect of shape memory alloy fiber content and preloading level on the self-healing properties of smart cementitious composite (SMA-ECC). Constr. Build. Mater. 2022, 341, 127797. [Google Scholar] [CrossRef]
- GB 50011-2010; Code for Seismic Design of Buildings. China Architecture and Building Press: Beijing, China, 2010. (In Chinese)
- ACI 352R-02; Recommendations for Design of Beam–Column Connections in Monolithic Reinforced Concrete Structures. American Concrete Institute: Farmington Hills, MI, USA, 2002.
- GB/T 50081-2019; Standard for Test Methods of Concrete Physical and Mechanical Properties. China Building Industry Press: Beijing, China, 2019. (In Chinese)
- GB/T 228.1-2010; Metallic Materials-Tensile Testing-Part 1: Method of Test at Room Temperature. China Standardization Administration: Beijing, China, 2010. (In Chinese)
- JGJ/T 101-2015; Specification for Seismic Test of Building. China Architecture and Building Press: Beijing, China, 2015. (In Chinese)
- Li, Y.; Cui, L.; Zheng, Y.; Yang, D. Reverse marthensitic transformation of prestrained TiNi shape memory alloy in cement composite. J. Mater. Sci. Lett. 2001, 22, 1685–1686. [Google Scholar] [CrossRef]
- Park, R. Valuation of ductility of structures and structural assemblages from laboratory testing. Bull. N. Z. Nat. Soc. Earthq. Eng. 1989, 22, 155–166. [Google Scholar]
- Kim, V.T.; Nele, D.B. Self-healing in cementitious materials—A review. Materials 2013, 6, 2182–2217. [Google Scholar]
- Zhu, Y.; Yang, Y.; Yao, Y. Autogenous self-healing of engineered cementitious composites under freeze–thaw cycles. Constr. Build. Mater. 2012, 34, 522–530. [Google Scholar] [CrossRef]


| Specimen | Type | Axial Compressive Ratio | Material in Joint Zone |
|---|---|---|---|
| J-RC | monolithic | 0.2 | Concrete |
| PJ-ECC | precast | 0.2 | ECC |
| PJ-SMA-ECC | precast | 0.2 | SMA-ECC |
| Cement | Fly Ash | Slag Powder | Quartz Sand | Water | Water Reducer | PVA Fiber (V%) | SMA Fiber (V%) | |
|---|---|---|---|---|---|---|---|---|
| SMA-ECC | 0.15 | 0.7 | 0.15 | 0.4 | 0.25 | 0.003 | 1.70 | 1.00 |
| ECC | 0.15 | 0.7 | 0.15 | 0.4 | 0.25 | 0.003 | 1.70 | 0.00 |
| Type | Diameter (mm) | Length (mm) | Tensile Strength (MPa) | Elastic Modulus (GPa) | Density (kg/m3) |
|---|---|---|---|---|---|
| PVA | 0.04 | 12 | 1560 | 42.8 | 1300 |
| SMA | 0.6 | 16 | 895 | 41 | 6450 |
| Material | Water | Cement | Sand | Coarse Aggregate | Fly Ash | HRWRA |
|---|---|---|---|---|---|---|
| Content (kg/m3) | 163 | 347 | 693 | 1130 | 82 | 9.9 |
| Weight proportion (%) | 0.47 | 1.00 | 2.00 | 3.26 | 0.24 | 0.029 |
| Scheme 43. | Strength of Concrete (MPa) | Strength of ECC (MPa) | Strength of SMA-ECC (MPa) |
|---|---|---|---|
| Precast beam | 43.4 | — | — |
| Precast column | 43.4 | — | — |
| Cast-in-place zone | 42.1 | 43.7 | 40.2 |
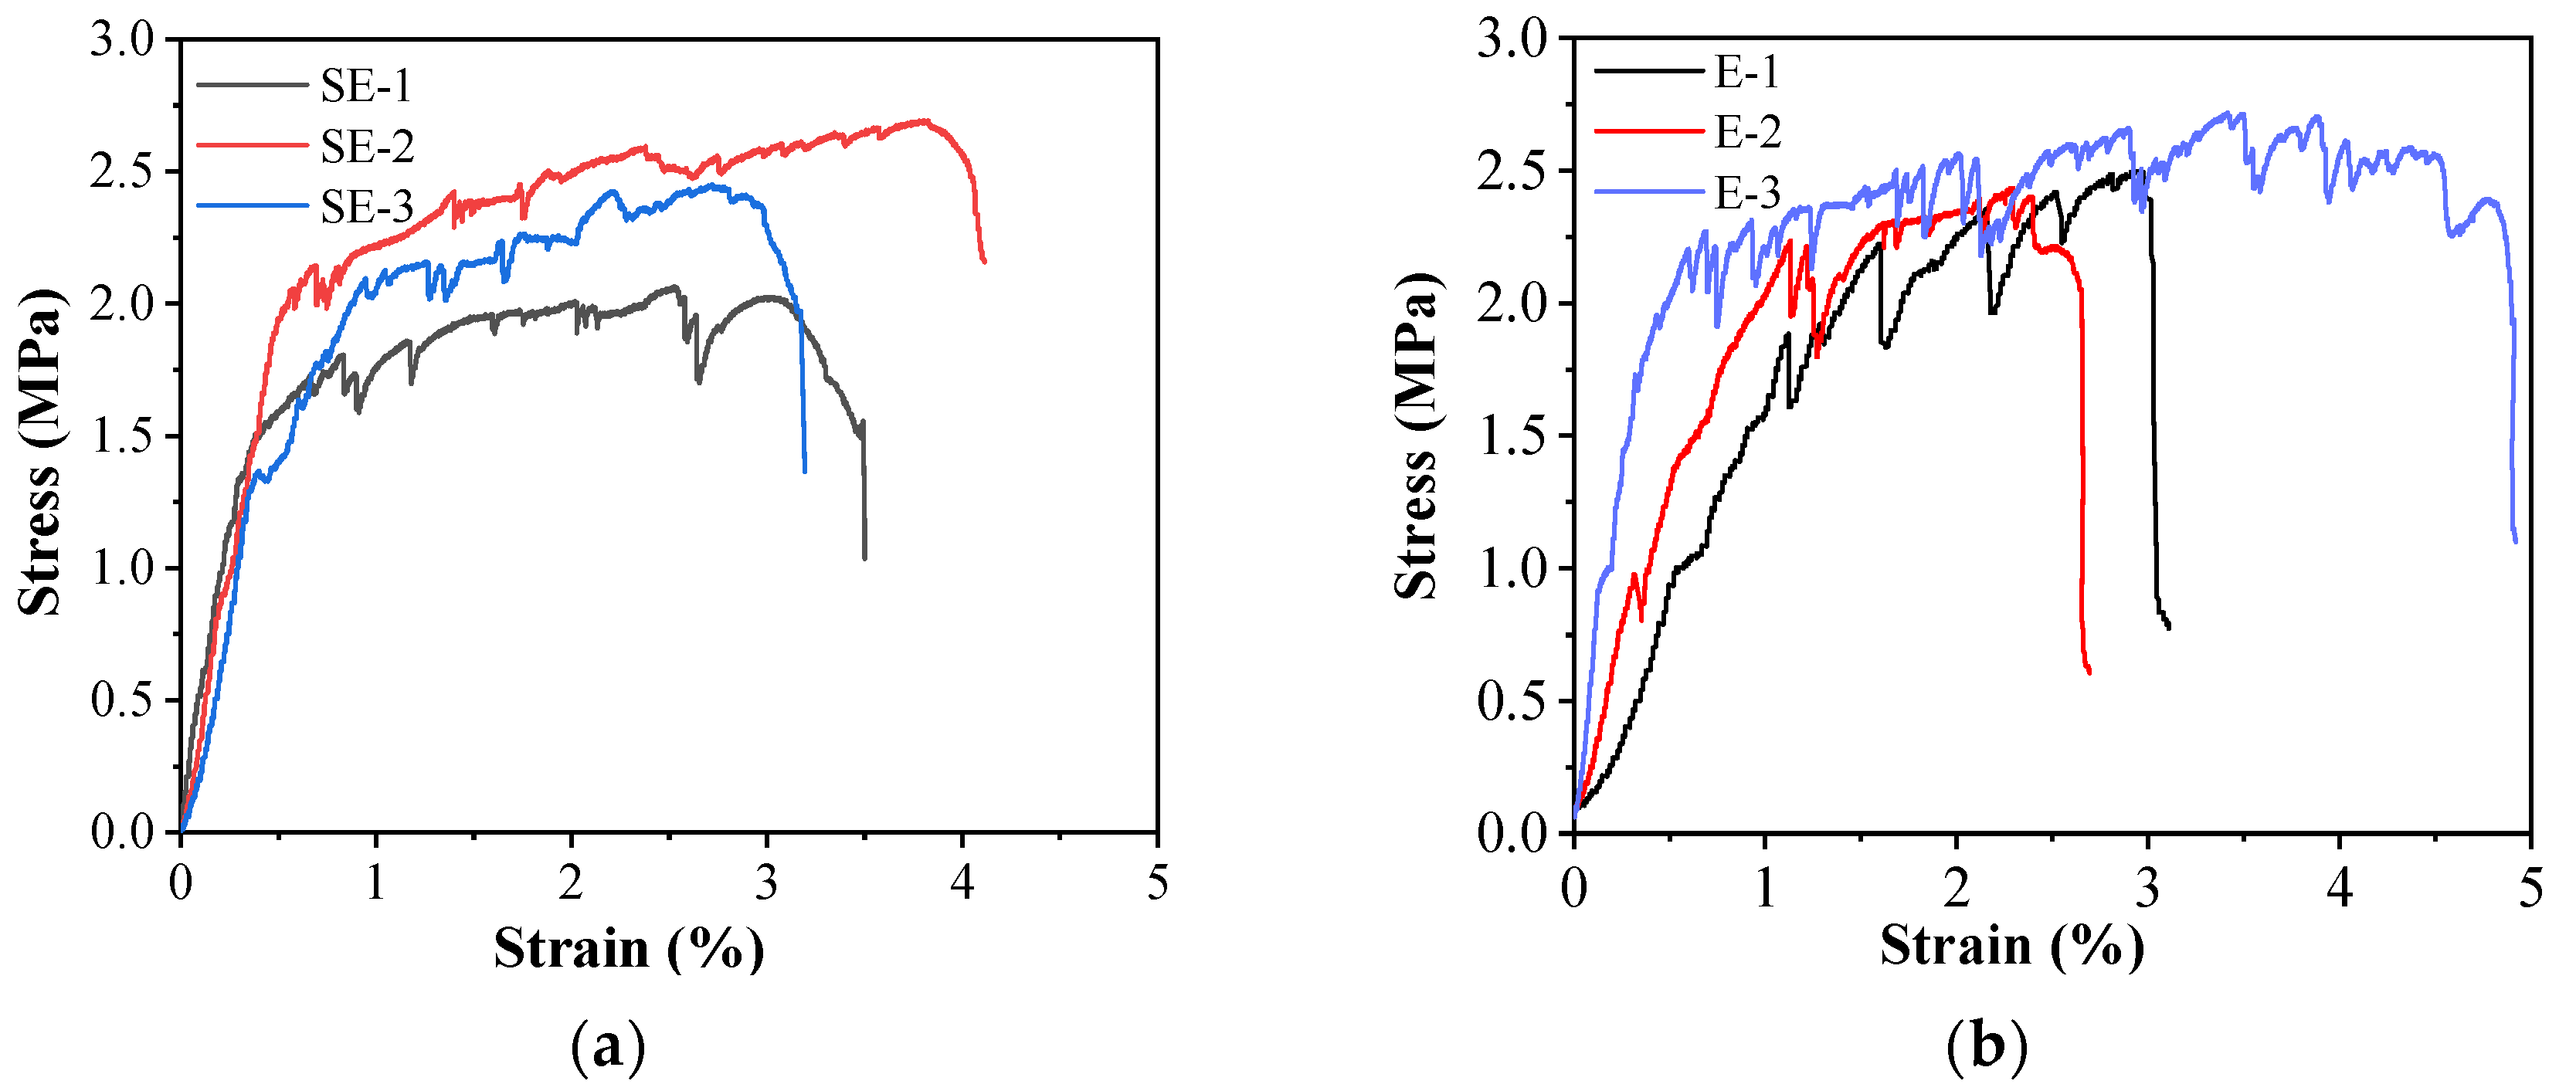
| Material | Tensile Specimen | Tensile Strength (MPa) | Ultimate Tensile Strain (%) |
|---|---|---|---|
| SMA-ECC | SE-1 | 2.06 | 3.50 |
| SE-2 | 2.69 | 4.07 | |
| SE-3 | 2.44 | 3.18 | |
| Average | 2.40 | 3.58 | |
| ECC | E-1 | 2.48 | 3.03 |
| E-2 | 2.42 | 2.65 | |
| E-3 | 2.68 | --- | |
| Average | 2.53 | 2.84 |
| Scheme | Diameter (mm) | Yield Strength (MPa) | Ultimate Strength (MPa) | Elastic Modulus (GPa) | Elongation (%) |
|---|---|---|---|---|---|
| Stirrup bar | 8 | 436 | 635 | 201 | 14.66 |
| Longitudinal bars | 20 | 435 | 629 | 211 | 14.11 |
| 22 | 432 | 621 | 199 | 13.74 |
| Specimen | Number of Cracks | Average Crack Width (mm) | Maximum Crack Width (mm) | |
|---|---|---|---|---|
| The final target displacement | J-RC | 15 | 0.652 | 1.128 |
| PJ-ECC | 13 | 0.058 | 0.121 | |
| PJ-SMA-ECC | 8 | 0.030 | 0.043 | |
| 15 min after the test stopped | J-RC | 15 | 0.571 | 0.781 |
| PJ-ECC | 13 | 0.042 | 0.112 | |
| PJ-SMA-ECC | 1 | 0.011 | 0.011 |
| Specimen | Pc (kN) | Δc (mm) | Py (kN) | Δy (mm) | Pm (kN) | Δm (mm) | Pu (kN) | Δu (mm) | μ | |
|---|---|---|---|---|---|---|---|---|---|---|
| J-RC | Pos. | NA | NA | 175.7 | 29.0 | 190.3 | 48.5 | 161.8 | 67.4 | 2.33 |
| Neg. | 60.8 | 4.0 | 137.5 | 15.3 | 157.0 | 49.5 | 133.5 | 69.8 | 4.56 | |
| Average | 60.8 | 4.0 | 156.6 | 22.2 | 173.7 | 49.0 | 147.7 | 68.6 | 3.45 | |
| PJ-ECC | Pos. | NA | NA | 137.5 | 18.6 | 160.5 | 24.1 | 136.4 | 63.2 | 3.40 |
| Neg. | 72.8 | 4.0 | 135.7 | 11.7 | 160.1 | 24.0 | 136.1 | 69.3 | 5.92 | |
| Average | 72.8 | 4.0 | 136.6 | 15.2 | 160.3 | 24.1 | 136.3 | 66.3 | 4.66 | |
| PJ-SMA-ECC | Pos. | NA | NA | 151.2 | 14.9 | 179.8 | 24.0 | 152.8 | 56.0 | 3.76 |
| Neg. | 73.7 | 4.0 | 121.9 | 10.3 | 158.2 | 32.0 | 134.5 | 57.4 | 5.57 | |
| Average | 73.7 | 4.0 | 136.6 | 12.6 | 169.0 | 28 | 143.7 | 56.7 | 4.67 | |
| Before Test | During Test | After Test | ||||||||
|---|---|---|---|---|---|---|---|---|---|---|
| Number | 1 | 2 | 3 | 4 | 5 | 6 | 7 | 23 | 24 | 25 |
| Target displacement | Initial | 2Δy | 0 | −2Δy | 3Δy | 0 | −3Δy | 15 min | 60 min | 24 h |
Publisher’s Note: MDPI stays neutral with regard to jurisdictional claims in published maps and institutional affiliations. |
© 2022 by the authors. Licensee MDPI, Basel, Switzerland. This article is an open access article distributed under the terms and conditions of the Creative Commons Attribution (CC BY) license (https://creativecommons.org/licenses/by/4.0/).
Share and Cite
Chen, W.; Feng, K.; Wang, Y.; Cui, S.; Lin, Y. Seismic Performance of a Novel Precast Beam-Column Joint Using Shape Memory Alloy Fibers-Reinforced Engineered Cementitious Composites. Buildings 2022, 12, 1404. https://doi.org/10.3390/buildings12091404
Chen W, Feng K, Wang Y, Cui S, Lin Y. Seismic Performance of a Novel Precast Beam-Column Joint Using Shape Memory Alloy Fibers-Reinforced Engineered Cementitious Composites. Buildings. 2022; 12(9):1404. https://doi.org/10.3390/buildings12091404
Chicago/Turabian StyleChen, Weihong, Kai Feng, Ying Wang, Shuangshuang Cui, and Yiwang Lin. 2022. "Seismic Performance of a Novel Precast Beam-Column Joint Using Shape Memory Alloy Fibers-Reinforced Engineered Cementitious Composites" Buildings 12, no. 9: 1404. https://doi.org/10.3390/buildings12091404