
The Effect of Village Morphological Variation Caused by Economic Development on Residents’ Health and Rural Ventilation in Tianjin
 ,
,
Abstract
:1. Introduction
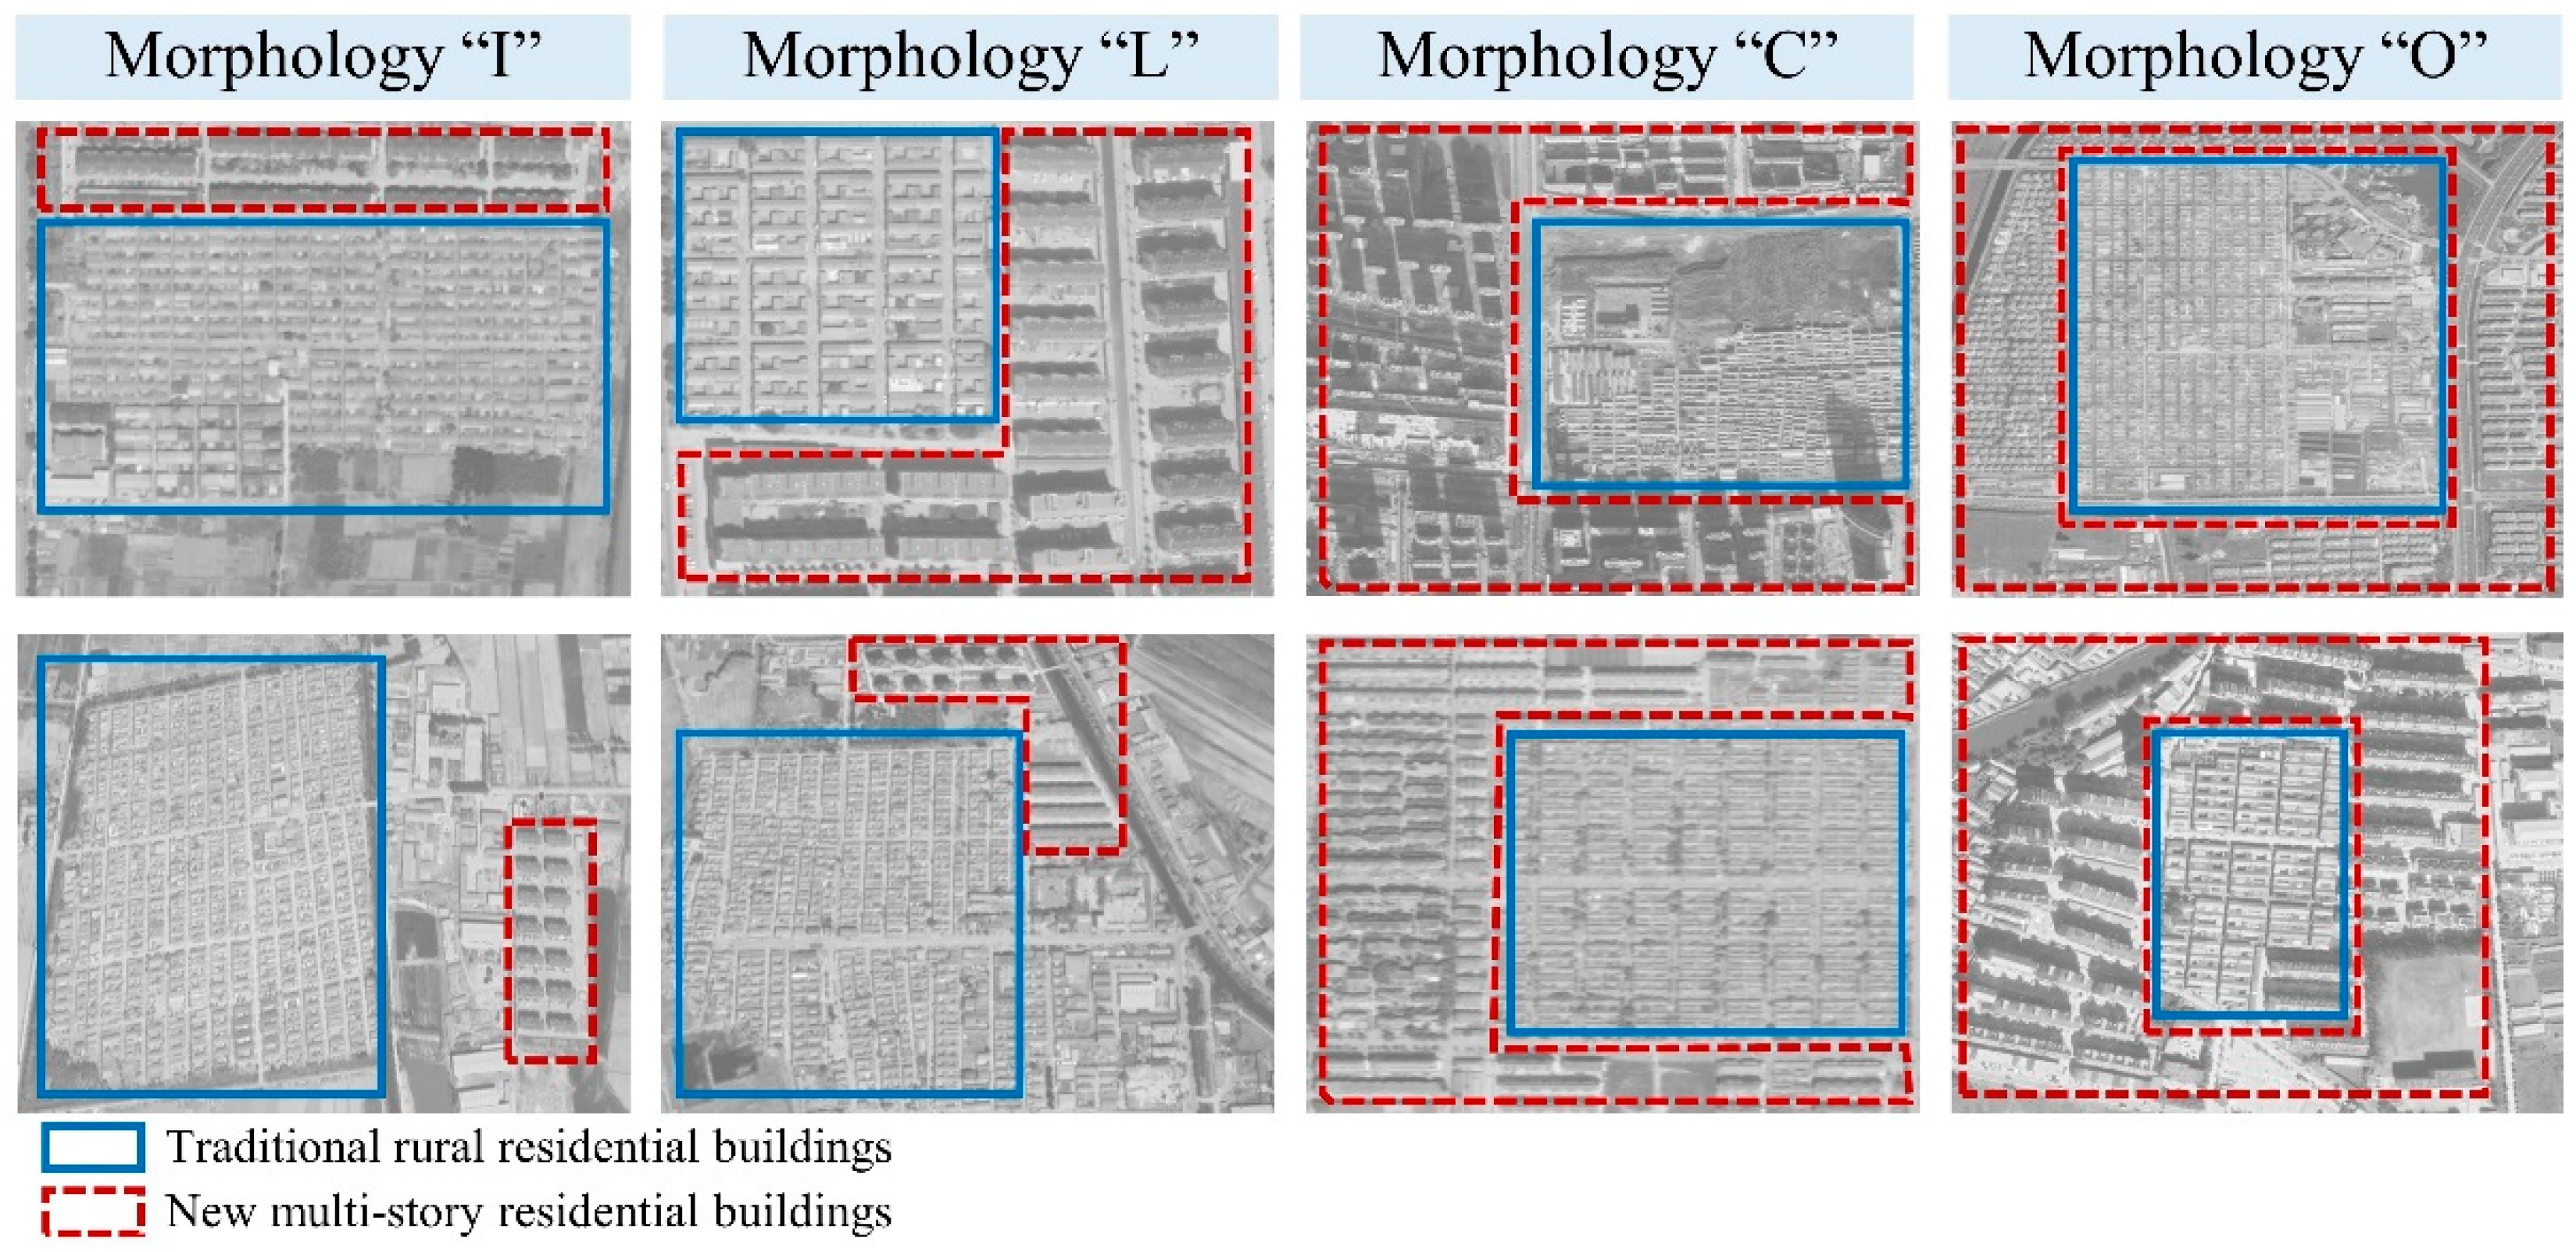
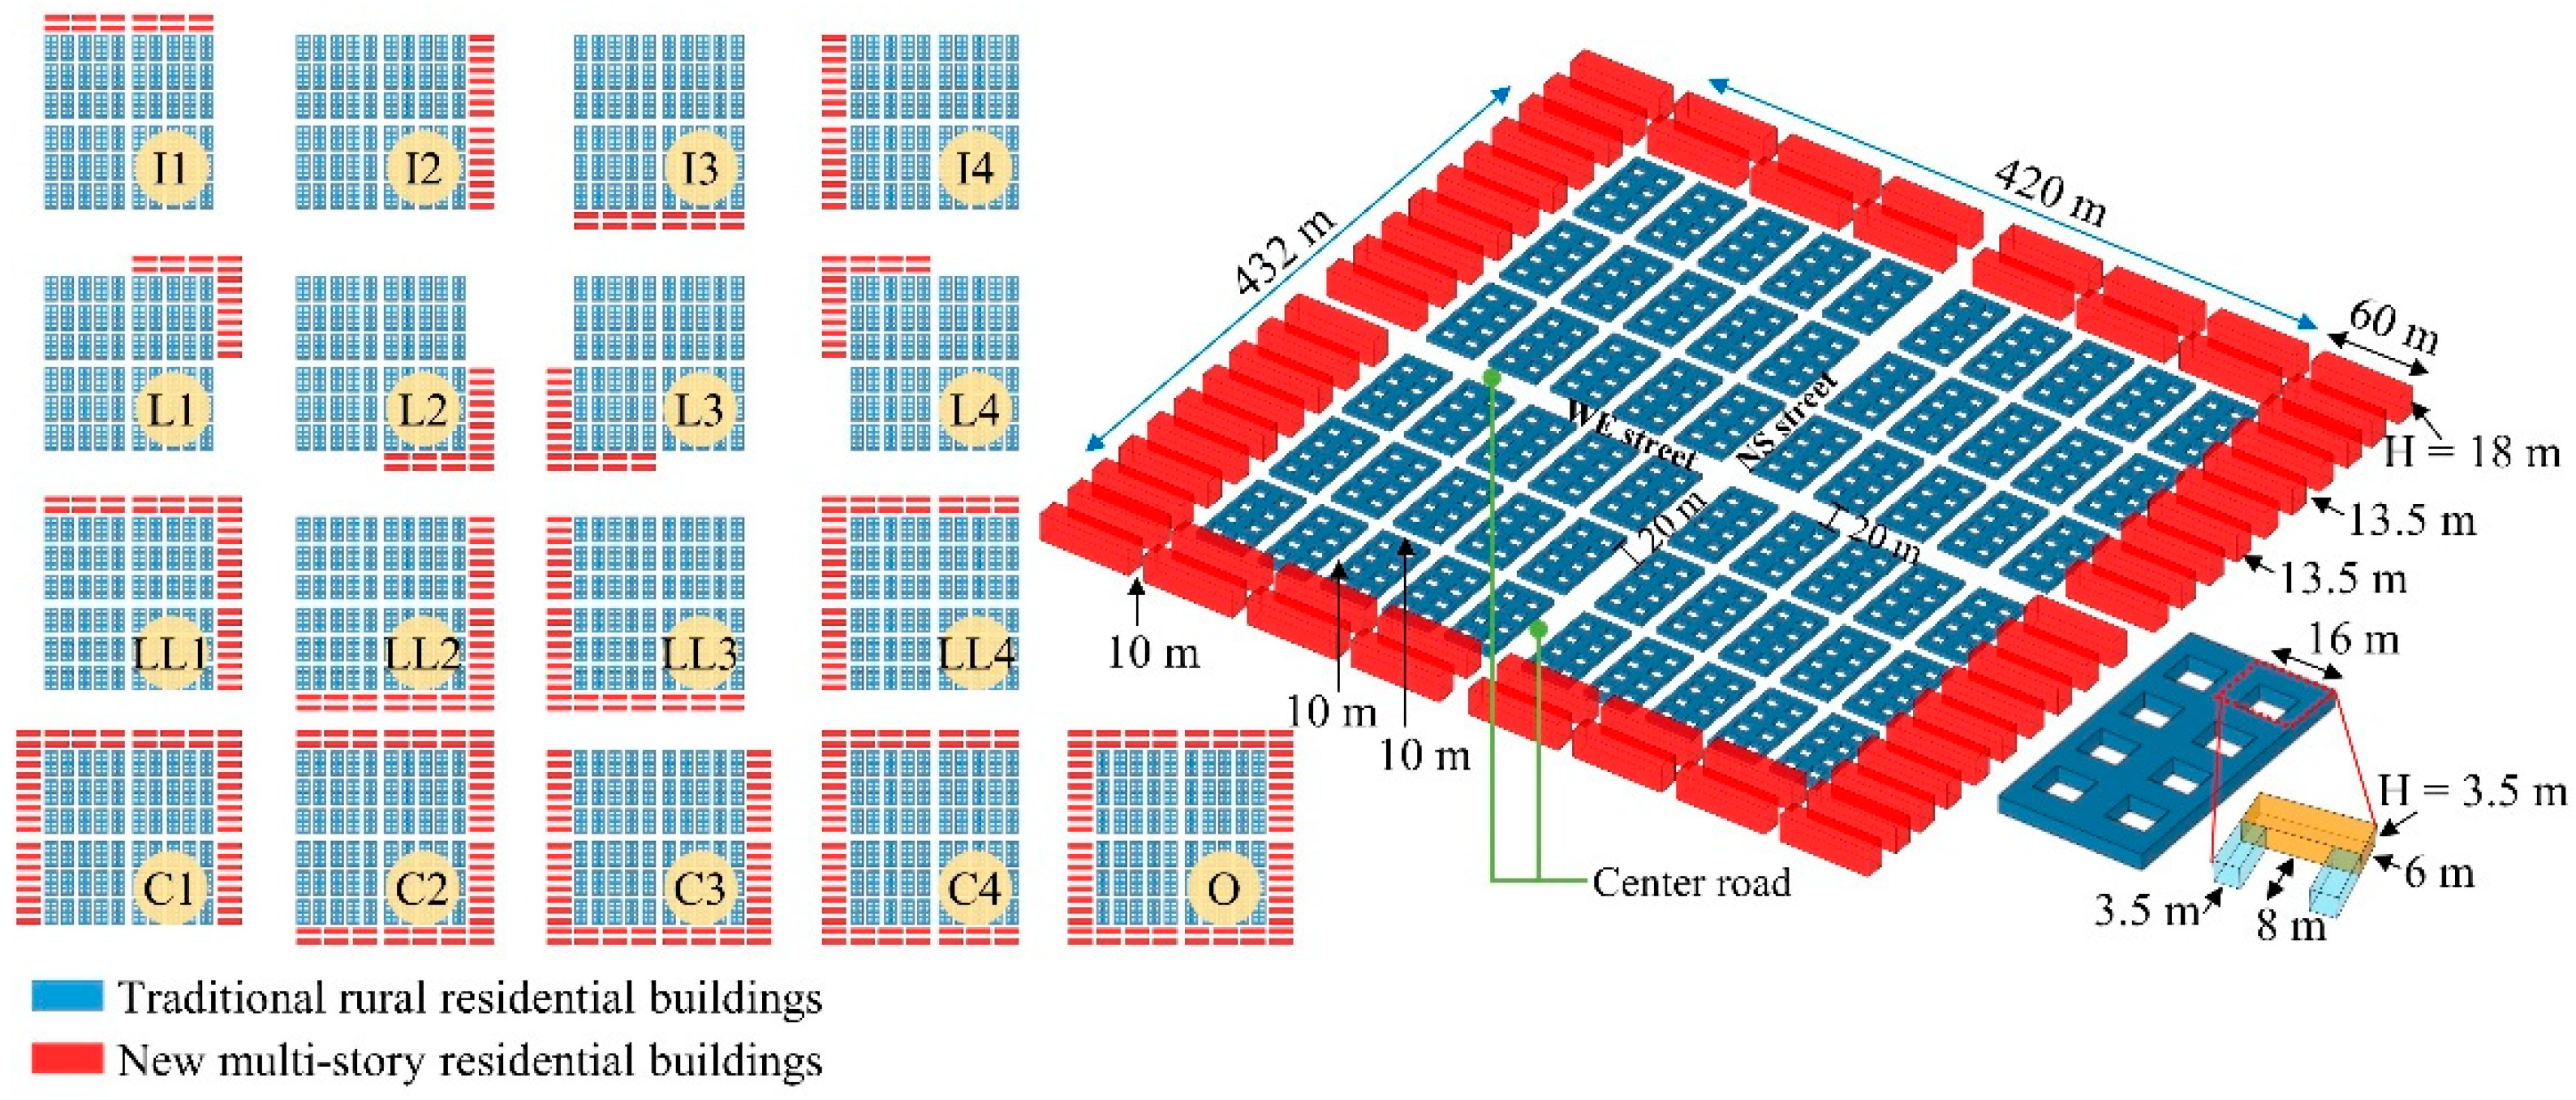
2. Morphological Analysis
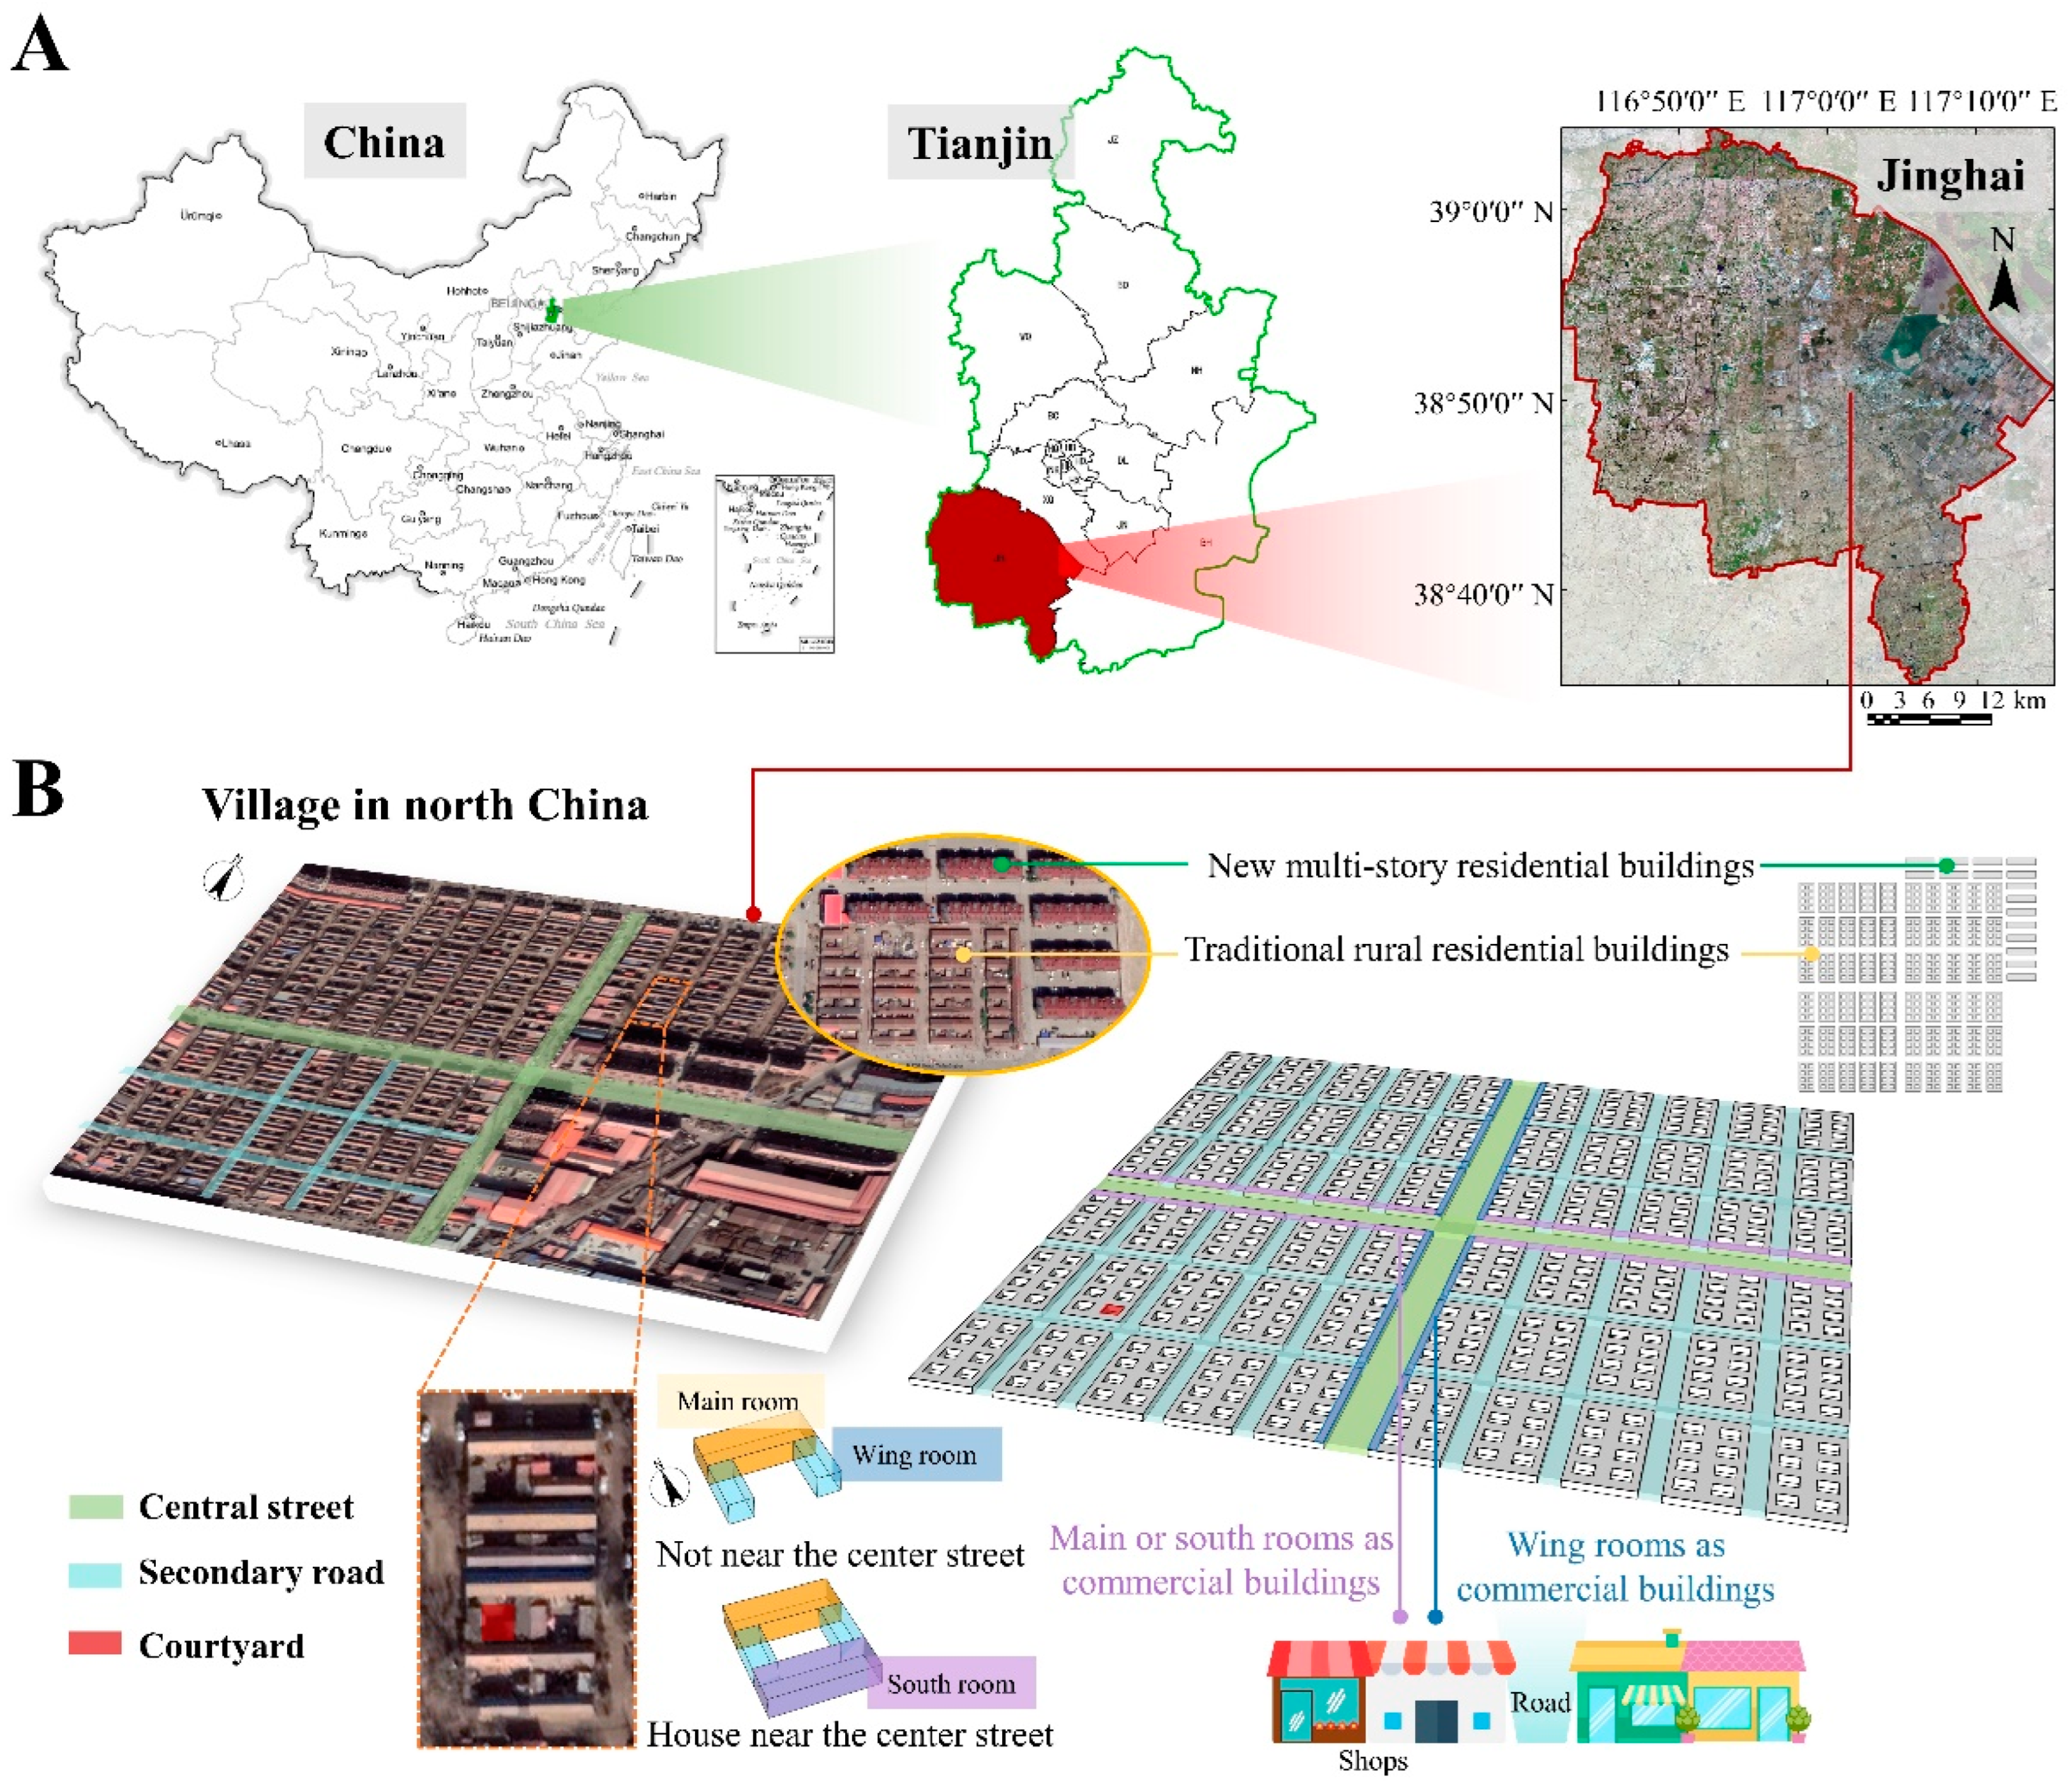
2.1. Study Region
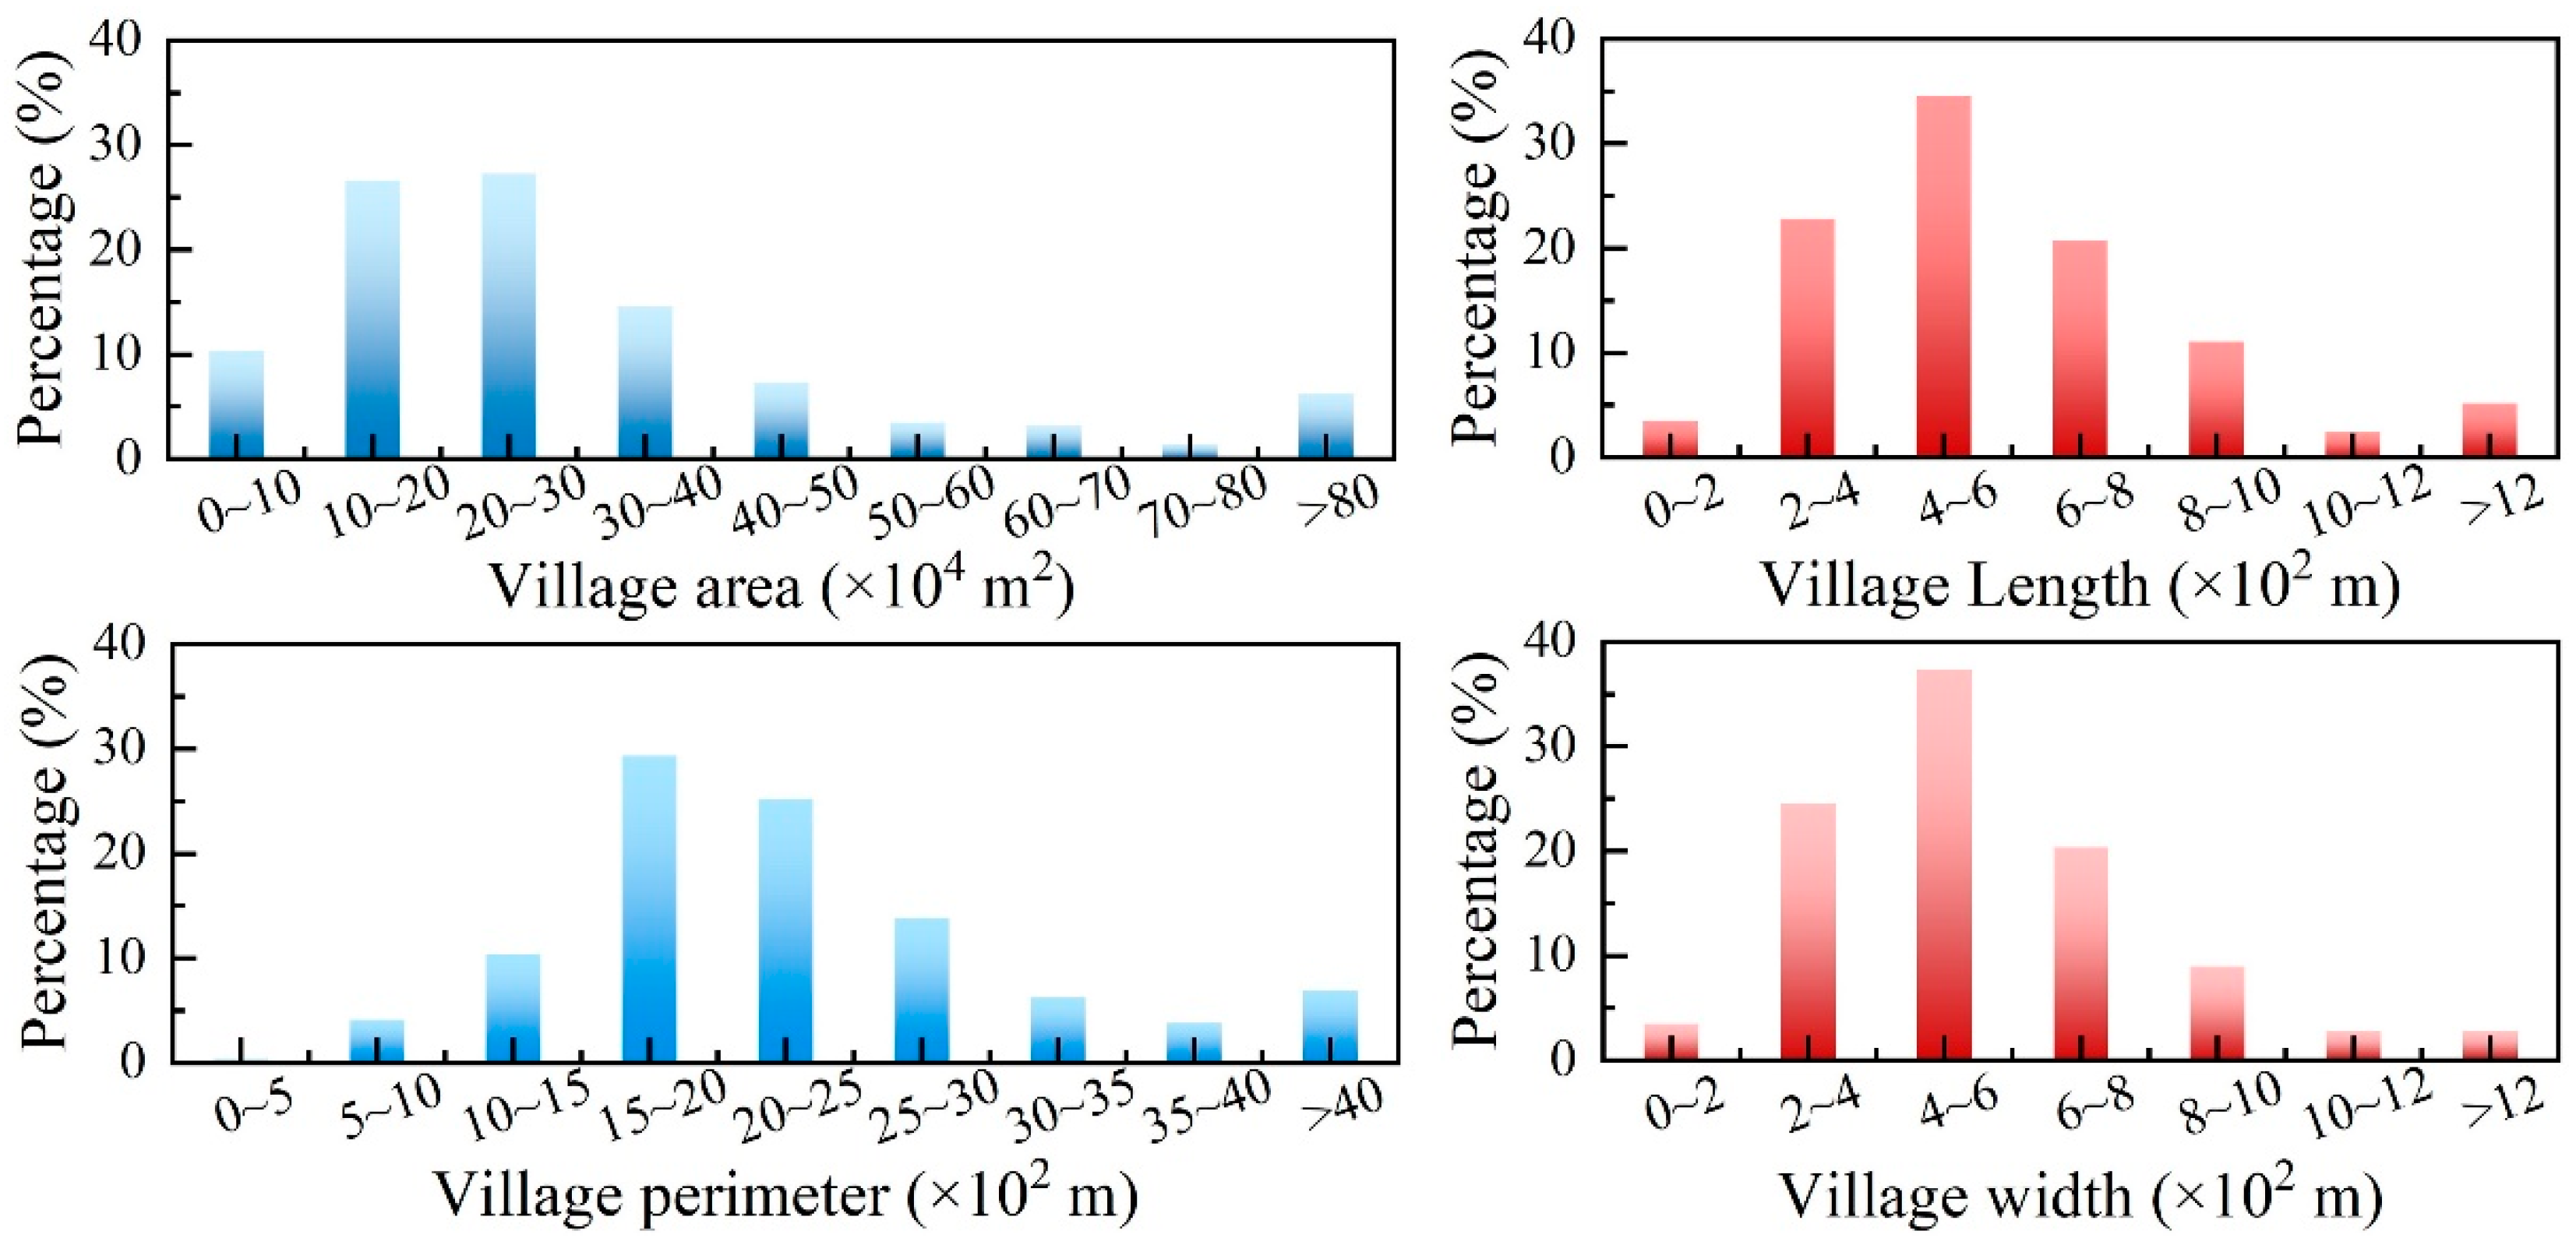
2.2. Morphological Statistics
3. Methodology
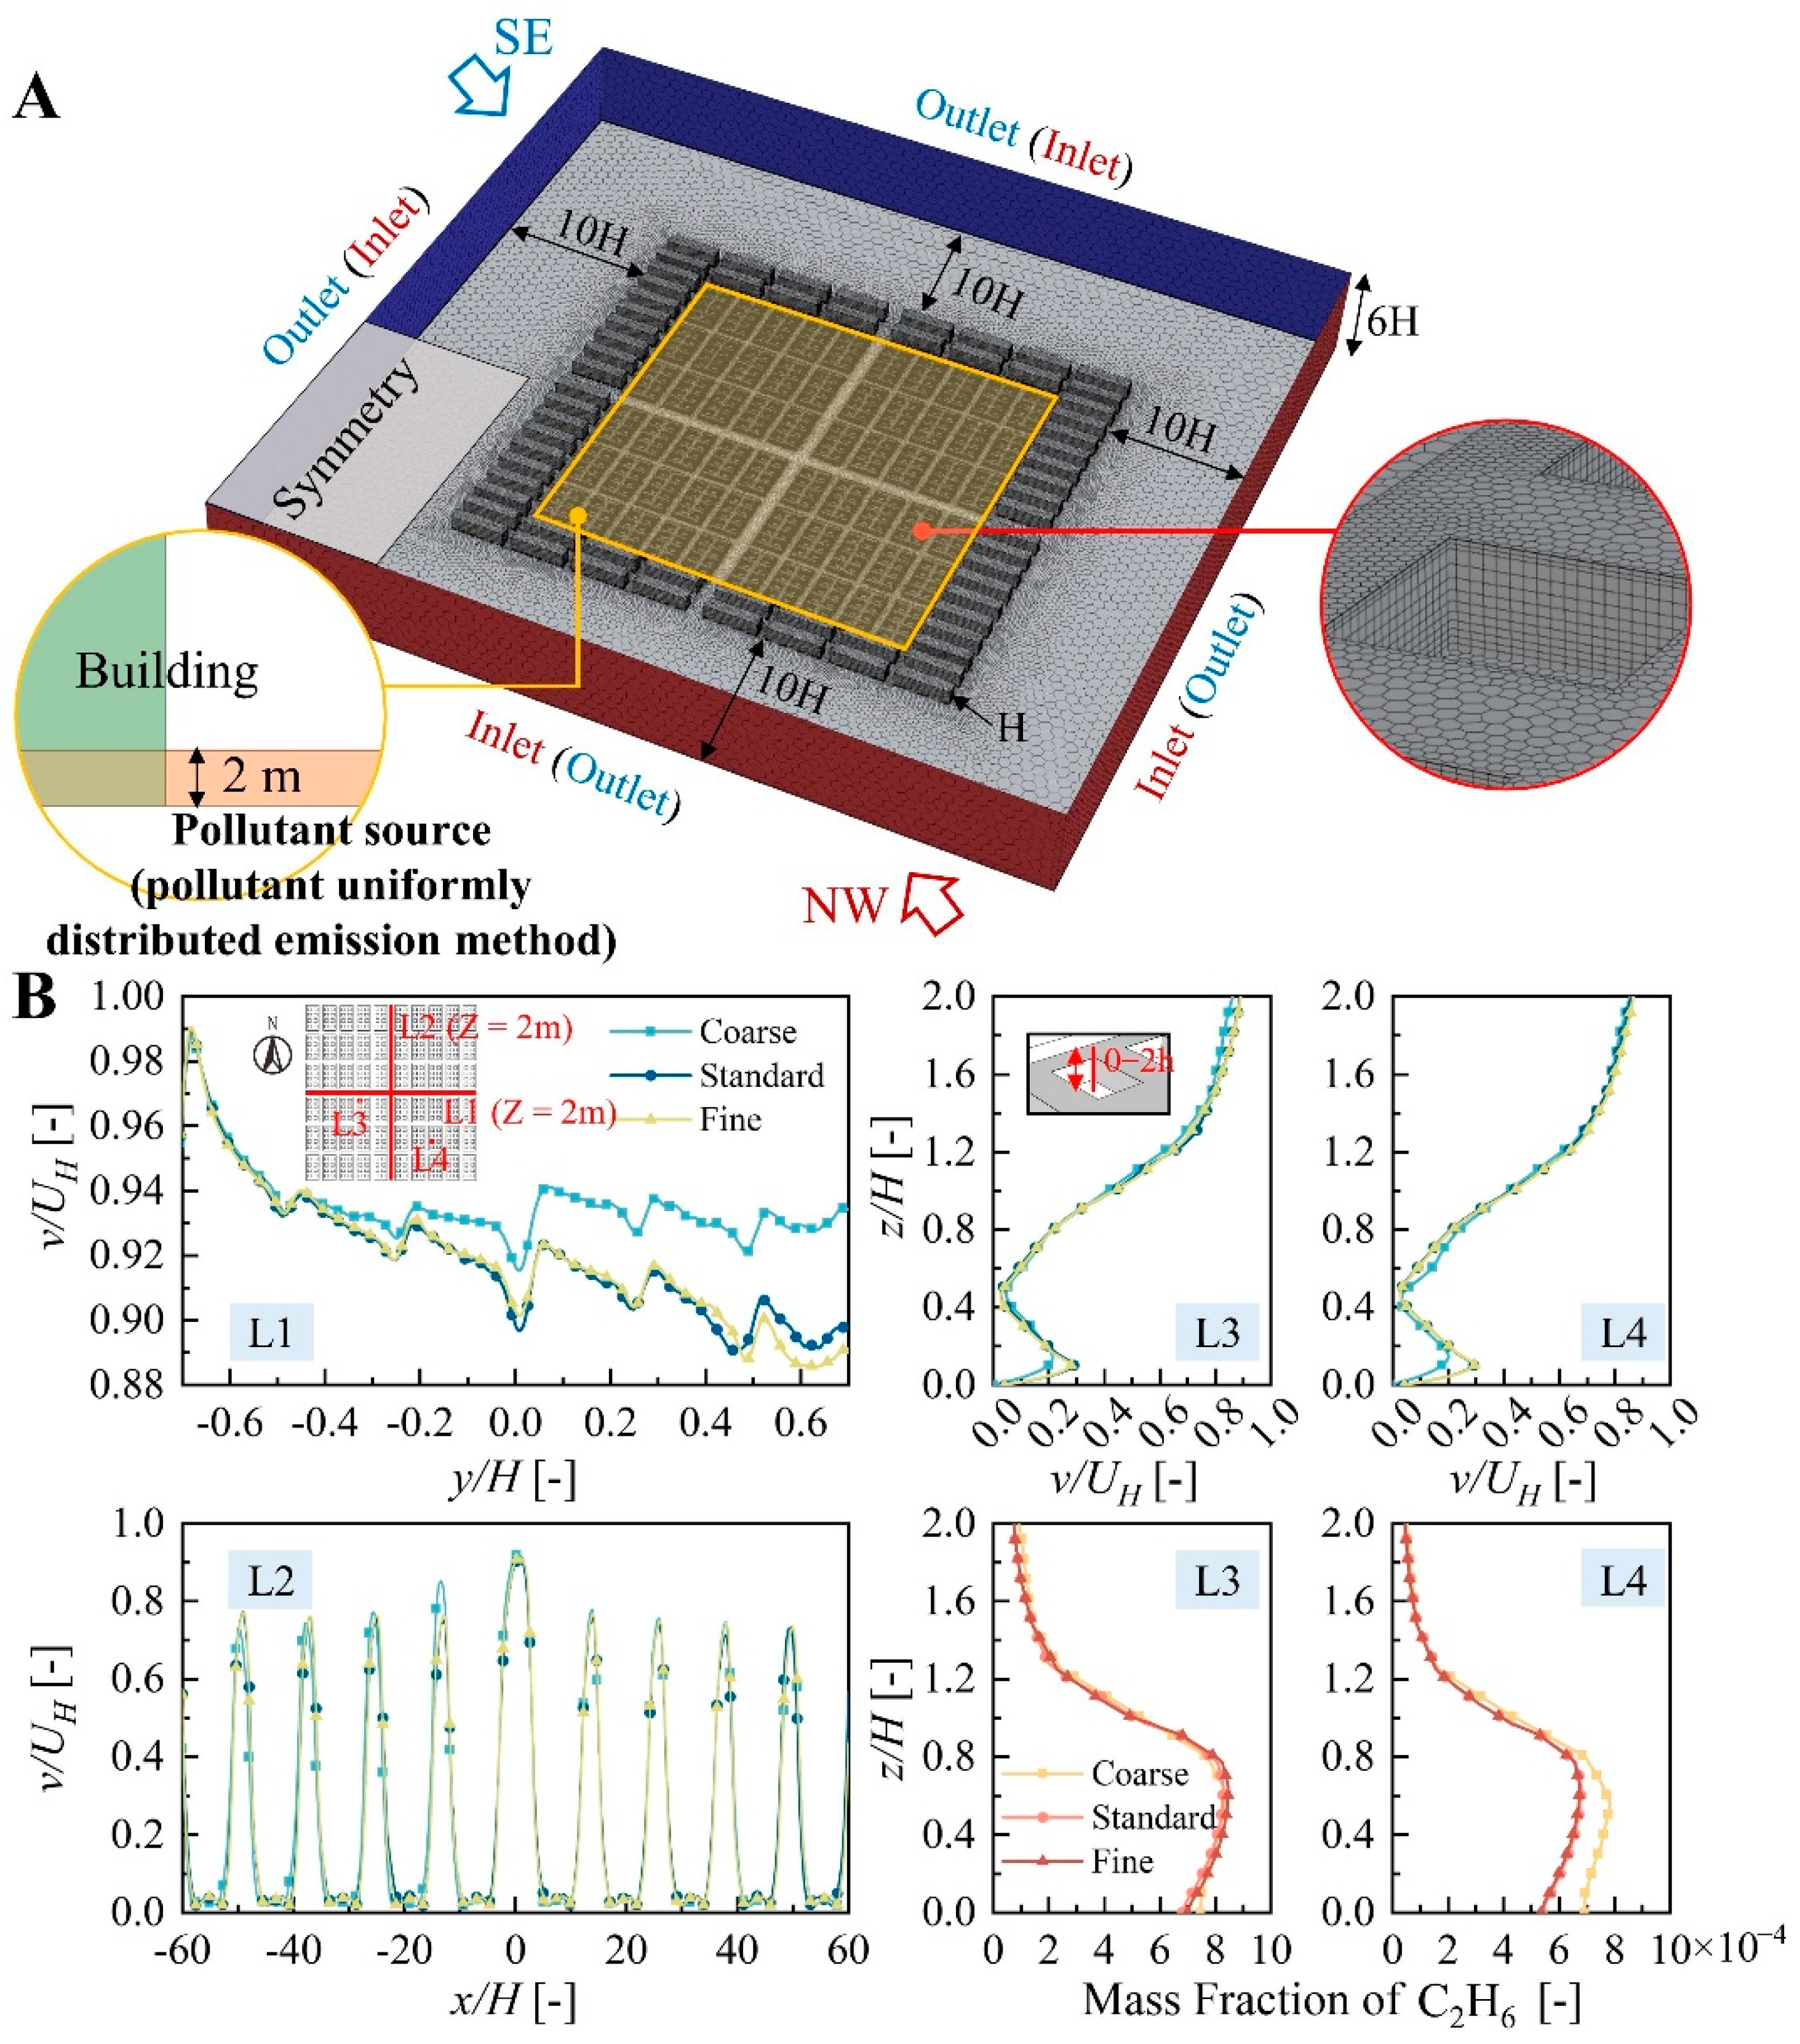
3.1. CFD Simulation Method
3.2. Grid Sensitivity and Validation
3.3. Analysis Indices
3.3.1. Normalized Pollutant Concentration
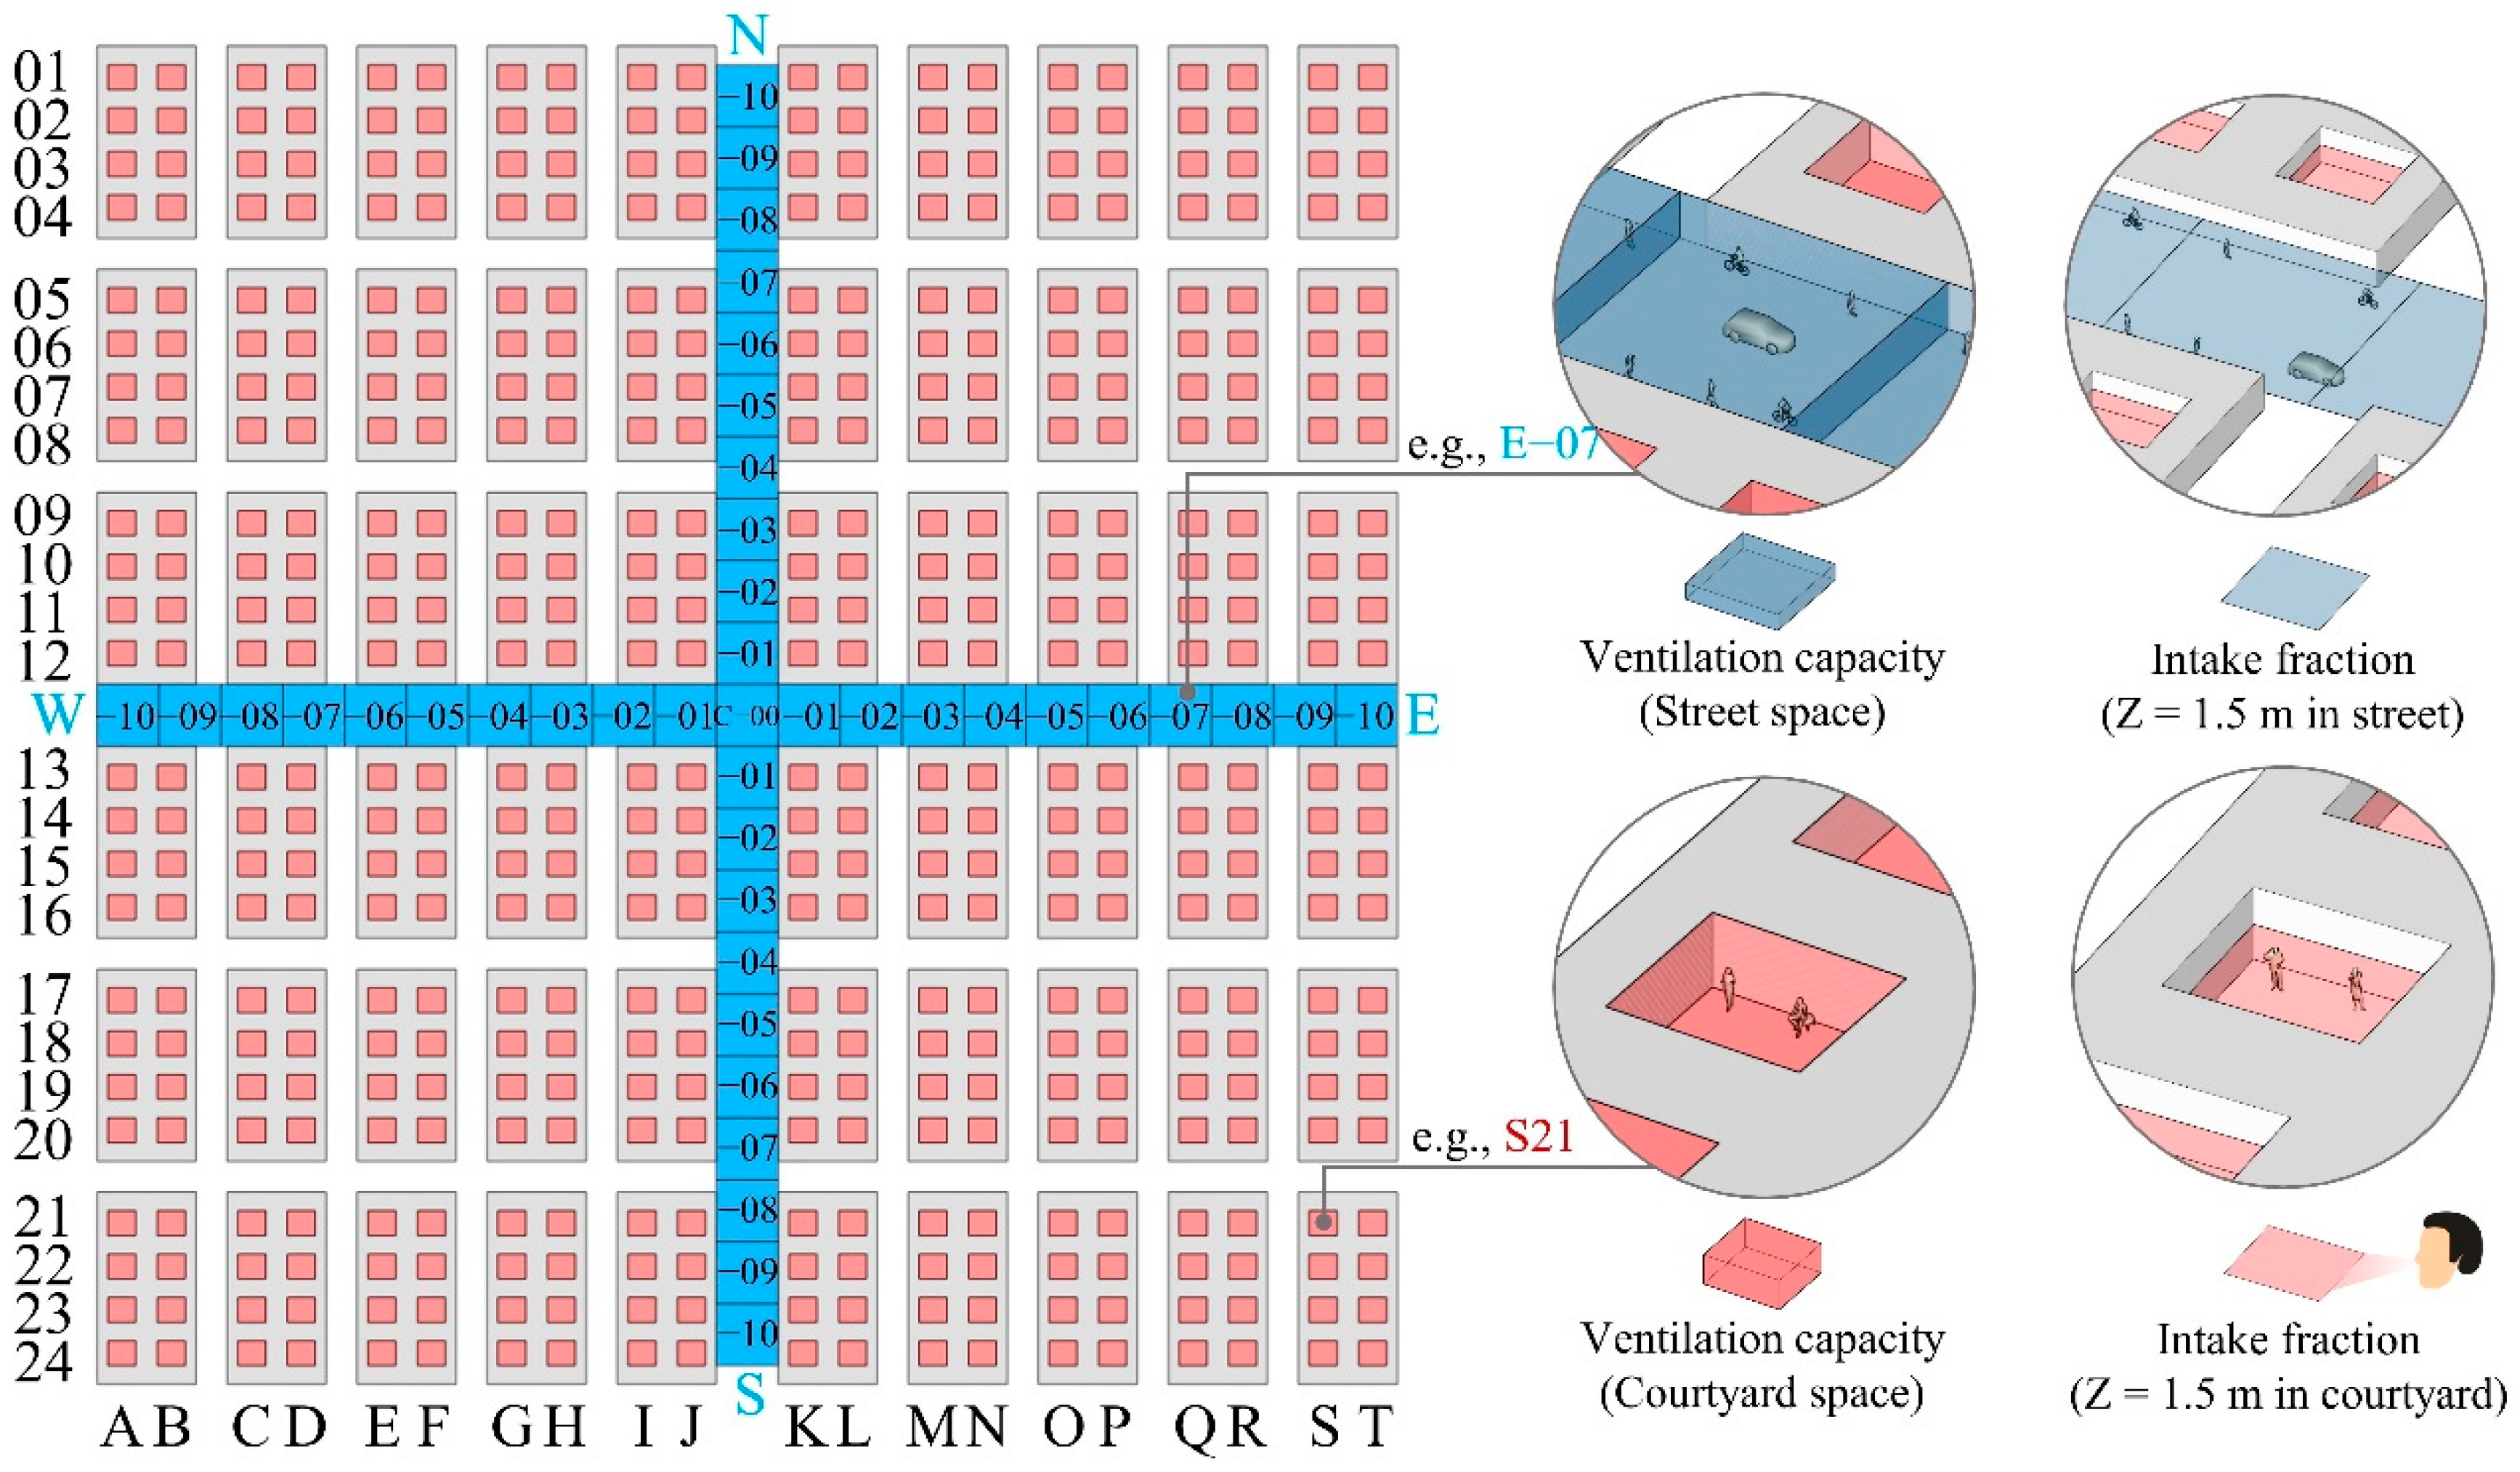
3.3.2. Purging Flow Rate
3.3.3. Intake Fraction
4. Results and Discussion
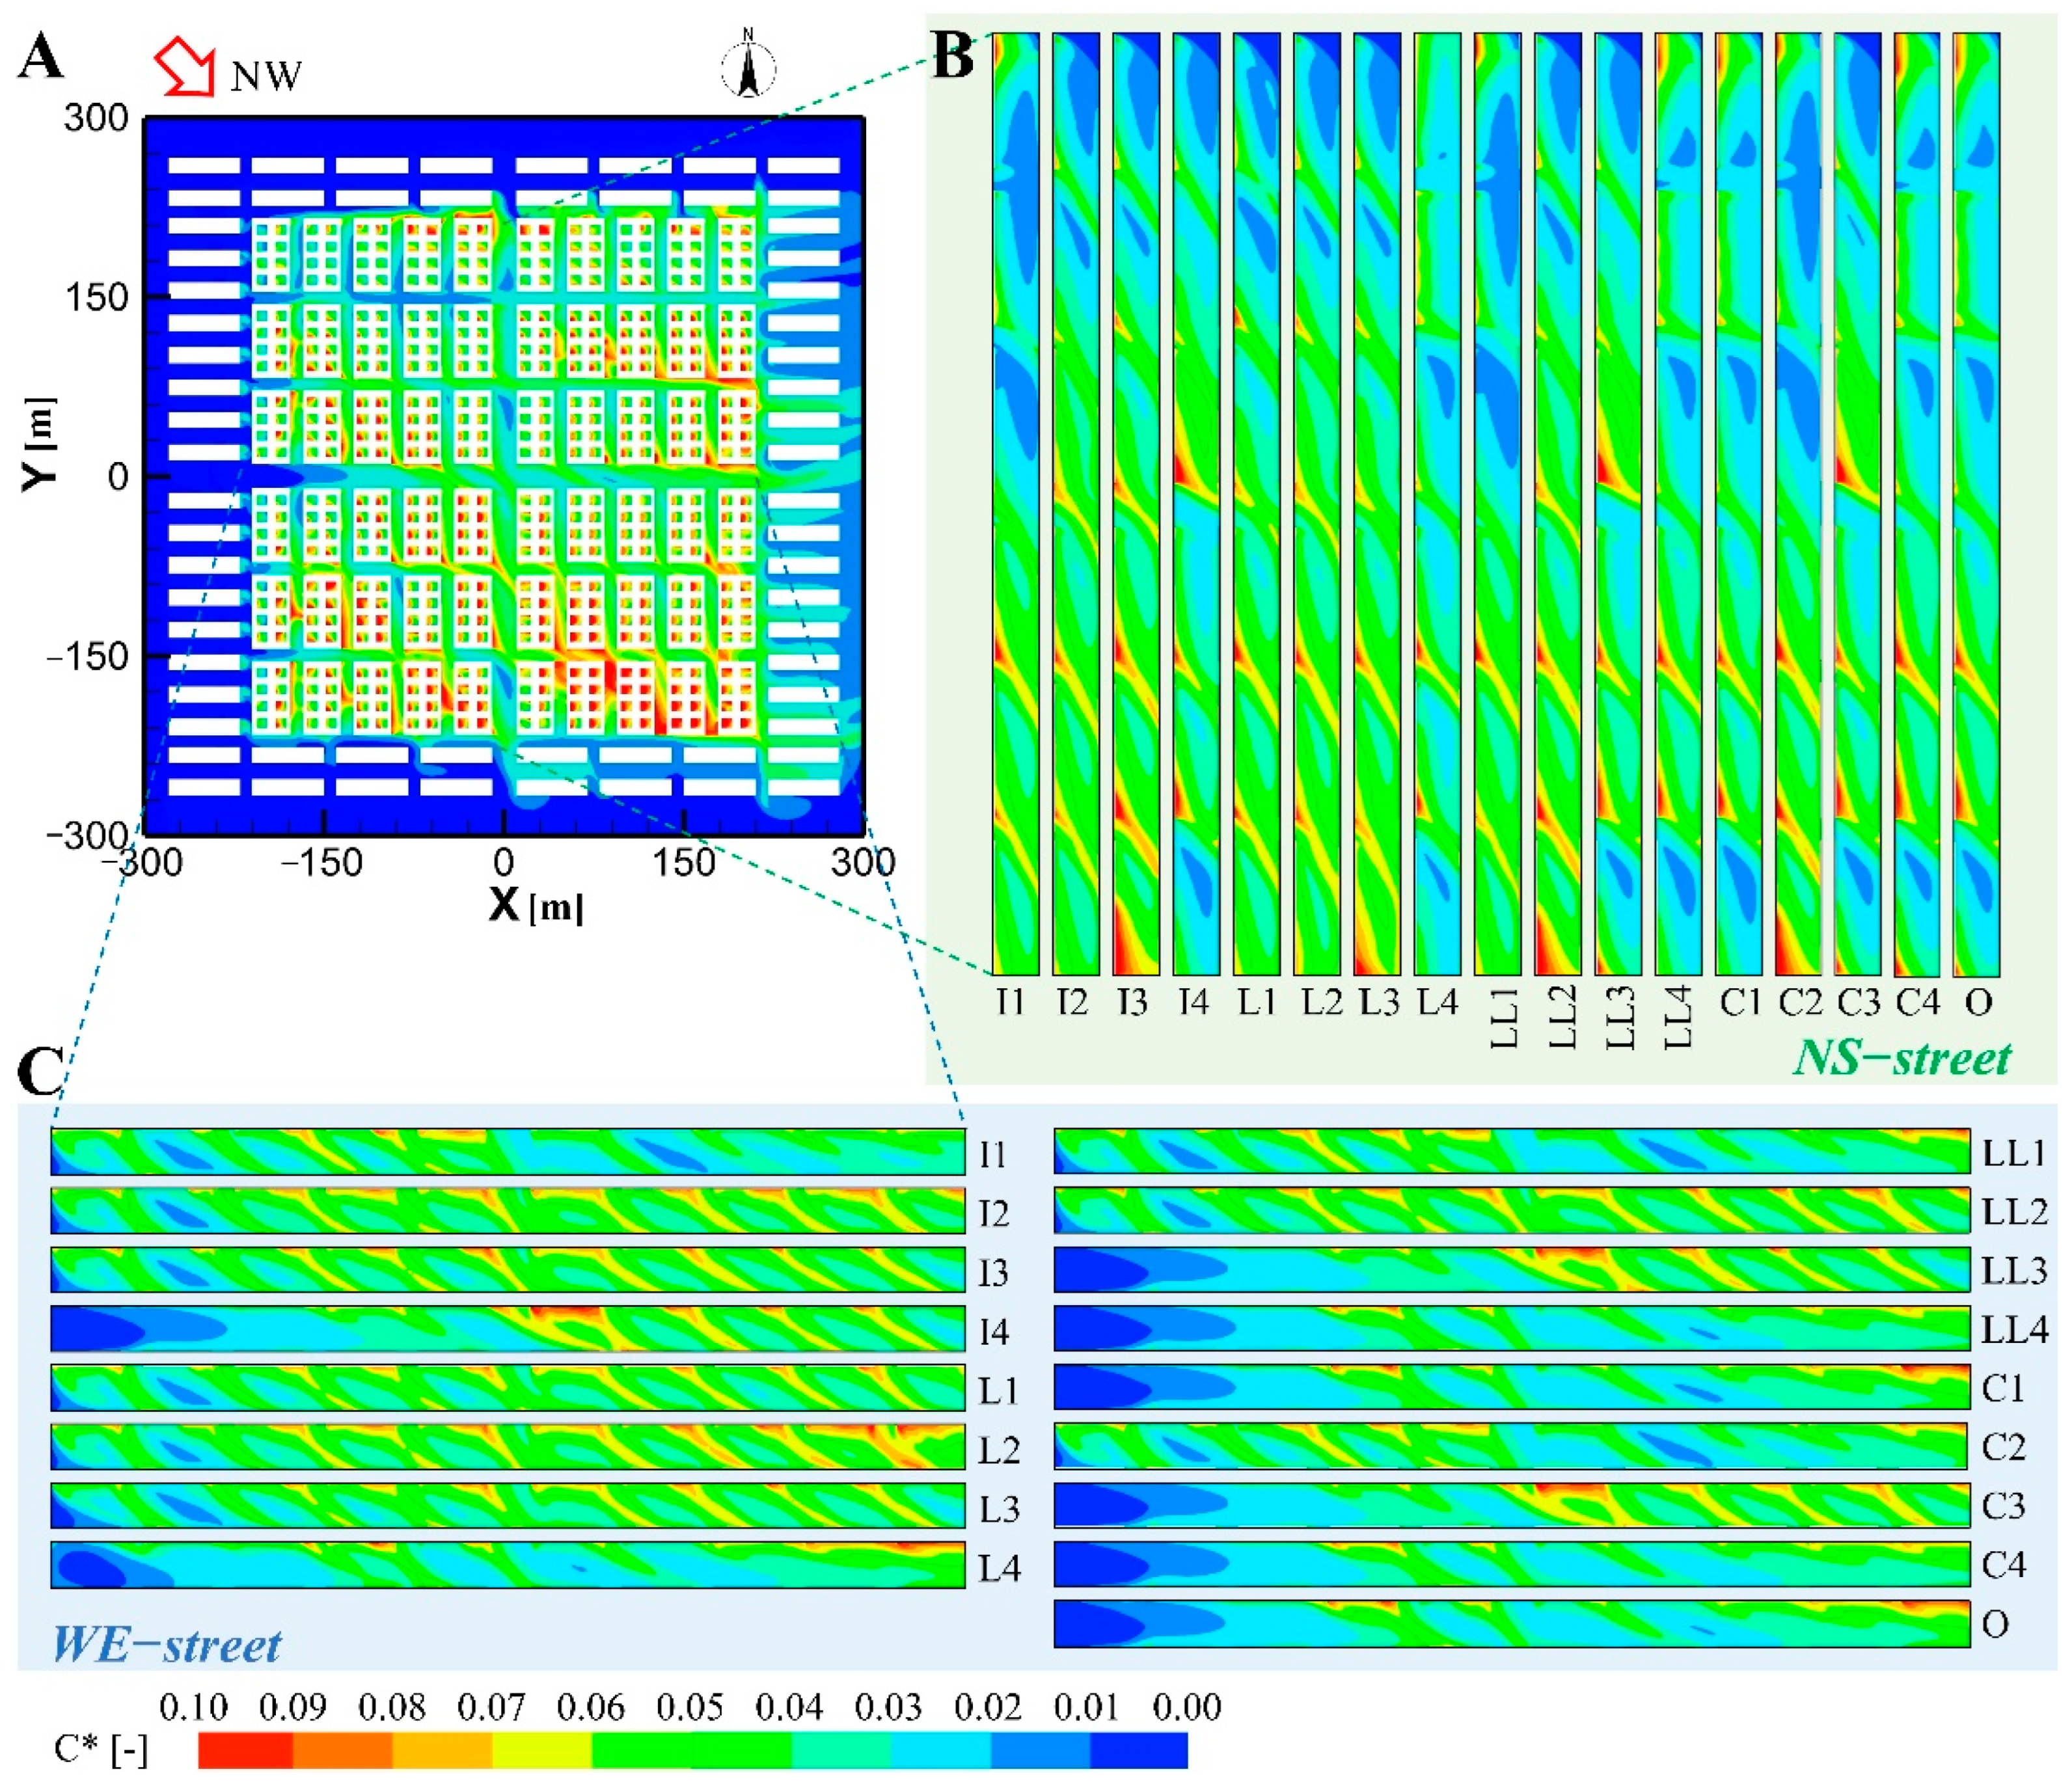
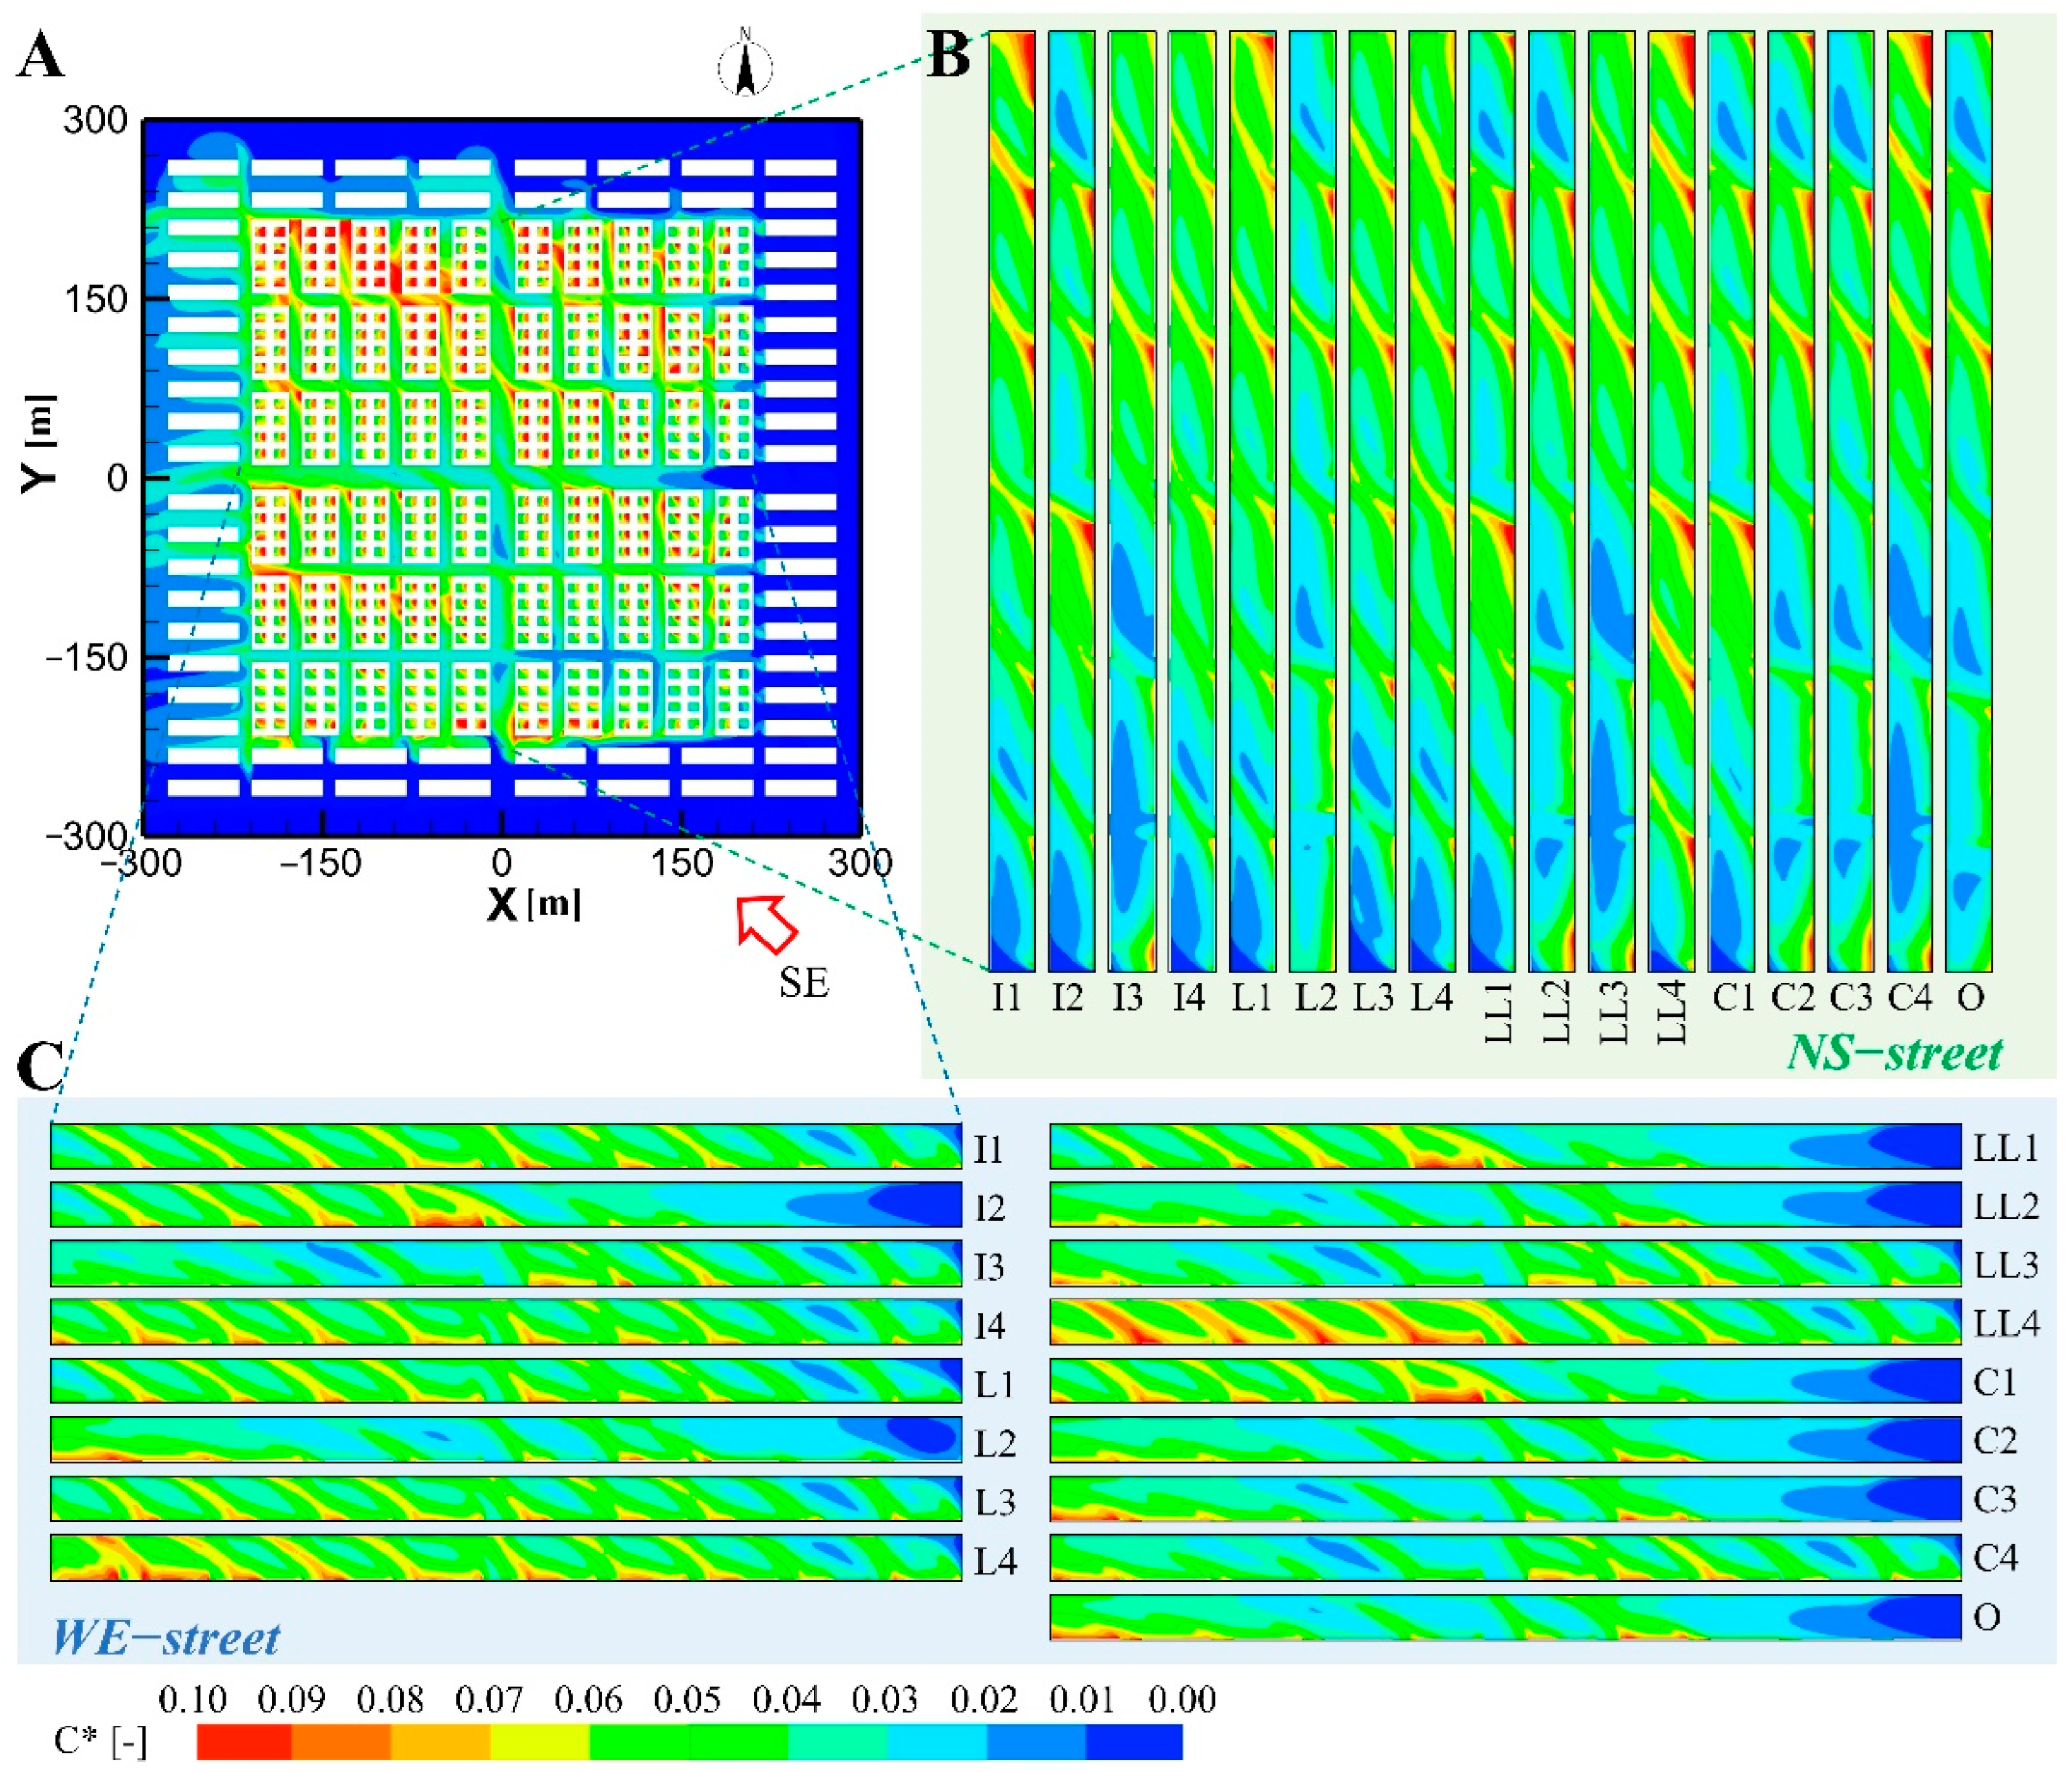
4.1. Pollutant Field
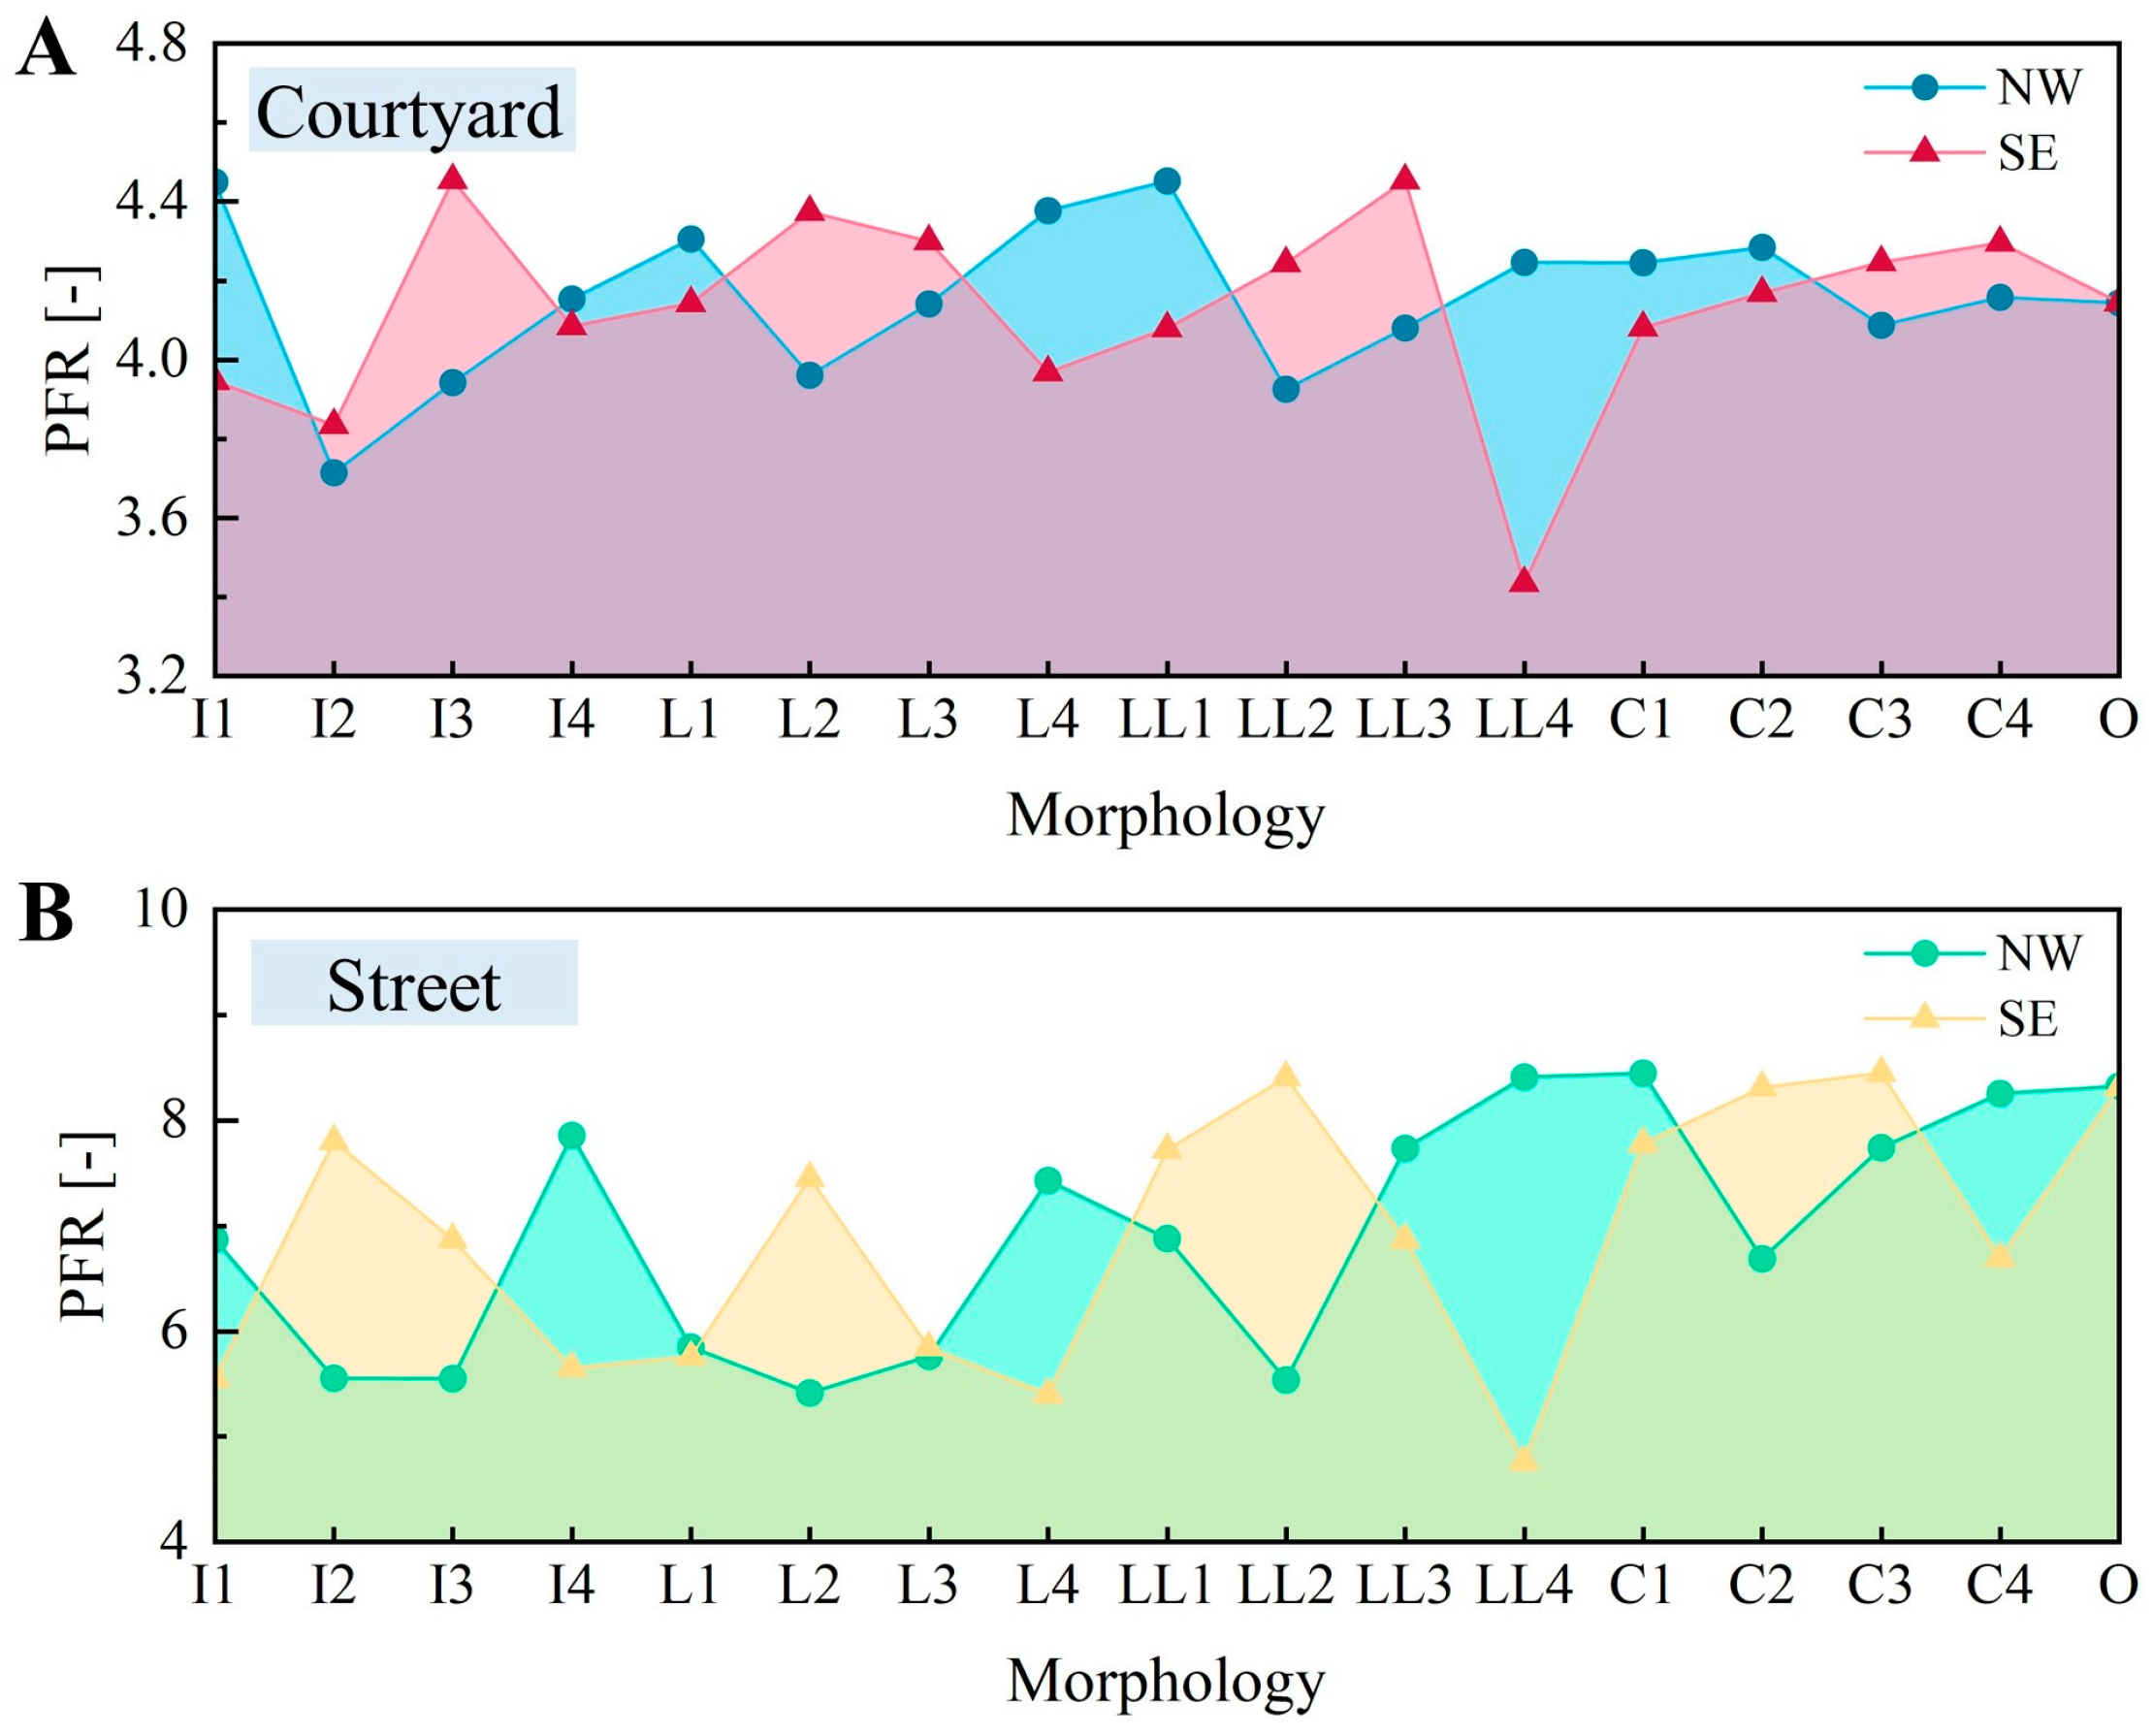
4.2. Ventilation Capacity
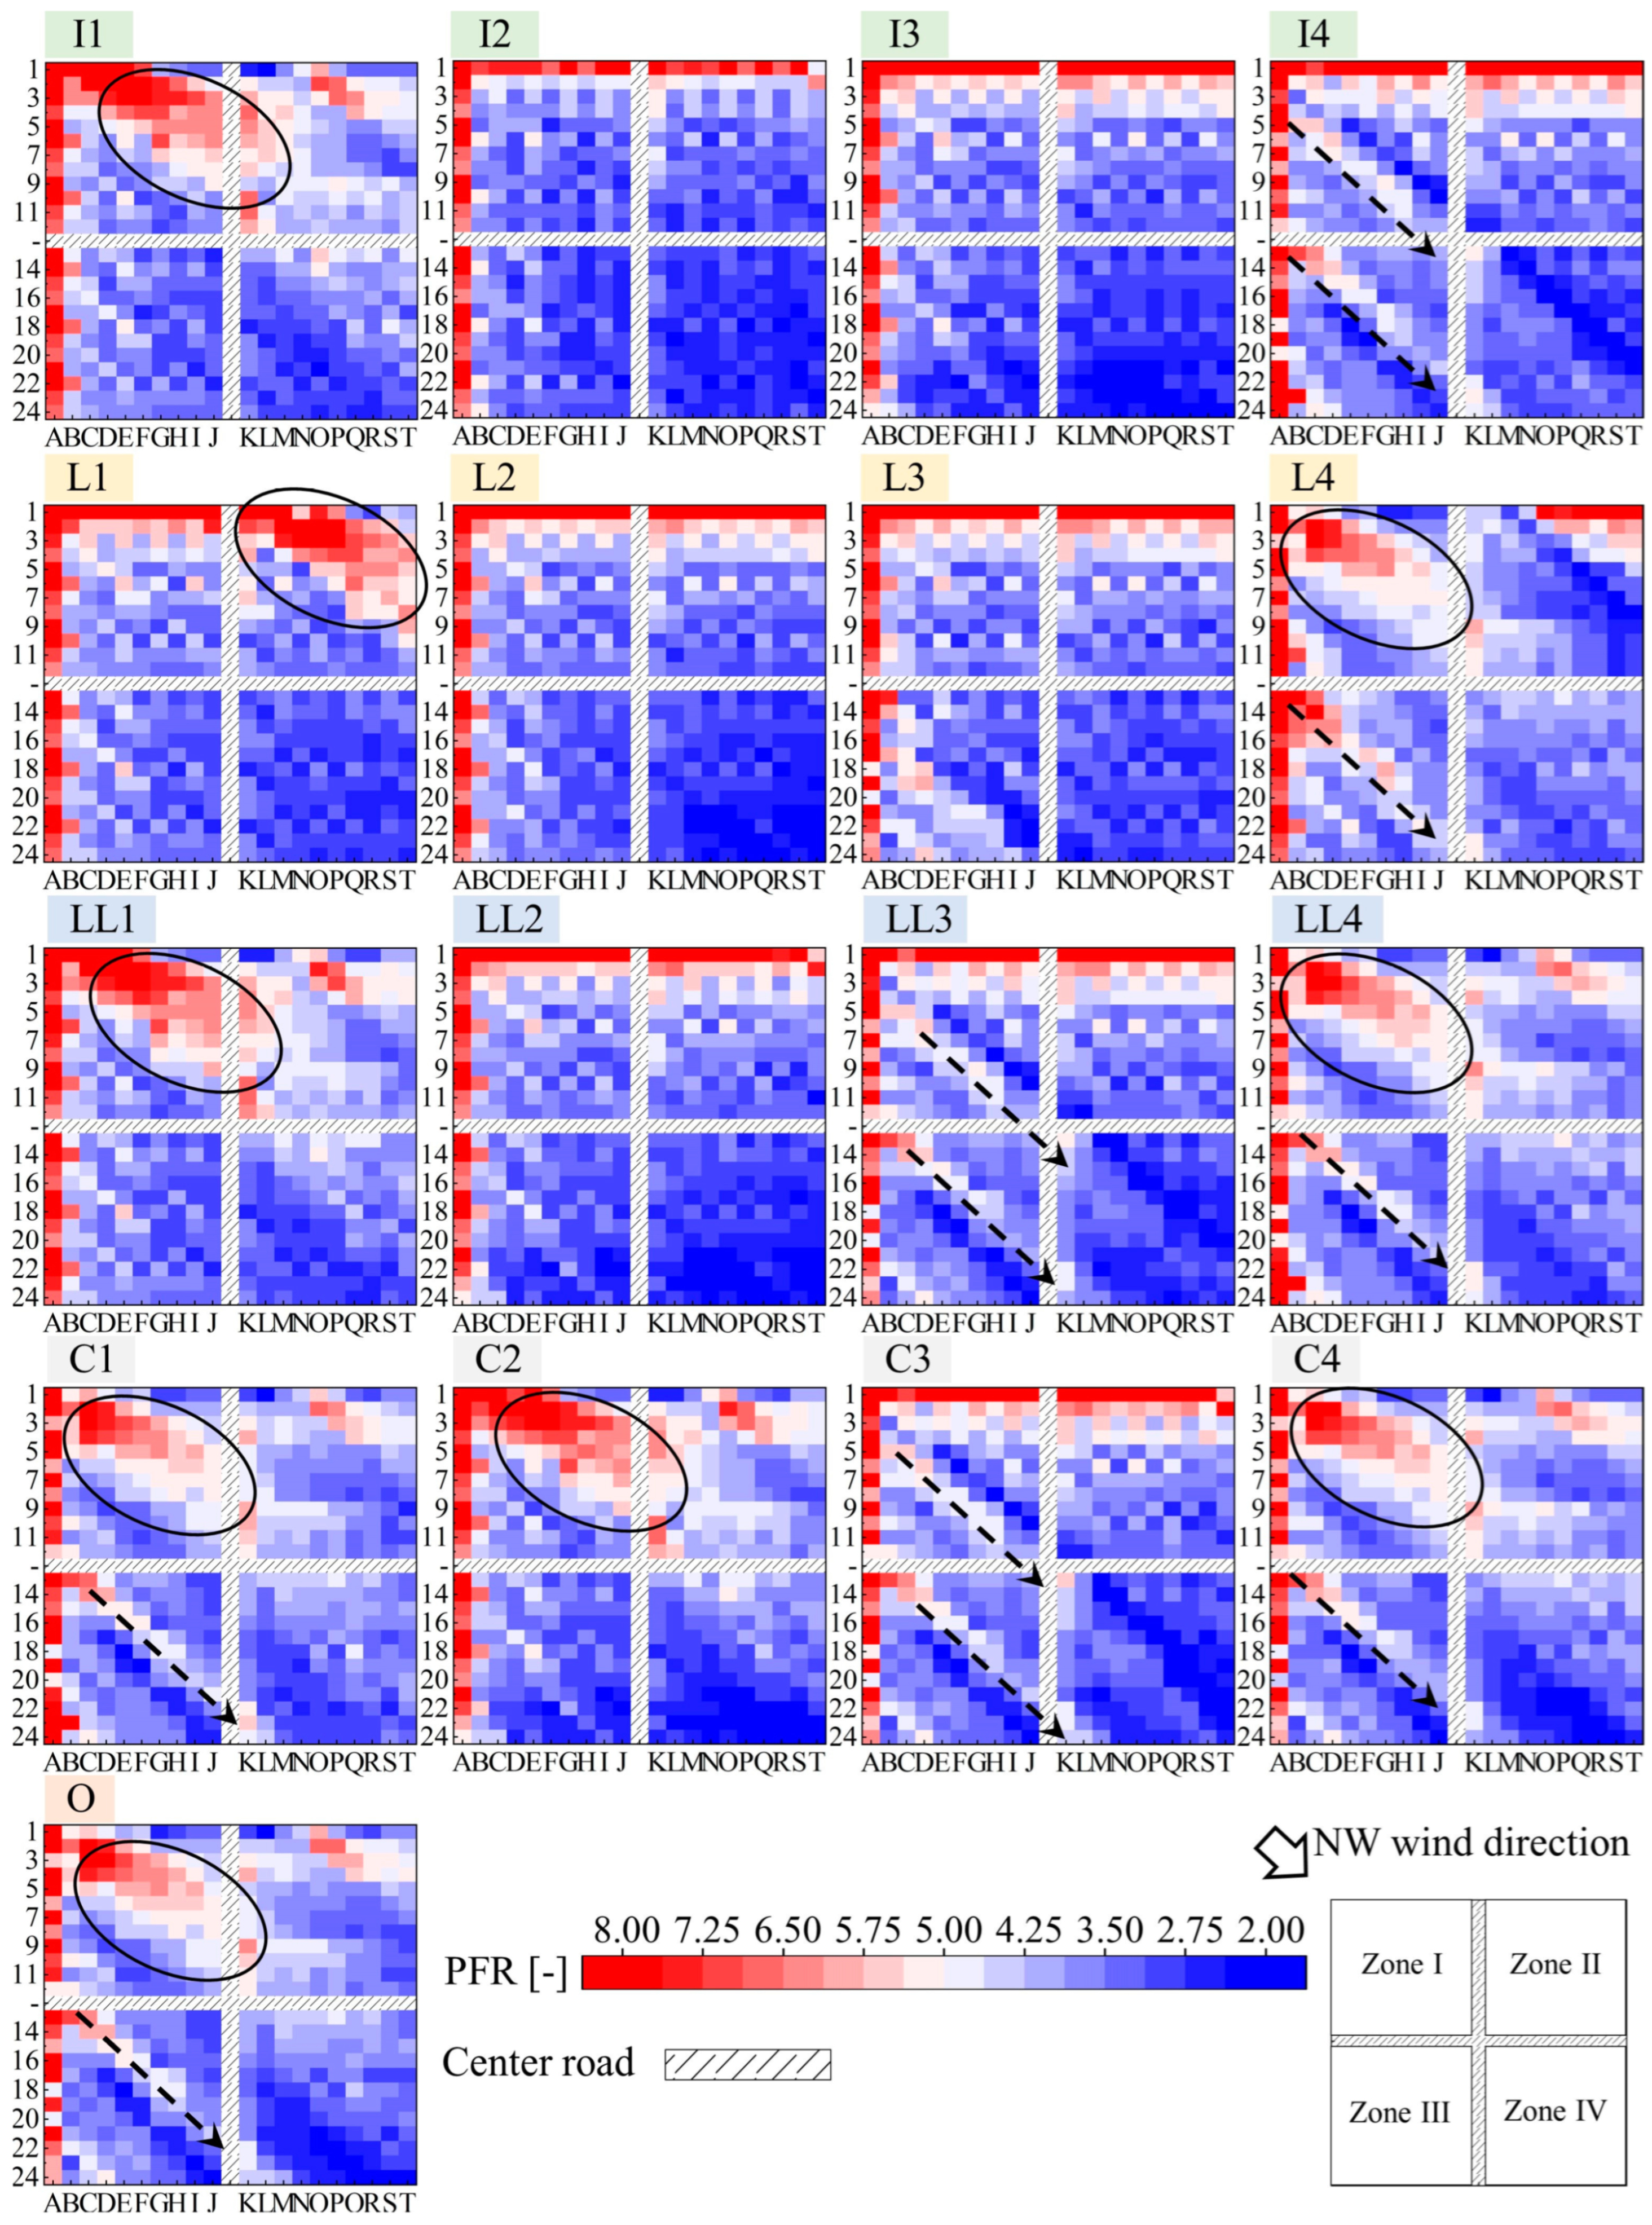
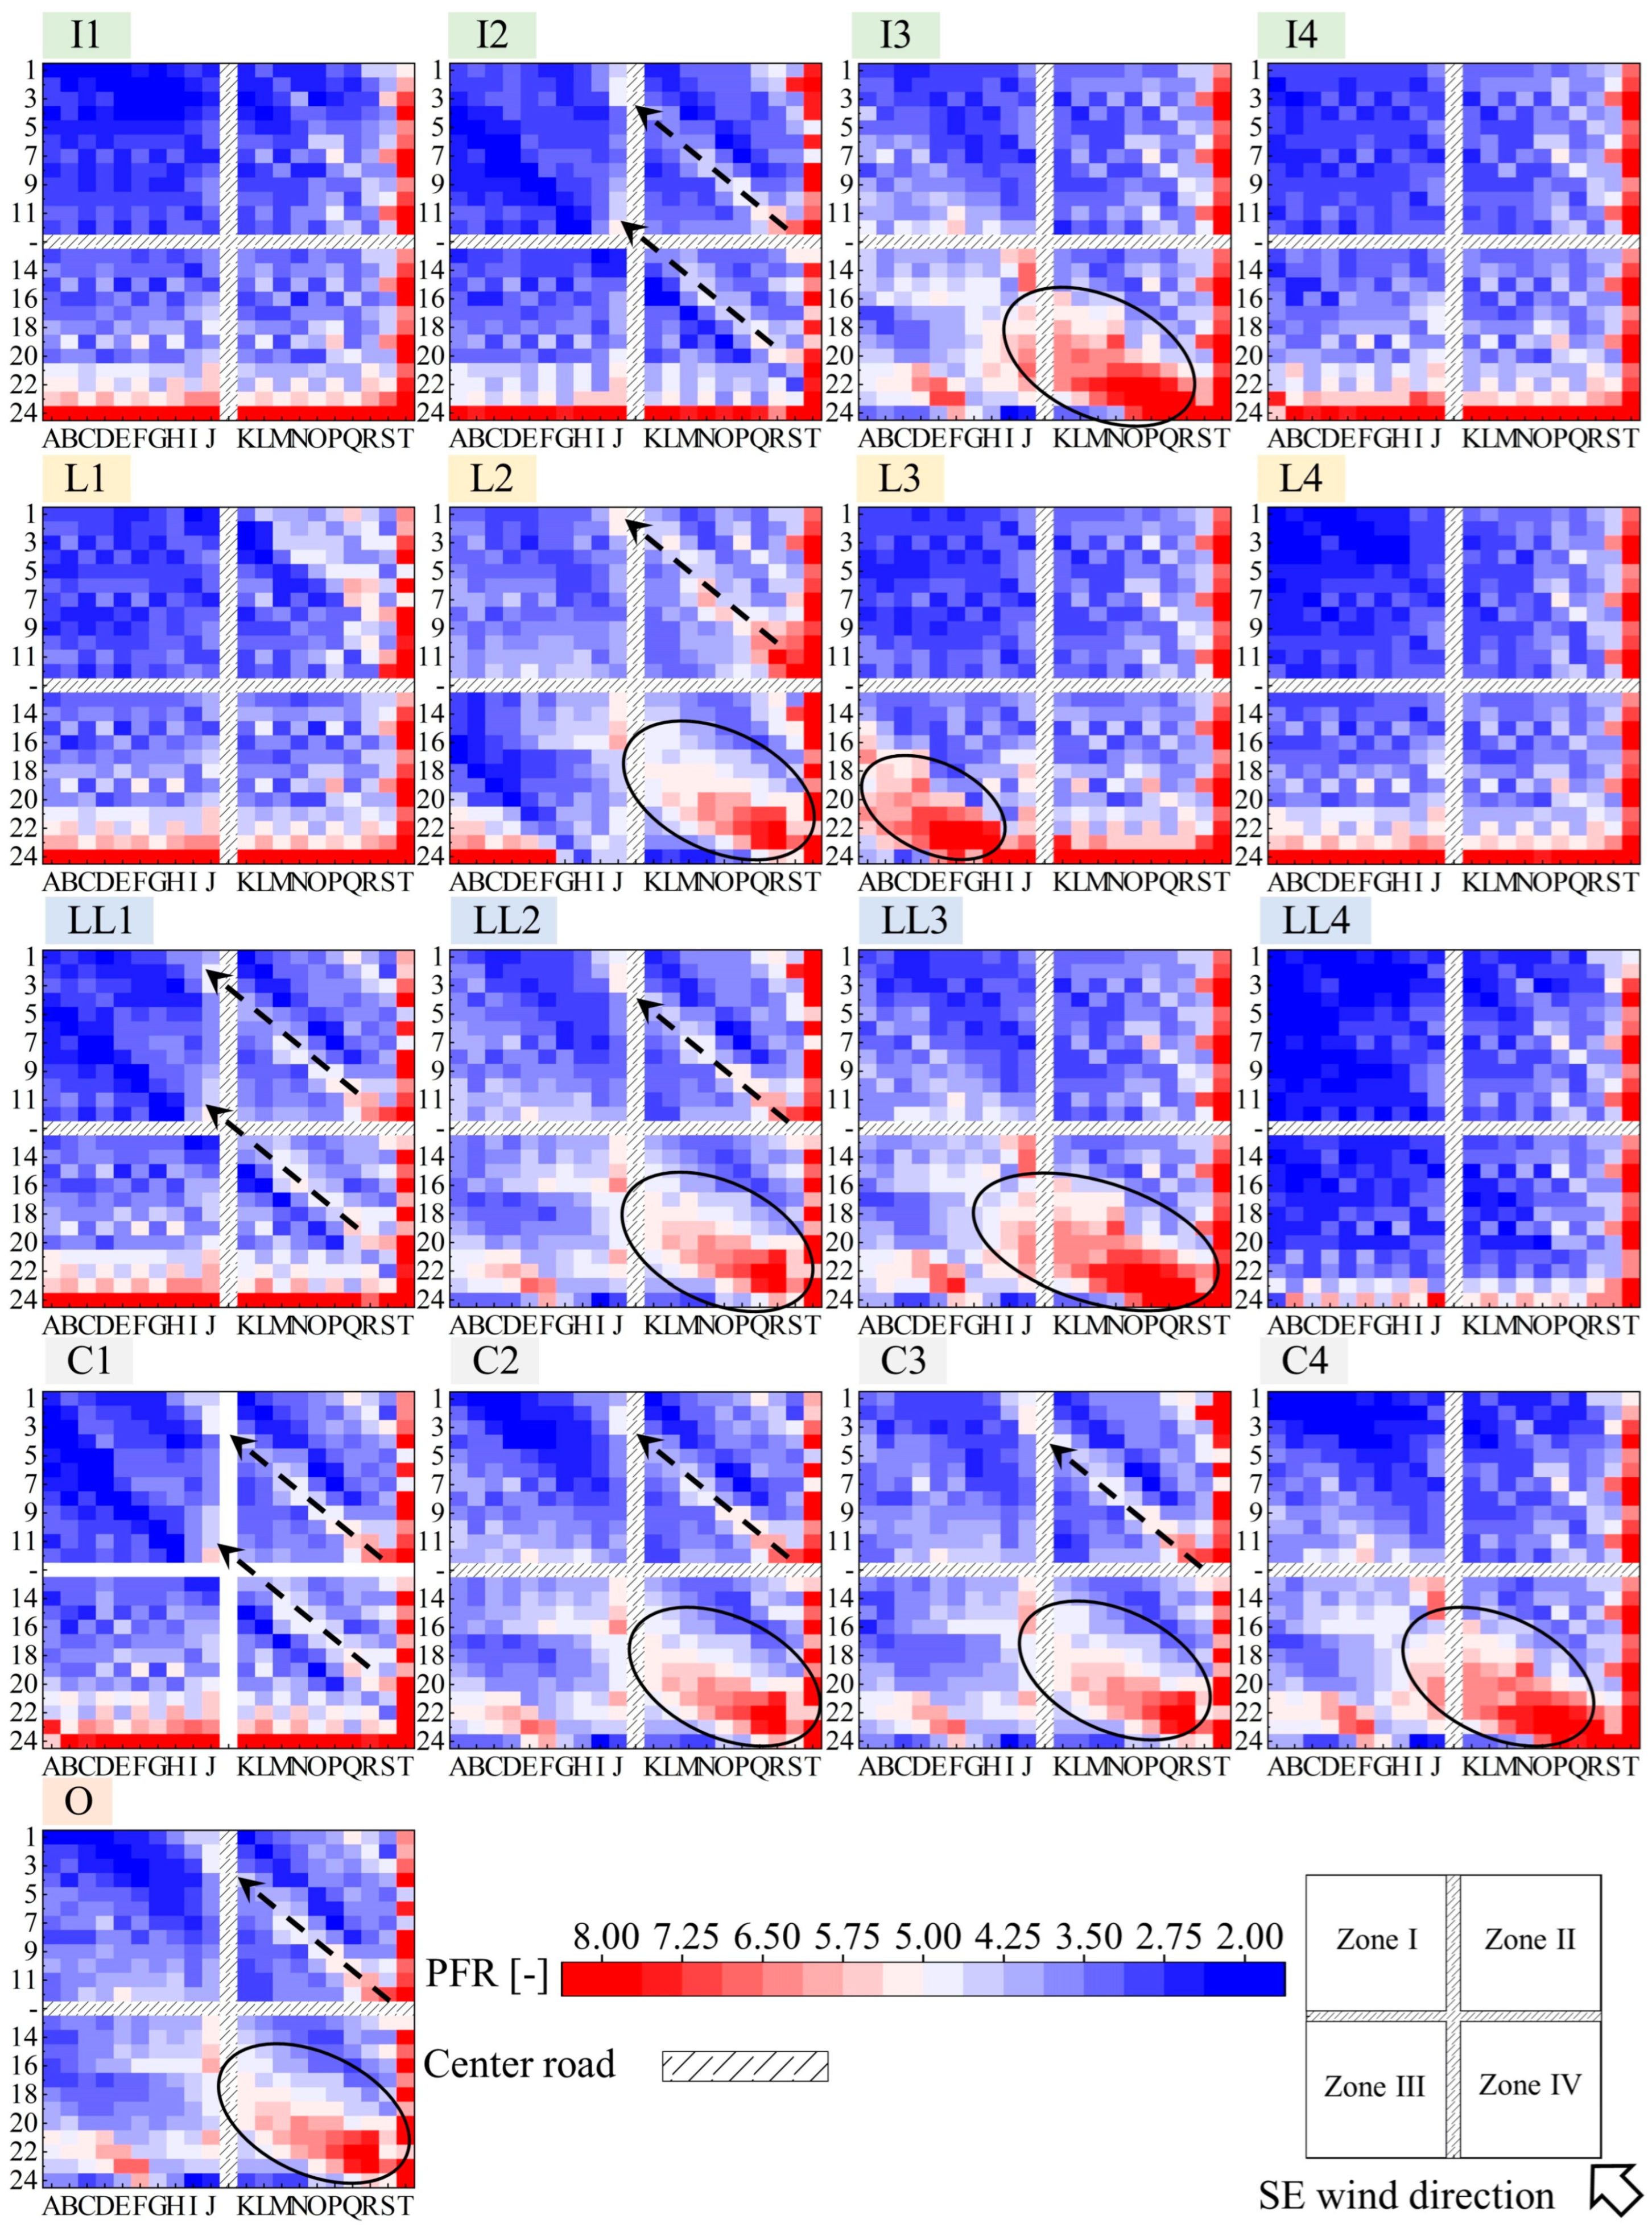
4.2.1. Courtyard
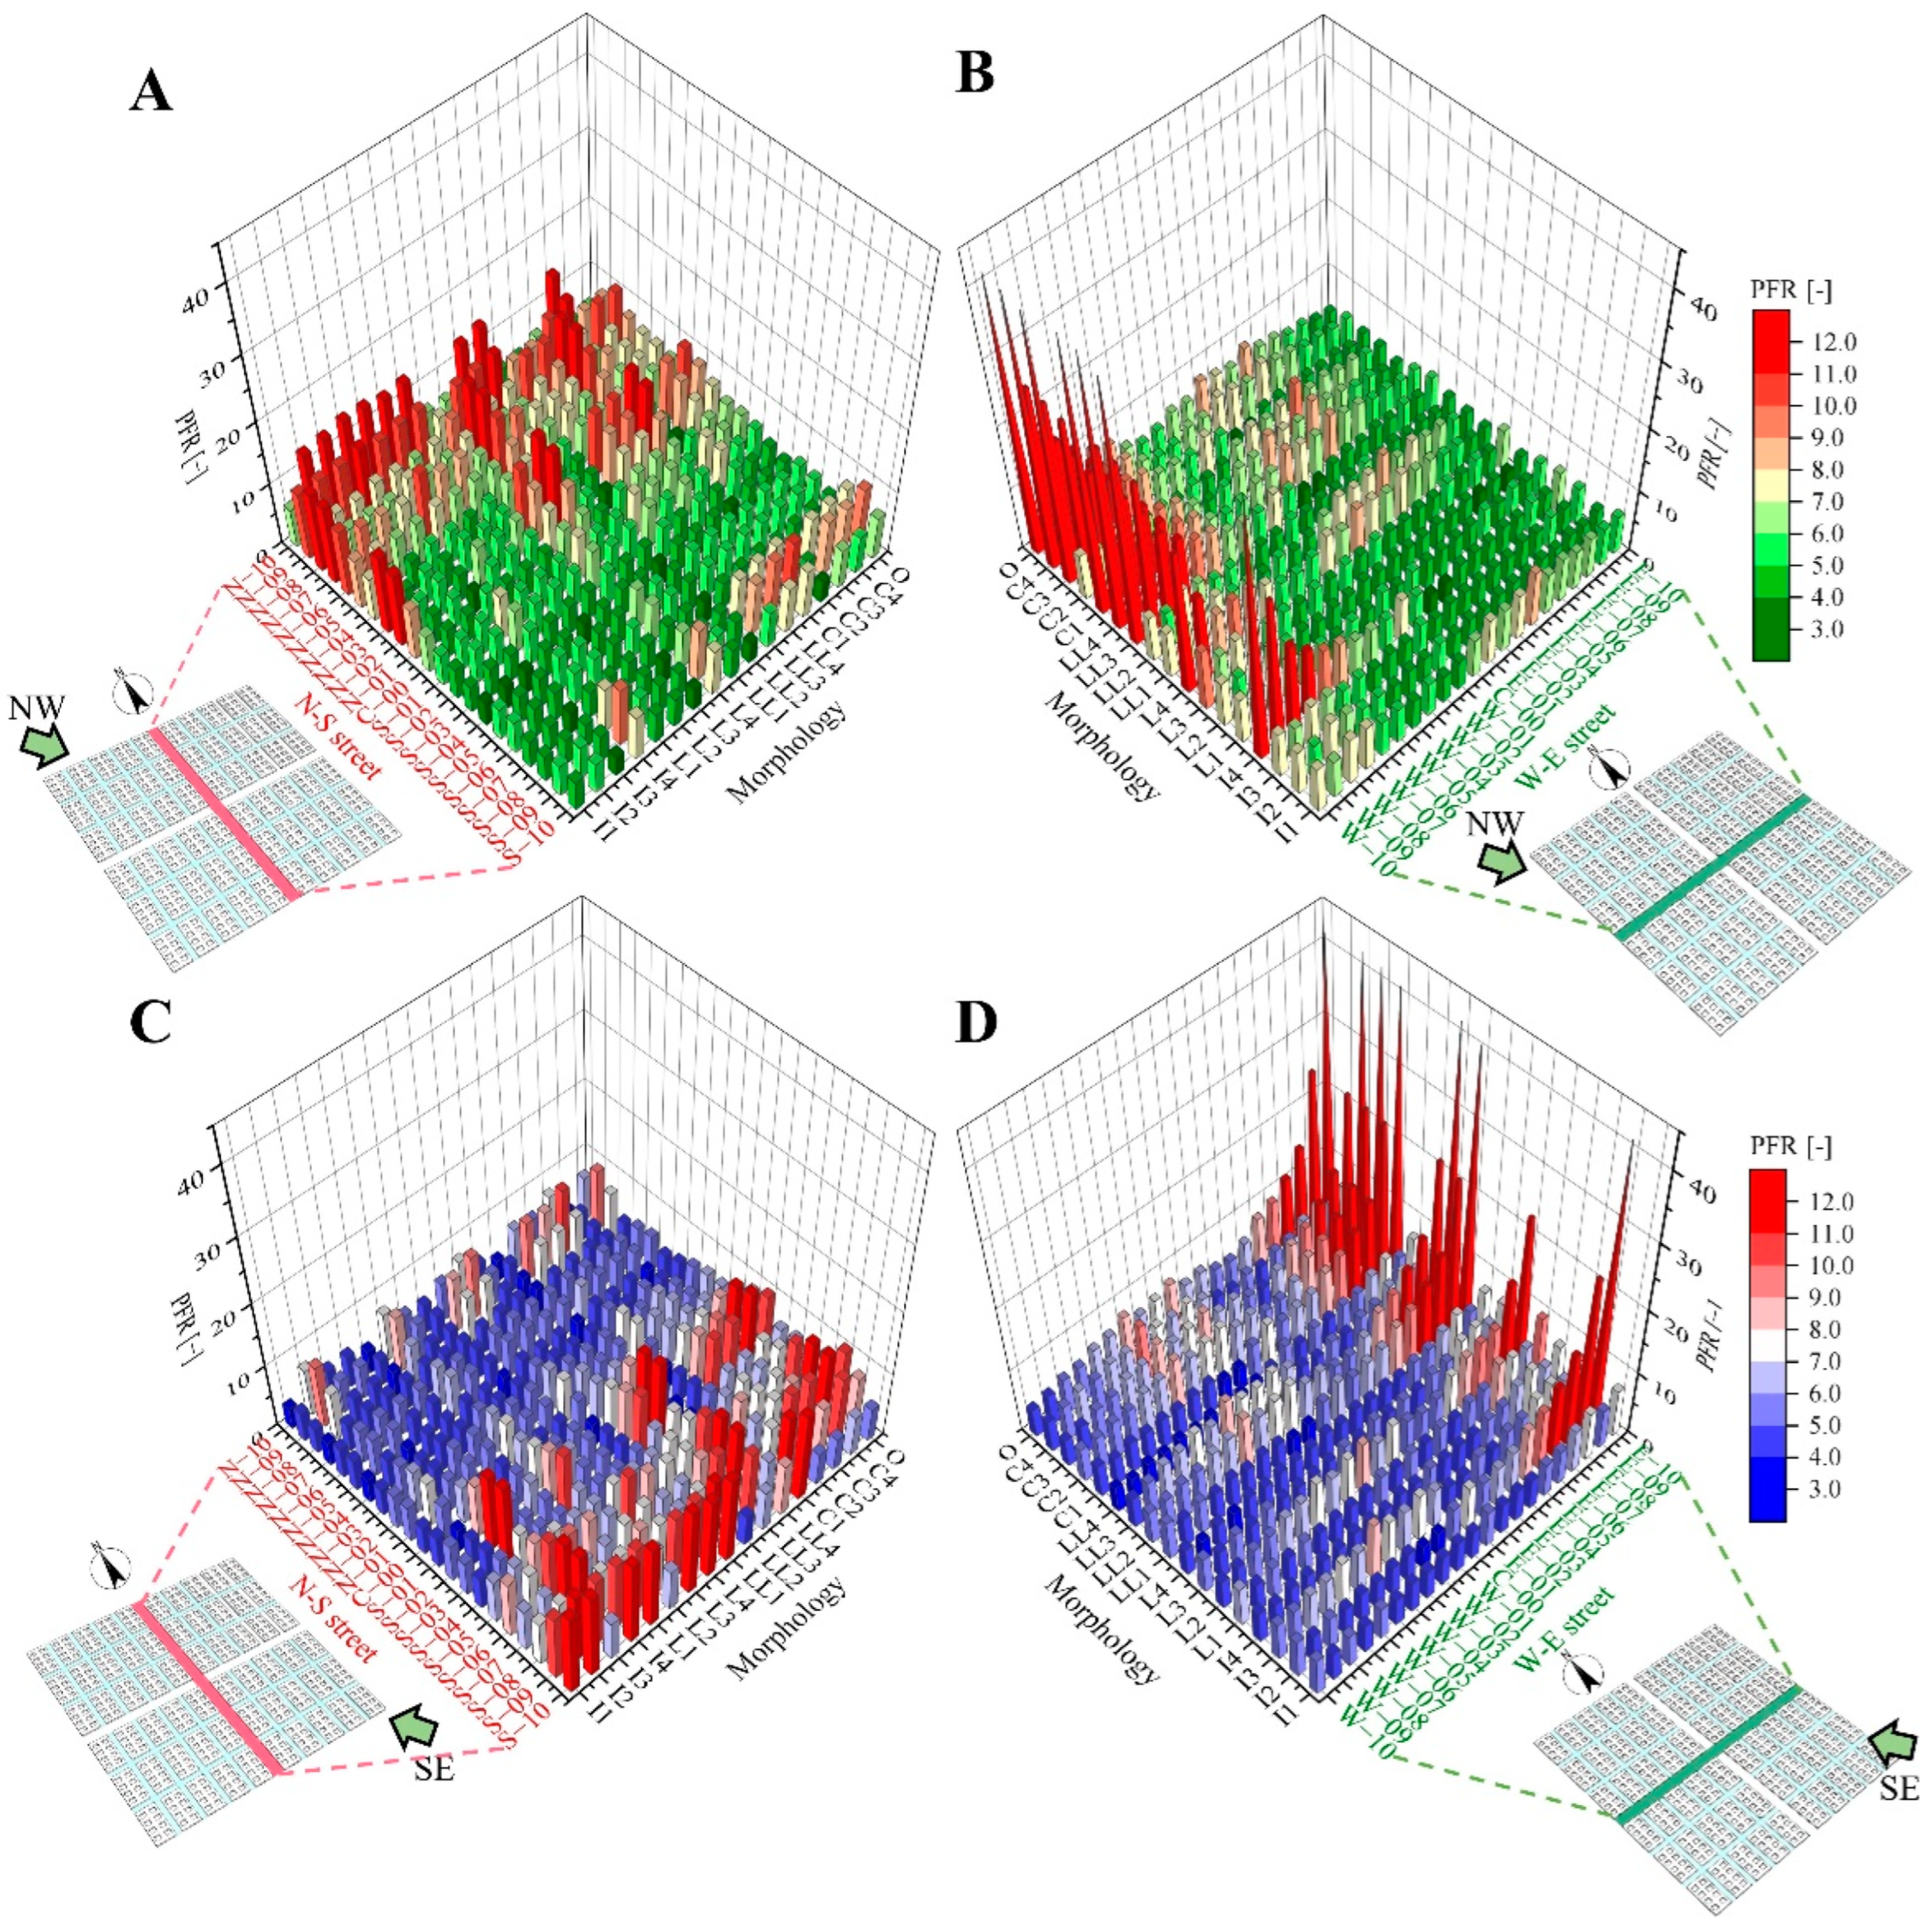
4.2.2. Street
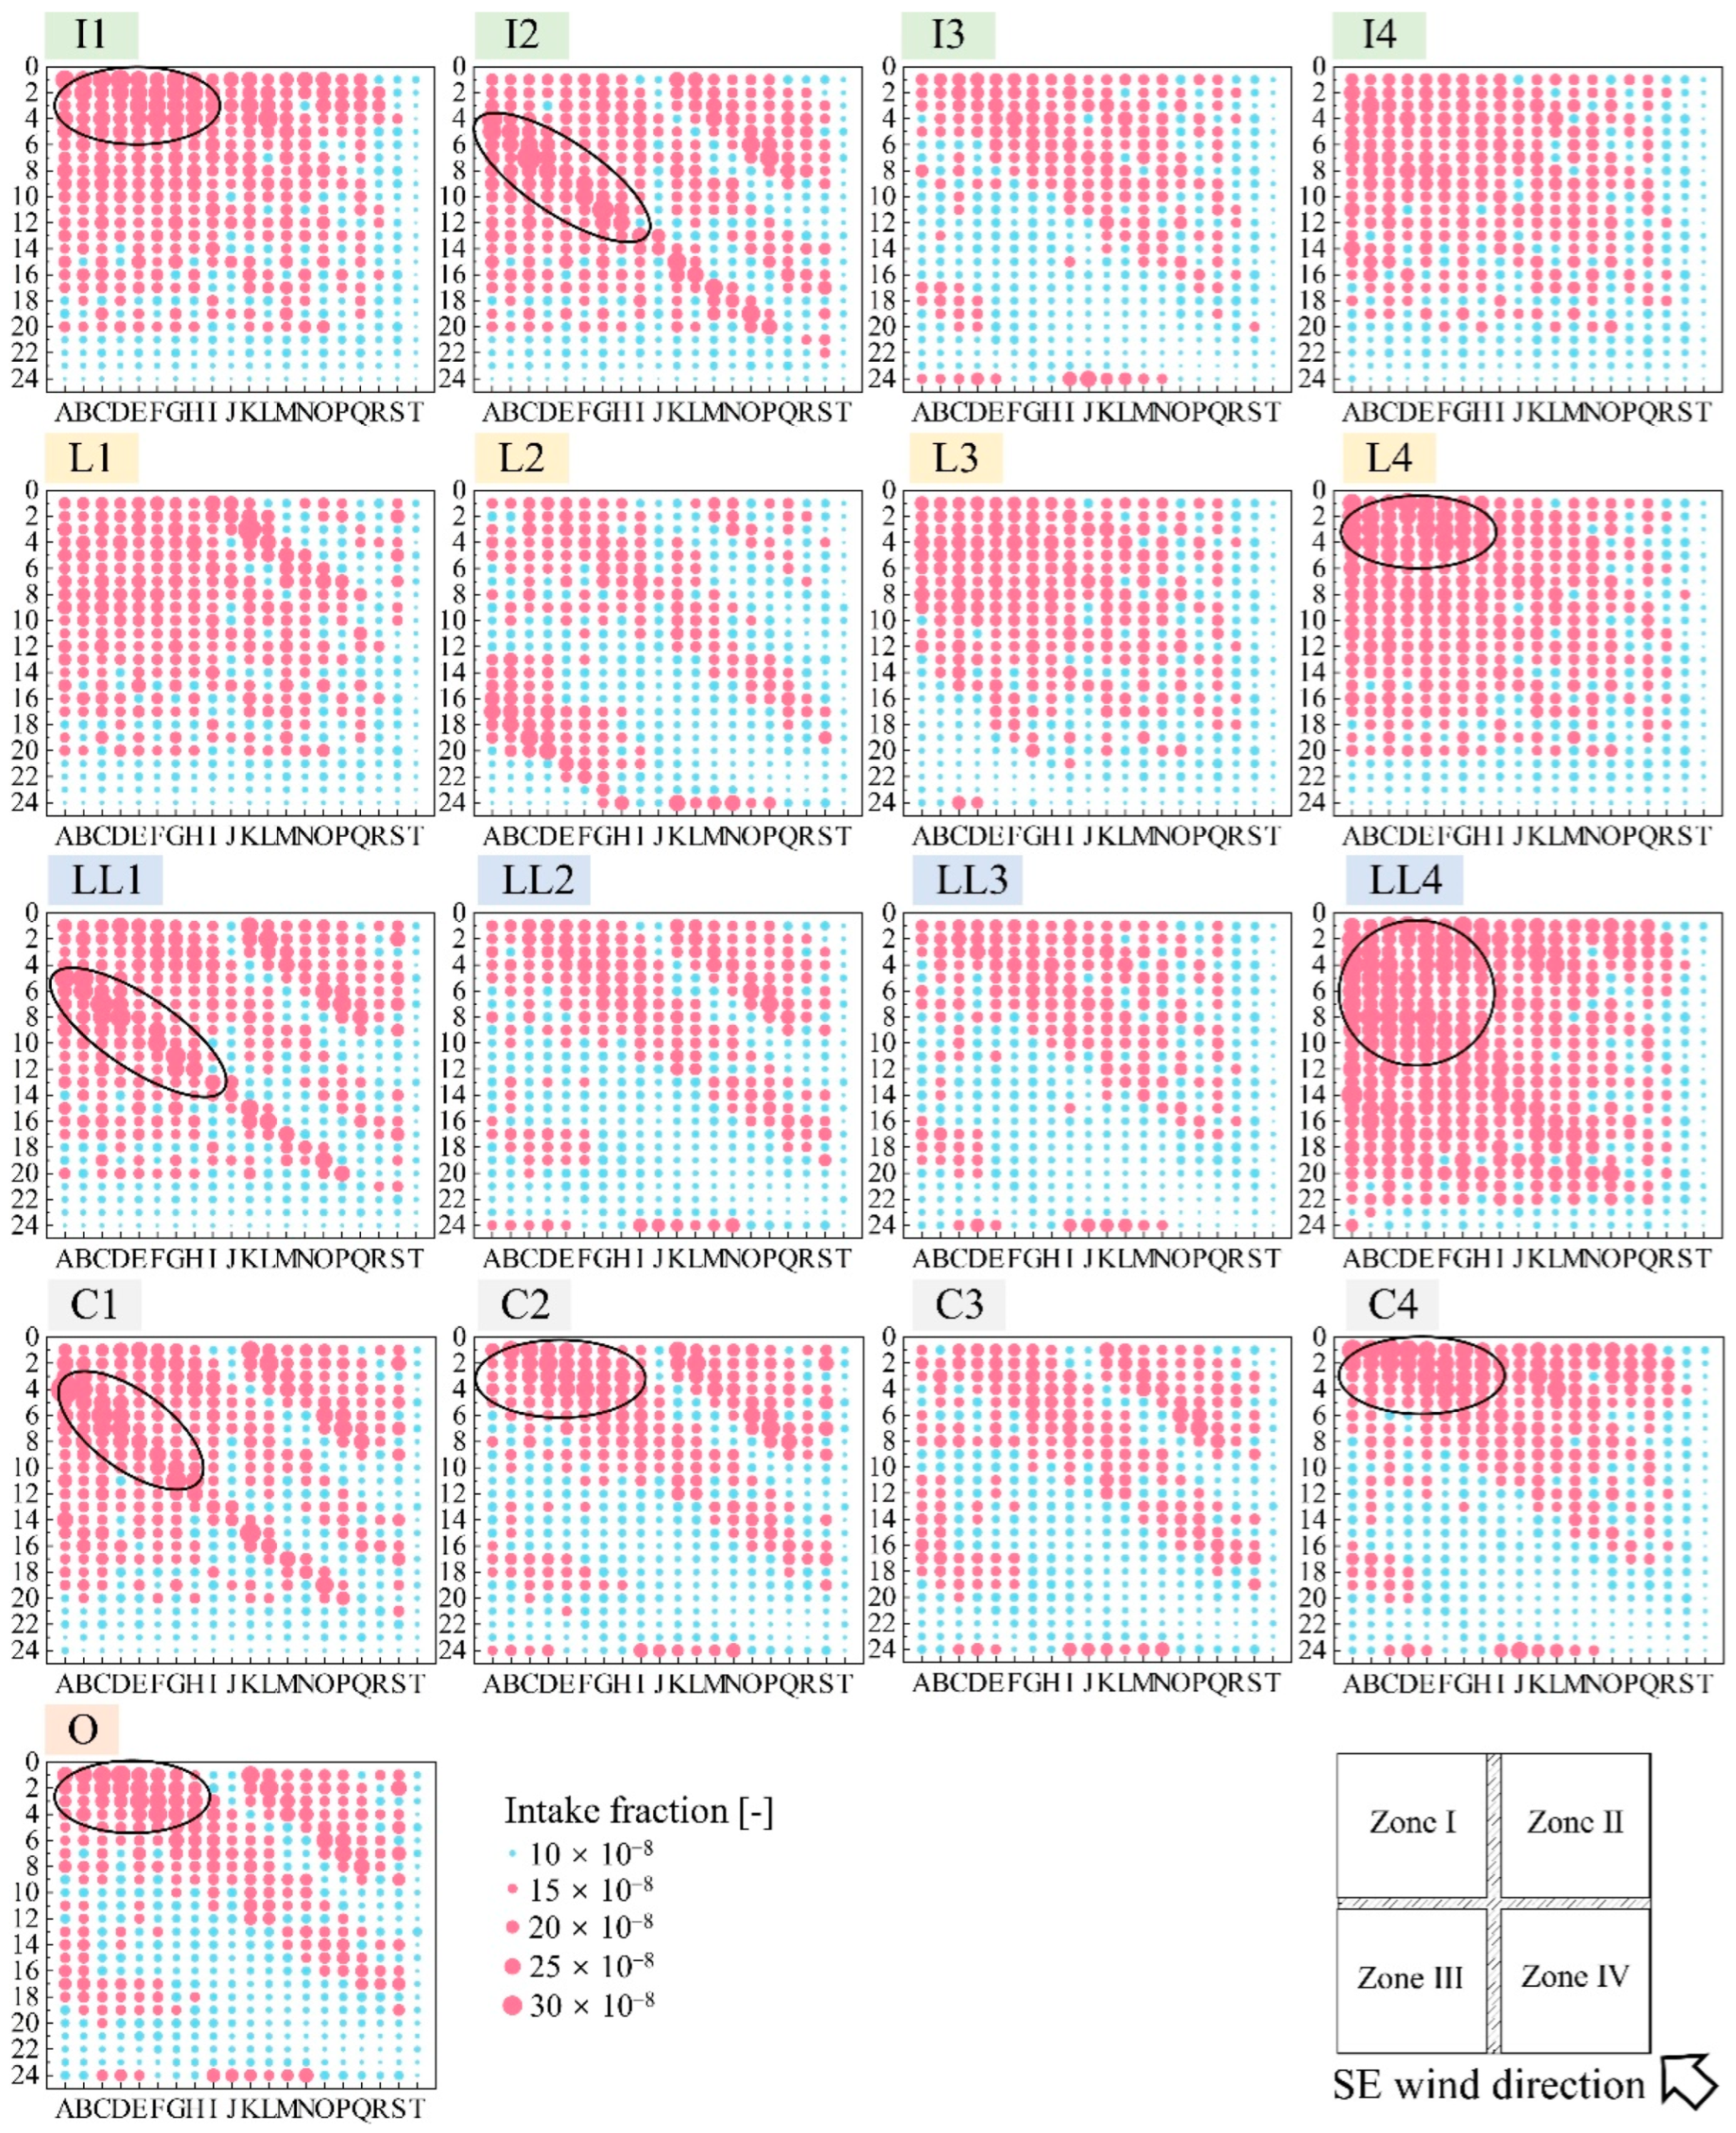
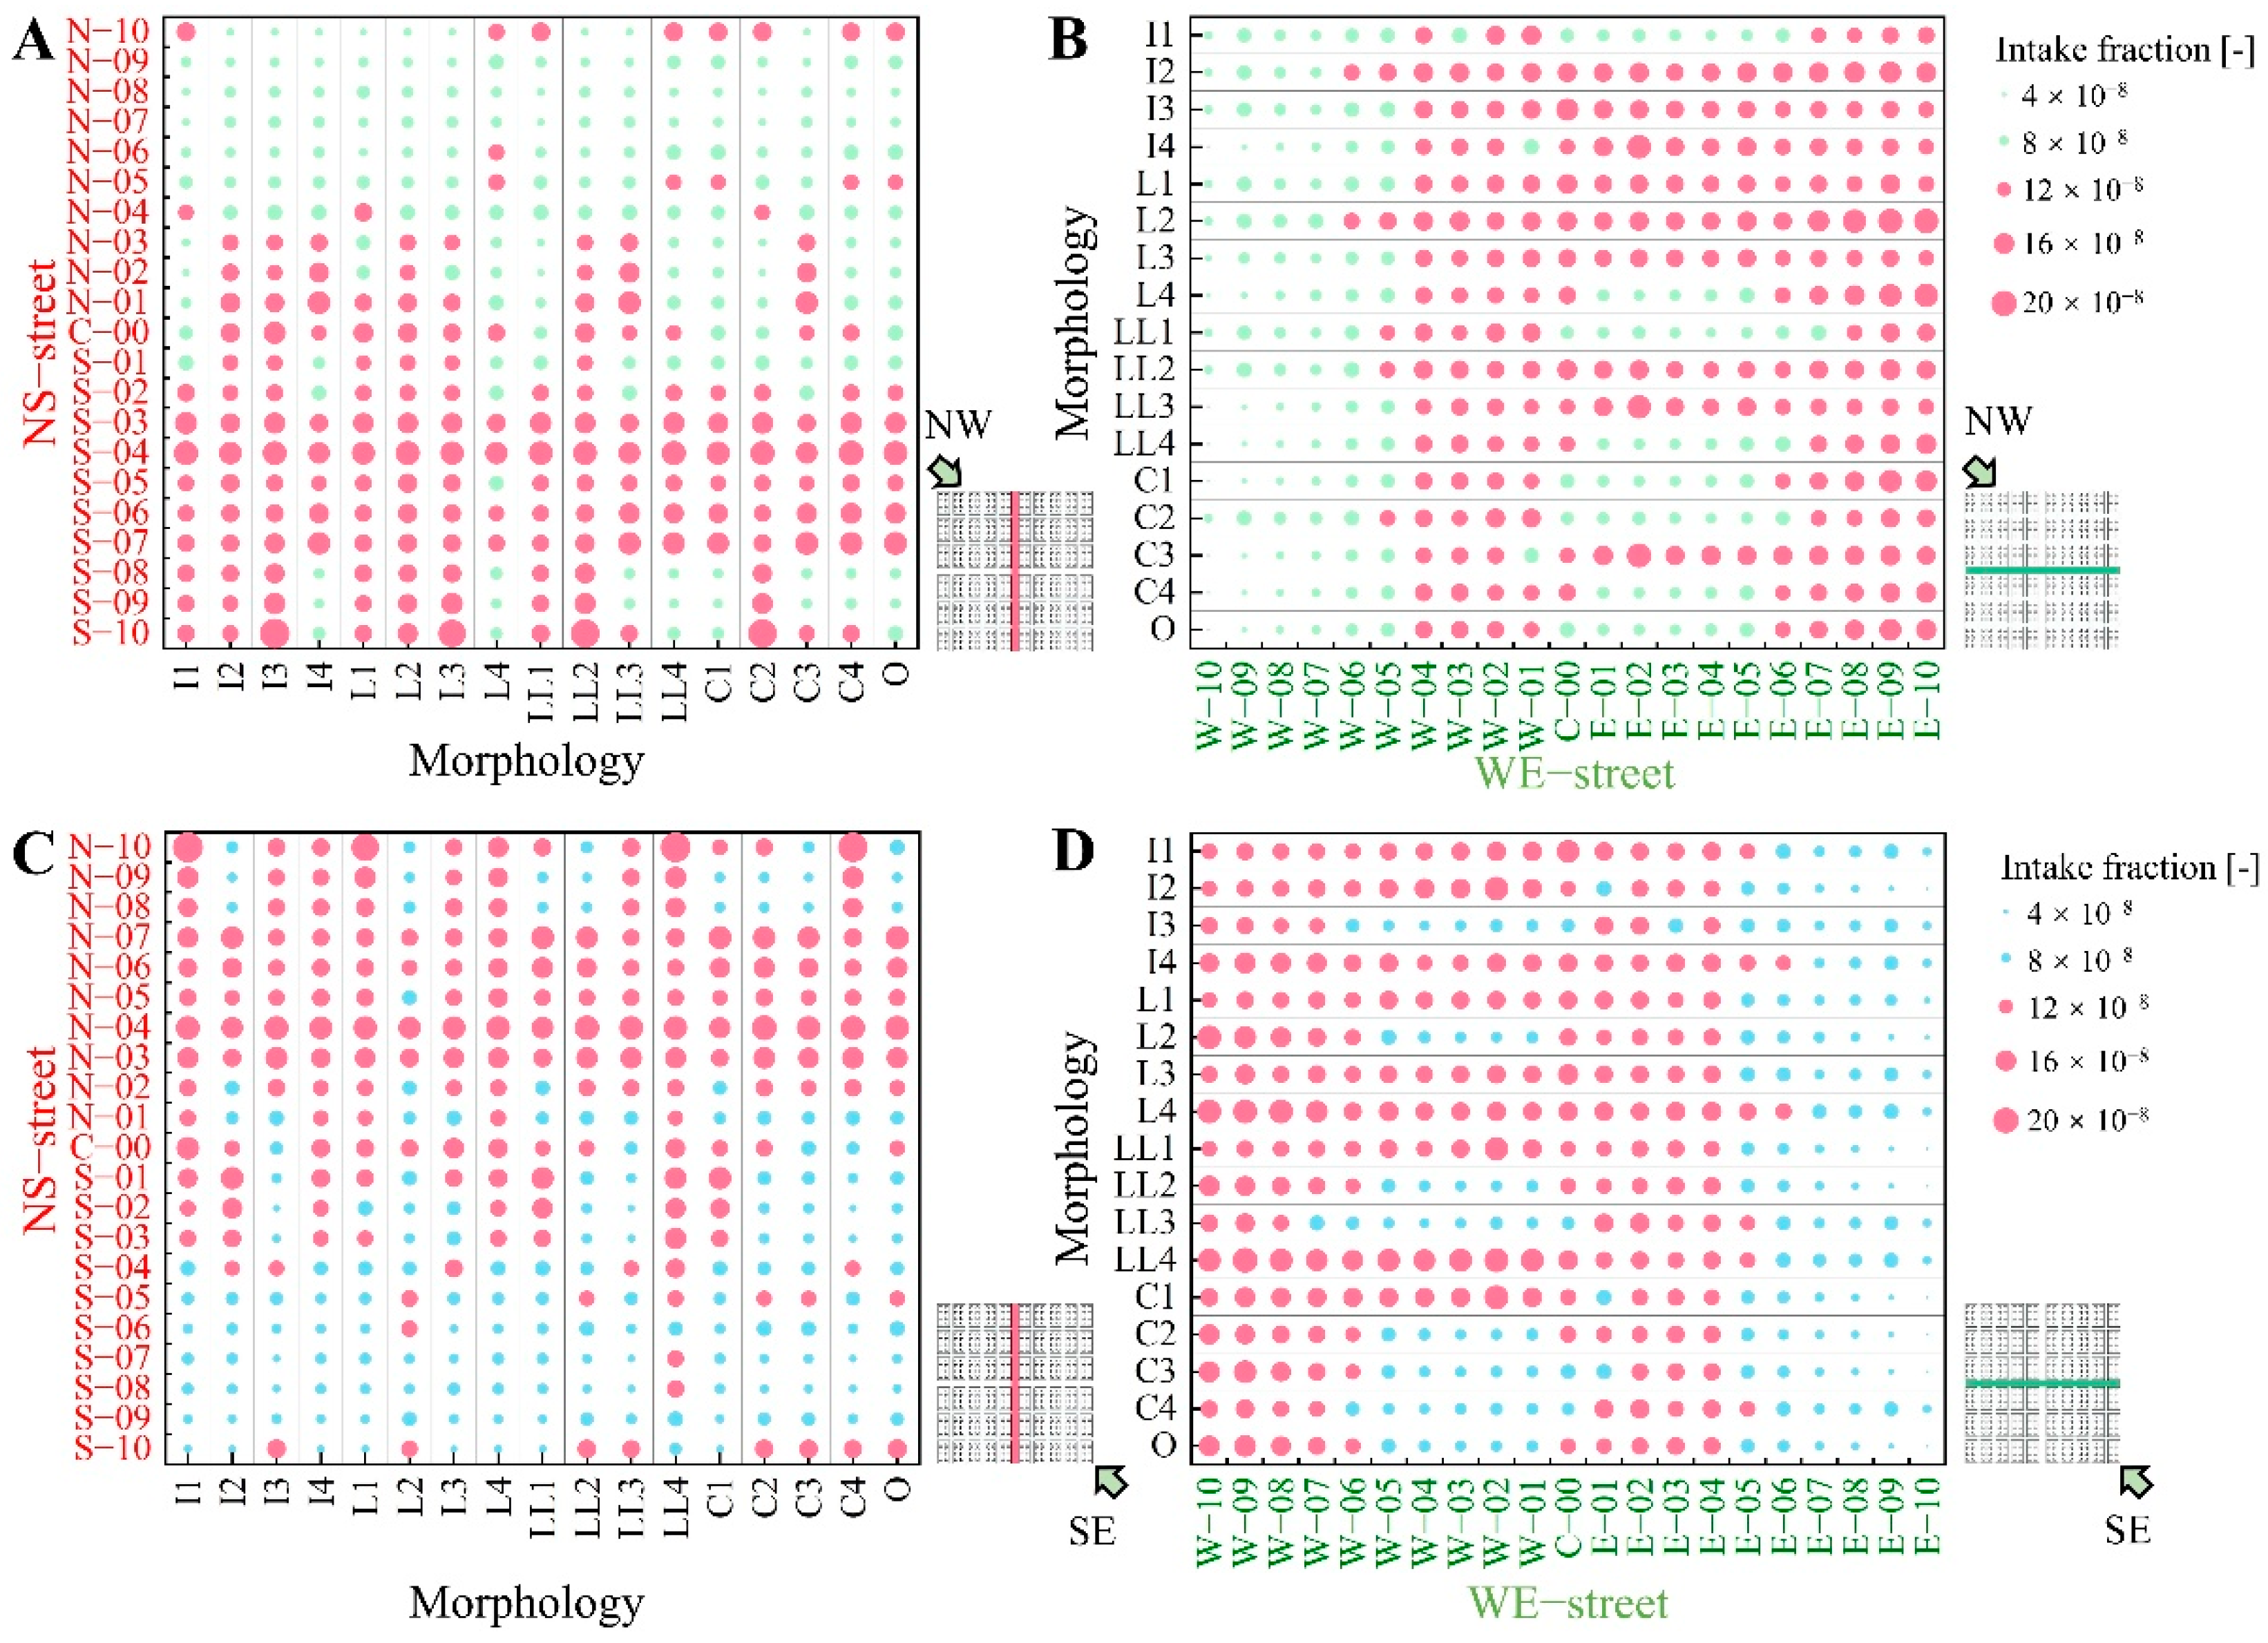
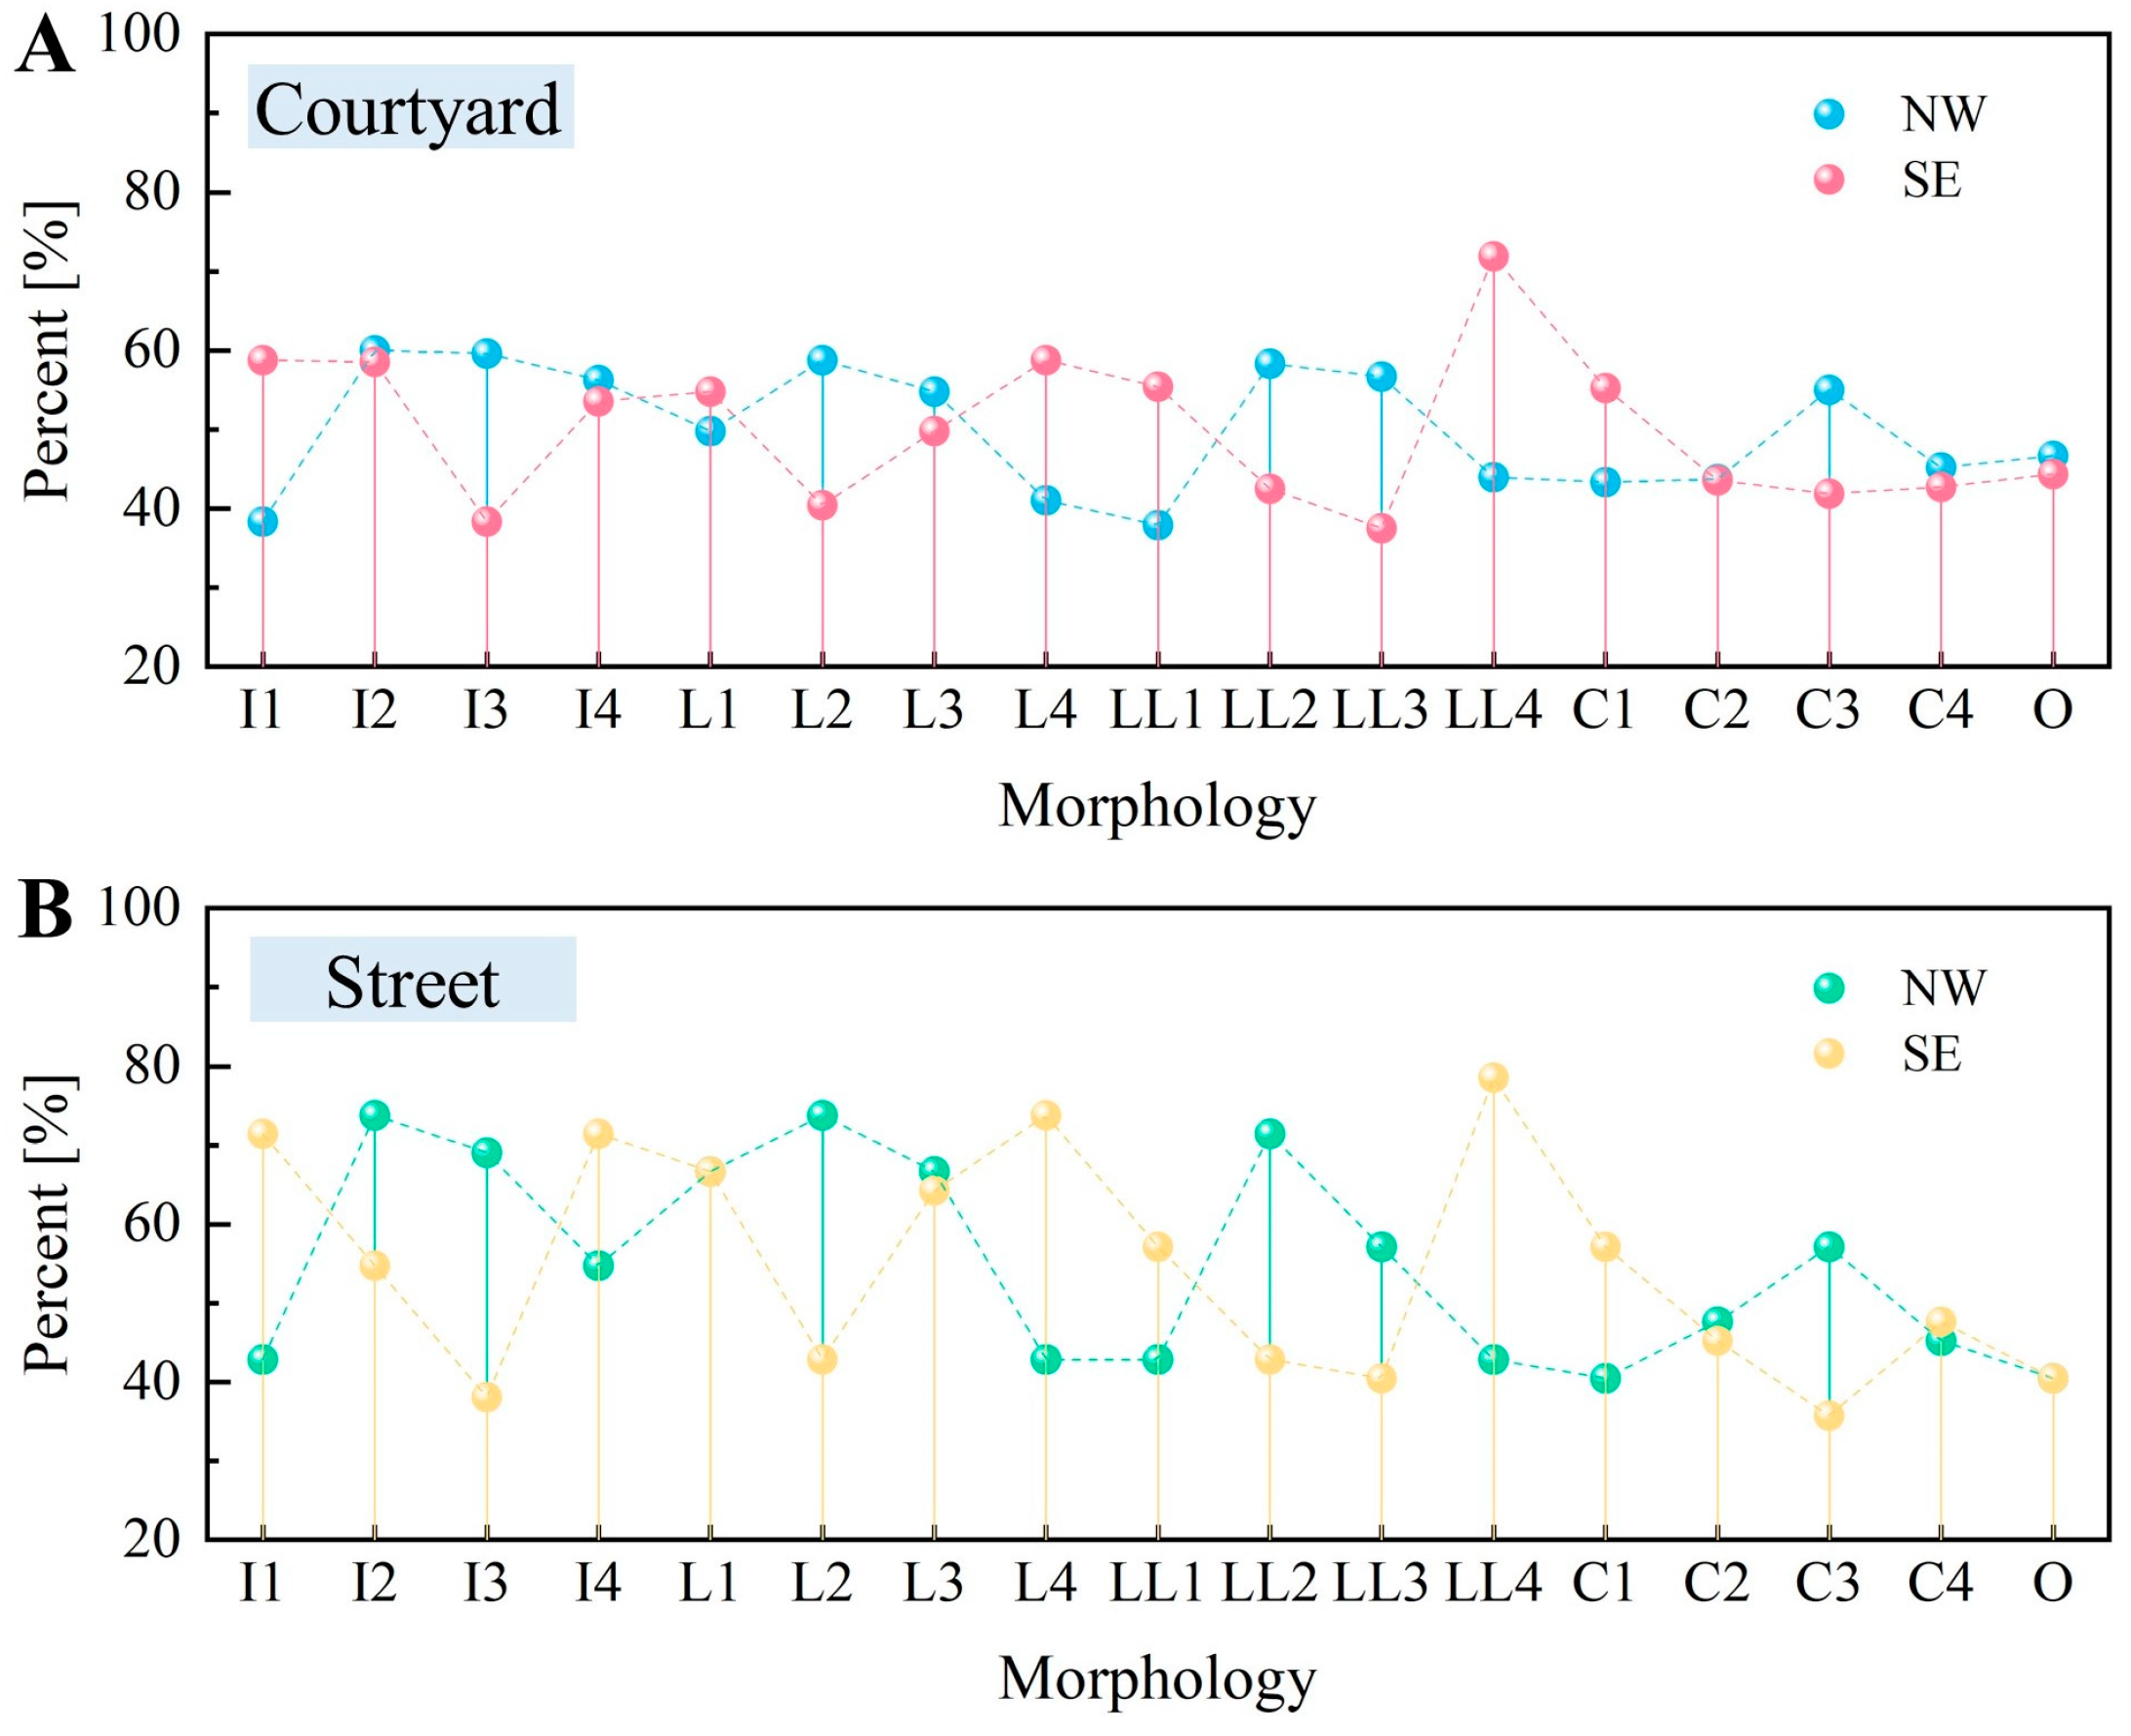
4.3. Health Risks
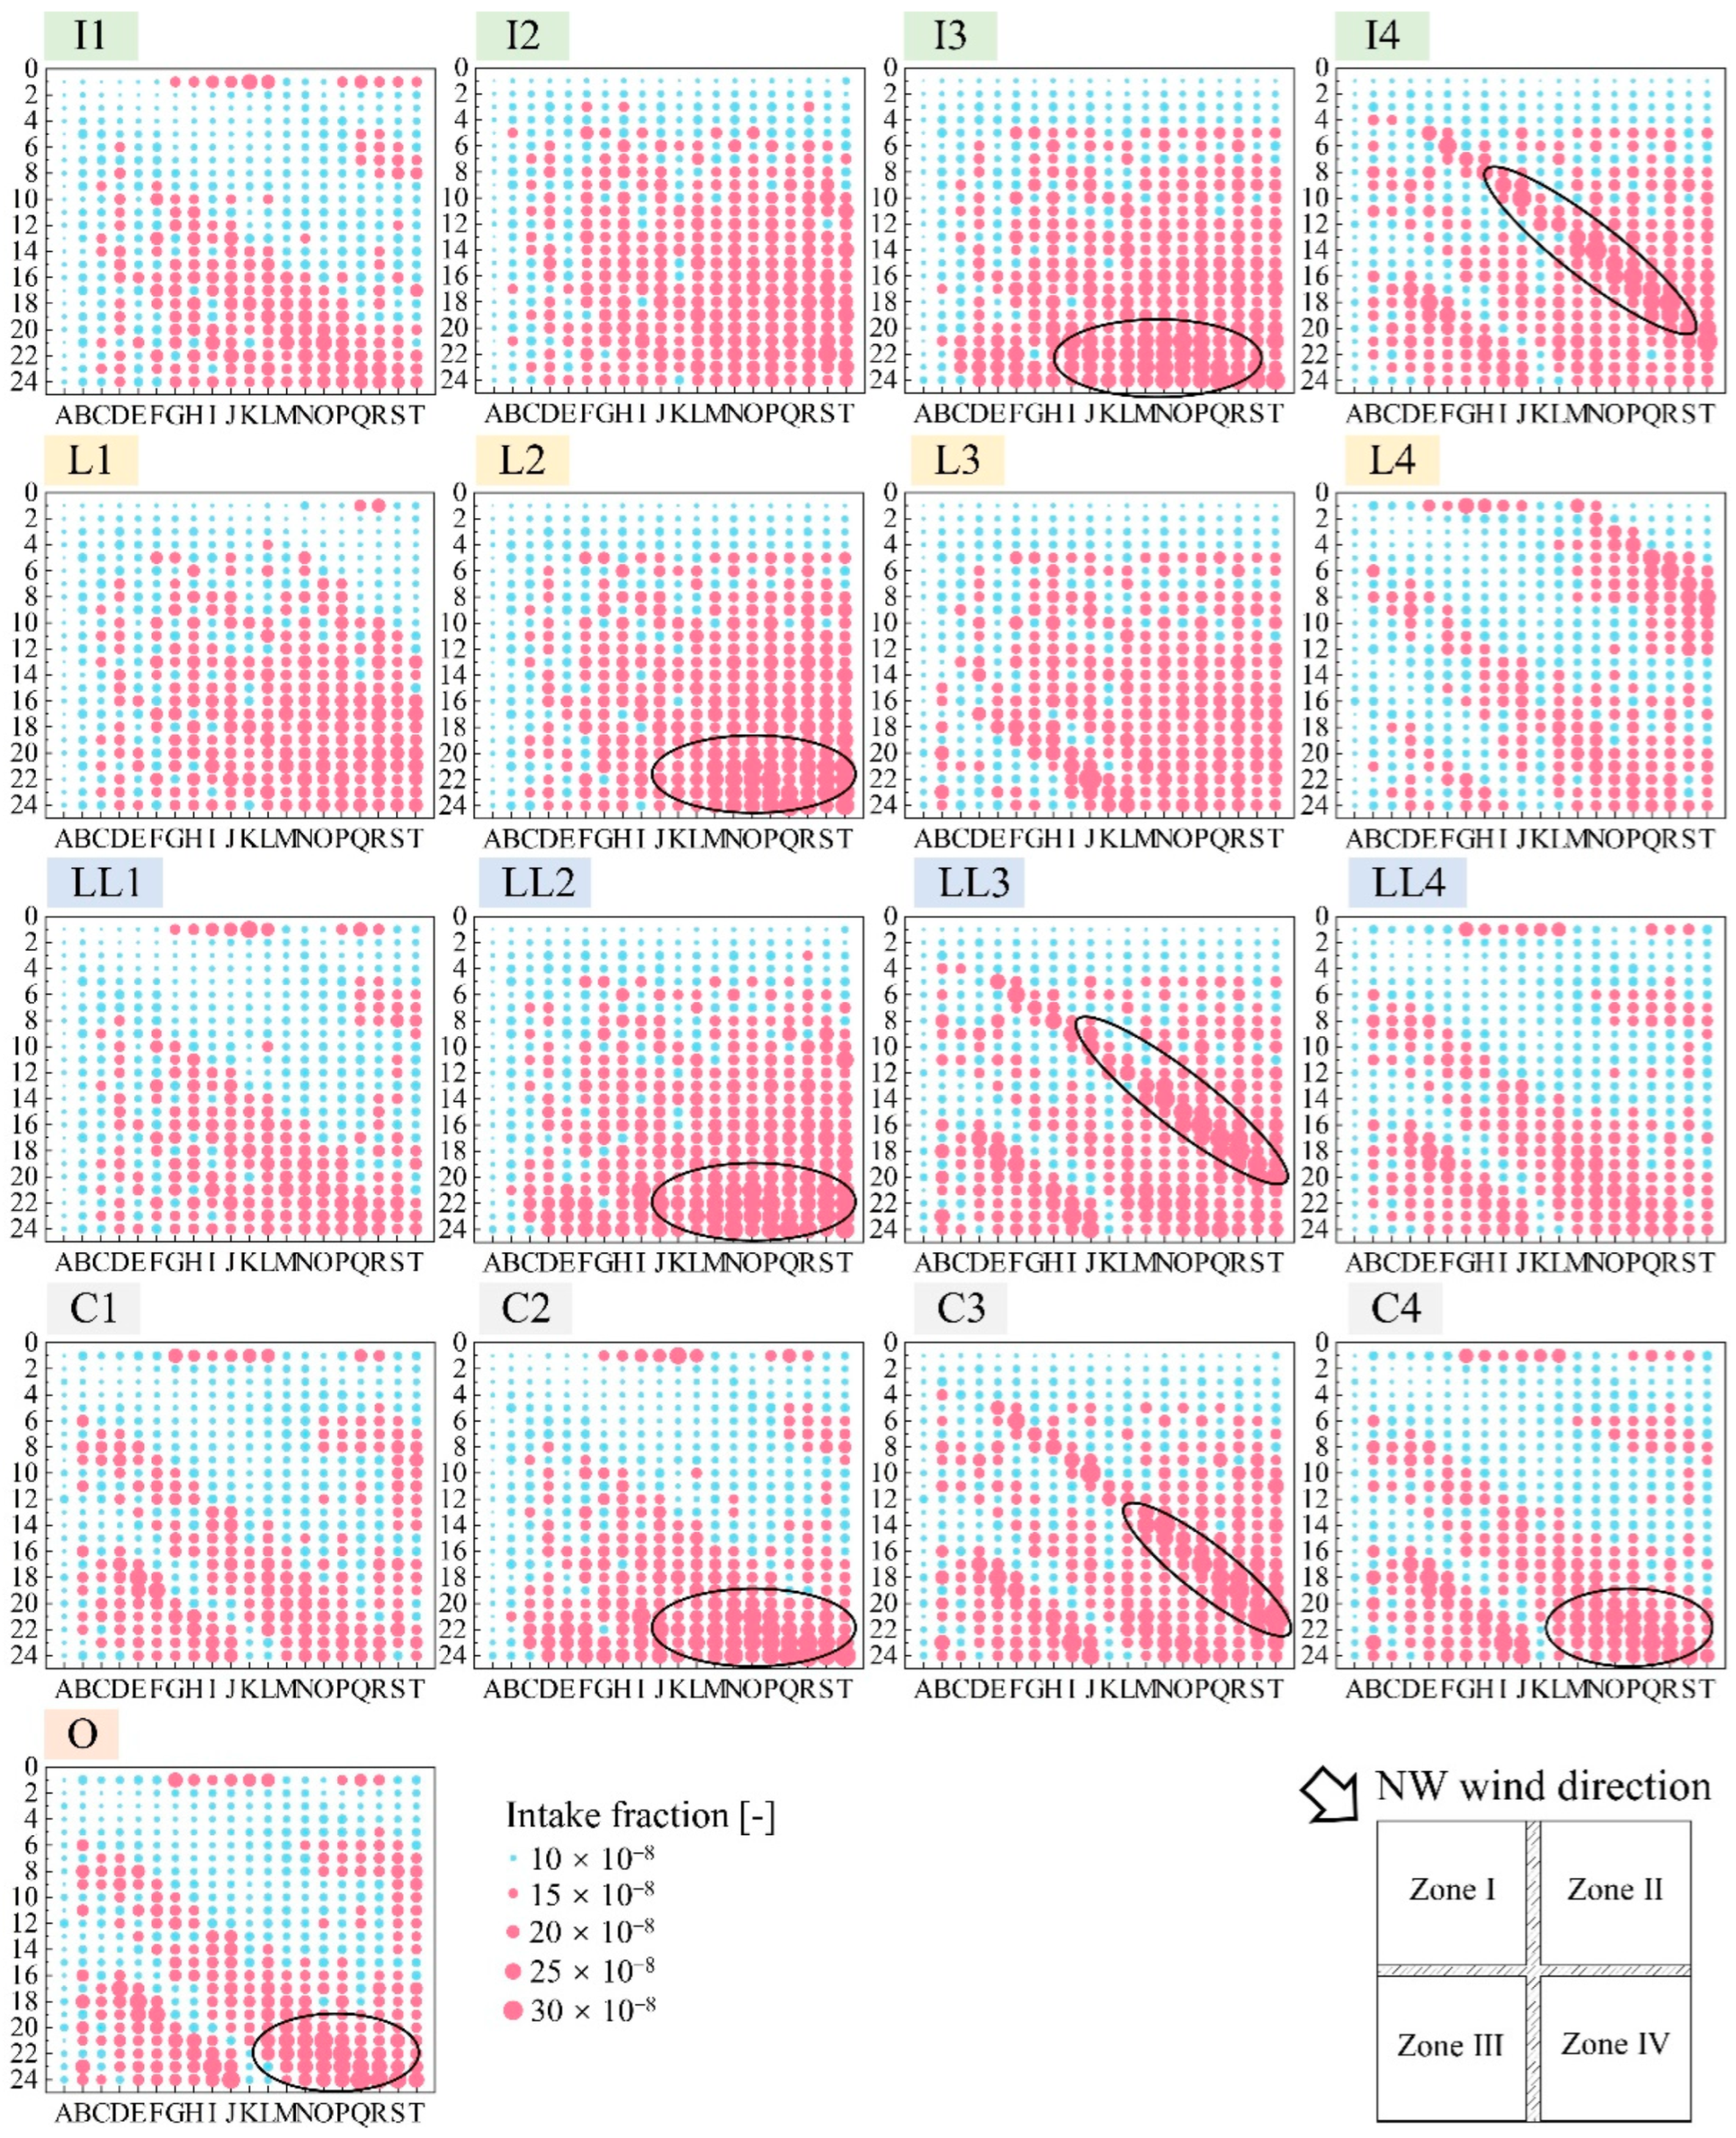
4.3.1. Courtyard
4.3.2. Street
4.4. Development Suggestions
5. Conclusions
- For the northwest wind direction, the ventilation capacity of the courtyard in the northern part of the village can be improved when there are multi-story buildings in the north or west of the village. For the southeast wind direction, when multi-story buildings exist in the south and east of the village, the ventilation capacity of the courtyard in the southern part of the village can be improved.
- When there are multi-story buildings in the south of the village, the southern part of the village tends to form a high exposure risk area in the northwest wind direction. For the southeast wind direction, multi-story buildings in the north of the village are more likely to form a high exposure risk area in the northern part of the village.
- Morphology C2 and C4 both obtained seven stars, which are the best of the typical village morphologies for courtyard and central street ventilation. In addition, morphology O, C1, and C3 also received high star numbers, with six, five, and five stars, respectively.
- Morphology C is recommended for constructing multi-story residential buildings in the countryside of Tianjin. The morphologies without multi-story buildings in the west only (C2) and east only (C4) of the village are optimal.
- For a more generalized conclusion of other North China villages with different wind directions, the windward side of surrounding multi-story buildings increases the speed of the village’s incoming winds but also blocks the airflow when located on the opposite side.
Author Contributions
Funding
Institutional Review Board Statement
Informed Consent Statement
Data Availability Statement
Conflicts of Interest
References
- Yim, S.H.L.; Fung, J.C.H.; Lau, A.K.H.; Kot, S.C. Air ventilation impacts of the “wall effect” resulting from the alignment of high-rise buildings. Atmos. Environ. 2009, 43, 4982–4994. [Google Scholar] [CrossRef]
- Ramponi, R.; Blocken, B.; de Coo, L.B.; Janssen, W.D. CFD simulation of outdoor ventilation of generic urban configurations with different urban densities and equal and unequal street widths. Build. Environ. 2015, 92, 152–166. [Google Scholar] [CrossRef]
- Tominaga, Y.; Stathopoulos, T. CFD simulation of near-field pollutant dispersion in the urban environment: A review of current modeling techniques. Atmos. Environ. 2013, 79, 716–730. [Google Scholar] [CrossRef]
- Kastner-Klein, P.; Berkowicz, R.; Britter, R. The influence of street architecture on flow and dispersion in street canyons. Meteorol. Atmos. Phys. 2004, 87, 121–131. [Google Scholar] [CrossRef]
- Yi, Y.; Shen, G.; Zhang, C.; Sun, H.; Zhang, Z.; Yin, S. Quantitative analysis and prediction of urban heat island intensity on urban-rural gradient: A case study of Shanghai. Sci. Total Environ. 2022, 829, 154264. [Google Scholar] [CrossRef]
- He, B.-J.; Ding, L.; Prasad, D. Relationships among local-scale urban morphology, urban ventilation, urban heat island and outdoor thermal comfort under sea breeze influence. Sust. Cities Soc. 2020, 60, 102289. [Google Scholar] [CrossRef]
- Zhang, Z.; Zhao, X.; Mao, R.; Xu, J.; Kim, S.-J. Predictability of the winter haze pollution in Beijing–Tianjin–Hebei region in the context of stringent emission control. Atmos. Pollut. Res. 2022, 13, 101392. [Google Scholar] [CrossRef]
- Zhang, Y.; Zhao, B. Simulation and health risk assessment of residential particle pollution by coal combustion in China. Build. Environ. 2007, 42, 614–622. [Google Scholar] [CrossRef]
- Shen, G.; Tao, S.; Wei, S.; Chen, Y.; Zhang, Y.; Shen, H.; Huang, Y.; Zhu, D.; Yuan, C.; Wang, H.; et al. Field measurement of emission factors of PM, EC, OC, Parent, Nitro-, and Oxy- Polycyclic Aromatic Hydrocarbons for residential briquette, coal cake, and wood in rural Shanxi, China. Environ. Sci. Technol. 2013, 47, 2998–3005. [Google Scholar] [CrossRef]
- Cai, S.; Li, Q.; Wang, S.; Chen, J.; Ding, D.; Zhao, B.; Yang, D.; Hao, J. Pollutant emissions from residential combustion and reduction strategies estimated via a village-based emission inventory in Beijing. Environ. Pollut. 2018, 238, 230–237. [Google Scholar] [CrossRef]
- Chen, Z.; Wang, J.-N.; Ma, G.-X.; Zhang, Y.-S. China tackles the health effects of air pollution. Lancet 2013, 382, 1959–1960. [Google Scholar] [CrossRef]
- Zhao, K.; Zhang, Y.; Shang, J.; Schauer, J.J.; Huang, W.; Tian, J.; Yang, S.; Fang, D.; Zhang, D. Impact of Beijing’s “Coal to Electricity” program on ambient PM2.5 and the associated reactive oxygen species (ROS). J. Environ. Sci. 2022. [Google Scholar] [CrossRef]
- Peng, Y.; Buccolieri, R.; Gao, Z.; Ding, W. Indices employed for the assessment of “urban outdoor ventilation”—A review. Atmos. Environ. 2020, 223, 117211. [Google Scholar] [CrossRef]
- Ma, X.; Leung, T.M.; Chau, C.K.; Yung, E.H.K. Analyzing the influence of urban morphological features on pedestrian thermal comfort. Urban CLim. 2022, 44, 101192. [Google Scholar] [CrossRef]
- Yang, J.; Yang, Y.; Sun, D.; Jin, C.; Xiao, X. Influence of urban morphological characteristics on thermal environment. Sust. Cities Soc. 2021, 72, 103045. [Google Scholar] [CrossRef]
- Liu, Y.; Xu, Y.; Zhang, F.; Shu, W. A preliminary study on the influence of Beijing urban spatial morphology on near-surface wind speed. Urban CLim. 2020, 34, 100703. [Google Scholar] [CrossRef]
- Peng, Y.; Gao, Z.; Buccolieri, R.; Ding, W. An investigation of the quantitative correlation between urban morphology parameters and outdoor ventilation efficiency indices. Atmosphere 2019, 10, 33. [Google Scholar] [CrossRef]
- Peng, Y.; Gao, Z.; Buccolieri, R.; Shen, J.; Ding, W. Urban ventilation of typical residential streets and impact of building form variation. Sust. Cities Soc. 2021, 67, 102735. [Google Scholar] [CrossRef]
- Shen, J.; Gao, Z.; Ding, W.; Yu, Y. An investigation on the effect of street morphology to ambient air quality using six real-world cases. Atmos. Environ. 2017, 164, 85–101. [Google Scholar] [CrossRef]
- Zheng, X.; Montazeri, H.; Blocken, B. Impact of building façade geometrical details on pollutant dispersion in street canyons. Build. Environ. 2022, 212, 108746. [Google Scholar] [CrossRef]
- Xie, X.; Huang, Z.; Wang, J.-S. Impact of building configuration on air quality in street canyon. Atmos. Environ. 2005, 39, 4519–4530. [Google Scholar] [CrossRef]
- Huang, Y.; He, W.; Kim, C.-N. Impacts of shape and height of upstream roof on airflow and pollutant dispersion inside an urban street canyon. Environ. Sci. Pollut. Res. 2015, 22, 2117–2137. [Google Scholar] [CrossRef] [PubMed]
- Takano, Y.; Moonen, P. On the influence of roof shape on flow and dispersion in an urban street canyon. J. Wind Eng. Ind. Aerodyn. 2013, 123, 107–120. [Google Scholar] [CrossRef]
- Wen, C.-Y.; Juan, Y.-H.; Yang, A.-S. Enhancement of city breathability with half open spaces in ideal urban street canyons. Build. Environ. 2017, 112, 322–336. [Google Scholar] [CrossRef]
- Chen, L.; Mak, C.M. Integrated impacts of building height and upstream building on pedestrian comfort around ideal lift-up buildings in a weak wind environment. Build. Environ. 2021, 200, 107963. [Google Scholar] [CrossRef]
- Sha, C.; Wang, X.; Lin, Y.; Fan, Y.; Chen, X.; Hang, J. The impact of urban open space and ‘lift-up’ building design on building intake fraction and daily pollutant exposure in idealized urban models. Sci. Total Environ. 2018, 633, 1314–1328. [Google Scholar] [CrossRef] [PubMed]
- Kubota, T.; Miura, M.; Tominaga, Y.; Mochida, A. Wind tunnel tests on the relationship between building density and pedestrian-level wind velocity: Development of guidelines for realizing acceptable wind environment in residential neighborhoods. Build. Environ. 2008, 43, 1699–1708. [Google Scholar] [CrossRef]
- Hu, T.; Yoshie, R. Indices to evaluate ventilation efficiency in newly-built urban area at pedestrian level. J. Wind Eng. Ind. Aerodyn. 2013, 112, 39–51. [Google Scholar] [CrossRef]
- Chang, C.-H.; Meroney, R.N. Concentration and flow distributions in urban street canyons: Wind tunnel and computational data. J. Wind Eng. Ind. Aerodyn. 2003, 91, 1141–1154. [Google Scholar] [CrossRef]
- Ahmad, K.; Khare, M.; Chaudhry, K.K. Wind tunnel simulation studies on dispersion at urban street canyons and intersections—a review. J. Wind Eng. Ind. Aerodyn. 2005, 93, 697–717. [Google Scholar] [CrossRef]
- Liu, C.-H.; Leung, D.Y.C.; Barth, M.C. On the prediction of air and pollutant exchange rates in street canyons of different aspect ratios using large-eddy simulation. Atmos. Environ. 2005, 39, 1567–1574. [Google Scholar] [CrossRef]
- Liu, C.-H.; Cheng, W.C.; Leung, T.C.Y.; Leung, D.Y.C. On the mechanism of air pollutant re-entrainment in two-dimensional idealized street canyons. Atmos. Environ. 2011, 45, 4763–4769. [Google Scholar] [CrossRef]
- Li, X.-X.; Liu, C.-H.; Leung, D.Y.C. Numerical investigation of pollutant transport characteristics inside deep urban street canyons. Atmos. Environ. 2009, 43, 2410–2418. [Google Scholar] [CrossRef]
- Li, J.; Zheng, B.; Bedra, K.B.; Li, Z.; Chen, X. Effects of residential building height, density, and floor area ratios on indoor thermal environment in Singapore. J. Environ. Manag. 2022, 313, 114976. [Google Scholar] [CrossRef]
- Hadavi, M.; Pasdarshahri, H. Investigating effects of urban configuration and density on urban climate and building systems energy consumption. J. Build. Eng. 2021, 44, 102710. [Google Scholar] [CrossRef]
- Yuan, C.; Ren, C.; Ng, E. GIS-based surface roughness evaluation in the urban planning system to improve the wind environment—A study in Wuhan, China. Urban CLim. 2014, 10, 585–593. [Google Scholar] [CrossRef]
- Wong, M.S.; Nichol, J.; Ng, E. A study of the “wall effect” caused by proliferation of high-rise buildings using GIS techniques. Landsc. Urban Plan. 2011, 102, 245–253. [Google Scholar] [CrossRef]
- He, X.; Li, Y.; Wang, X.; Chen, L.; Yu, B.; Zhang, Y.; Miao, S. High-resolution dataset of urban canopy parameters for Beijing and its application to the integrated WRF/Urban modelling system. J. Clean Prod. 2019, 208, 373–383. [Google Scholar] [CrossRef]
- Shen, C.; Shen, A.; Cui, Y.; Chen, X.; Liu, Y.; Fan, Q.; Chan, P.; Tian, C.; Wang, C.; Lan, J.; et al. Spatializing the roughness length of heterogeneous urban underlying surfaces to improve the WRF simulation-part 1: A review of morphological methods and model evaluation. Atmos. Environ. 2022, 270, 118874. [Google Scholar] [CrossRef]
- Tominaga, Y.; Stathopoulos, T. CFD modeling of pollution dispersion in a street canyon: Comparison between LES and RANS. J. Wind Eng. Ind. Aerodyn. 2011, 99, 340–348. [Google Scholar] [CrossRef] [Green Version]
- Wei, D.; Hu, X.; Chen, Y.; Li, B.; Chen, H. An investigation of the quantitative correlation between urban spatial morphology indicators and block wind environment. Atmosphere 2021, 12, 234. [Google Scholar] [CrossRef]
- Liu, W.; Zhang, G.; Jiang, Y.; Wang, J. Effective range and driving factors of the urban ventilation corridor effect on urban thermal comfort at unified scale with multisource data. Remote Sens. 2021, 13, 1783. [Google Scholar] [CrossRef]
- Ng, E.; Yuan, C.; Chen, L.; Ren, C.; Fung, J.C.H. Improving the wind environment in high-density cities by understanding urban morphology and surface roughness: A study in Hong Kong. Landsc. Urban Plan. 2011, 101, 59–74. [Google Scholar] [CrossRef] [PubMed]
- National Bureau of Statistics. The Seventh National Census; National Bureau of Statistics: Beijing, China, 2021.
- Ma, T.; Chen, T. Classification and pedestrian-level wind environment assessment among Tianjin’s residential area based on numerical simulation. Urban CLim. 2020, 34, 100702. [Google Scholar] [CrossRef]
- Richards, P.J.; Hoxey, R.P. Appropriate boundary conditions for computational wind engineering models using the k-e turbulence model. Comput. Wind. Eng. Ind. Aerodyn. 1993, 46–47, 145–153. [Google Scholar] [CrossRef]
- Tominaga, Y.; Mochida, A.; Yoshie, R.; Kataoka, H.; Nozu, T.; Yoshikawa, M.; Shirasawa, T. AIJ guidelines for practical applications of CFD to pedestrian wind environment around buildings. J. Wind Eng. Ind. Aerodyn. 2008, 96, 1749–1761. [Google Scholar] [CrossRef]
- Yoshie, R.; Mochida, A.; Tominaga, Y.; Kataoka, H.; Harimoto, K.; Nozu, T.; Shirasawa, T. Cooperative project for CFD prediction of pedestrian wind environment in the Architectural Institute of Japan. J. Wind Eng. Ind. Aerodyn. 2007, 95, 1551–1578. [Google Scholar] [CrossRef]
- Chang, C.-H.; Meroney, R.N. Numerical and physical modeling of bluff body flow and dispersion in urban street canyons. J. Wind Eng. Ind. Aerodyn. 2001, 89, 1325–1334. [Google Scholar] [CrossRef]
- Xu, F.S.; Yang, J.Z.; Zhu, X.W. A comparative study on the difference of CFD simulations based on a simplified geometry and a more refined BIM based geometry. AIP Adv. 2020, 10, 125318. [Google Scholar] [CrossRef]
- Xu, F.S.; Gao, Z.; Zhang, J.S. Effects of roadside morphologies and moving vehicles on street canyon ventilation. Build. Environ. 2022, 218, 109138. [Google Scholar] [CrossRef]
- Xu, F.S.; Gao, Z.; Zhang, J.S.; Hu, Y.Y.; Ding, W.W. Influence of typical street-side public building morphologies on the ventilation performance of streets and squares. Build. Environ. 2022, 221, 109331. [Google Scholar] [CrossRef]
- Santiago, J.L.; Martilli, A.; Martin, F. CFD simulation of airflow over a regular array of cubes. Part I: Three-dimensional simulation of the flow and validation with wind-tunnel measurements. Bound.-Layer Meteor. 2007, 122, 609–634. [Google Scholar] [CrossRef]
- Hang, J.; Li, Y. Age of air and air exchange efficiency in high-rise urban areas and its link to pollutant dilution. Atmos. Environ. 2011, 45, 5572–5585. [Google Scholar] [CrossRef]
- He, L.J.; Hang, J.; Wang, X.M.; Lin, B.R.; Li, X.H.; Lan, G.D. Numerical investigations of flow and passive pollutant exposure in high-rise deep street canyons with various street aspect ratios and viaduct settings. Sci. Total Environ. 2017, 584, 189–206. [Google Scholar] [CrossRef]
- Du, X.; Wu, Y.; Fu, L.X.; Wang, S.X.; Zhang, S.J.; Hao, J.M. Intake fraction of PM2.5 and NOx from vehicle emissions in Beijing based on personal exposure data. Atmos. Environ. 2012, 57, 233–243. [Google Scholar] [CrossRef]


| Location | Type | Profiles/Conditions |
|---|---|---|
| Inlet | Velocity inlet | Equations (1), (3) and (4), 3 m/s |
| Outlet | Outflow | |
| Top | Symmetry | |
| Ground | Wall | No-slip |
| Building | Wall | No-slip |
| Morphology | I1 | I2 | I3 | I4 | L1 | L2 | L3 | L4 | LL1 | LL2 | LL3 | LL4 | C1 | C2 | C3 | C4 | O | |
|---|---|---|---|---|---|---|---|---|---|---|---|---|---|---|---|---|---|---|
| Courtyard (NW) | ⋆ | ⋆ | ⋆ | ⋆ | ⋆ | ⋆ | ⋆ | ⋆ | ||||||||||
| Courtyard (SE) | ⋆ | ⋆ | ⋆ | ⋆ | ⋆ | ⋆ | ⋆ | ⋆ | ||||||||||
| Street (NW) | ⋆ | ⋆ | ⋆ | ⋆ | ⋆ | ⋆ | ⋆ | ⋆ | ||||||||||
| Street (SE) | ⋆ | ⋆ | ⋆ | ⋆ | ⋆ | ⋆ | ⋆ | ⋆ | ||||||||||
| Per_IF | Courtyard (NW) | ⋆ | ⋆ | ⋆ | ⋆ | ⋆ | ⋆ | ⋆ | ⋆ | |||||||||
| Courtyard (SE) | ⋆ | ⋆ | ⋆ | ⋆ | ⋆ | ⋆ | ⋆ | ⋆ | ||||||||||
| Street (NW) | ⋆ | ⋆ | ⋆ | ⋆ | ⋆ | ⋆ | ⋆ | ⋆ | ||||||||||
| Street (SE) | ⋆ | ⋆ | ⋆ | ⋆ | ⋆ | ⋆ | ⋆ | ⋆ | ||||||||||
| Total star number | 3 | 1 | 3 | 1 | 1 | 4 | 1 | 4 | 4 | 4 | 4 | 4 | 5 | 7 | 5 | 7 | 6 | |
Publisher’s Note: MDPI stays neutral with regard to jurisdictional claims in published maps and institutional affiliations. |
© 2022 by the authors. Licensee MDPI, Basel, Switzerland. This article is an open access article distributed under the terms and conditions of the Creative Commons Attribution (CC BY) license (https://creativecommons.org/licenses/by/4.0/).
Share and Cite
Xu, F.; Gao, Z.; Xing, Y.; Wu, Z.; Zhang, J.; Liao, Y.; Hu, Y. The Effect of Village Morphological Variation Caused by Economic Development on Residents’ Health and Rural Ventilation in Tianjin. Buildings 2022, 12, 1393. https://doi.org/10.3390/buildings12091393
Xu F, Gao Z, Xing Y, Wu Z, Zhang J, Liao Y, Hu Y. The Effect of Village Morphological Variation Caused by Economic Development on Residents’ Health and Rural Ventilation in Tianjin. Buildings. 2022; 12(9):1393. https://doi.org/10.3390/buildings12091393
Chicago/Turabian StyleXu, Fusuo, Zhi Gao, Yuchen Xing, Zihao Wu, Jianshun Zhang, Yimin Liao, and Yongyu Hu. 2022. "The Effect of Village Morphological Variation Caused by Economic Development on Residents’ Health and Rural Ventilation in Tianjin" Buildings 12, no. 9: 1393. https://doi.org/10.3390/buildings12091393