
Parametric Design and Spatial Optimization of East–West-Oriented Teaching Spaces in Shanghai


Abstract
:1. Introduction
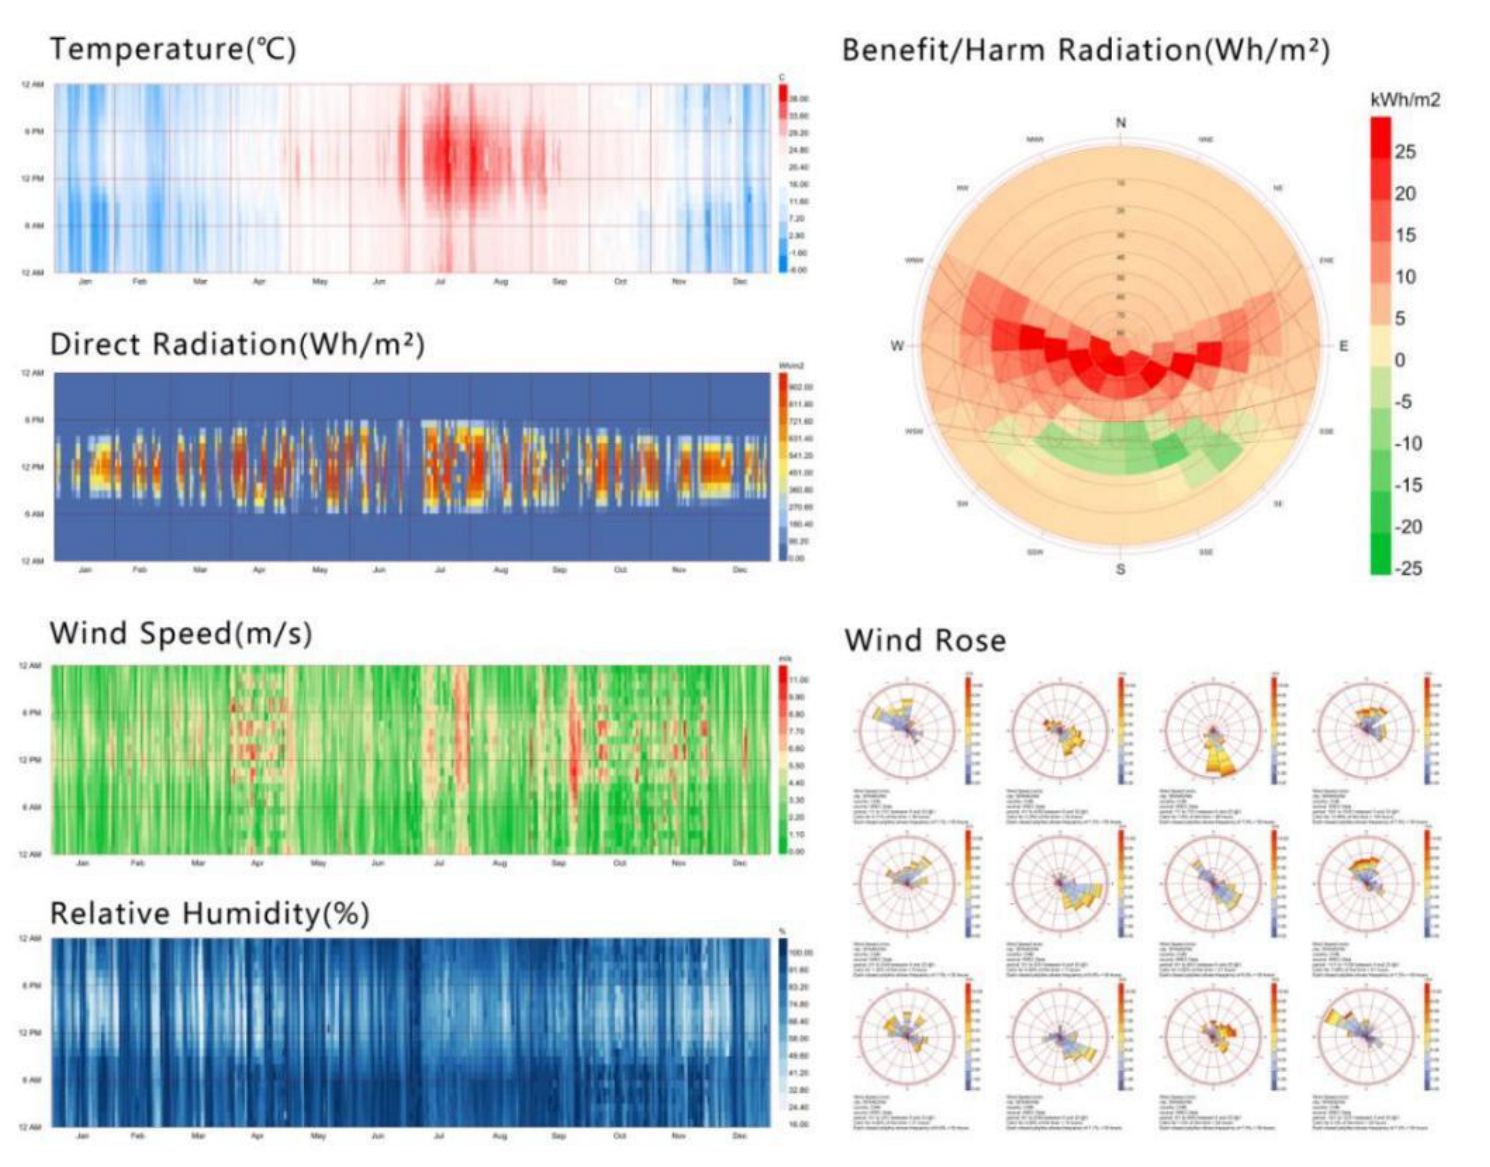
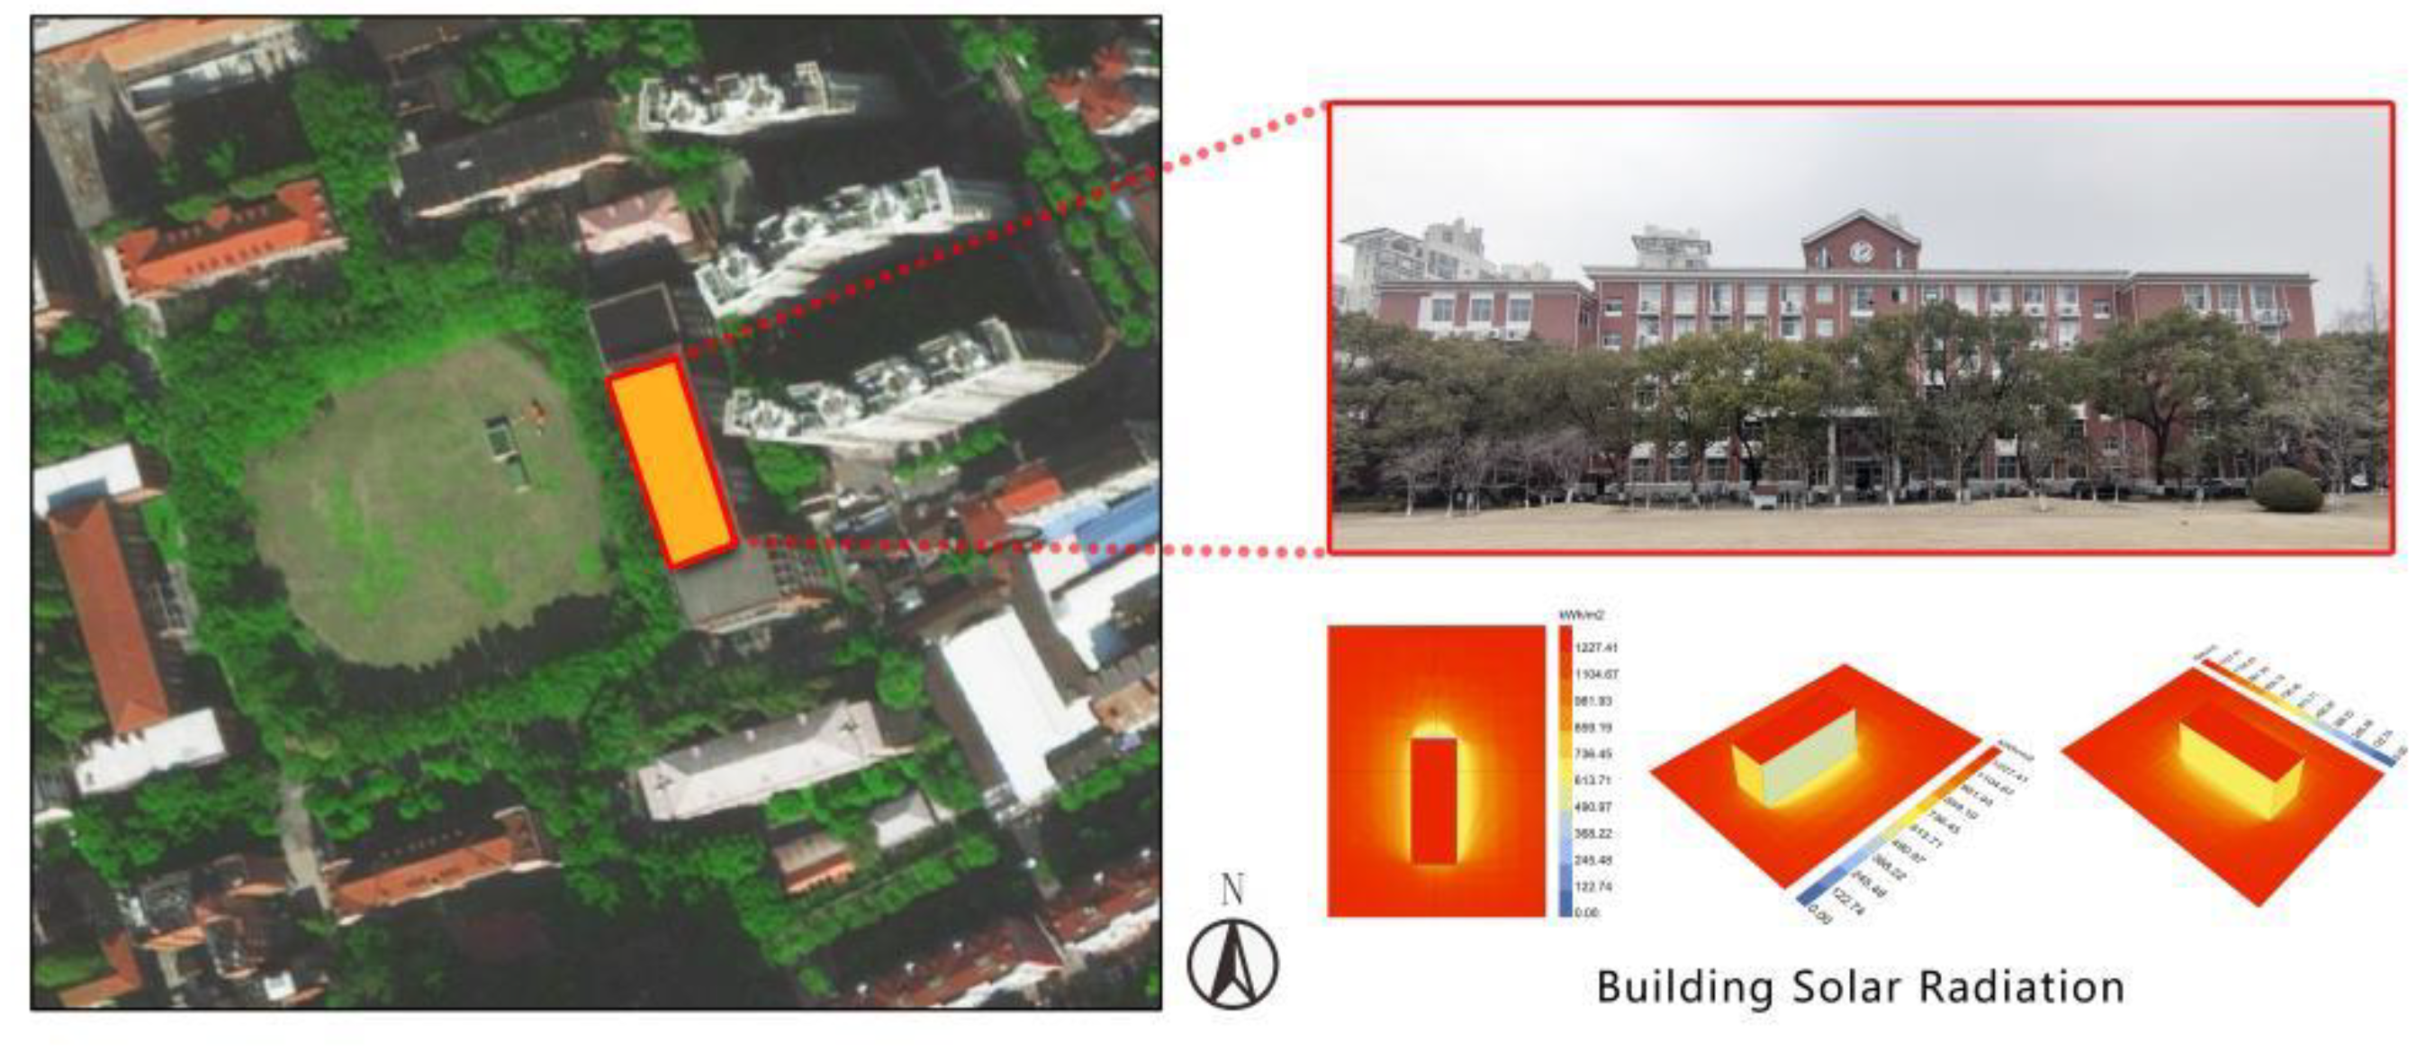
2. The Study Area
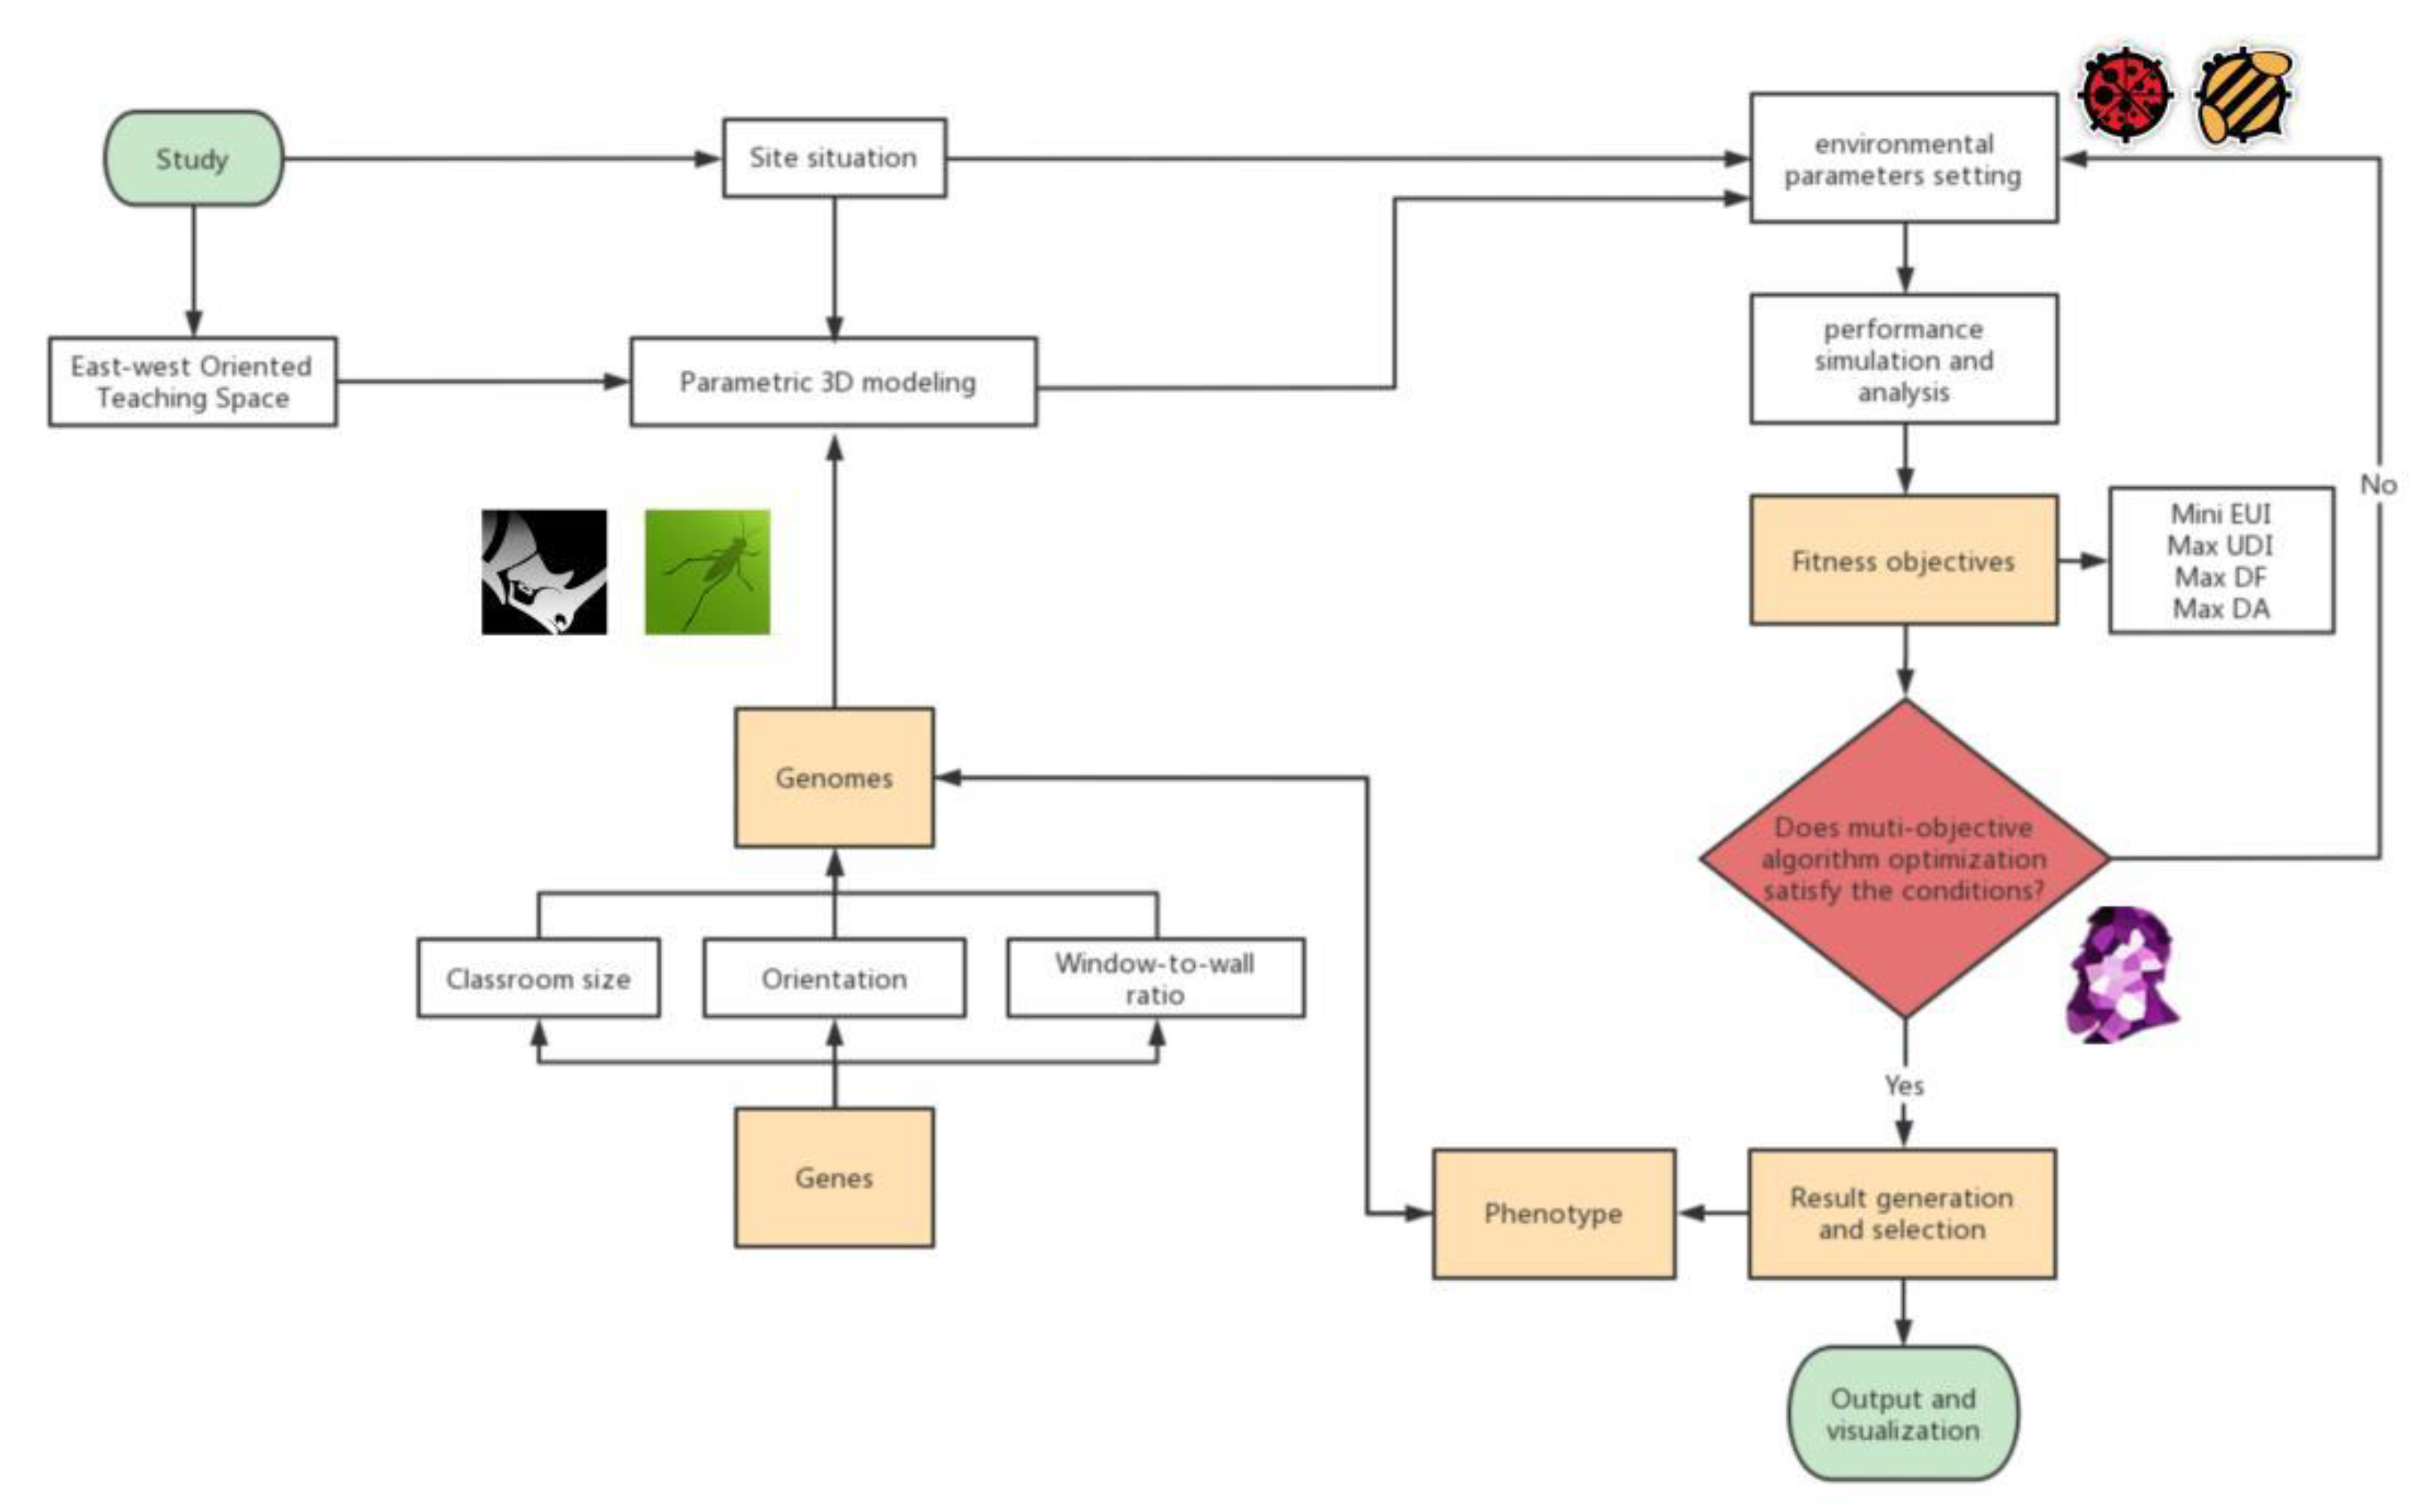
3. Methodology
- parametric 3D modeling by Rhino and Grasshopper tools;
- setting environmental parameters and running simulation by BPS software (Ladybug and Honeybee);
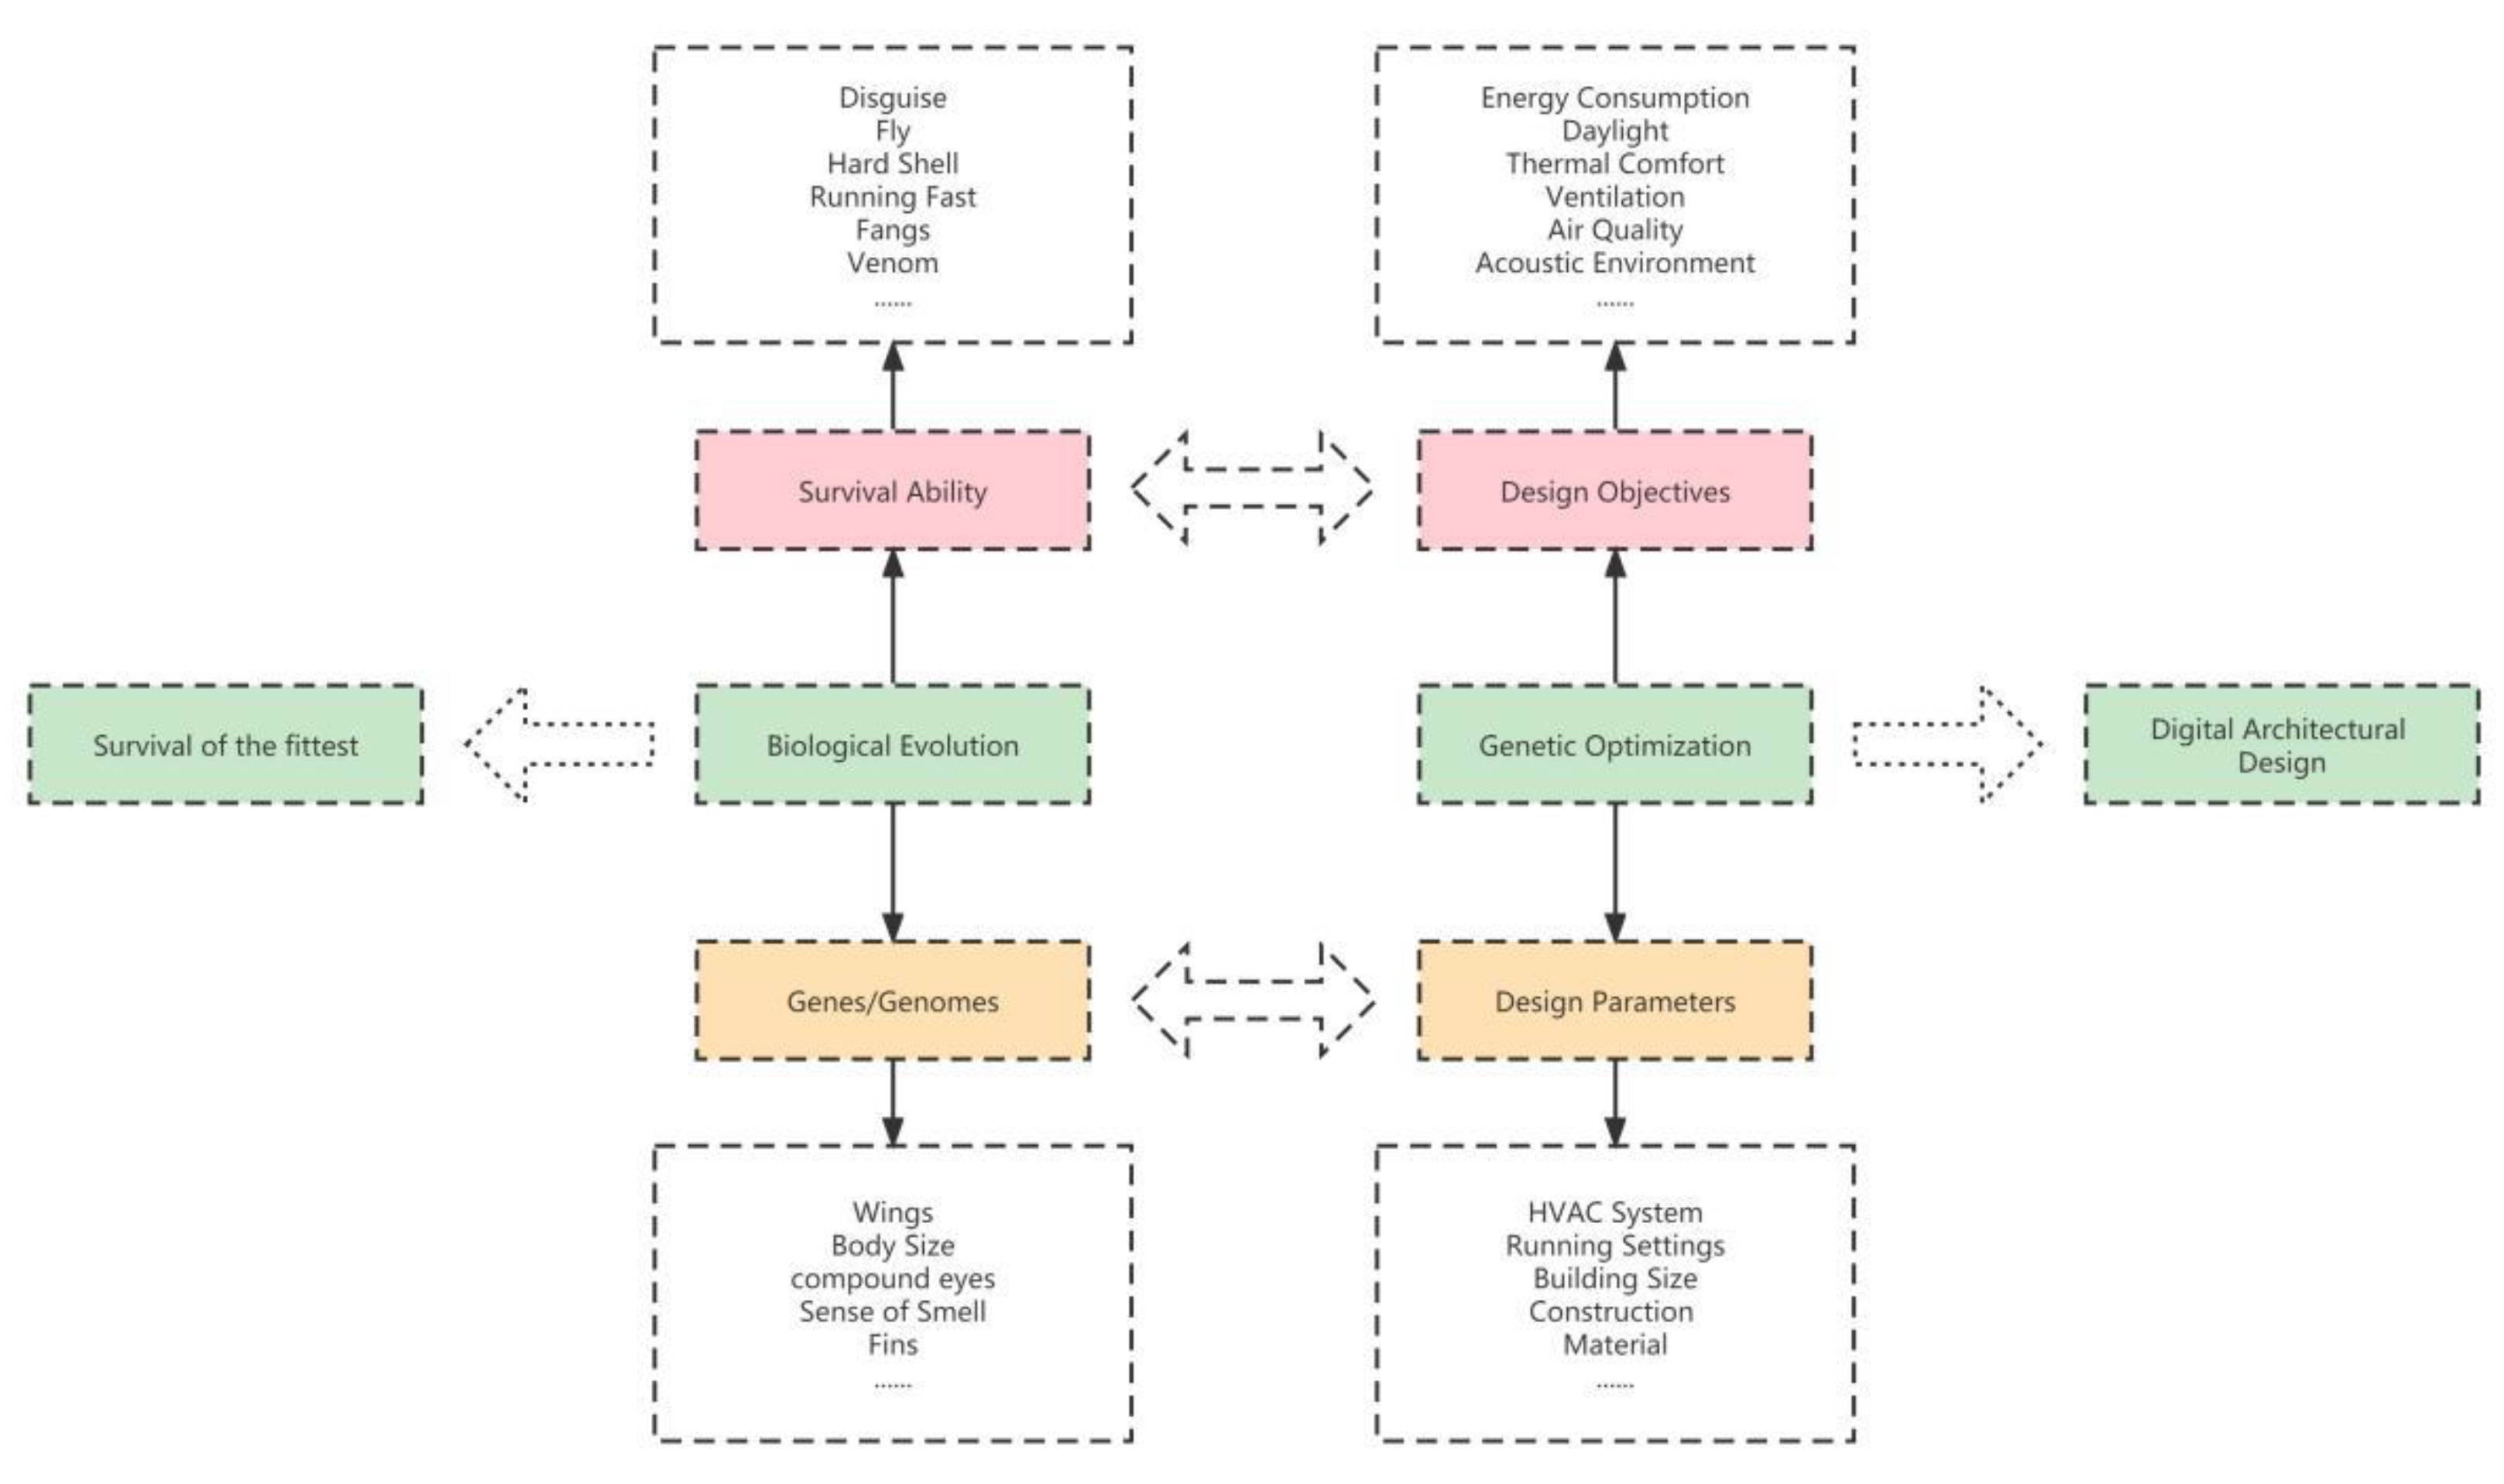
- confirmation of fitness optimization targets and selection of genes;
- muti-objective algorithm optimization based on genetic algorithm (Wallacei X);
- results selection and phenotype output.
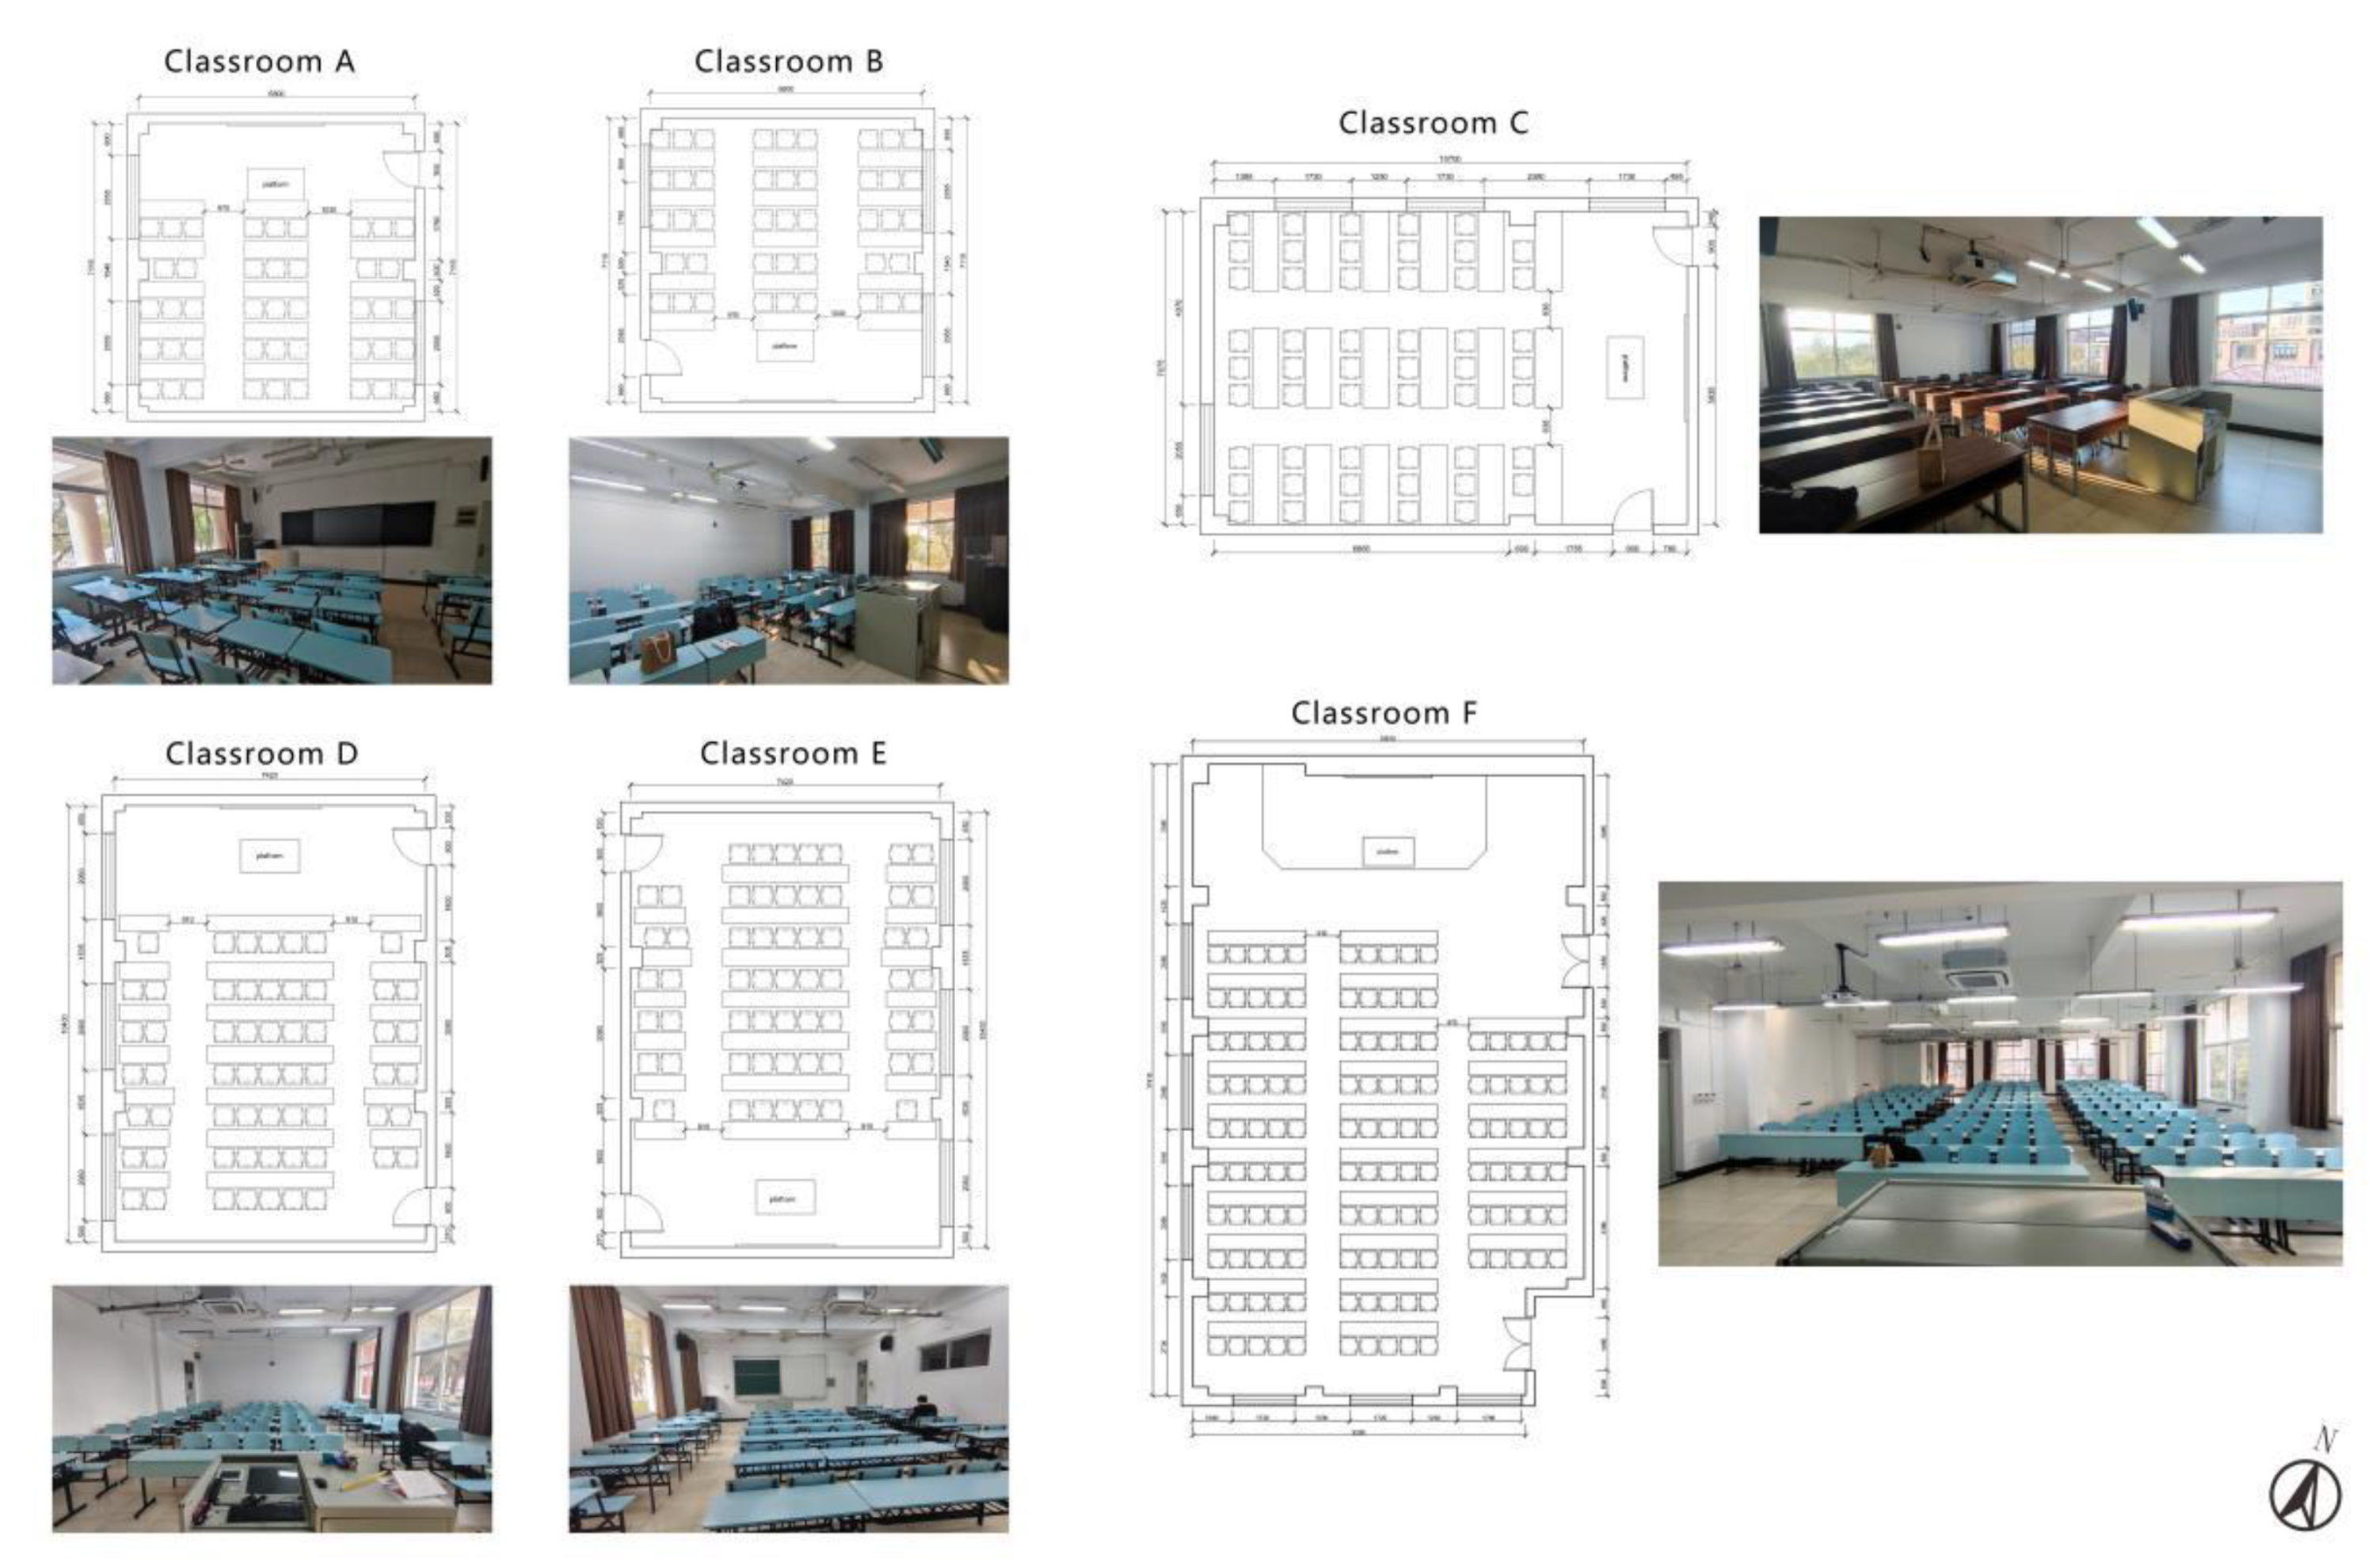
3.1. Classroom Classification and Parametric Modeling
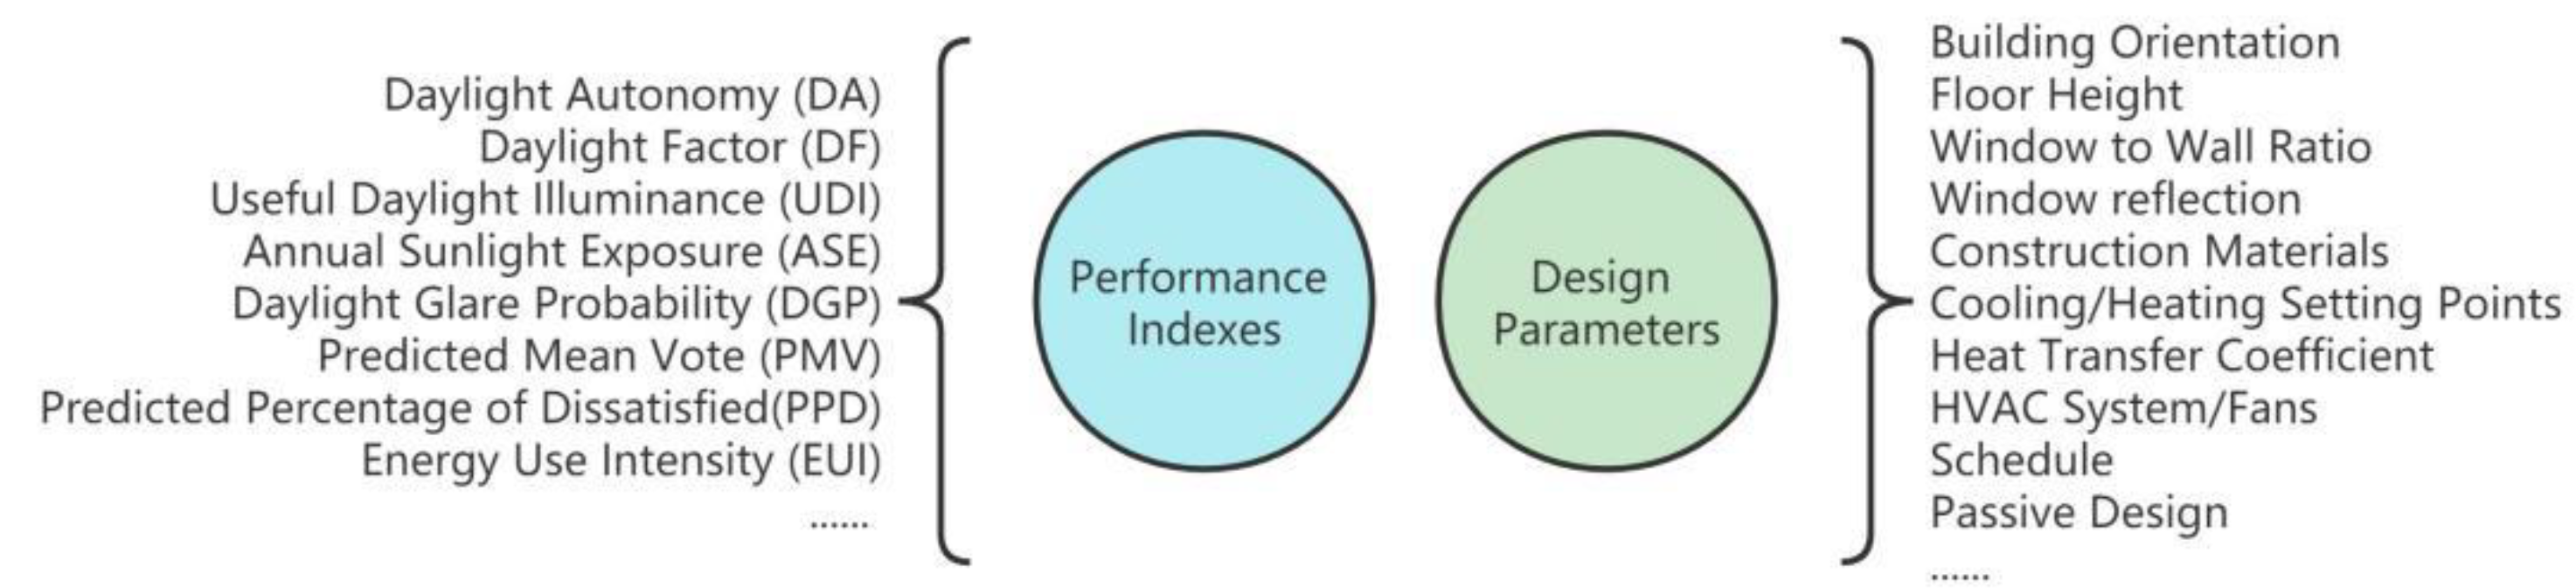
3.2. Calibration of Environmental Parameters and Calculation of Indicators
3.3. Shape Optimization with Evolutionary Algorithms
4. Results and Discussions
- Filter the optimization results that are calculated;
- Record a detailed analysis;
- Determine visual expression and phenotype.
4.1. Results from Small-Sized Classroom Optimization
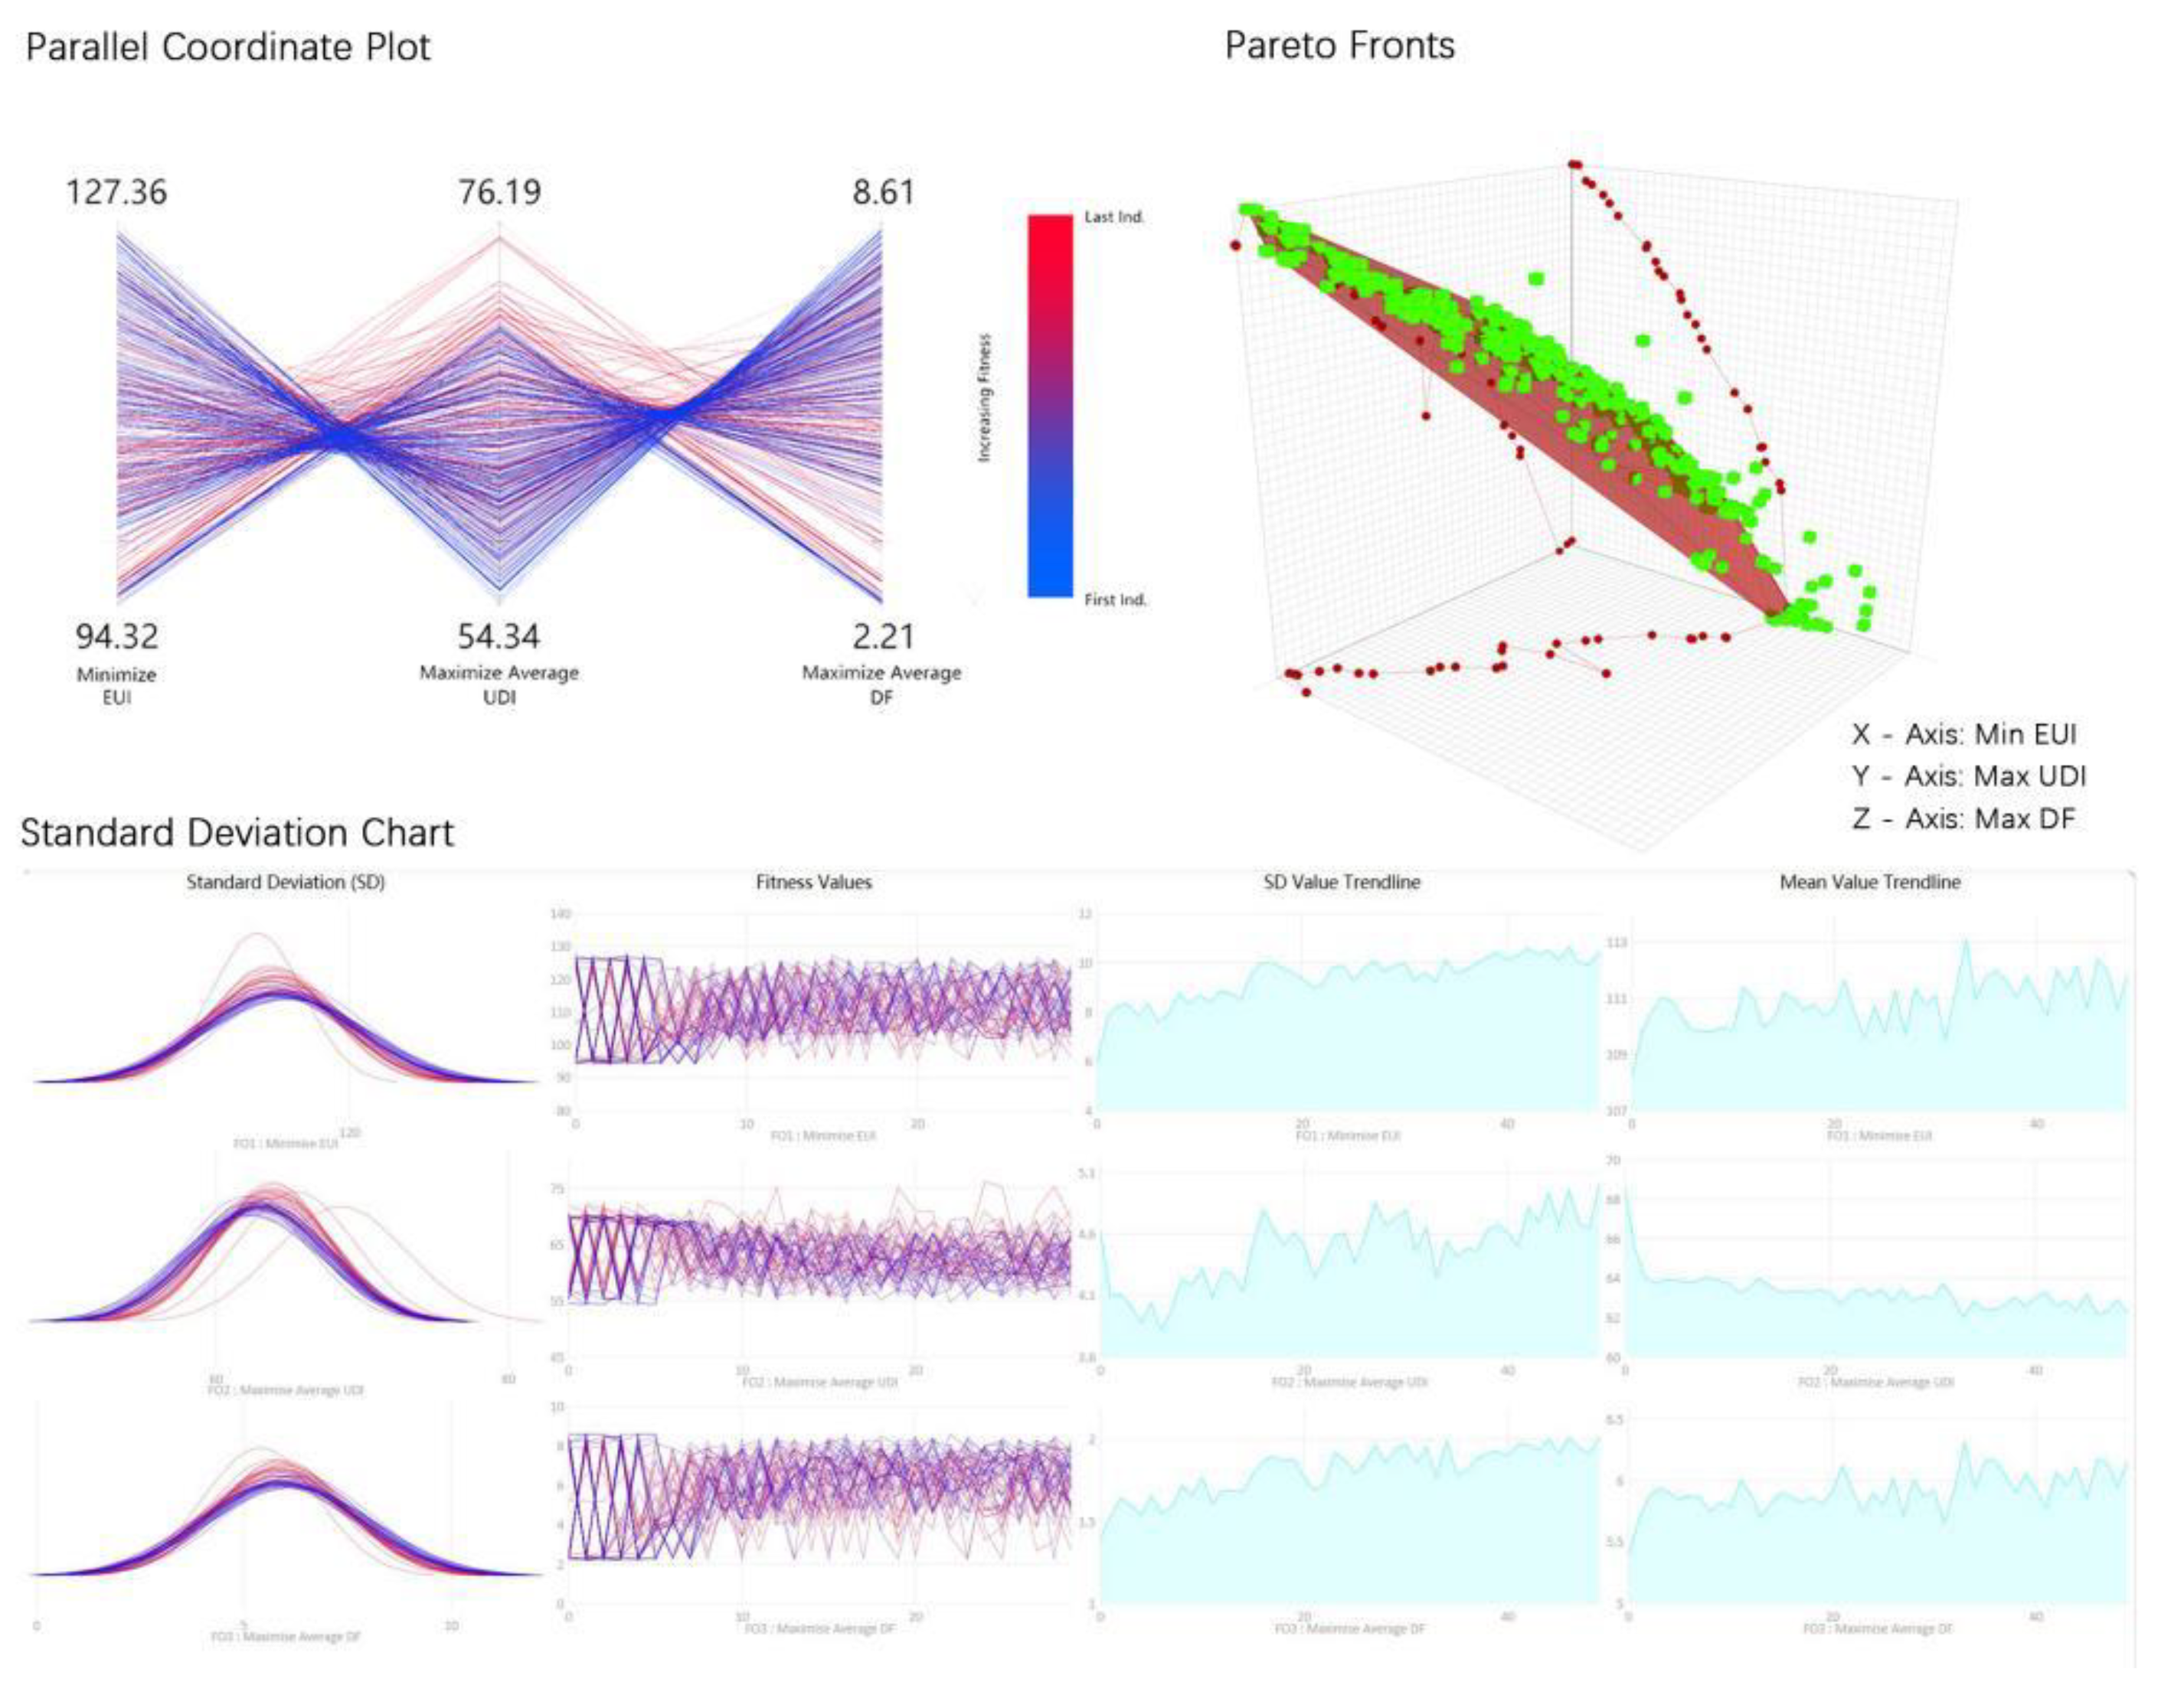
4.1.1. West Facade Fenestration for Small Classrooms
- −
- Generation size: 30, Generation count: 50
- −
- Population size: 30 × 50 = 1500 genomes
- −
- Time required for simulation: 14.5 h
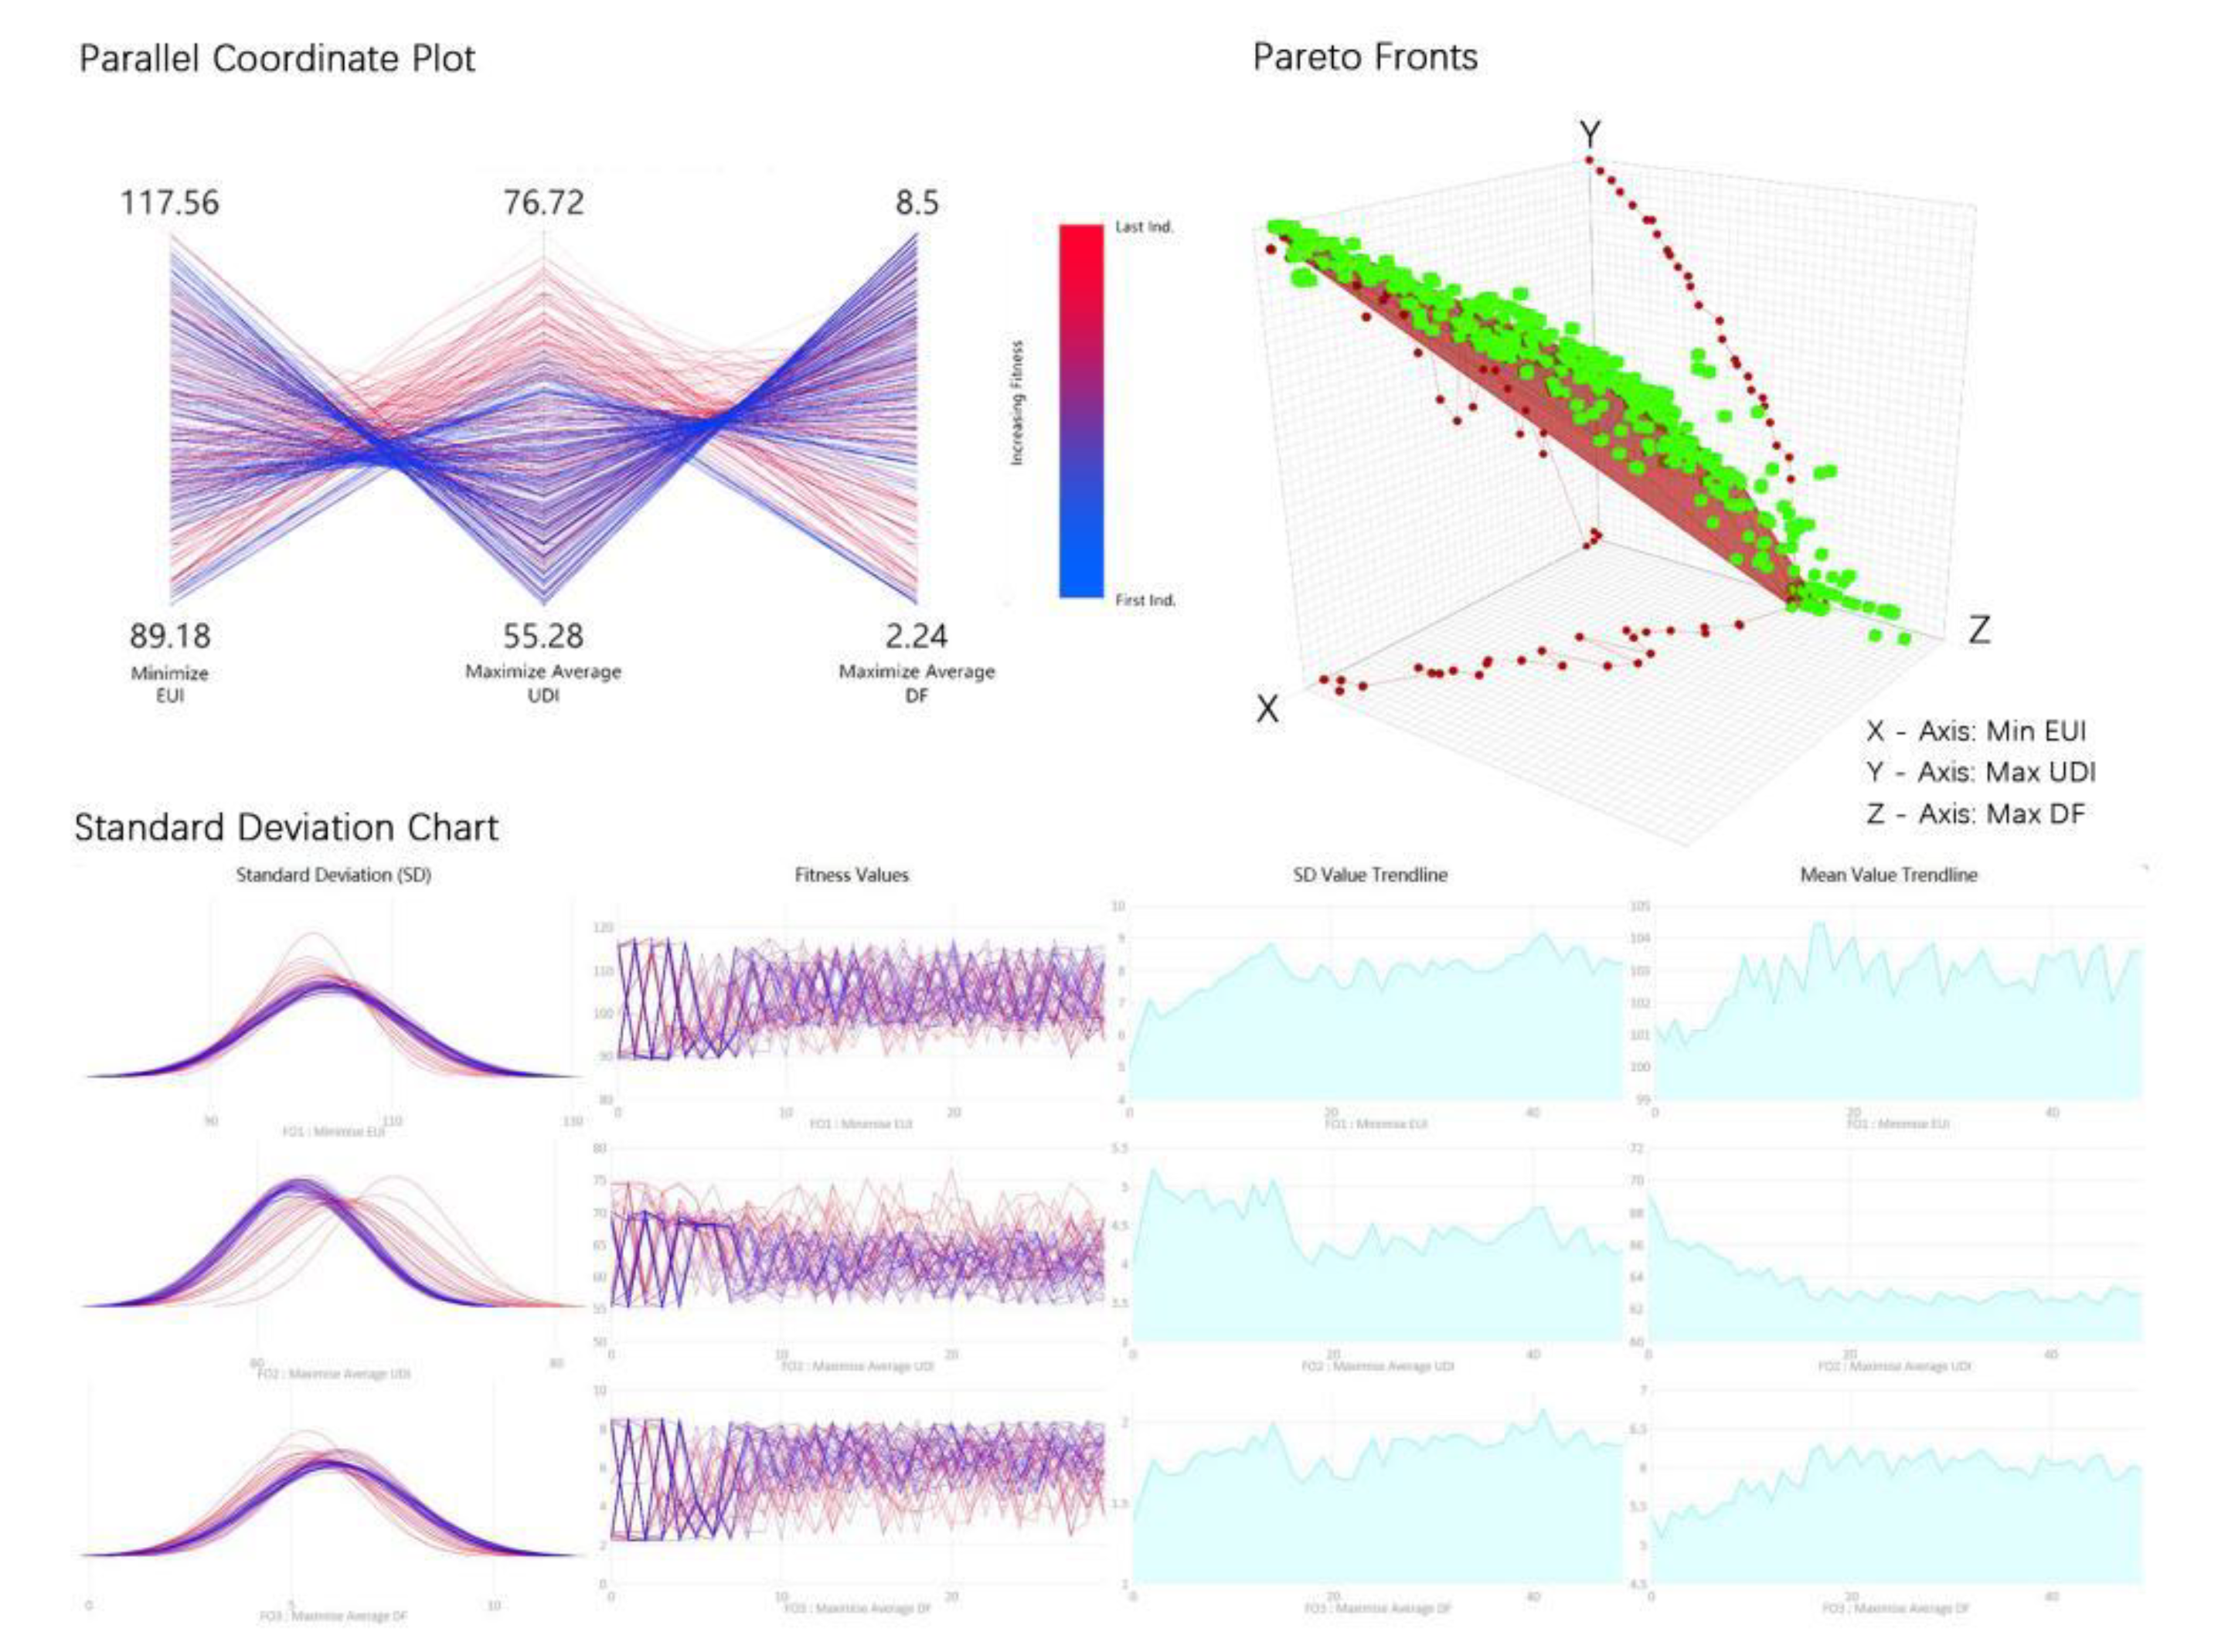
4.1.2. East Facade Fenestration for Small Classrooms
4.2. Results from Medium-Sized Classroom Optimization
4.2.1. West Facade Fenestration for Medium Classrooms
- −
- Generation size: 60, Generation count: 50
- −
- Population size: 60 × 50 = 3000 genomes
- −
- Time required for simulation: 47.5 h
4.2.2. East Facade Fenestration for Medium Classrooms
- −
- Generation size: 30, Generation count: 50
- −
- Population size: 30 × 50 = 1500 genomes
- −
- Time required for simulation: 17.5 h
4.3. Result from Large-Sized Classroom Optimization
4.3.1. West and South Facade Fenestration for Large Classrooms
- −
- Generation size: 30, Generation count: 50
- −
- Population size: 30 × 50 = 1500 genomes
- −
- Time required for simulation: 19.5 h
4.3.2. East and South Facade Fenestration for Large Classrooms
4.4. Summary of Results
- The reduction of energy consumption (EUI):
- −
- Small Classroom, West: 4.3~9.5%, East: 5.4~10.9%;
- −
- Medium Classroom, West: 0.9~12.1%, East: 9.7~18.5%;
- −
- Large Classroom, West: 9.4~17.6%, East: 15.1~18.9%;
- −
- Average decrease, West: 4.9~13.1%, East: 10.1~16.1%;
- −
- Total, 7.5~14.6%.
- The energy savings rate of east-facing classrooms compared with west-facing classrooms:
- −
- Small Classroom: almost identical;
- −
- Medium Classroom: 7.9~9.8%;
- −
- Large Classroom: 1.6~6.8%;
- −
- Average: 4.8~8.3%.
- The enhancement of the lighting environment:
- −
- UDI index: the improvements of small and large sizes were generally within 5%, or roughly the same as the previous. Medium classrooms could reach about 10%;
- −
- DF index: 20~35% improvement for small classrooms, 9% for medium classrooms, over 10% for the large classroom;
- −
- DA index: 6~20% improvement for small classrooms, approximately 14% for medium classrooms, 3.6~27.5% for the large classroom.
- Comparison with normal classrooms with north–south orientations:
- −
- Energy saving: the energy consumption of east–west-oriented teaching spaces could be reduced by 5.9%~26.4% with the same environmental factors.
- −
- Lighting environment: slightly better than normal classrooms in terms of UDI index, and slightly inferior (but still high) in terms of DF and DA indexes.
5. Limitation
6. Conclusions
- (1)
- The energy consumption of the optimized classrooms was reduced. Teaching spaces with an east–west orientation could save 7.5%~14.6% of energy after optimization. On average, spaces with west- and east-facing directions could save 4.9%~13.1% and 10.1%~16.1%, respectively. Furthermore, the arrangement of windows in easterly directions always consumed less energy than westerly ones, using 4.8%~8.3% less on average. This may be attributed to the sunlight coming from the west in the afternoon.
- (2)
- Surprisingly, the results showed a high energy-saving ratio for the optimization of medium-sized classrooms with the maximum number and frequency of usage because of their reasonable sizes.
- (3)
- The indoor lighting environment also showed satisfactory results. Three indexes (UDI, DF, and DA) all had different degrees of improvement. The enhancement of the UDI index was generally within 5%, while the overall data were above 60%, and sometimes even up to 75%; most of the DF indexes exceeded 5.0% for a satisfying indoor light environment; the improvement of the DA index was large, with values above 50% and some reaching 80%.
- (4)
- Compared with the normal classrooms, the energy consumption was reduced by 5.9%~26.4%. This was slightly better than the normal classrooms in terms of UDI index and slightly inferior (but still high) in terms of DF and DA indexes. The values provided are typically not high because all climate zones in China must be considered for the normal classrooms.
Author Contributions
Funding
Institutional Review Board Statement
Informed Consent Statement
Data Availability Statement
Acknowledgments
Conflicts of Interest
References
- Yan, D.; Chen, Y.; Pan, Y.; Gao, Y.; Zhnag, Q. Building performance simulation research in China: Current Status and perspectives. Build. Sci. 2018, 34, 130–138. [Google Scholar]
- Arens, E.; Humphreys, M.A.; de Dear, R. Are ‘class A’ temperature requirements realistic or desirable? Build. Environ. 2010, 45, 4–10. [Google Scholar]
- Fanger, P.O. Thermal Comfort; Danish Technical Pres: Copenhagen, Denmark, 1970. [Google Scholar]
- Humphreys, M.A.; Nicol, J.F. The validity of ISO-PMV for predicting comfort votes in every-day life. Energy Build. 2002, 34, 667–684. [Google Scholar]
- Nicol, J.; Humphreys, M. New standards for comfort and energy use in buildings. Build. Res. Inf. 2009, 37, 68–73. [Google Scholar]
- Zhu, Y. Thermal Comfort, what level is adequate? World Archit. 2015, 07, 35–37. [Google Scholar]
- Cao, B.; Shang, Q.; Dai, Z.; Zhu, Y. The impact of air-conditioning usage on sick building syndrome during summer in China. Indoor Built Environ. 2013, 22, 490–497. [Google Scholar]
- Yu, J.; Ouyang, Q.; Zhu, Y.; Shen, H.; Cao, G.; Cui, W. A comparison of the thermal adaptability of people accustomed to air conditioned environments and naturally ventilated environments. Indoor Air 2012, 22, 110–118. [Google Scholar] [PubMed]
- Chen, Y.Y.; Ebenstein, A.; Greenstone, M.; Li, H. Evidence on the impact of sustained exposure to air pollution on life expectancy from China’s Huai River policy. Proc. Natl. Acad. Sci. USA 2013, 110, 32–41. [Google Scholar]
- Huang, J.; Liu, Y.; Guo, Q.; Gai, P. Influence of window-wall ration on public buildings energy consumption in hot summer and cold winter zone. Build. Energy Effic. 2016, 44, 56–58. [Google Scholar] [CrossRef]
- Jia, J.; Liu, C.; Yang, H. Green design method of primary and secondary school teaching buildings based on simulation: Taking Teaching buildings in cold region for example. Build. Energy Effic. 2017, 45, 108142. [Google Scholar]
- Fan, X.; Lv, F. Research on fan & air-conditioning joint operation strategy in transition season for education building in Shanghai. Build. Energy Environ. 2015, 34, 1–4. [Google Scholar]
- Bai, L.; Yang, L.; Li, S.; Song, B. Study on the thermal environment of middle and primary school classrooms in spring in Xi’an. J. Xi’an Univ. Arch. Tech. (Nat. Sci. Ed.) 2015, 47, 407–412. [Google Scholar]
- Zhang, L.; Ji, L.; Fang, Z.; Zhang, H. Passive design strategies and their quantitative effects in the climate zone of Yangtze River delta region. Archit. Tech. 2020, 7, 102–105. [Google Scholar]
- Chen, X.; Zhong, D. Tactics of passive energy saving natural ventilation. Archit. J. 2011, 09, 34–37. [Google Scholar]
- Paola, R.; Cinzia, B. Environmental quality of university classrooms: Subjective and objective evaluation of the thermal, acoustic, and lighting comfort conditions. Build. Environ. 2018, 127, 23–36. [Google Scholar]
- Hua, W.-J.; Jin, J.-X.; Wu, X.-Y.; Yang, J.-W.; Jiang, X.; Gao, G.-P.; Tao, F.-B. Elevated light levels in schools have a protective effect on Myopia. Ophthalmic Physiol. Opt. 2015, 35, 252–262. [Google Scholar] [CrossRef]
- Read, S.A.; Collins, M.; Vincent, S. Light exposure and eye growth in childhood. Investig. Ophthalmol. Vis. Sci. 2015, 56, 6779–6787. [Google Scholar] [CrossRef]
- Ohn, H. Hygiene of the Eye in Schools; Simpkin, Marshall & Co.: London, UK, 1886. [Google Scholar]
- Zhou, Z.; Chen, T.; Wang, M.; Jin, L.; Zhao, Y.; Chen, S.; Wang, C.; Zhang, G.; Wang, Q.; Deng, Q.; et al. Pilot study of a novel classroom designed to prevent myopia by increasing children’s exposure to outdoor light. PLoS ONE 2017, 12, e0181772. [Google Scholar] [CrossRef]
- Liu, Y.; Liu, B.; Wang, M. Exploration on the space design of youth education place based on the improvement of natural light environment. Archit. Tech. 2019, 4, 40–43. [Google Scholar]
- Han, D.; Gu, Z.; Wu, G. Study of methods of deigning public buildings of climatic adaptability centered around spatial form. Archit. J. 2019, 4, 78–84. [Google Scholar]
- Mitchell, W.J. Computer-Aided Architectural Design; Petrocelli/Charter: New York, NY, USA, 1977. [Google Scholar]
- Frazer, J. An Evolutionary Architecture; Architectural Association: London, UK, 1995; pp. 16–25. [Google Scholar]
- Terry, K.; Stiny, G. Making Grammars: From Computing with Shapes to Computing with Things. Des. Stud. 2015, 41, 8–28. [Google Scholar]
- Sun, C.; Han, Y. A design theory on energy efficiency of digital buildings guided by green performance. Archit. J. 2016, 11, 89–93. [Google Scholar]
- Attia, S.; Gratia, E.; De Herde, A.; Hensen, J.L.M. Simulation-based decision support tool for early stages of zero-energy building design. Energy Build. 2012, 49, 2–15. [Google Scholar]
- Hopfe, C.J.; Struck, C.; Harputlugil, G.U.; Hensen, J.L. Exploration of the use of building performance simulation for conceptual design. Proc. IBPSA-NVL Conf. 2005, 2005, 1–8. [Google Scholar]
- Østergård, T.; Jensen, R.L.; Maagaard, S.E. Building simulations supporting decision making in early design—A review. Renew. Sustain. Energy Rev. 2016, 61, 187–201. [Google Scholar]
- Evins, R. A review of computational optimisation methods applied to sustainable building design. Renew. Sustain. Energy Rev. 2013, 22, 230–245. [Google Scholar]
- Machairas, V.; Tsangrassoulis, A.; Axarli, K. Algorithms for optimization of building design: A review. Renew. Sustain. Energy Rev. 2014, 31, 101–112. [Google Scholar]
- Bucking, S.; Zmeureanu, R.; Athienitis, A. A methodology for identifying the influence of design variations on building energy performance. J. Build. Perform. Simul. 2014, 7, 411–426. [Google Scholar]
- Slowik, A.; Kwasnicka, H. Evolutionary algorithms and their applications to engineering problems. Neural Comput. Appl. 2020, 32, 12363–12379. [Google Scholar]
- Chengye, M. Research on the generation design of primary and secondary education building based on muti-agent system. South China Univ. Technol. 2021, 2. [Google Scholar] [CrossRef]
- Doing Business in China–Survey. Ministry of Commerce of the People’s Republic of China. Available online: https://web.archive.org/web/20170403022204/http://english.mofcom.gov.cn/aarticle/zt_business/lanmub/200704/20070404532924.html (accessed on 26 May 2014).
- General History of Shanghai–Volume 2. Natural environment (in Chinese). Office of Shanghai Chronicles. Available online: http://www.shtong.gov.cn/dfz_web/DFZ/PianInfo?idnode=4563&tableName=userobject1a&id=-1 (accessed on 4 July 2008).
- U.S. Department of Energy (DOE). EnergyPlus Energy Simulation Software Version 9.3.0. 2020. Available online: https://energyplus.net/downloads (accessed on 12 April 2021).
- Gagge, A.P.; Fobelets, A.P.; Berglund, L.G. A Standard Predictive Index of Human Response to the Thermal Environment. ASHRAE Trans. 1986, 92, 85–101. [Google Scholar]
- GB 50099-2011; Code for Design of School. China Architecture & Building Press: Beijing, China, 2011.
- GB 50033-2013; Standard for Daylighting Design of Buildings. China Architecture & Building Press: Beijing, China, 2013.
- GB 50034-2013; Standard for Lighting Design of Buildings. China Architecture & Building Press: Beijing, China, 2013.
- GB/T 50785-2012; Evaluation Standard for Indoor Thermal Environment in Civil Buildings. China Architecture & Building Press: Beijing, China, 2012.
- DG/TJ08-12-2004; Shanghai General Primary and Secondary School Construction Standard. Shanghai Construction and Management Commission: Shanghai, China, 2004.
- DB3/T 539-2020; Code for Lighting Design of Primary and Secondary Schools and Kindergartens in Shanghai. Shanghai Municipal Bureau of Market Supervision: Shanghai, China, 2020.
- Day, M. Rhino Grasshopper. AEC Magazine, X3DMedia. 2010. Available online: https://aecmag.com/news/rhino-grasshopper/ (accessed on 12 April 2021).
- Davidson, S. Grasshopper: Algorithmic Modelling for Rhino. 2019. Available online: http://www.grasshopper3d.com (accessed on 21 January 2021).
- Fuller, D.; McNeil, A. Radiance—A Validated Lighting Simulation Tool—Radsite. Available online: https://www.radianceonline.org/ (accessed on 12 April 2021).
- Caetano, I.; Santos, L.; Leitão, A. Computational design in architecture: Defining parametric, generative, and algorithmic design. Front. Archit. Res. 2020, 9, 287–300. [Google Scholar]
- Hosseini, S.; Al Khaled, A. A survey on the imperialist competitive algorithm metaheuristic: Implementation in engineering domain and directions for future research. Appl. Soft Comput. 2014, 24, 1078–1094. [Google Scholar]
- Makki, M.; Showkatbakhsh, M. An Evolutionary Multi-Objective Optimization and Analytic Engine for Grasshopper 3D. Available online: https://www.wallacei.com/research (accessed on 10 May 2021).
- Ali, A.K.; Song, H.; Lee, O.J.; Kim, E.S.; Ali, H.H.M. Multi-Agent-Based Urban Vegetation Design. Int. J. Environ. Res. Public Health 2020, 17, 3075. [Google Scholar]
- Makki, M.; Showkatbakhsh, M.; Tabony, A.; Weinstock, M. Evolutionary algorithms for generating urban morphology: Variations and multiple objectives. Int. J. Archit. Comput. 2019, 17, 5–35. [Google Scholar]
- Makki, M.; Showkatbakhsh, M.; Song, Y. Wallacei Primer 2.0. 2019. Available online: https://www.wallacei.com/ (accessed on 12 April 2021).
- Navarro-Mateu, D.; Makki, M.; Cocho-Bermejo, A. Urban-Tissue Optimization through Evolutionary Computation. Mathematics 2018, 6, 189. [Google Scholar]


| Classroom | A | B | C | D | E | F |
|---|---|---|---|---|---|---|
| Height (m) | 3.4 | 3.4 | 3.4 | 3.8 | 3.8 | 4.0 |
| Width (m) | 6.80 | 6.80 | 10.70 | 7.42 | 7.42 | 10.81 |
| Length (m) | 7.11 | 7.11 | 7.08 | 10.40 | 10.40 | 17.42 |
| Floor area (m2) | 47.89 | 47.89 | 75.23 | 76.59 | 76.59 | 178.95 |
| Volume (m3) | 162.83 | 162.83 | 255.78 | 291.04 | 291.04 | 715.80 |
| N° of doors | 1 | 1 | 2 | 2 | 2 | 4 |
| Total doors surface (m2) | 1.89 | 1.89 | 3.78 | 3.78 | 3.78 | 6.13 |
| Orientation | West | East | West, North | West | East | West, South |
| N° of windows | 3 | 3 | 6 | 5 | 5 | 8 |
| Total windows surface (m2) | 10.92 | 10.92 | 16.29 | 16.22 | 16.22 | 35.26 |
| Material of windows | Glass-metal | |||||
| Ceiling material | Plaster | |||||
| Floor material | Marble | |||||
| Wall surface material | Plaster | |||||
| Surface color | White, gray, beige | White, gray, brown | White, gray, beige | |||
| Building service systems | HVAC system and fans | |||||
| Type of electric light | Fluorescent lamp | |||||
| Shading | Curtains (no external visors) | |||||
| Material | Brick | LW Concrete | 50 mm Insulation | Wall Air gap | Gypsum Board | Concrete Floor | Ground Floor_R11 |
|---|---|---|---|---|---|---|---|
| Roughness | Medium rough | Medium rough | Medium rough | Smooth | Medium smooth | Medium rough | Smooth |
| Thickness (m) | 0.1 | 0.1 | 0.05 | 0.1 | 0.01 | 0.1 | 0.04 |
| Conductivity (W/m∙k) | 0.9 | 0.53 | 0.03 | 0.67 | 0.16 | 2.31 | 0.02 |
| Density (kg/m3) | 1920.0 | 1280.0 | 43.0 | 1.28 | 800.0 | 2322.0 | 16.0 |
| Specific heat (J/kg∙K) | 790.0 | 840.0 | 1210.0 | 1000.0 | 1090.0 | 832.02 | 1129.71 |
| Thermal absorptance | 0.9 | 0.9 | 0.9 | 0.9 | 0.9 | 0.9 | 0.9 |
| Solar absorptance | 0.65 | 0.8 | 0.7 | 0.7 | 0.5 | 0.7 | 0.7 |
| Visible absorptance | 0.65 | 0.8 | 0.7 | 0.7 | 0.5 | 0.7 | 0.8 |
| R value (m2∙k/W) | 0.11 | 0.19 | 1.67 | 0.15 | 0.08 | 0.04 | 1.92 |
| Indicators | UDI (%) | DA (%) | DF (%) | ECB (kWh/m2) |
|---|---|---|---|---|
| Classroom A |  |  |  |  |
| Classroom B |  |  |  |  |
| Classroom C |  |  |  |  |
| Classroom D |  |  |  |  |
| Classroom E |  |  |  |  |
| Classroom F |  |  |  |  |
| Indicators | UDI (%) | DA (%) | DF (%) | EUI (kWh/m2) | Test Points | Orientation |
|---|---|---|---|---|---|---|
| Classroom A | 67.92 | 61.20 | 4.10 | 109.50 | 49 | West |
| Classroom B | 70.14 | 58.76 | 4.09 | 105.36 | 49 | East |
| Classroom C | 67.26 | 73.02 | 2.86 | 103.37 | 77 | West and North |
| Classroom D | 66.41 | 67.63 | 5.08 | 100.91 | 70 | West |
| Classroom E | 70.03 | 70.14 | 5.05 | 104.25 | 70 | East |
| Classroom F | 61.53 | 62.74 | 4.54 | 109.35 | 202 | West and South |
| Indicators | Min EUI | Max UDI | Max DF | Max DA | Priority of Energy | Priority of Daylight |
|---|---|---|---|---|---|---|
| Small classroom | √ | √ | √ | √ | ||
| Medium classroom | √ | √ | √ | √ | √ | √ |
| Large classroom | √ | √ | √ | √ | √ |
| Optimization Range | Small Classroom | Medium Classroom | Large Classroom | Step |
|---|---|---|---|---|
| Height (m) | 3.2~4.2 | 3.2~4.4 | 3.4~4.4 | 0.1 |
| Length (m) | 6~7.5 | 7.5~12 | 12~20 | 0.1 |
| Width (m) | 6~7.5 | 7.5~12 | 10~15 | 0.1 |
| Orientation (°) | −30°~30° | −30°~30° | −30°~30° | 1 |
| WWR (%) | West: 30~70 | West: 30~70 | West, South: 30~70 | 5 |
| East: 30~70 | East: 30~70 | East, South: 30~70 | ||
| N° of Genes | 5 | 5 | 6 | - |
| Small Classroom | Min EUI | Max UDI | Max DF | Pareto Set 1 | Pareto Set 2 | Pareto Set 3 |
|---|---|---|---|---|---|---|
| EUI (kWh/m2) | 94.32 | 102.30 | 126.25 | 104.30 | 101.35 | 103.97 |
| UDI (%) | 69.65 | 76.19 | 54.35 | 65.20 | 68.34 | 66.47 |
| DF (%) | 2.31 | 3.23 | 8.61 | 5.52 | 4.21 | 4.86 |
| Population | Gen.24 Ind.1 | Gen.0 Ind.24 | Gen.42 Ind.1 | Gen.49 Ind.28 | Gen.45 Ind.6 | Gen.35 Ind.26 |
| Diamond Fitness Chart |  |  |  |  |  |  |
| Small Classroom | Min EUI | Max UDI | Max DF | Pareto Set 1 | Pareto Set 2 | Pareto Set 3 |
|---|---|---|---|---|---|---|
| Height (m) | 3.2 | 4.1 | 4.2 | 3.2 | 3.3 | 3.3 |
| Length (m) | 7.5 | 6.8 | 7.4 | 7.5 | 7.5 | 6.8 |
| Width (m) | 7.5 | 7 | 6 | 7.5 | 7.4 | 7.3 |
| Orientation (°) | 23° | −20° | 30° | 23° | 30° | 30° |
| Plan |  |  |  |  |  |  |
| WWR (%) | 30 | 30 | 70 | 65 | 50 | 50 |
| Model |  |  |  |  |  |  |
| Small Classroom | Min EUI | Max UDI | Max DF | Pareto Set 1 | Pareto Set 2 | Pareto Set 3 |
|---|---|---|---|---|---|---|
| EUI (kWh/m2) | 89.19 | 94.80 | 115.93 | 99.95 | 95.65 | 97.73 |
| UDI (%) | 68.83 | 76.72 | 55.57 | 63.52 | 67.77 | 66.15 |
| DF (%) | 2.31 | 2.78 | 8.50 | 6.09 | 4.62 | 5.20 |
| Population | Gen.47 Ind.3 | Gen.1 Ind.20 | Gen.33 Ind.0 | Gen.48 Ind.28 | Gen.33 Ind.9 | Gen.41 Ind.28 |
| Diamond Fitness Chart |  |  |  |  |  |  |
| Small Classroom | Min EUI | Max UDI | Max DF | Pareto Set 1 | Pareto Set 2 | Pareto Set 3 |
|---|---|---|---|---|---|---|
| Height (m) | 3.2 | 3.5 | 4.1 | 3.3 | 3.3 | 3.3 |
| Length (m) | 7.5 | 6.3 | 7.5 | 7.5 | 7.5 | 6.7 |
| Width (m) | 7.5 | 6.6 | 6 | 7.4 | 7.5 | 7.5 |
| Orientation (°) | −26° | 20° | −28° | −29° | −25° | −24° |
| Plan |  |  |  |  |  |  |
| WWR (%) | 30 | 30 | 70 | 70 | 55 | 60 |
| Model |  |  |  |  |  |  |
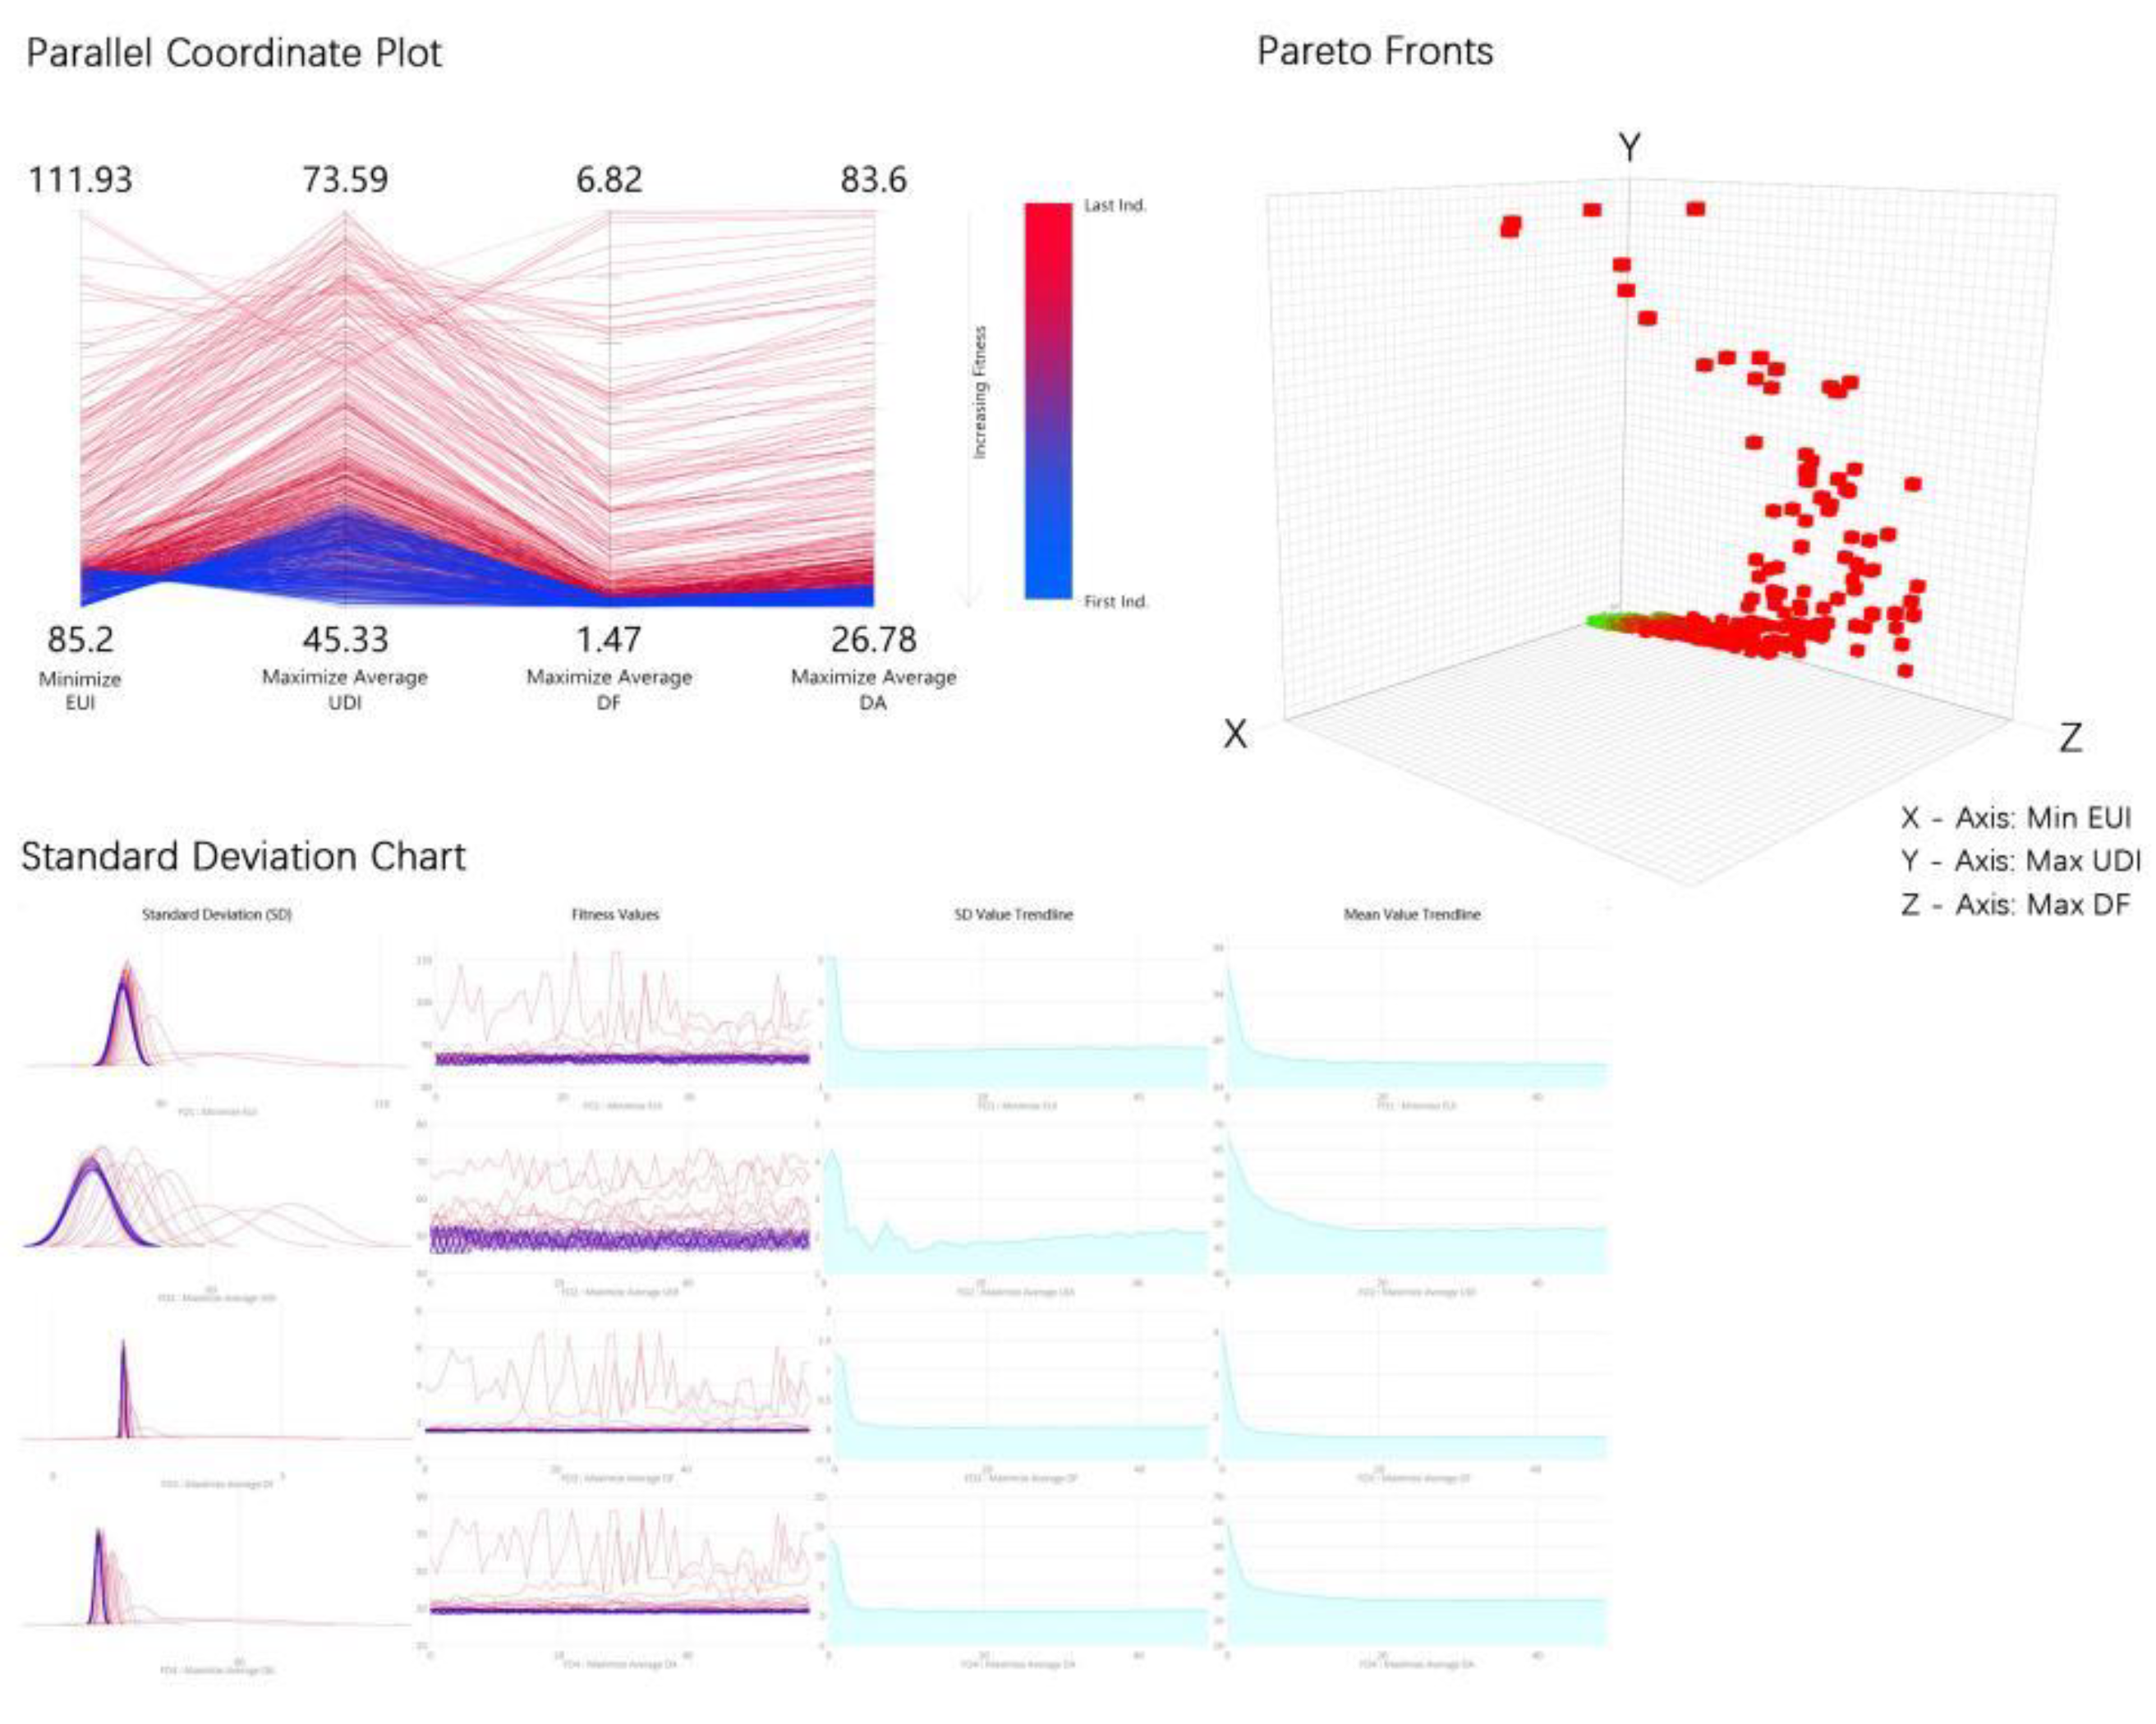
| Medium Classroom | Min EUI | Max UDI | Max DF | Max DA | Pareto Set 1 | Pareto Set 2 | Pareto Set 3 |
|---|---|---|---|---|---|---|---|
| EUI (kWh/m2) | 85.20 | 97.44 | 105.87 | 107.00 | 93.86 | 97.91 | 97.79 |
| UDI (%) | 52.27 | 73.59 | 67.66 | 62.65 | 68.47 | 66.16 | 70.57 |
| DF (%) | 1.53 | 3.17 | 6.82 | 6.79 | 4.26 | 5.10 | 5.24 |
| DA (%) | 29.75 | 52.14 | 83.43 | 83.60 | 60.89 | 70.85 | 70.37 |
| Population | Gen.32 Ind.0 | Gen.0 Ind.42 | Gen.0 Ind.18 | Gen.1 Ind.33 | Gen.0 Ind.48 | Gen.0 Ind.26 | Gen.0 Ind.6 |
| Diamond Fitness Chart |  |  |  |  |  |  |  |
| Medium Classroom | Min EUI | Max UDI | Max DF | Max DA | Pareto Set 1 | Pareto Set 2 | Pareto Set 3 |
|---|---|---|---|---|---|---|---|
| Height (m) | 3.2 | 4.1 | 4.2 | 3.7 | 3.7 | 3.3 | 3.9 |
| Length (m) | 12 | 8.3 | 11 | 11.5 | 9.7 | 11.7 | 10.7 |
| Width (m) | 12 | 8.6 | 7.9 | 7.7 | 10.4 | 9.6 | 10.6 |
| Orientation (°) | −30° | −29° | −28° | 13° | −18° | 20° | −29° |
| Plan |  |  |  |  |  |  |  |
| WWR (%) | 30 | 35 | 65 | 70 | 55 | 70 | 70 |
| Model |  |  |  |  |  |  |  |
| Medium Classroom | Min EUI | Max UDI | Max DF | Max DA | Pareto Set 1 | Pareto Set 2 | Pareto Set 3 |
|---|---|---|---|---|---|---|---|
| EUI (kWh/m2) | 87.08 | 90.05 | 102.35 | 102.35 | 88.39 | 93.13 | 89.40 |
| UDI (%) | 51.20 | 74.71 | 62.13 | 62.14 | 70.68 | 69.95 | 70.22 |
| DF (%) | 1.58 | 4.32 | 6.80 | 6.79 | 4.42 | 4.66 | 5.08 |
| DA (%) | 29.20 | 67.53 | 83.45 | 83.52 | 61.33 | 63.50 | 68.68 |
| Population | Gen.49 Ind.2 | Gen.0 Ind.11 | Gen.1 Ind.20 | Gen.2 Ind.24 | Gen.1 Ind.21 | Gen.0 Ind.3 | Gen.0 Ind.26 |
| Diamond Fitness Chart |  |  |  |  |  |  |  |
| Medium Classroom | Min EUI | Max UDI | Max DF | Max DA | Pareto Set 1 | Pareto Set 2 | Pareto Set 3 |
|---|---|---|---|---|---|---|---|
| Height (m) | 3.2 | 3.4 | 4.2 | 4.2 | 3.6 | 4 | 3.3 |
| Length (m) | 11.8 | 11.8 | 11 | 11 | 11.9 | 8.8 | 11.7 |
| Width (m) | 12 | 7.9 | 7.9 | 7.9 | 10.4 | 10.3 | 9.6 |
| Orientation (°) | 14° | 28° | −28° | −28° | 21° | 12° | 20° |
| Plan |  |  |  |  |  |  |  |
| WWR (%) | 30 | 50 | 65 | 65 | 60 | 60 | 70 |
| Model |  |  |  |  |  |  |  |
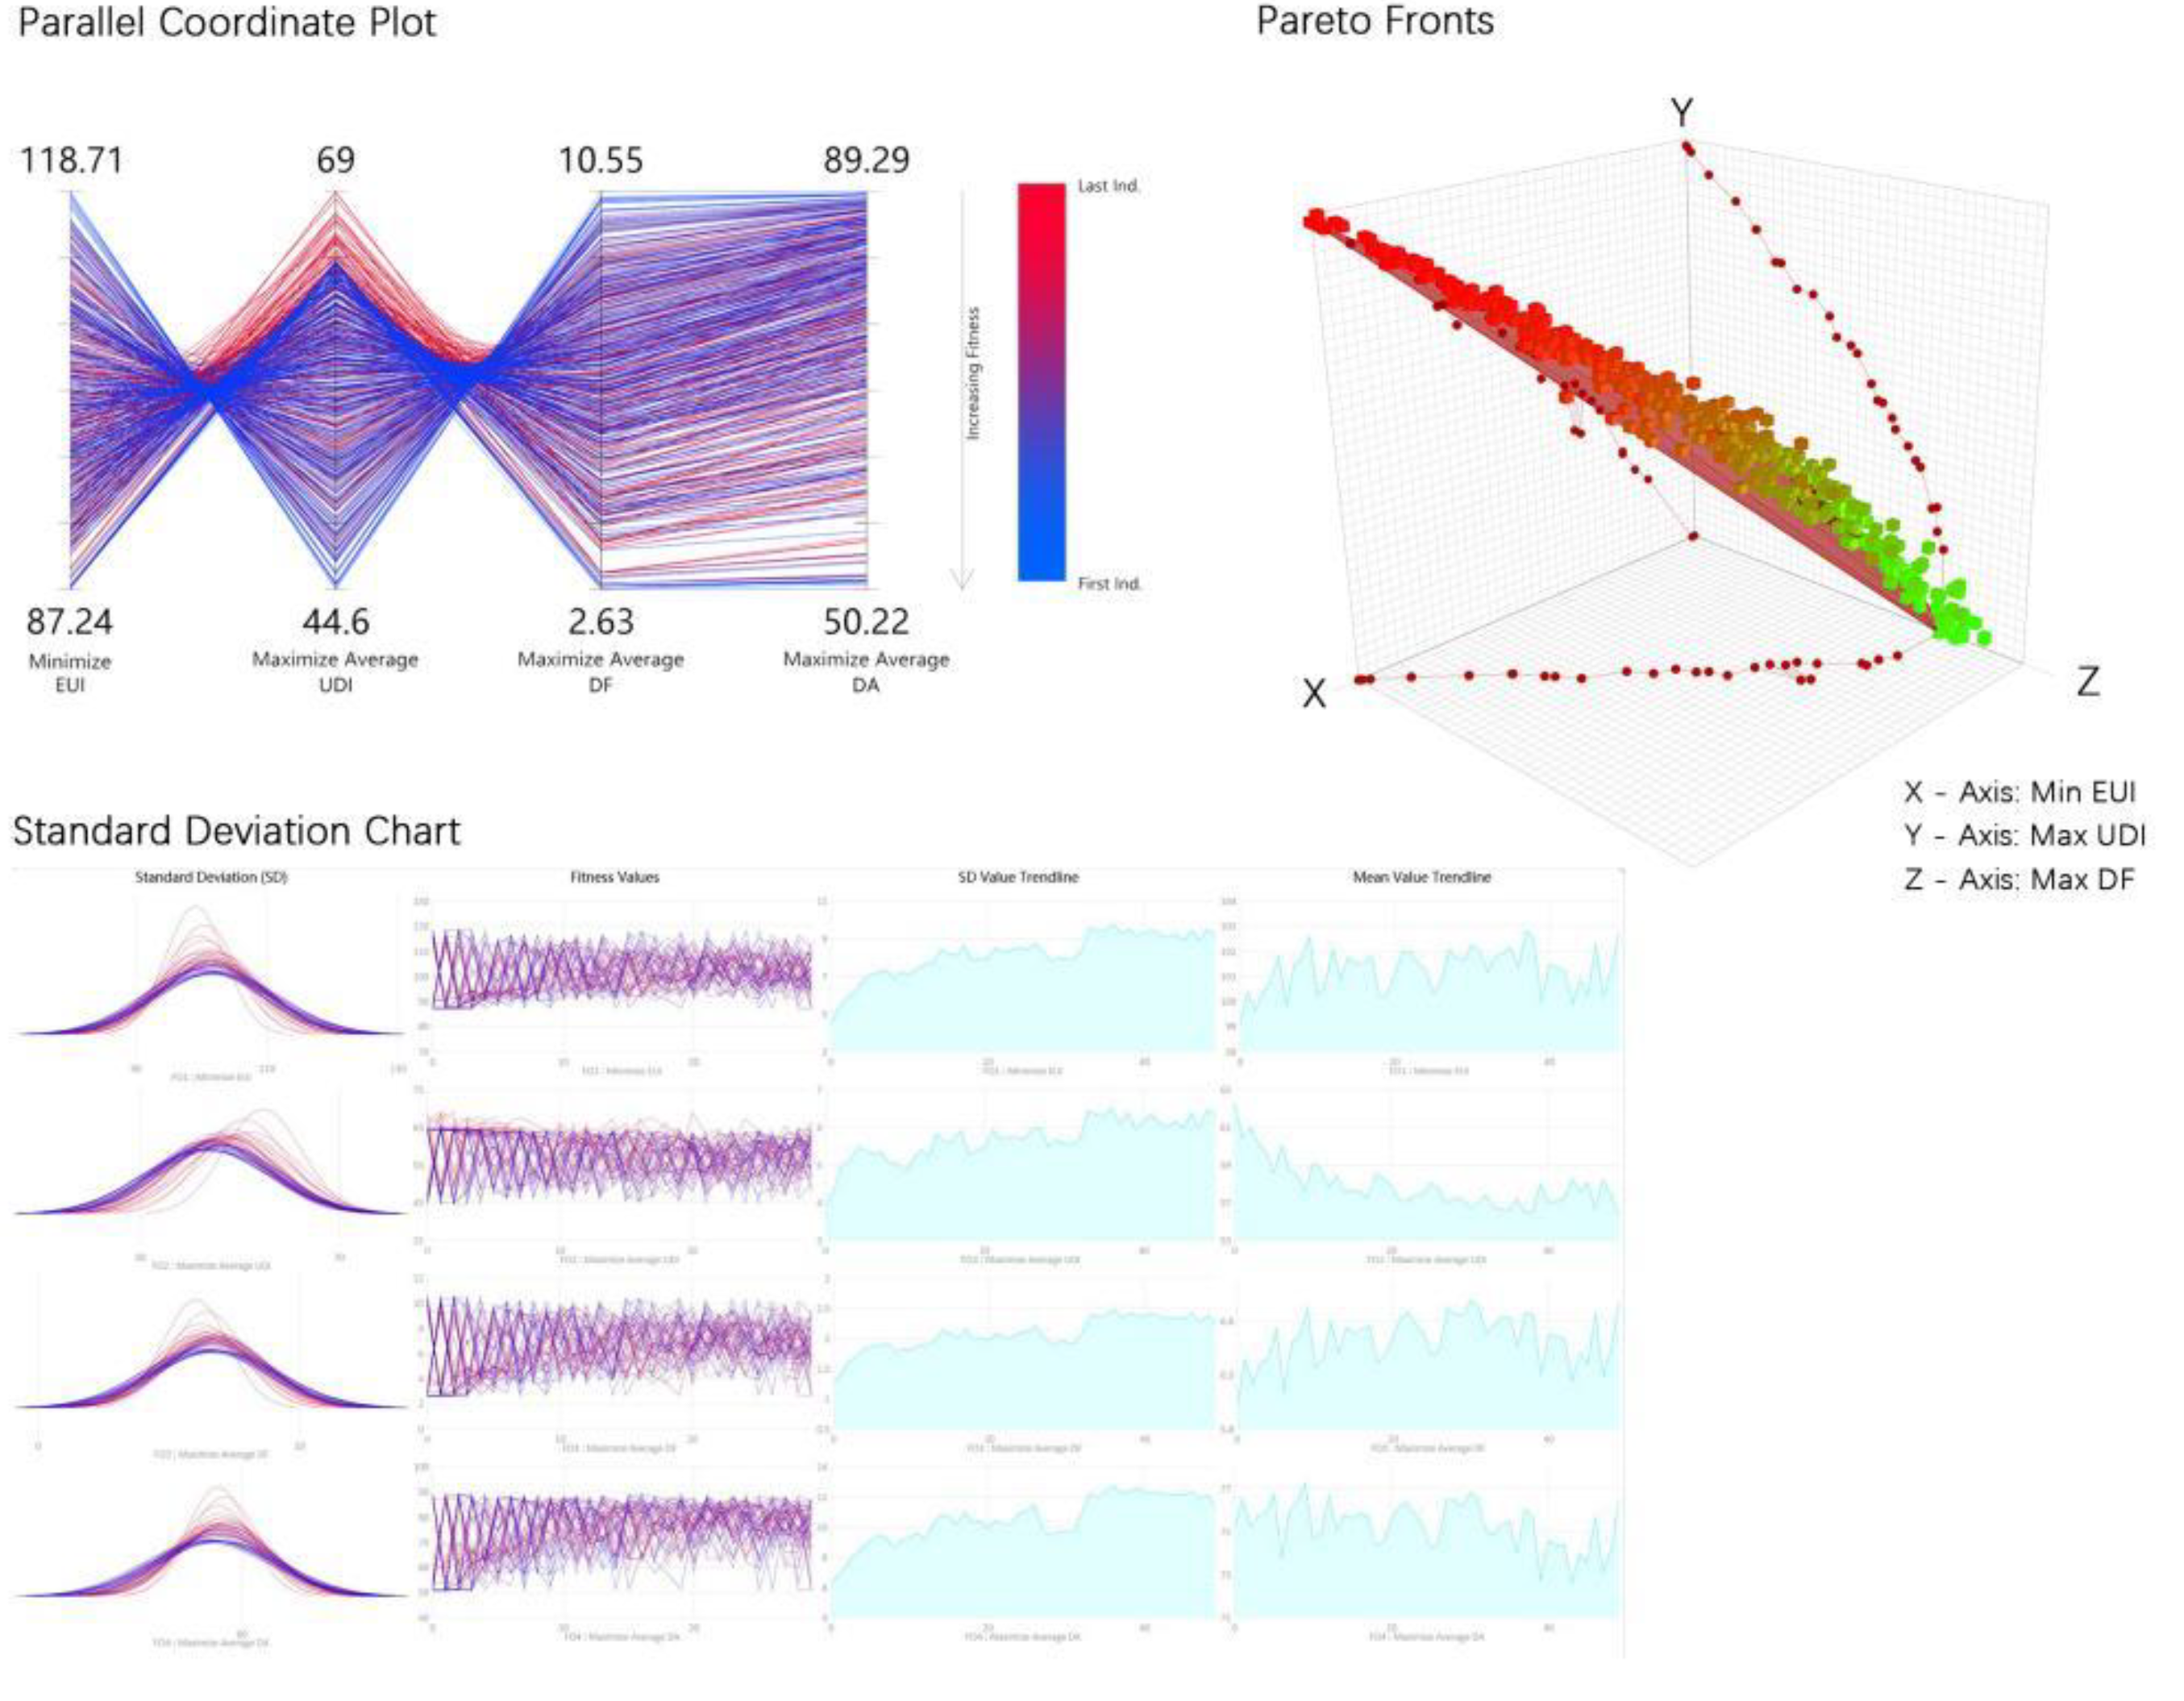
| Large Classroom | Min EUI | Max UDI | Max DF | Max DA | Pareto Set 1 | Pareto Set 2 | Pareto Set 3 |
|---|---|---|---|---|---|---|---|
| EUI (kWh/m2) | 87.24 | 91.96 | 118.54 | 118.54 | 94.75 | 97.51 | 101.31 |
| UDI (%) | 64.73 | 69.00 | 44.95 | 44.95 | 62.22 | 60.47 | 58.39 |
| DF (%) | 2.64 | 3.59 | 10.55 | 10.55 | 5.05 | 6.16 | 7.13 |
| DA (%) | 50.74 | 61.37 | 89.29 | 89.29 | 67.82 | 73.71 | 79.99 |
| Population | Gen.42 Ind.0 | Gen.2 Ind.1 | Gen.44 Ind.2 | Gen.44 Ind.2 | Gen.29 Ind.12 | Gen.31 Ind.16 | Gen.42 Ind.15 |
| Diamond Fitness Chart |  |  |  |  |  |  |  |
| Large Classroom | Min EUI | Max UDI | Max DF | Max DA | Pareto Set 1 | Pareto Set 2 | Pareto Set 3 |
|---|---|---|---|---|---|---|---|
| Height (m) | 3.4 | 4.3 | 4.4 | 4.4 | 3.4 | 3.4 | 3.5 |
| Length (m) | 19.9 | 16.3 | 12 | 12 | 19.7 | 16.8 | 18.4 |
| Width (m) | 15 | 13.4 | 11.1 | 11.1 | 15 | 14.9 | 11.1 |
| Orientation (°) | 13° | −20° | 11° | 11° | 24° | 9° | 11° |
| Plan |  |  |  |  |  |  |  |
| WWR (%) | South:30 | South:30 | South:70 | South:70 | South:70 | South:70 | South:65 |
| West:35 | West:30 | West:70 | West:70 | West:50 | West:60 | West:65 | |
| Model |  |  |  |  |  |  |  |
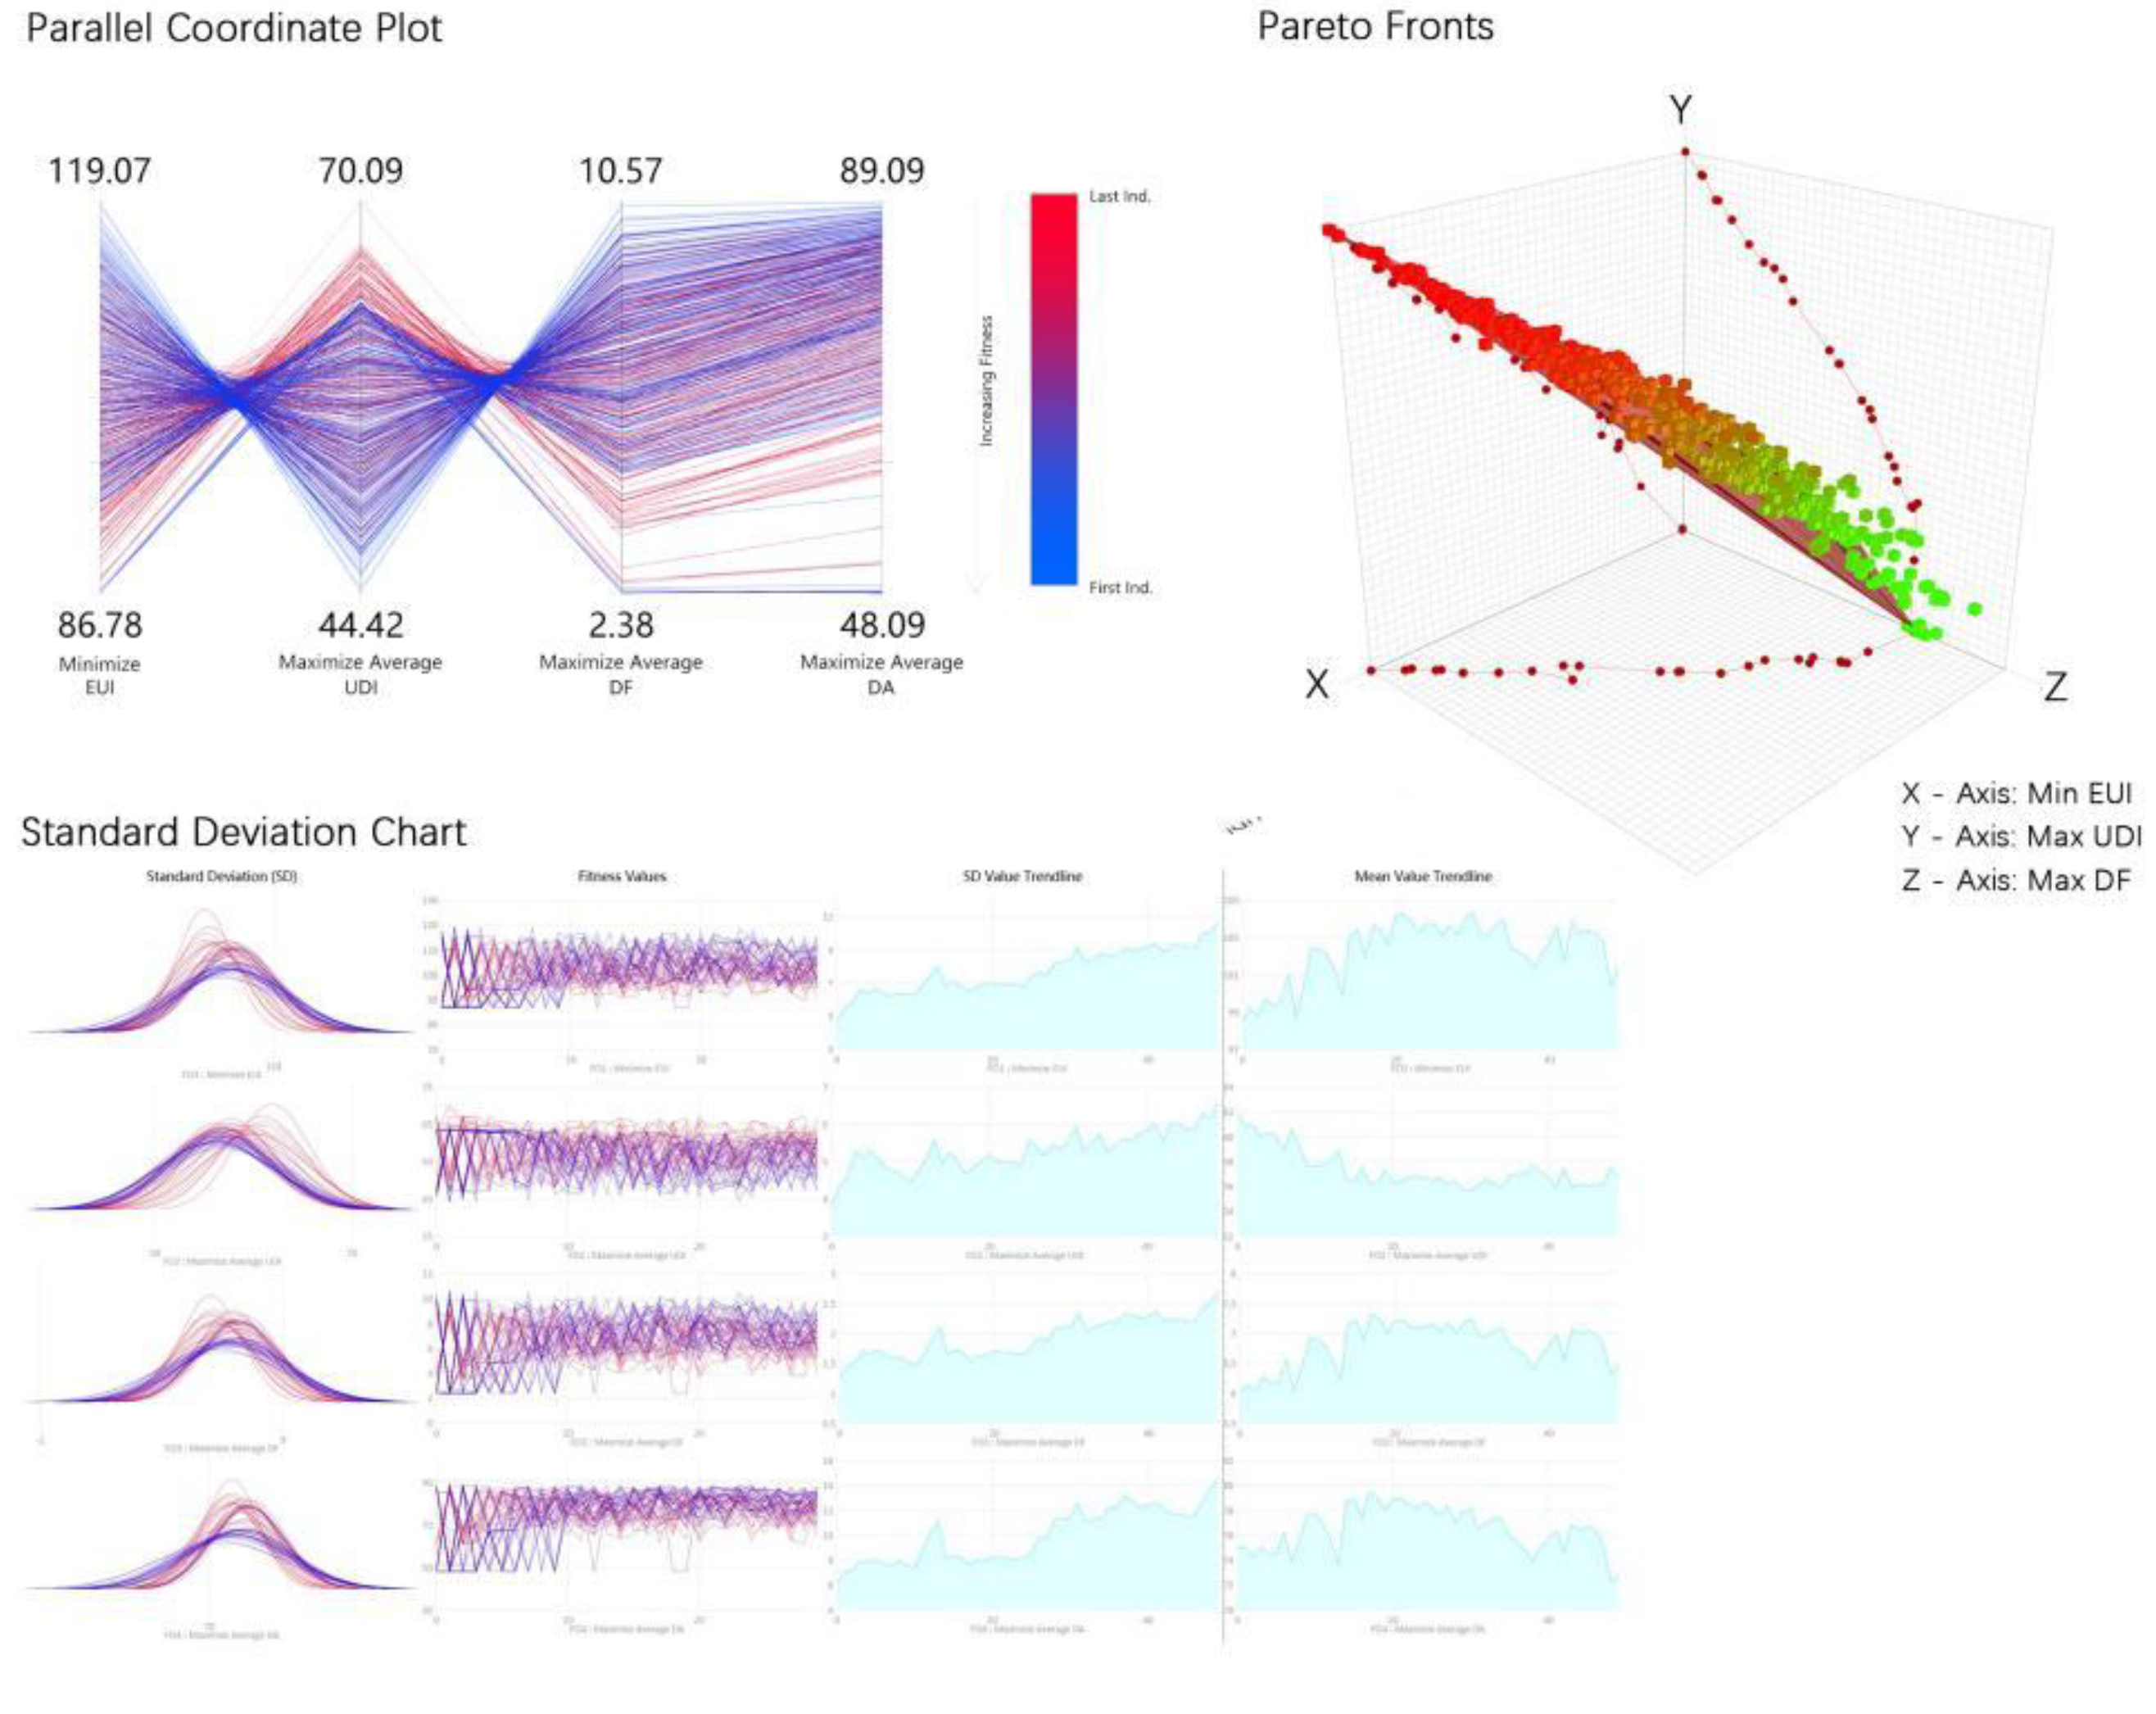
| Large Classroom | Min EUI | Max UDI | Max DF | Max DA | Pareto Set 1 | Pareto Set 2 | Pareto Set 3 |
|---|---|---|---|---|---|---|---|
| EUI (kWh/m2) | 86.78 | 91.63 | 119.07 | 119.07 | 94.13 | 96.42 | 100.01 |
| UDI (%) | 63.41 | 70.09 | 44.42 | 44.42 | 63.18 | 62.45 | 61.18 |
| DF (%) | 2.43 | 4.13 | 10.57 | 10.57 | 5.02 | 5.43 | 6.01 |
| DA (%) | 48.13 | 67.24 | 89.09 | 89.09 | 67.63 | 71.06 | 76.85 |
| Population | Gen.48 Ind.2 | Gen.0 Ind.1 | Gen.49 Ind.1 | Gen.49 Ind.1 | Gen.46 Ind.5 | Gen.22 Ind.7 | Gen.39 Ind.22 |
| Diamond Fitness Chart |  |  |  |  |  |  |  |
| Large Classroom | Min EUI | Max UDI | Max DF | Max DA | Pareto Set 1 | Pareto Set 2 | Pareto Set 3 |
|---|---|---|---|---|---|---|---|
| Height (m) | 3.4 | 3.8 | 4.4 | 4.4 | 3.8 | 3.8 | 4.1 |
| Length (m) | 20 | 19.6 | 12.2 | 12.2 | 20 | 19.6 | 12.2 |
| Width (m) | 14.9 | 10.5 | 10.9 | 10.9 | 14.8 | 13.8 | 14.8 |
| Orientation (°) | −23° | 9° | −27° | −27° | −17° | −24° | −25° |
| Plan |  |  |  |  |  |  |  |
| WWR (%) | South:30 East:30 | South:30 East:40 | South:70 East:70 | South:70 East:70 | South:55 East:50 | South:60 East:50 | South:30 East:70 |
| Model |  |  |  |  |  |  |  |
| Classroom Type | Small Classroom | Medium Classroom | Large Classroom | |||
|---|---|---|---|---|---|---|
| Orientation | West | East | West | East | West and South | East and South |
| Height (m) | 3.2~3.4 | 3.2~3.4 | 3.7~ 4.0 | 3.6~4.0 | 3.4~3.6 | 3.6~4.2 |
| Length (m) | ≈7.5 | ≈7.5 | 9.5~12 | 10~12 | 15~20 | 16~20 |
| Width (m) | ≈7.5 | ≈7.5 | 8~11 | 9.5~11 | 11~15 | 12~15 |
| Orientation (°) | 20~30° | −20~−30° | −20~−30°, 10~20° | 15~25° | 10~25° | −15~−25° |
| WWR (%) | 50~65 | 50~70 | 55~70 | 50~70 | South: 50~70 | South: 40~60 |
| West: 40~65 | West: 40~70 | |||||
| Expected EUI (kWh/m2) | 100~105 | 95~100 | 90~100 | 88~95 | 93~100 | 90~95 |
| Expected UDI (%) | 65~70 | 60~75 | 65~75 | 65~70 | 55~65 | 60~65 |
| Expected DF (%) | 5.0~5.5 | 4.5~6.5 | 4.0~5.5 | 4.5~5.5 | 5.0~7.0 | 5.0~6.0 |
| Expected DA (%) | 60~65 | 65~70 | 70~80 | 65~80 | 65~80 | 65~80 |
Publisher’s Note: MDPI stays neutral with regard to jurisdictional claims in published maps and institutional affiliations. |
© 2022 by the authors. Licensee MDPI, Basel, Switzerland. This article is an open access article distributed under the terms and conditions of the Creative Commons Attribution (CC BY) license (https://creativecommons.org/licenses/by/4.0/).
Share and Cite
Mo, H.; Zhou, Y.; Song, Y. Parametric Design and Spatial Optimization of East–West-Oriented Teaching Spaces in Shanghai. Buildings 2022, 12, 1333. https://doi.org/10.3390/buildings12091333
Mo H, Zhou Y, Song Y. Parametric Design and Spatial Optimization of East–West-Oriented Teaching Spaces in Shanghai. Buildings. 2022; 12(9):1333. https://doi.org/10.3390/buildings12091333
Chicago/Turabian StyleMo, Hongzhi, Yuxin Zhou, and Yiming Song. 2022. "Parametric Design and Spatial Optimization of East–West-Oriented Teaching Spaces in Shanghai" Buildings 12, no. 9: 1333. https://doi.org/10.3390/buildings12091333