
Impact of a Warming Climate on Hospital Energy Use and Decarbonization: An Australian Building Simulation Study


Abstract
:1. Introduction
1.1. Need for Emission Reductions in the Built Environment
1.2. Health Facility Emissions
1.3. Healthcare Resilience to Climate Change
1.4. Rationale and Novelty of the Study
2. Materials and Methods
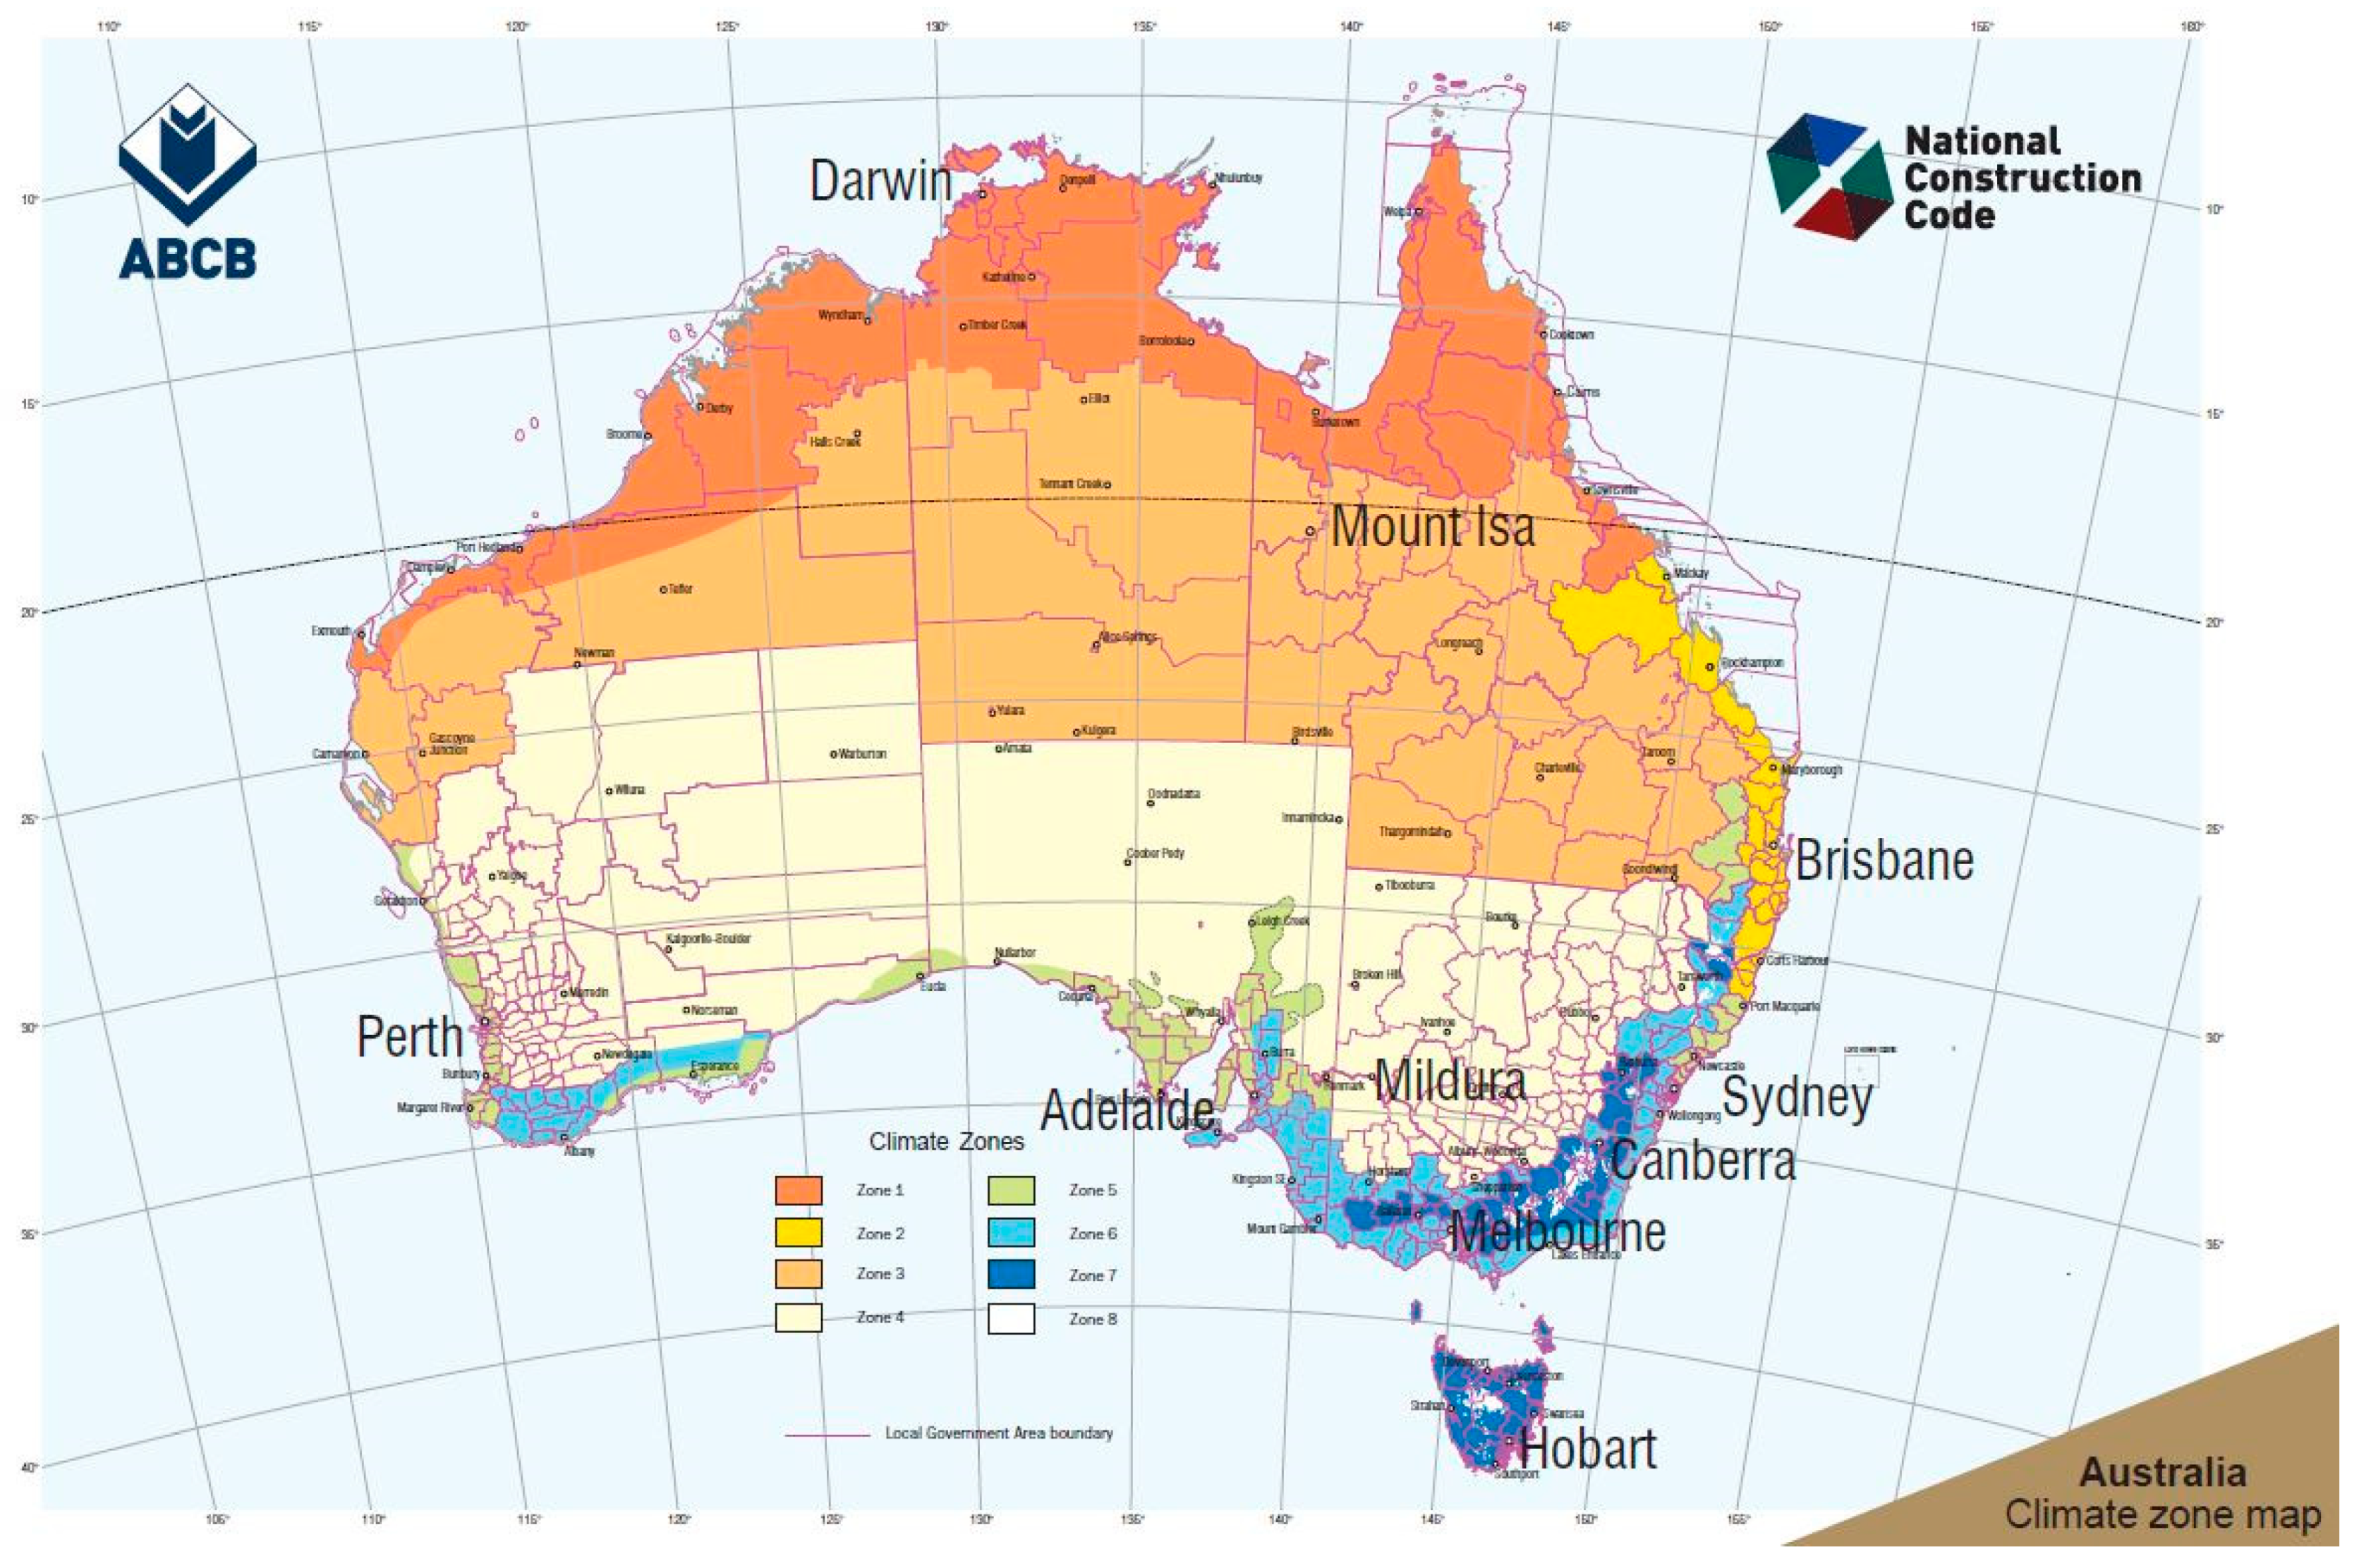
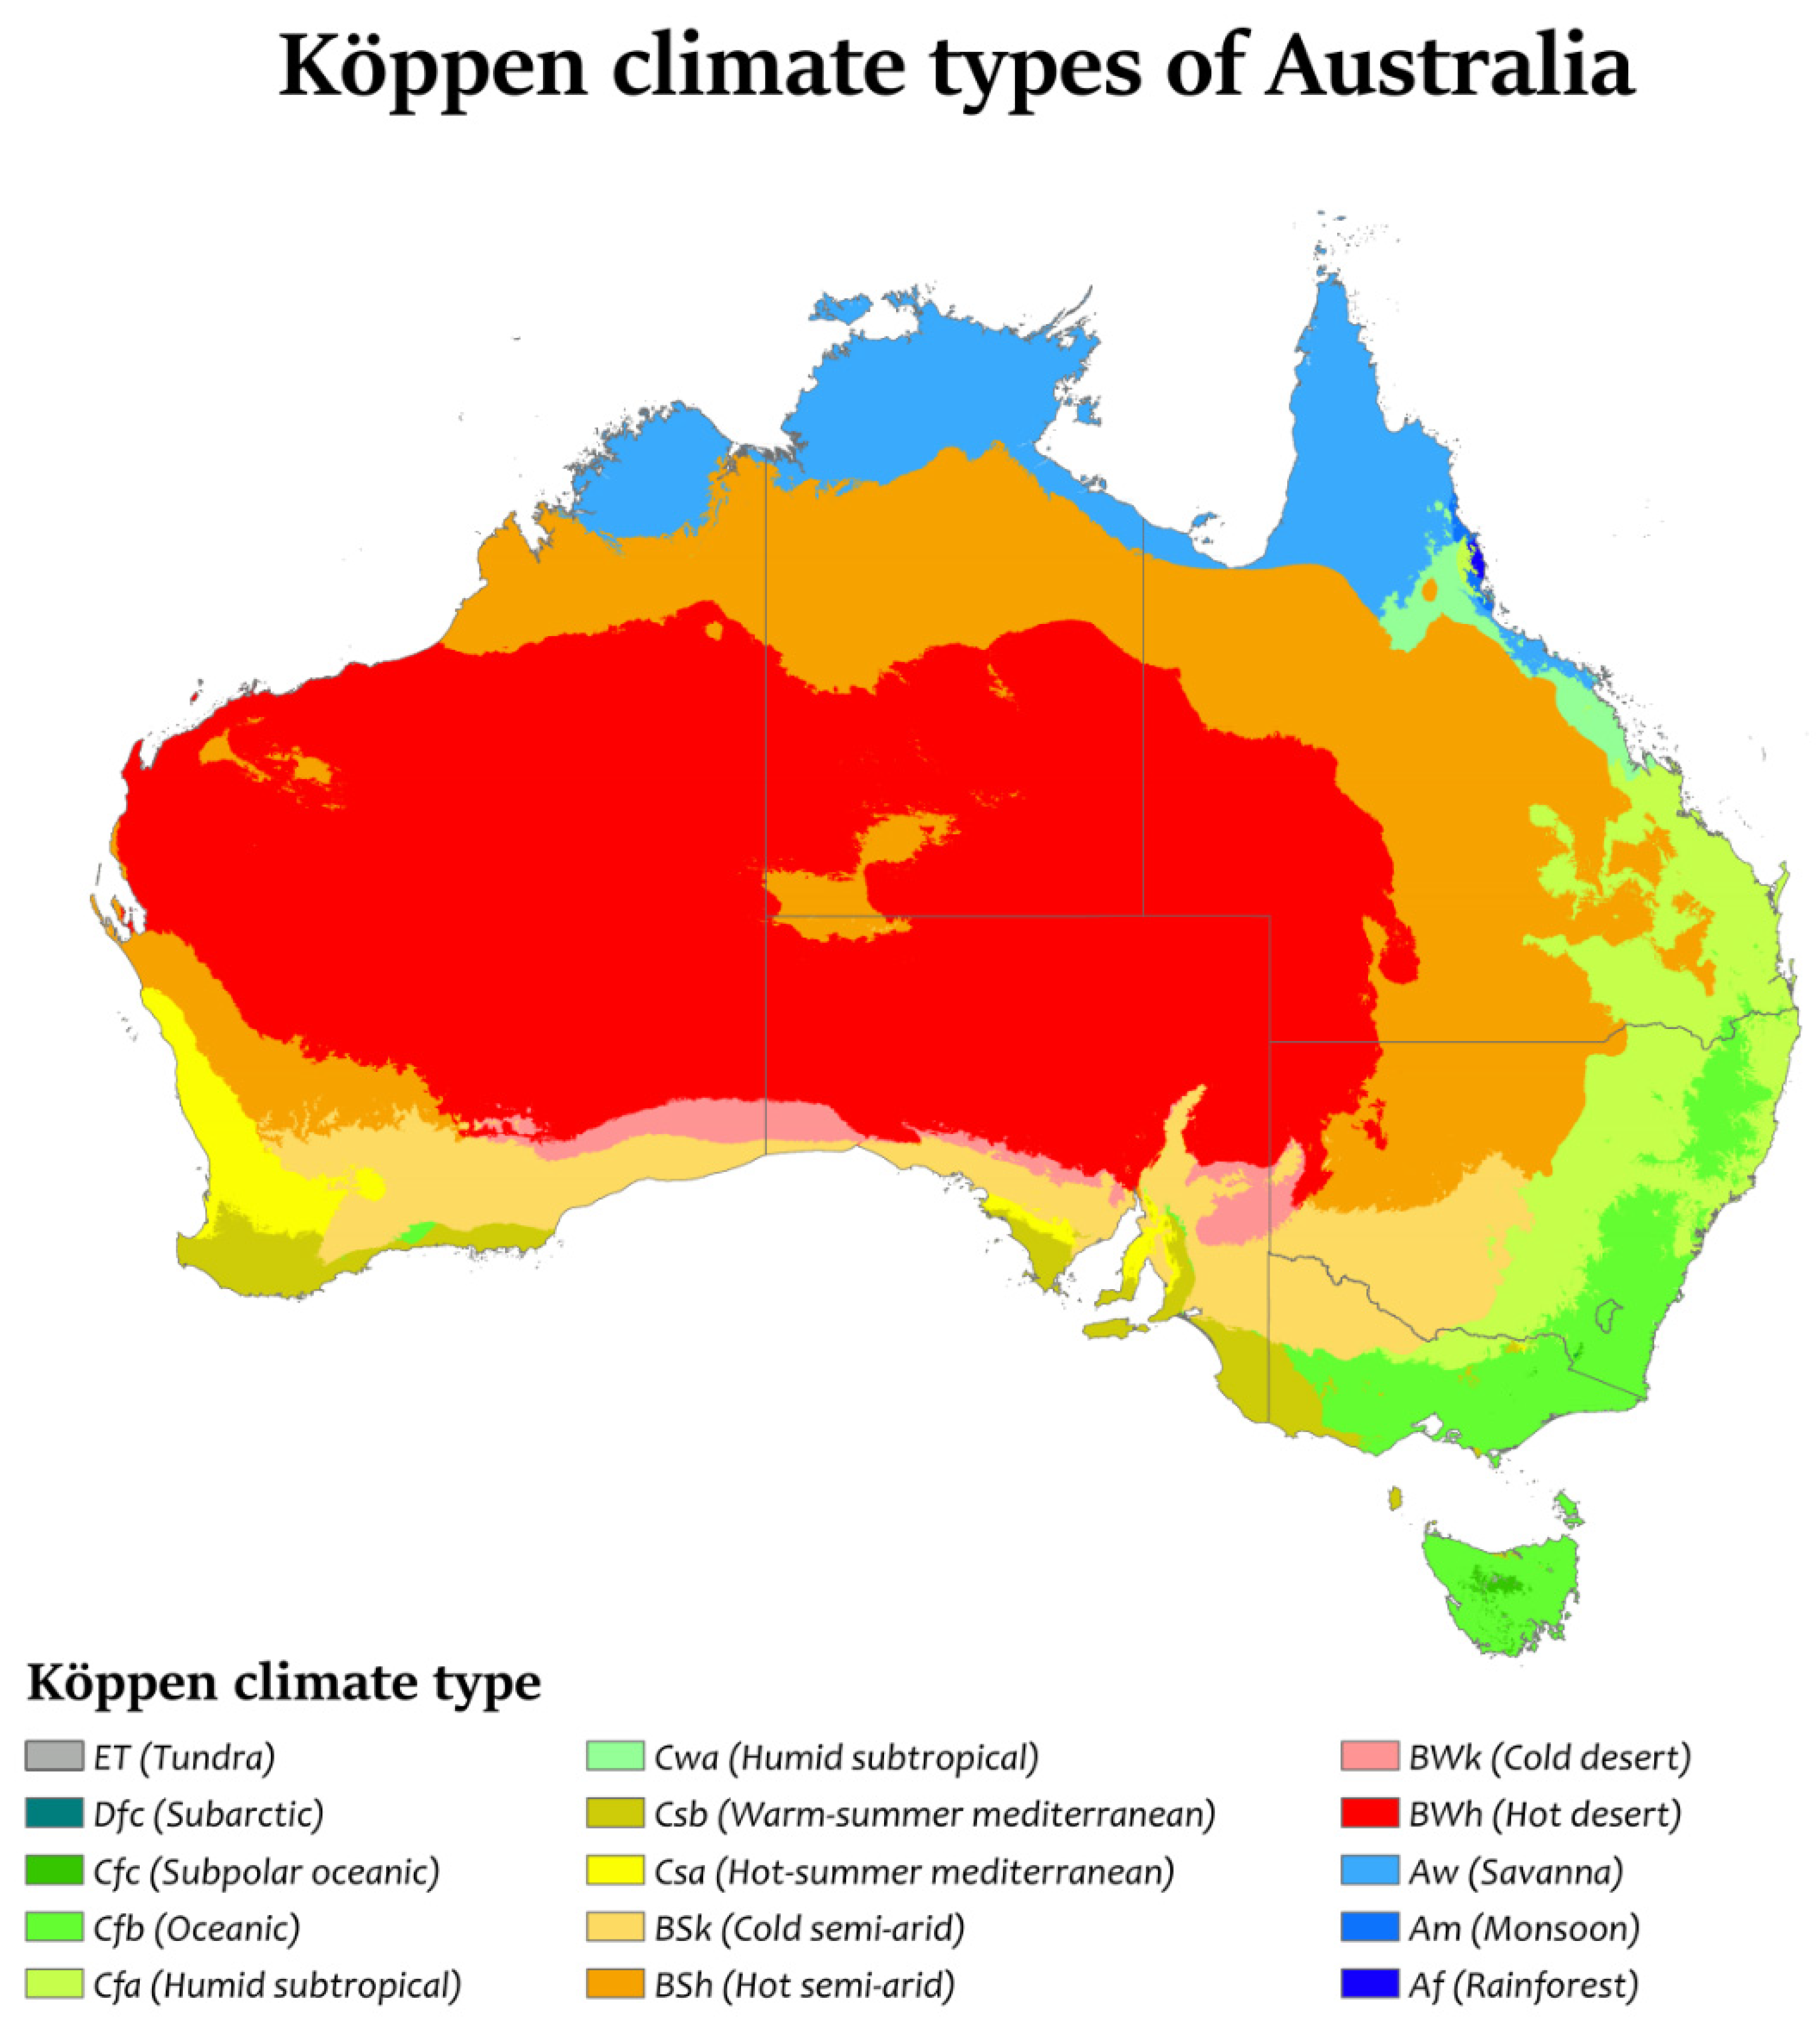
2.1. Geographic Locations and Climate Classifications
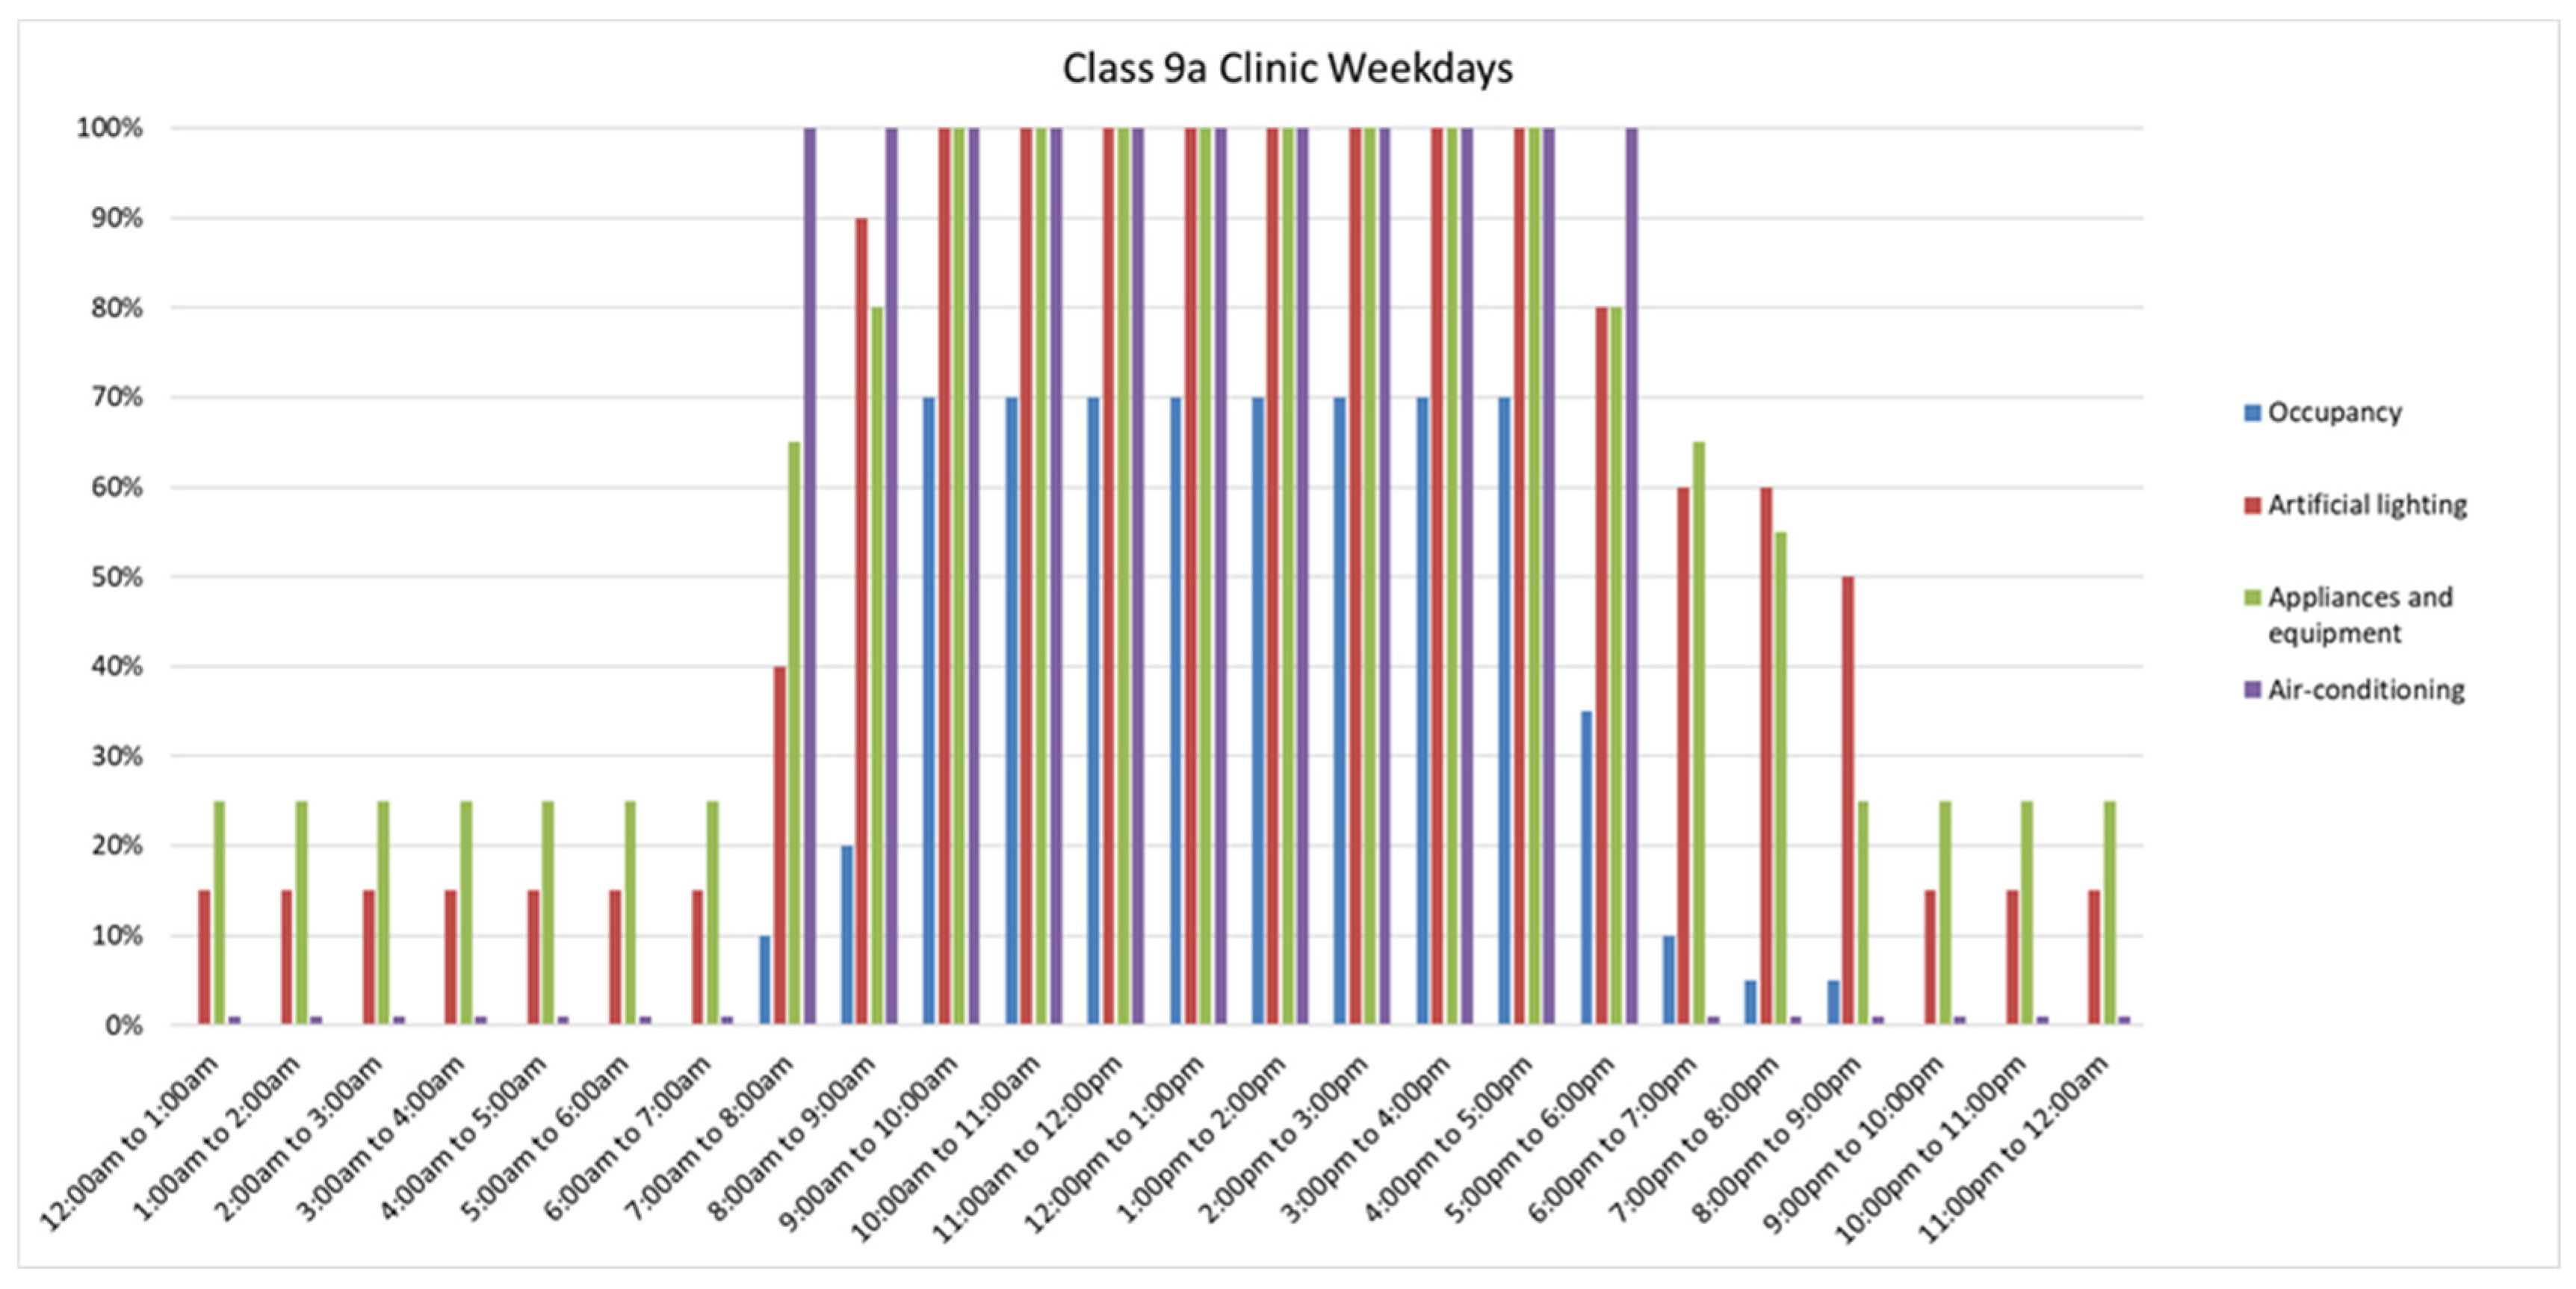
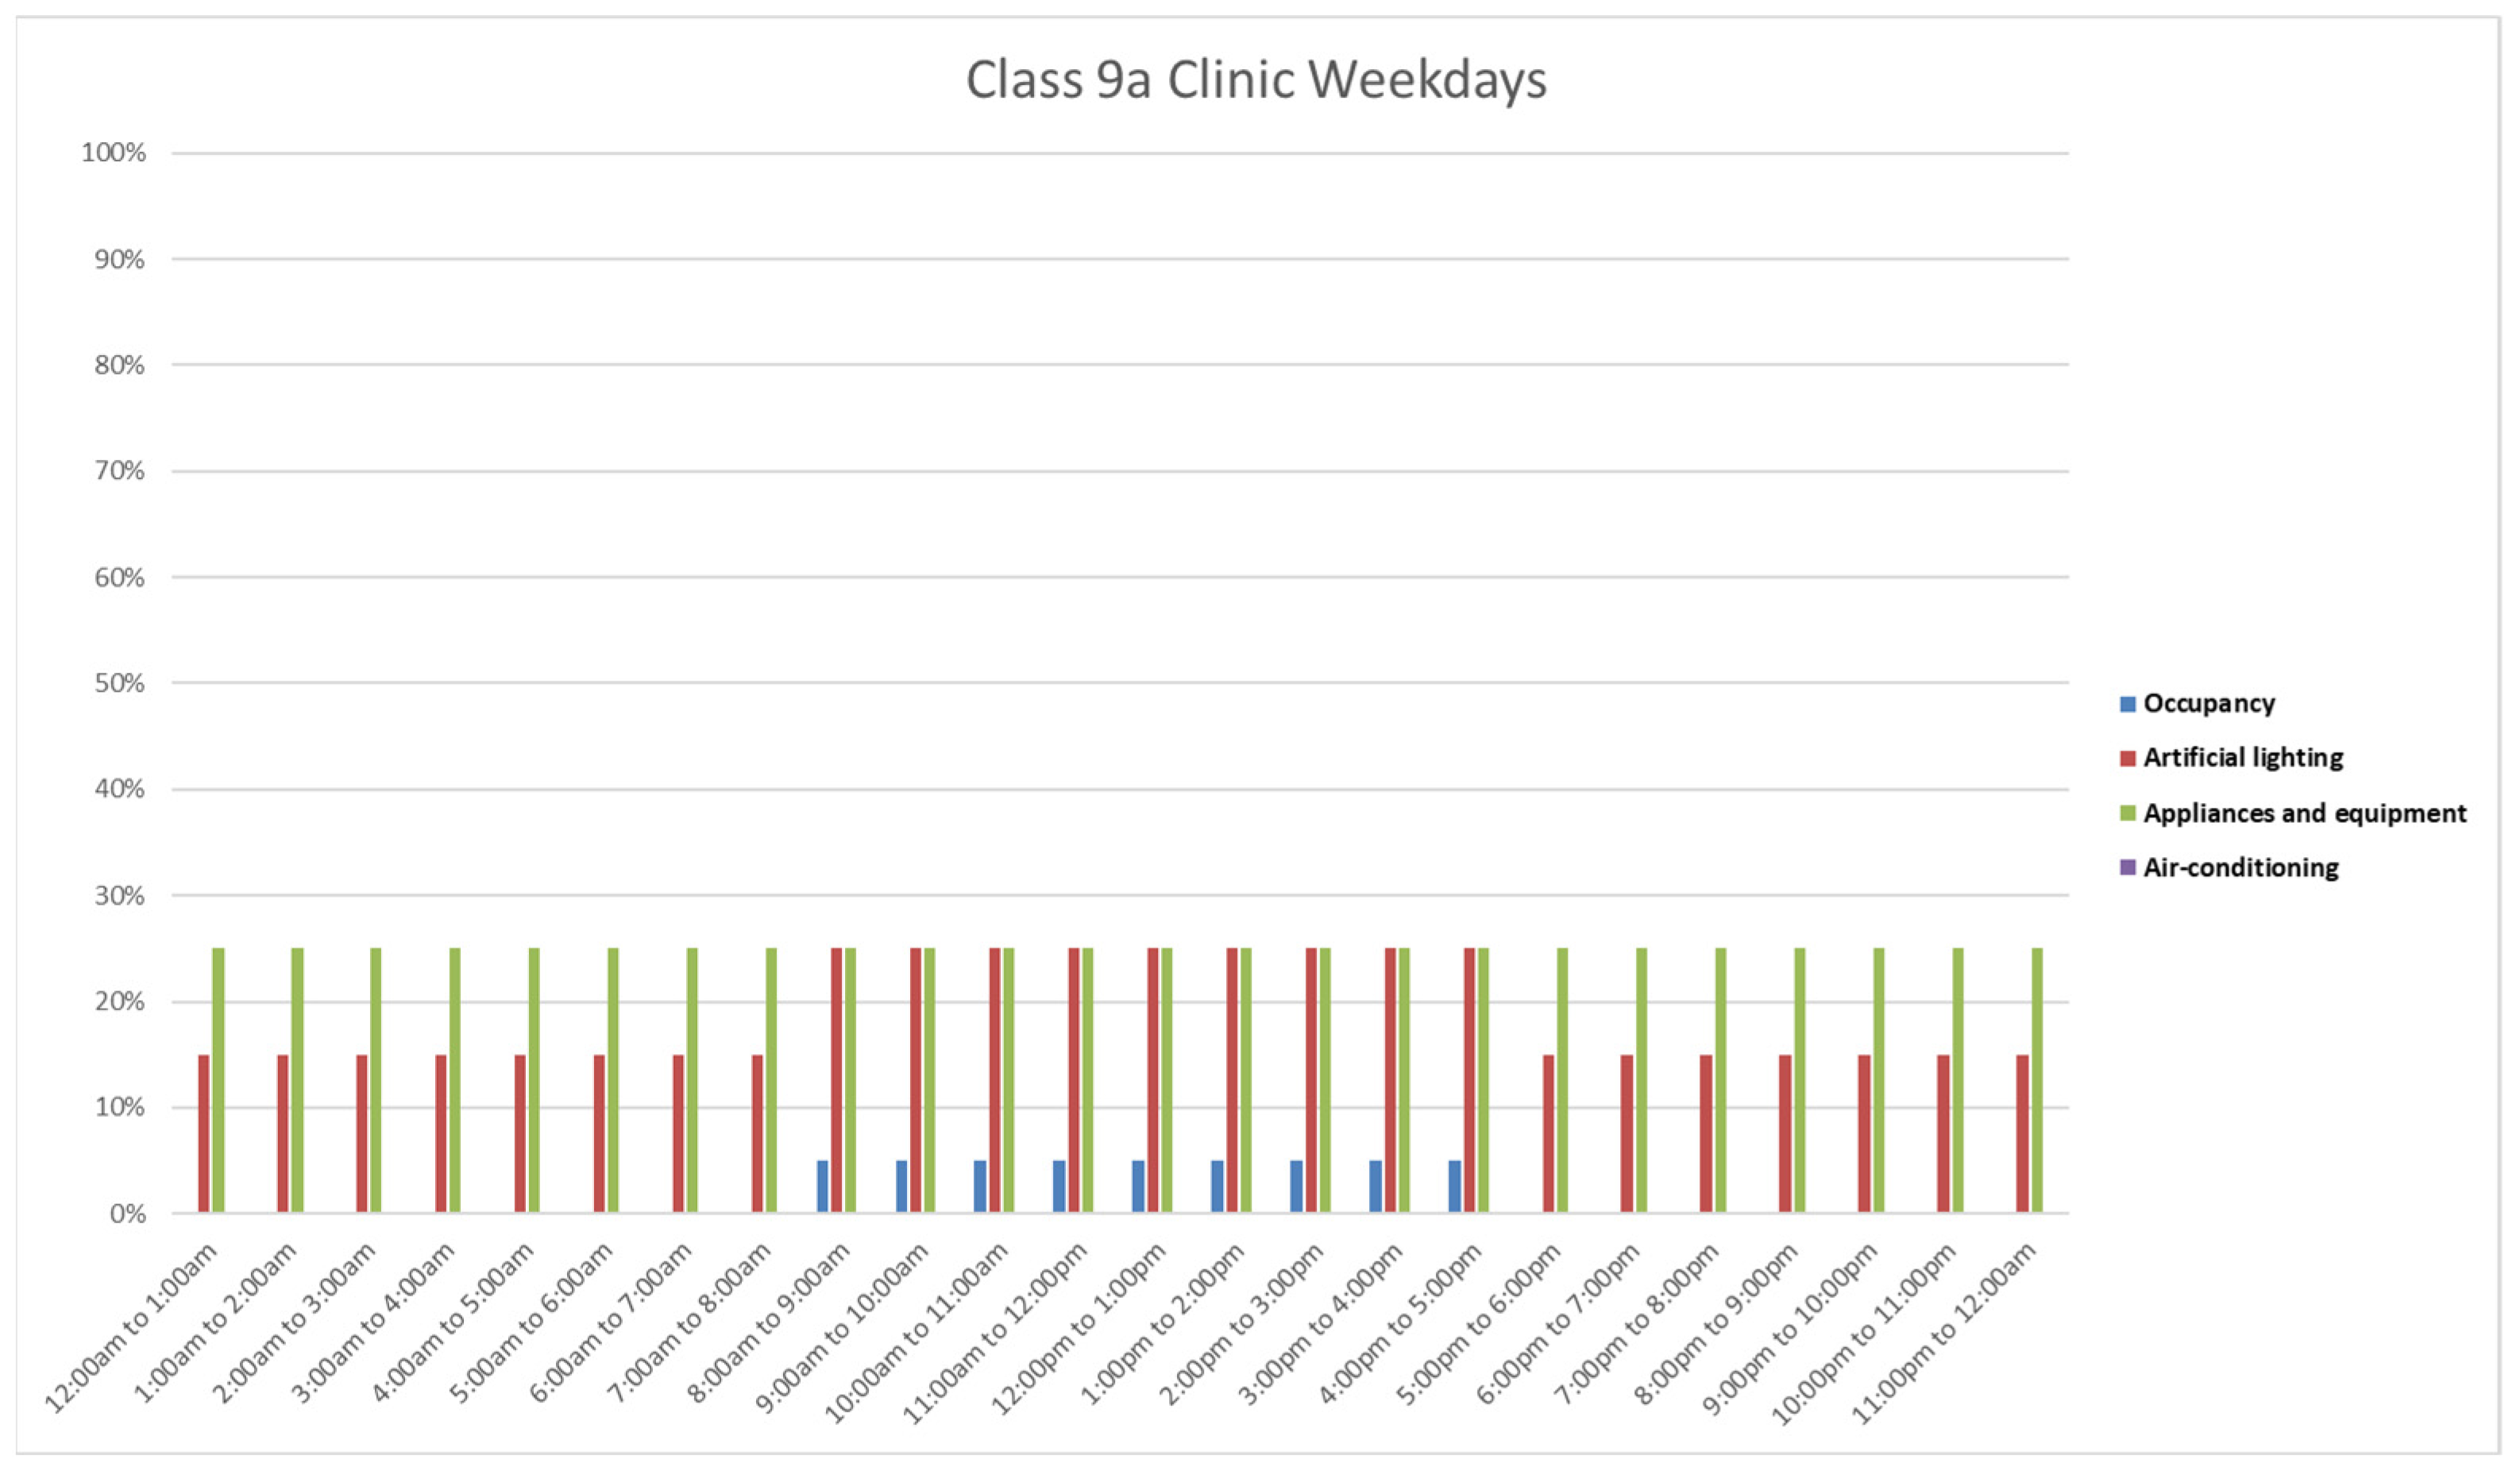
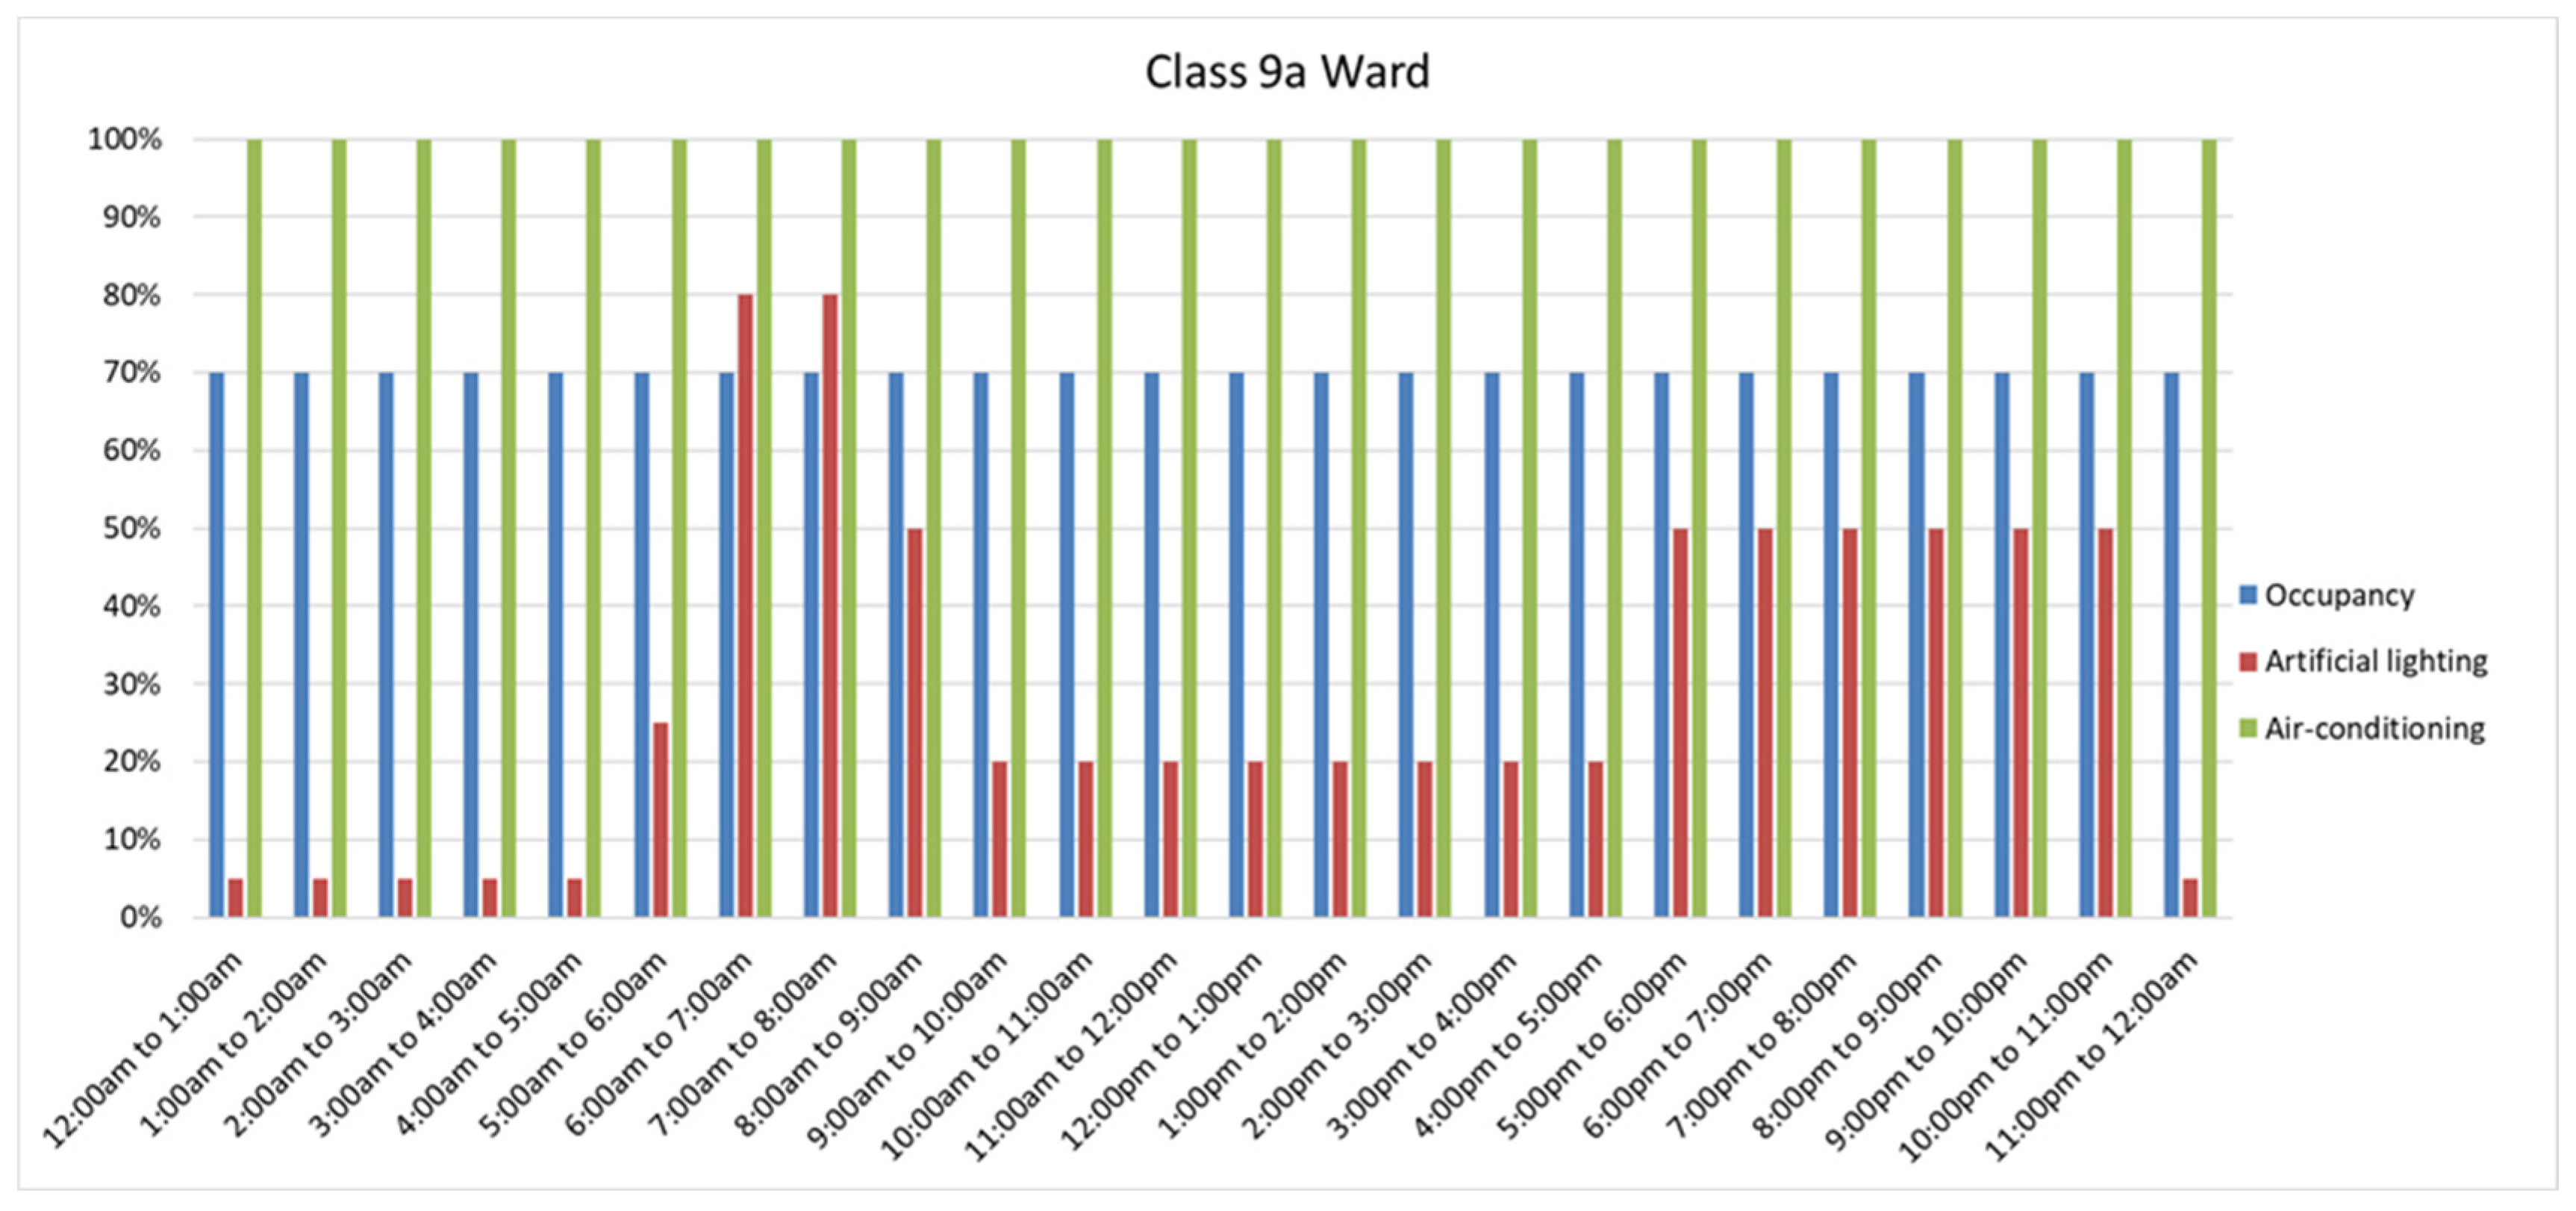
2.2. Archetype Building Models
2.3. Climate Weather Files
2.4. Simulation Software and Analysis
- space heating only (boiler) energy use;
- HVAC system energy use, including chillers, boilers, air handling units (AHUs), fans, pumps and fan coil units (FCUs);
- site total energy use, including HVAC system energy use, boilers, lighting and all plug-in loads.
3. Results and Discussion
3.1. Small Hospital
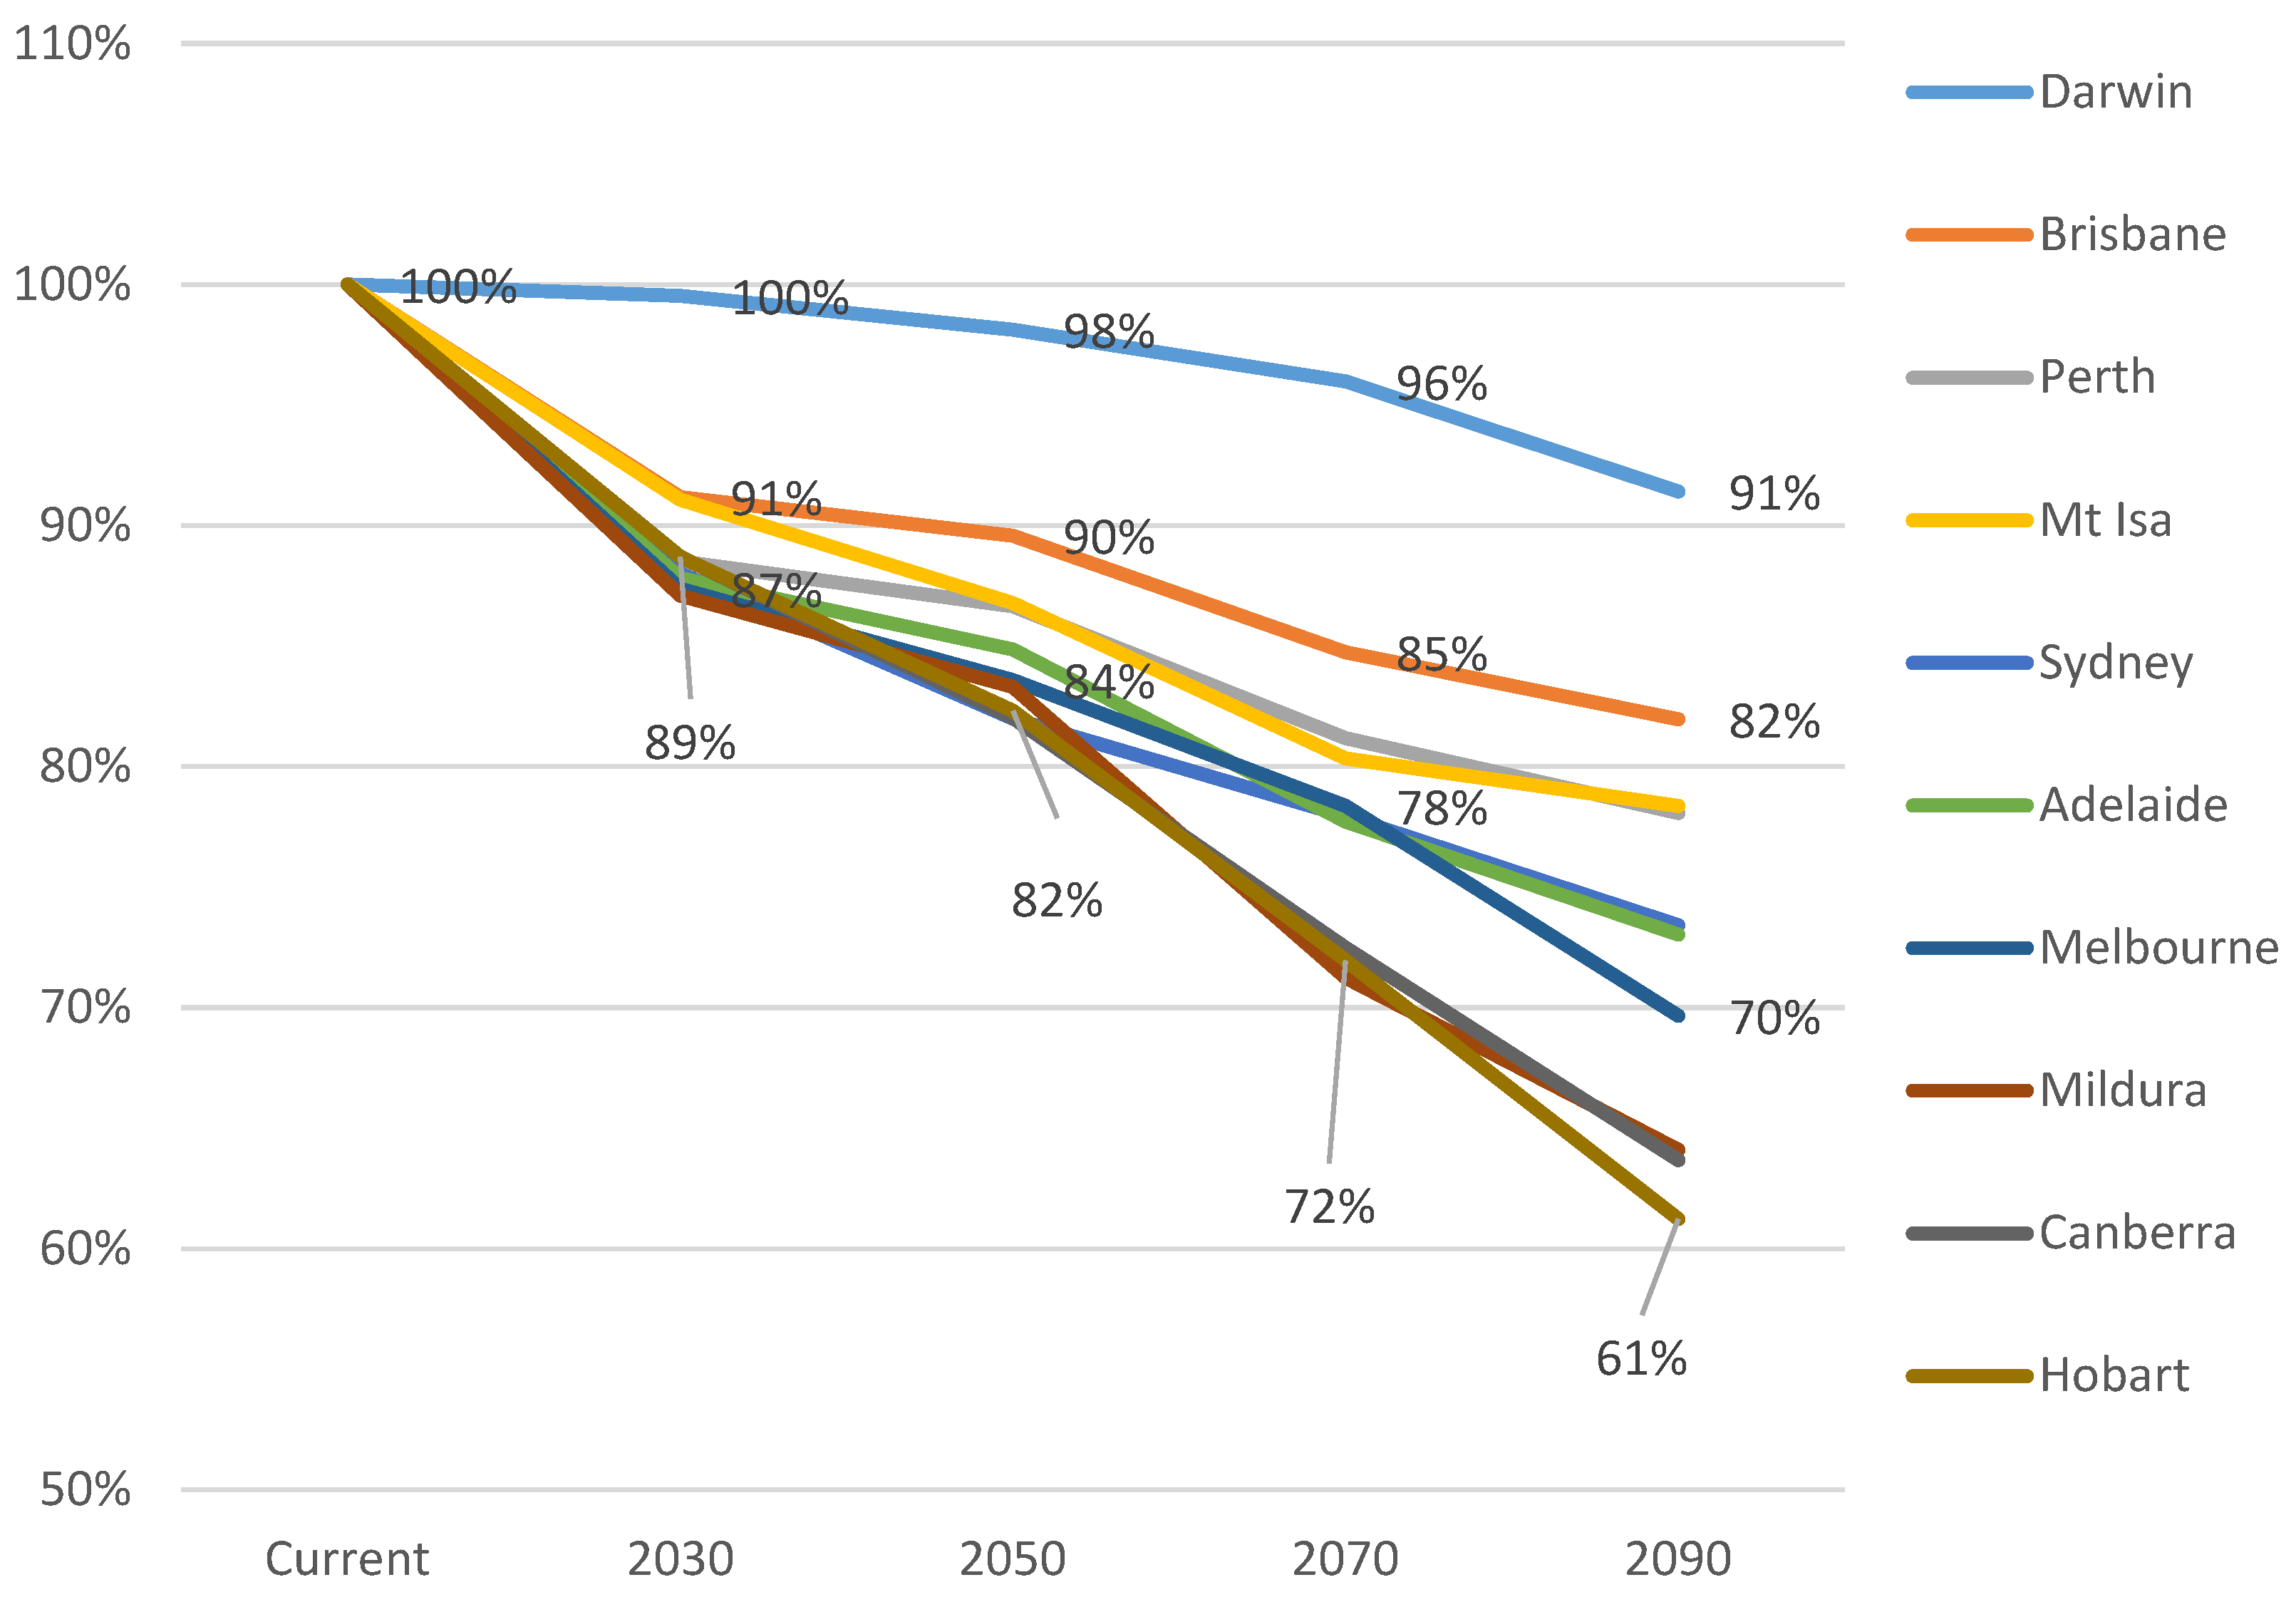
3.1.1. Heating Energy Use
3.1.2. HVAC Energy Use
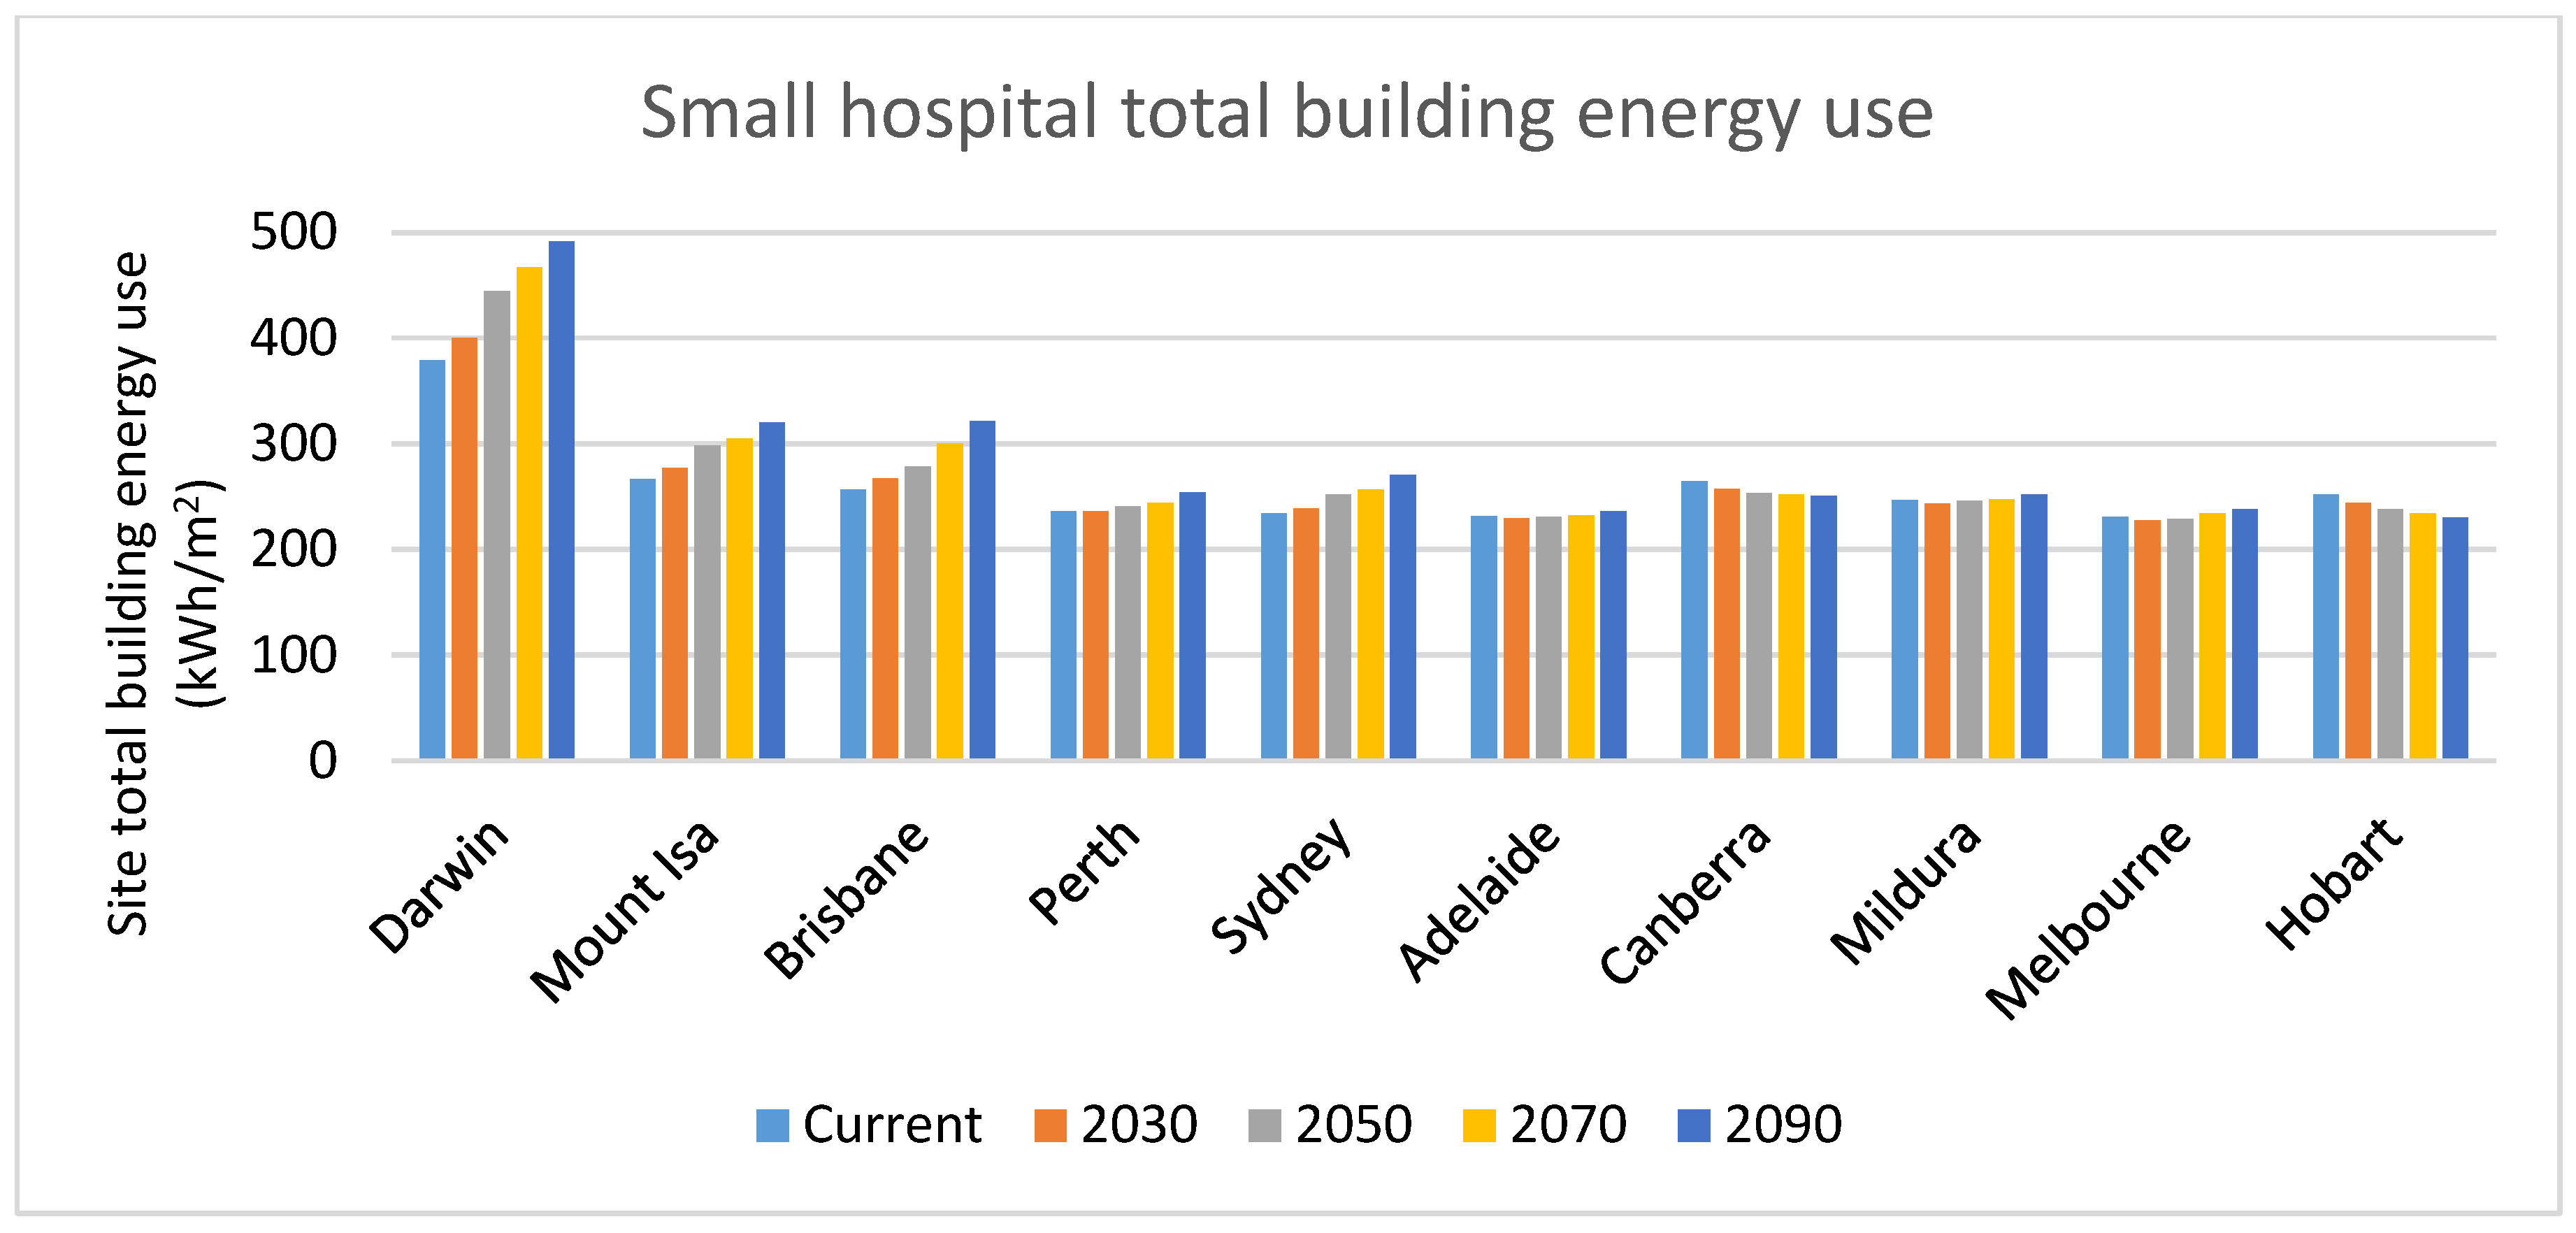
3.1.3. Site Total Energy Use
3.2. Large Hospital
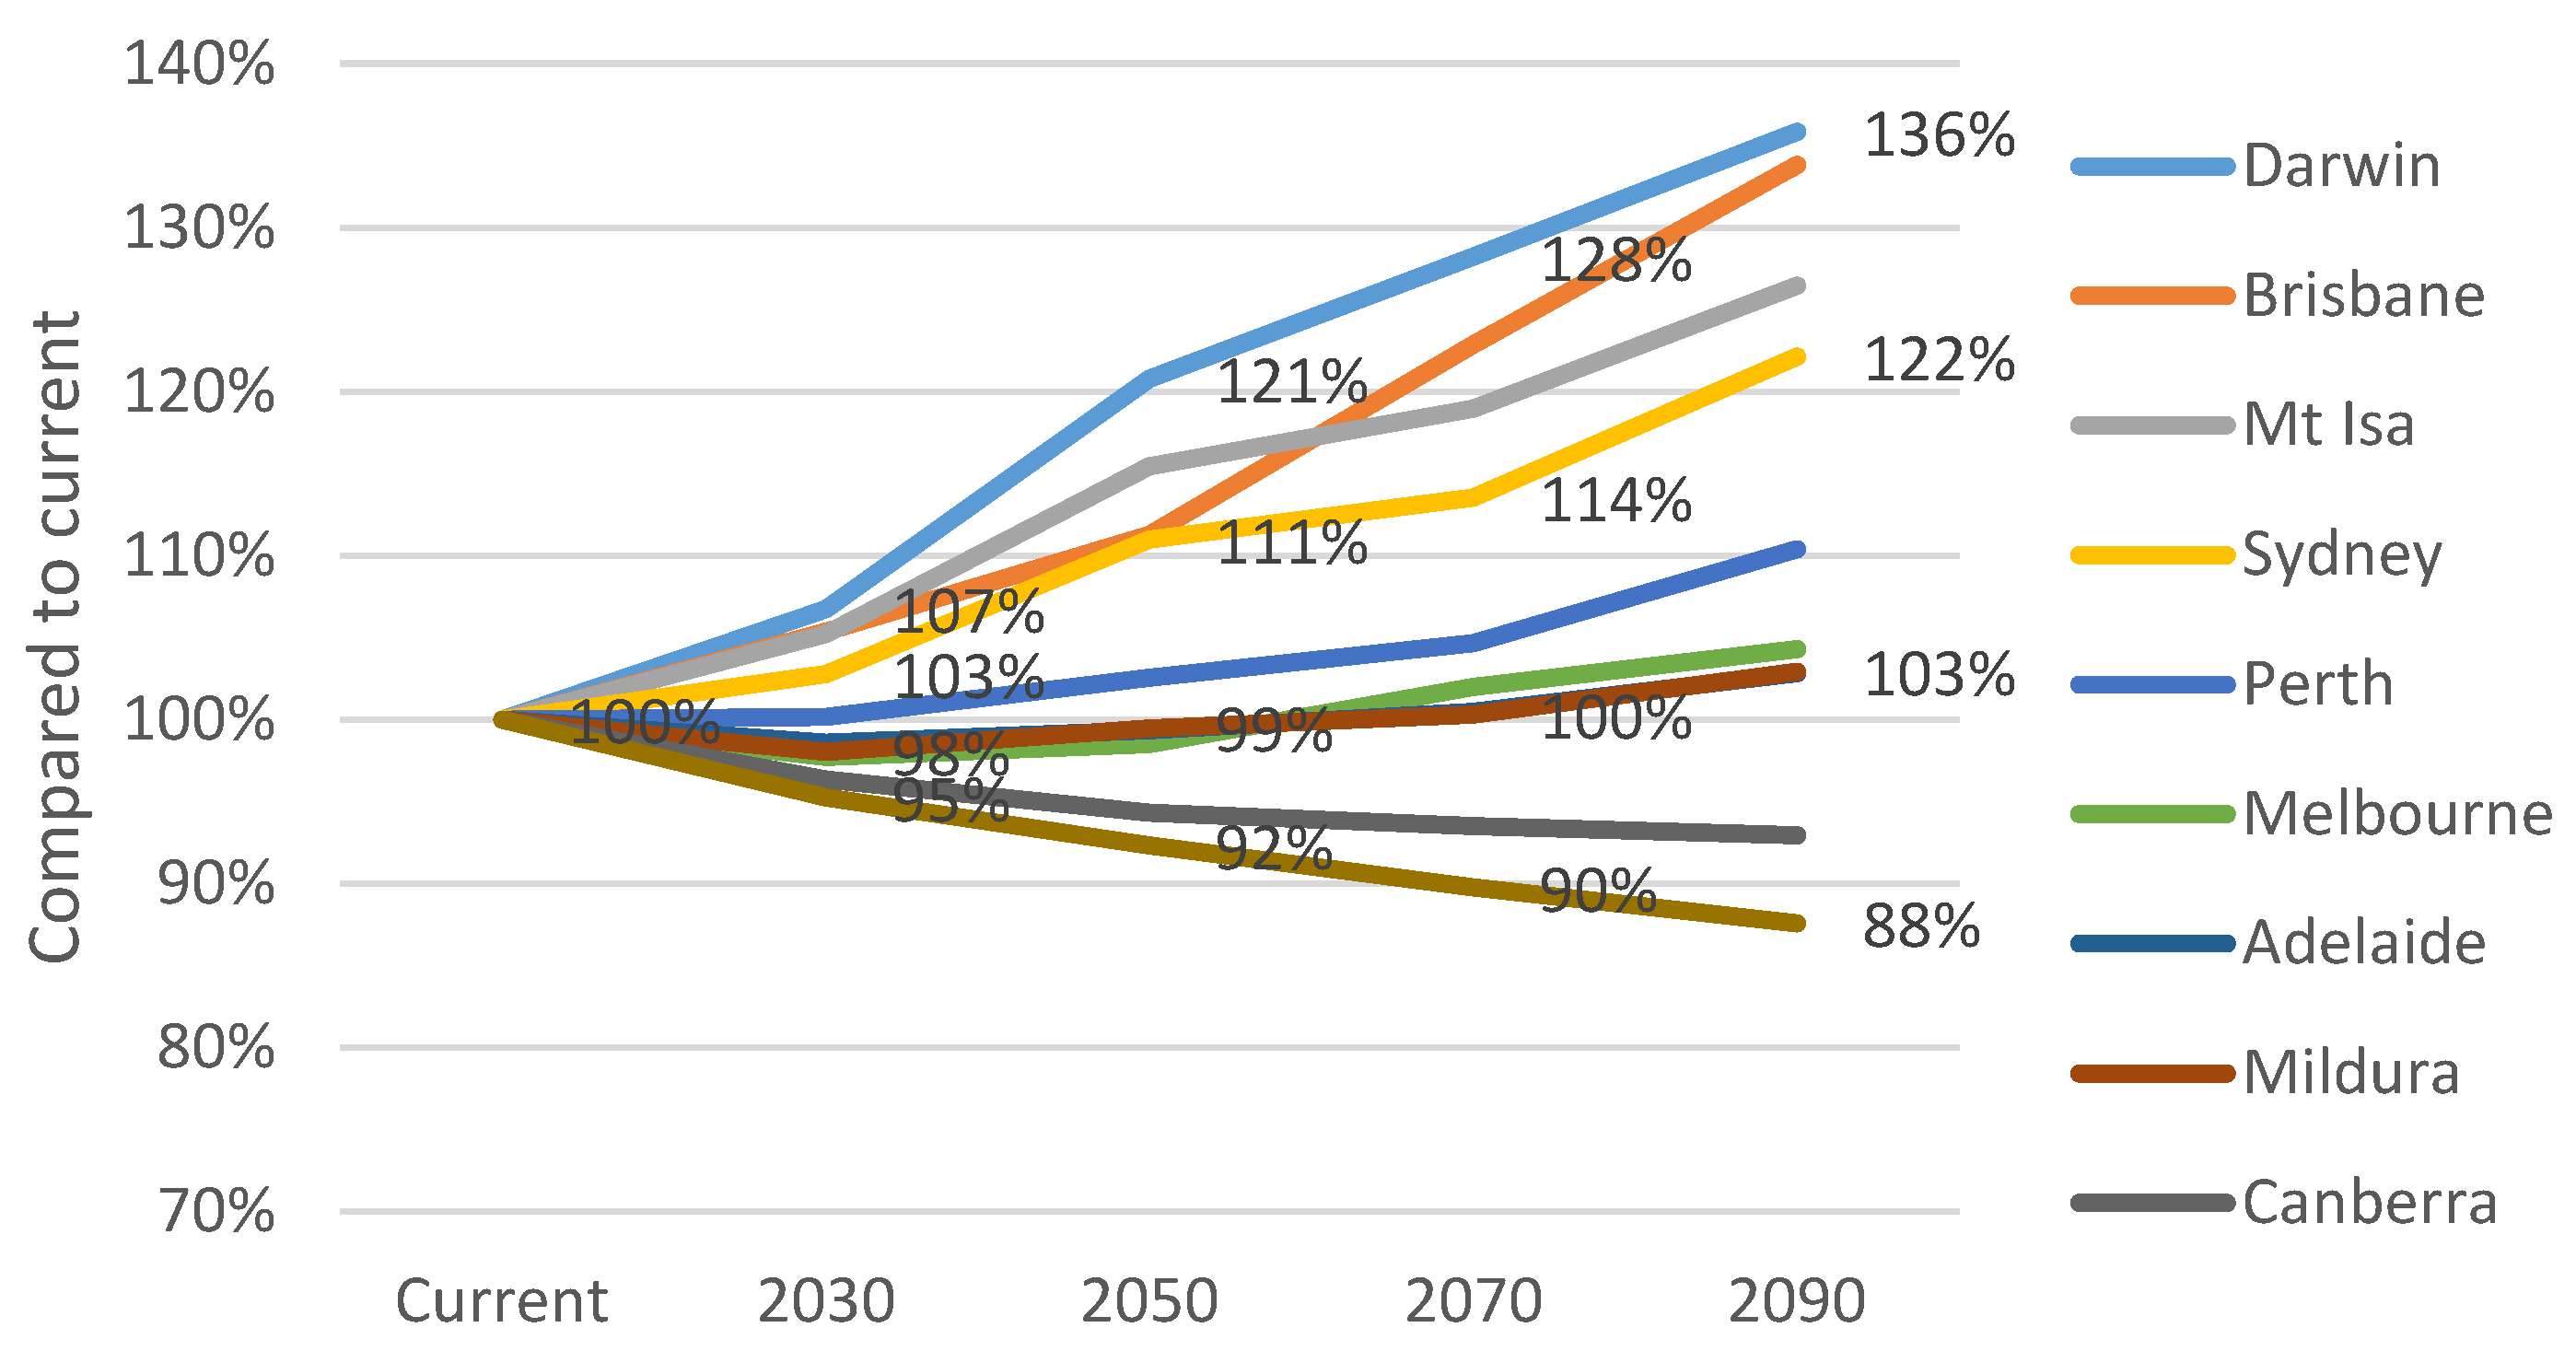
3.2.1. Heating Energy Use
3.2.2. HVAC Energy Use
3.2.3. Site Total Energy Use
4. Conclusions
- Analysis of the impact of future climate, and decarbonization, on hospital peak demand, and hence, the electrical infrastructure required;
- Development of climate files suitable for HVAC selection and sizing, as well as for renewable energy system sizing (for example, rooftop solar photovoltaics);
- Development of climate files for extreme conditions, such as heat waves; and
- The development of guidelines and a decision-making framework for healthcare asset managers to enable “whole of life” and “whole of system” approaches to the design, procurement, decarbonization and operation of healthcare facilities into the future.
Author Contributions
Funding
Institutional Review Board Statement
Data Availability Statement
Conflicts of Interest
Abbreviations
| ABCB | Australian Building Codes Board |
| ACH | Air change per hour |
| AHIA | Australasian Health Infrastructure Alliance |
| AHU | Air handling unit |
| ASHRAE | American Society of Heating, Refrigerating and Air-Conditioning Engineers |
| CAV | Constant air volume |
| CSSD | Critical service and storage department |
| CSIRO | The Commonwealth Scientific and Industrial Research Organisation |
| EUI | Energy use intensity |
| FCU | Fan coil unit |
| GHG | Greenhouse gas |
| HVAC | Heating, ventilation and air conditioning |
| IEA | International Energy Agency |
| IPCC | Intergovernmental Panel on Climate Change |
| IPU | Inpatient unit |
| IRENA | The International Renewable Energy Agency |
| NCC | National Construction Code (Australia) |
| NHS | National Health Service (UK) |
| NOAA | National Oceanic and Atmospheric Administration |
| NZCE | Net-zero carbon emissions |
| RCP | Representative Concentration Pathways |
| TMY | Typical Meteorological Year |
| VAV | Variable air volume |
References
- Lindsay, R.; Dahlman, L. Climate Change: Global Temperature. National Oceanic and Atmospheric Administration (NOAA). Available online: https://www.climate.gov/news-features/understanding-climate/climate-change-global-temperature (accessed on 28 June 2022).
- Foo, G. Climate Change—Impact on Building Design and Energy; COAG Energy Council: Canberra, Australia, 2020. [Google Scholar]
- Bragge, P.; Alyse, L.; Pattuwage, L.; Capon, T.; Armstrong, F.; Burgess, M.; Watts, C.; Cooke, S.; Bowen, K.; Liew, D. Climate Change and Australia’s Health Systems: A Review of Literature, Policy and Practice; Monash Sustainable Development Evidence Review Service: Melborune, VIC, Australia, 2021. [Google Scholar]
- IPCC. Global warming of 1.5 °C. An IPCC Special Report on the Impacts of Global Warming of 1.5 °C above Pre-Industrial Levels and Related Global Greenhouse Gas Emission Pathways, in the Context of Strengthening the Global Response to the Threat of Climate Change. 2018. Available online: https://www.ipcc.ch/sr15/ (accessed on 20 February 2019).
- IRENA. World Energy Transitions Outlook—1.5 °C Pathway. Available online: www.irena.org/publications (accessed on 12 June 2022).
- Riffat, S.; Mardiana, A. Building Energy Consumption and Carbon Dioxide Emissions: Threat to Climate Change. J. Earth Sci. Clim. Chang. S3 2015. [Google Scholar] [CrossRef]
- Ali, A.; Khozema; Ahmad, M.I.; Yusup, Y. Issues, Impacts, and Mitigations of Carbon Dioxide Emissions in the Building Sector. Sustainability 2020, 12, 18. [Google Scholar]
- Stagrum, A.E.; Andenæs, E.; Kvande, T.; Lohne, J. Climate Change Adaptation Measures for Buildings—A Scoping Review. Sustainability 2020, 12, 1721. [Google Scholar] [CrossRef]
- Karliner, J.; Slotterback, S.; Boyd, R.; Ashby, B.; Steele, K.; Wang, J. Health care’s climate footprint: The health sector contribution and opportunities for action. Eur. J. Public Heal. 2020, 30. [Google Scholar] [CrossRef]
- Morgenstern, P.; Li, M.; Raslan, R.; Ruyssevelt, P.; Wright, A. Benchmarking Acute Hospitals: Composite Electricity Targets Based on Departmental Consumption Intensities? Energy Build. 2016, 118, 277–290. [Google Scholar] [CrossRef]
- Aspinall, P. Benchmarking and Best Practice—Energy Management for Healthcare in the UK, Hospital Engineering & Facilities Management. 2004. [Google Scholar]
- EPA. Data Trends—Energy Use in Hospitals. Environmental Protection Agency—the U.S. Available online: www.energystar.gov (accessed on 8 August 2022).
- Ji, R.; Qu, S. Investigation and Evaluation of Energy Consumption Performance for Hospital Buildings in China. Sustainability 2019, 11, 1724. [Google Scholar] [CrossRef]
- Satish, K. Energy Efficiency in Hospitals, Best Practice Guide; Bureau of Energy Efficiency: New Delhi, India, 2009. [Google Scholar]
- Kolokotsa, D.; Tsoutsos, T.; Papantoniou, S. Energy conservation techniques for hospital buildings. Adv. Build. Energy Res. 2012, 6, 159–172. [Google Scholar] [CrossRef]
- pitt&sherry. Baseline Energy Consumption and Greenhouse Gas Emissions in Commercial Buildings in Australia Part-1 Report; Council of Australian Governments (COAG): Canberra, Australia, 2012. [Google Scholar]
- Ma, Y.; Saha, S.C.; Miller, W.; Guan, L. Comparison of Different Solar-Assisted Air Conditioning Systems for Australian Office Buildings. Energies 2017, 10, 1463. [Google Scholar] [CrossRef]
- Liu, A.; Miller, W.; Chiou, J.; Zedan, S.; Yigitcanlar, T.; Ding, Y. Aged Care Energy Use and Peak Demand Change in the COVID-19 Year: Empirical Evidence from Australia. Buildings 2021, 11, 570. [Google Scholar] [CrossRef]
- Burch, H.; Anstey, M.H.; McGain, F. Renewable energy use in Australian public hospitals. Med. J. Aust. 2021, 215, 160. [Google Scholar] [CrossRef]
- Malik, A.; Lenzen, M.; McAlister, S.; McGain, F. The carbon footprint of Australian health care. Lancet Planet. Health 2018, 2, e27–e35. [Google Scholar] [CrossRef]
- Dzau, V.J.; Living, R.; Barret, G.; Witty, A. Decarbonizing the U.S. Health Sector—A Call to Action. N. Engl. J. Med. 2021, 385, 2117–2119. [Google Scholar] [CrossRef]
- NHS. Delivering a ‘Net Zero’ National Health Service; NHS England and NHS Improvement: London, UK, 2020. [Google Scholar]
- Tomson, C. Reducing the Carbon Footprint of Hospital-Based Care. Future Healthc. J. 2015, 2, 57–62. [Google Scholar] [CrossRef]
- Quitmann, C.; Sauerborn, R.; Danquah, I.; Herrmann, A. Climate Change Mitigation Is a Hot Topic, but Not When It Comes to Hospitals’: A Qualitative Study on Hospital Stake-Holders’ Perception and Sense of Responsibility for Greenhouse Gas Emissions. J. Med. Ethics 2022. [Google Scholar] [CrossRef] [PubMed]
- MacNaughton, P.; Cao, X.; Buonocore, J.; Cedeno-Laurent, J.; Spengler, J.; Bernstein, A.; Allen, J.G. Energy savings, emission reductions, and health co-benefits of the green building movement. J. Expo. Sci. Environ. Epidemiol. 2018, 28, 307–318. [Google Scholar] [CrossRef]
- Brown, L.H.; Buettner, P.G.; Canyon, D.V. The Energy Burden and Environmental Impact of Health Services. Am. J. Public Health 2012, 102, e76–e82. [Google Scholar] [CrossRef] [PubMed]
- Gupta, R.; Gregg, M. Care Provision Fit for a Warming Climate. Archit. Sci. Rev. 2017, 60, 275–285. [Google Scholar] [CrossRef]
- Hiete, M.; Merz, M.; Schultmann, F. Scenario-based impact analysis of a power outage on healthcare facilities in Germany. Int. J. Disaster Resil. Built Environ. 2011, 2, 222–244. [Google Scholar] [CrossRef]
- Khahro, S.; Kumar, D.; Siddiqui, F.; Ali, T.; Raza, M.; Khoso, A. Optimizing Energy Use, Cost and Carbon Emission through Building Information Modelling and a Sustainability Approach: A Case-Study of a Hospital Building. Sustainability 2021, 13, 3675. [Google Scholar] [CrossRef]
- Zhang, C.; Kazanci, O.B.; Levinson, R.; Heiselberg, P.; Olesen, B.W.; Chiesa, G.; Sodagar, B.; Ai, Z.; Selkowitz, S.; Zinzi, M.; et al. Resilient cooling strategies—A critical review and qualitative assessment. Energy Build. 2021, 251, 111312. [Google Scholar] [CrossRef]
- Tonmoy, F.; Palutikof, J.; Boulter, S.; Schneider, P.; Cooke, S. Climate Change Adaptation Planning Guidance Guidelines; Queensland Health: Brisbane, Australia, 2019. [Google Scholar]
- AIRAH. Resilience Checklist; Liza Taylor, L., Ed.; The Australian Institute of Refrigeration, Air Conditioning and Heating (AIRAH): Melbourne, Australia, 2021. [Google Scholar]
- Palutikof, J.; Boulter, S.; Schneider, P.; Tonmoy, F. Climate Change Adaptation Planning Guidance Almanac; Queensland Health: Brisbane, Australia, 2019. [Google Scholar]
- Herrera, M.; Natarajan, S.; Coley, D.A.; Kershaw, T.; Ramallo-González, A.P.; Eames, M.; Fosas, D.; Wood, M. A review of current and future weather data for building simulation. Build. Serv. Eng. Res. Technol. 2017, 38, 602–627. [Google Scholar] [CrossRef]
- Liu, A.; Ma, Y.; Miller, W.; Xia, B.; Zedan, S.; Bonney, B. Energy Analysis and Forecast of a Major Modern Hospital. Buildings 2022, 12, 1116. [Google Scholar] [CrossRef]
- Australian Building Codes Board. Ncc 2019 Building Code of Australia—Volume One; Australian Building Codes Board: Canberra, ACT, Australia, 2019. [Google Scholar]
- Chen, D.; Chen, H.W. Using the Köppen classification to quantify climate variation and change: An example for 1901–2010. Environ. Dev. 2013, 6, 69–79. [Google Scholar] [CrossRef]
- Peel, M.C.; Finlayson, B.L.; McMahon, T.A. Updated World Map of the Köppen-Geiger Climate Classification. Hydrol. Earth Syst. Sci. 2007, 11, 1633–1644. [Google Scholar] [CrossRef]
- Beck, H.E.; Zimmermann, N.E.; McVicar, T.R.; Vergopolan, N.; Berg, A.; Wood, E.F. Present and future Köppen-Geiger climate classification maps at 1-km resolution. Sci. Data 2018, 5, 180214. [Google Scholar] [CrossRef]
- Goel, S.; Athalye, R.; Wang, W.; Zhang, J.; Rosenberg, M.; Xie, Y.; Hart, R.; Mendon, V. Enhancements to Ashrae Standard 90.1-Prototype Building Models; Pacific Northwest National Laboratory: Richland, DC, USA, 2014. [Google Scholar]
- Carnieletto, L.; Ferrando, M.; Teso, L.; Sun, K.; Zhang, W.; Causone, F.; Romagnoni, P.; Zarrella, A.; Hong, T. Italian prototype building models for urban scale building performance simulation. Build. Environ. 2021, 192, 107590. [Google Scholar] [CrossRef]
- ASHRAE. Advanced Energy Design Guide for Small Hospitals and Healthcare Facilities, Achieving 30% Energy Savings toward a Net Zero Energy Building; American Society of Heating, Refrigerating and Air-Conditioning Engineers: Peachtree Coreners, GA, USA, 2009. [Google Scholar]
- Advanced Energy Design Guide for Large Hospitals. In Achieving 50% Energy Savings toward a Net Zero Energy Building; American Society of Heating, Refrigerating and Air-Conditioning Engineers: Peachtree Coreners, GA, USA, 2012.
- D’Agostino, D.; Parker, D.; Epifani, I.; Crawley, D.; Lawrie, L. How will future climate impact the design and performance of nearly zero energy buildings (NZEBs)? Energy 2021, 240, 122479. [Google Scholar] [CrossRef]
- Pyrgou, A.; Castaldo, V.L.; Pisello, A.L.; Cotana, F.; Santamouris, M. Differentiating responses of weather files and local climate change to explain variations in building thermal-energy performance simulations. Sol. Energy 2017, 153, 224–237. [Google Scholar] [CrossRef]
- Nielsen, C.N.; Kolarik, J. Utilization of Climate Files Predicting Future Weather in Dynamic Building Performance Simulation—A review. J. Phys. Conf. Ser. 2021, 2069. [Google Scholar] [CrossRef]
- Troup, L.; Eckelman, M.J.; Fannon, D. Simulating future energy consumption in office buildings using an ensemble of morphed climate data. Appl. Energy 2019, 255, 113821. [Google Scholar] [CrossRef]
- P.Tootkaboni, M.; Ballarini, I.; Zinzi, M.; Corrado, V. A Comparative Analysis of Different Future Weather Data for Building Energy Performance Simulation. Climate 2021, 9, 37. [Google Scholar] [CrossRef]
- Zhengen, R.; Tang, Z.; James, M. Typical Meteorological Year Weather Files for Building Energy Modelling—User Guide; CSIRO: Canberra, Australia, 2021. [Google Scholar]
- CSIRO. Predictive Weather Files for Building Energy Modelling User Guide; CSIRO: Canberra, Australia, 2021. [Google Scholar]
- DesignBuilder. Designbuilder Simulation Documentation for Designbuilder V7: UK 2022. Available online: https://designbuilder.co.uk/ (accessed on 21 July 2022).
- Araji, M.T. Surface-to-volume ratio: How building geometry impacts solar energy production and heat gain through envelopes. IOP Conf. Ser. Earth Environ. Sci. 2019, 323, 012034. [Google Scholar] [CrossRef]
- Lim, H.S.; Kim, G. Analysis of Energy Performance on Envelope Ratio Exposed to the Outdoor. Adv. Civ. Eng. 2018, 2018, 7483619. [Google Scholar] [CrossRef]


| Major System | Sub-System |
|---|---|
| STRUCTURAL SYSTEM | Materials and structural systems used in the building |
| EXISTING SERVICE SYSTEMS | Electrical system |
| Fuel storage facility | |
| HVAC system | |
| PLANNING SYSTEMS | Demand planning |
| Policy and procedure development | |
| Capability and service planning | |
| Energy planning | |
| Procurement planning |
| Hazard Category | Specific Hazard Example | Impact on Energy Systems |
|---|---|---|
| Heat related | Increase in mean temperature and extreme heat (frequency, duration, magnitude and intensity of heat waves), impacting both day-time and night-time temperatures | Building/s overheating—health impact/potential heat stress for occupants Increased cooling load/requirement Increased energy demand (and cost) Heat island effect for heating, ventilation, air conditioning and refrigeration (HVAC&R) equipment (reduced performance and energy efficiency) Increased pressure on site energy capacity Increased risk of HVAC&R failure Reduced network capacity and increase in load-shedding/blackouts |
| Relative Humidity related | Increase in RH | Decrease in effectiveness of some cooling systems (e.g., evaporative coolers, ceiling fans) Decrease in thermal performance of buildings Higher dew point, and hence, mold and mildew on building materials and HVAC&R ducts |
| Rainfall related | Disruption to utilities, e.g., loss of mains power Inundation of facilities (e.g., plant room and essential services) Flooding leading to damage/preventing transport access | Reliance on backup systems (with impacts on building services, not on critical or essential services circuits) Damage to HVAC&R equipment Loss of power Limited access for service providers Inability to secure further diesel supplies for generators |
| State/Territory | Interim Emissions Reduction Target | NZCE Target | Renewable Energy (Electricity) Target |
|---|---|---|---|
| Australian Capital Territory (ACT) | 50–60% on 1990 levels by 2025 65–75% on 1990 levels by 2030 90–95% on 1990 levels by 2040 | 2045 | 100% by 2030 |
| New South Wales (NSW) | 50% on 2005 levels by 2030 | 2050 | Nil |
| Northern Territory (NT) | 2050 | 50% (elec.) by 2030 | |
| Queensland (QLD) | 30% on 2005 levels by 2030 | 2050 | 50% by 2030 |
| South Australia (SA) | 50+% on 2005 levels by 2030 | 2050 | 100% by 2030 (Actual 62% in 2021) |
| Tasmania (TAS) | NZCE in 6 of last 7 years | 2030 | 100% achieved 2018 |
| Victoria (VIC) | 28–33% on 2005 levels by 2025 45–50% on 2005 levels by 2030 | 2050 | 50% by 2030 |
| Western Australia (WA) | >50% on 2005 levels by mid-2030 | 2050 | Nil |
| Energy | 2016/17 | 2017/18 | 2018/19 |
|---|---|---|---|
| National baseline renewables | 15.7% | 17.0% | 24.0% |
| Total hospital energy consumed | 4,132,162 MWh | 4,213,694 MWh | 4,121,911 MWh |
| Hospital renewable energy produced | 13,651 MWh | 18,350 MWh | 94,415 MWh |
| Hospital energy % renewable | 0.33% | 0.44% | 2.29% |
| Location | Latitude | Longitude | Altitude | Australian Climate Classification (for Buildings) | Köppen–Geiger Climate Classification |
|---|---|---|---|---|---|
| Darwin | 12.4637° S | 130.8444° E | 31 m | High humid summer, warm winter | Aw (Tropical Savanna) |
| Mt Isa | 20.7264° S | 138.4930° E | 356 m | Hot dry summer, warm winter | Bsh (Mid-Latitude Steppe and Desert) |
| Brisbane | 27.4705° S | 153.0260° E | 22 m | Warm humid summer, mild winter | Cfa (Humid, Sub-tropical) |
| Perth | 31.9523° S | 115.8613° E | 13 m | Warm temperate | Csa (Mediterranean) |
| Sydney | 33.8688° S | 151.2093° E | 58 m | Warm temperate | Cfa (Humid, Sub-tropical) |
| Adelaide | 34.9285° S | 138.6007° E | 50 m | Warm temperate | Csa (Mediterranean) |
| Canberra | 35.2802° S | 149.1310° E | 578 m | Cool temperate | Cfb (Marine West Coast) |
| Mildura | 35.2902° S | 142.1367° E | 33 m | Hot dry summer, cool winter | BSk (Mid-Latitude Steppe/Semi-Arid Cool) |
| Melbourne | 37.8136° S | 144.9631° E | 31 m | Mild temperate | Cfb (Marine West Coast) |
| Hobart | 42.8826° S | 147.3257° E | 17 m | Cool temperate | Cfb (Marine West Coast) |
| Building Geometry | |
|---|---|
| Floor | Single floor |
| Total floor area | 8203 m2 |
| Number of people | 1235 |
| Building thermal properties | Total R-values or U-values |
| External wall | R1.4 m2∙K/W |
| Roof and Ceiling | R3.7 m2∙K/W |
| Floor | R0.4 m2∙K/W |
| Window-to-Wall Ratio | 31% |
| Window U-value | U5.0 W/m2∙K |
| Window SHGC | 0.44 |
| Internal loads | |
| Weighted average lighting power density | 4.19 W/m2 |
| Weighted average plug load power density | 9.54 W/m2 |
| HVAC AHU types | Zones |
| FCUs | Back of House |
| CAV single zone | Offices, Toilets |
| CAV single zone 100% Outside Air | Operating Theater |
| CAV multi zone | Ambulatory Care, Birthing, Emergency and Imaging, Entry and Café, Gym, IPU (inpatient unit), Pathology, Pharmacy |
| CAV multi zone 100% Outside Air | CSSD (critical service and storage department) and Sterile Store |
| Thermostat setpoints | |
| Heating | 21 °C ± 0.5 °C |
| Cooling | 23 °C ± 0.5 °C for Back of House, 22 °C ± 0.5 °C for others |
| Relative humidity | 50% ± 5% |
| HVAC control | |
| System type | Centralized Air-cooled Chilled Water Cooling and Centralized Boiler Hot Water Heating |
| Chiller COP efficiency | 2.6 |
| Electric boiler heating efficiency | 95% |
| Chilled water setpoint temperatures | 6 °C/12 °C |
| Hot water setpoint temperatures | 55 °C/45 °C |
| Supply air temperature | Maximum 35 °C, Minimum 12 °C |
| HVAC sizing | Auto-sized to design days |
| Heat recovery | No |
| Infiltration (ACH) | 0.7 when HVAC is off, 0.35 when HVAC is on |
| Building Geometry | |
|---|---|
| Floor | 6 Stories |
| Total floor area | 142,789 m2 |
| Number of people | 13,907 |
| Building thermal properties | Total U-values |
| External wall | R1.4 m2∙K/W |
| Roof and Ceiling | R4.6 m2∙K/W |
| Floor | R0.4 m2∙K/W |
| Window-to-Wall Ratio | 30% |
| Window U-value | U5.0 W/m2∙K |
| Window SHGC | 0.43 |
| Internal loads | |
| Weighted average lighting power density | 4 W/m2 |
| Weighted average plug load power density | 12 W/m2 |
| HVAC AHU types | Zones |
| VAV single zone with FCUs | Corridor, Dining Lounge, Morgue, Plant and Services, Retail, Toilets, Transformer and Generator, Trolley Hold, Circulation, Stores, HVAC Plant |
| VAV multi zone | Offices, Staff and Clinics, Imaging and Labs, Birthing |
| VAV multi zone 100% Outside Air | Ward and Bed areas |
| Thermostat setpoints | |
| Heating | 21 °C ± 0.5 °C |
| Cooling | 24 °C ± 0.5 °C |
| Relative humidity | 50% ± 5% |
| HVAC control | |
| System type | Centralized Water-cooled Chilled Water Cooling and Centralized Boiler Hot Water Heating |
| Chiller COP efficiency | 6.28 |
| Electric boiler heating efficiency | 100% |
| Chilled water setpoint temperatures | 6 °C/12 °C |
| Hot water setpoint temperatures | 80 °C/70 °C |
| Supply air temperature | Maximum 35 °C, Minimum 12 °C |
| HVAC sizing | Auto-sized to design days |
| Heat recovery | Yes |
| Infiltration (ACH) | 0.7 when HVAC is off, 0.35 when HVAC is on |
| Scenarios | Description | Note |
|---|---|---|
| Current | CSIRO TMY2 files | Historical weather based on 1990–2015 data |
| 2030 | representing the typical year for 2020–2040 | CSIRO RCP8.5: Business-as-usual pathway, Representative Concentration Pathway 8.5 |
| 2050 | representing the typical year for 2040–2060 | |
| 2070 | representing the typical year for 2060–2080 | |
| 2090 | representing the typical year for 2080–2100 |
| Locations | Current | 2030 | 2050 | 2070 | 2090 |
|---|---|---|---|---|---|
| DARWIN | 29.9 | 28.1 | 24.6 | 22.7 | 20 |
| MOUNT ISA | 43.4 | 38.5 | 34 | 30.4 | 28.2 |
| BRISBANE | 63.6 | 53.9 | 50.7 | 44 | 39.7 |
| PERTH | 83.1 | 74.2 | 71 | 65 | 59.2 |
| SYDNEY | 77.1 | 67.7 | 60.4 | 56.1 | 49.9 |
| ADELAIDE | 93.4 | 84.8 | 81.2 | 72.7 | 65.3 |
| CANBERRA | 133 | 121 | 112.9 | 101.2 | 90.7 |
| MILDURA | 100.5 | 90.4 | 87 | 76 | 67.9 |
| MELBOURNE | 101.5 | 90.5 | 87.3 | 79.5 | 69 |
| HOBART | 136.9 | 124.6 | 116.5 | 103.6 | 90.3 |
| Locations | Current | 2030 | 2050 | 2070 | 2090 |
|---|---|---|---|---|---|
| DARWIN | 311.51 | 332.50 | 376.25 | 399.41 | 423.22 |
| MOUNT ISA | 199.42 | 209.81 | 230.19 | 237.23 | 252.21 |
| BRISBANE | 189.64 | 199.82 | 211.00 | 232.99 | 253.77 |
| PERTH | 168.94 | 169.21 | 173.26 | 176.79 | 186.49 |
| SYDNEY | 166.70 | 171.32 | 184.98 | 189.26 | 203.63 |
| ADELAIDE | 164.45 | 162.17 | 163.38 | 165.22 | 169.14 |
| CANBERRA | 197.53 | 190.30 | 186.32 | 184.71 | 183.61 |
| MILDURA | 179.59 | 176.08 | 178.62 | 180.13 | 184.85 |
| MELBOURNE | 163.90 | 160.18 | 161.44 | 167.14 | 170.94 |
| HOBART | 185.19 | 176.36 | 170.96 | 166.22 | 162.22 |
| Locations | Current | 2030 | 2050 | 2070 | 2090 |
|---|---|---|---|---|---|
| DARWIN | 13.5 | 13.45 | 13.3 | 13 | 12.4 |
| MOUNT ISA | 12.7 | 11.6 | 11 | 10.2 | 10 |
| BRISBANE | 18.7 | 17.0 | 16.7 | 15.8 | 15.3 |
| PERTH | 21.9 | 19.4 | 19 | 17.8 | 17.1 |
| SYDNEY | 22.5 | 19.8 | 18.5 | 17.6 | 16.5 |
| ADELAIDE | 23 | 20.2 | 19.5 | 17.9 | 16.8 |
| CANBERRA | 41.7 | 37 | 34.2 | 30.2 | 26.5 |
| MILDURA | 28 | 24.4 | 23.3 | 19.9 | 17.9 |
| MELBOURNE | 27.6 | 24.2 | 23.1 | 21.7 | 19.3 |
| HOBART | 42.4 | 37.6 | 34.9 | 30.5 | 26 |
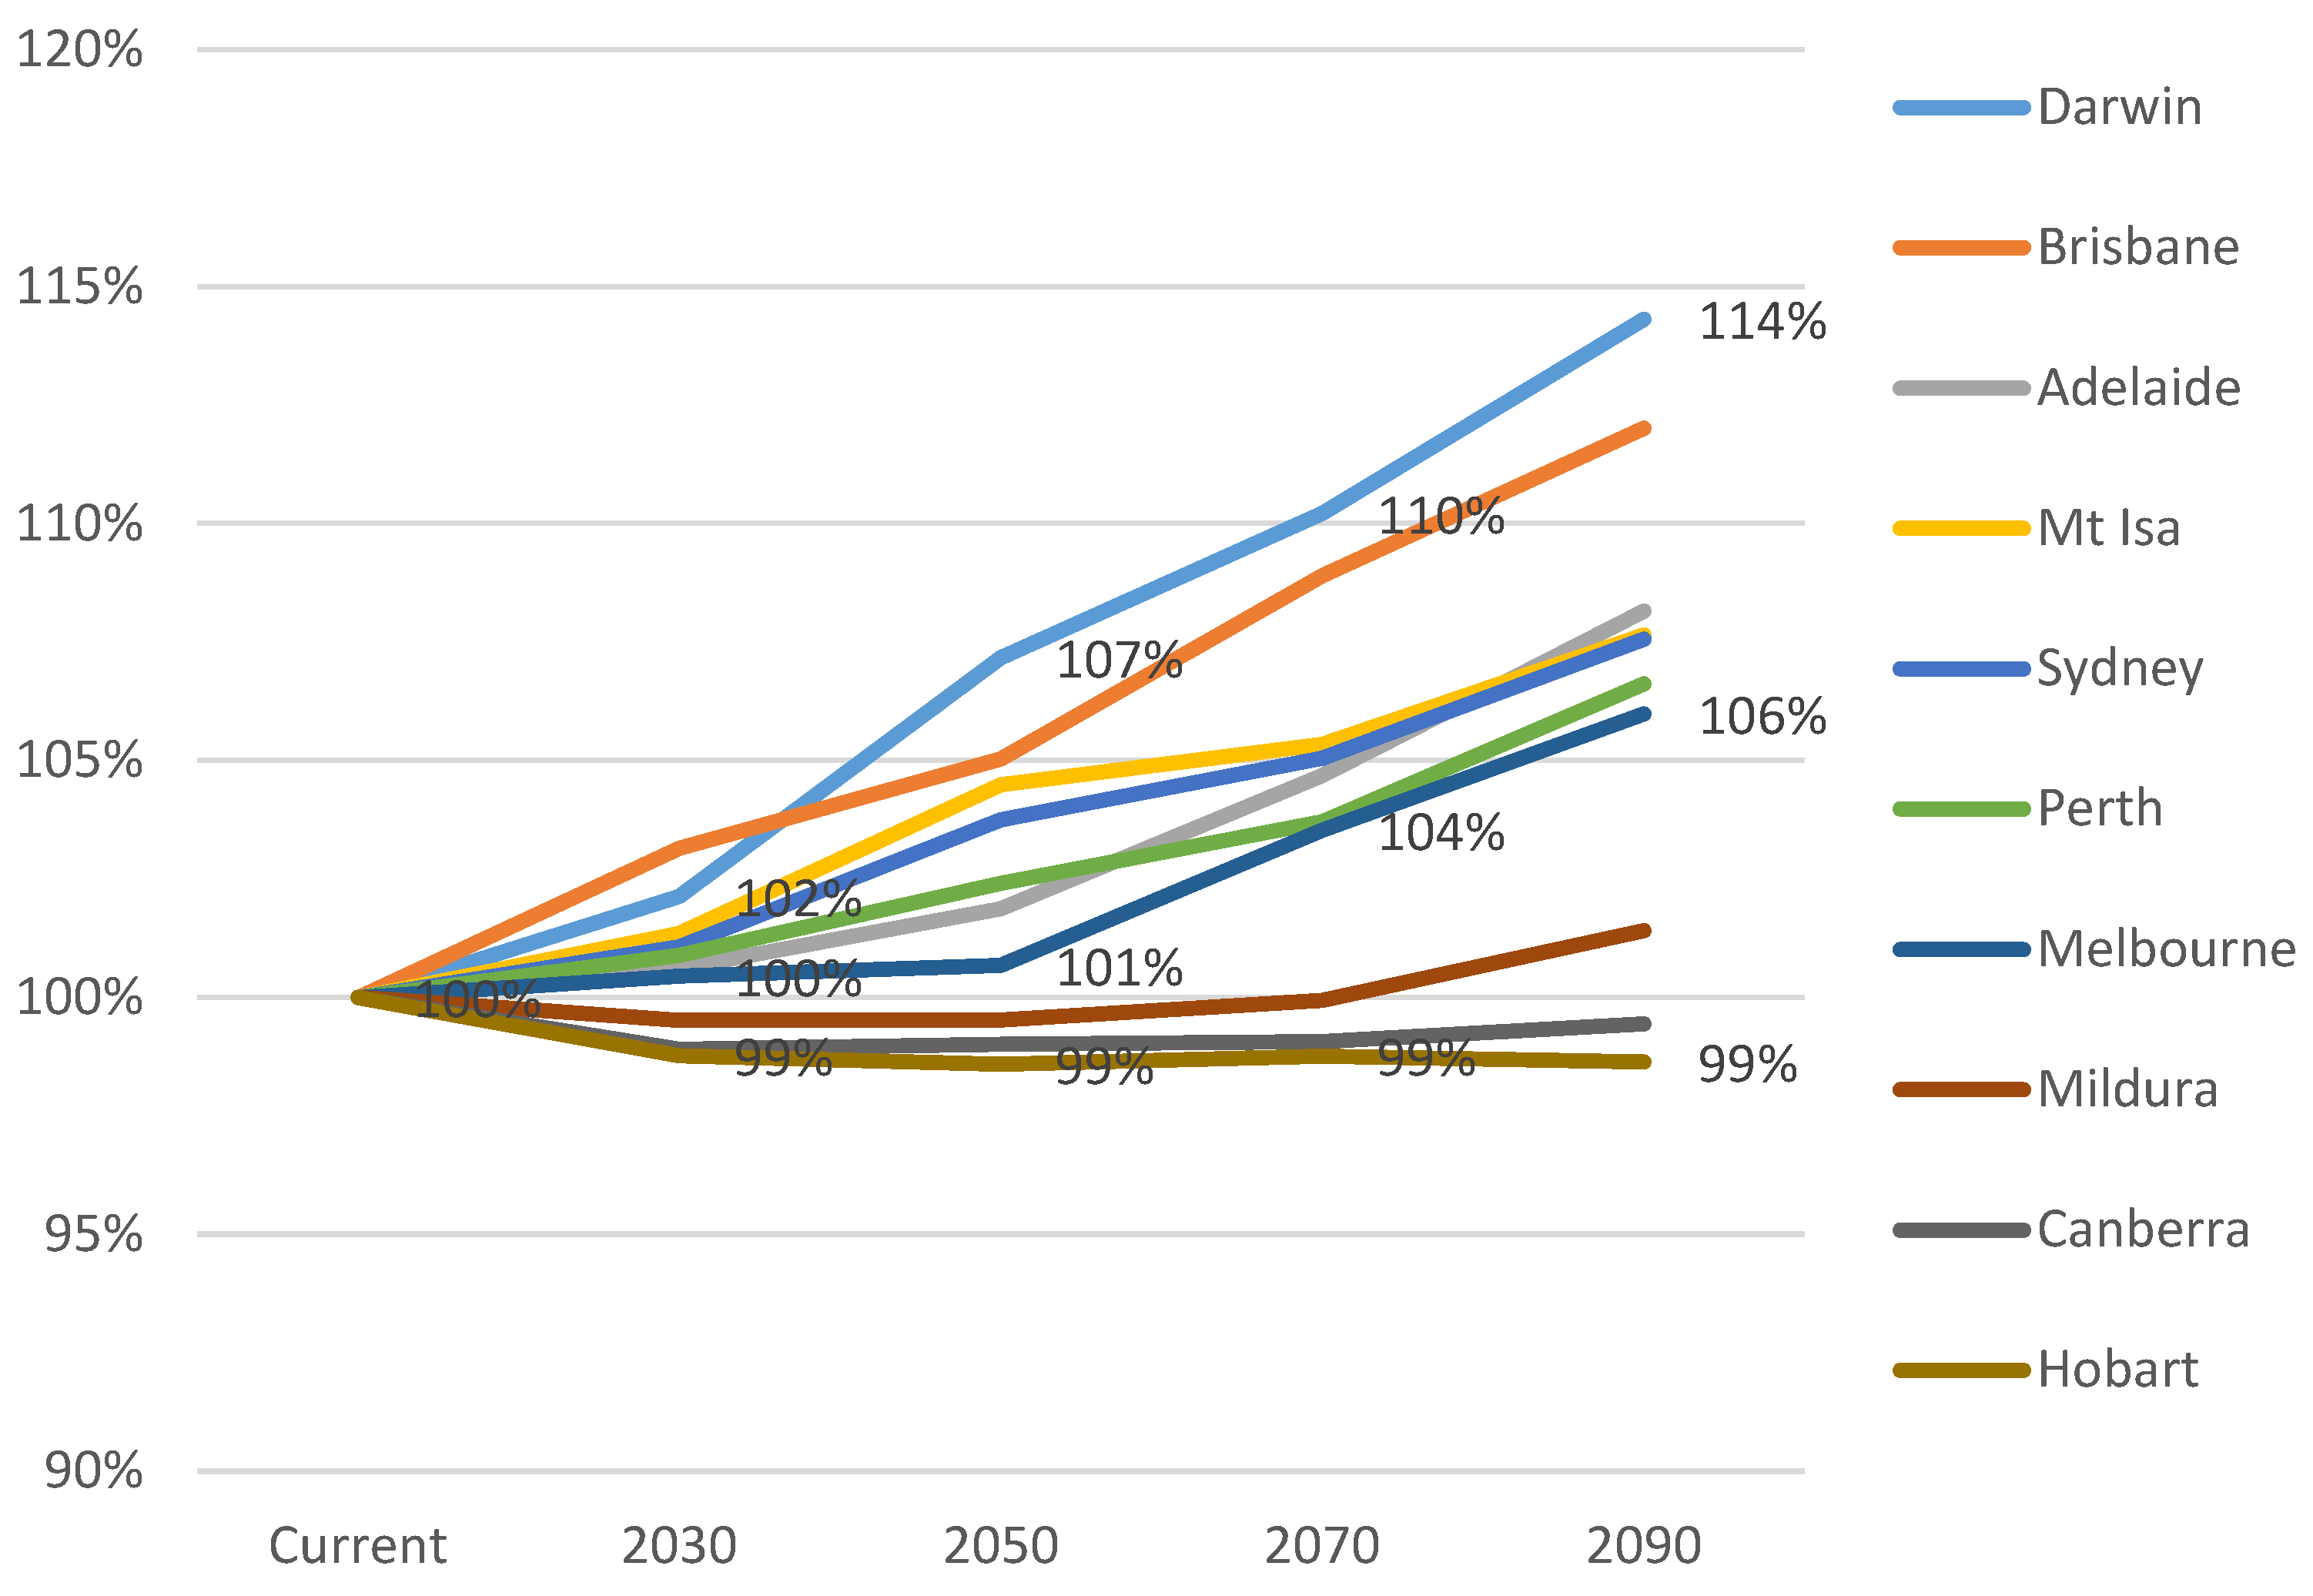
| Locations | Current | 2030 | 2050 | 2070 | 2090 |
|---|---|---|---|---|---|
| DARWIN | 131.18 | 133.97 | 140.58 | 144.58 | 149.96 |
| MOUNT ISA | 108.51 | 109.98 | 113.38 | 114.31 | 116.82 |
| BRISBANE | 111.82 | 115.33 | 117.44 | 121.77 | 125.25 |
| PERTH | 101.70 | 102.60 | 104.15 | 105.47 | 108.43 |
| SYDNEY | 108.60 | 109.75 | 112.67 | 114.08 | 116.81 |
| ADELAIDE | 95.37 | 95.95 | 97.15 | 99.83 | 103.14 |
| CANBERRA | 106.93 | 105.77 | 105.87 | 105.93 | 106.33 |
| MILDURA | 102.05 | 101.56 | 101.56 | 101.98 | 103.49 |
| MELBOURNE | 99.97 | 100.41 | 100.64 | 103.49 | 105.95 |
| HOBART | 106.14 | 104.83 | 104.64 | 104.82 | 104.69 |
Publisher’s Note: MDPI stays neutral with regard to jurisdictional claims in published maps and institutional affiliations. |
© 2022 by the authors. Licensee MDPI, Basel, Switzerland. This article is an open access article distributed under the terms and conditions of the Creative Commons Attribution (CC BY) license (https://creativecommons.org/licenses/by/4.0/).
Share and Cite
Ma, Y.; Zedan, S.; Liu, A.; Miller, W. Impact of a Warming Climate on Hospital Energy Use and Decarbonization: An Australian Building Simulation Study. Buildings 2022, 12, 1275. https://doi.org/10.3390/buildings12081275
Ma Y, Zedan S, Liu A, Miller W. Impact of a Warming Climate on Hospital Energy Use and Decarbonization: An Australian Building Simulation Study. Buildings. 2022; 12(8):1275. https://doi.org/10.3390/buildings12081275
Chicago/Turabian StyleMa, Yunlong, Sherif Zedan, Aaron Liu, and Wendy Miller. 2022. "Impact of a Warming Climate on Hospital Energy Use and Decarbonization: An Australian Building Simulation Study" Buildings 12, no. 8: 1275. https://doi.org/10.3390/buildings12081275