Article

Stability Analysis of the Inclined Capillary Barrier Covers under Rainfall Condition

1
Department of Geotechnical Engineering, College of Civil Engineering, Tongji University, 1239 Siping Road, Shanghai 200092, China
2
Qiannan Traffic Design Institution Group Co., Ltd., Guizhou 558000, China
*
Author to whom correspondence should be addressed.
Buildings 2022, 12(8), 1218; https://doi.org/10.3390/buildings12081218
Submission received: 4 July 2022 / Revised: 5 August 2022 / Accepted: 10 August 2022 / Published: 12 August 2022
(This article belongs to the Special Issue New Advances in Soil-Structure Systems)

Abstract

:
Capillary barrier covers consist of fine-grained soil layer overlying coarse-grained soil layer, which are widely used as surface covers for mine tailings, solid waste landfills, and low-level radioactive waste repositories. On one hand, the capillary barrier covers can effectively prevent the rainfall water infiltrating into the toxic and hazardous materials below. On the other hand, the infiltrated water stores and diverts in the fine-grained soil layer, leading to a reduction in the stability of the capillary barrier covers. In this study, a stability analysis method for the capillary barrier covers was established based on the Green-Ampt model and the Janbu method. Firstly, the infiltration process of capillary barrier covers was analyzed and divided into four stages. The variation of the wetting front profile during infiltration, caused by the capillary barrier effect, was depicted based on the law of mass conservation. Next, the wetting front is assumed to be the potential sliding surface. As the infiltration goes on, the stability of capillary barrier covers in different stages was analyzed through the limit equilibrium method. Both the water redistribution and the influence of seepage force in the capillary barrier covers were considered in the proposed method. Finally, using the examples in the published articles, the availability and superiority of the proposed method was verified.

1. Introduction

Surface barrier covers are commonly used as the capping of mine tailings [1,2], solid waste landfills [3,4] and low-level radioactive waste repositories [5,6]. It has been over forty years since the emergence of surface covers and a number of changes have taken place in the materials used for the covers. Among them, the representative ones include Soil Covers [7], Compacted Clay Covers [8,9], and Geosynthetic Clay Liners in covers [10,11]. The main purpose of these kinds of surface covers is to prevent the rainwater from entering into the toxic waste below. Due to the similarity of the working mechanism of these types of covers, they are generally referred as the traditional covers.
However, a great deal of engineering experiences has shown that the traditional covers have obvious drawbacks in long-term service [12,13]. Due to the complex and changeable atmospheric environment, the traditional covers are subjected to periodic cycles of wetting/drying and freezing/thawing, causing the soil cracking of the overlying clay layers. The cracks in the clay layers significantly increase the permeability of the surface covers, resulting in the failure of water resistance. Lu et al. [14] investigated the anti-seepage performance of loess landfill covers and verified that the hydraulic conductivity of cracked soil was three orders of magnitude higher than non-cracked soil. Melchior et al. [15] monitored the landfill cover systems in Hamburg for 18 years and found severe cracking of the clay layer. The annual leakage of the cracked clay layer was approximately 10 times greater than the non-cracked status and the leakage rate (ratio of leakage to rainfall) rises to 42%. Additionally, the function of the surface covers in gas emission controlling aroused more and more attention among the scholars [16,17]. The soil cracking of traditional covers allows toxic and harmful gases entering the atmosphere, posing a threat to ecosystem and human beings.
Considering the disadvantages of the traditional covers, some scholars proposed the idea of Alternative Earthen Final Covers (AEFCs) [12,18,19]. The AEFCs is not exclusively based on the idea of ‘water retention’ but rather on the idea of ‘water storage’, which means that the infiltrated water is retained in the soil layer during rainfall and evaporates into the atmosphere during sunny days. Thus, the AEFCs allows for a dynamic cycle of water migration. In order to maximize the water storage capacity of soil covering, capillary barrier covers are proposed [20,21,
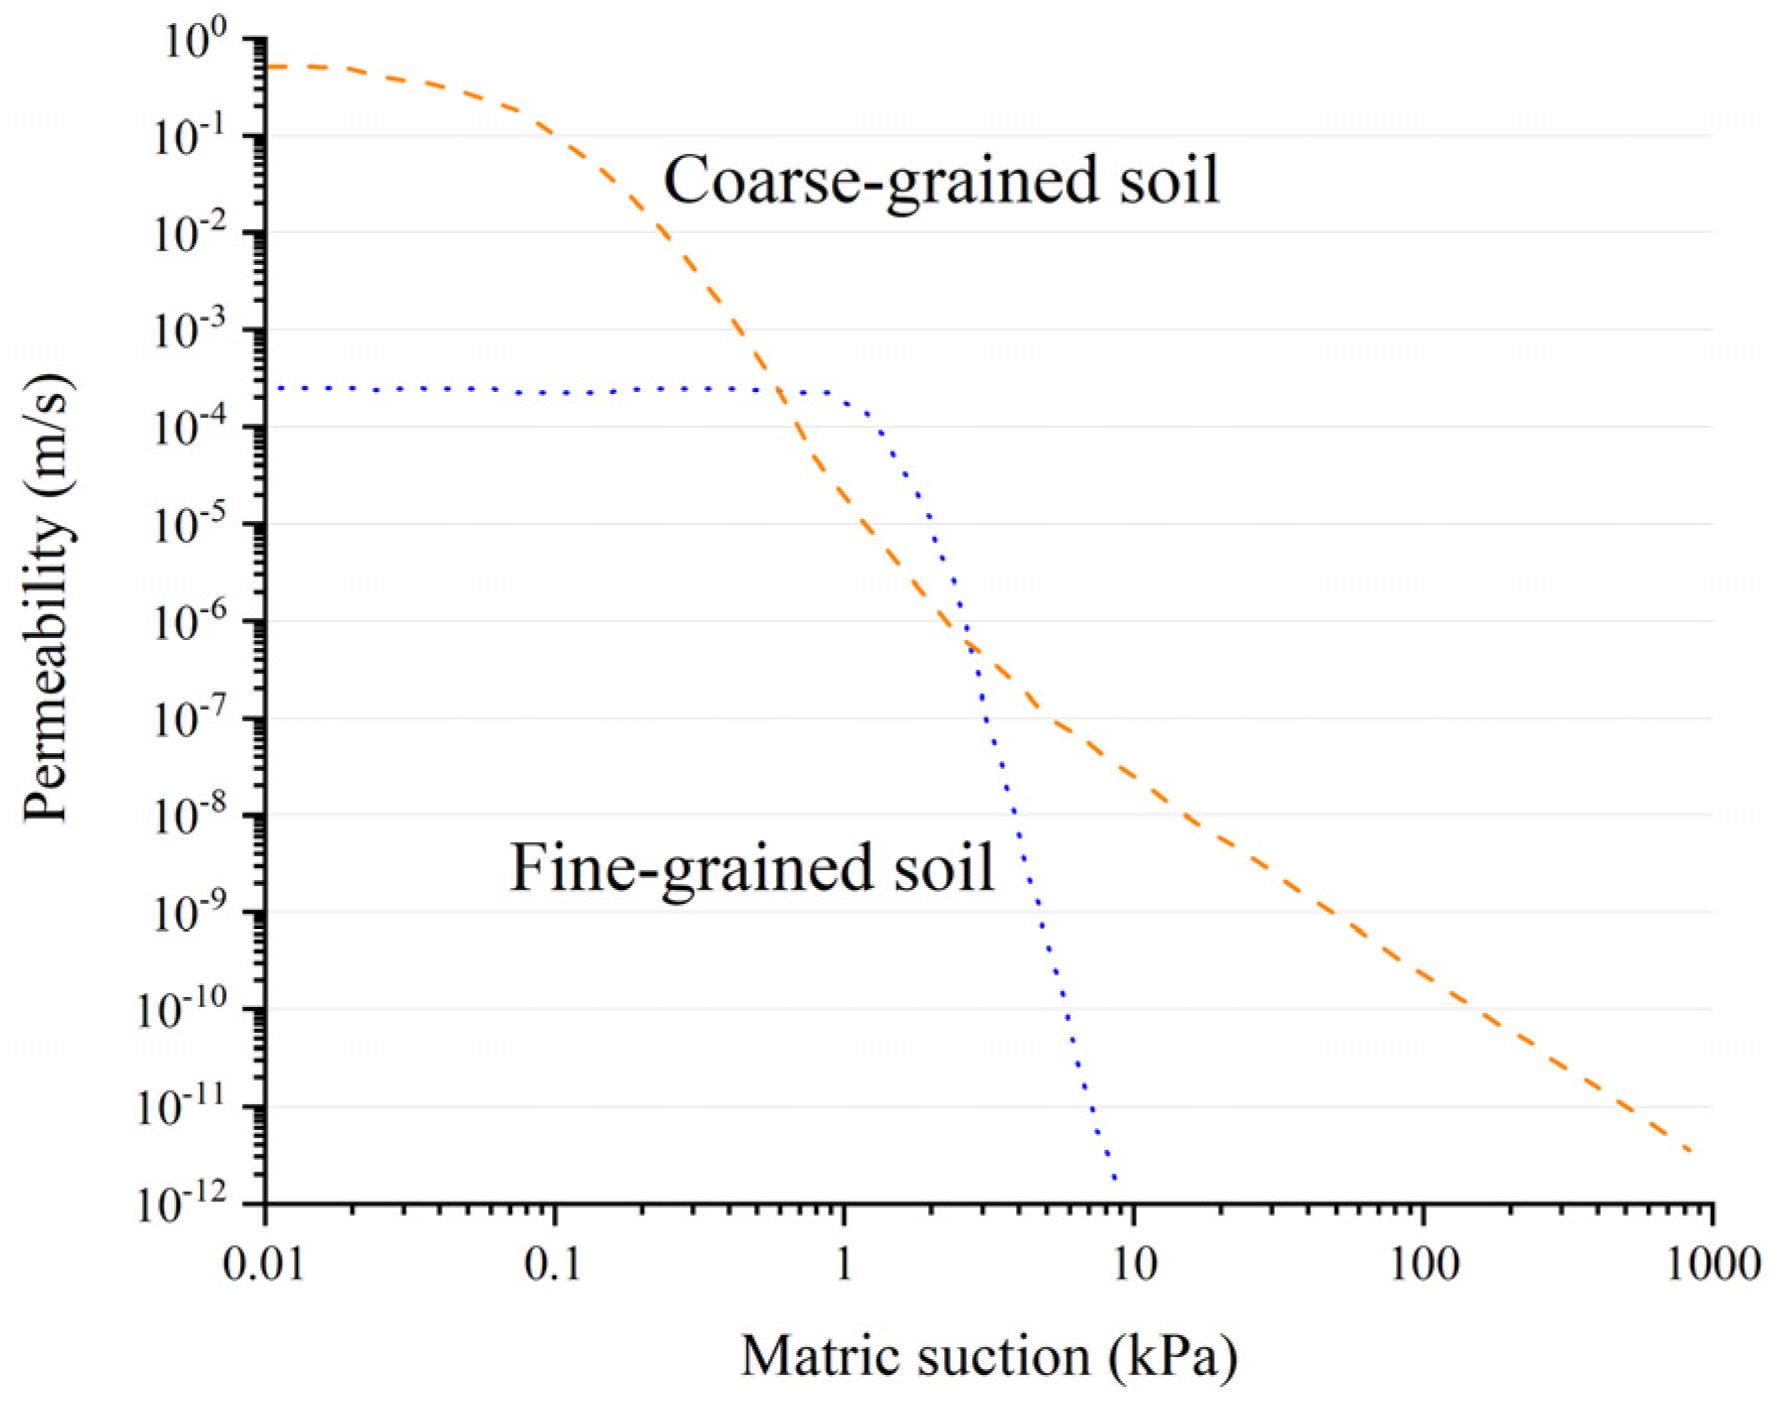
22]. The capillary barrier cover usually consists of a layer of fine-grained soil underlain by a layer of coarse-grained soil. When the infiltrated water reaches the interface of two layers, the water cannot seep downward due to the differences in hydraulic conductivity between fine-grained soil and coarse-grained soil. At that time, water migrates along the interface and re-infiltrates upwards. Only the suction of the coarse-grained soil decreases to the water-entry value (point A in Figure 1.) does the water can penetrate the interface and infiltrate into the coarse-grained layer. Subsequently, the moisture content of the coarse-grained soil continuously increases. When the hydraulic conductivity of the fine-grained and coarse-grained soils are equal, the capillary barrier covers completely fails and water enters the coarse-grained layer rapidly. Former studies have verified that the fine-grained soil in capillary barrier covers is nearly saturated when the breakthrough happens [23,24]. The coarse-grained soil will increase the water storage capacity of the overlying fine-grained soil, contributing to the overall impermeability of the surface cover. Furthermore, the fine-grained soils of capillary barrier cover usually consist of non-clayed soils, which effectively avoids the system failure caused by cracking. Additionally, the fine/coarse-grained soils are cheap and easy-available materials, which effectively reduces the cost of engineering.
Previous studies have deeply investigated the water storage capacity and water migration process of the capillary barrier covers. Through the visible tracer test, Qian et al. [26] studied the performance of the capillary barrier covers under different thicknesses, rainfall intensities and slope angles. Results showed that the efficiency of capillary barrier covers increases with coarse-grained soil layer thickness and slope angle while decreases with rainfall intensity. A large-scale indoor experiment was carried out by Kampf et al. [27] to investigate the uncertainties about conceptualization and parameterization of capillary barriers design. The data revealed that infiltrated water in fine-grained soil mainly migrates laterally in the saturated zone and the performance of capillary barrier covers is highly sensitive to the hydraulic properties of both fine and coarse soil. Considering the limitations of indoor experiments, some scholars have conducted filed tests and monitored the performance of established capillary barrier covers for a long time. Rahardjo et al. [25] studied the capillary barrier covers under tropical heavy rainfall and verified that the capillary barrier covers can effectively contain the negative pore-water pressure of the coarse- grained soil layer. Zhang [28] collected the monitor data of the Prototype Hanford Barrier (PHB) in the U.S up to 19 years. The monitoring record showed that the capillary barrier covers performed well in the 19 years even under extreme weather conditions. However, most of the previous research focused on the water storage and drainage capacity of capillary barrier covers, ignoring the stability analysis of capillary barrier covers.
In many engineering projects, the capillary barrier covers are placed on the slopes. Due to the capillary barrier effect, the water cannot infiltrate downward but store in the fine-grained soil during the rainfall. As the rain goes on, the fine-grained soil layer approximately reaches saturated, which greatly reduces the shear strength of the fine-grained soil. Additionally, in fine-grained soil layer, the water diversion exposes the fine-grained soil skeleton to seepage forces, leading to the occurrence of fine-grained soil instability. As the capillary barrier cover consists of a fine/coarse-grained bilayer structure, a weak zone of shear strength will also be formed at the interface of the two layers. With the increases of water content, the fine-grained soil layer may slide along the interface. Juca et al. [
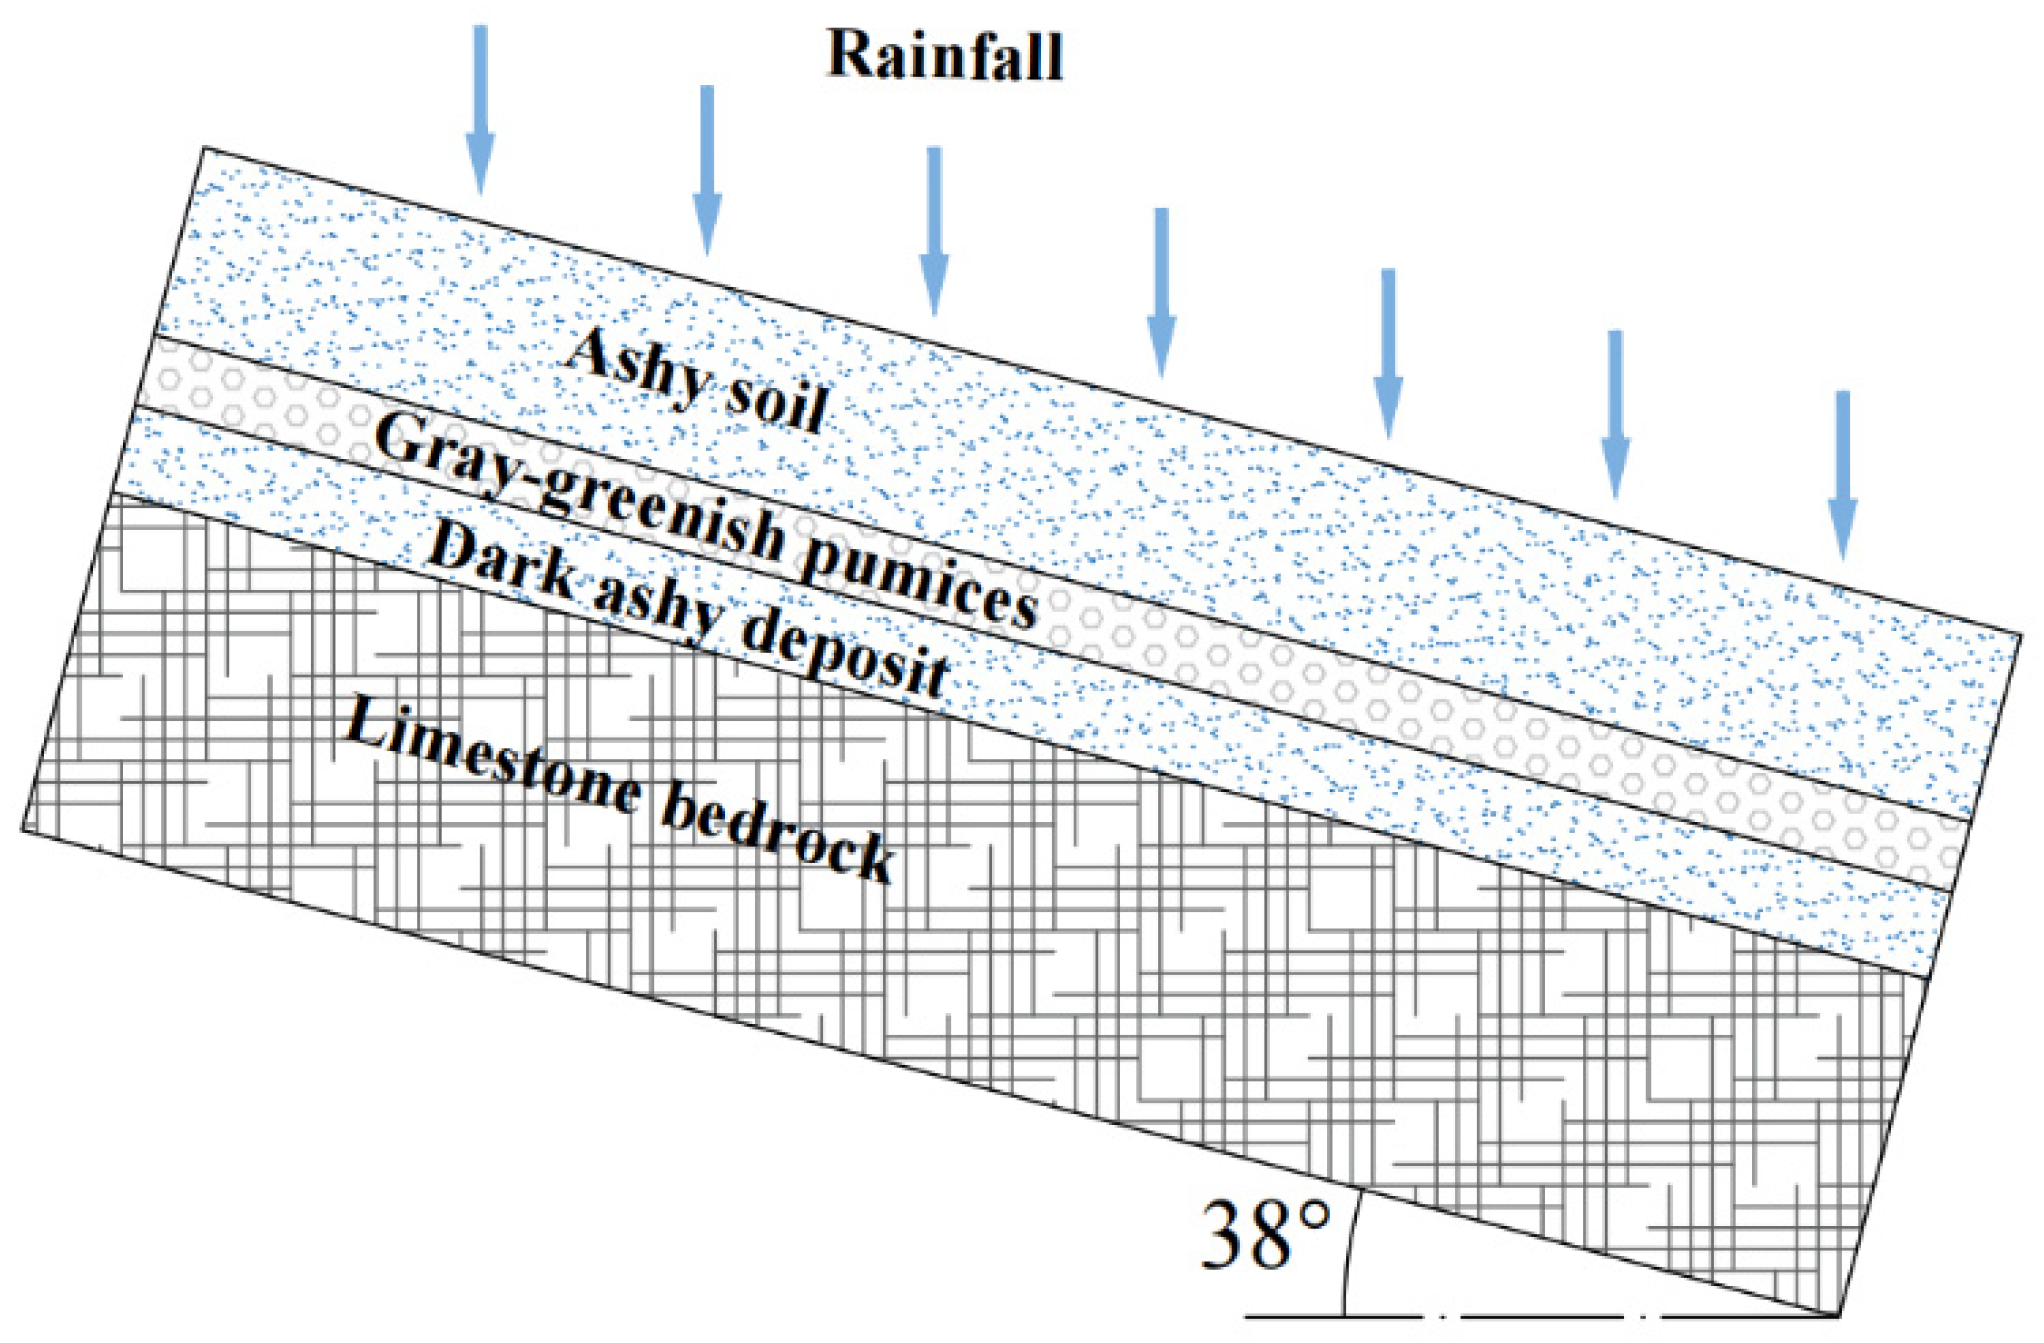
29] reported the excessive movement of the landfill covers in Brazil and pointed out that the instability is caused by the water storage. In Italy, the catastrophic landslides with fine/coarse-grained soil structures have occurred at Bracigliano, Quindici, Sarno and so on [30], which caused serious damages and aroused huge discussion [31,32]. Due to the different mechanical properties and water contents of the upper/underlying layers, it is widely considered that the failures usually happened at the top fine-grained layer or the interface of the fine/coarse-grained layers [33,34].
Recently, the analysis of infiltration and stability of the multi-layer slopes has been studied by many scholars. Based on the one-dimensional infiltration model and infinite slope analysis, Cho [35] studied the shallow failures of two-layer slopes and verified the influence of the infiltration to slope stability. Mancarella et al. [30] conducted the infiltration tests and pointed out significant localized moisture accumulation leads to the slope instability. Xiong et al. [36] analyzed the stability of multi-layer slopes by assuming that the sliding surface is located at the wetting front. Through limit equilibrium analysis, results showed the first layer is most susceptible to slide. However, in these studies, the difference in hydraulic conductivity between the upper and lower layers is not so significant that the infiltrated water can enter the underlying layer freely, which is different from the characteristics of capillary barrier covers mentioned above.
In this article, a stability analysis method for the capillary barrier covers was proposed. Firstly, the infiltration process of the capillary barrier covers was conducted by analyzing the Green-Ampt model and considering the capillary barrier effect at the interface of fine/coarse grained soil. Next, considering the water storage and diversion, the stability analysis of the capillary barrier was divided into three stages considering the influence of seepage force and the changes of the wetting front profiles. Finally, the proposed method was analyzed and verified by using the cases in the published article.

2. Infiltration Analysis of Capillary Barrier Covers

2.1. Basic Rainfall Infiltration Model

The stability of the capillary barrier covers is closely related to the infiltration progress during rainfall. It is widely considered that the infiltration of the inclined soil is a typical three-dimensional unsaturated process, which is controlled by the Richard’s equation (Equation (1)). Due to the complexity of non-linear partial differential equations, the Richard’s equation is usually solved by numerical methods, such as the finite difference method, finite element method, etc. Complex discretization and iteration are required in this process, making it difficult to acquire the calculation result.
θ t = x ( K x ( θ ) φ x ) + y ( K y ( θ ) φ y ) + z ( K z ( θ ) φ z )
where, θ : water content; t: time; Kx/Ky/Kz: the permeability at x/y/z directions; φ : the total soil-water potential.
In order to obtain the wetting profiles of rainfall infiltration more easily and quickly, many scholars have simplified Richard’s equation, arguing that slope infiltration can be reduced from a complex three-dimensional problem to a one-dimensional problem [37,38]. Thus, many physical models have been proposed based on the assumption of one-dimensional infiltration. Among these models, the Green-Ampt model [39] has been widely studied and accepted by scholars because of its clear physical meaning and concise expressions [40,41]. In the GA (Green-Ampt) model, rainwater infiltrates continuously downwards and the soil gradually reaches saturated. It is assumed a well-defined wetting front is between the upper saturated zone and the lower initial unsaturated zone. When the rainfall intensity is lower than the infiltration capacity of the soil, the infiltration rate i is equal to rainfall intensity. When the rainfall intensity is higher than the infiltration capacity of the soil, the expression of the GA model for single layer slope is shown as followed [42]:
i = K Z f cos α + S f Z f
where, i: the infiltration rate of rainfall (m/s); K: the permeability coefficient of soil (m/s); Zf: the depth of wetting front perpendicular to the slope surface (m); α : the dip angle of the slope surface (°); Sf: the matric suction head at the wetting front (m).

2.2. Rainfall Infiltration Model for Capillary Barrier Covers

Initially, the infiltration process of the capillary barrier cover is consistent with that of the ordinary slopes. Thus, the wetting front profile is assumed to be parallel to the surface of fine-grained soil layer based on the hypothesis of GA model. The formula to calculate the infiltration depth is:
Z f 1 = K 1 S f i K 1 cos α
where, i: the infiltration rate of rainfall (m/s); K1: the permeability coefficient of the fine-grained soil (m/s); Zf1: the depth of wetting front perpendicular to the slope surface (m); α : the dip angle of the slope surface (°); Sf: the matric suction head at the wetting front (m).
Assuming the initial content of fine-grained soil is the same and the upper/lower boundaries (AC and BD in Figure 2) of fine-grained soil is impermeable. In this stage, the infiltration volume can be calculated as:
V f = Z f 1 ( θ s θ 0 ) L W
where, Vf: the infiltration volume into the slope (m3); Zf1: the depth of wetting front perpendicular to the slope surface (m); θ s : the saturated water content of the fine-grained soil; θ 0 : the initial water content of the fine-grained soil; L: the length of the slope surface (m); W: the width of the slope (assumed to be the unit width in this study) (m).
As the rain goes on, the water infiltrates continuously and starts to move downward along the slope. Assuming the water in the fine-grained soil is linearly distributed in both parallel and vertical directions. When the water content of the fine-grained soil reached the breakthrough point of the capillary barrier at the toe of the slope, the water content of each point in the fine-grained soil is:
θ f = x L ( y r y l ) + y l
y r = y h f ( θ t θ s ) + θ s
y l = y h f ( θ c θ s ) + θ s
where, θ t : volumetric water content at the bottom of fine-grained layer on the slope toe; θ c : volumetric water content at the bottom of fine-grained layer on the slope crest; hf: the depth of fine-grained soil.
Thus, when the breakthrough happens, the total infiltration volume at per unit width can be calculated as (Figure 3):
V f = 0 l 0 h 0 1 [ x y l h ( θ 1 θ 0 ) + y h ( θ 0 θ s ) + θ s ] d x d y d z h f L θ 0
The solution is:
V f = 1 4 h f L ( θ 1 + 2 θ s + θ 0 ) h f L θ 0
where, θ s : the saturated water content of the fine-grained soil; θ 0 : the initial water content of the fine-grained soil; θ 1 : the breakthrough water content of the capillary barrier covers.
Based on former studies, assuming the wetting front profile is in the shape of parabolic function [43,44], the totally infiltrated volume of per unit width also can be calculated as:
V f G A = 0 h f ( L a z 2 b z c ) ( θ s θ 0 ) d z
Due to the law of conservation of mass, the infiltration volume in the upper saturated zone of the wetting front should be equal to the variation of water in the fine-grained soil layer. Thus, V f = V f G A , it can be expressed as:
1 4 h f L ( θ 1 + 2 θ s + θ 0 ) h f L θ 0 = 0 h f ( L a z 2 b z c ) ( θ s θ 0 ) d z
Associated with the existing geometric conditions:
{ z = 0 , x = 0 z = h f , x = L
The parabolic function of the wetting front profile of the GA model can be solved.
Next, as the water infiltration goes on, the infiltration volume of fine-grained soil increases and the wetting front move upwards [20,42]. The scheme of this process is shown in Figure 4.
Finally, the capillary barrier effect at the interface of fine/coarse-grained soils is totally ineffective. A large quantities of rainwater infiltrates into the coarse-grained soil layer because of its greater hydraulic conductivity. As the breakthrough point moves upwards along the interface, more and more water start to infiltrate into the coarse-grained layer. The relationship between wetting front depth and infiltration time can also be calculated by the GA model as long as indicating the upper saturated zone as the ponding water. The shape of wetting front in coarse-grained soil is assumed to be parallel to the interface.

3. Stability Analysis of Capillary Barrier Covers

The limiting equilibrium method is the most classic and accepted method of slope stability analysis [45,46,47]. Due to the clear physical meaning, well-defined mechanical relationships and simple calculations, the limit equilibrium method is widely used in the stability analysis of various slopes. Many methods have been proposed based on the principle of limit equilibrium analysis, including the Swedish slice method [48], the simplified Bishop method [49,50], the Janbu method [51], the Morgenstern-Price method [52] and so on. Among these methods, the Janbu method can be used for arbitrarily shaped sliding surfaces. Additionally, the calculation process of the Janbu method is simpler than others. For the fine/coarse-grained soil slopes, many realistic accidents and experiments have confirmed that the failure is mainly caused by the top fine-grained soil [30,33,53]. Therefore, the stability of the fine-grained soil layer in the capillary barrier cover is analyzed using the Janbu method in this paper.

3.1. Sliding Surface in the Fine-Grained Soil

Initially, the rainfall water infiltrated into the fine-grained soil vertically with no diversion and the wetting front could be assumed to be parallel to the slope surface. At that time, the downward infiltration dominates water migration. The factor of safety can be calculated as:
F s = N tan φ + c L W sin α
where, Fs: the factor of safety; W: the gravity of upper zone; N: the stress at the interface (equal to Wcosα); c: the effective cohesion of soil; L: the length of the slope; φ : the internal friction of the soil; α : the slope angle.
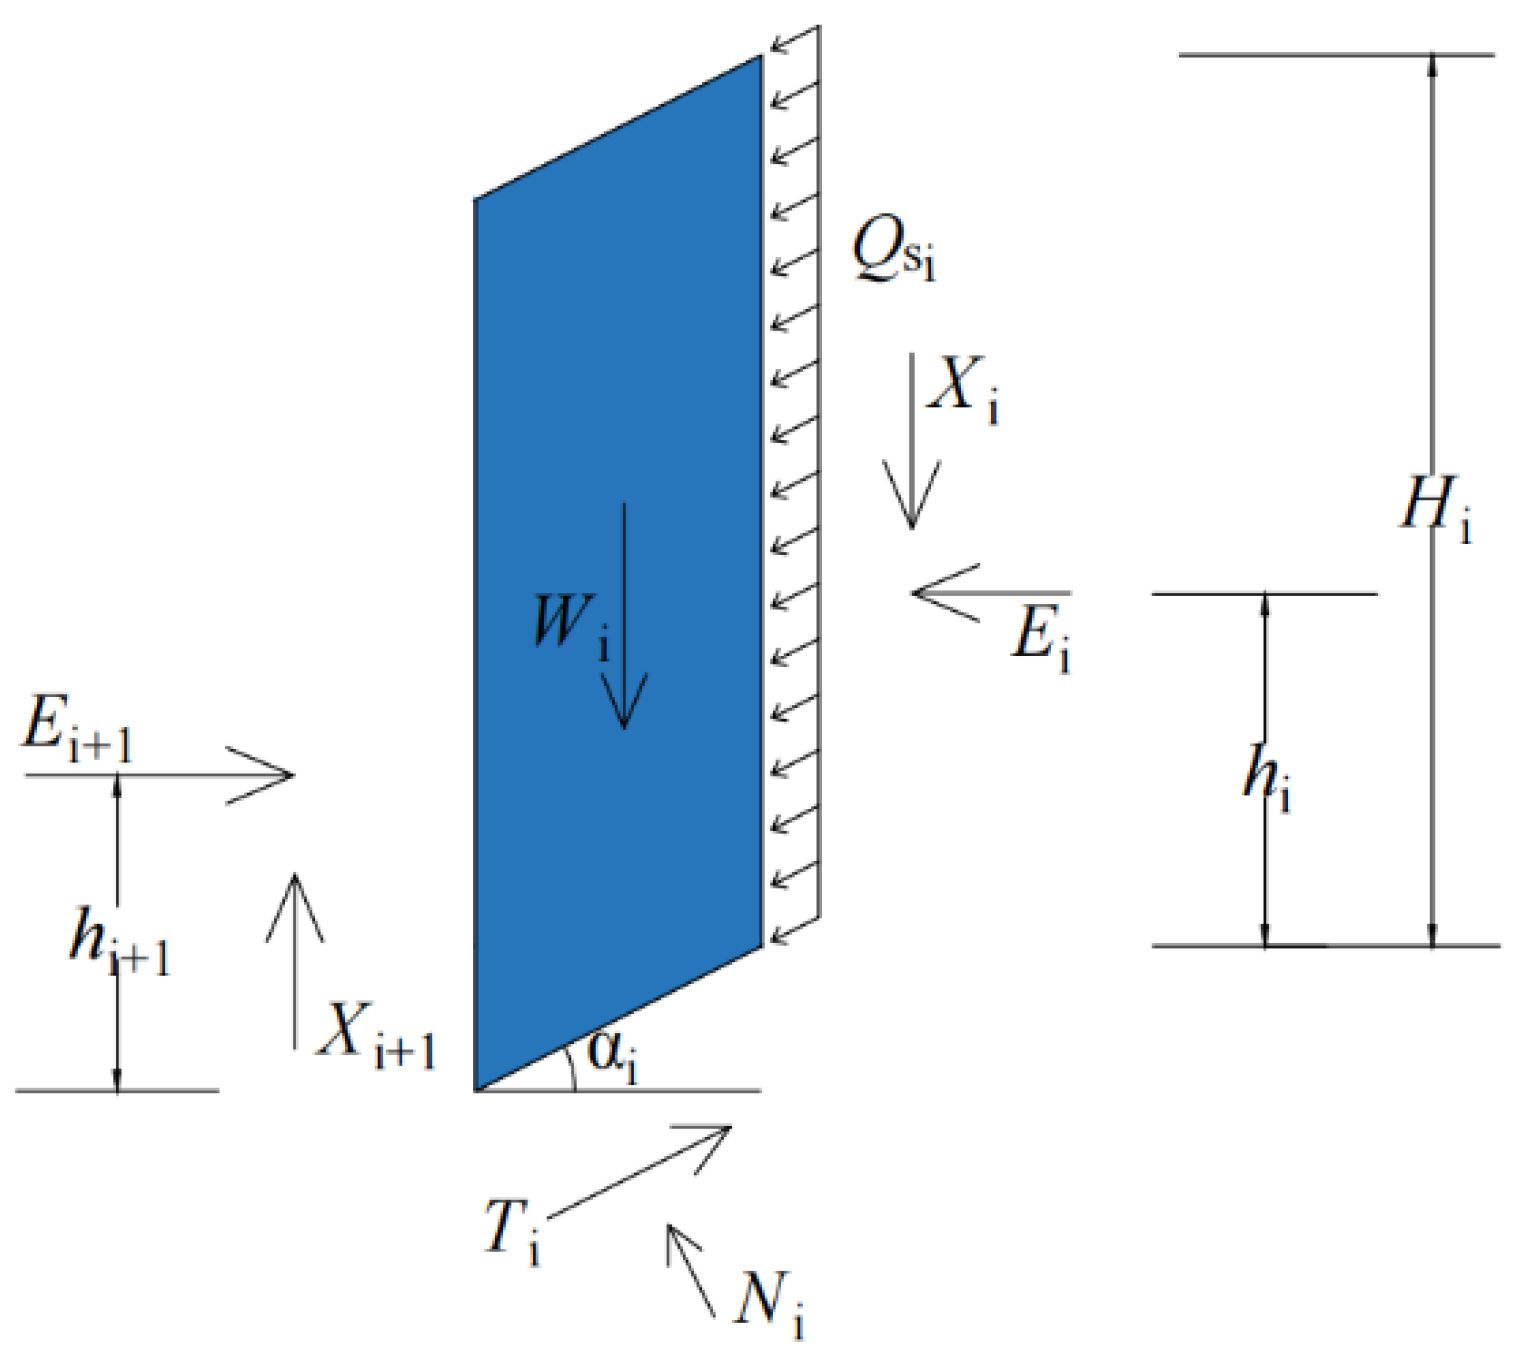
As the rain goes on, the infiltrated water started to divert along the interface and the wetting front profile was considered to be the parabolic function shape. Assuming the wetting front as the sliding surface, the upper saturated zone was split into individual vertical slices (Figure 5). Considering the water diversion at that time, the seepage force parallel to the slope surface can be calculated as:
Q s = γ w J V u s
where, Qs: the seepage force; γ w : the unit weight of water; J: the hydraulic gradient; Vus: the volume of upper saturated zone.
Based on the force balance of vertical and horizontal directions on slice i:
W i + Q s i H i sin α i + X i X i + 1 = N i cos α i + T i sin α i
Q s i H i cos α i + E i E i + 1 = T i cos α i N i sin α i
According to the limiting equilibrium conditions:
T i = c e i Δ x sec α i + N i tan φ e i
where,
c e i = c i F s , tan φ e = tan φ i F s
c i , φ i : the effective cohesion and effective angle of internal friction of the soil.
Associating the Equations (15)–(17):
N i = W i + Q s i H i sin α i Δ X i c e i Δ x tan α i cos α i + sin α i tan φ e i
T i = ( W i + Q s i H i sin α i Δ X i ) tan φ e i + c e i Δ x cos α i + sin α i tan φ e i
Δ E i = Q s i H i cos α i c e i Δ x 1 + tan α i tan α i φ e i + W i + Q s i H i sin α i Δ X i tan α i φ e i
When it comes to the last slice:
E n + 1 = 0
Therefore,
i = 1 n Δ E i = 0
The Equation (19) can be written as:
i = 1 n { Q s i H i cos α i c e i Δ x [ 1 + tan α i tan ( α i φ e i ) ] + ( W i + Q s i H i sin α i Δ X i ) tan ( α i φ e i ) } = 0
Subsequently, the torque equilibrium equation of each slice is listed:
( X i + Δ x i ) Δ x 2 + X i Δ x 2 Q i H i 2 Q s i H i 2 2 + E i + 1 ( h i + 1 Δ x tan α i 2 ) E i ( h i + Δ x tan α i 2 ) = 0
Considering:
E i + 1 = E i + Δ E i
Δ h i = h i + 1 h i Δ x tan α i
Δ E i h i + 1 Δ E i h i
Equation (23) can be simplified as:
X i = Q i H i 2 Δ x + Q s i H i 2 2 Δ x E i Δ h i Δ x Δ E i h i Δ x
Finally, the factor of safety Fs can be calculated by iteration. The iteration steps are listed as followed:
(1)
Assume Δ X i = 0 , substitute it into the Equation (23) and acquire the approximate value of Fs1.
(2)
Use Fs1, Δ X i and Equation (20) to calculate Δ E i , and acquire the value of Ei.
(3)
Substitute Ei and Δ E i into Equation (28), acquire the value of Xi and Δ X i .
(4)
Substitute the calculated Δ X i above into the Equation (23) and acquire the new value of Fs2.
(5)
Repeat the steps above until the error of two Fsi less than the threshold.

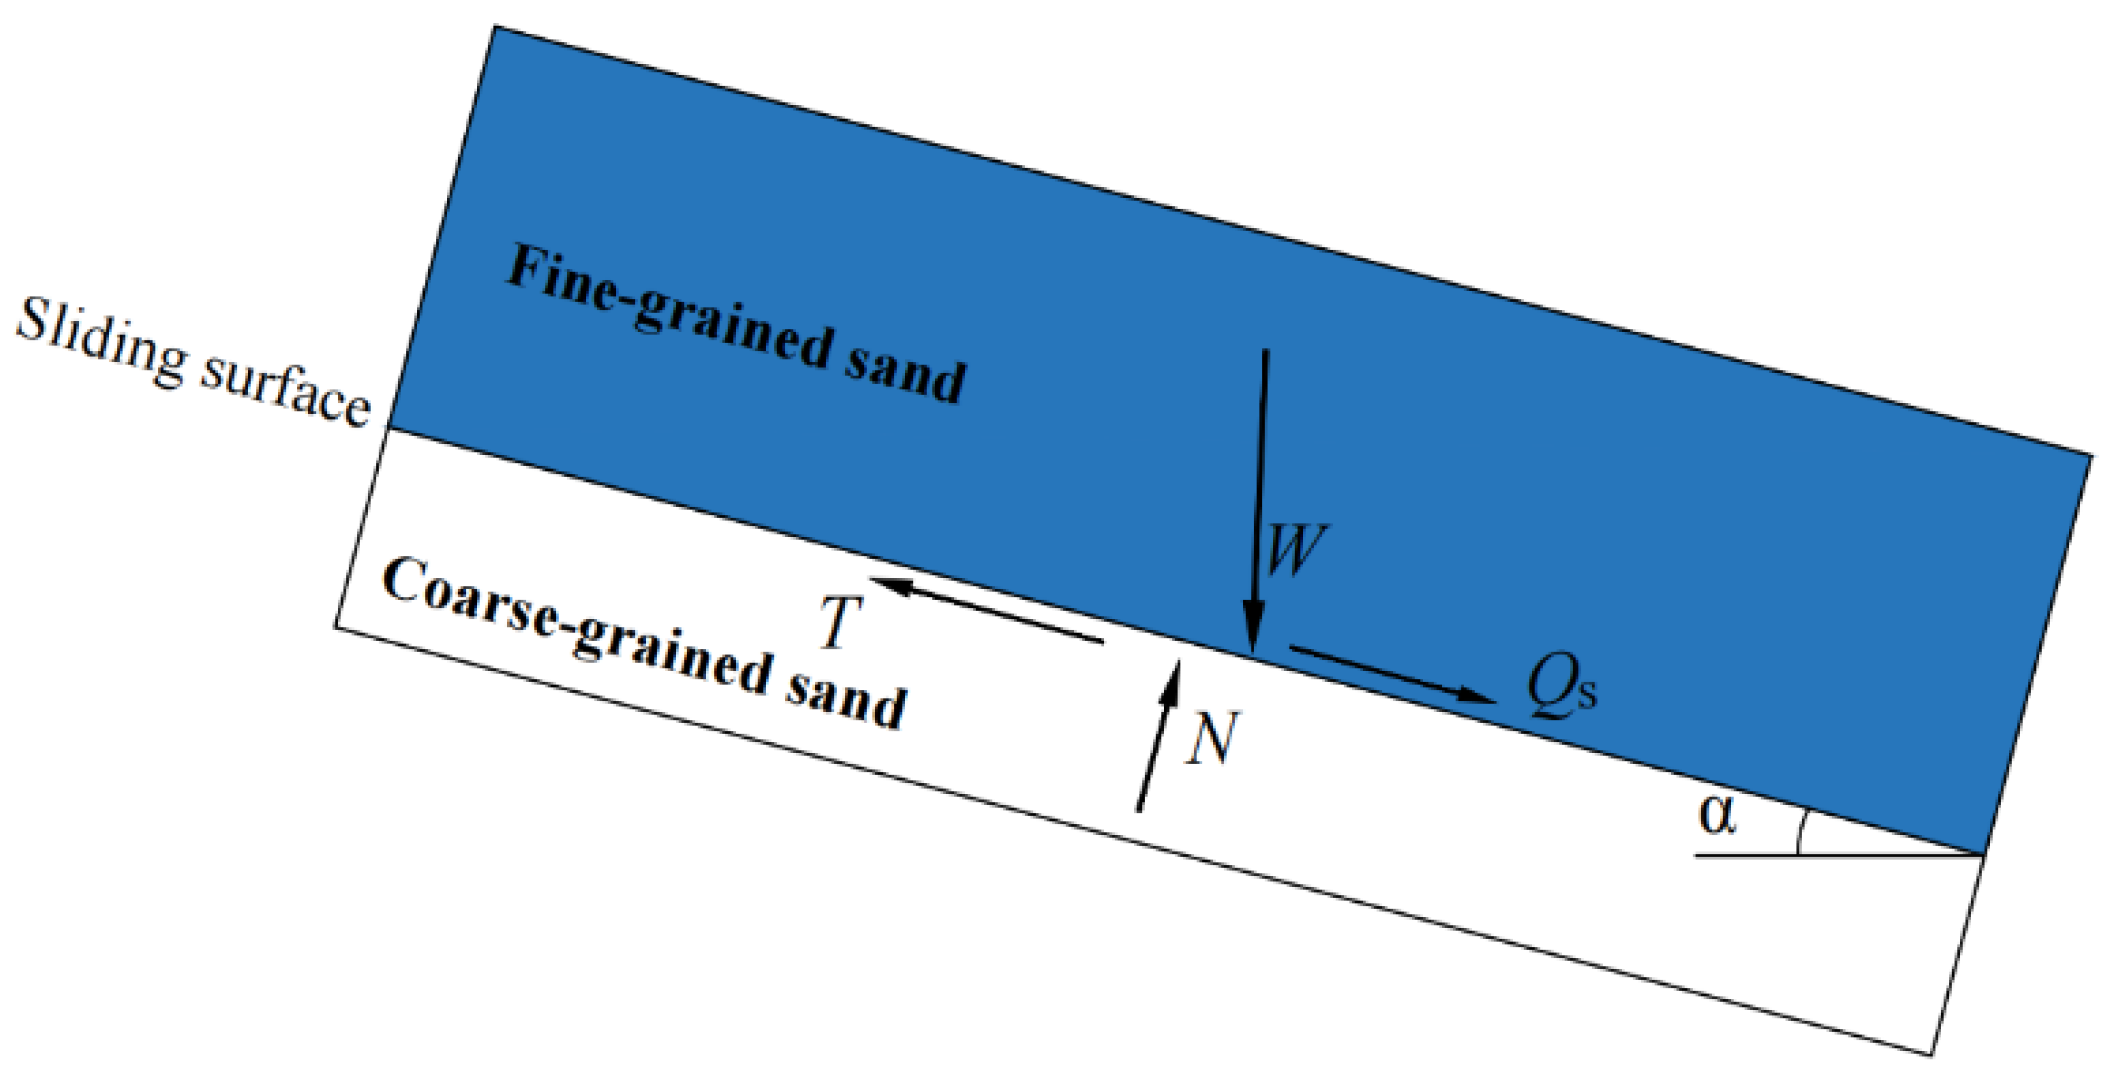
3.2. Sliding Surface at the Interface between the Fine/Coarse-Grained Soil Layers

When the breakthrough point moves to the crest of the slope, the interface between the fine/coarse-grained soil layers becomes nearly saturated and the shear strength decreases. Considering the water diversion at that time (Figure 6), the factor of safety can be calculated as:
F s = N tan φ + c L W sin α + Q s
where, Fs: the factor of safety; W: the gravity of upper zone; N: the stress at the interface (equal to Wcosα); c : the cohesion of the interface soil; L: the length of the slope; φ : the internal friction of the interface soil; α : the slope angle; Q s : the seepage force.

3.3. Sliding Surface in the Coarse-Grained Soil

For the underlying coarse-grained soil, which is unsaturated through the infiltration process, the safety factor can be calculated using the modified Mohr-coulomb failure criterion [54].
F s = c + ( σ n u a ) tan φ + ( u a u w ) tan φ b τ m
where, τ m is the shear stress at the slip surface, c is the cohesion, ( σ n u a ) is the net normal stress, ( u a u w ) is the matric suction, φ is the effective angle of friction, φ b is the angle which defines how the shear strength increases with the increase of matric suction.
Due to the unsaturated condition of the coarse-grained soil, the calculated safety factor may be higher than before when the sliding surface is in the coarse-grained soil layer. Former studies have proven that the failure of the capillary barrier covers mainly happened at the fine-grained soil layer [30,33,53]. Thus, the final safety factor of the capillary barrier covers is the lower one between these two values in this article.

4. Model Verification

4.1. Cases Study

In southern Italy, many pumices slopes were covered by the ashes caused by volcano eruptions, which caused naturally formed capillary barrier covers (Figure 7). In the last decades, many catastrophic events occurred at these slopes with the sliding of the surface ashes, arousing widespread interests among scholars [30,33,55]. To verify the availability and accuracy of the proposed method, several published physical model tests, which used the same soil materials from southern Italy, were chosen as the cases.
The experimental model in Capparelli’s article is 270 cm long and 60 cm wide, with a 10 cm thickness of pumices interbedded between two 20 cm volcanic ashes layers in the vertical direction (Figure 8). The hydraulic properties of the experimental soils were listed in Table 1. In the top layer of ashes, six tensimeters were located at the depth of 6 cm and 18.5 cm, in the upslope, middle and downslope correspondingly. The rainfall intensity is 32 mm/h in the initial 18 min and changes to 9 mm/h subsequently.
The relationship between rainfall time and infiltration depth in the fine-grained soil layer was depicted in Figure 9. Initially, the infiltration depth is consistent at the different locations of the slope, indicating the wetting front is parallel to the slope surface at the beginning state. As the rain goes on, the wetting front reached the downslope area firstly, then migrated to the upslope gradually. Using the proposed model, the migration of wetting front at the interface of fine/coarse-grained soils was depicted, which is consistent with the experiment results.
After infiltration analysis, three actual landslides in southern Italy (Figure 10) were used to verify the availability of the proposed stability analysis method [57]. The main physical and mechanical properties of the soils were shown in the Table 2.
Figure 11 shows the relationships between rainfall time and safety factor for the three slopes. Generally speaking, the safety factor decreases with the rainfall continues. For slope one, the safety factor was lower than 1 after only 3 h of rainfall. The main reason of this phenomenon is the steep angle of slope one, which is nearly 45°. Due to the low cohesion of surface fine-grained soil, the safety factor is significantly influenced by the slope angle. For slope two and three, the slope instability occurred after almost 6 h of rainfall. At that time, the wetting front reached the interface between the two layers, causing the sharp decrease of the slope stability. Calculation results showed that the safety factors of the slopes were all lower than 1 (Table 3), indicating that these slopes were unstable. As a matter of fact, the slopes slid and caused heavy damages. For artificial capillary barrier covers, it is recommended to construct at the slope angle ranging from 10 to 30 degrees.
Another natural capillary barrier slope in Pizzo d’Alvano massif, Italy (Figure 12) is chosen to further verify the method [58]. Five months monitoring data of rainfall have been collected in that region. The mechanical properties of the soil are listed in Table 4.
Figure 13 shows the monitoring rainfall data at the Pizzo d’Alvano massif and the calculated safety factors correspondingly. It is obvious that the precipitation is relatively less from January to April. At that time, the capillary barrier slope kept stable since the safety factor is always larger than one. In May, the rainfall frequency and rainfall amount increase. At the end of the May, for more than 80 mm rainfall in one day, the capillary barrier slope is unstable. In fact, the landslide happened at the May for this slope. The proposed method is proven to be accurate in the calculation of safety factor for capillary barrier covers. It is worth noting that the long-term rainfall will shed significant negative effect on the stability of capillary barrier covers, since the infiltrated water cannot effectively evaporate from the fine-grained layer.

4.2. Further Analysis

To further verify the proposed model, another capillary barrier cover in the published article was used as the illustration [35]. The length of the analyzed slope is 10 m with 0.5 m upper silt layer and 35° slope angle. Basic properties of the soils used in this study were shown in Table 5 and Table 6.
In the whole process, the rainfall intensity is higher than the infiltration capacity of the upper silt. Using the proposed method, the relationship between the factor of safety and the rainfall hours is calculated and shown as follows:
As shown in Figure 14, the factor of safety decreases with the rainfall goes on. When the infiltration time is less than 40 h, the similar safety factor of the slope is calculated through the proposed method and the method in [35]. Subsequently, the wetting front reaches the interface of fine/coarse-grained soils. Due to the capillary barrier effect, the vertical infiltration is blocked, and water starts to migrate laterally. At that time, the safety factor calculated by the proposed method tends to be lower than the result of Cho’s method. In the proposed method, the wetting front profile is assumed to be the parabolic shape and migrates from the downslope towards the upslope. Meanwhile, the seepage force caused by the water diversion is taken into considered. In contrast, in Cho’s model, the seepage force is neglected, and the wetting front profile is assumed to be parallel to the slope surface all the time. Former studies have proven the migration of wetting front and the water diversion at the interface between fine/coarse-grained soil layers [33,55]. It is more reasonable to consider the influence of seepage force and wetting front migration in the stability analysis of capillary barrier covers.
The relationship between the thickness of the fine-grained soil layer and factor of safety was also analyzed (Figure 15). Initially, the stability of the fine-grained layer is the same for different thicknesses. As the rainfall goes on, the infiltrated water reaches the interface between fine/coarse-grained soils and starts to migrate laterally, resulting in the decrease of safety factor. The thinner of the fine-grained layer, the faster of the infiltrated water reaches the interface. In the case of short rainfall durations, it is reasonable to thicken the fine-grained layer in order to improve the stability of capillary barrier cover. However, if the rainfall lasts long enough, the calculated results show that the final safety factor of the fine-grained soil layer decreases with the thickness increases.

5. Conclusions

In this study, a stability analysis method considering the water redistribution and seepage forces of the capillary barrier covers was established based on the Green-Ampt model and Janbu method. The proposed method was verified and analyzed by the examples in the published articles.
Different from the infiltration process of homogeneous soil slopes, the infiltrated water is stored and diverted laterally because of the differences in the hydraulic conductivity of fine/coarse grained soils. When the water reached the interface of fine/coarse grained soils, it didn’t infiltrate downwards continuously, but diverted laterally towards the toe of the slope. Based on the law of conservation of mass, the wetting front profile was depicted as parabolic function in the method proposed. Next, as the infiltration goes on, the wetting front moves towards the crest of the slope. Compared with the traditional Green-Ampt model, the proposed model in this article is more consistent with the experimental results of the capillary barrier covers. Additionally, the influence of the seepage force is considered in the proposed method, which makes the stability analysis more accurate.
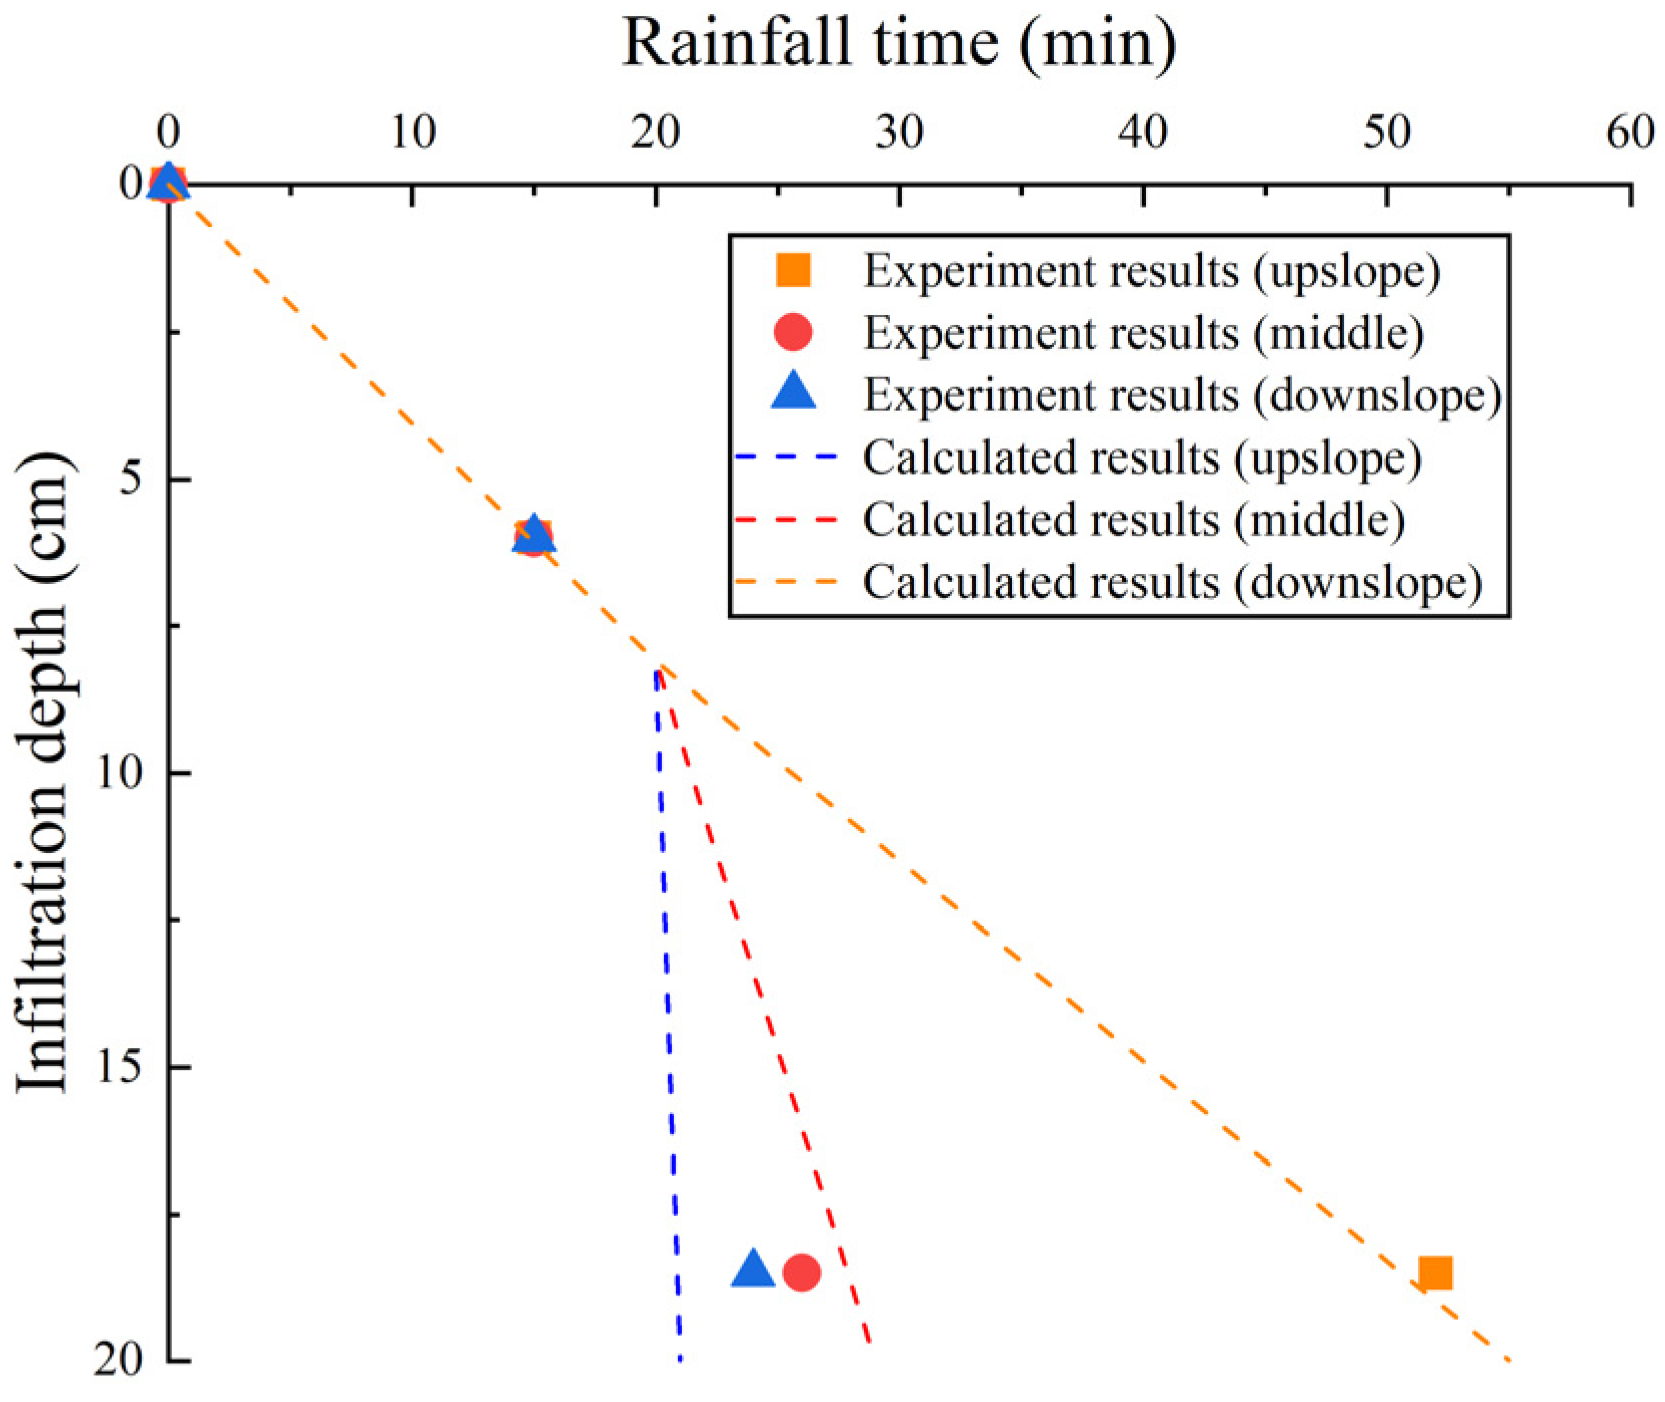
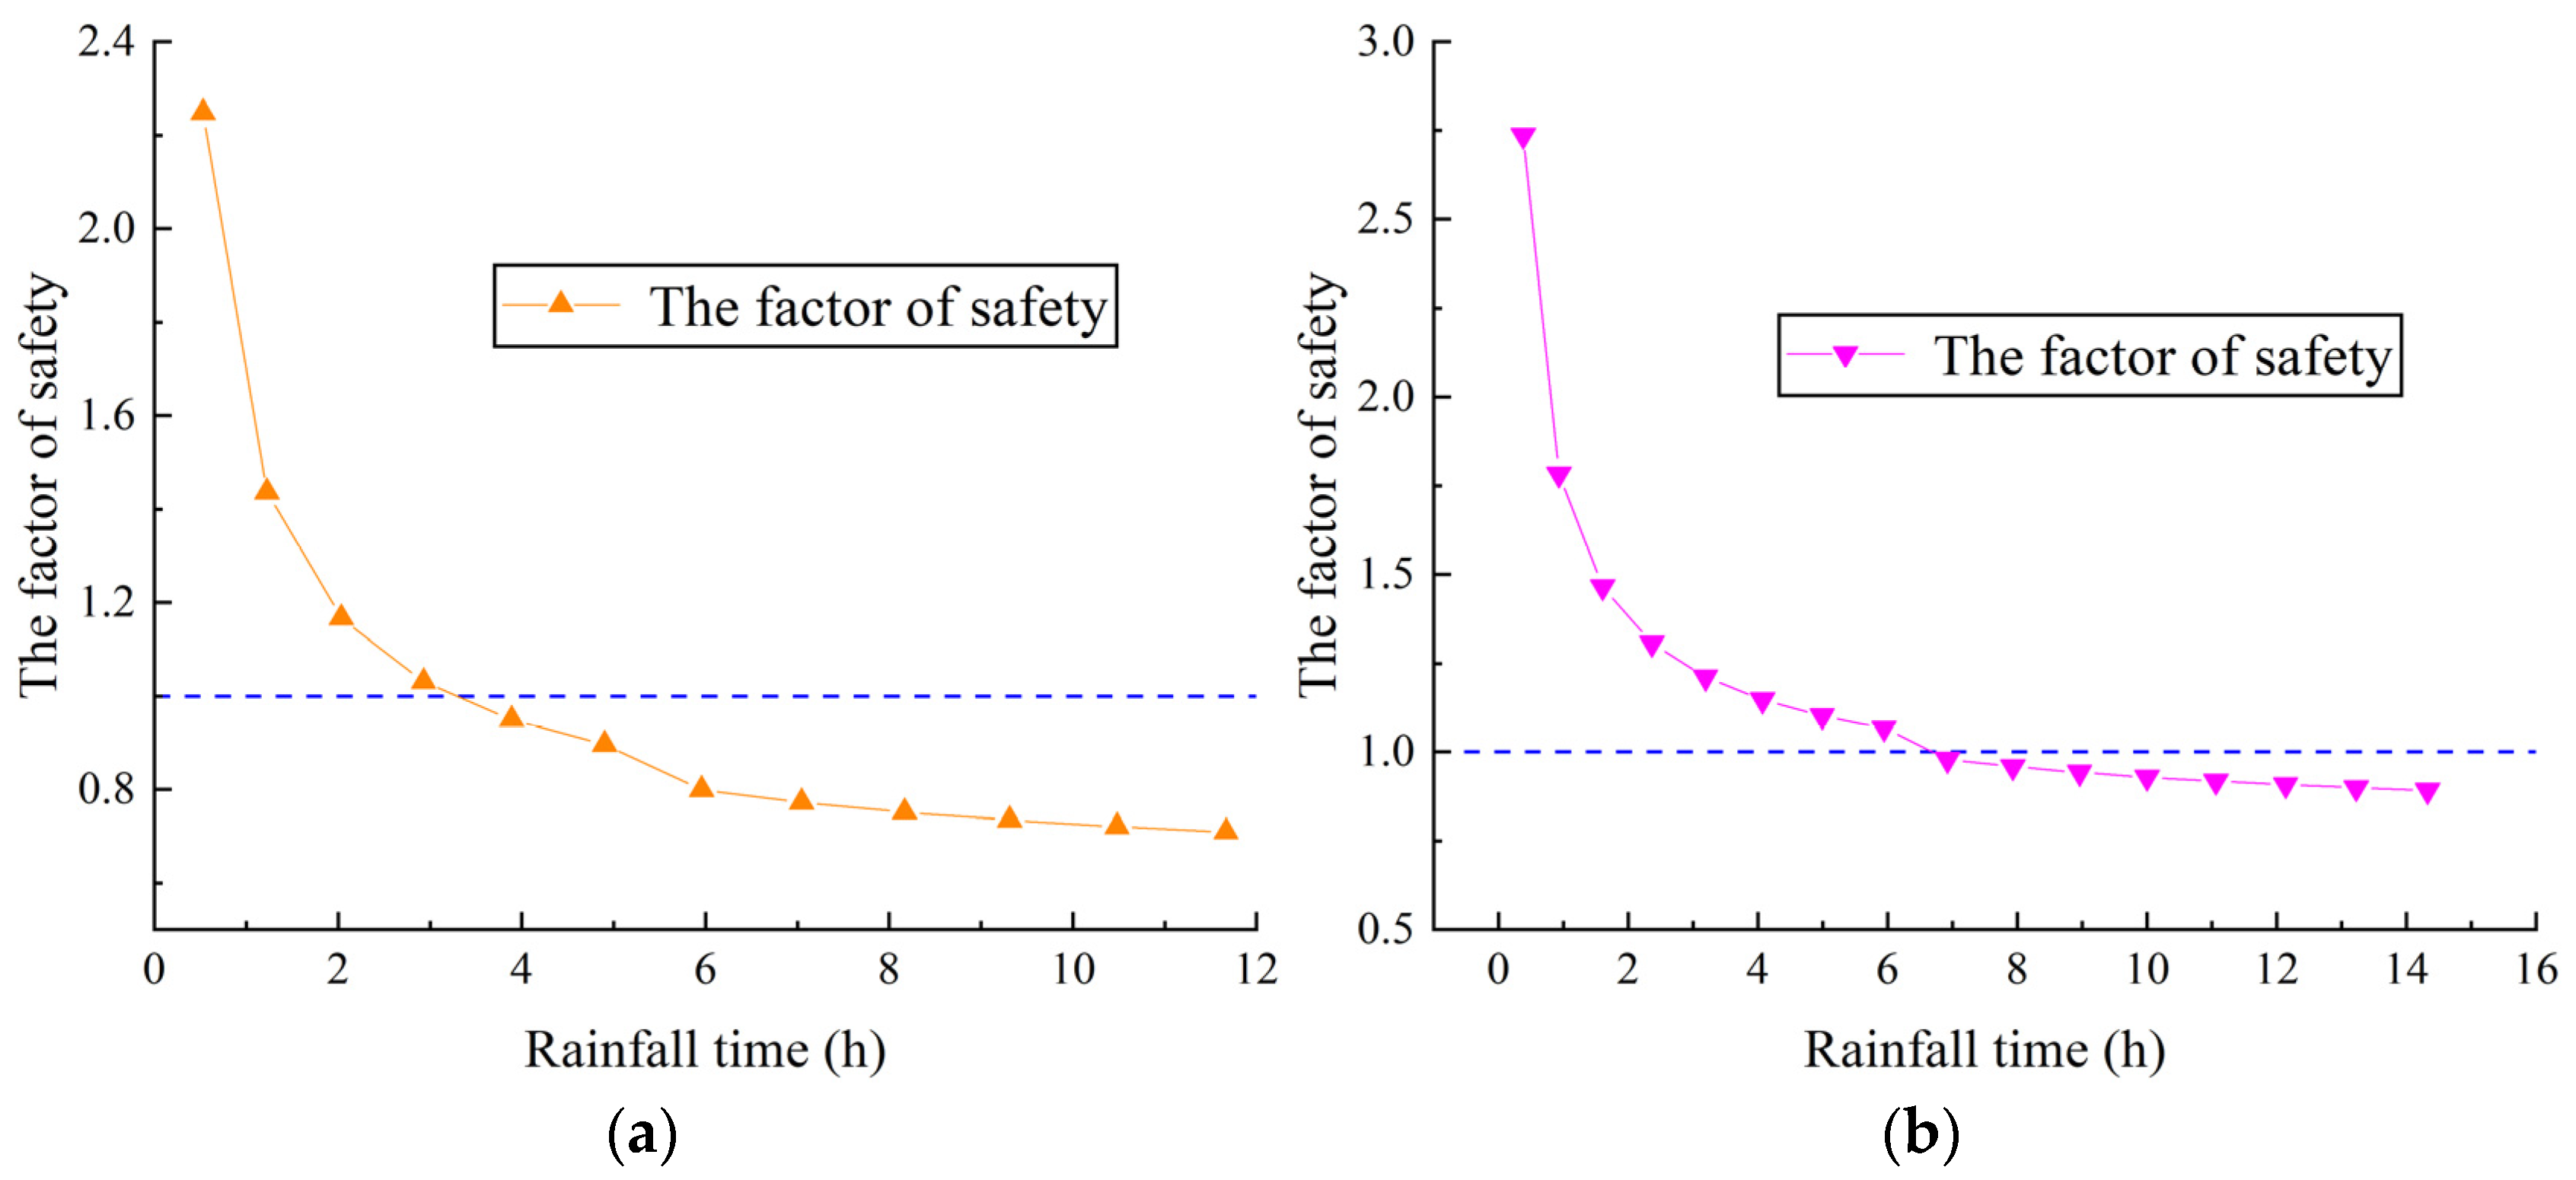
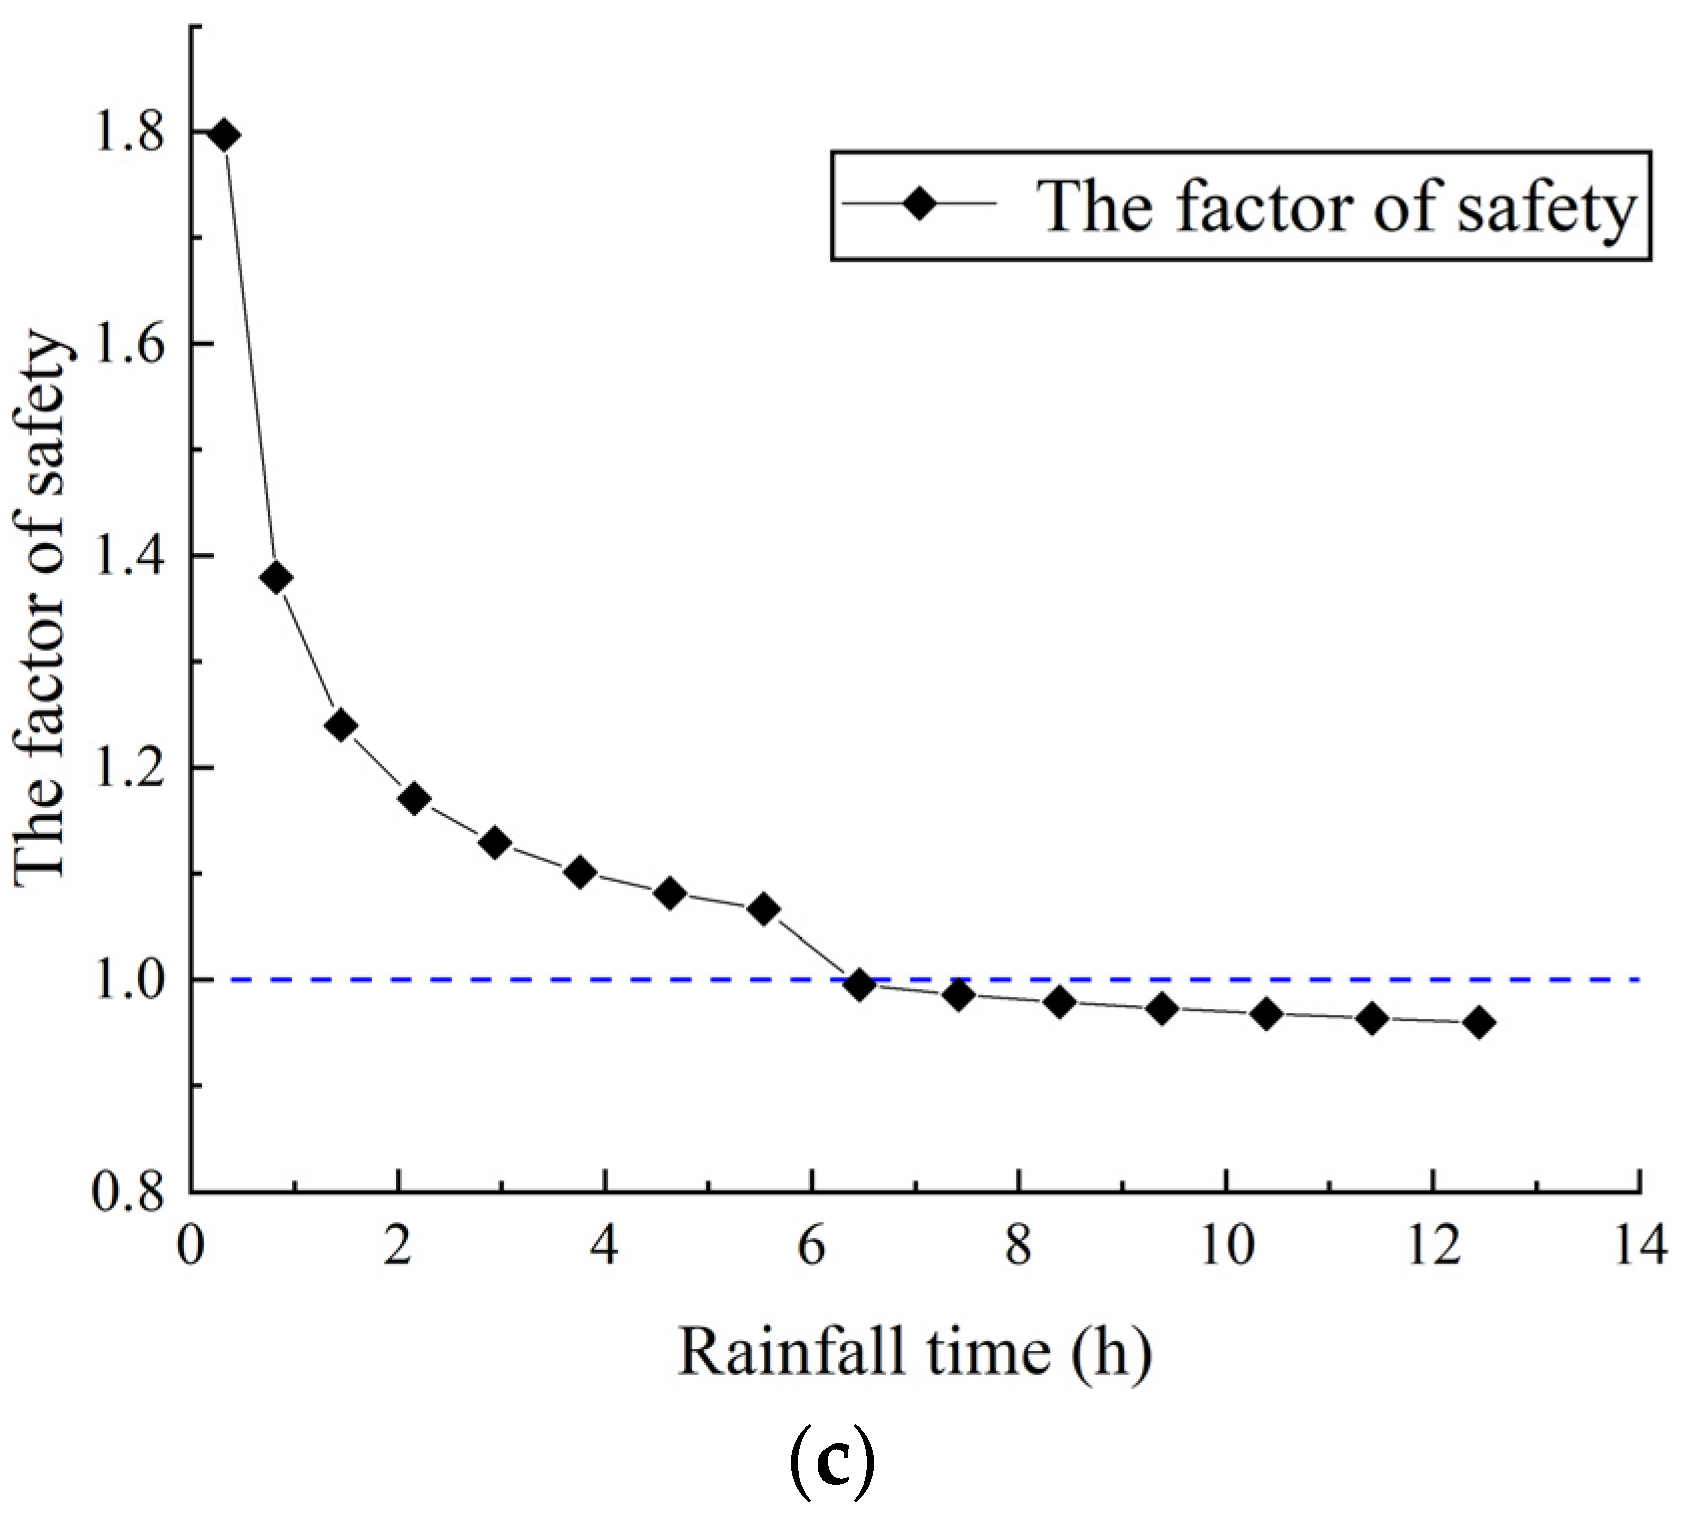
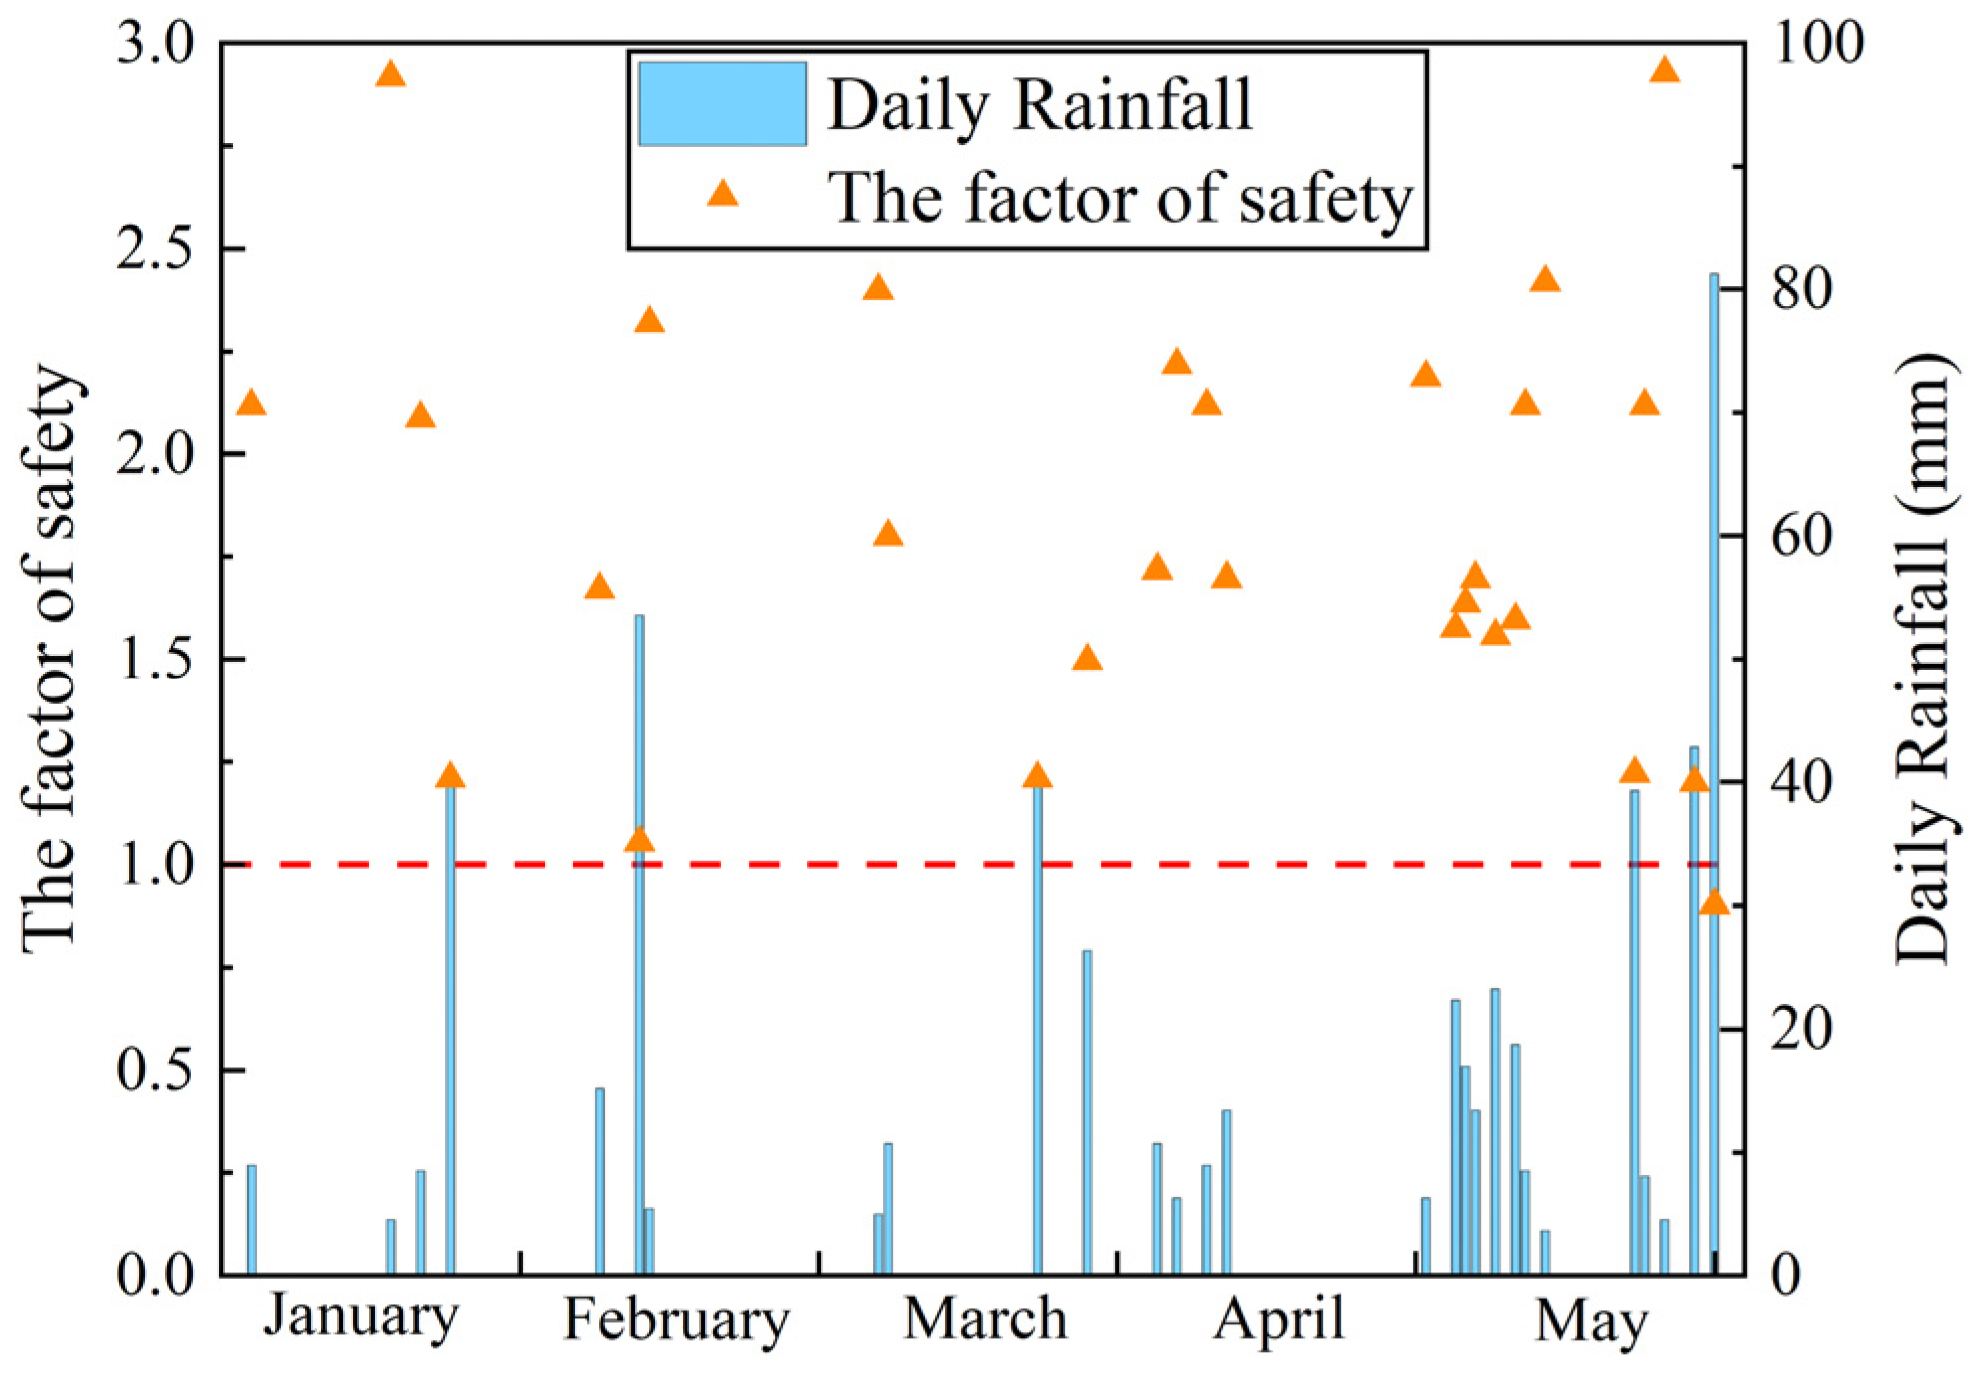
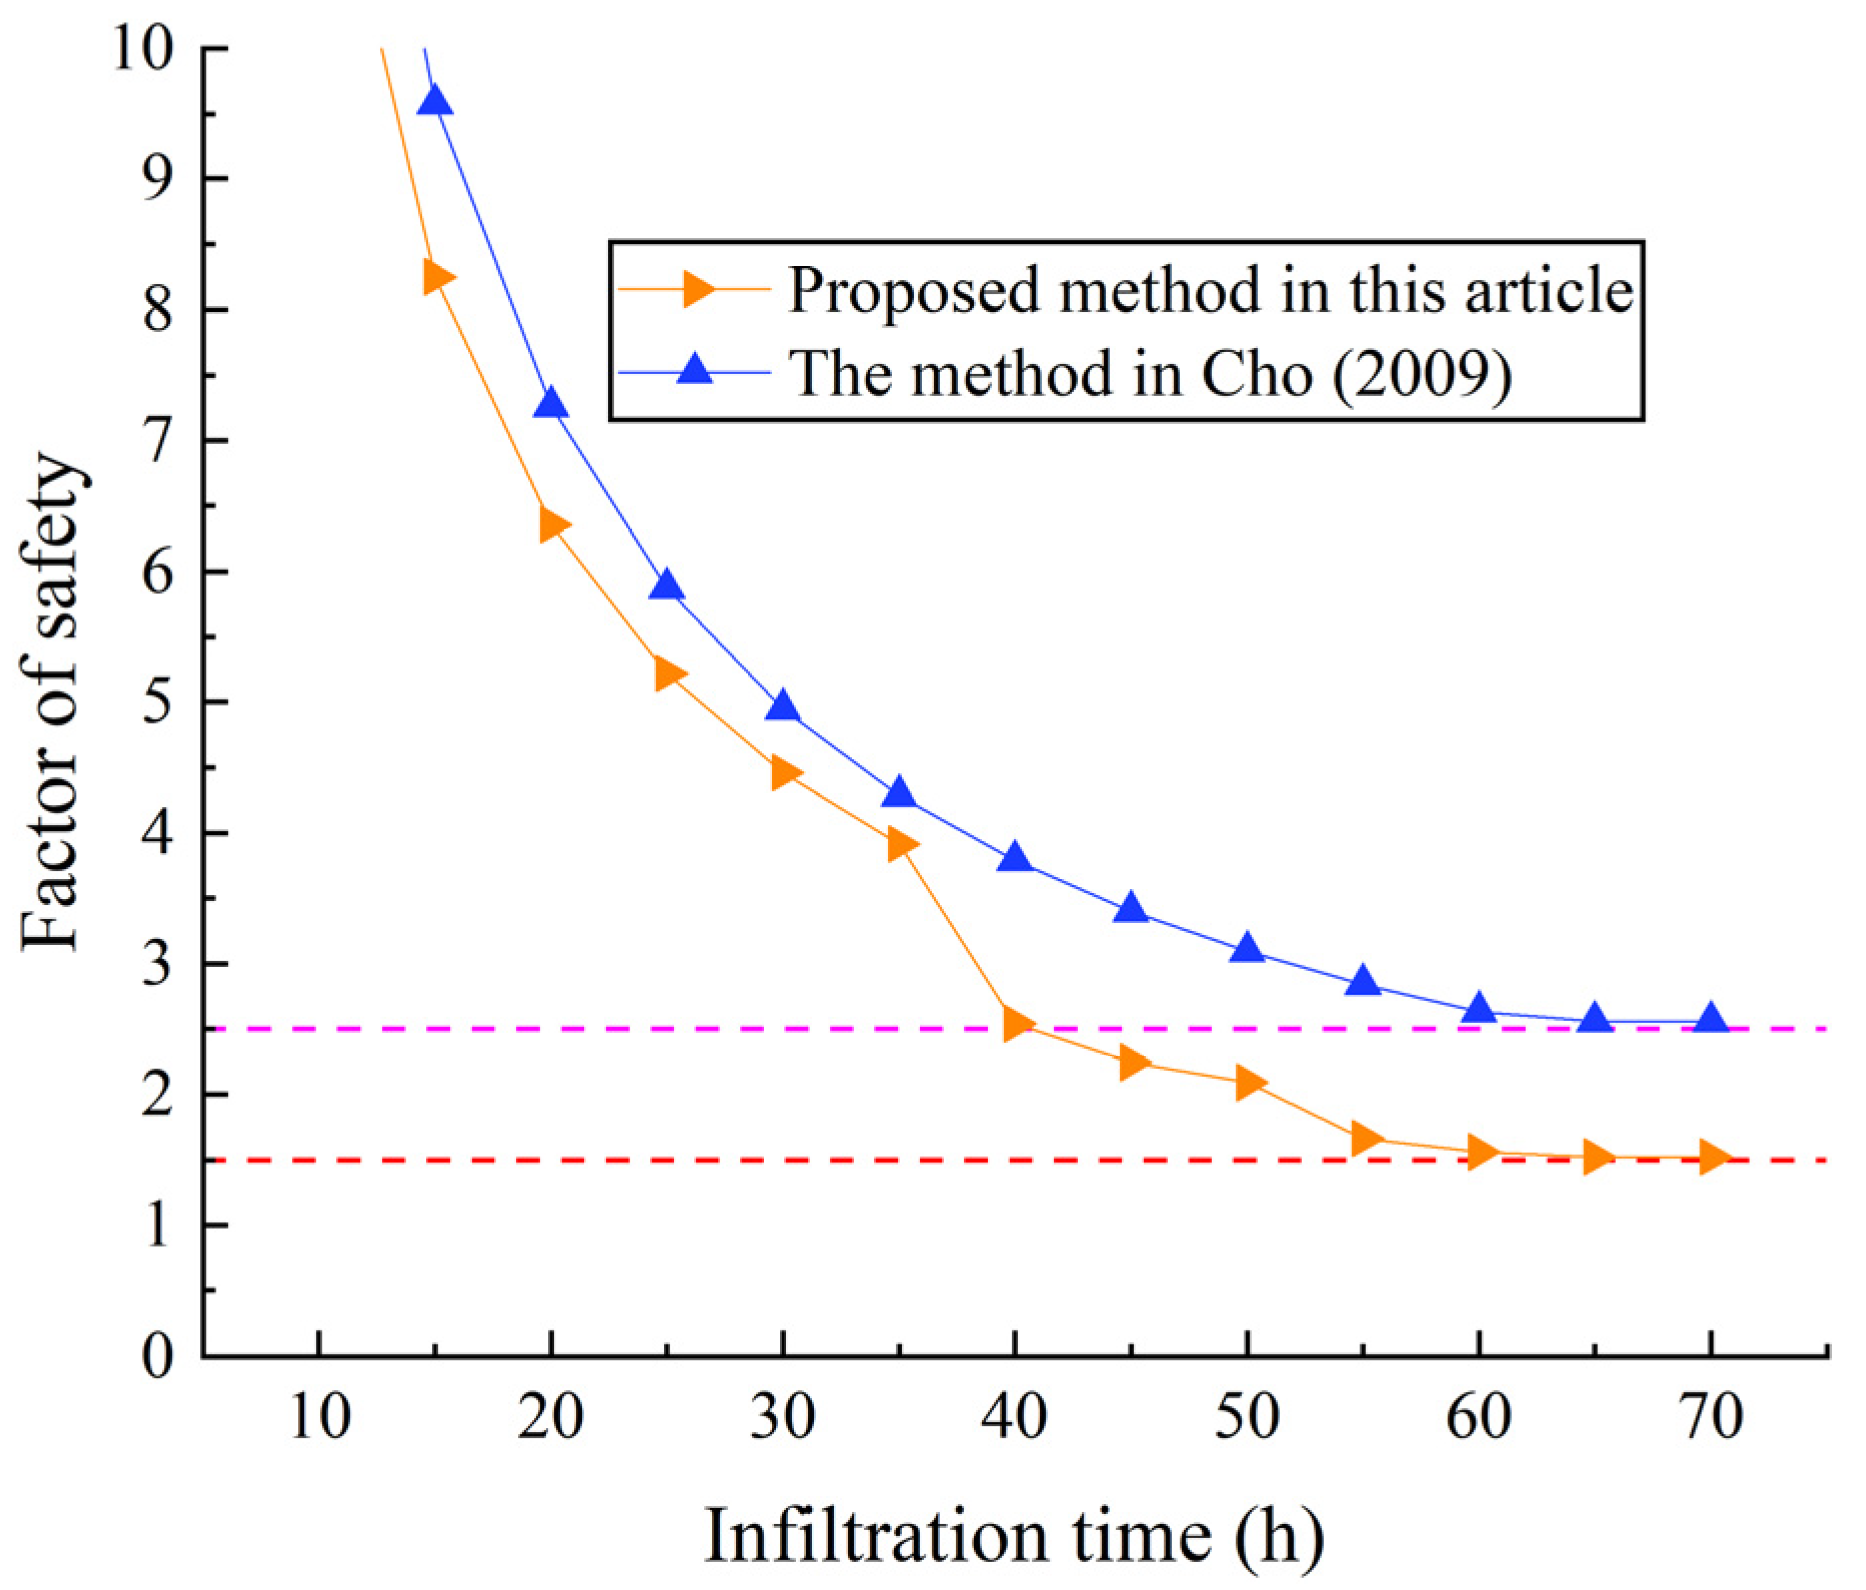
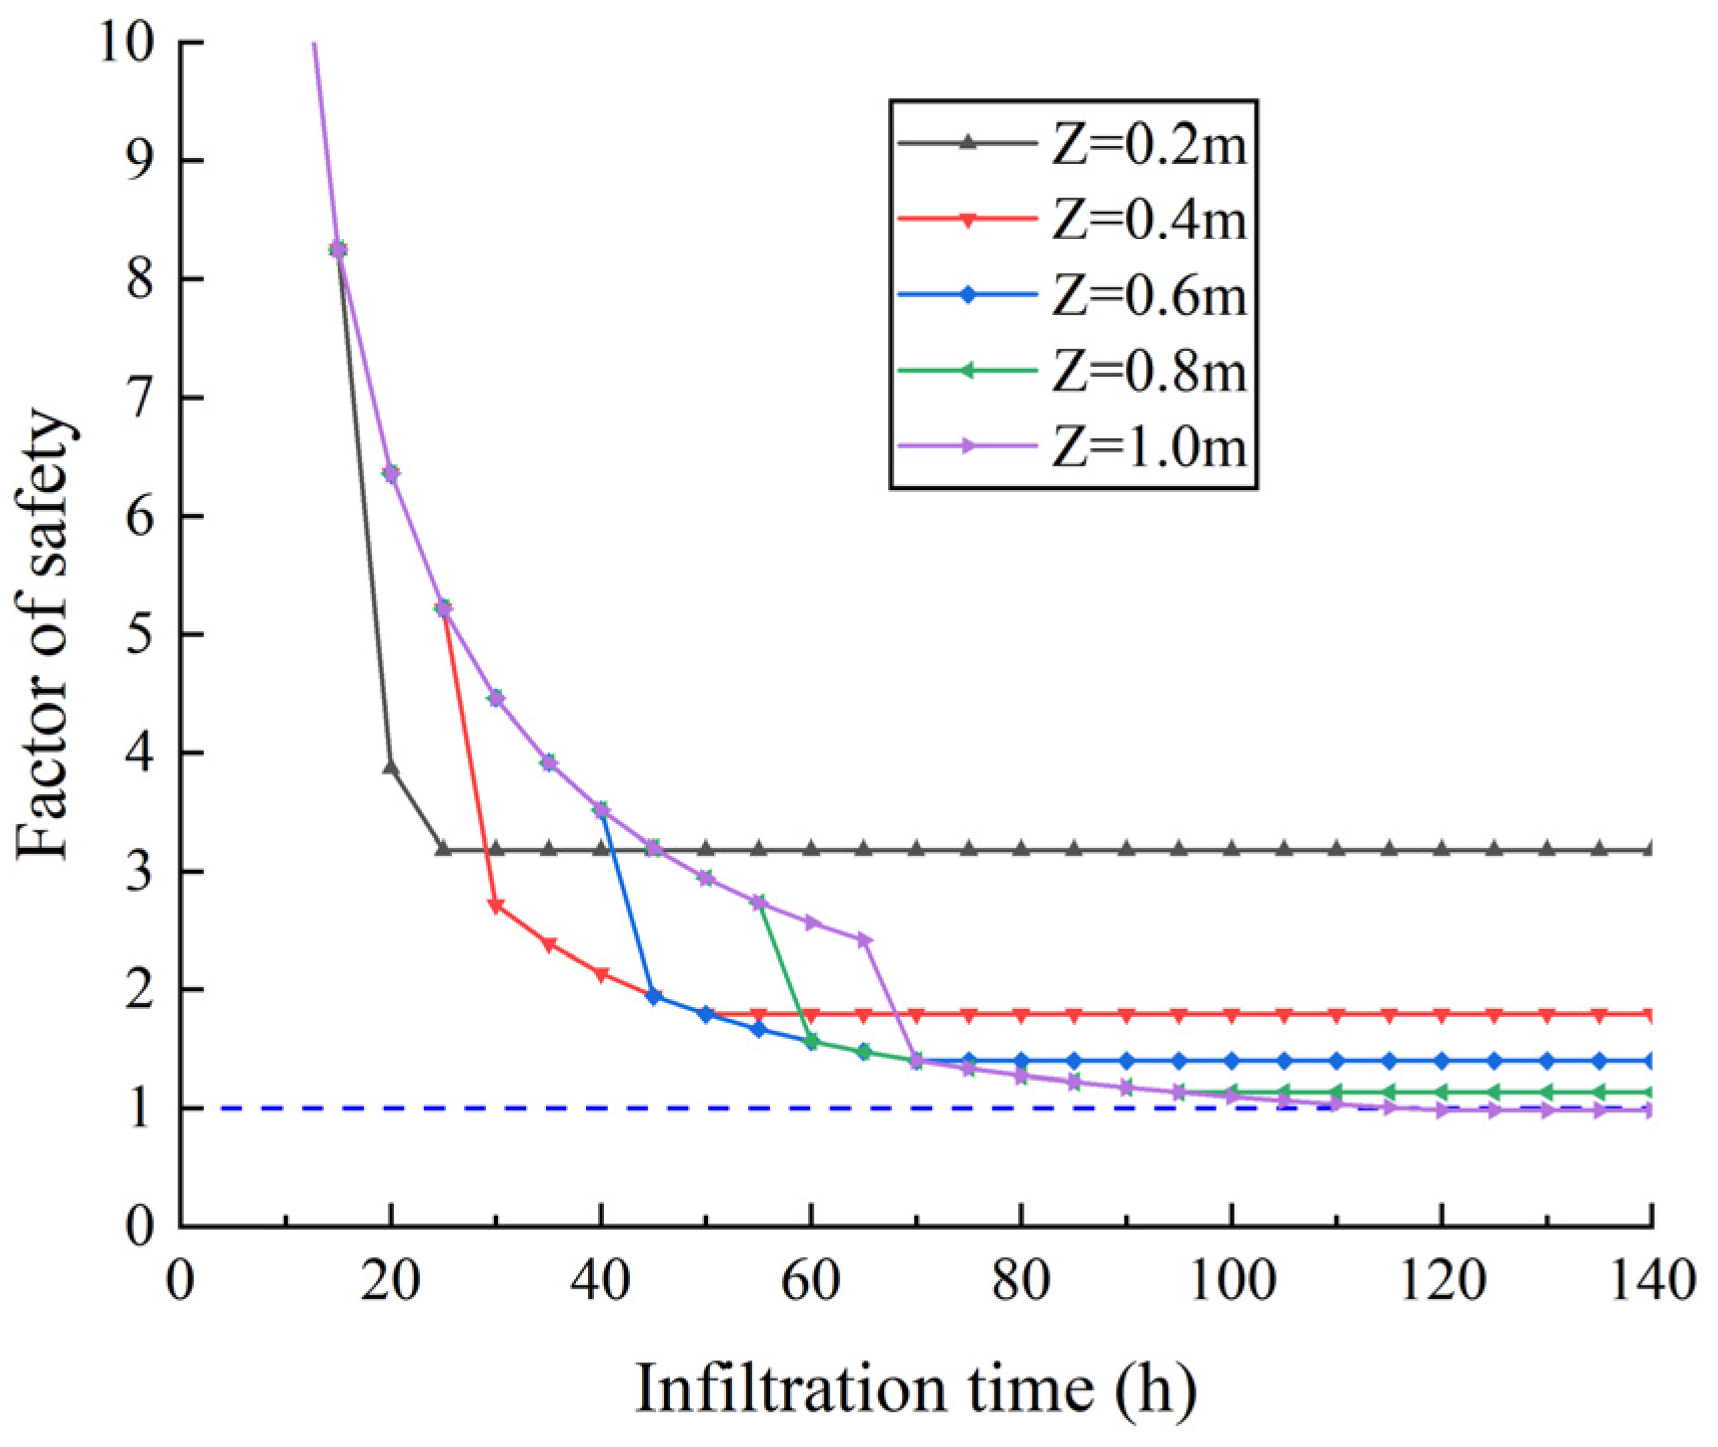
Using the examples in the published articles, the availability of the proposed method was verified. By calculating the relationship between infiltration time and safety factor, the results of the proposed method were close to the existing method at the initial stage of water infiltration. Subsequently, the diversion and redistribution of the infiltrated water caused the decreasing of safety factor. The safety factor calculated by the proposed method is lower than the published one due to the influence of seepage force. Additionally, the safety factors under different thickness of fine-grained soil were calculated. Results showed that the stability of capillary barrier covers is closed related to local climate. When the rainfall duration is short, increasing the thickness of fine-grained soil layer reasonably can improve the stability. Otherwise, the final safety factor of capillary barrier covers decreases with the thickness of fine-grained soil increases under enough long duration of rainfall.
Although the proposed method shows satisfying results, there are some simplifications in it. The spatial distribution of water is simplified as linear distribution and the wetting front shape is depicted as the parabolic function in this study. In addition, the preferential seepage in the fine-grained soil is also needed further study.

Author Contributions

All authors contributed to the study conception and design. Material preparation, data collection and analysis were performed by C.G., Y.Z. (Yueming Zhu) and Y.Z. (Yawei Zhang). The first draft of the manuscript was written by C.G. and all authors commented on previous versions of the manuscript. All authors have read and agreed to the published version of the manuscript.

Funding

This research was funded by the National Key Research and Development Project (2019YFC1509900).

Institutional Review Board Statement

Not applicable.

Informed Consent Statement

Not applicable.

Data Availability Statement

Data is contained within the article.

Conflicts of Interest

The authors declare no conflict of interest.

References

  1. Ye, Z.H.; Wong, J.W.C.; Wong, M.H.; Baker, A.J.M.; Shu, W.S.; Lan, C.Y. Revegetation of Pb/Zn mine tailings, Guangdong Province, China. Restor. Ecol. 2000, 8, 87–92. [Google Scholar] [CrossRef]
  2. Hey, C.; Simms, P. Preliminary assessment of biosolids in covers with capillary barrier effects. Eng. Geol. 2021, 280, 105973. [Google Scholar] [CrossRef]
  3. Banar, M.; Guney, Y.; Ozkan, A.; Gunkaya, Z.; Bayrakci, E.; Ulutas, D. Utilization of Waste Clay from Boron Production in Bituminous Geosynthetic Barrier (GBR-B) Production as Landfill Liner. Int. J. Polym. Sci. 2016, 2016, 1648920. [Google Scholar] [CrossRef]
  4. Suzuki, K.; Anegawa, A.; Endo, K.; Yamada, M.; Ono, Y.; Ono, Y. Performance evaluation of intermediate cover soil barrier for removal of heavy metals in landfill leachate. Chemosphere 2008, 73, 1428–1435. [Google Scholar] [CrossRef] [PubMed]
  5. Aguiar, L.A.; Melo, P.; Alvim, A.C.M. Failure probability evaluation of a near-surface radioactive waste repository due to water infiltration. Nucl. Technol. 2013, 183, 228–247. [Google Scholar] [CrossRef]
  6. Adinarayana, K.N.V.; Sasidhar, P.; Balasubramaniyan, V. Modelling of calcium leaching and its influence on radionuclide migration across the concrete engineered barrier in a NSDF. J. Environ. Radioact. 2013, 124, 93–100. [Google Scholar] [CrossRef]
  7. Fayer, M.J.; Gee, G.W. Multiple-year water balance of soil covers in a semiarid setting. J. Environ. Qual. 2006, 35, 366–377. [Google Scholar] [CrossRef]
  8. Choi, Y.; Choo, H.; Yun, T.S.; Lee, C.; Lee, W. Engineering Characteristics of Chemically Treated Water-Repellent Kaolin. Materials 2016, 9, 978. [Google Scholar] [CrossRef]
  9. Filice, S.; Bongiorno, C.; Libertino, S.; Compagnini, G.; Gradon, L.; Iannazzo, D.; La Magna, A.; Scalese, S. Structural Characterization and Adsorption Properties of Dunino Raw Halloysite Mineral for Dye Removal from Water. Materials 2021, 14, 3676. [Google Scholar] [CrossRef]
  10. Bouazza, A.; Rahman, F. Oxygen diffusion through partially hydrated geosynthetic clay liners. Géotechnique 2007, 57, 767–772. [Google Scholar] [CrossRef]
  11. Shan, H.Y.; Yao, J.T. Measurement of air permeability of geosynthetic clay liners. Geotext. Geomembr. 2000, 18, 251–261. [Google Scholar] [CrossRef]
  12. Benson, C.; Abichou, T.; Albright, W.; Gee, G.; Roesler, A. Field Evaluation of Alternative Earthen Final Covers. Int. J. Phytoremediation 2001, 3, 105–127. [Google Scholar] [CrossRef]
  13. Apiwantragoon, P.; Benson, C.H.; Albright, W.H. Field Hydrology of Water Balance Covers for Waste Containment. J. Geotech. Geoenviron. Eng. 2015, 141, 04014101. [Google Scholar] [CrossRef]
  14. Lu, H.J.; Li, J.X.; Wang, W.W.; Wang, C.H. Cracking and water seepage of Xiashu loess used as landfill cover under wetting-drying cycles. Environ. Earth Sci. 2015, 74, 7441–7450. [Google Scholar] [CrossRef]
  15. Melchior, S.; Sokollek, V.; Berger, K.; Vielhaber, B.; Steinert, B. Results from 18 Years of In Situ Performance Testing of Landfill Cover Systems in Germany. J. Environ. Eng. 2010, 136, 815–823. [Google Scholar] [CrossRef]
  16. Holly, M.A.; Larson, R.A. Thermochemical Conversion of Biomass Storage Covers to Reduce Ammonia Emissions from Dairy Manure. Water Air Soil Pollut. 2017, 228, 434. [Google Scholar] [CrossRef]
  17. Bierwagen, B.G.; Theobald, D.M.; Pyke, C.R.; Choate, A.; Groth, P.; Thomas, J.V.; Morefield, P. National housing and impervious surface scenarios for integrated climate impact assessments. Proc. Natl. Acad. Sci. USA 2010, 107, 20887–20892. [Google Scholar] [CrossRef]
  18. Benson, C.H.; Bosscher, P.J.; Lane, D.T.; Pliska, R.J. Monitoring-system for hydrologic evaluation of landfill covers. Geotech. Test. J. 1994, 17, 138–149. [Google Scholar]
  19. Abichou, T.; Liu, X.L.; Tawfiq, K. Design considerations for lysimeters used to evaluate alternative earthen final covers. J. Geotech. Geoenviron. Eng. 2006, 132, 1519–1525. [Google Scholar] [CrossRef]
  20. Ng, C.W.W.; Liu, J.; Chen, R.; Xu, J. Physical and numerical modeling of an inclined three-layer (silt/gravelly sand/clay) capillary barrier cover system under extreme rainfall. Waste Manag. 2015, 38, 210–221. [Google Scholar] [CrossRef]
  21. Kampf, M.; Montenegro, H. On the performance of capillary barriers as landfill cover. Hydrol. Earth Syst. Sci. 1997, 1, 925–929. [Google Scholar] [CrossRef]
  22. Zhan, L.T.; Li, G.Y.; Jiao, W.G.; Lan, J.W.; Chen, Y.M.; Shi, W. Performance of a compacted loess/gravel cover as a capillary barrier and landfill gas emissions controller in Northwest China. Sci. Total Environ. 2020, 718, 137195. [Google Scholar] [CrossRef] [PubMed]
  23. Tami, D.; Rahardjo, H.; Leong, E.C.; Fredlund, D.G. A physical model for sloping capillary barriers. Geotech. Test. J. 2004, 27, 173–183. [Google Scholar]
  24. Yang, H.; Rahardjo, H.; Leong, E.C.; Fredlund, D.G. A study of infiltration on three sand capillary barriers. Can. Geotech. J. 2004, 41, 629–643. [Google Scholar] [CrossRef]
  25. Rahardjo, H.; Santoso, V.A.; Leong, E.C.; Ng, Y.S.; Hua, C.J. Performance of an Instrumented Slope Covered by a Capillary Barrier System. J. Geotech. Geoenviron. Eng. 2012, 138, 481–490. [Google Scholar] [CrossRef]
  26. Qian, T.W.; Huo, L.J.; Zhao, D.Y. Laboratory Investigation into Factors Affecting Performance of Capillary Barrier System in Unsaturated Soil. Water Air Soil Pollut. 2010, 206, 295–306. [Google Scholar] [CrossRef]
  27. Kampf, M.; Holfelder, T.; Montenegro, H. Identification and parameterization of flow processes in artificial capillary barriers. Water Resour. Res. 2003, 39, 1276. [Google Scholar] [CrossRef]
  28. Zhang, Z.F. Evaluating the long-term hydrology of an evapotranspiration-capillary barrier with a 1000 year design life. Water Resour. Res. 2016, 52, 4883–4904. [Google Scholar] [CrossRef]
  29. Juca, J.F.T.; Norberto, A.D.; do Santos, J.I.; Marinho, F.A.M. Brasilia municipal solid waste landfill: A case study on flow and slope stability. Soils Rocks 2021, 44. [Google Scholar] [CrossRef]
  30. Mancarella, D.; Doglioni, A.; Simeone, V. On capillary barrier effects and debris slide triggering in unsaturated layered covers. Eng. Geol. 2012, 147, 14–27. [Google Scholar] [CrossRef]
  31. Crosta, G.B.; Dal Negro, P. Observations and modelling of soil slip-debris flow initiation processes in pyroclastic deposits: The Sarno 1998 event. Nat. Hazards Earth Syst. Sci. 2003, 3, 53–69. [Google Scholar] [CrossRef]
  32. Cascini, L.; Cuomo, S.; Guida, D. Typical source areas of May 1998 flow-like mass movements in the Campania region, Southern Italy. Eng. Geol. 2008, 96, 107–125. [Google Scholar] [CrossRef]
  33. Damiano, E.; Greco, R.; Guida, A.; Olivares, L.; Picarelli, L. Investigation on rainwater infiltration into layered shallow covers in pyroclastic soils and its effect on slope stability. Eng. Geol. 2017, 220, 208–218. [Google Scholar] [CrossRef]
  34. Guadagno, F.M.; Forte, R.; Revellino, P.; Fiorillo, F.; Focareta, M. Some aspects of the initiation of debris avalanches in the Campania Region: The role of morphological slope discontinuities and the development of failure. Geomorphology 2005, 66, 237–254. [Google Scholar] [CrossRef]
  35. Cho, S.E. Infiltration analysis to evaluate the surficial stability of two-layered slopes considering rainfall characteristics. Eng. Geol. 2009, 105, 32–43. [Google Scholar] [CrossRef]
  36. Xiong, S.; Yao, W.M.; Li, C.D. Stability evaluation of multilayer slopes considering runoff in the saturated zone under rainfall. Eur. J. Environ. Civ. Eng. 2019, 25, 1718–1732. [Google Scholar] [CrossRef]
  37. Philip, J.R. Hillslope infiltration: Planar slopes. Water Resour. Res. 1991, 27, 109–117. [Google Scholar] [CrossRef]
  38. Iverson, R.M. Landslide triggering by rain infiltration. Water Resour. Res. 2000, 36, 1897–1910. [Google Scholar] [CrossRef]
  39. Green, W.H.; Ampt, C.A. Studies of soil physics I. The flow of air and water through soils. J. Agric. Sci. 1911, 4, 11–24. [Google Scholar]
  40. Liu, G.X.; Craig, J.R.; Soulis, E.D. Applicability of the Green-Ampt Infiltration Model with Shallow Boundary Conditions. J. Hydrol. Eng. 2011, 16, 266–273. [Google Scholar] [CrossRef]
  41. Lee, S.; Chu, M.L.; Schmidt, A.R. Effective Green-Ampt Parameters for Two-Layered Soils. J. Hydrol. Eng. 2020, 25. [Google Scholar] [CrossRef]
  42. Chen, R.; Liu, J.; Ng, C.W.W.; Chen, Z.K. Influence of Slope Angle on Water Flow in a Three-Layer Capillary Barrier Soil Cover under Heavy Rainfall. Soil Sci. Soc. Am. J. 2019, 83, 1637–1647. [Google Scholar] [CrossRef]
  43. Mailapalli, D.R.; Raghuwanshi, N.S.; Singh, R. Physically Based Model for Simulating Flow in Furrow Irrigation. II: Model Evaluation. J. Irrig. Drain. Eng. 2009, 135, 747–754. [Google Scholar] [CrossRef]
  44. Clapp, R.B.; Hornberger, G.M. Empirical equations for some soil hydraulic-properties. Water Resour. Res. 1978, 14, 601–604. [Google Scholar] [CrossRef]
  45. Azarafza, M.; Akgun, H.; Ghazifard, A.; Asghari-Kaljahi, E.; Rahnamarad, J.; Derakhshani, R. Discontinuous rock slope stability analysis by limit equilibrium approaches—A review. Int. J. Digit. Earth. 2021, 14, 1918–1941. [Google Scholar] [CrossRef]
  46. Nilsen, B. Rock slope stability analysis according to Eurocode 7, discussion of some dilemmas with particular focus on limit equilibrium analysis. Bull. Eng. Geol. Environ. 2017, 76, 1229–1236. [Google Scholar] [CrossRef]
  47. Guan, Y.P.; Liu, X.L.; Wang, E.Z.; Wang, S.J. The Stability Analysis Method of the Cohesive Granular Slope on the Basis of Graph Theory. Materials 2017, 10, 240. [Google Scholar] [CrossRef] [PubMed]
  48. Deng, D.P.; Zhao, L.H.; Li, L. Limit equilibrium slope stability analysis using the nonlinear strength failure criterion. Can. Geotech. J. 2015, 52, 563–576. [Google Scholar] [CrossRef]
  49. Garga, V.K.; Hansen, D.; Townsend, D.R. Mechanisms of massive failure for flowthrough rockfill embankments. Can. Geotech. J. 1995, 32, 927–938. [Google Scholar] [CrossRef]
  50. Mahdi, T.F.; Merabtene, T. Automated numerical analysis tool for assessing potential bank failures during flooding. Nat. Hazards 2010, 55, 3–14. [Google Scholar] [CrossRef]
  51. Johari, A.; Mousavi, S. An analytical probabilistic analysis of slopes based on limit equilibrium methods. Bull. Eng. Geol. Environ. 2019, 78, 4333–4347. [Google Scholar] [CrossRef]
  52. Bai, T.; Qiu, T.; Huang, X.M.; Li, C. Locating Global Critical Slip Surface Using the Morgenstern-Price Method and Optimization Technique. Int. J. Géoméch. 2014, 14, 319–325. [Google Scholar] [CrossRef]
  53. Damiano, E. Effects of layering on triggering mechanisms of rainfall-induced landslides in unsaturated pyroclastic granular soils. Can. Geotech. J. 2019, 56, 1278–1290. [Google Scholar] [CrossRef]
  54. Fredlund, D.G.; Morgenstern, N.R.; Widger, R.A. Shear-strength of unsaturated soils. Can. Geotech. J. 1978, 15, 313–321. [Google Scholar] [CrossRef]
  55. Capparelli, G.; Damiano, E.; Greco, R.; Olivares, L.; Spolverino, G. Physical modeling investigation of rainfall infiltration in steep layered volcanoclastic slopes. J. Hydrol. 2020, 580, 124199. [Google Scholar] [CrossRef]
  56. Olivares, L.; Damiano, E.; Netti, N.; de Cristofaro, M. Geotechnical Properties of Two Pyroclastic Deposits Involved in Catastrophic Flowslides for Implementation in Early Warning Systems. Geosciences 2019, 9, 24. [Google Scholar] [CrossRef]
  57. De Vita, P.; Napolitano, E.; Godt, J.W.; Baum, R.L. Deterministic estimation of hydrological thresholds for shallow landslide initiation and slope stability models: Case study from the Somma-Vesuvius area of southern Italy. Landslides 2013, 10, 713–728. [Google Scholar] [CrossRef]
  58. Eduardo, B.; Leonardo, C.; Vito, F.; Giuseppe, S. Geotechnical characterisation of pyroclastic soils involved in huge flowslides. Geotech. Geol. Eng. 2005, 23, 365–402. [Google Scholar] [CrossRef]
Figure 1. Permeability functions of different materials. Modified from [25].
Buildings 12 01218 g001
Figure 2. Scheme of the initial stage of water infiltration.
Buildings 12 01218 g002
Figure 3. The scheme of water content distribution at the breakthrough time of fine-grained soil.
Buildings 12 01218 g003
Figure 4. The scheme of the movement of wetting front profile. (ad), the wetting front migrates upslope.
Buildings 12 01218 g004
Figure 5. The slice of saturated fine-grained soil.
Buildings 12 01218 g005
Figure 6. Forces at the interface of fine/coarse-grained soil layers.
Buildings 12 01218 g006
Figure 7. Soil profiles of the the Cervinara slope in southern Italy. Modified from [56].
Buildings 12 01218 g007
Figure 8. Side view of the physical model [55].
Buildings 12 01218 g008
Figure 9. The relationship between infiltration depth and rainfall time (the points are the experimental results [55]; the dotted lines are the calculated results using the proposed method).
Buildings 12 01218 g009
Figure 10. Engineering geological profiles of three slopes.
Buildings 12 01218 g010
Figure 11. The relationships between rainfall time and safety factor: (a) Slope 1; (b) Slope 2; (c) Slope 3.
Buildings 12 01218 g011aBuildings 12 01218 g011b
Figure 12. The scheme of the slope at Pizzo d’Alvano massif.
Buildings 12 01218 g012
Figure 13. The stability calculation results of the slope at Pizzo d’Alvano massif.
Buildings 12 01218 g013
Figure 14. Factor of safety of the capillary barrier cover with the variation of infiltration time.
Buildings 12 01218 g014
Figure 15. Factor of safety of the capillary barrier cover under different thickness of fine-grained soil layers.
Buildings 12 01218 g015
Table 1. Hydraulic properties of the materials.
Soil TypeKsat (m/s) θ s a t θ r θ i   nm α (kPa−1)
Ashes1.8 × 10−50.750.10.241.50.330.53
Coarse pumices3.9 × 10−50.580.0180.071.20.168.8
Where, Ksat: saturated conductivity; θ s a t : saturated volumetric water content; θ r : residual volumetric water content; θ i : the initial volumetric water content; n, m, α: van Genuchten parameters.
Table 2. Main physical and mechanical properties of the materials of three slopes.
Soil Type γ d (kN/m3) c   ( kPa ) φ ( ° )
B9.64.532
Bb9.81.834
Bbb6.48.135
C9.6037
Table 3. The safety factor of three slopes above.
Slopes Slope   Angle   ( ° ) Calculated Safety FactorREAL STATUS
1450.71slid
2370.89slid
3330.96slid
Table 4. Main physical and mechanical properties of the materials in Pizzo d’Alvano massif.
Soil TypeDry Density (kN/m3) c   ( kPa ) φ   ( ° )
Ashy soil7.12.930
Pumices9.61.535
Table 5. Main physical and mechanical properties of the materials in Section 4.2.
Soil Type γ d   ( kN / m 3 ) c   ( kPa ) φ   ( ° )
Sand19035
Silt191025
Table 6. Hydraulic properties of the materials in Section 4.2.
Soil TypeKsat (m/s) θ s a t θ r nm α (kPa−1)
Sand6.11 × 10−70.3460.1856.4420.2291.841
Silt2.5 × 10−70.3730.040.0570.0410.426
In this case, Ksat: saturated conductivity; θ s a t : saturated volumetric water content; θ r : residual volumetric water content; n, m, α: van Genuchten parameters.
Publisher’s Note: MDPI stays neutral with regard to jurisdictional claims in published maps and institutional affiliations.

