Article

Construction Tasks Electronic Process Monitoring: Laboratory Circuit-Based Simulation Deployment

by
Diego Calvetti
1,*,
Luís Sanhudo
2,
Pedro Mêda
1,
João Poças Martins
3,
Miguel Chichorro Gonçalves
3 and
Hipólito Sousa
3
1
CONSTRUCT/GEQUALTEC, Construction Institute, Faculty of Engineering, Porto University, 4200-465 Porto, Portugal
2
BUILT CoLAB—Digital Built Environment, 4150-171 Porto, Portugal
3
CONSTRUCT/GEQUALTEC, Faculty of Engineering, Porto University, 4200-465 Porto, Portugal
*
Author to whom correspondence should be addressed.
Buildings 2022, 12(8), 1174; https://doi.org/10.3390/buildings12081174
Submission received: 20 June 2022 / Revised: 28 July 2022 / Accepted: 31 July 2022 / Published: 6 August 2022

Abstract

:
The domain of data processing is essential to accelerate the delivery of information based on electronic performance monitoring (EPM). The classification of the activities conducted by craft workers can enhance the mechanisation and productivity of activities. However, research in this field is mainly based on simulations of binary activities (i.e., performing or not performing an action). To enhance EPM research in this field, a dynamic laboratory circuit-based simulation of ten common constructions activities was performed. A circuit feasibility case study of EPM using wearable devices was conducted, where two different data processing approaches were tested: machine learning and multivariate statistical analysis (MSA). Using the acceleration data of both wrists and the dominant leg, the machine-learning approach achieved an accuracy between 92 and 96%, while MSA achieved 47–76%. Additionally, the MSA approach achieved 32–76% accuracy by monitoring only the dominant wrist. Results highlighted that the processes conducted with manual tools (e.g., hammering and sawing) have prominent dominant-hand motion characteristics that are accurately detected with one wearable. However, free-hand performing (masonry), walking and not operating value (e.g., sitting) require more motion analysis data points, such as wrists and legs.

1. Introduction

The construction industry (CI) is a significant player in the world economic scenario, as construction-related spending accounts for 13% of the global gross domestic product (GDP) [1]. However, despite its importance, this sector has shown weak productivity growth at a global scale [2], averaging a 1% annual productivity increase since 1997 [1]. Crafts and trade workers comprise 56% of the sector’s employment at the European Union level [3]. Innovation is required to mitigate the impact of workforce shrinkage on the industry, boosting labour productivity on site. To this end, there is an increased relevance in monitoring the industry’s primary productive workforce, justifying its importance as a research topic, which is aligned with the natural interests of companies [4] and the digitalisation and automation trends of Construction 4.0 [5,6]. Through this monitoring, companies can better evaluate their return on investment [4,7,8], while also providing supervisors with better information to support workforce development, training and deployment [5]. Authors refer to this monitoring and performance measurement as electronic performance monitoring (EPM) [8,9,10].
As such, the current technological advances enable new, more reliable methods of data collection, allowing for the real-time monitoring of construction activities. These methods are supported by recent innovations in micro and nanotechnology that enable the sustained assessment of each worker’s task process. The systematic control of construction operations can bring immediate awareness of specific aspects of undergoing activities, enabling better decision making [11] and the assessment of the project’s productivity in order to increase its performance [12]. Additionally, on-site labour productivity can be correlated with carbon dioxide (CO2) emissions and the generation of sanitary wastewater [13]. In fact, according to Mojahed and Aghazadeh, in the context of construction engineering, productivity is mainly related to the performance achieved within each work activity [14]. Finally, digital twins approaches focusing on managing production in a construction set are vital for the monitoring of construction sites [15,16].
The present research aims to assess this EPM in multiple construction tasks, using wearable devices, machine-learning and multivariate statistical analysis (MSA) data processing tools. The objectives of this work are the following:
  • Simulate a near-real scenario in which ten different construction activities are performed;
  • Deploy EPM, using wearable devices, and investigate options to reduce the number of devices overseeing the activities’ characteristics;
  • Classify the activities, grouping them over a process analysis;
  • Analyse the data with two distinct approaches, namely, machine learning and MSA, comparing the acquired results.

2. Background

Workforce activity classification through wearable devices as inertial measurement units (IMUs) is performed using different sensor combinations, namely: accelerometer [17,18,19,20,21]; accelerometer plus gyroscope [22,23,24,25,26]; and accelerometer, gyroscope, plus magnetometer [27,28,29]. Additionally, IMUs devices are positioned over multiple body parts [17,20,27] or on different body parts, such as: the spine [30,31]; arm [22,23,24,25,28]; arms and waist [21,32]; wrist [18,19]; and wrist and leg [26,33].
Labour process modelling based on workforce motion is more commonly applied in manufacturing working design than in the CI, with few studies targeting a process analysis approach in the CI [21,32]. The approach of modelling and measuring manual work systems sets the way for a comprehensive understanding of construction labour motion productivity. The process flow literature has five classes of activities that comprise all production tasks [34,35,36]:
  • Operation (performing work dealing with products), symbolised by a circle [35,36];
  • Inspection (performing quality control work), illustrated by a square [35,36];
  • Delay (waiting time, do not advance work progress), illustrated by capital “D” letter [35,36];
  • Transportation (moving products), illustrated by an arrow [35,36];
  • Storage (used for long-range storage) illustrated by a triangle [35,36].
The productive state addresses the workforce performance during the development of tasks, which can be either Productive (also referred to as Direct or Effective) work, Contributory (also referred to as Support) work or Nonproduction (also referred to as Ineffective) work [37]. This concept was applied by Refs [21,32,38] to cluster construction activities over Effective–Support–Ineffective work. A motion productivity model establishes nine processes to map craft workforce on-site tasks [5], as presented:
  • Free-hand performing (FHP), Operation, e.g., setting a brick;
  • Auxiliary tools (AUT), Inspection, e.g., using a spirit level;
  • Manual tools (MNT), Operation, e.g., using a trowel;
  • Electric/Electronic tools (EET), Operation, e.g., using a drill;
  • Machines operation (MOP), Operation, e.g., using a backhoe;
  • Robotic automation (RBA), Operation, e.g., robotic bricklaying arm;
  • Do not operate value (IDL), Delay, e.g., chatting and resting;
  • Walking (WLK), Delay, e.g., going to the WC;
  • Carrying, (CAR), Transportation/Storage, e.g., products, equipment.
Table 1 presents studies targeting construction tasks activity or process recognition. The maximum number of activities analysed in a single study totals eight activities. It is also observed that, on average, six to seven individuals (subjects) perform the activities. Most studies performed simulations (eleven out of thirteen), while only two experienced a more realistic simulation scenario in a training centre. For clarity, a binary analysis can be identified when only one action is evaluated against another action or an idleness state (stopped).
Several mathematical and statistical methods can be used to process and analyse the data. In most cases, these methods are used in conjunction with the univariate and multivariate analyses [42] and Monte Carlo simulation [38]. Dynamic analysis methods and neural networks are also widely used. There is a trend for applying artificial intelligence (AI) when faced with the large amounts of data collected by electronic devices to process such information quicker and more autonomously. Academic studies focusing on the classification of human activities/actions develop algorithms based on machine learning, including deep-learning [28,43] and traditional approaches [19,20,44]. Machine learning is a subset of AI and can be seen as an autonomous and self-teaching system for training algorithms to find patterns and subsequently use this knowledge to make predictions about new data [45,46]. The domain of data processing is essential to accelerate the delivery of information based on EPM: the faster and more autonomous the data processing, the more agile the delivery of solutions.

3. Method

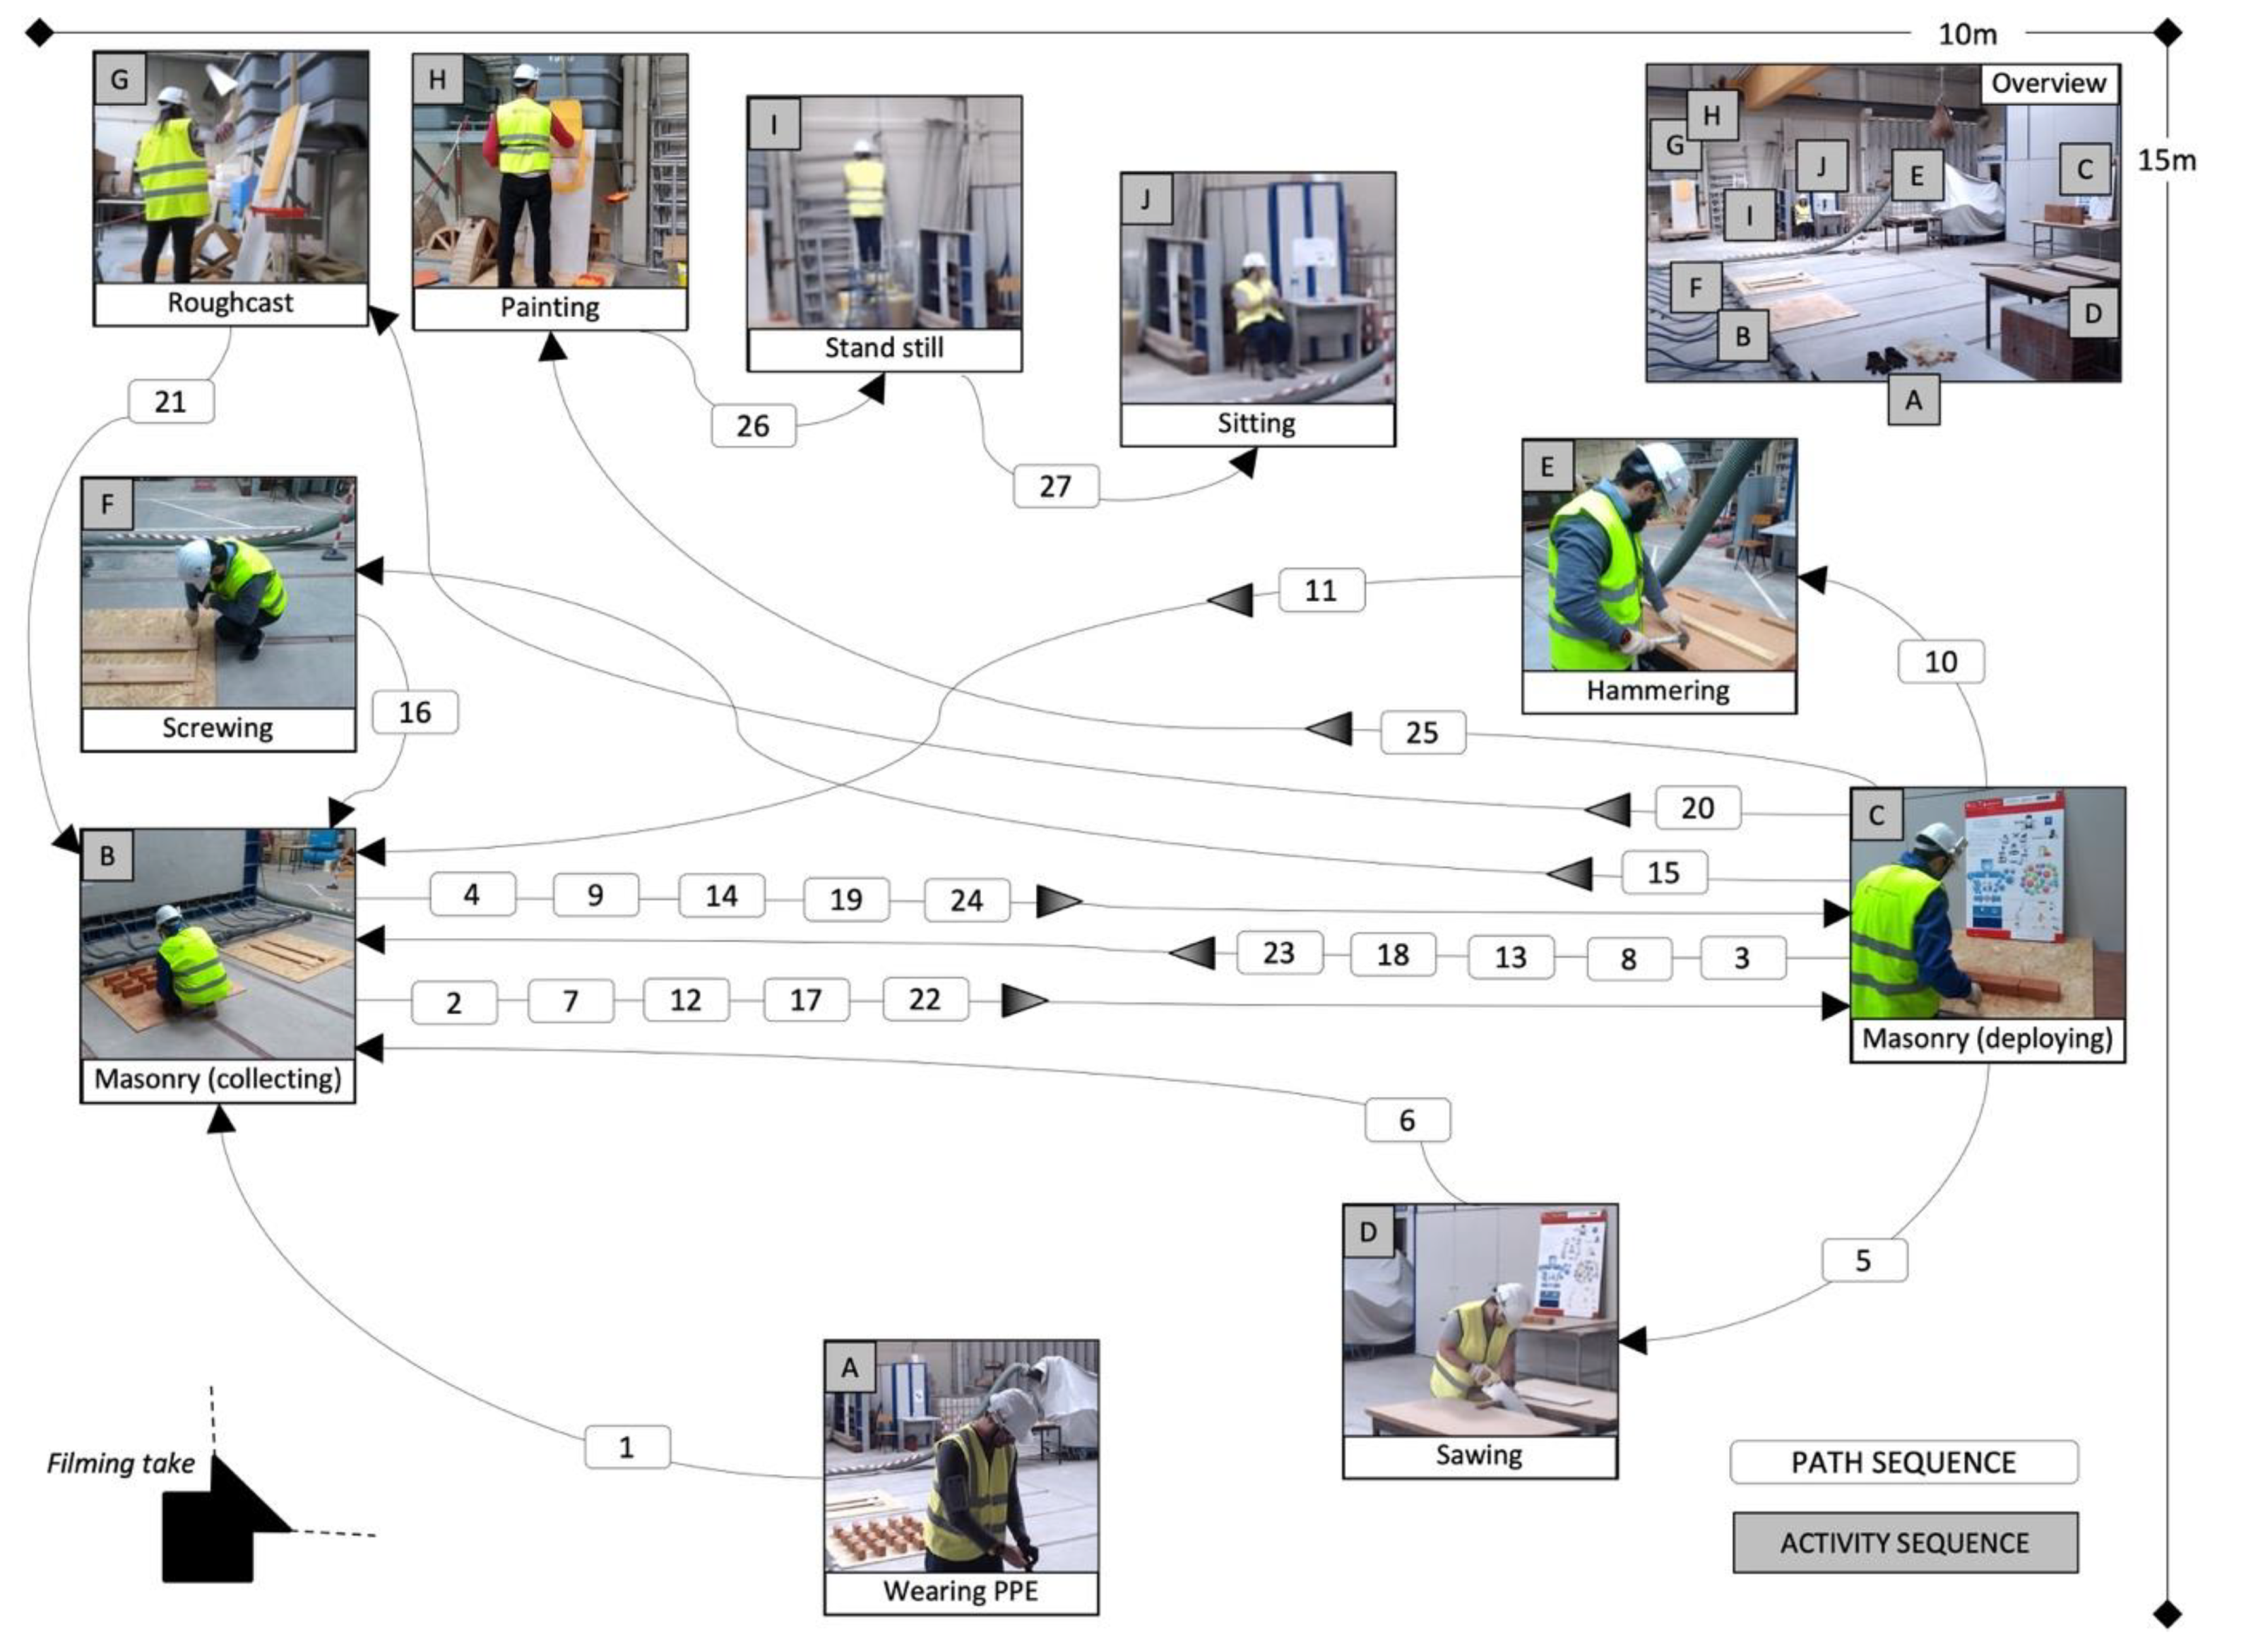
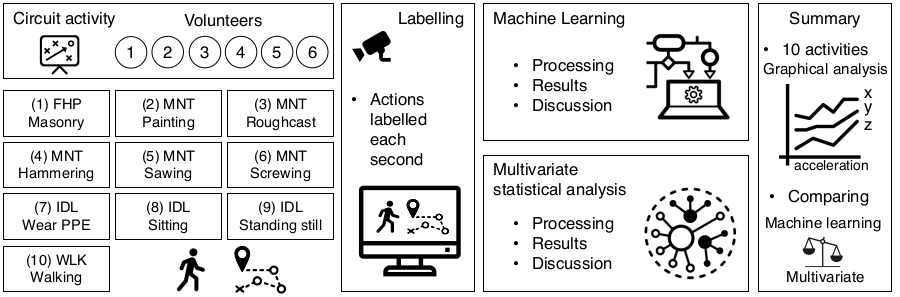
3.1. Research Design

As highlighted above, most studies on activity and process recognition showcase a binary approach (performing/not performing an activity) [22,23,24,25,39,41], with few experiments conducted on site [21,32]. To fill this gap, the present research proposes a laboratory circuit with multiple activities, emulating on-site conditions for testing EPM deployment. A laboratory environment provides a more controlled and labour-saving environment to record and label the actions, as well as test the hardware solutions. Figure 1 presents the data collection and analysis flow chart to clarify the validation approach of the different cases. The main goal is to test and validate the laboratory circuit-based simulation deployment and compare and evaluate two data analysis approaches, assessing their feasibility and performance accuracy.

3.2. Data Collection

For an efficient performance monitoring of the construction craft workforce, it is essential to at least assess the hand tasks, the walking–travelling and the idleness. To this end, a circuit concept was established to simulate an interactive work scenario seen in a typical on-site construction project. This circuit purposely aimed to avoid a binary analysis, as it is the authors’ opinion that such an approach does not properly reflect a construction worker’s behaviour. For this reason, basic daily work activities were selected, which are part of the daily life of workers in different functions. It can be inferred that, given the role of a specific worker, his/her actions can be previously mapped, which would facilitate activity classification. Additionally, according to Adrian (2004), at least 50% of the workforce time on site is spent on non-productive activities (e.g., walking, drinking water, talking to co-workers) [37]. A total of six volunteers were equipped with three devices, two on both wrists and one on the dominant leg’s ankle. The inertial measurement units (IMU, similar to watches) devices collected 3-axis data at a sampling frequency of 100 Hz with a 1 s epoch output. Each data point is thus represented as a vector containing the timestamp of the reading and nine acceleration values (one for each axis of the three accelerometers).
Figure 2 shows the circuit deployed in a 150-square-meter indoor laboratory. The circuit was composed of work areas where the volunteers interactively performed the existing 10 activities. The volunteers walked from station to station to perform these activities, walking/travelling around the stations, assumed with letters in the figure. As well, a path sequence was pointed out as evidenced with the numbers; however, the volunteers had the option of carrying two or four bricks at once and shortening the travel between actions B (Masonry collection) and C (Masonry deployment).

3.3. Data Analysis

Figure 3 presents the deployed method. After completing the circuit containing ten construction activities, each simulation had its actions labelled every second. These data were then processed and evaluated by two different methods. A graphical analysis of the accelerations collected during each activity summarised the analysis. Finally, a qualitative analysis of the two methods was provided. The data were labelled manually using a synchronised video recording of the circuit. The data points of each activity were:
  • Painting, MNT—Manual tools (1562);
  • Sawing, MNT—Manual tools (1466);
  • Hammering, MNT—Manual tools (1419);
  • Walking, WLK—Walking (1411);
  • Masonry, FHP—Free-hand performing (863);
  • Screwing, MNT—Manual tools (759);
  • Sitting, IDL—Do not operate value (624);
  • Roughcasting, MNT—Manual tools (621);
  • Standing still, IDL—Do not operate value (296);
  • Wearing personal protective equipment (PPE), IDL—Do not operate value (287).
Next, the activities were clustered into three small mixed groups based on the process characteristics and the number of data points. First, a mixed group was established with the only “free-hand performing” activity (Masonry) plus two “manual tools” processes (Painting and Roughcasting). A second contained just “manual tools” (Hammering, Sawing and Screwing). A third was composed of “do not operate value” (Wearing PPE; Sitting; Standing still) and “walking” (Walking).
Additionally, the formation of the three groups of analysis with different processes and their respective activities was based on diversification to evaluate the variability in the classification accuracy through the different groups of activities with different motion patterns. However, the group “free-hand performing (Masonry) plus two manual tools (Painting and Roughcasting)” had a mix of motion activities; the masonry action had multiple two hands and body motion activities, while painting and roughcasting had almost static body motion with a prevalence of high-frequency motions on the predominant hand and only a few motions on the non-dominant hand, supporting the actions.
In the group “manual tools (Hammering, Sawing and Screwing)”, there was a uniqueness of actions with hand tools and non-movement characteristics of the legs. Additionally, a predominance of high frequency on the predominant hand motions could be noted, which was only supported by a quasi-static motion of the non-dominant hand. However, the three activities demanded very peculiar and distinguished predominant hand motions between them.
Finally, the group “do not operate value (Wearing PPE, Sitting, Standing still) plus walking (Walking)” mixed the walking movement with resting actions and some unusual movement activities, such as putting on protective equipment (e.g., gloves, glasses, helmet).
A total of 155 min of activities was monitored. The process of labelling the actions (second by second) took approximately 26 h. Table 2 shows the number of points (variables) collected by the 3-axis accelerometers positioned in three locations on the volunteers’ bodies.
For data processing, the pre-labelling of activities is necessary. First, the classification algorithms used the labelled data for training. Second, pre-labelling enabled quantifying the accuracy of the analyses. MSA was used to group data according to the characteristics of the variables. Both processes were applied to understand the potential of each method to be used in future applications. In addition, a graphical analysis of the accelerations collected in the 3 axes allowed an assessment of the specific characteristic of each activity, improving the perception of the results obtained by the classification methods.

4. Results and Discussion

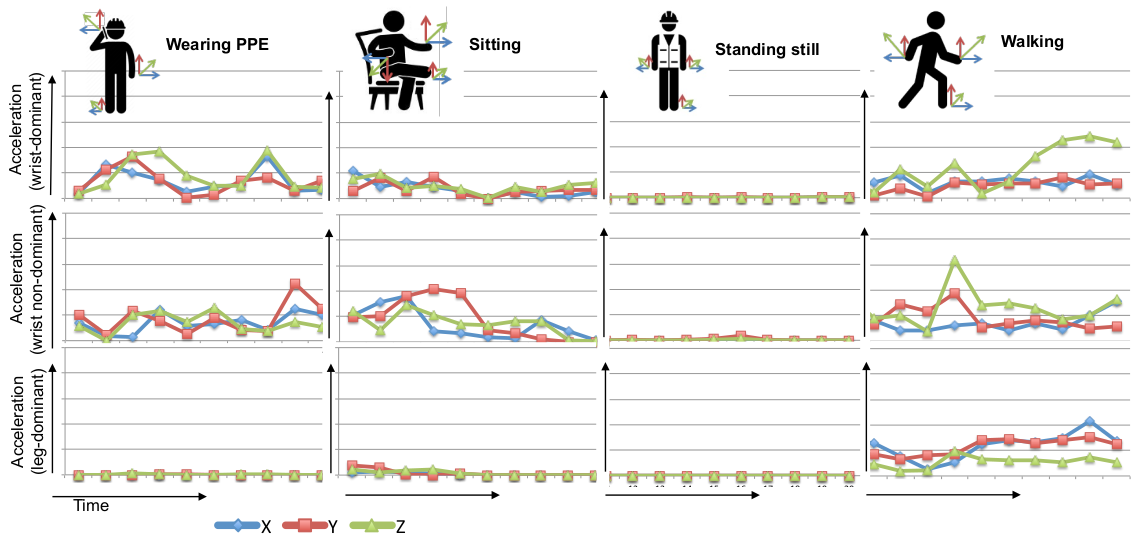
4.1. Acceleration Data

This section presents and discusses the activities’ acceleration data characteristics and the results of both processing methods applied for classifying the actions (i.e., machine learning and MSA). A cross-analysis focuses on a deep understanding of the tasks and process motion characteristics. Finally, a qualitative analysis of the processing tools is presented based on the findings.
The clustering of activities was realised by targeting a diverse group of motion characteristics. In the first group, the Masonry activity presented a mix of motions, from loading to laying the bricks. It is possible to observe a variety of accelerations in the three axes (X, Y, Z) in both the dominant and non-dominant hands and the leg. In contrast, the Painting activity has more significant dominant hand motions, with a marked acceleration in the Z direction, with little or no effort in the other hand and legs. Finally, in Roughcasting, dominant hand movements’ predominance can be identified with more significant accelerations in the Z and X directions. Figure 4 presents the characteristics of accelerations from dominant and non-dominant wrists, as well as the dominant leg for the three activities, making it possible to visualise the distinguished motion patterns. It can be inferred that when classifying these three activities, some misleading results can occur because of the non-linearity of the Masonry activity that might overlap with some motion characteristics captured in the other activities. This becomes even clearer when the classification is based only on the wrist-dominant motions, as the leg variable that will differentiate it from the others is lost, resulting in reduced accuracy.
In the second group, a more precise classification/clustering is observed in activities using manual tools. All three activities have similar characteristics: significant dominant hand motions, non-dominant hand support when adjusting the material/element and supporting the body, and virtually no leg motions. The predominance of movements in vectors X and Z stands out in the hammering activity. The predominance of acceleration in the X direction is evident in the Sawing activity. Finally, in the Screwing activity, a linear pattern is seen, with the predominance of vectors Y and Z. This set of activities is presented in Figure 5. It is observed that the accuracy of the classifiers should not be influenced by removing the non-dominant hand and leg data. On the contrary, there is a subtle accuracy increase.
Finally, in the last group, except for the Standing still activity, which practically does not present motions with representative accelerations, the other activities are of peculiar motions. For example, volunteers move their hands and legs slightly, even while sitting. When Wearing PPE, no significant leg motions are detected, but the hands have practically random accelerations. When Walking, the limbs’ motions and accelerations have a similar cadence in each individual. Machine learning interprets the acceleration patterns more accurately than the other methods used in this study. On the contrary, the simple grouping by multivariate analysis only makes it easy to observe the Standing still state, not evaluating cadences with similar acceleration. The most prominent vectors in each activity are represented in Figure 6 for Wearing PPE, Sitting, Standing still and Walking. When the results are only pertinent to the wrist-dominant data, there are practically no differences in the accuracy. This fact indicates that the wrist-dominant motion detected was peculiar enough to differentiate such different actions.

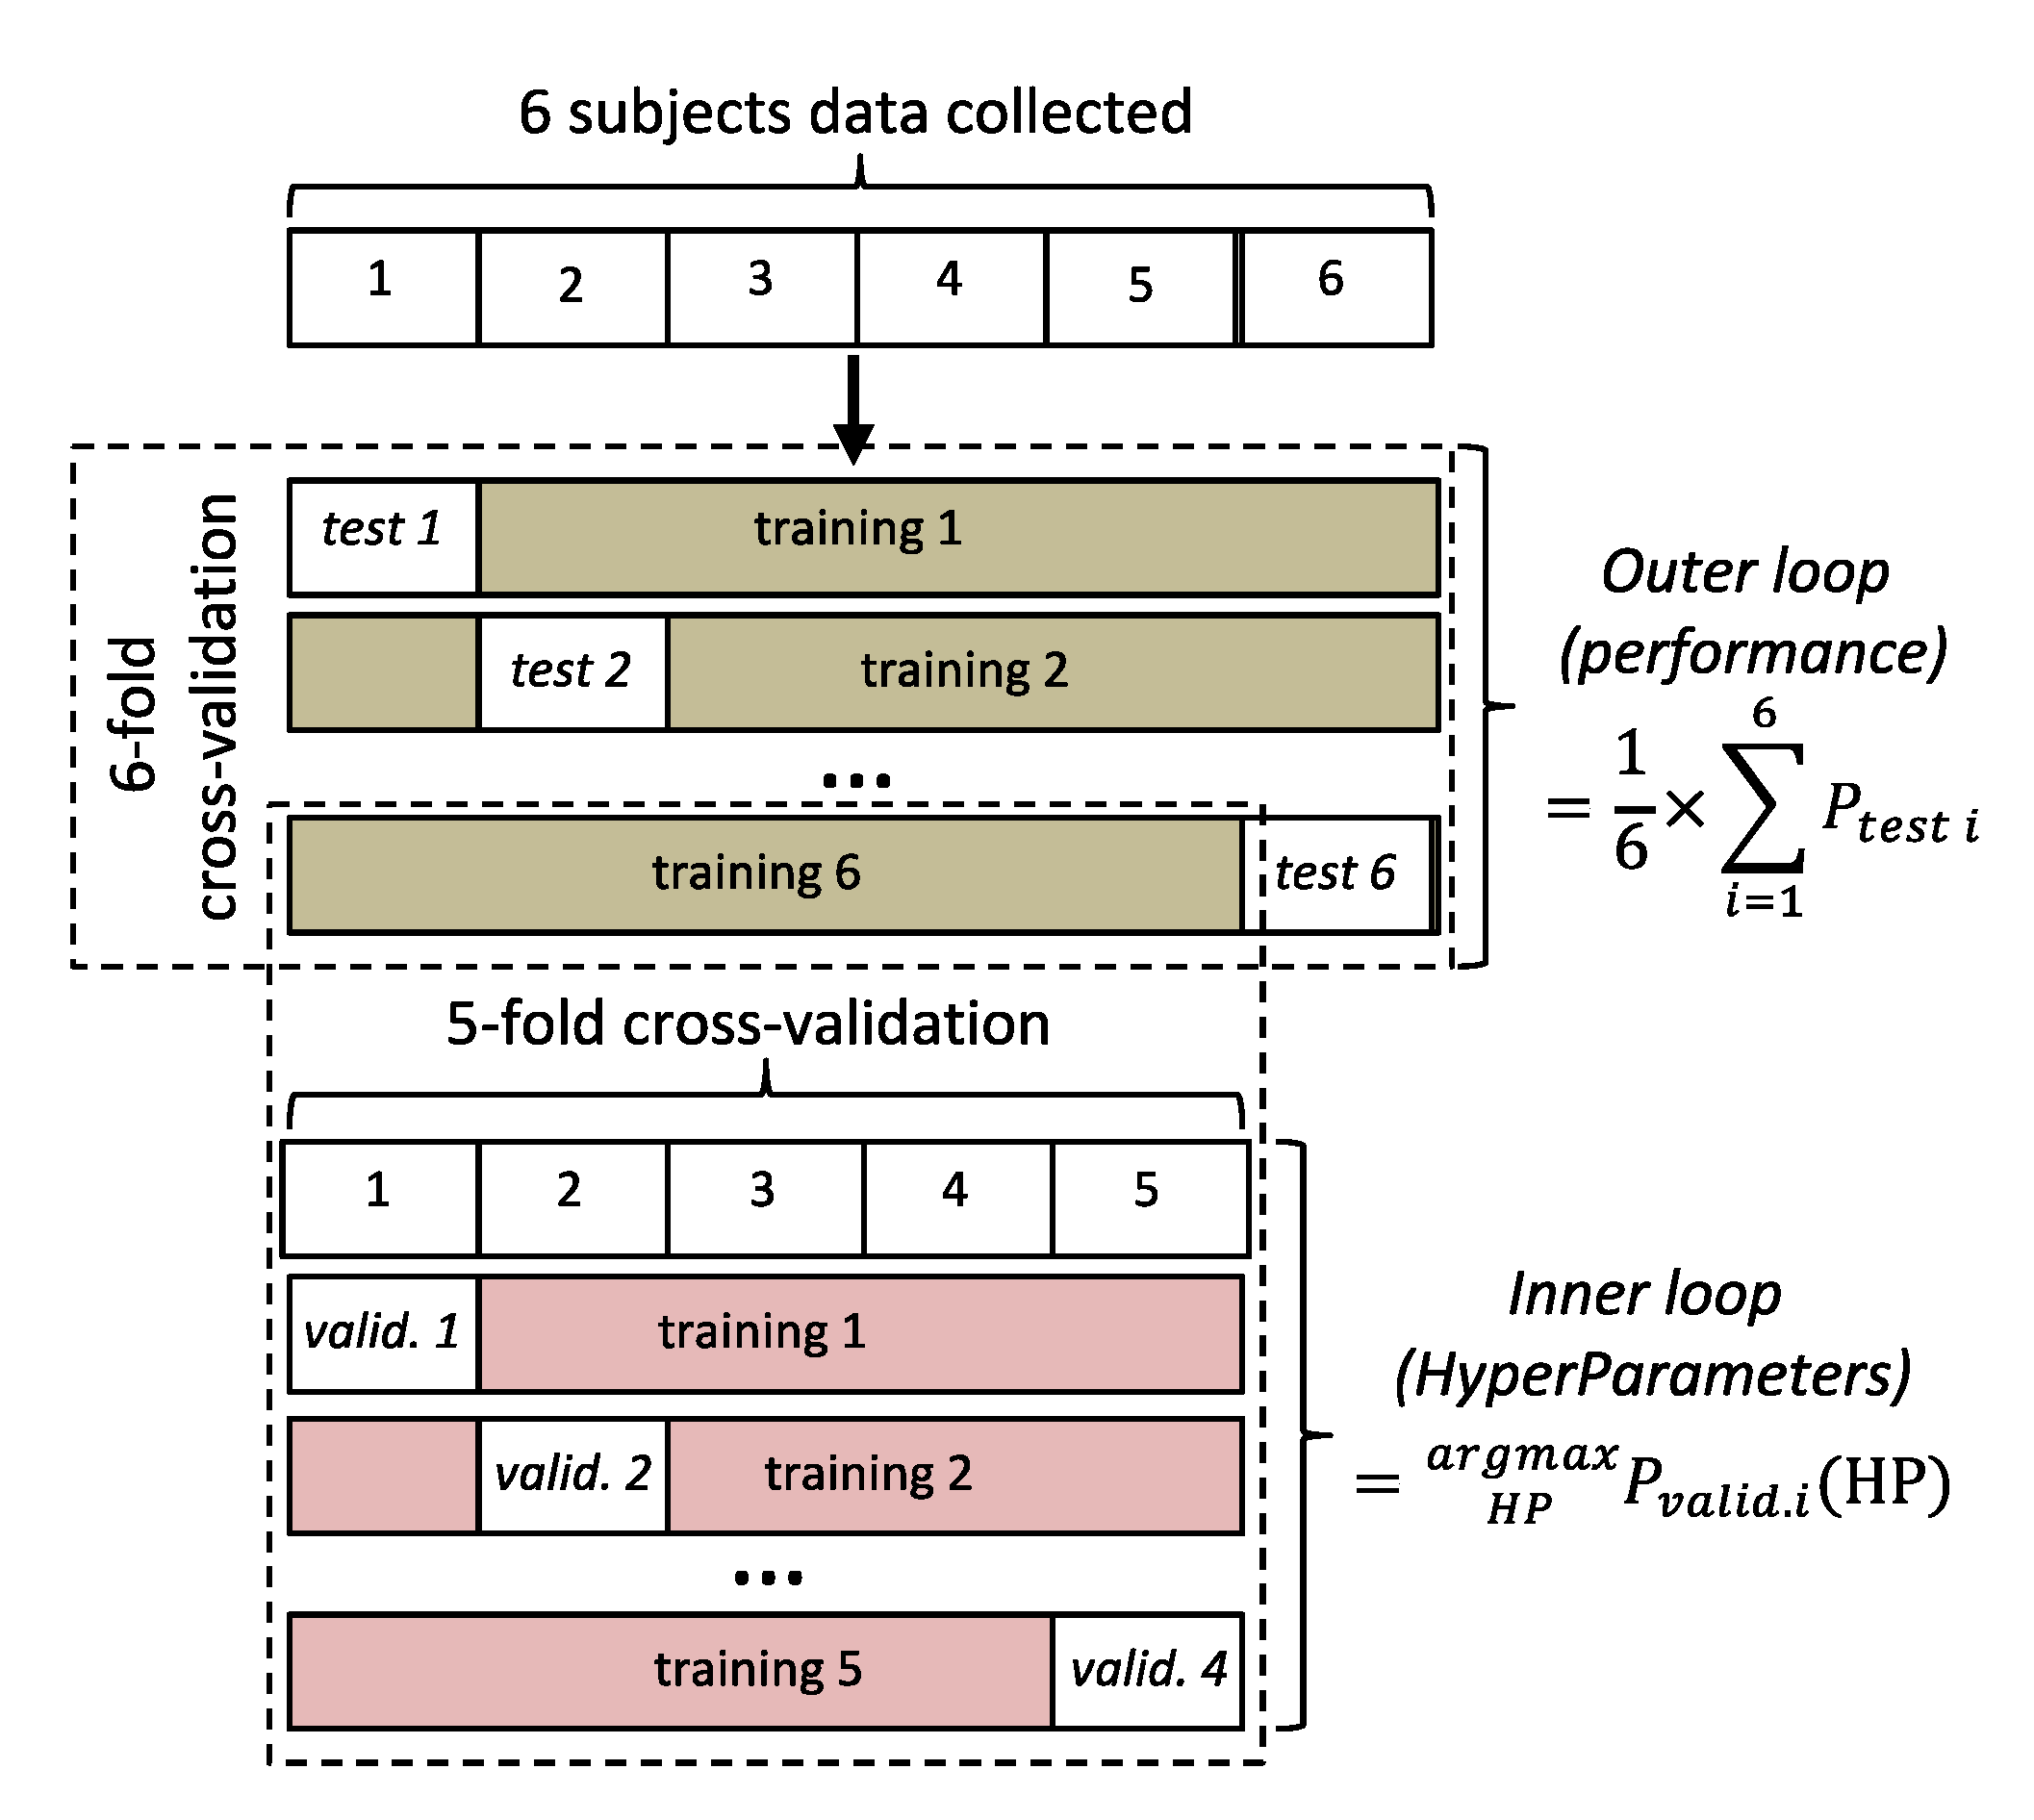
4.2. Machine Learning

After data collection, all information points must be characterised manually for the machine-learning approach, which indicates the need to use video recordings as a reference. These points are the identification and labelling of the type of process or action or motion at each moment of the analysis. Then, the process of classifying the data is carried out, which are commonly divided into groups according to the characteristics of the sample. Afterwards, feature extraction is performed to identify the most useful characteristics to classify each group of actions. Next, the classifiers are selected, and each method’s reliability (%) evaluation is performed for the sample. Finally, a set of algorithms can be calibrated to carry out future autonomous analyses.
As previously presented, the ten activities were divided into three groups: Free-hand performing (Masonry) + Manual tools (Painting and Roughcasting); Manual tools (Hammering, Sawing and Screwing); Do not operate value (Wearing PPE, Sitting, Standing still) + Walking (Walking). Several classification conditions were studied, including the ideal time window size (in seconds) to segment the data; the extraction and selection of relevant artificial features; the adjustment of hyperparameters (time windows and parameter grouping masses); and the training and selection of the classifier. As presented in Figure 7, the hyperparameters and classifier selection was based on the best accuracy obtained through a cross-validation approach, using two training loops.
Finally, the classifiers were tested in a subject-independent (i.e., classifier trained without any test subject data) and -dependent (i.e., classifier trained with a portion of the test subject data) approach for all activities, using the optimal reasonable time window.
Thirteen different classifiers were evaluated, containing both basic models and ensemble methods:
  • Basic models: decision tree (DT); K-nearest neighbours (KNN); logistic regression (LR); multilayer perceptron (MLP); multiclass support vector machines (SVM) with different kernels (linear (LSVM), polynomial (PSVM), radial basis function—rbf (RSVM), sigmoid (SSVM)).
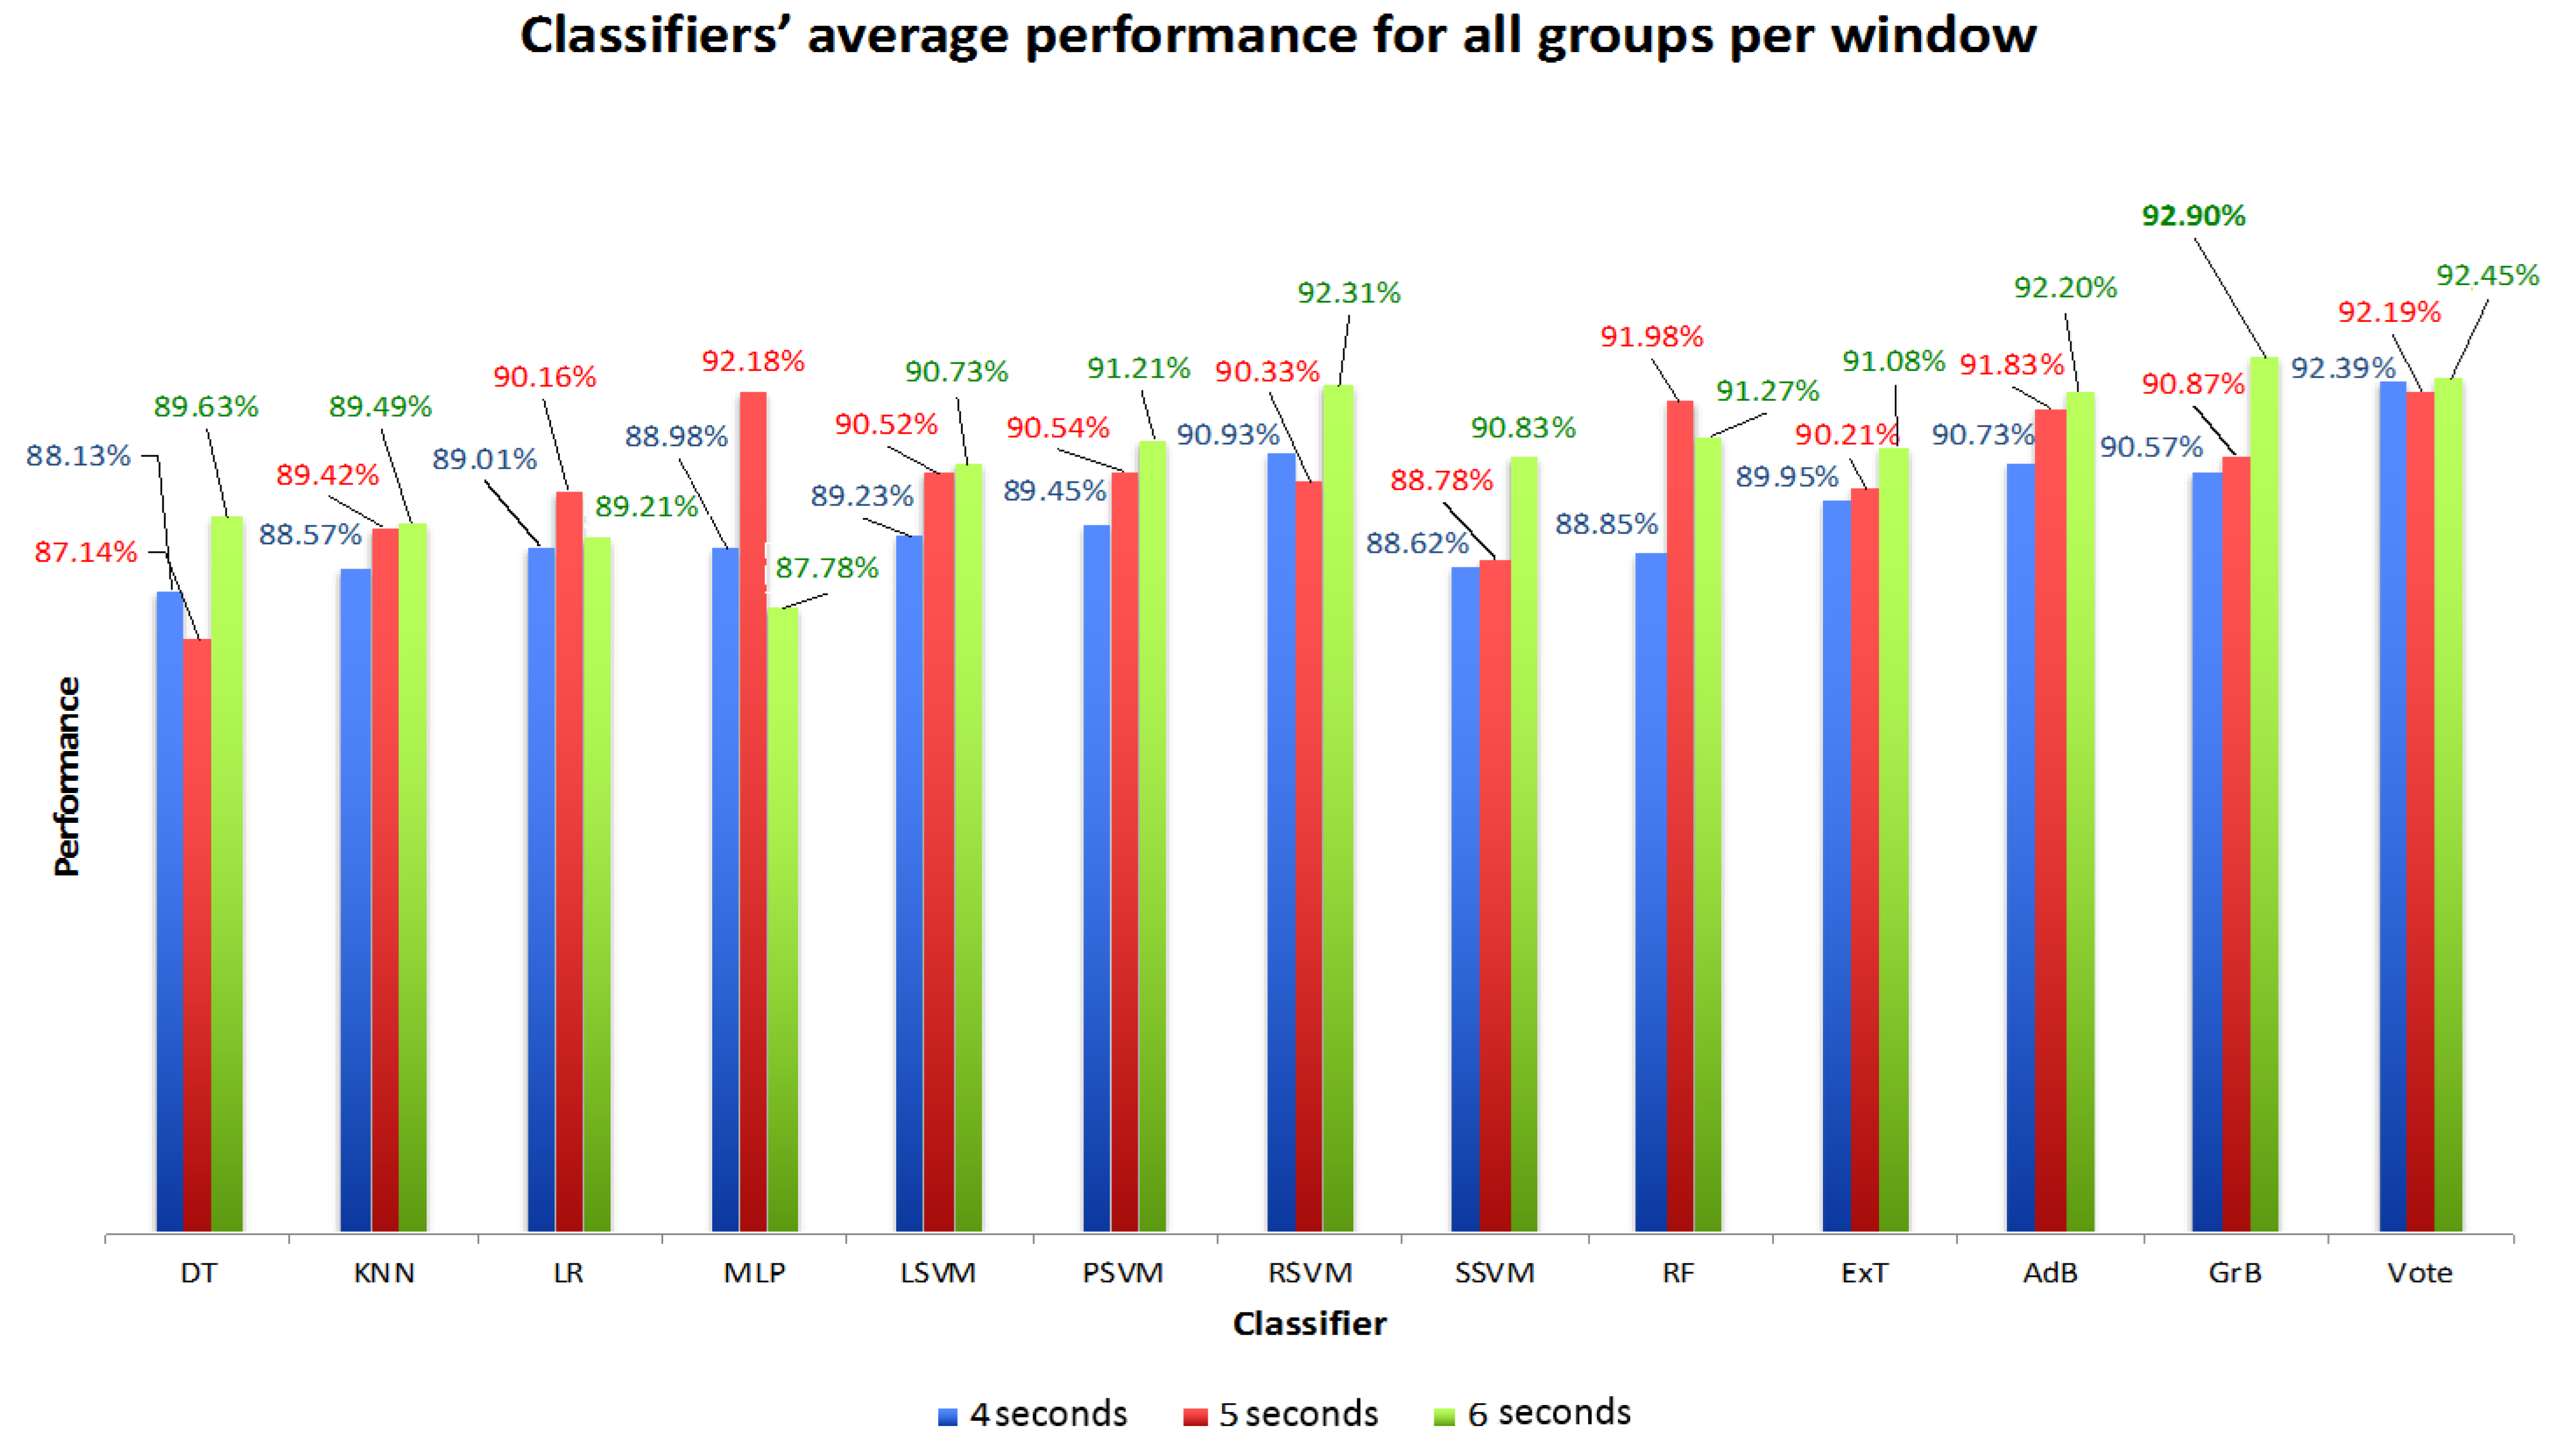
  • Ensemble methods: random forest (RF); extremely randomised trees (ExT); AdaBoost (AdB); gradient boosting (GrB); majority/hard vote (vote). For the subject-independent assessment approach, windows with different times (4, 5 or 6 s) were applied to each group of activities.
For an analysis of the subject-independent approach, Figure 8, Figure 9 and Figure 10 show the classifiers’ performance (average balanced accuracy) for each group and window combination. Figure 11 presents the average performance of all groups per window, and Figure 12 presents the average performance of all windows per group.
Figure 8 shows the results for the “free-hand performing (Masonry) plus two manual tools (Painting and Roughcasting)” group, where the best performing classifier showcased a 92.71% accuracy (6 s window with the LSVM classifier).
Figure 9 shows the results for the “manual tools (Hammering, Sawing, and Screwing)” group, where the best performance was a 96.07% accuracy for the vote classifier with a 5 s window.
Finally, Figure 10 shows the results for the group “do not operate value (Wearing PPE, Sitting, Standing still) plus walking (Walking)”, where the best performance was achieved for a 6 s window with the GrB classifier—94.66% accuracy.
In summary, all three groups presented a similar range of performance, with all best accuracies at above 92%.
For an analysis of a subject-dependent approach, Figure 13 showcases the performance of all classifiers when applied to all ten activities and a 6 s window. This approach essentially indicates whether and how much the classifier performance would benefit from gathering the training data of new subjects (i.e., workers) before starting to predict their activities. To help compare both approaches, Figure 13 also shows the same analysis for a subject-independent approach, enabling a side-by-side comparison.
As such, from Figure 13, it can be concluded that the KNN classifier achieved the best performance of 93.69%, with the AdB classifier ranking in close second with 93.57%. Both these highest accuracies were achieved for the subject-dependent approach, which reached an average performance of 86.08%, throughout all classifiers. This accuracy is roughly 6% higher than the 80.43% average accuracy achieved by the subject-independent approach. In fact, the subject-independent approach with all activities was also far below the accuracies achieved for each group independently, whose highest values were all above 92%, as previously seen in Figure 8, Figure 9 and Figure 10. Thus, it can be stated that the division of all activities into smaller groups is vital to increase accuracy, while subject dependence can help boost the accuracy even further.
Nevertheless, even without all favourable conditions, the achieved accuracies are encouraging, with the GrB classifier achieving a maximum of 85.54% when facing all activities and a subject-independent approach (Figure 13).

4.3. Multivariate Statistical Analysis

The multivariate statistical analysis aims to verify the formation of clusters for the data collected during the experiment. IBM SPSS Statistics (version 25) was the main software tool for statistical calculations. Microsoft Excel was also used for the graphical formatting of data from SPSS. The analysis by non-hierarchical classification allows the evaluation of the cluster’s dimensionality formed by the subjects [47], where a synthesis analysis of the mathematical results is carried out concerning the aspects of the three groups of processes and the ten activities: Free-hand performing (Masonry) + Manual tools (Painting and Roughcasting)—three clusters; Manual tools (Hammering, Sawing and Screwing)—three clusters; Do not operate value (Wearing PPE, Sitting, Standing still) + Walking (Walking)—four clusters.
After applying the non-hierarchical classification according to the number of activities in each group, the results are compared with the labelled data to determine the accuracy of these processes. Initially, to group the clusters’ activities, only the absolute parameters of the accelerations (in their three axes) collected on the wrists and one leg were used as variables (83,772 data points). However, nine features were used in the analysis. Next, the same process was performed only with the values of the accelerations (three axes) of the volunteers’ dominant hands. Thus, the analysis had a third of the number of variables used in the previous case (27,924 data points). However, three features were used in the analysis.
Table 3 presents the set-up requirements for a non-hierarchical classification in Free-hand performing (Masonry) + Manual tools (Painting and Roughcasting) processes and tasks, making three clusters fit with the activities. To group the activities in clusters, the absolute parameters of the accelerations (in their three axes) collected on the wrists and one leg were used as a total of nine variables (27,414 data points).
Table 4 presents the interaction history. Iterations stopped because the maximum number of iterations was performed. The maximum absolute coordinate change for any centre is 0.836, and the current iteration is 10. The minimum distance between the initial centres is 584.024. Table 5 shows the distances between the final cluster of activity centres, and Table 6 presents the number of cases in each cluster.
In effect, each of the 3046 lines (activities identified in each second) was identified by a cluster. A small extraction of this information is shown in Table 7. Moreover, a true or false analysis was carried out line by line to identify whether the indicated cluster was equal or not to the real label. Thus, when the correct results are totalled, the accuracy of the analysis is determined. Finally, the results for the multivariate analysis of “Free-hand performing (Masonry) + Manual tools (Painting and Roughcasting)” indicated 1855 correct values in 3064, reaching an accuracy of 60.90%. The exact process of clustering only three axes of the dominant hand (9138 data points) achieves 32.50% accuracy. Table 8 presents the set-up requirements for a non-hierarchical classification in Manual tools (Hammering, Sawing and Screwing) process and tasks, creating three clusters of activities. To group the activities into clusters, the absolute parameters of the accelerations (in their three axes) collected on the wrists and one leg were used—a total of nine variables (32,796 data points). Table 9 presents the interaction history. Iterations stopped because the maximum number of iterations was performed. The maximum absolute coordinate change for any centre is 0.547, and the current iteration is 10. The minimum distance between the initial centres is 575.296. Table 10 shows the distances between the final cluster of activity centres, and Table 11 presents the number of cases in each cluster.
Each of the 3644 lines (activities identified in each second) is identified by a cluster. A small extraction of this information is shown in Table 12. Again, the true or false analysis was carried out to evaluate the accurate labelling. The multivariate analysis of Manual tools (Hammering, Sawing and Screwing) process and tasks indicated 2772 correct values in 3644, reaching an accuracy of 76.07%. In contrast, using just three axes of the dominant hand (10,932 data points), it achieved 76.23% accuracy.
Table 13 presents the set-up requirements for a non-hierarchical classification for the group containing the activities of Wearing PPE, Sitting, Standing still and Walking. To obtain the four clusters of activities, data of the wrists and one leg were used as nine variables (23,562 data points).
Table 14 presents the interaction history that stopped because the maximum number of iterations was performed. The minimum distance found between the initial centres is 531.495. With ten current iterations, the maximum absolute coordinate change for any centre is 3.637. Table 15 presents the distances between the final cluster of activity centres. Table 16 shows the number of cases in each cluster.
A small extraction of the clustering information regarding the processing of the 2618 lines (activities identified in each second) is shown in Table 17. The multivariate analysis of the activities of Wearing PPE, Sitting, Standing still and Walking indicated 1249 correct values in 2618, reaching an accuracy of 47.71%. Finally, an accuracy of 46.60% was achieved by clustering the data from three axes of the dominant hand (9138 data points).
Table 18 and Table 19 present a summary of all the analyses. The process Manual tools with the three activities (Hammering, Sawing and Screwing) achieved higher accuracy in both situations—Wrists and Leg (76.07%) and Wrist-dominant (76.23%). Additionally, it was the only case of the highest accuracy, only clustering the Wrist-dominant data. As seen, the group of two processes and three activities, “Free-hand performing (Masonry) + Manual tools (Painting, Roughcasting)”, achieved an accuracy of 60.90% (Wrists and Leg) and (32.50%). In this case, the analysis by using only the wrist-dominant data decreased the accuracy by almost a half. Finally, the lowest accuracy was identified in the group of two processes and four activities—“Do not operate value (Wearing PPE, Sitting, Standing still) + Walking (Walking)”—47.41% and 46.60%, respectively, for Wrists and Leg, and Wrist-dominant data. In this case, a slight difference was noted.
In the “Free-hand performing (Masonry) + Manual tools (Painting and Roughcasting)” group, when only the data of the dominant wrist was considered, a high increase in the maximum absolute coordinate change for any centre was observed. Additionally, the distances between the final cluster centres decreased significantly. This was not verified in the other two cases, which maintained approximate values in both scenarios. Forward in the next section, a summary analysis will be performed.

4.4. Classification and Clustering Cross-Analysis

Figure 14 illustrates the accuracy achieved by the machine-learning process and the multivariate statistical analysis. The classifications performed through machine learning reached high precision in all three cases. Multivariate statistical analysis evidenced moderate accuracy. Subsequently, an analysis is developed to highlight the different classification accuracy results when using the three collection points and is carried out only with the wrist-dominant data. The objective is to explain why there is a loss of approximately 50% of accuracy in the first group, while in another case (Manual tools), there is a subtle increase in accuracy, and in the last group, only a difference of less than 1% is observed. Finally, based on the results and the analyses, it is possible to put forward an overall evaluation of the machine-learning methods and multivariate statistical analysis (see Figure 15). The purpose of these classifiers is to avoid manual data processing, as in a real-life construction situation, the large volume of data would result in extensive manual work.
It can be concluded that the multivariate statistical analysis method alone is not able to label actions. However, multivariate analysis can speed up the labelling work, since a preliminary process can seek to cluster the data and facilitate their visual interpretation. The multivariate analysis method is more straightforward than machine learning and can achieve a moderate accuracy with fewer features to vectorise, demanding lower expert knowledge and computational capacity. The enormous potential of machine learning is in creating algorithms that, once able to interpret an activity (based on acceleration), can perform this task without the need for pre-labelling or training sets. The idealised format of an activity circuit can assist in the algorithms’ calibration, since a new individual can be monitored in a known and pre-established sequence of activities/actions.

5. Conclusions

The dynamic circuit proposed in this paper makes EPM laboratory experimentation more similar to the on-site reality. The option of grouping the activities with different motion characteristics proved essential for the analysis, since it was demonstrated that having heterogeneous motions/acceleration activities hampers the classification process. Future research in the field of EPM and activity classification should observe this practice of clustering activities with distinct motion characteristics. Moreover, this is an accurate picture of the work developed for the craft workers on site. The activities’ classifications and their grouping over a process analysis allow a deep understanding of the motion characteristics. However, process modelling analysis can provide better performance evaluation.
The experiment conducted to test the circuit feasibility deploys electronic monitoring, using wearable devices (IMUs) to collect motion acceleration of wrists and the dominant leg. Activities with multiple motions characteristics, such as free-hand performing (e.g., masonry), walking and do not operate value (e.g., Wearing PPE and Sitting), require more motion analysis data points, such as wrists and legs. On the other hand, processes conducted with Manual tools (e.g., painting, roughcasting, hammering, sawing and screwing) have prominent dominant-hand motion characteristics that are easily detected with just one wearable. In summary, processing the data with two approaches (i.e., machine learning and MSA, in a laboratory circuit with six subjects using three activity groups resulted in the following:
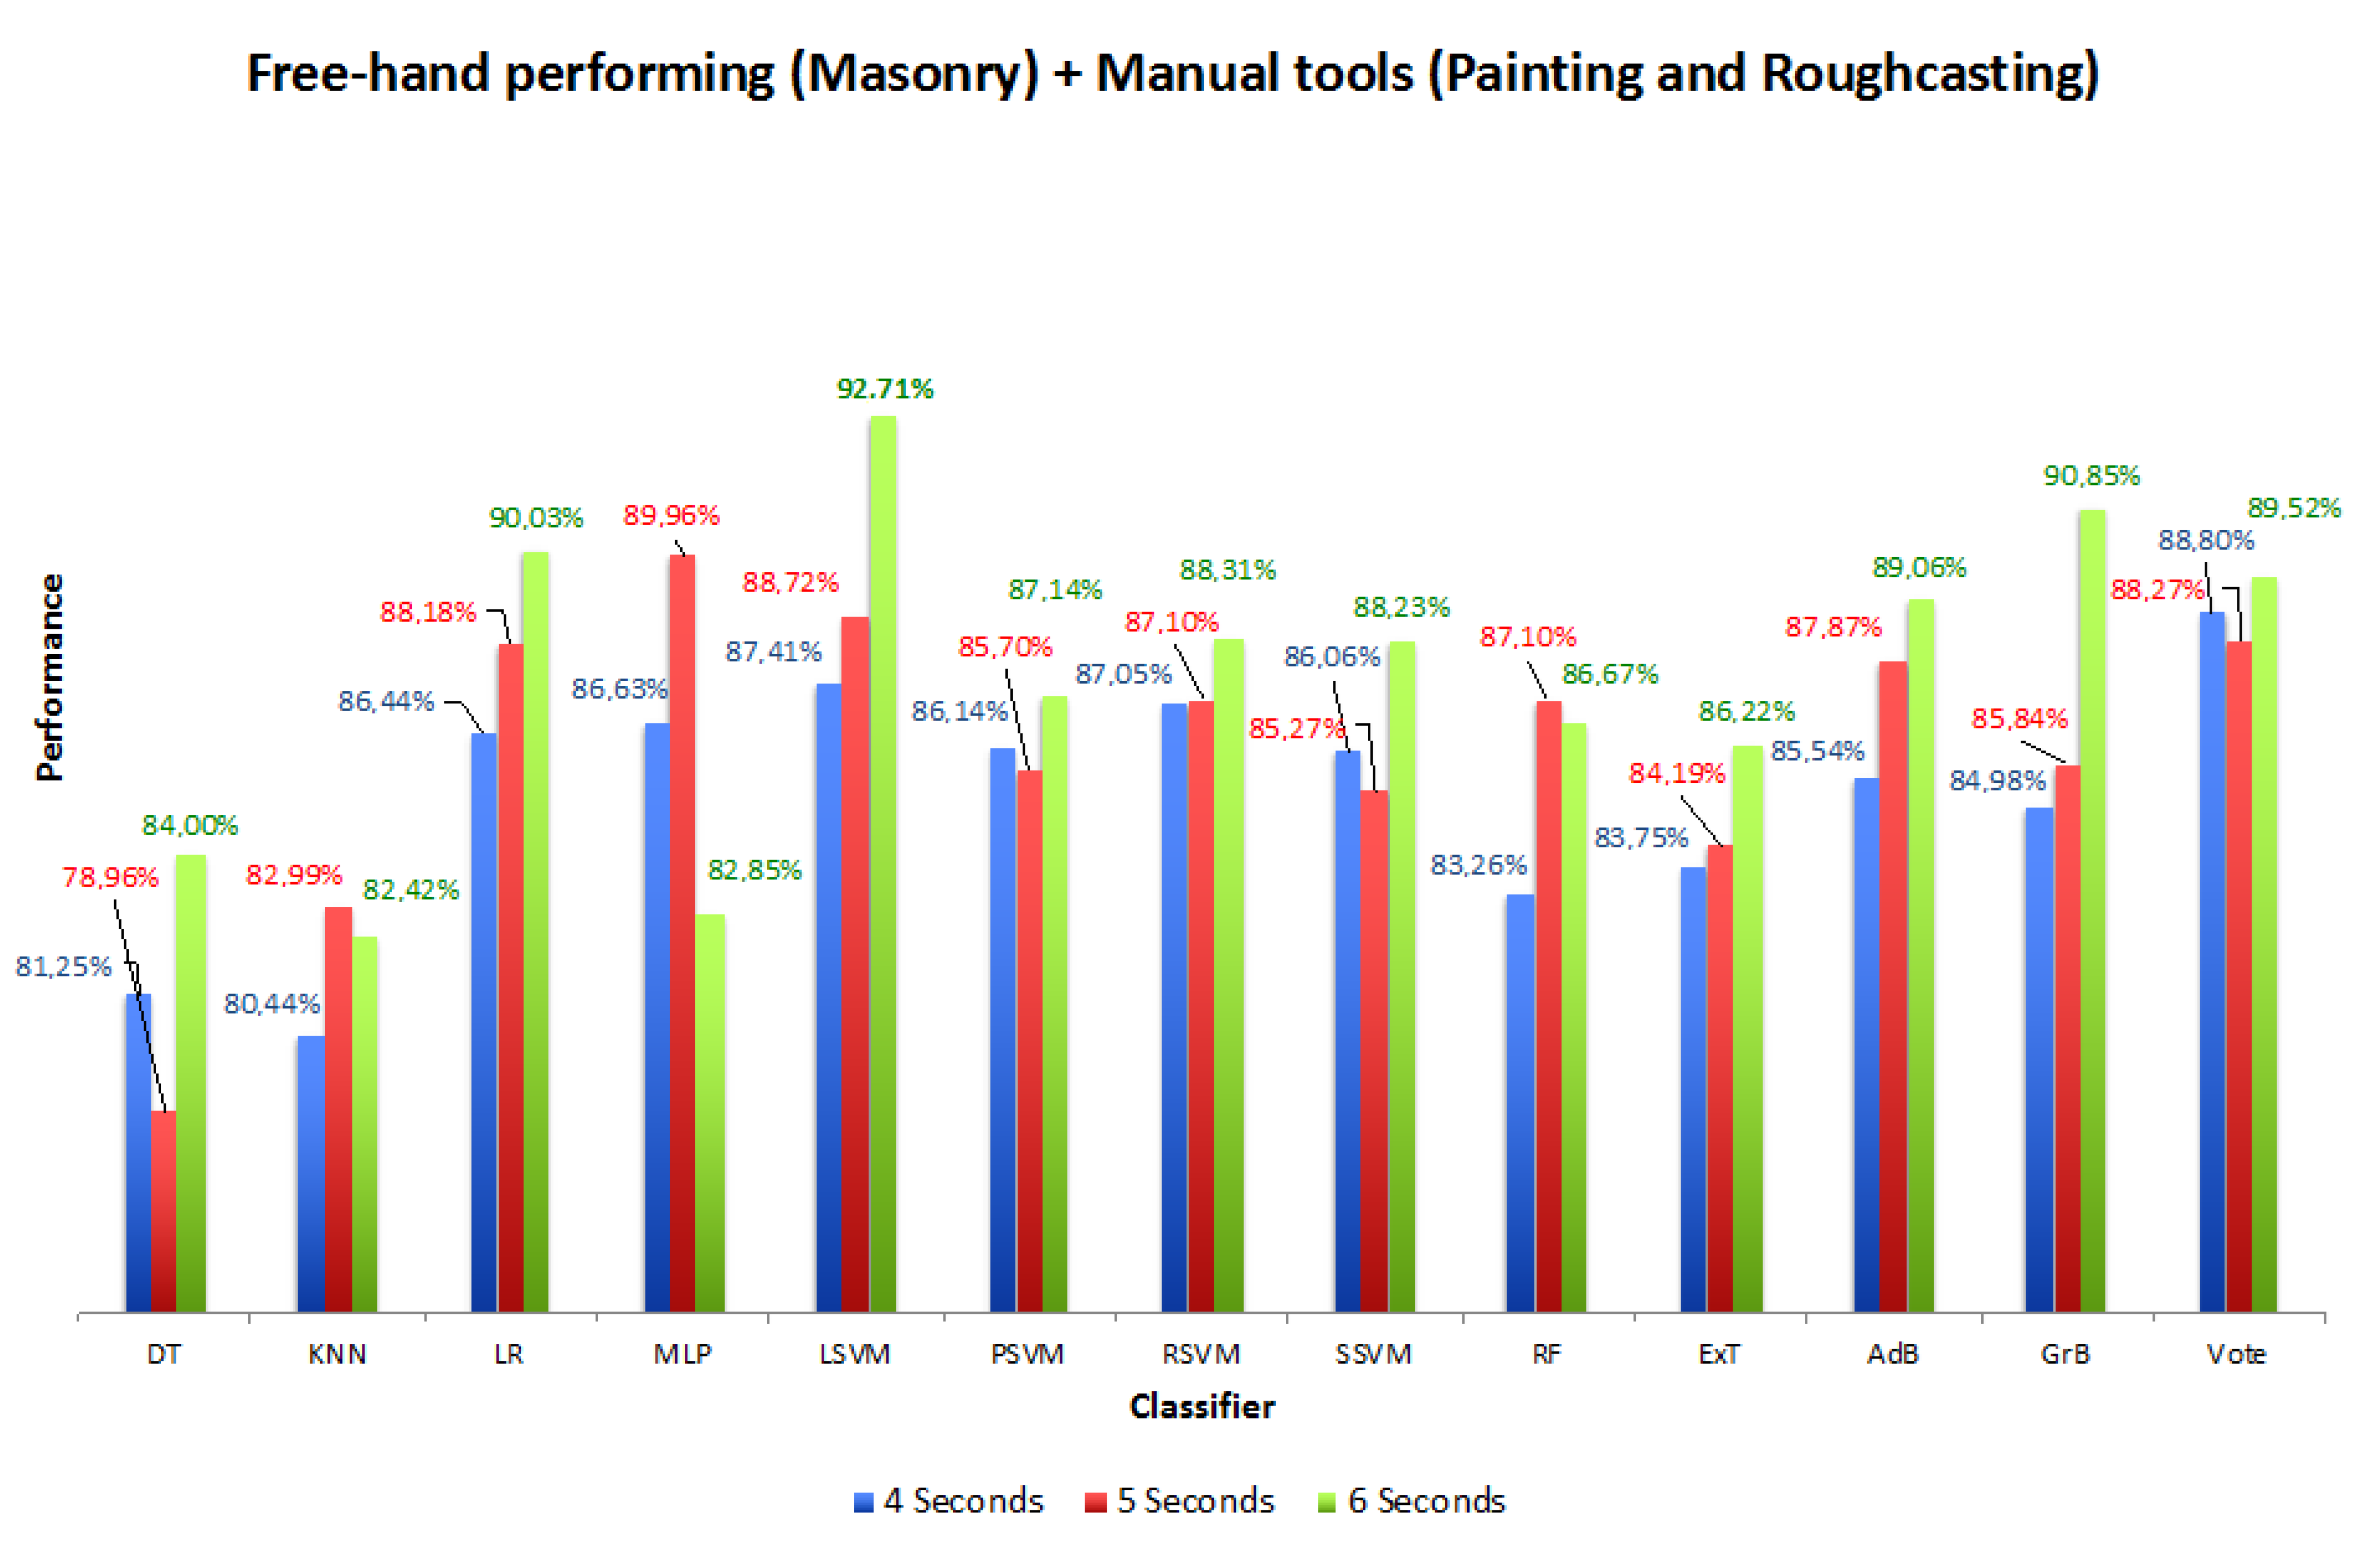
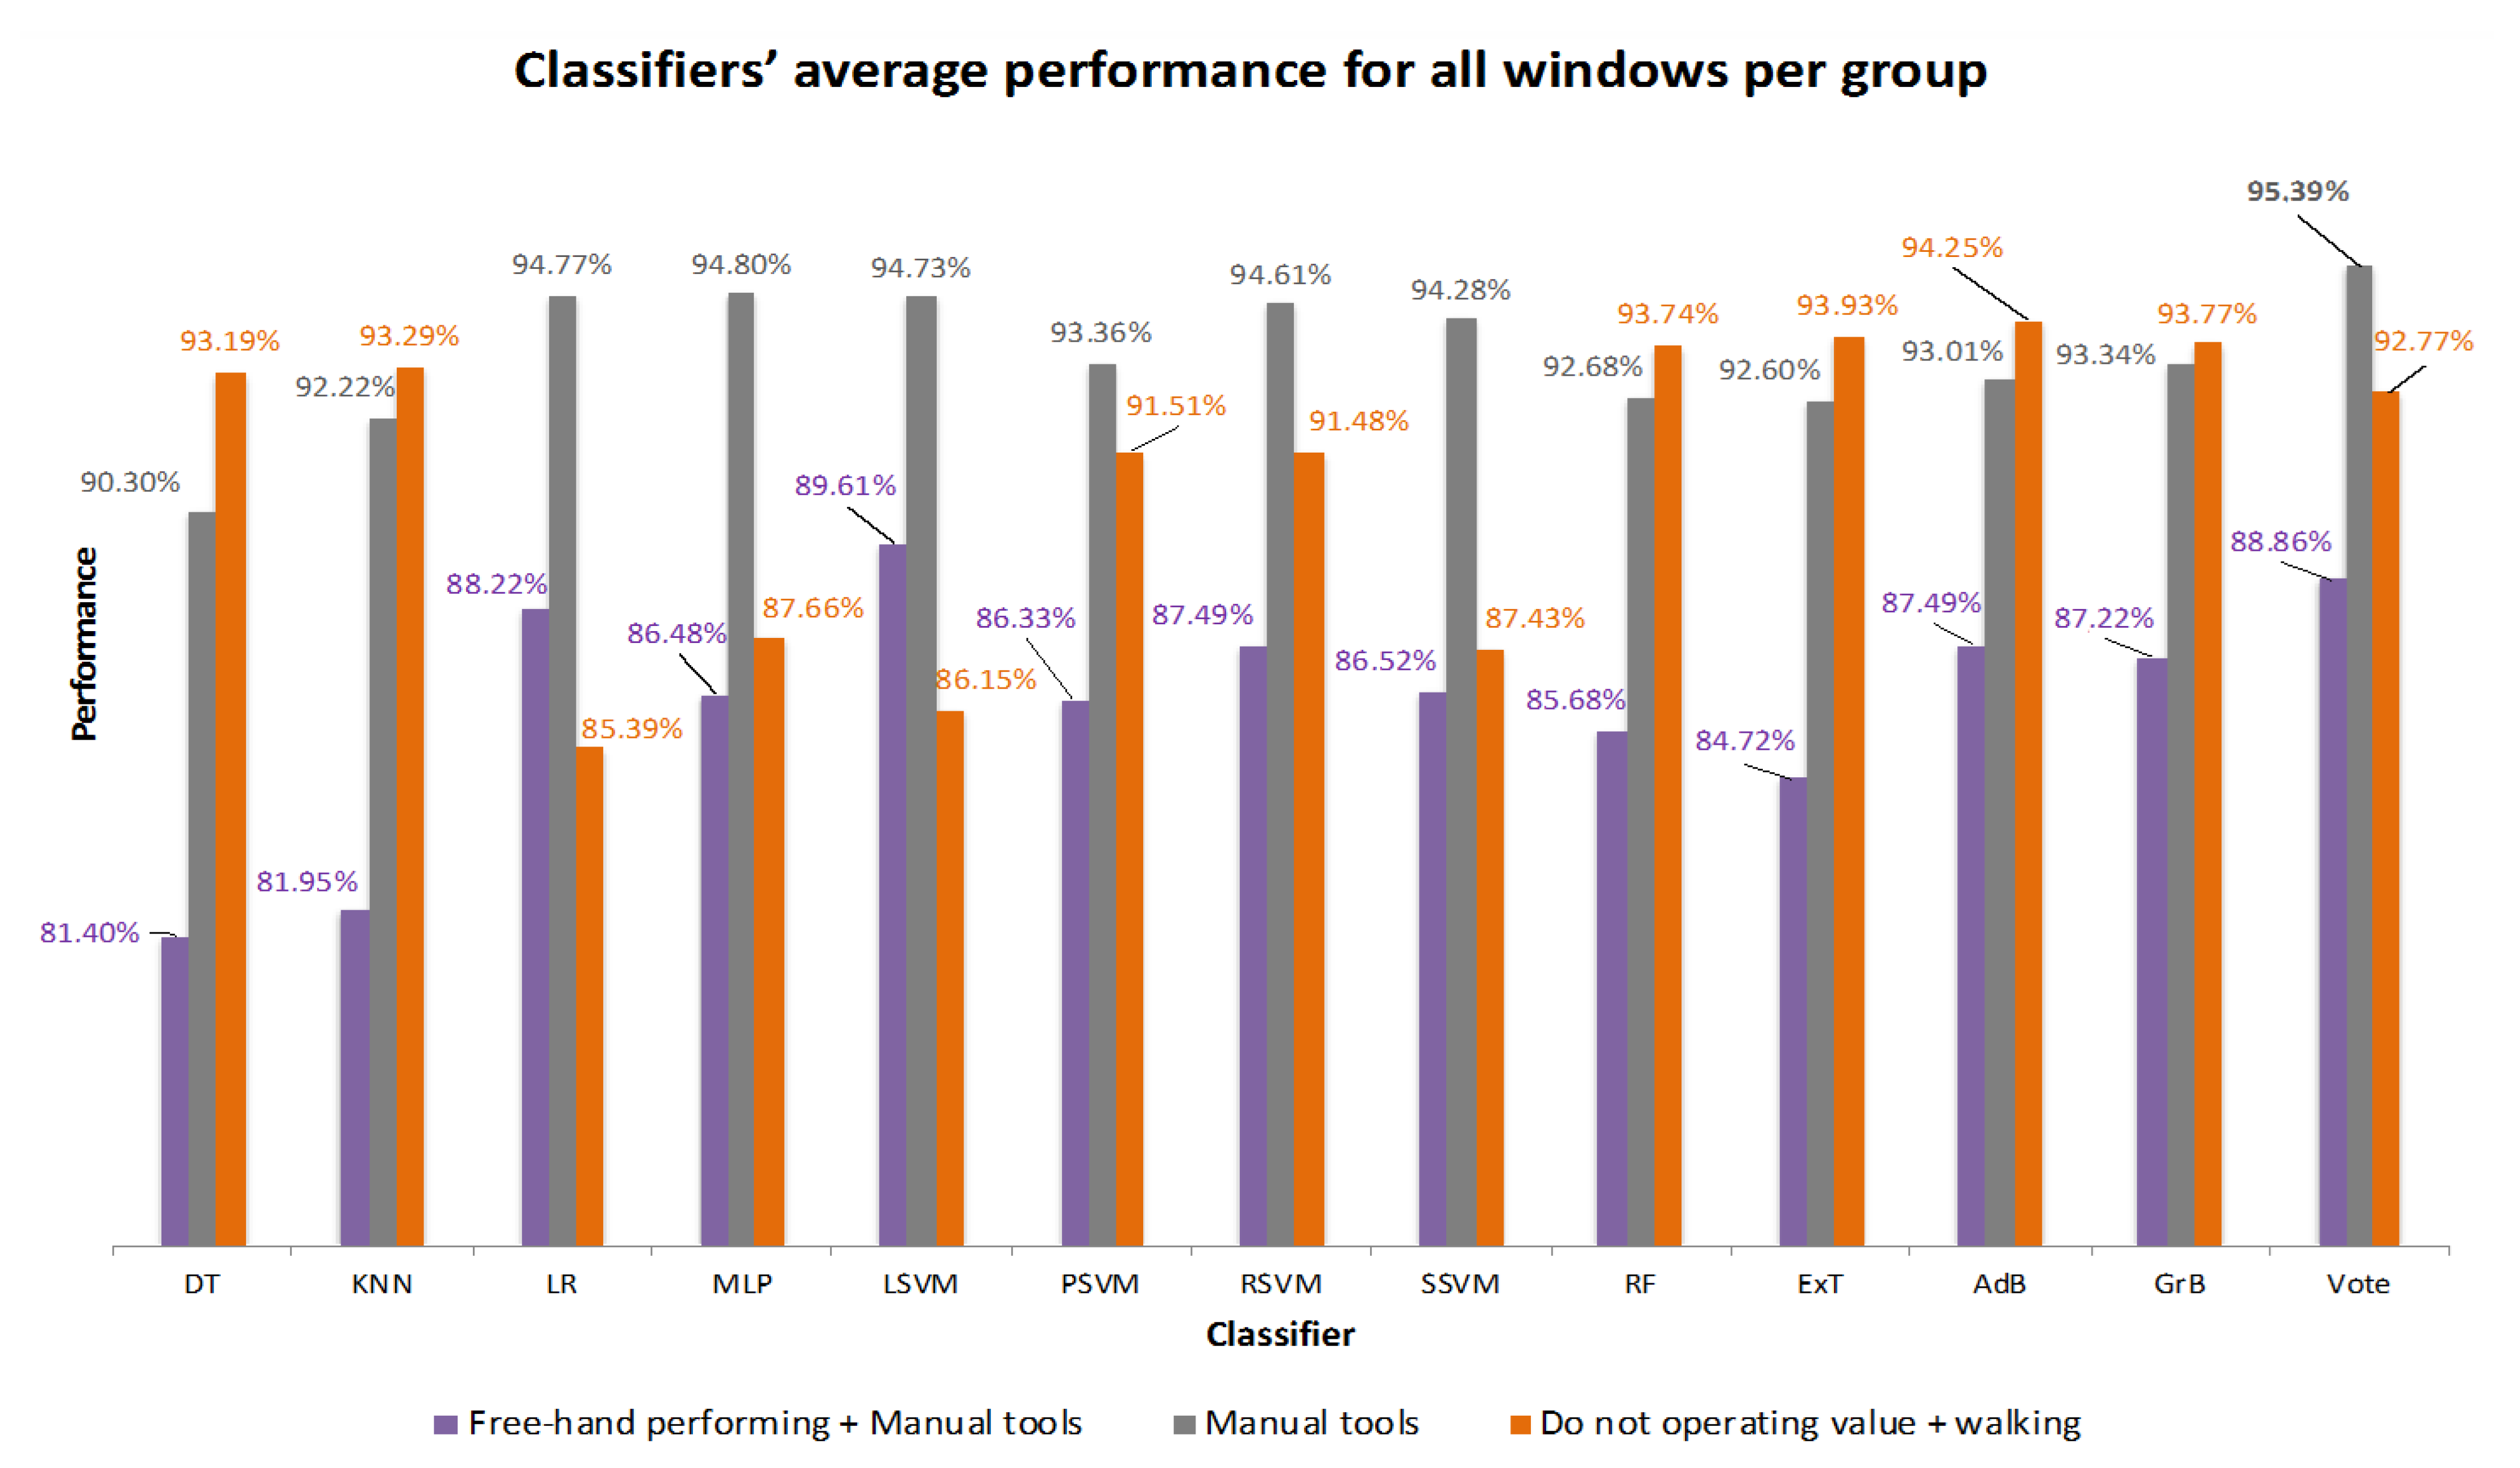
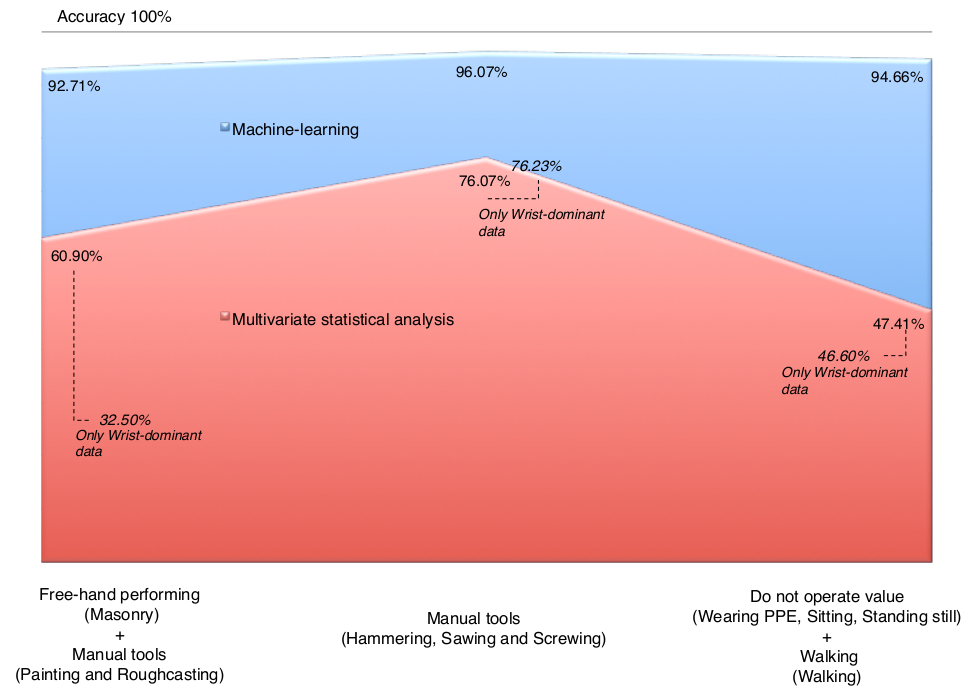
  • The “free-hand performing (Masonry) plus two manual tools (Painting and Roughcasting)” group achieved a 92.71% accuracy for the machine-learning approach and 60.09% for MSA when using three IMUs (both wrists and one at the dominant leg). When using only one IMU (only wrist-dominant data), MSA reached 32.50% accuracy;
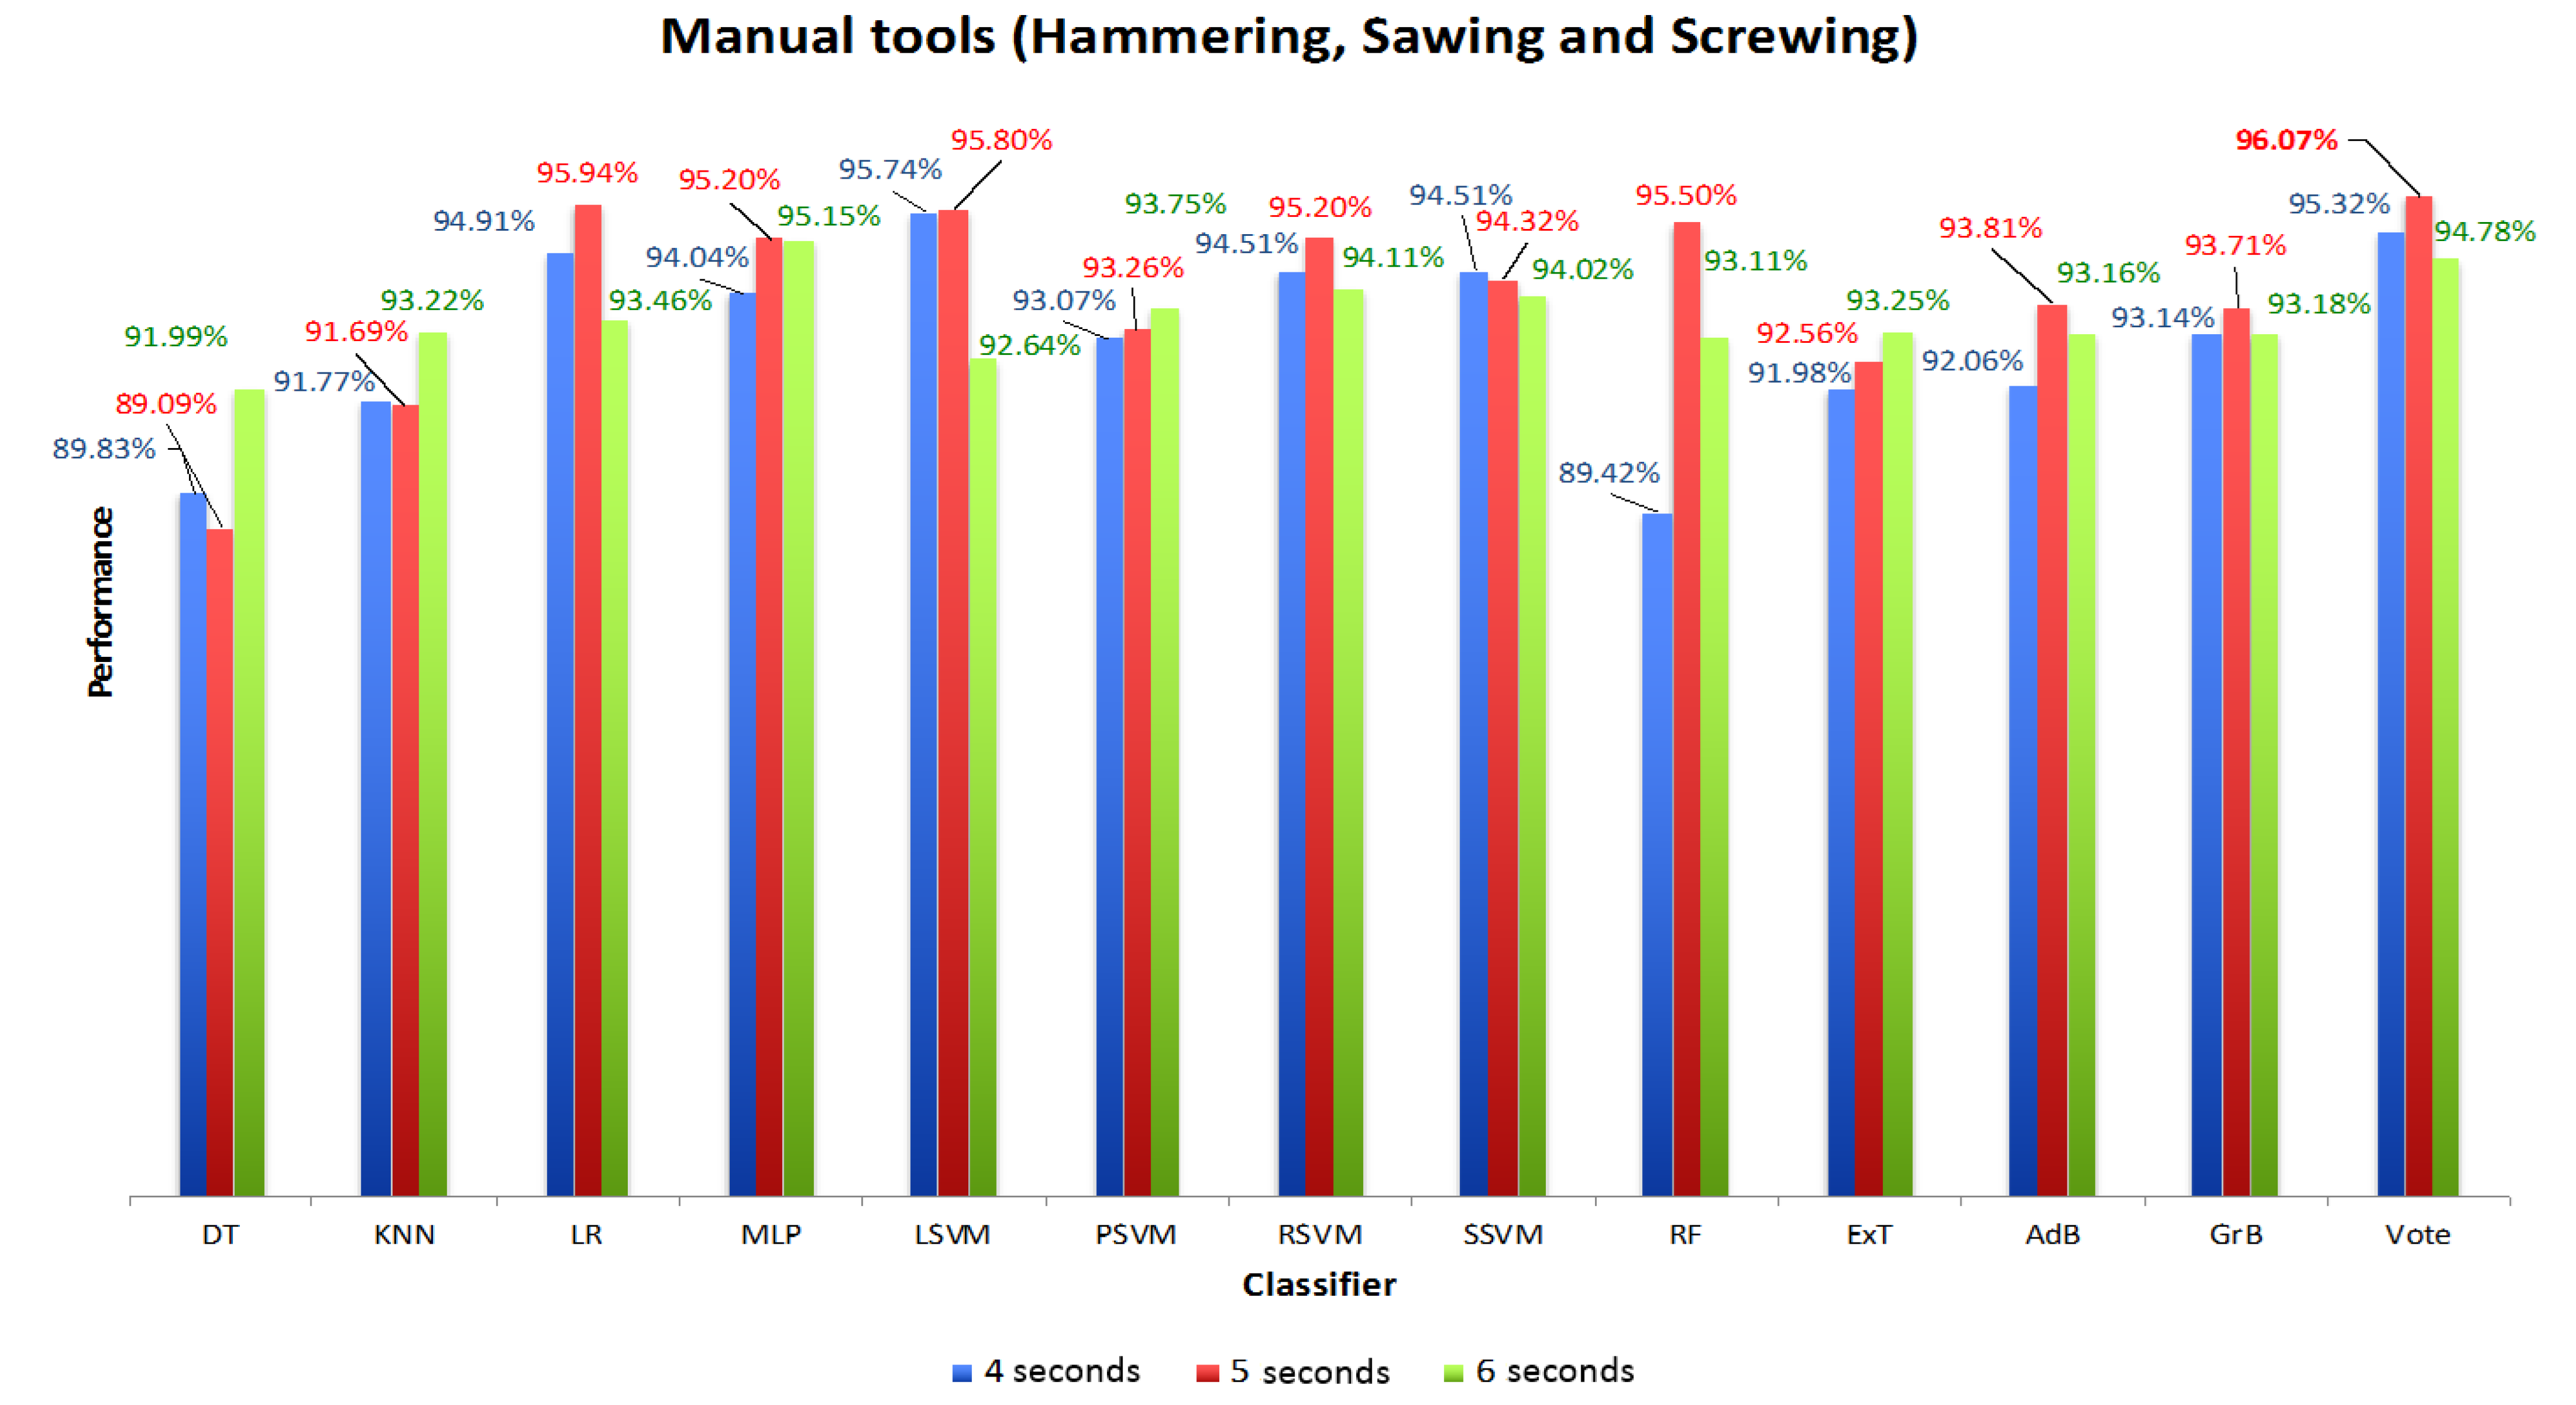
  • The “manual tools (Hammering, Sawing and Screwing)” group achieved a 96.07% accuracy for the machine-learning approach and 76.07% for MSA when using three IMUs (both wrists and one at the dominant leg). When using only one IMU (only wrist-dominant data), MSA reached 76.23% accuracy;
  • Finally, the “do not operate value (Wearing PPE, Sitting, Standing still) and walking (Walking)” group achieved a 94.66% accuracy for the machine-learning approach and 47.41% for MSA when using three IMUs (both wrists and one at the dominant leg). When using only one IMU (only wrist-dominant data), MSA reached 46.60% accuracy.
In practice, the approach of classifying workforce activities is to better understand and map the on-site processes. Proper activity classification is crucial for modelling the construction process and applying lean concepts and unnecessary motion elimination. Task data analysis can quantify the time spent by the worker using a manual tool, walking–travelling or carrying elements, for instance. These data can be used to implement improvements, for example, providing electric tools or bench stations and reorganising the site stock to avoid long walks to collect elements and accessories.
The main contribution of this research is to establish and test an EPM laboratory circuit-based simulation that introduces a way to develop, test and improve in-house EPM solutions for deployment on site. The laboratory circuit is the appropriate testbed environment to develop data processing approaches, for example, mixing methodologies to improve the accuracy and outcome lead time. Additionally, in the laboratory, multiple wearable devices and other technologies (e.g., filming) can be combined in different ways, changing data collection points and assessing the impact of these changes on the solutions’ autonomy, scalability and user comfort.
It is expected that the development of similar circuits in other locations will enable comparisons with the results presented in this paper. Further research will focus on setting a larger circuit, adding activities such as inspection duties, electric tools use and machine operations. Additionally, other mixed approaches to electronic performance monitoring will be tested using images, sound and geolocation. Finally, developing faster and more accurate data processing algorithms is a critical goal for this type of solution to be deployed on site.

Author Contributions

Conceptualisation, D.C.; methodology, D.C. and L.S.; software, D.C. and L.S.; validation, D.C., L.S., P.M. and J.P.M.; formal analysis, P.M., J.P.M., M.C.G. and H.S.; investigation, D.C., M.C.G. and H.S.; resources, J.P.M., M.C.G. and H.S.; data curation, D.C. and L.S.; writing—original draft preparation, D.C., L.S., P.M. and J.P.M.; writing—review and editing, D.C., L.S., P.M. and J.P.M.; visualisation, D.C., L.S., P.M. and J.P.M.; supervision, J.P.M., M.C.G. and H.S.; project administration, J.P.M., M.C.G. and H.S.; funding acquisition, J.P.M., M.C.G. and H.S. All authors have read and agreed to the published version of the manuscript.

Funding

Base Funding of the CONSTRUCT—Instituto de I&D em Estruturas e Construções—funded by national funds through the FCT/MCTES (PIDDAC): UIDB/04708/2020. This work is supported by the European Social Fund (ESF), through the North Portugal Regional Operational Programme (Norte 2020) [Funding Reference: NORTE-06-3559-FSE-000176].

Institutional Review Board Statement

Not applicable.

Informed Consent Statement

Informed consent was obtained from all subjects involved in the study.

Data Availability Statement

Not applicable.

Conflicts of Interest

The authors declare no conflict of interest.

References

  1. Barbosa, F.; Woetzel, J.; Mischke, J. Reinventing Construction: A Route to Higher Productivity; McKinsey Global Institute: Washington, DC, USA, 2017. [Google Scholar]
  2. Farmer, M. The Farmer Review of the UK Construction Labour Model: Modernise or Die; Construction Leadership Council: London, UK, 2016. [Google Scholar]
  3. Desruelle, P.; Baldini, G.; Barboni, M.; Bono, F.; Delipetrev, B.; Duch Brown, N.; Fernandez Macias, E.; Gkoumas, K.; Joossens, E.; Kalpaka, A.; et al. Digital Transformation in Transport, Construction, Energy, Government and Public Administration; Publications Office of the European Union: Luxembourg, 2019. [Google Scholar]
  4. Alder, G.S.; Tompkins, P.K. Electronic Performance Monitoring. Manag. Commun. Q. 1997, 10, 259–289. [Google Scholar] [CrossRef]
  5. Calvetti, D.; Mêda, P.; Gonçalves, M.C.; Sousa, H. Worker 4.0: The Future of Sensored Construction Sites. Buildings 2020, 10, 169. [Google Scholar] [CrossRef]
  6. Edirisinghe, R. Digital skin of the construction site: Smart sensor technologies towards the future smart construction site. Eng. Constr. Archit. Manag. 2019, 26, 184–223. [Google Scholar] [CrossRef]
  7. Alder, G.S.; Ambrose, M.L. An examination of the effect of computerized performance monitoring feedback on monitoring fairness, performance, and satisfaction. Organ. Behav. Hum. Decis. Process. 2005, 97, 161–177. [Google Scholar] [CrossRef]
  8. Alder, G.S. Employee reactions to electronic performance monitoring: A consequence of organizational culture. J. High Technol. Manag. Res. 2001, 12, 323–342. [Google Scholar] [CrossRef]
  9. U.S. Congress Office of Technology Assessment. The Electronic Supervisor: New Technology, New Tensions; U.S. Government Printing Office: Washington, DC, USA, 1987.
  10. Schleifer, L.M. Electronic performance monitoring (EPM). Appl. Ergon. 1992, 23, 4–5. [Google Scholar] [CrossRef]
  11. Yang, J.; Park, M.W.; Vela, P.A.; Golparvar-Fard, M. Construction performance monitoring via still images, time-lapse photos, and video streams: Now, tomorrow, and the future. Adv. Eng. Inform. 2015, 29, 211–224. [Google Scholar] [CrossRef]
  12. Liou, F.; Borcherding, J.D.; Borcherding John, D. Work Sampling Can Predict Unit Rate Productivity. J. Constr. Eng. Manag. 1986, 112, 90–103. [Google Scholar] [CrossRef]
  13. Calvetti, D.; Gonçalves, M.C.; Vahl, F.P.; Meda, P.; de Sousa, H.J.C. Labour productivity as a means for assessing environmental impact in the construction industry. Environ. Eng. Manag. J. 2021, 20, 781–790. [Google Scholar] [CrossRef]
  14. Mojahed, S.; Aghazadeh, F. Major factors influencing productivity of water and wastewater treatment plant construction: Evidence from the deep south USA. Int. J. Proj. Manag. 2008, 26, 195–202. [Google Scholar] [CrossRef]
  15. Sacks, R.; Brilakis, I.; Pikas, E.; Xie, H.S.; Girolami, M. Construction with digital twin information systems. Data-Centric Eng. 2020, 1, e14. [Google Scholar] [CrossRef]
  16. Mêda, P.; Calvetti, D.; Hjelseth, E.; Sousa, H. Incremental Digital Twin Conceptualisations Targeting Data-Driven Circular Construction. Buildings 2021, 11, 554. [Google Scholar] [CrossRef]
  17. Zheng, X.; Wang, M.; Ordieres-Meré, J. Comparison of data preprocessing approaches for applying deep learning to human activity recognition in the context of industry 4.0. Sensors 2018, 18, 2146. [Google Scholar] [CrossRef] [PubMed]
  18. Ryu, J.; Seo, J.; Liu, M.; Lee, S.; Haas, C.T. Action Recognition Using a Wristband-Type Activity Tracker: Case Study of Masonry Work. In Proceedings of the Construction Research Congress, San Juan, Puerto Rico, 31 May–2 June 2016; ASCE: Reston, VA, USA, 2016; pp. 790–799. [Google Scholar]
  19. Ryu, J.; Seo, J.; Jebelli, H.; Lee, S. Automated Action Recognition Using an Accelerometer-Embedded Wristband-Type Activity Tracker. J. Constr. Eng. Manag. 2019, 145, 04018114. [Google Scholar] [CrossRef]
  20. Bao, L.; Intille, S.S. Activity recognition from user-annotated acceleration data. In Proceedings of the Second International Conference, PERVASIVE 2004, Vienna, Austria, 21–23 April 2004; Springer: Berlin/Heidelberg, Germany; New York, NY, USA, 2004; pp. 1–17. [Google Scholar]
  21. Joshua, L.; Varghese, K. Automated recognition of construction labour activity using accelerometers in field situations. Int. J. Product. Perform. Manag. 2014, 63, 841–862. [Google Scholar] [CrossRef]
  22. Akhavian, R.; Behzadan, A. Wearable sensor-based activity recognition for data-driven simulation of construction workers’ activities. In Proceedings of the Winter Simulation Conference, Huntington Beach, CA, USA, 6–9 December 2015; IEEE: Piscataway, NJ, USA, 2015; pp. 3333–3344. [Google Scholar]
  23. Akhavian, R.; Behzadan, A.H. Smartphone-based construction workers’ activity recognition and classification. Autom. Constr. 2016, 71, 198–209. [Google Scholar] [CrossRef]
  24. Akhavian, R.; Brito, L.; Behzadan, A. Integrated Mobile Sensor-Based Activity Recognition of Construction Equipment and Human Crews. In Proceedings of the Conference on Autonomous and Robotic Construction of Infrastructure, Ames, IA, USA, 2–3 June 2015; pp. 1–20. [Google Scholar]
  25. Akhavian, R.; Behzadan, A.H. Coupling human activity recognition and wearable sensors for data-driven construction simulation. J. Inf. Technol. Constr. 2018, 23, 1–15. [Google Scholar]
  26. Zhang, M.; Chen, S.; Zhao, X.; Yang, Z. Research on construction workers’ activity recognition based on smartphone. Sensors 2018, 18, 2667. [Google Scholar] [CrossRef]
  27. Sztyler, T.; Stuckenschmidt, H. On-body localization of wearable devices: An investigation of position-aware activity recognition. In Proceedings of the 2016 IEEE International Conference on Pervasive Computing and Communications, PerCom 2016, Sydney, NSW, Australia, 14–19 March 2016; IEEE: Piscataway, NJ, USA, 2016; pp. 1–9. [Google Scholar]
  28. Tao, W.; Lai, Z.H.; Leu, M.C.; Yin, Z. Worker Activity Recognition in Smart Manufacturing Using IMU and sEMG Signals with Convolutional Neural Networks. Procedia Manuf. 2018, 26, 1159–1166. [Google Scholar] [CrossRef]
  29. Ordóñez, F.J.; Roggen, D. Deep convolutional and LSTM recurrent neural networks for multimodal wearable activity recognition. Sensors 2016, 16, 115. [Google Scholar] [CrossRef]
  30. Yang, K.; Jebelli, H.; Ahn, C.R.; Vuran, M.C. Threshold-Based Approach to Detect Near-Miss Falls of Iron-Workers Using Inertial Measurement Units. In Proceedings of the Computing in Civil Engineering 2015, Austin, TX, USA, 21–23 June 2015; ASCE: Reston, VA, USA, 2015; pp. 148–155. [Google Scholar]
  31. Yang, K.; Ahn, C.R.; Vuran, M.C.; Aria, S.S. Semi-supervised near-miss fall detection for ironworkers with a wearable inertial measurement unit. Autom. Constr. 2016, 68, 194–202. [Google Scholar] [CrossRef]
  32. Joshua, L.; Varghese, K. Classification of bricklaying activities in work sampling categories using accelerometers. In Proceedings of the Construction Research Congress 2012: Construction Challenges in a Flat World, West Lafayette, IN, USA, 21–23 May 2012; pp. 919–928. [Google Scholar]
  33. Sanhudo, L.; Calvetti, D.; Martins, J.P.; Ramos, N.M.M.; Magalhães, P.M.; Gonçalves, M.C.; de Sousa, H.J.C. Activity Classification using Accelerometers and Machine Learning for Complex Construction Worker Activities. J. Build. Eng. 2021, 35, 102001. [Google Scholar] [CrossRef]
  34. Freivalds, A. Niebel’s Methods, Standards, and Work Design; Mcgraw-Hill Higher Education: Boston, MA, USA, 2009; Volume 700. [Google Scholar]
  35. Meyers, F.E.; Stewart, J.R. Motion and Time Study for Lean Manufacturing, 3rd ed.; Prentice Hall: Hoboken, NJ, USA, 2002; ISBN 0-13-031670-9. [Google Scholar]
  36. Groover, M.P. Work Systems and the Methods, Measurement, and Management of Work; Pearson Prentice Hall: Hoboken, NJ, USA, 2007; ISBN 9780131406506. [Google Scholar]
  37. Adrian, J.J. Construction Productivity: Measurement and Improvement; Stipes Publishing: Champaign, IL, USA, 2004. [Google Scholar]
  38. Calvetti, D.; Ferreira, M.L.R. Agile Methodology to Performance Measure and Identification of Impact Factors in the Labour Productivity of Industrial Workers. U.Porto J. Eng. 2018, 4, 49–64. [Google Scholar] [CrossRef]
  39. Akhavian, R.; Behzadan, A.H. Productivity Analysis of Construction Worker Activities Using Smartphone Sensors. In Proceedings of the 16th International Conference on Computing in Civil and Building Engineering (ICCCBE), Osaka, Japan, 6–8 July 2016; pp. 1067–1074. [Google Scholar]
  40. Joshua, L.; Varghese, K. Accelerometer-based activity recognition in construction. J. Comput. Civ. Eng. 2011, 25, 370–379. [Google Scholar] [CrossRef]
  41. Bangaru, S.S.; Wang, C.; Aghazadeh, F. Data quality and reliability assessment of wearable emg and IMU sensor for construction activity recognition. Sensors 2020, 20, 5264. [Google Scholar] [CrossRef]
  42. Calvetti, D. Multivariate Statistical Analysis Approach to Cluster Construction Workers based on Labor Productivity Performance. U.Porto J. Eng. 2018, 4, 16–33. [Google Scholar] [CrossRef]
  43. Nweke, H.F.; Teh, Y.W.; Al-garadi, M.A.; Alo, U.R. Deep learning algorithms for human activity recognition using mobile and wearable sensor networks: State of the art and research challenges. Expert Syst. Appl. 2018, 105, 233–261. [Google Scholar] [CrossRef]
  44. Nath, N.D.; Chaspari, T.; Behzadan, A.H. Automated ergonomic risk monitoring using body-mounted sensors and machine learning. Adv. Eng. Inform. 2018, 38, 514–526. [Google Scholar] [CrossRef]
  45. Marr, B. Artificial Intelligence: What’s the Difference Between Deep Learning and Reinforcement Learning? Available online: https://www.forbes.com/sites/bernardmarr/2018/10/22/artificial-intelligence-whats-the-difference-between-deep-learning-and-reinforcement-learning/#27bf005f271e (accessed on 22 October 2020).
  46. Jakhar, D.; Kaur, I. Artificial intelligence, machine learning and deep learning: Definitions and differences. Clin. Exp. Dermatol. 2020, 45, 131–132. [Google Scholar] [CrossRef]
  47. Marôco, J. Análise Estatística com o SPSS Statistics; ReportNumber, Lda: Pero Pinheiro, Portugal, 2011; ISBN 9899676322. [Google Scholar]
Figure 1. Research flow chart.
Buildings 12 01174 g001
Figure 2. Laboratory circuit with the path and activity sequence, the first set by the numbers and the following by the letters.
Buildings 12 01174 g002
Figure 3. Laboratory experiment method.
Buildings 12 01174 g003
Figure 4. Motion characteristic of Masonry, Painting and Roughcast.
Buildings 12 01174 g004
Figure 5. Motion characteristic of Hammering, Sawing and Screwing.
Buildings 12 01174 g005
Figure 6. Motion characteristic of Wearing PPE, Sitting, Standing still and Walking.
Buildings 12 01174 g006
Figure 7. Cross-validation approach comprising two training loops.
Buildings 12 01174 g007
Figure 8. Classifiers’ performance for Masonry, Painting and Roughcasting.
Buildings 12 01174 g008
Figure 9. Classifiers’ performance for Hammering, Sawing and Screwing.
Buildings 12 01174 g009
Figure 10. Classifiers’ performance for Wearing PPE, Sitting, Standing still and Walking.
Buildings 12 01174 g010
Figure 11. Classifiers’ average performance for all groups per window.
Buildings 12 01174 g011
Figure 12. Classifiers’ average performance for all groups per window.
Buildings 12 01174 g012
Figure 13. All ten activities at once (6 s window).
Buildings 12 01174 g013
Figure 14. Machine learning vs. Multivariate statistical analysis.
Buildings 12 01174 g014
Figure 15. Comparative evaluation.
Buildings 12 01174 g015
Table 1. Studies on activity/process recognition.
Ref.On-Site Experiment?YearSubjectsActivity/Process Recognition
[22]No, simulation on a binary approach20164(1) Cutting Lumber;
(2) Transportation;
(3) Installation.
[24]No, simulation on a binary approach20154Category 1
(1) Sawing;
(2) Idling.
Category 2
(2) Idling;
(3) Hammering;
(4) Turning a wrench.
Category 3
(2) Idling;
(5) Loading sections into a wheelbarrow;
(6) Pushing a loaded wheelbarrow;
(7) Dumping sections from a wheelbarrow;
(8) Returning an empty wheelbarrow.
[23]No, simulation on a binary approach20164(1) Cutting Lumber;
(2) Transportation;
(3) Installation.
[25]No, simulation on a binary approach20184Category 1
(1) Sawing;
(2) Idling.
Category 2
(2) Idling;
(3) Hammering;
(4) Turning a wrench.
Category 3
(2) Idling;
(5) Loading sections into a wheelbarrow;
(6) Pushing a loaded wheelbarrow;
(7) Dumping sections from a wheelbarrow;
(8) Returning an empty wheelbarrow.
[39]No, simulation on a binary approach20164Category 1
(1) Sawing;
(2) Idling.
Category 2
(2) Idling;
(3) Hammering;
(4) Turning a wrench.
Category 3
(2) Idling;
(5) Loading sections into a wheelbarrow;
(6) Pushing a loaded wheelbarrow;
(7) Dumping sections from a wheelbarrow;
(8) Returning an empty wheelbarrow.
[26]No, simulation (not possible to infer the method)20189(1) Standing;
(2) Walking;
(3) Squatting;
(4) Cleaning up the template;
(5) Fetching and placing rebar;
(6) Locating the rebar;
(7) Binding rebar;
(8) Placing concrete pads.
[28]No, simulation (static, performing actions over a table/workstation)20188(1) Grabbing tool/part;
(2) Hammering nail;
(3) Using power screwdriver;
(4) Resting arm;
(5) Turning screwdriver;
(6) Using wrench.
[18]No, simulation (in a training centre with workers)20165(1) Spreading mortar;
(2) Bringing and laying blocks;
(3) Adjusting blocks;
(4) Removing remaining mortar.
[19]No, simulation (in a training centre with workers)201910(1) Spreading mortar;
(2) Bringing and laying blocks;
(3) Adjusting blocks;
(4) Removing remaining mortar.
[32]Yes, on-site2012-(1) Effective work;
(2) Contributory work;
(3) Ineffective work.
[21]Yes, on-site201420(1) Effective work;
(2) Contributory work;
(3) Ineffective work.
[40]No, simulation (not possible to infer the method)2011-(1) Fetching and spreading mortar;
(2) Fetching and laying brick;
(3) Filling joints.
[41]No, simulation on a binary approach20208(1) Screwing;
(2) Wrenching;
(3) Lifting;
(4) Carrying.
Table 2. Data collected.
Masonry, Painting and RoughcastingHammering, Sawing and ScrewingWearing PPE, Sitting, Standing Still, WalkingTotal
Experiment Timingseconds3046364426189308
minutes516144155
Labelling Timingminutes5086074361551
Acceleration data pointsWrists and Leg27,41432,79623,56283,772
Wrist (dominant)913810,932785427,924
Table 3. Set-up of three clusters.
Output Created
InputActive DatasetDataSet0
Filter<none>
Weight<none>
Split File<none>
N of Rows in Working Data File3046
Missing Value HandlingDefinition of MissingUser-defined missing values are treated as missing.
Cases UsedStatistics are based on cases with no missing values for any clustering variable used.
SyntaxWrist (dominant) 3 VAR
Wrist (non-dominant) 3 VAR
Leg (dominant) 3 VAR
QUICK CLUSTER VAR00006-07-08-09-10-11-12-13-014
/MISSING = LISTWISE
/CRITERIA = CLUSTER(3) MXITER(10) CONVERGE(0)
/METHOD = KMEANS(NOUPDATE)
/SAVE CLUSTER DISTANCE
/PRINT INITIAL ANOVA CLUSTER DISTAN.
ResourcesProcessor Time00:00:00.39
Elapsed Time00:00:00.00
Workspace Required1944 bytes
QCL_2Distance of Case from its Classification Cluster Centre
Table 4. Interaction history.
IterationChange in Cluster Centres
RoughcastPaintingMasonry
1313.4141199.5498246.4082
263.280425.8395110.5989
326.427318.729238.7331
412.94469.384215.5661
57.78455.56104.5176
63.93392.92091.3539
73.0502.40740.9133
81.7721.35210.3767
91.13670.83860.2579
100.85160.66060
Table 5. Distances between final cluster centres.
ClusterRoughcastPaintingMasonry
Roughcast 159.1544283.4235
Painting159.1544 233.6170
Masonry283.4235233.6170
Table 6. Number of cases.
Number of Cases in Each Cluster
Roughcast1022
Painting1309
Masonry715
Valid3046
Missing0
Table 7. Verification process.
SubjectTaskTimeWrist (Dominant)WristLegCase N.ClusterDistanceTest
1Masonry10:40:18284117212131123113924062942Masonry268.6488TRUE
1Masonry10:40:195066992271101646011996943Masonry156.0831TRUE
1Masonry10:40:20676399696518014113590944Masonry124.6410TRUE
1Masonry10:40:21112836698016514313539945Masonry132.9037TRUE
1Masonry10:40:224159551219357115531946Painting137.2267FALSE
1Masonry10:40:2320116015343634212471947Roughcast134.2535FALSE
Table 8. Set-up of three clusters.
Output Created
InputActive DatasetDataSet0
Filter<none>
Weight<none>
Split File<none>
N of Rows in Working Data File3644
Missing Value HandlingDefinition of MissingUser-defined missing values are treated as missing.
Cases UsedStatistics are based on cases with no missing values for any clustering variable used.
SyntaxWrist (dominant) 3 VAR
Wrist (non-dominant) 3 VAR
Leg (dominant) 3 VAR
QUICK CLUSTER VAR00006-07-08-09-10-11-12-13-014
/MISSING = LISTWISE
/CRITERIA = CLUSTER(3) MXITER(10) CONVERGE(0) /METHOD = KMEANS(NOUPDATE)
/SAVE CLUSTER DISTANCE
/PRINT INITIAL ANOVA CLUSTER DISTAN.
ResourcesProcessor Time00:00:00.44
Elapsed Time00:00:00.00
Workspace Required1944 bytes
Variables Created or ModifiedQCL_1Cluster Number of Case
QCL_2Distance of Case from its Classification Cluster Centre
Table 9. Interaction history.
Change in Cluster Centres
IterationSawingScrewingHammering
1261.0570345.3322323.5139
258.581076.706255.8298
365.075825.033721.6352
414.499611.56378.7550
53.30596.62063.7269
60.53694.24382.0083
70.43532.39901.0646
801.27040.5940
900.78040.3616
1000.84720.3929
Table 10. Distances between final cluster centres.
ClusterSawingScrewingHammering
Sawing 260.6854244.6953
Screwing260.6854 108.0933
Hammering244.6953 108.0933
Table 11. Number of cases.
Number of Cases in Each Cluster
ClusterSawing1172
Screwing783
Hammering1689
Valid 3644
Missing 0
Table 12. Validation process.
SubjectTaskTimeWrist (Dominant)WristLegCase N.ClusterDistanceTest
2Sawing14:34:4726225460400007Sawing290,162TRUE
2Sawing14:34:4817136350100008Sawing1,086,854TRUE
2Sawing14:34:49852221520000009Screwing1,380,763FALSE
2Sawing14:34:50439131400000010Screwing2,154,279FALSE
2Sawing14:34:5183258100000011Hammering821,257FALSE
2Sawing14:34:52337723200001112Sawing638,884TRUE
Table 13. Set-up of four clusters.
Output Created
InputActive DatasetDataSet0
Filter<none>
Weight<none>
Split File<none>
N of Rows in Working Data File2618
Missing Value HandlingDefinition of MissingUser-defined missing values are treated as missing.
Cases UsedStatistics are based on cases with no missing values for any clustering variable used.
SyntaxWrist (dominant) 3 VAR
Wrist (non-dominant) 3 VAR
Leg (dominant) 3 VAR
QUICK CLUSTER VAR00006-07-08-09-10-11-12-13-014
/MISSING = LISTWISE
/CRITERIA = CLUSTER(4) MXITER(10) CONVERGE(0)
/METHOD = KMEANS(NOUPDATE)
/SAVE CLUSTER DISTANCE
/PRINT INITIAL ANOVA CLUSTER DISTAN.
ResourcesProcessor Time00:00:00.37
Elapsed Time00:00:00.00
Workspace Required2288 bytes
Variables Created or ModifiedQCL_1Cluster Number of Case
QCL_2Distance of Case from its Classification Cluster Centre
Table 14. Interaction history.
Change in Cluster Centres
IterationStanding StillWalkingWearing PPESitting
1253.1632271.7627253.8942247.4363
234.666823.813228.916241.9111
315.328511.906930.534516.2089
412.83814.694937.31999.3450
511.10226.063629.65768.6092
69.22943.835519.17645.9783
77.28043.481015.12765.1283
87.48171.949912.96994.6997
96.07550.847310.07645.9705
103.67531.36176.60545.3191
Table 15. Distances between final cluster centres.
ClusterStanding StillWalkingWearing PPESitting
Standing still 272.6942185.9325362.6586
Walking272.6942 190.9127162.3144
Wearing PPE185.9325190.9127 228.9966
Sitting362.6586162.3144228.9966
Table 16. Number of cases.
Number of Cases in Each Cluster
ClusterStanding still763
Walking742
Wearing PPE725
Sitting388
Valid 2618
Missing 0
Table 17. Validation process.
SubjectTaskTimeWrist (Dominant)WristLegCase N.ClusterDistanceTest
4Walking15:29:51533914517527193193347930Wearing1,636,731FALSE
4Walking15:29:5211068286963241257760931Wearing2,104,327FALSE
4Walking15:29:53744610077761409713050932Walking896,969TRUE
4Walking15:29:541244873229920811517528933Walking1,569,528TRUE
4Walking15:29:5511257727116424510319729934Walking1,987,402TRUE
4Walking15:29:56581262336818830210416838935Sitting2,836,098FALSE
Table 18. Classification results summary.
DataFree-Hand Performing Plus Manual ToolsManual ToolsDo Not Operate Value Plus WalkingAverageMedian
AccuracyWrists and Leg60.90%76.07%47.41%61.46%60.90%
Wrist (dominant)32.50%76.23%46.60%51.78%46.60%
Difference>28.4%<0.16%>0.81%
Acceleration data pointsWrists and Leg27,41432,79623,562
Wrist (dominant)913810,9327854
The maximum absolute coordinate change for any centreWrists and Leg0.8360.5473.637
The minimum distance between initial centresWrists and Leg584.024575.296531.495
Table 19. Clustering results summary.
DataFree-Hand Performing Plus Manual ToolsManual ToolsDo Not Operate Value Plus Walking
Distances between final cluster centresi159.1544260.6854272.6942
ii283.4235244.6953185.9325
iii233.6170108.0933362.6586
iv 190.9127
v 162.3144
vi 228.9966
Average225.3983204.4913233.9182
The maximum absolute coordinate change for any centreWrist (dominant)9.5361.0419.544
The minimum distance between initial centresWrist (dominant)512.347512.347481.594
Distances between final cluster centresi131.3473241.3922163.2217
ii205.7065107.7671192.3734
iii128.8105257.2948271.5576
iv 120.2651
v 111.9096
vi 195.5329
Average155.2882202.1514175.8099
Publisher’s Note: MDPI stays neutral with regard to jurisdictional claims in published maps and institutional affiliations.

