
Revealing Impacts of Trees on Modeling Microclimate Behavior in Spaces between Buildings through Simulation Monitoring


Abstract
:1. Introduction
2. Methodology
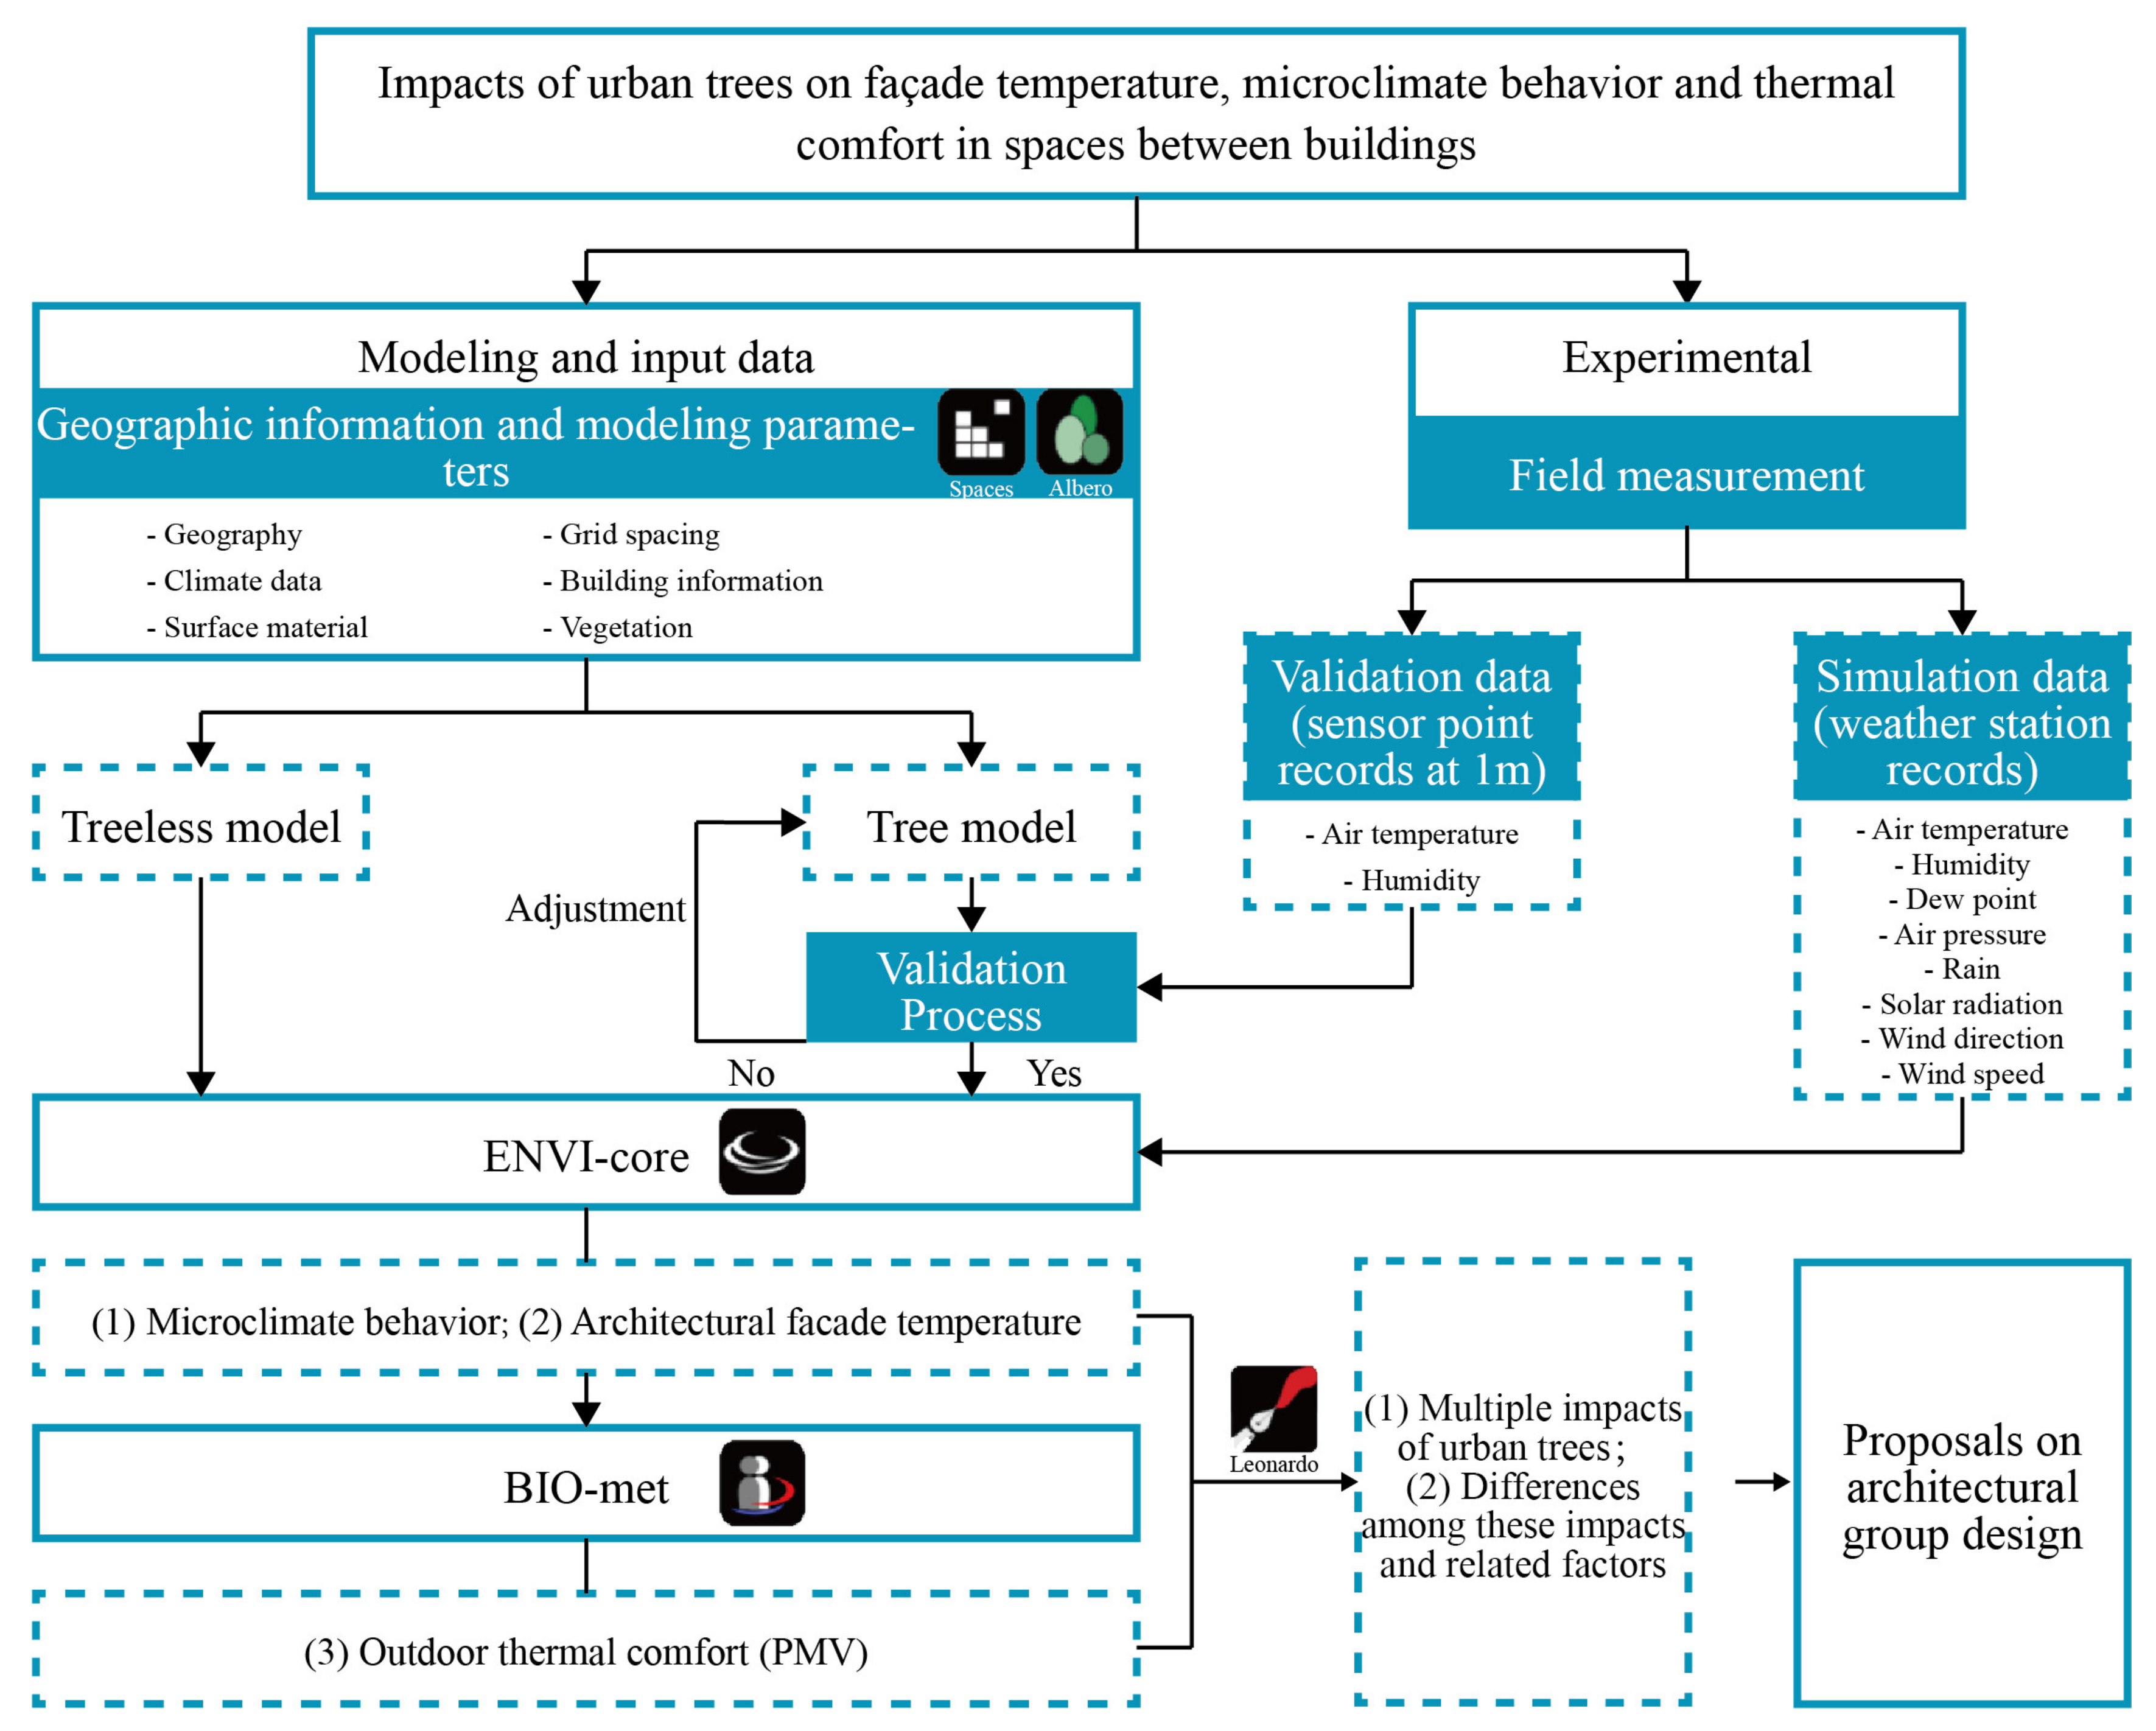
2.1. Overview of the Methodology
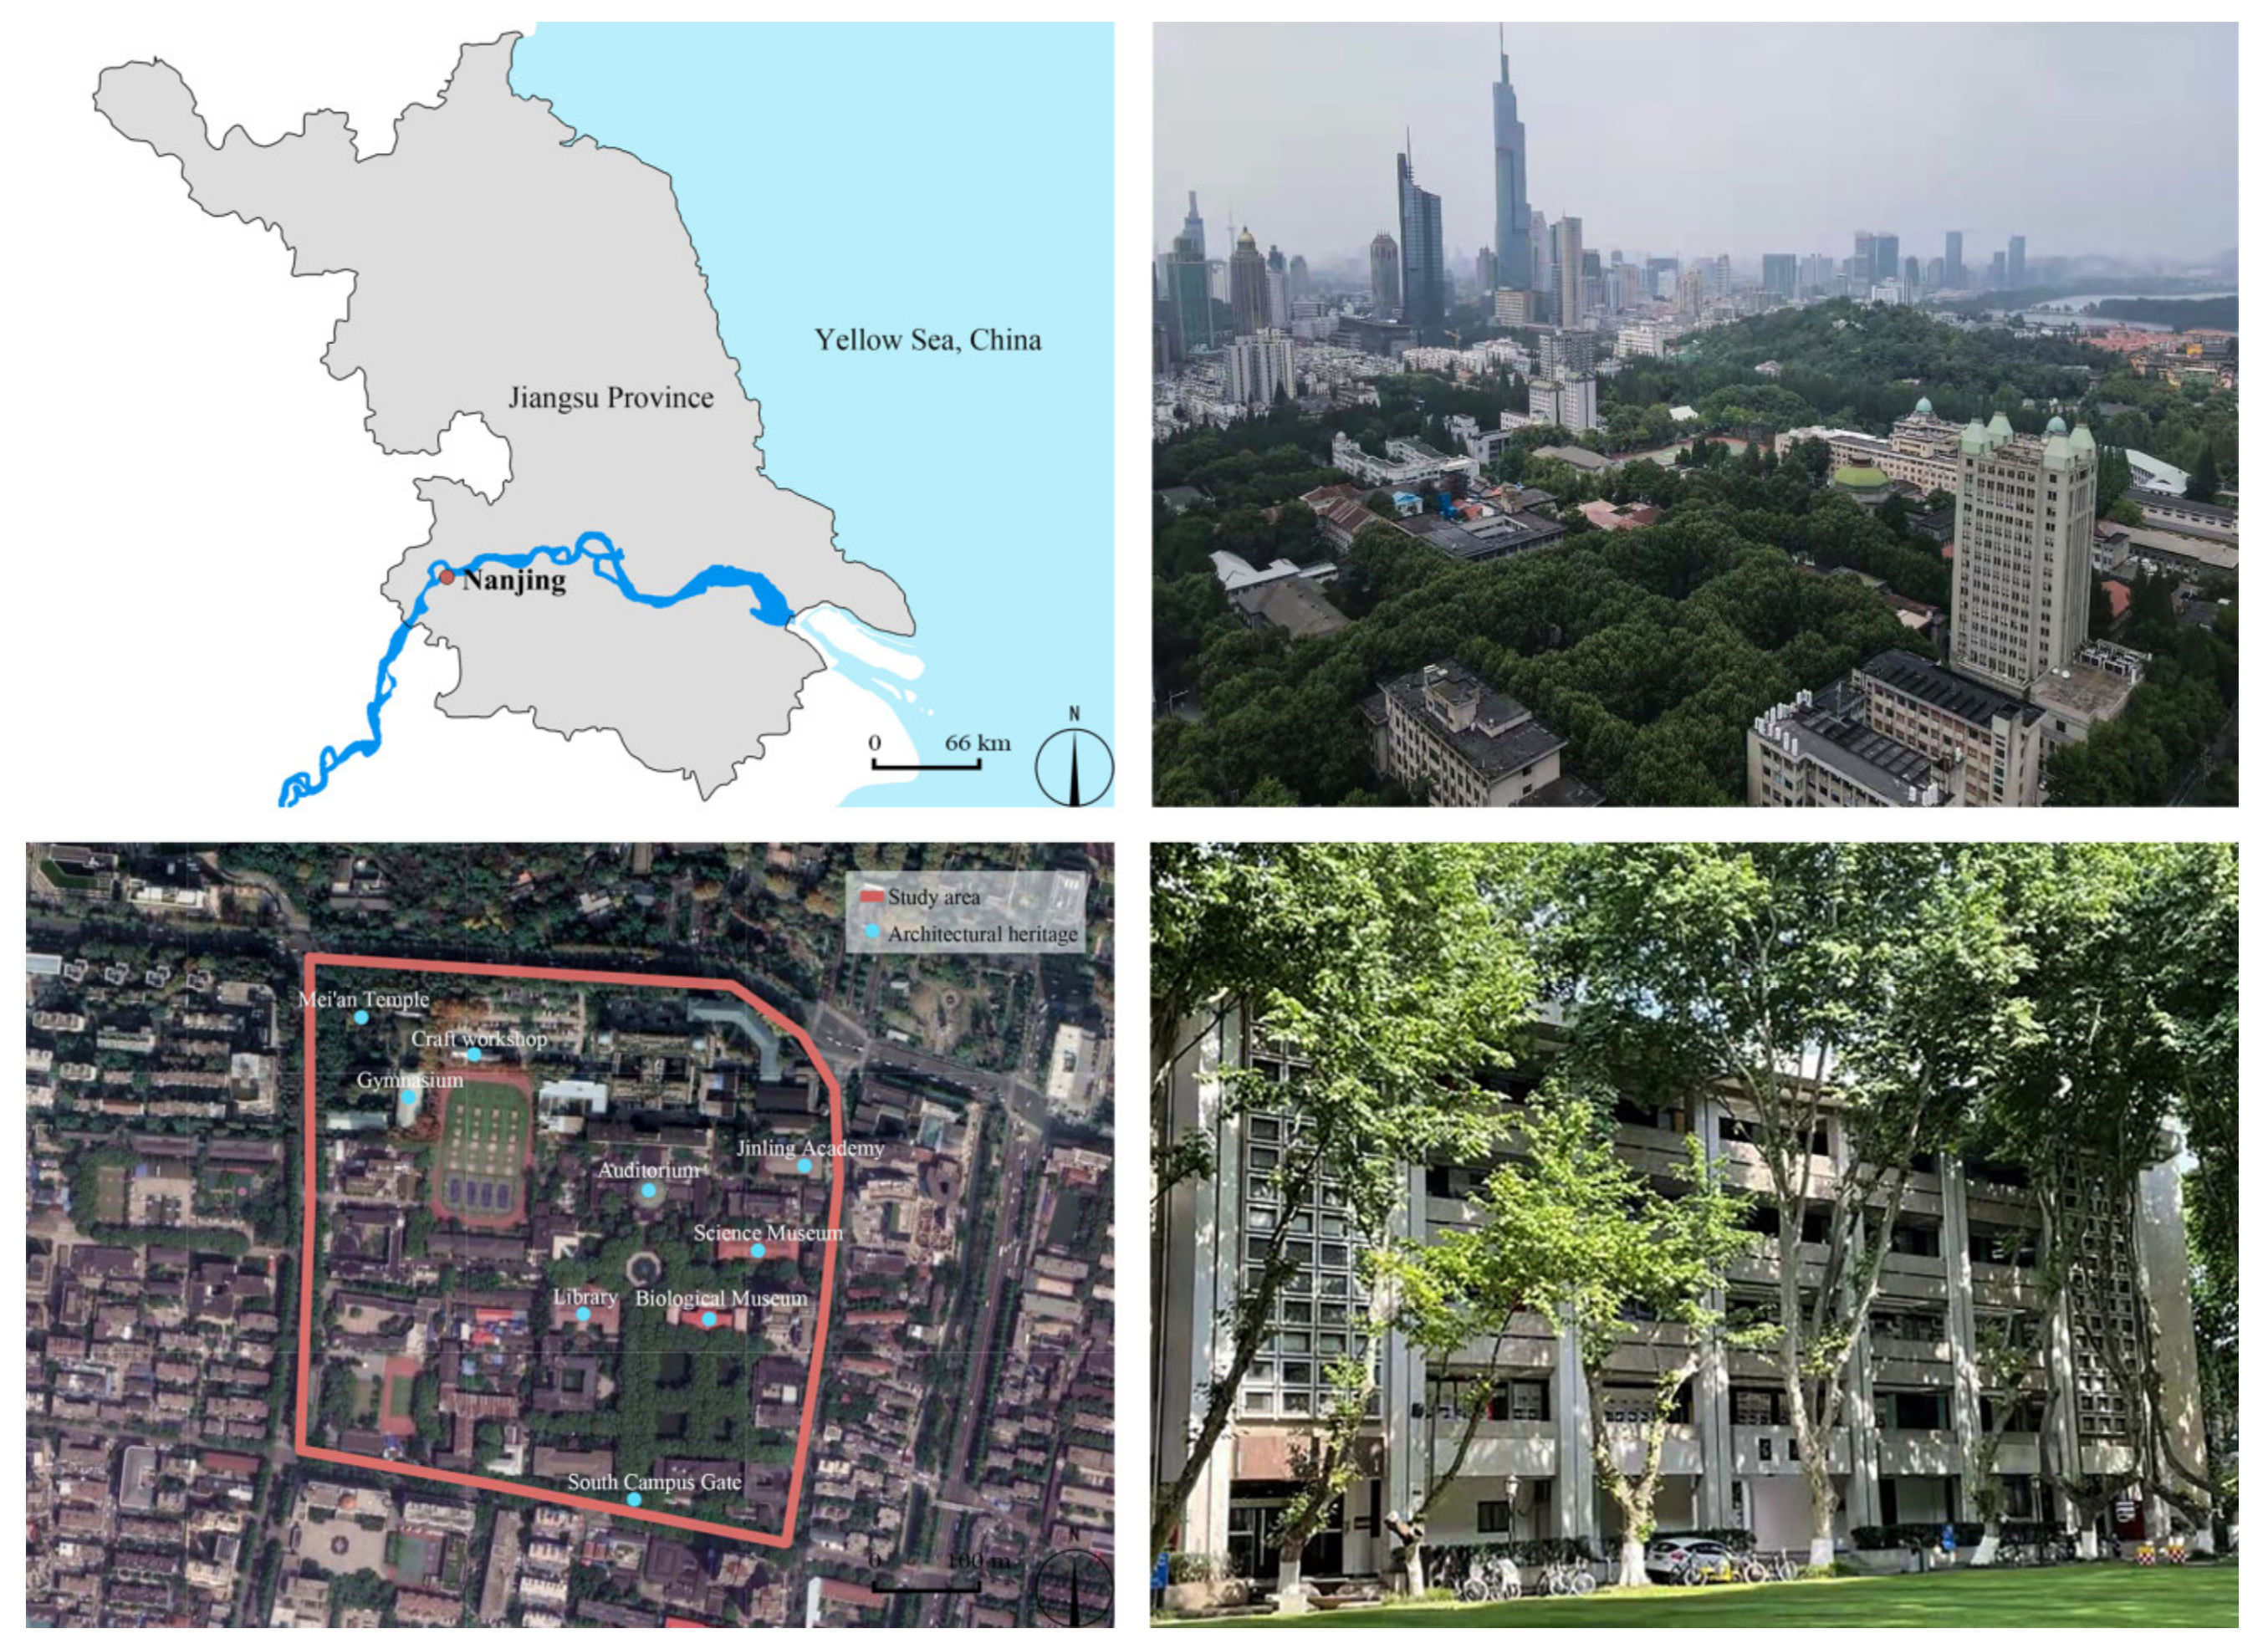
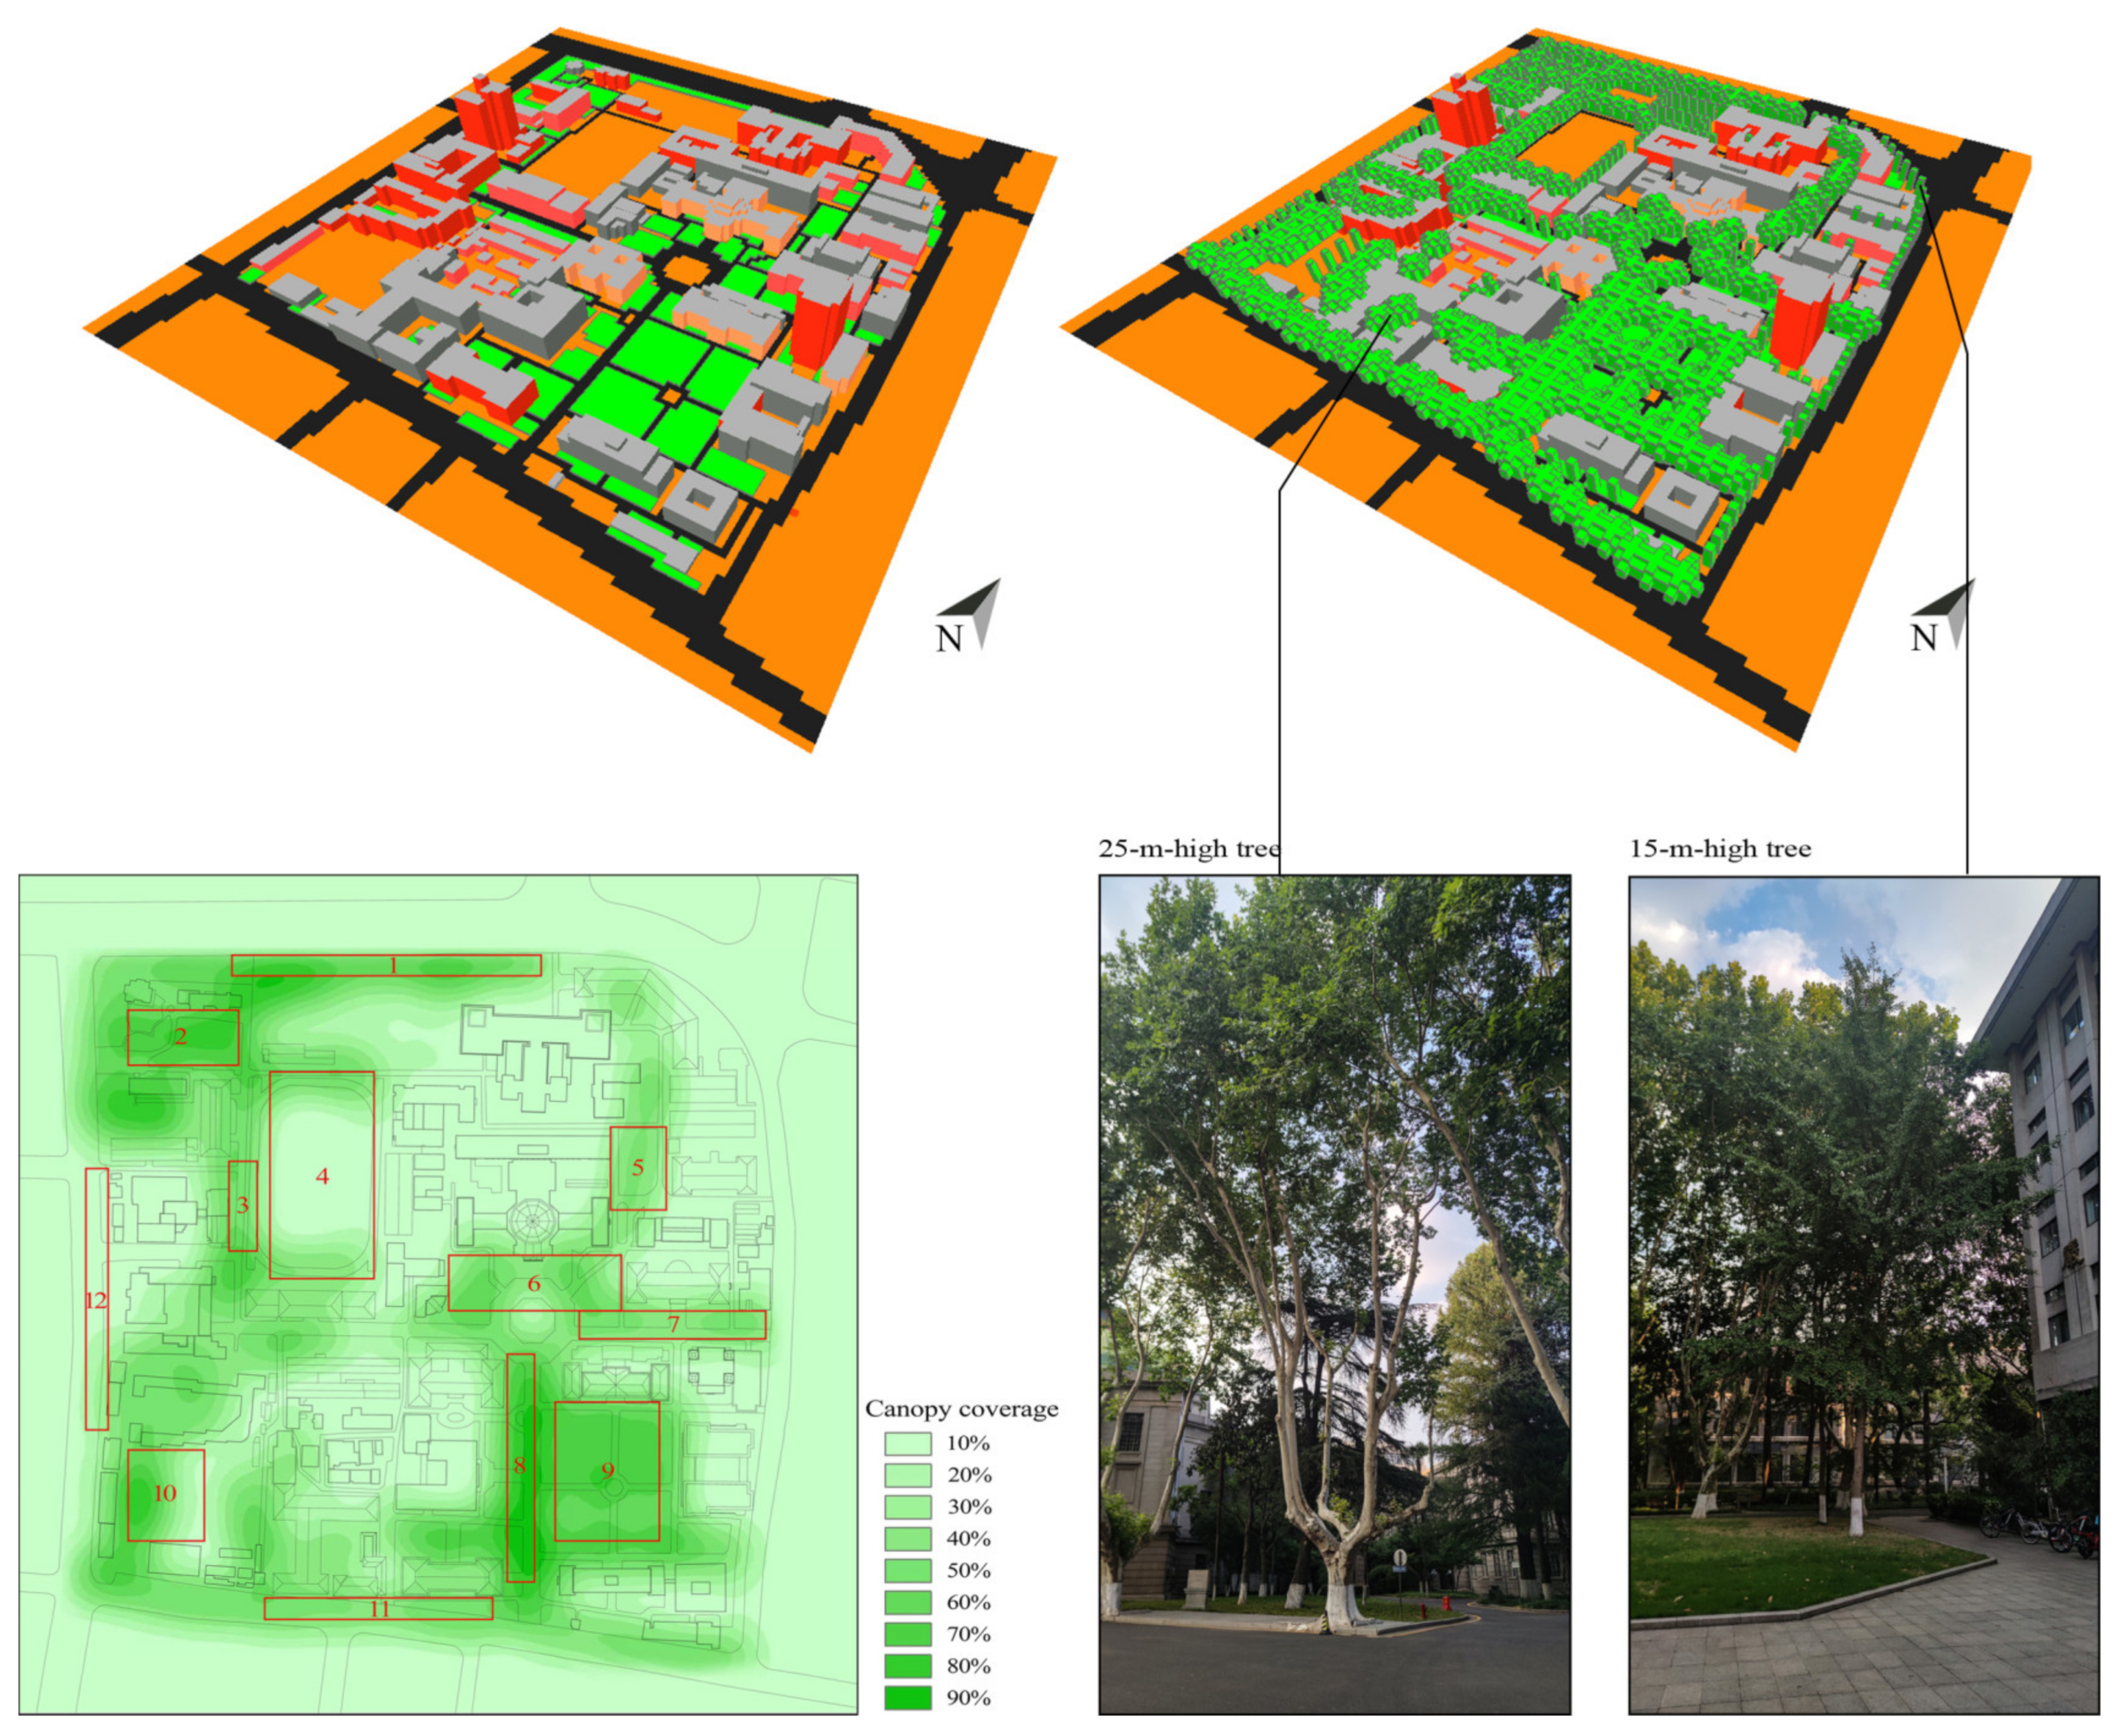
2.2. Case Area
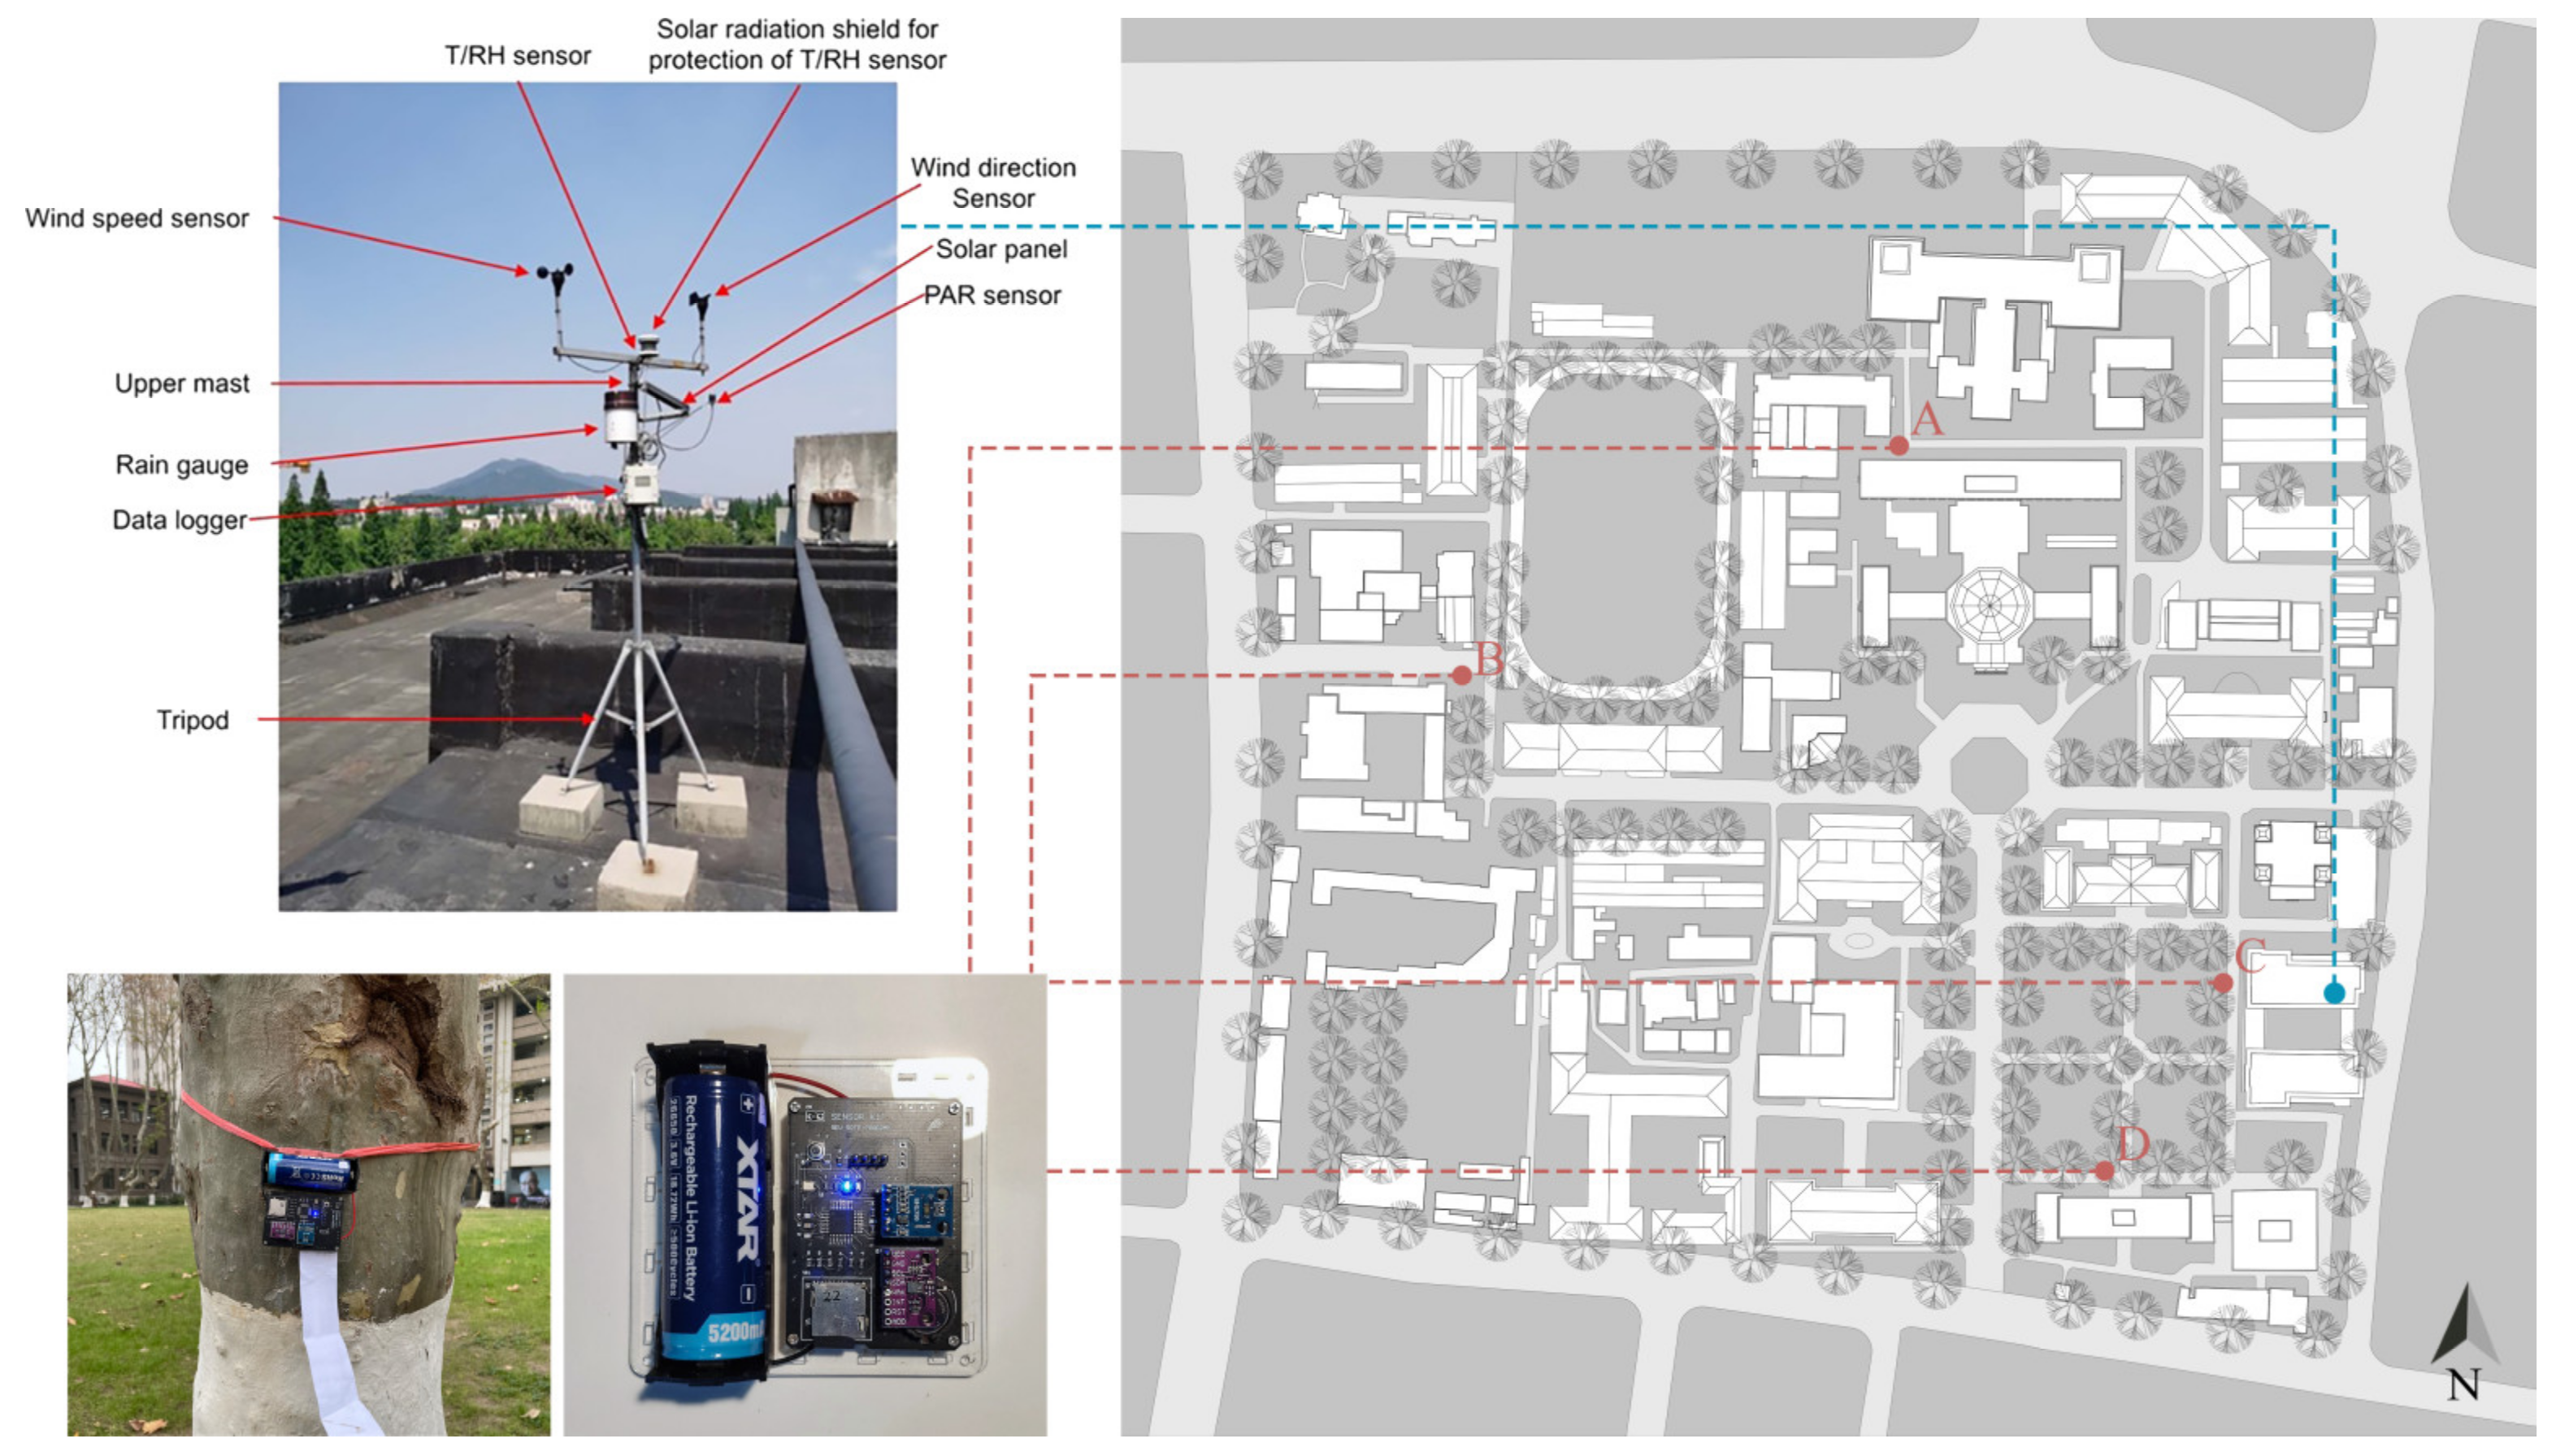
2.3. The Microclimate Experiment Setup
2.4. Simulation Model in ENVI-Met 4.4.6
2.5. Model Calibration Assessment
3. Results
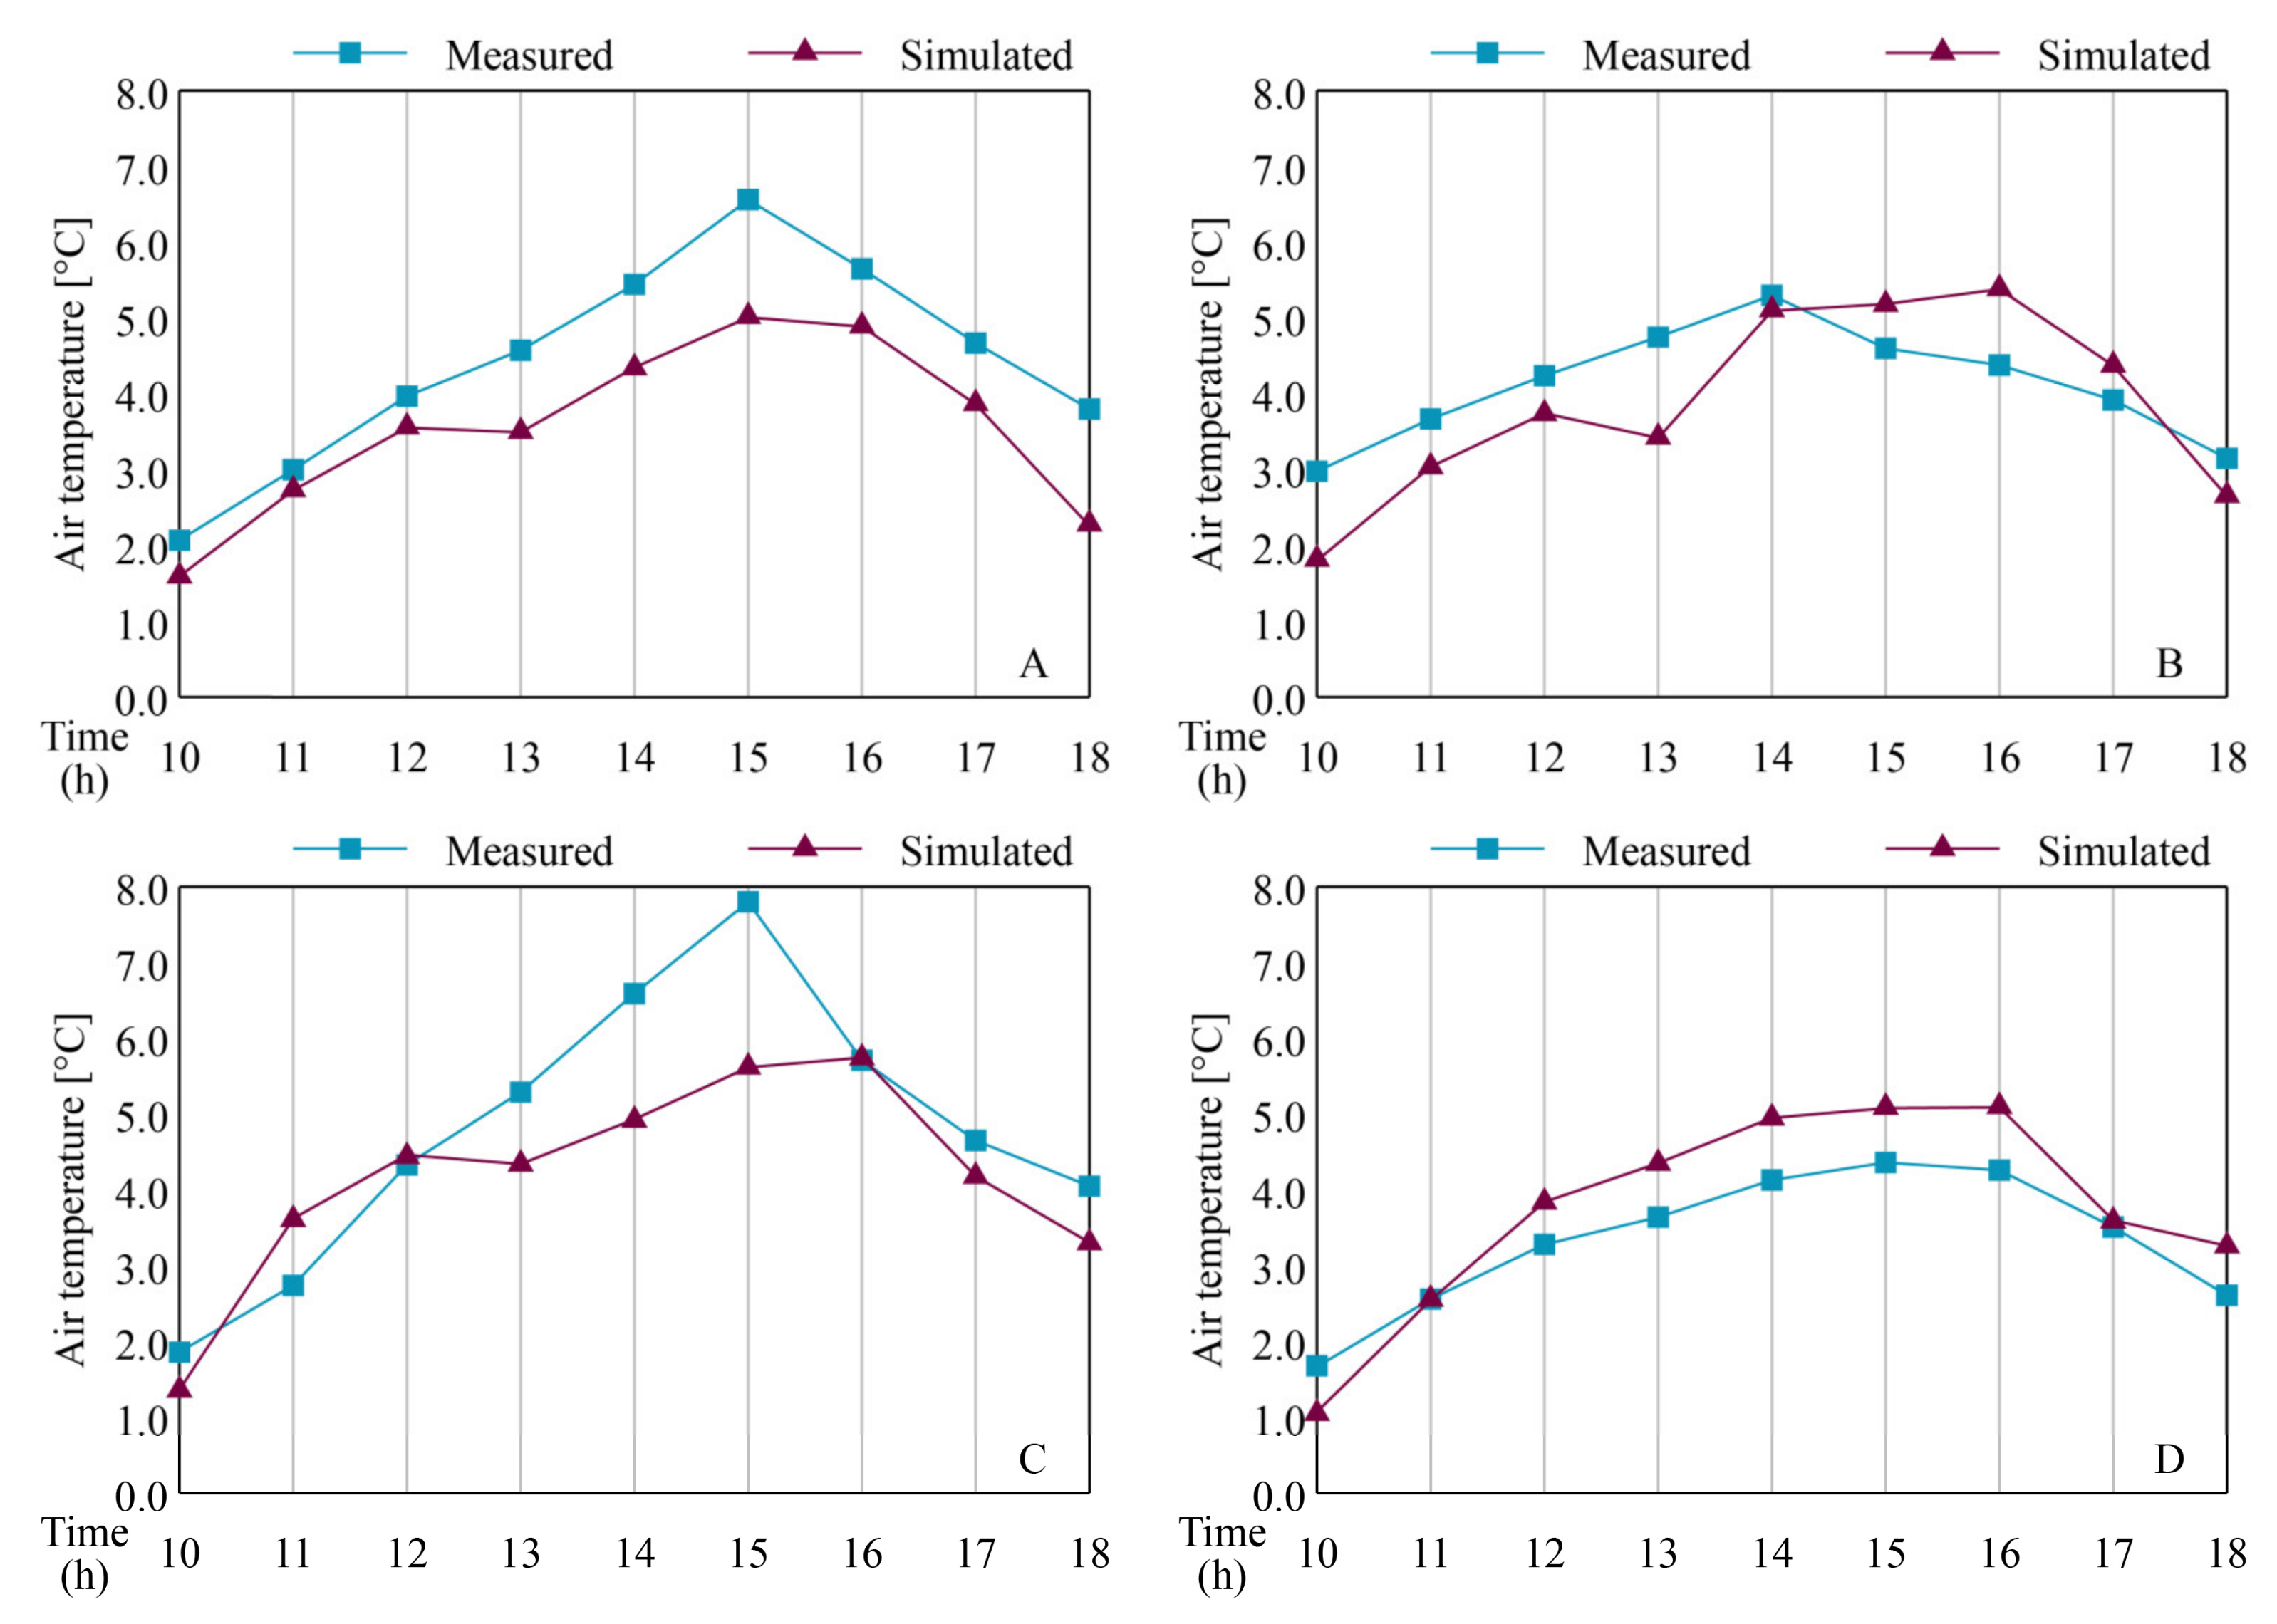
3.1. Validation Results of Simulation Model in ENVI-Met
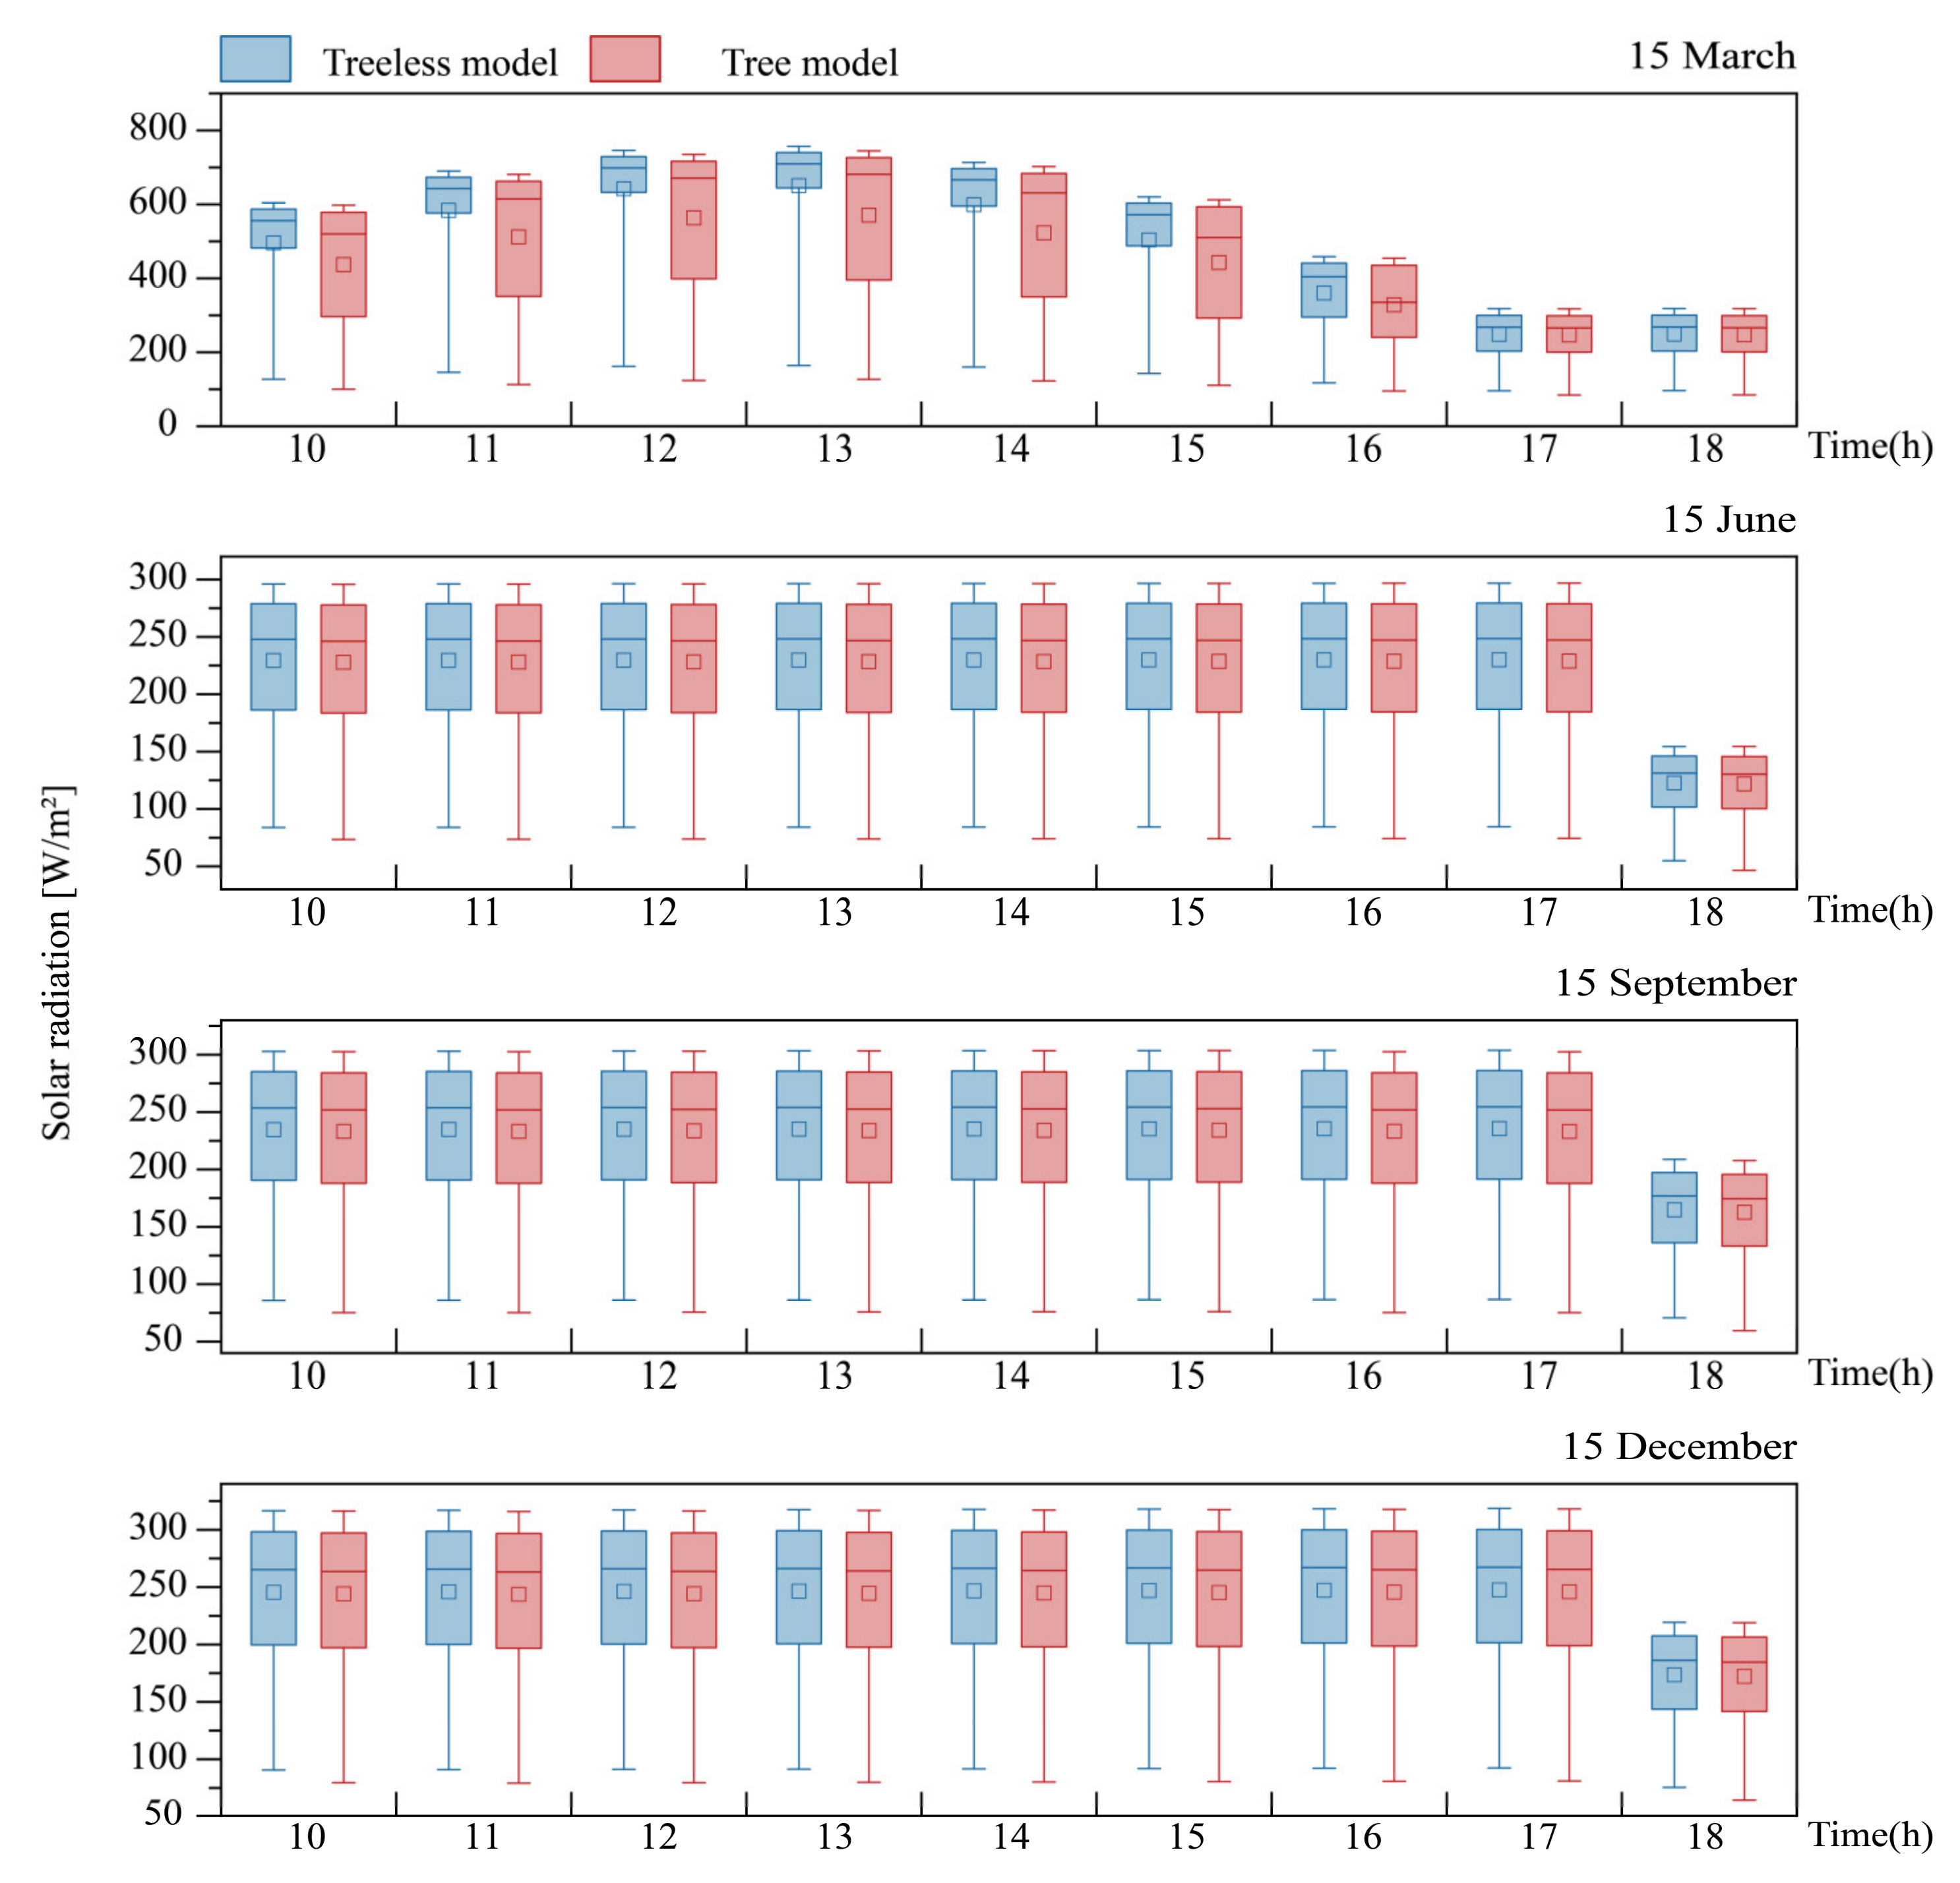
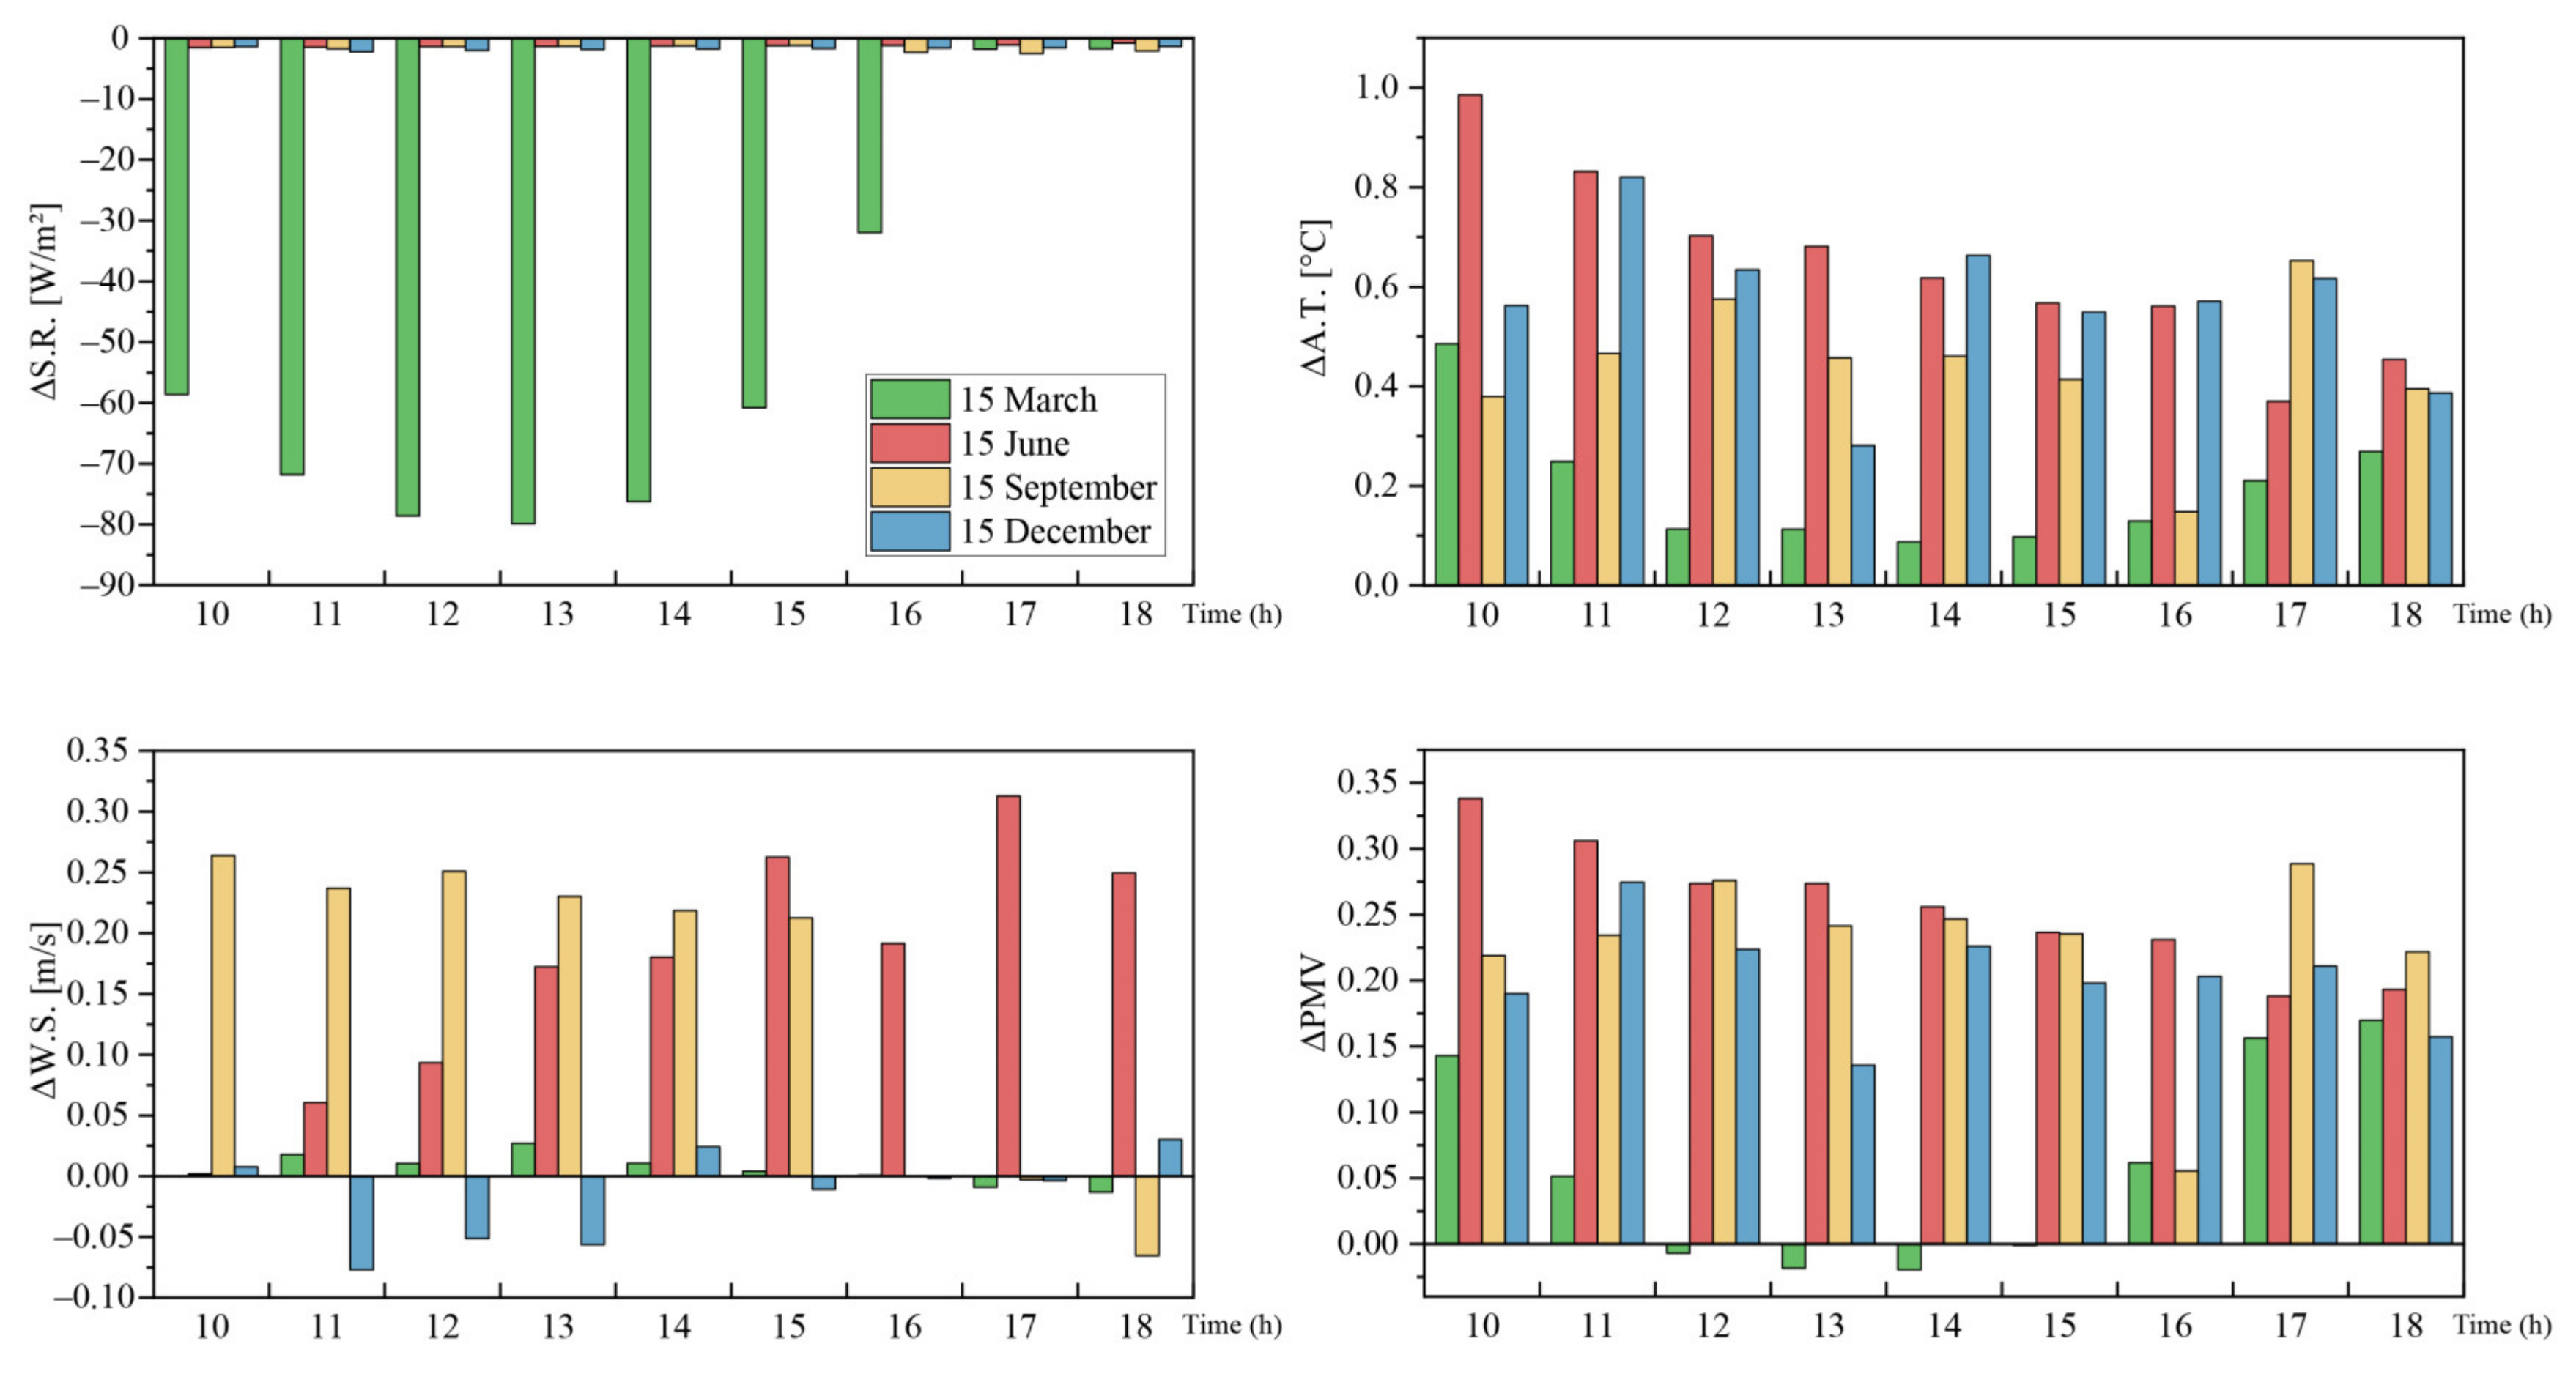
3.2. Results of Solar Radiation Distribution
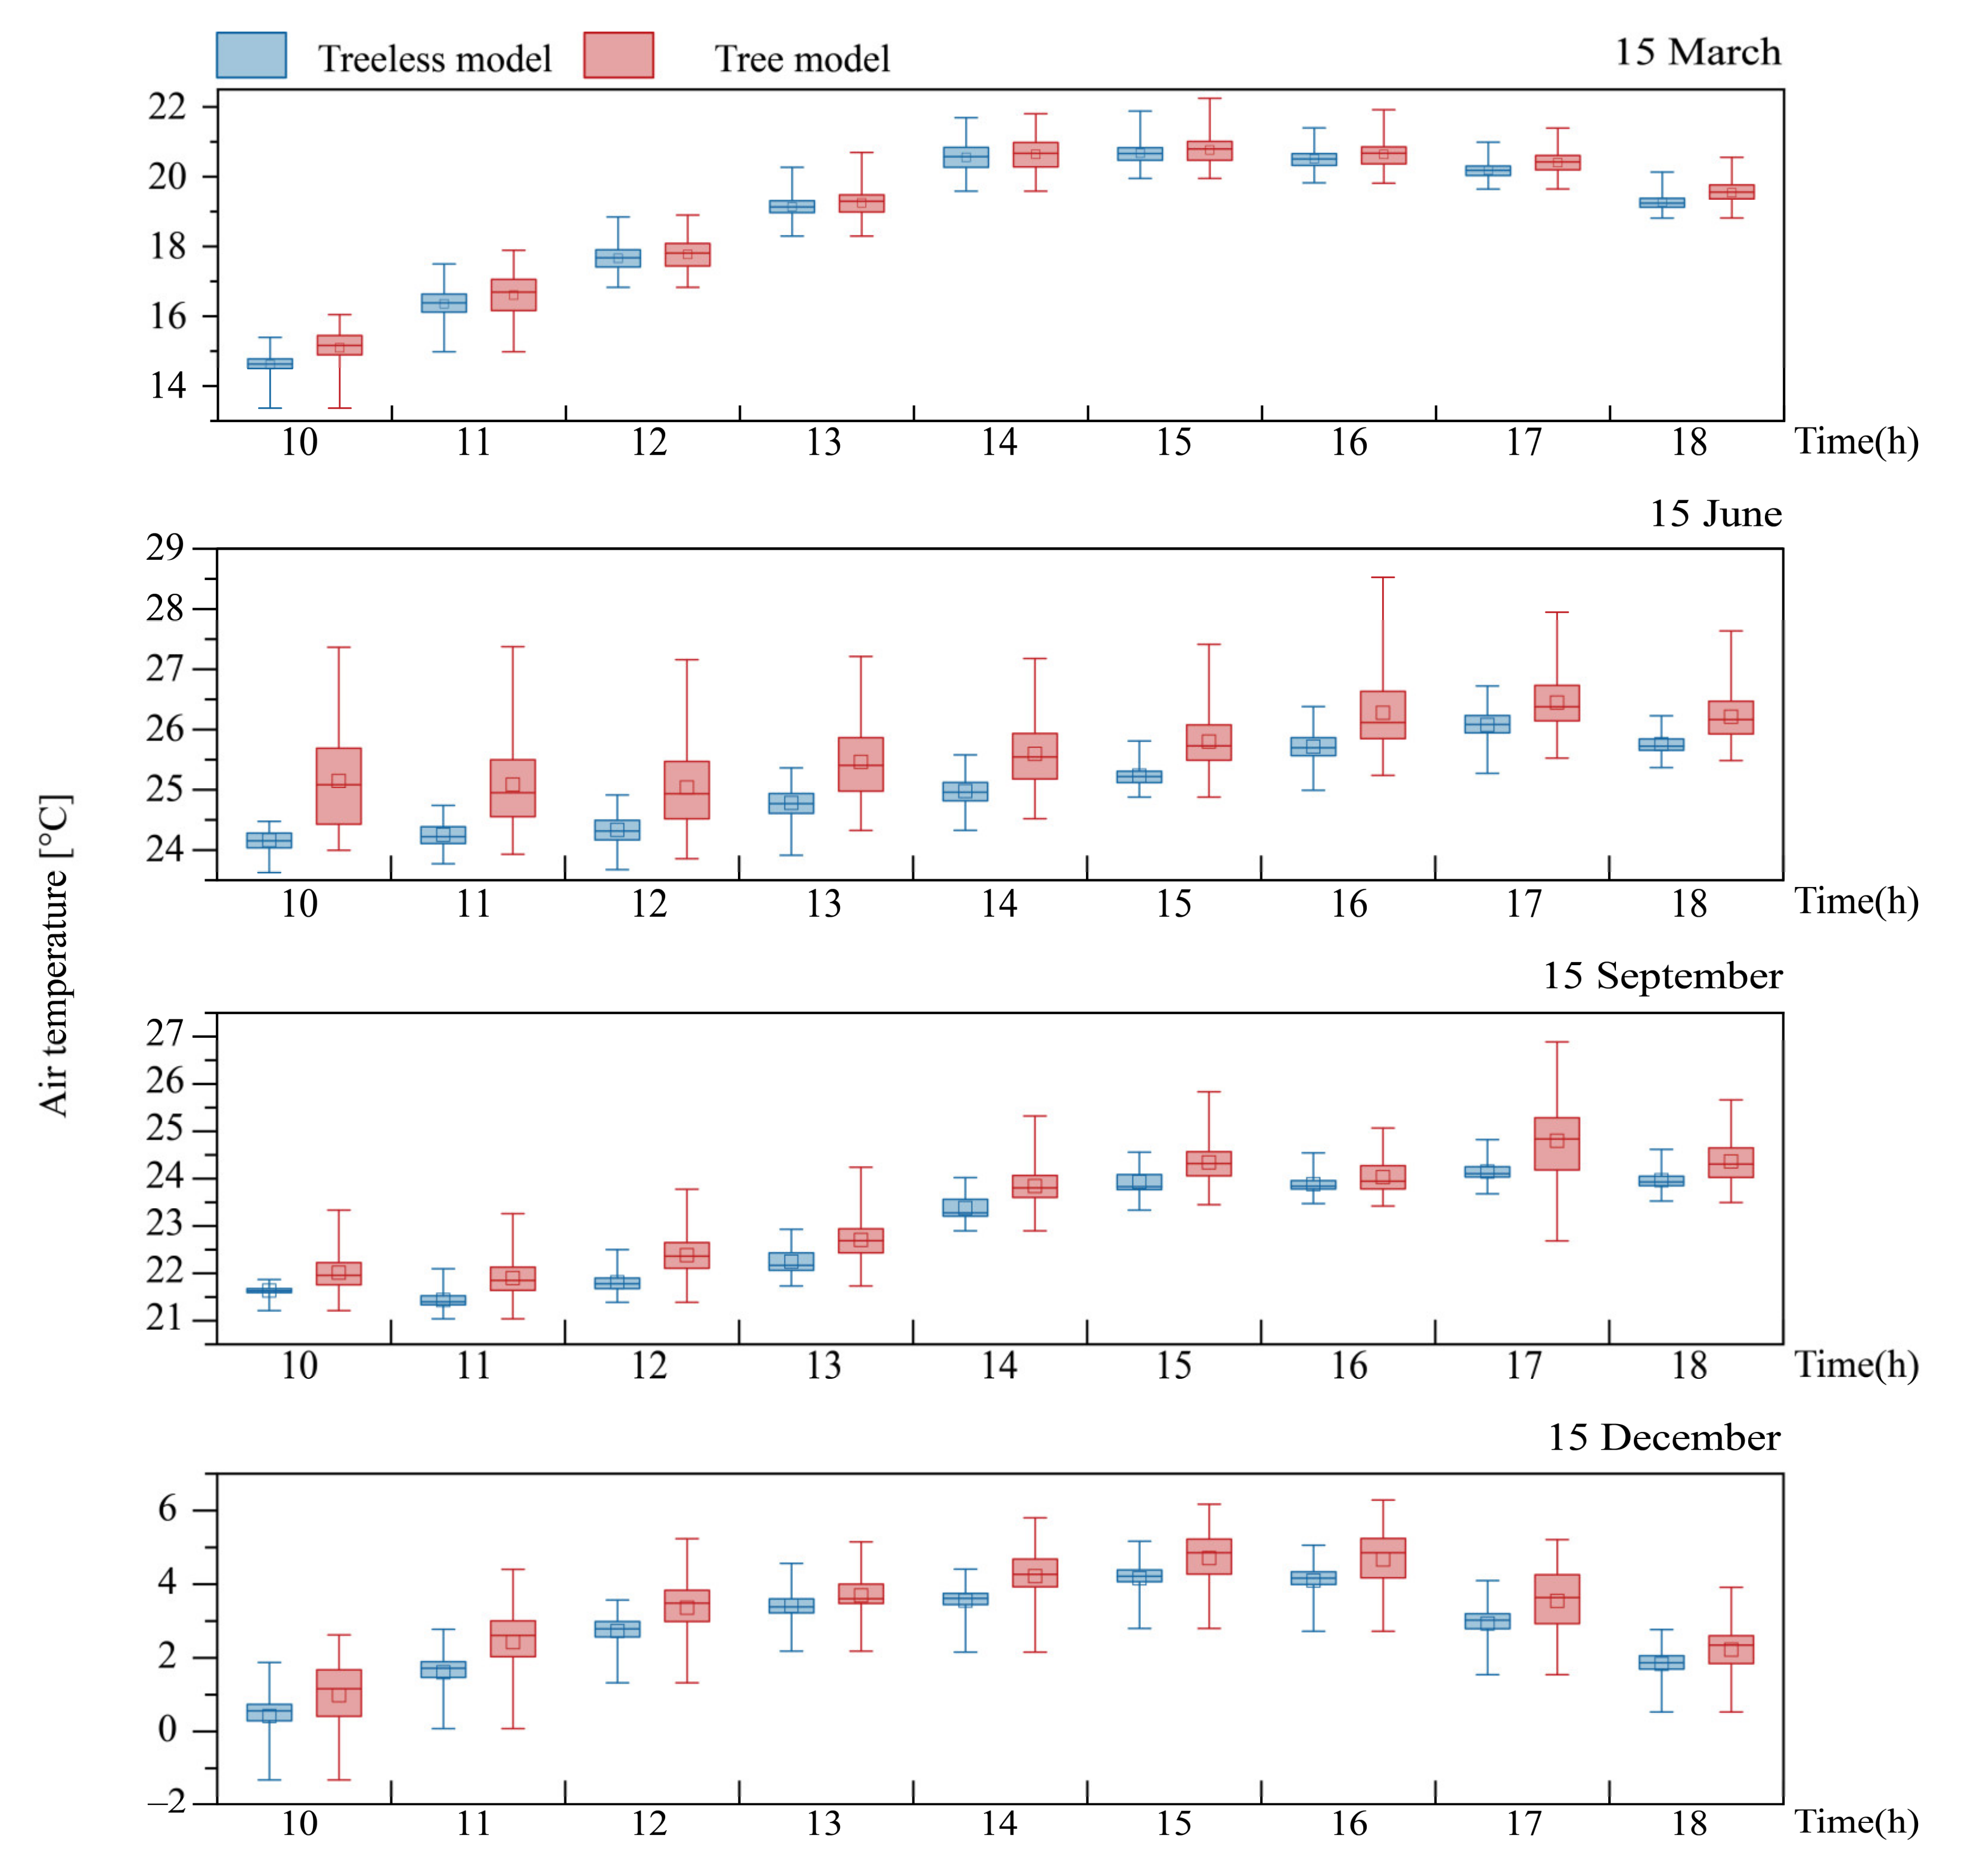
3.3. Results of Air Temperature between Buildings
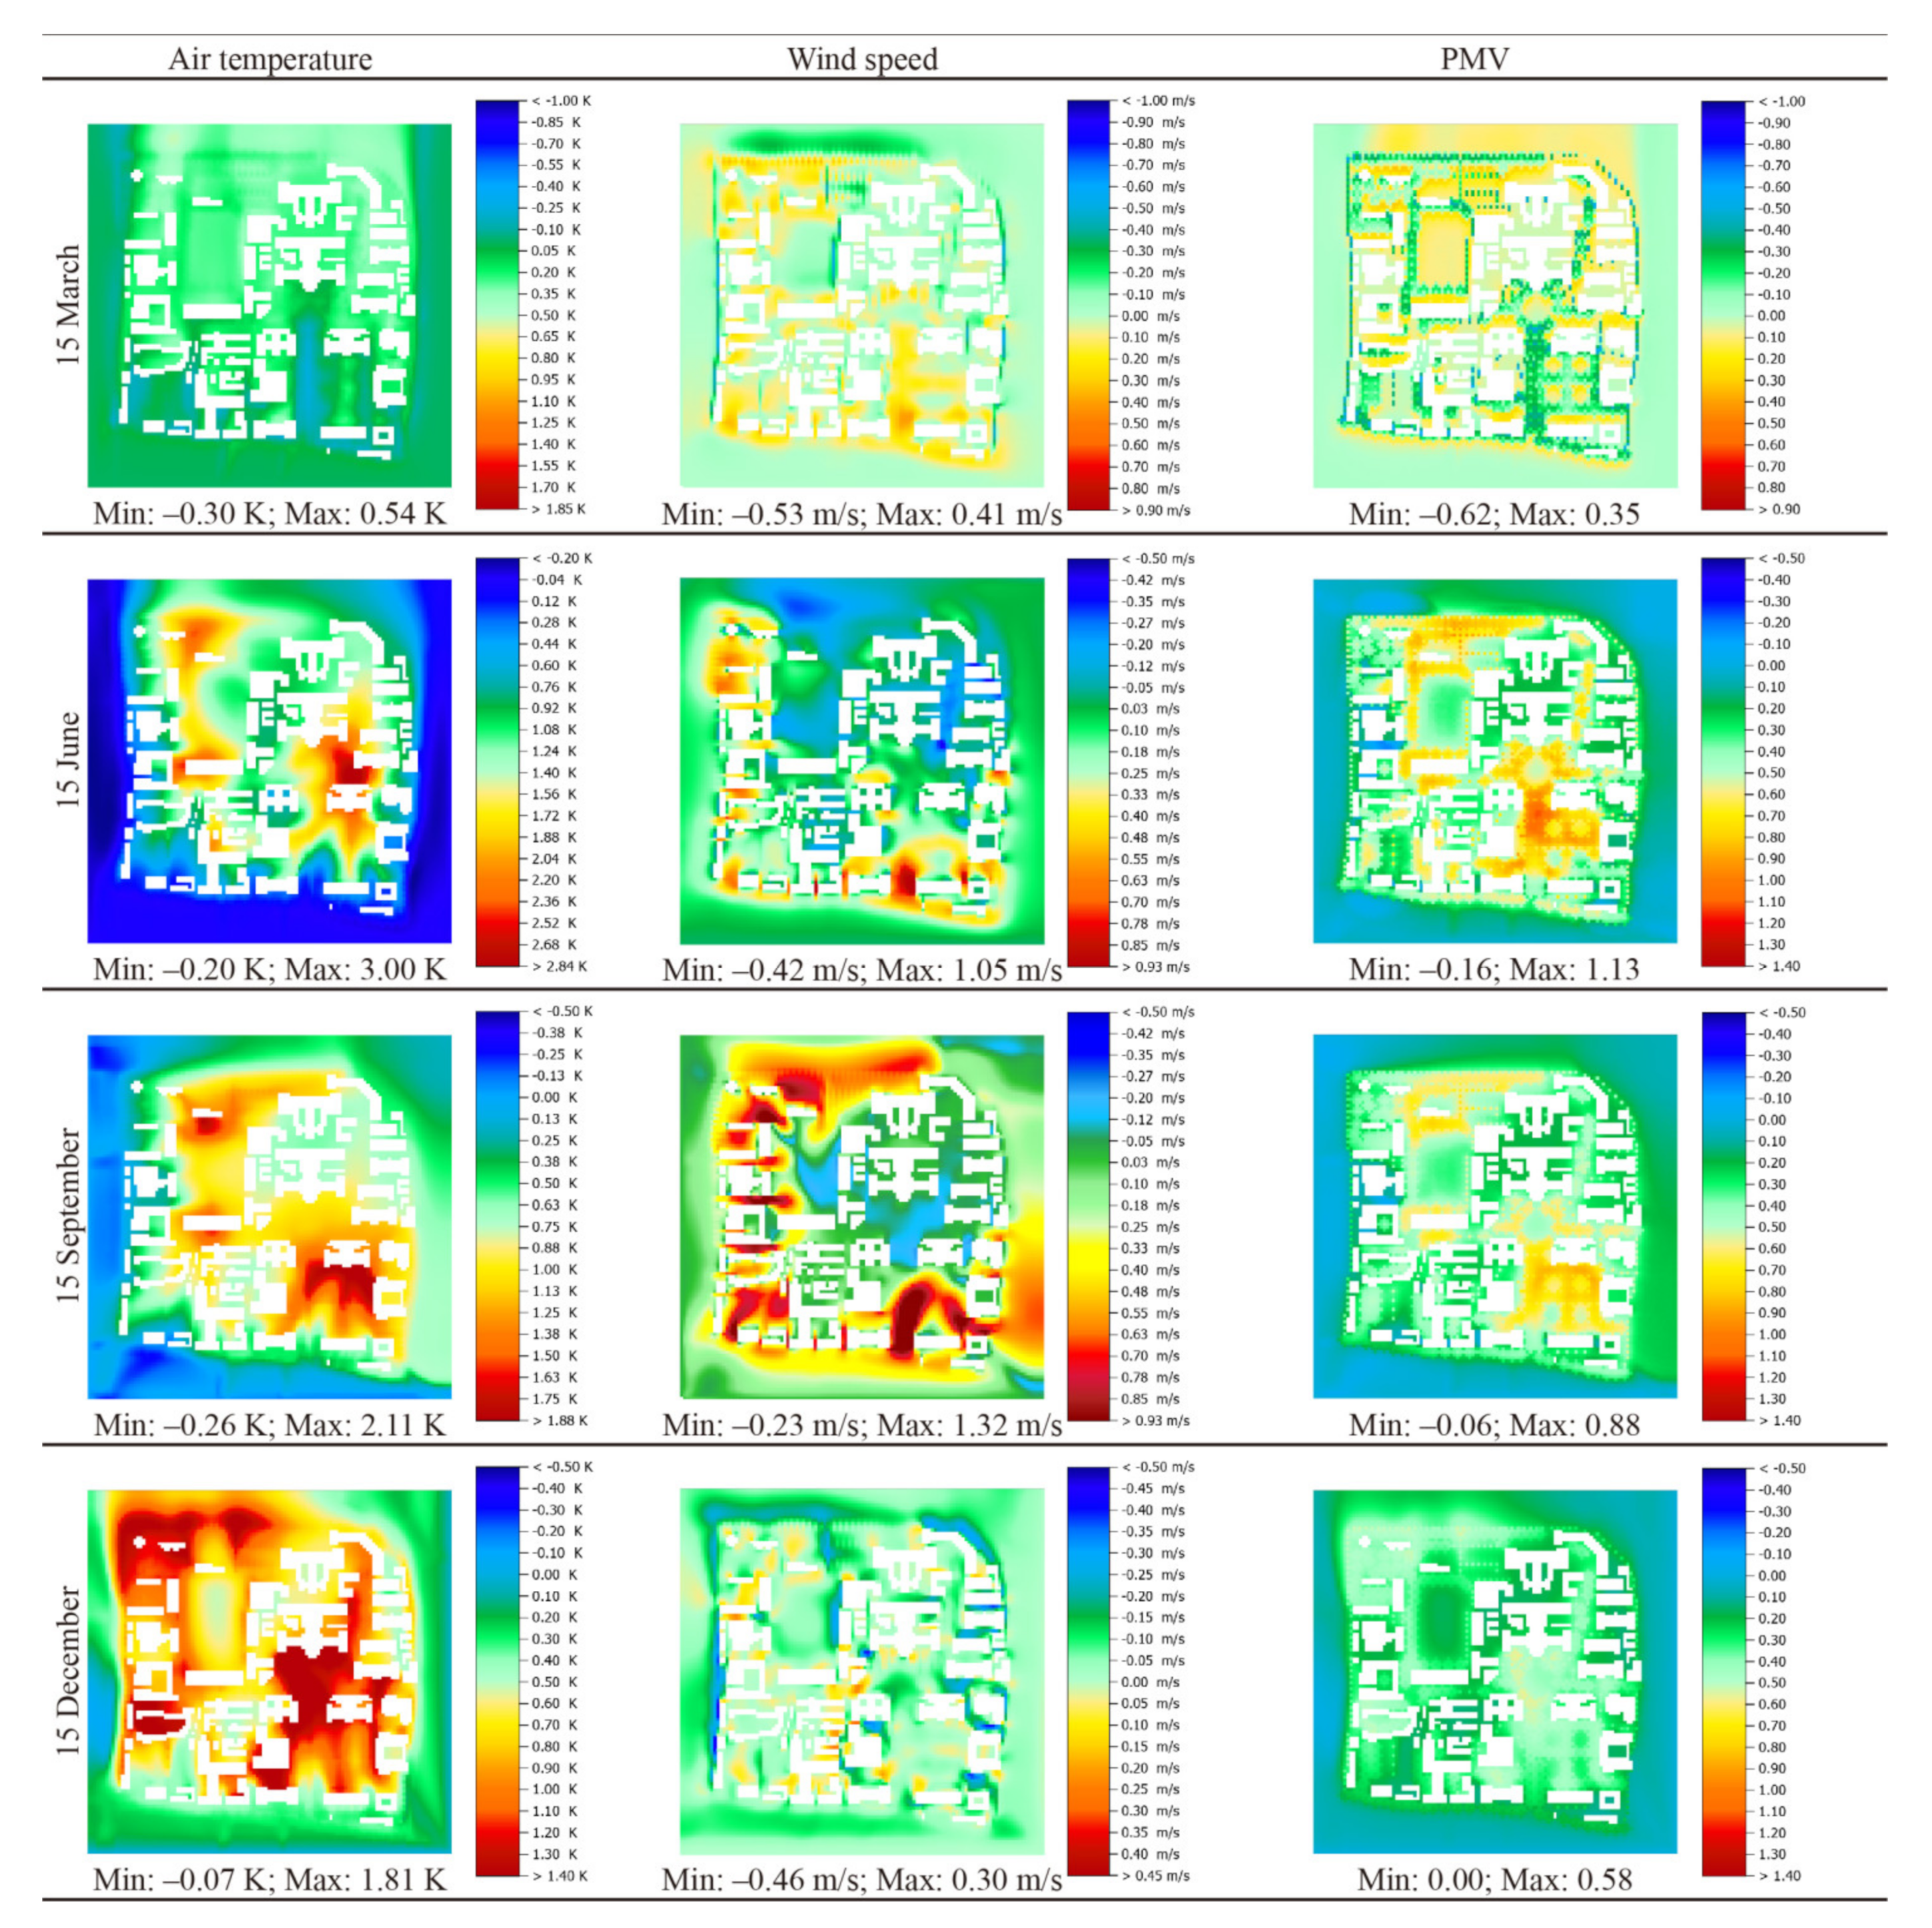
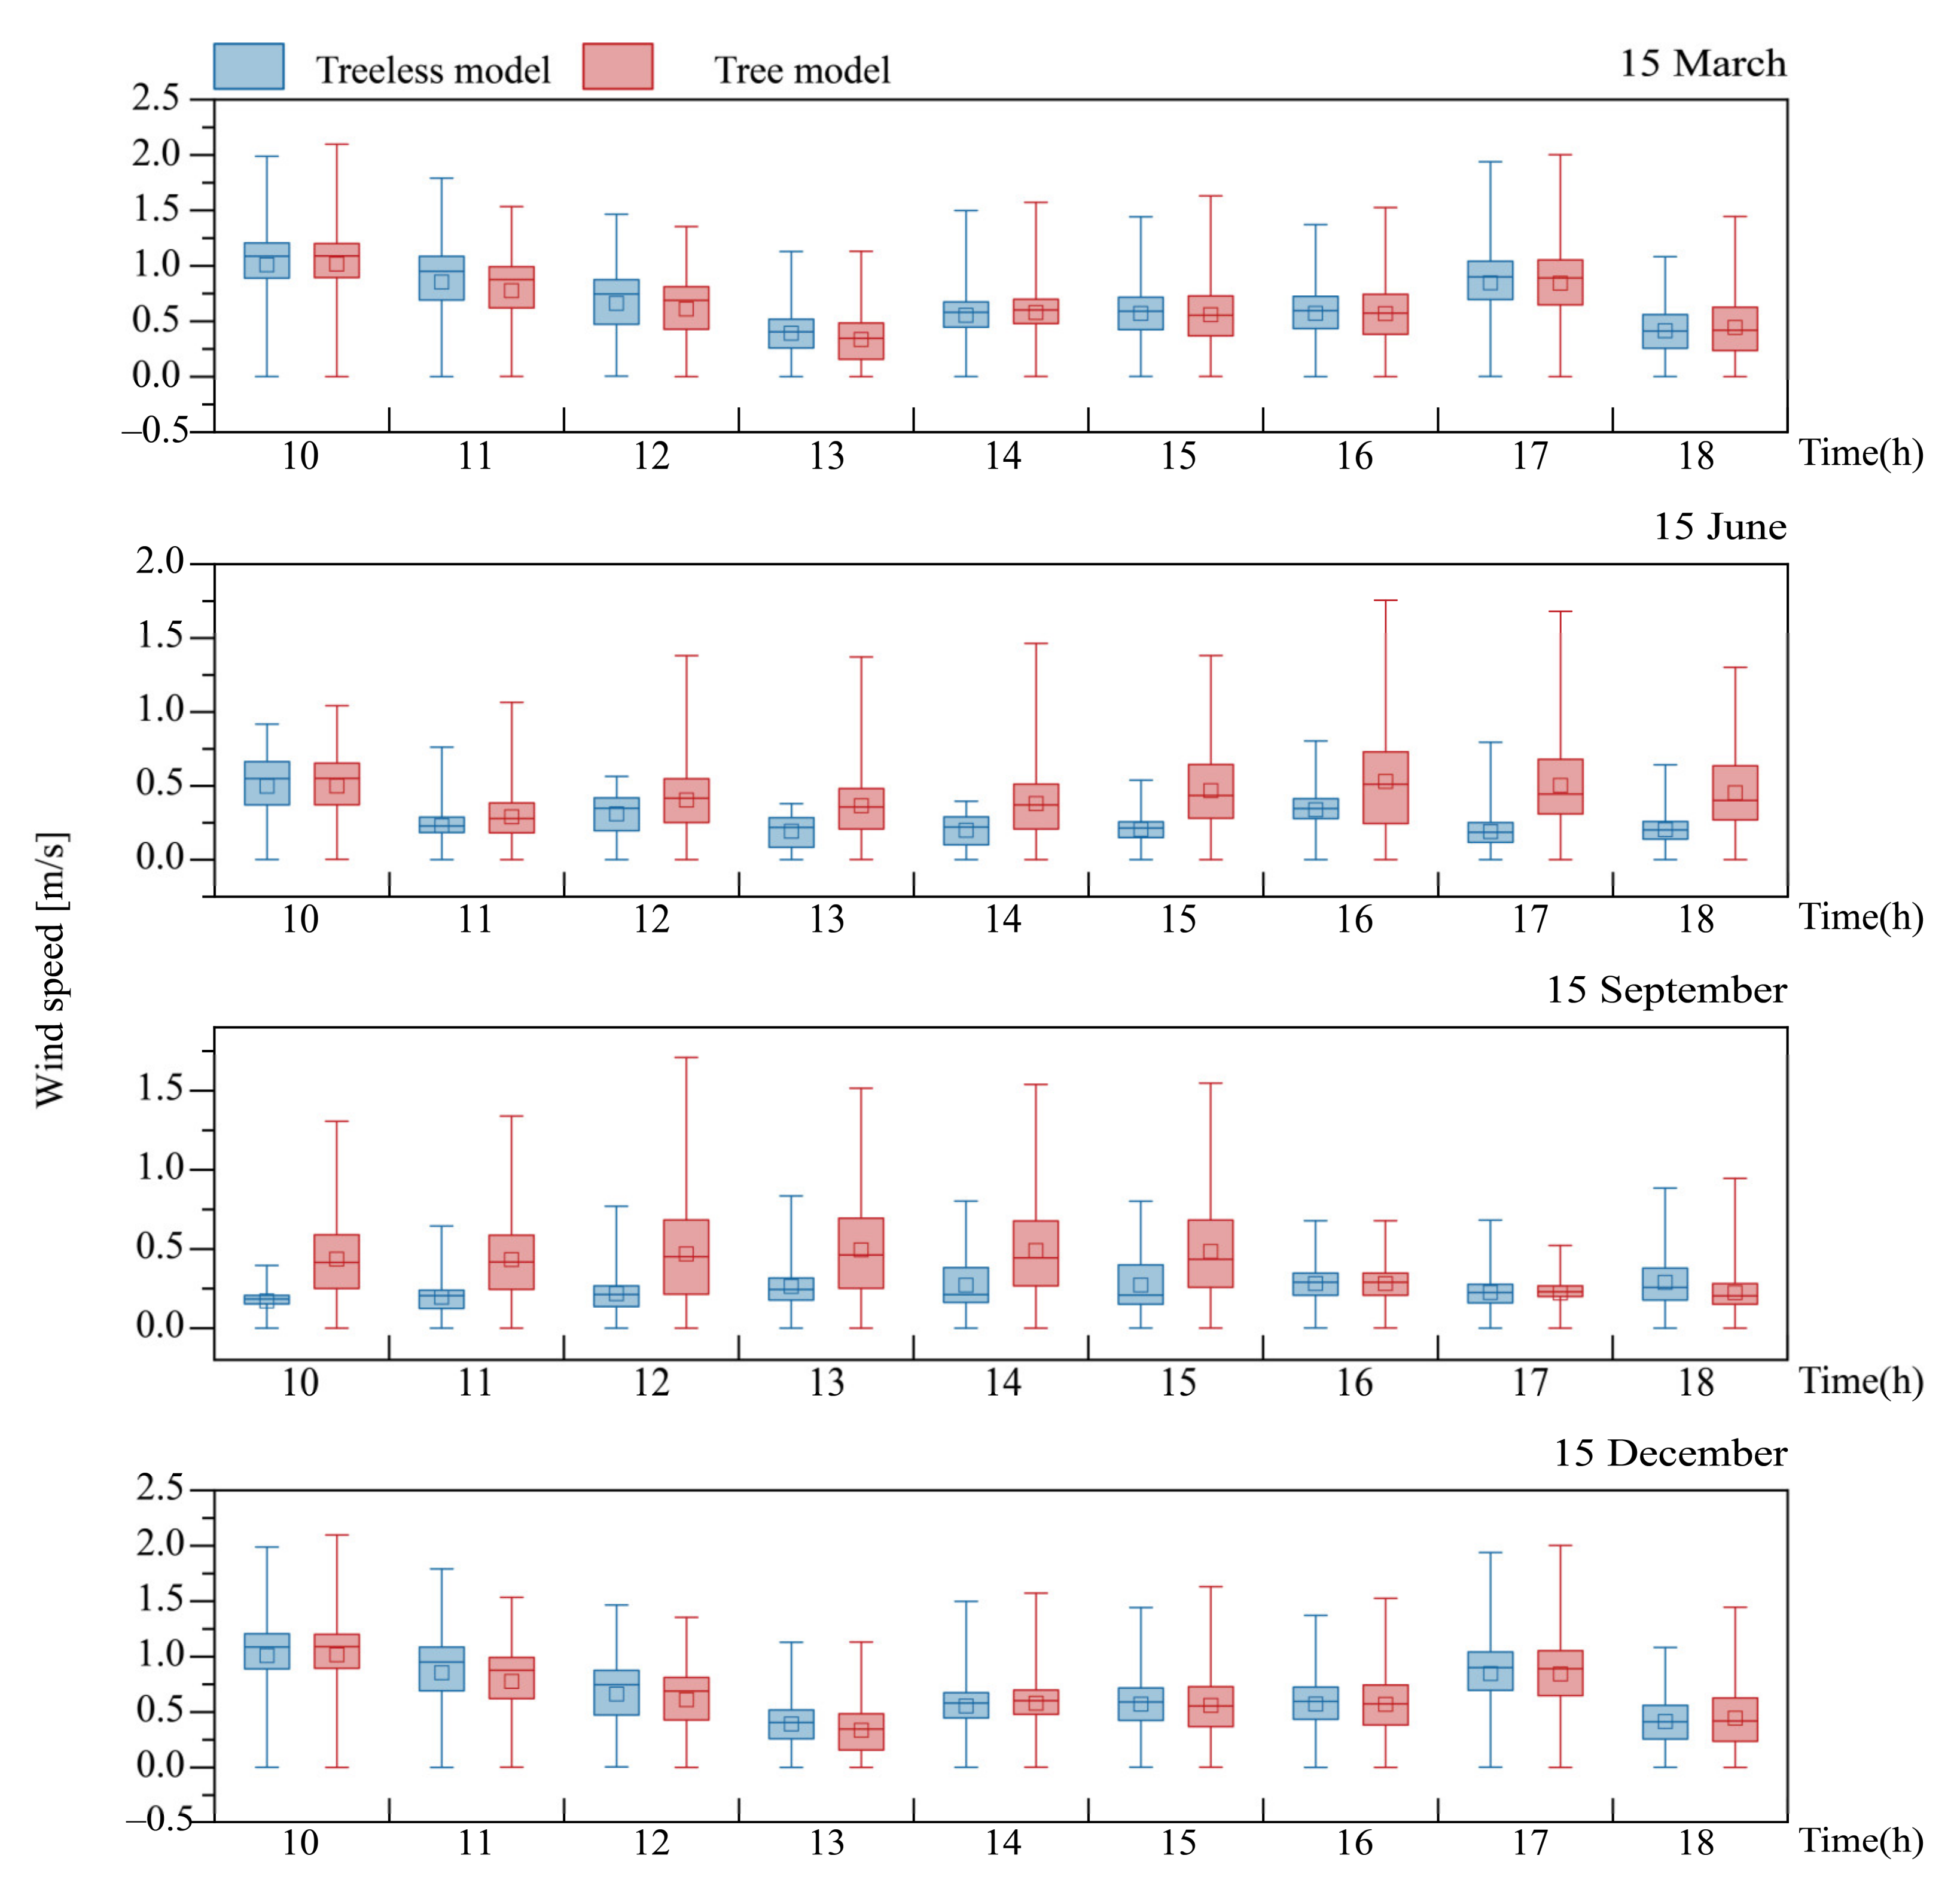
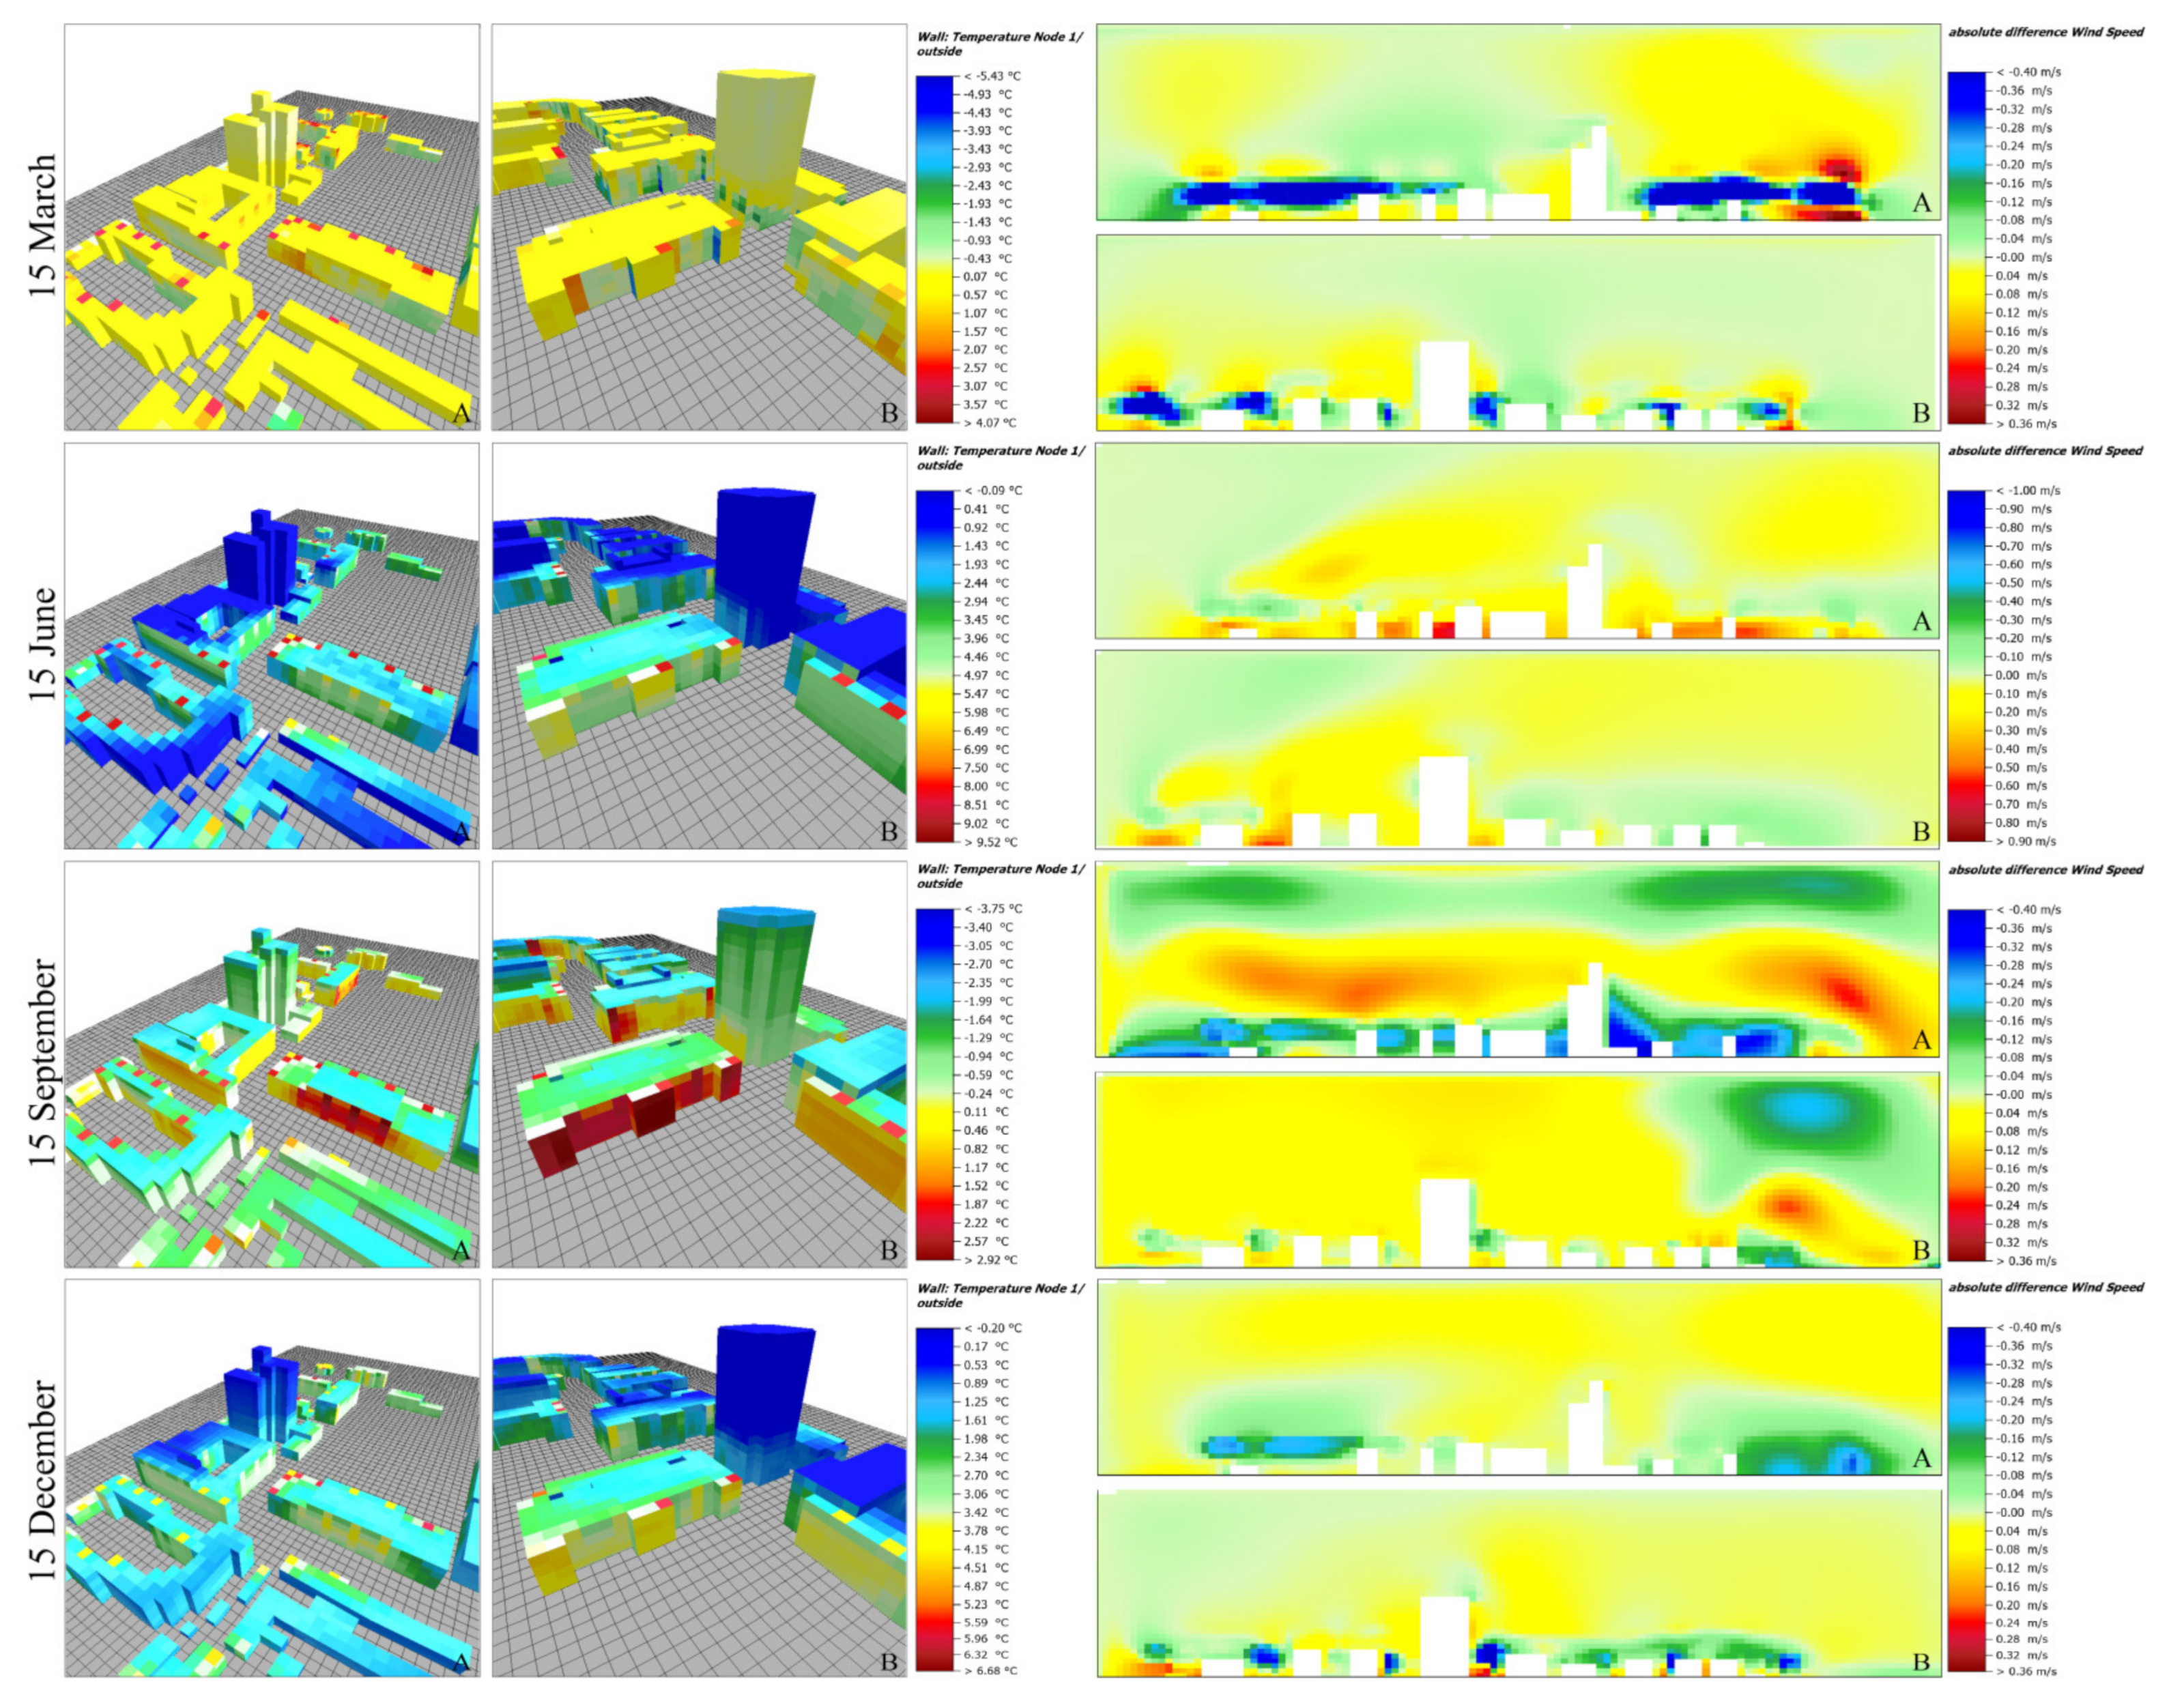
3.4. Results of Wind between Buildings
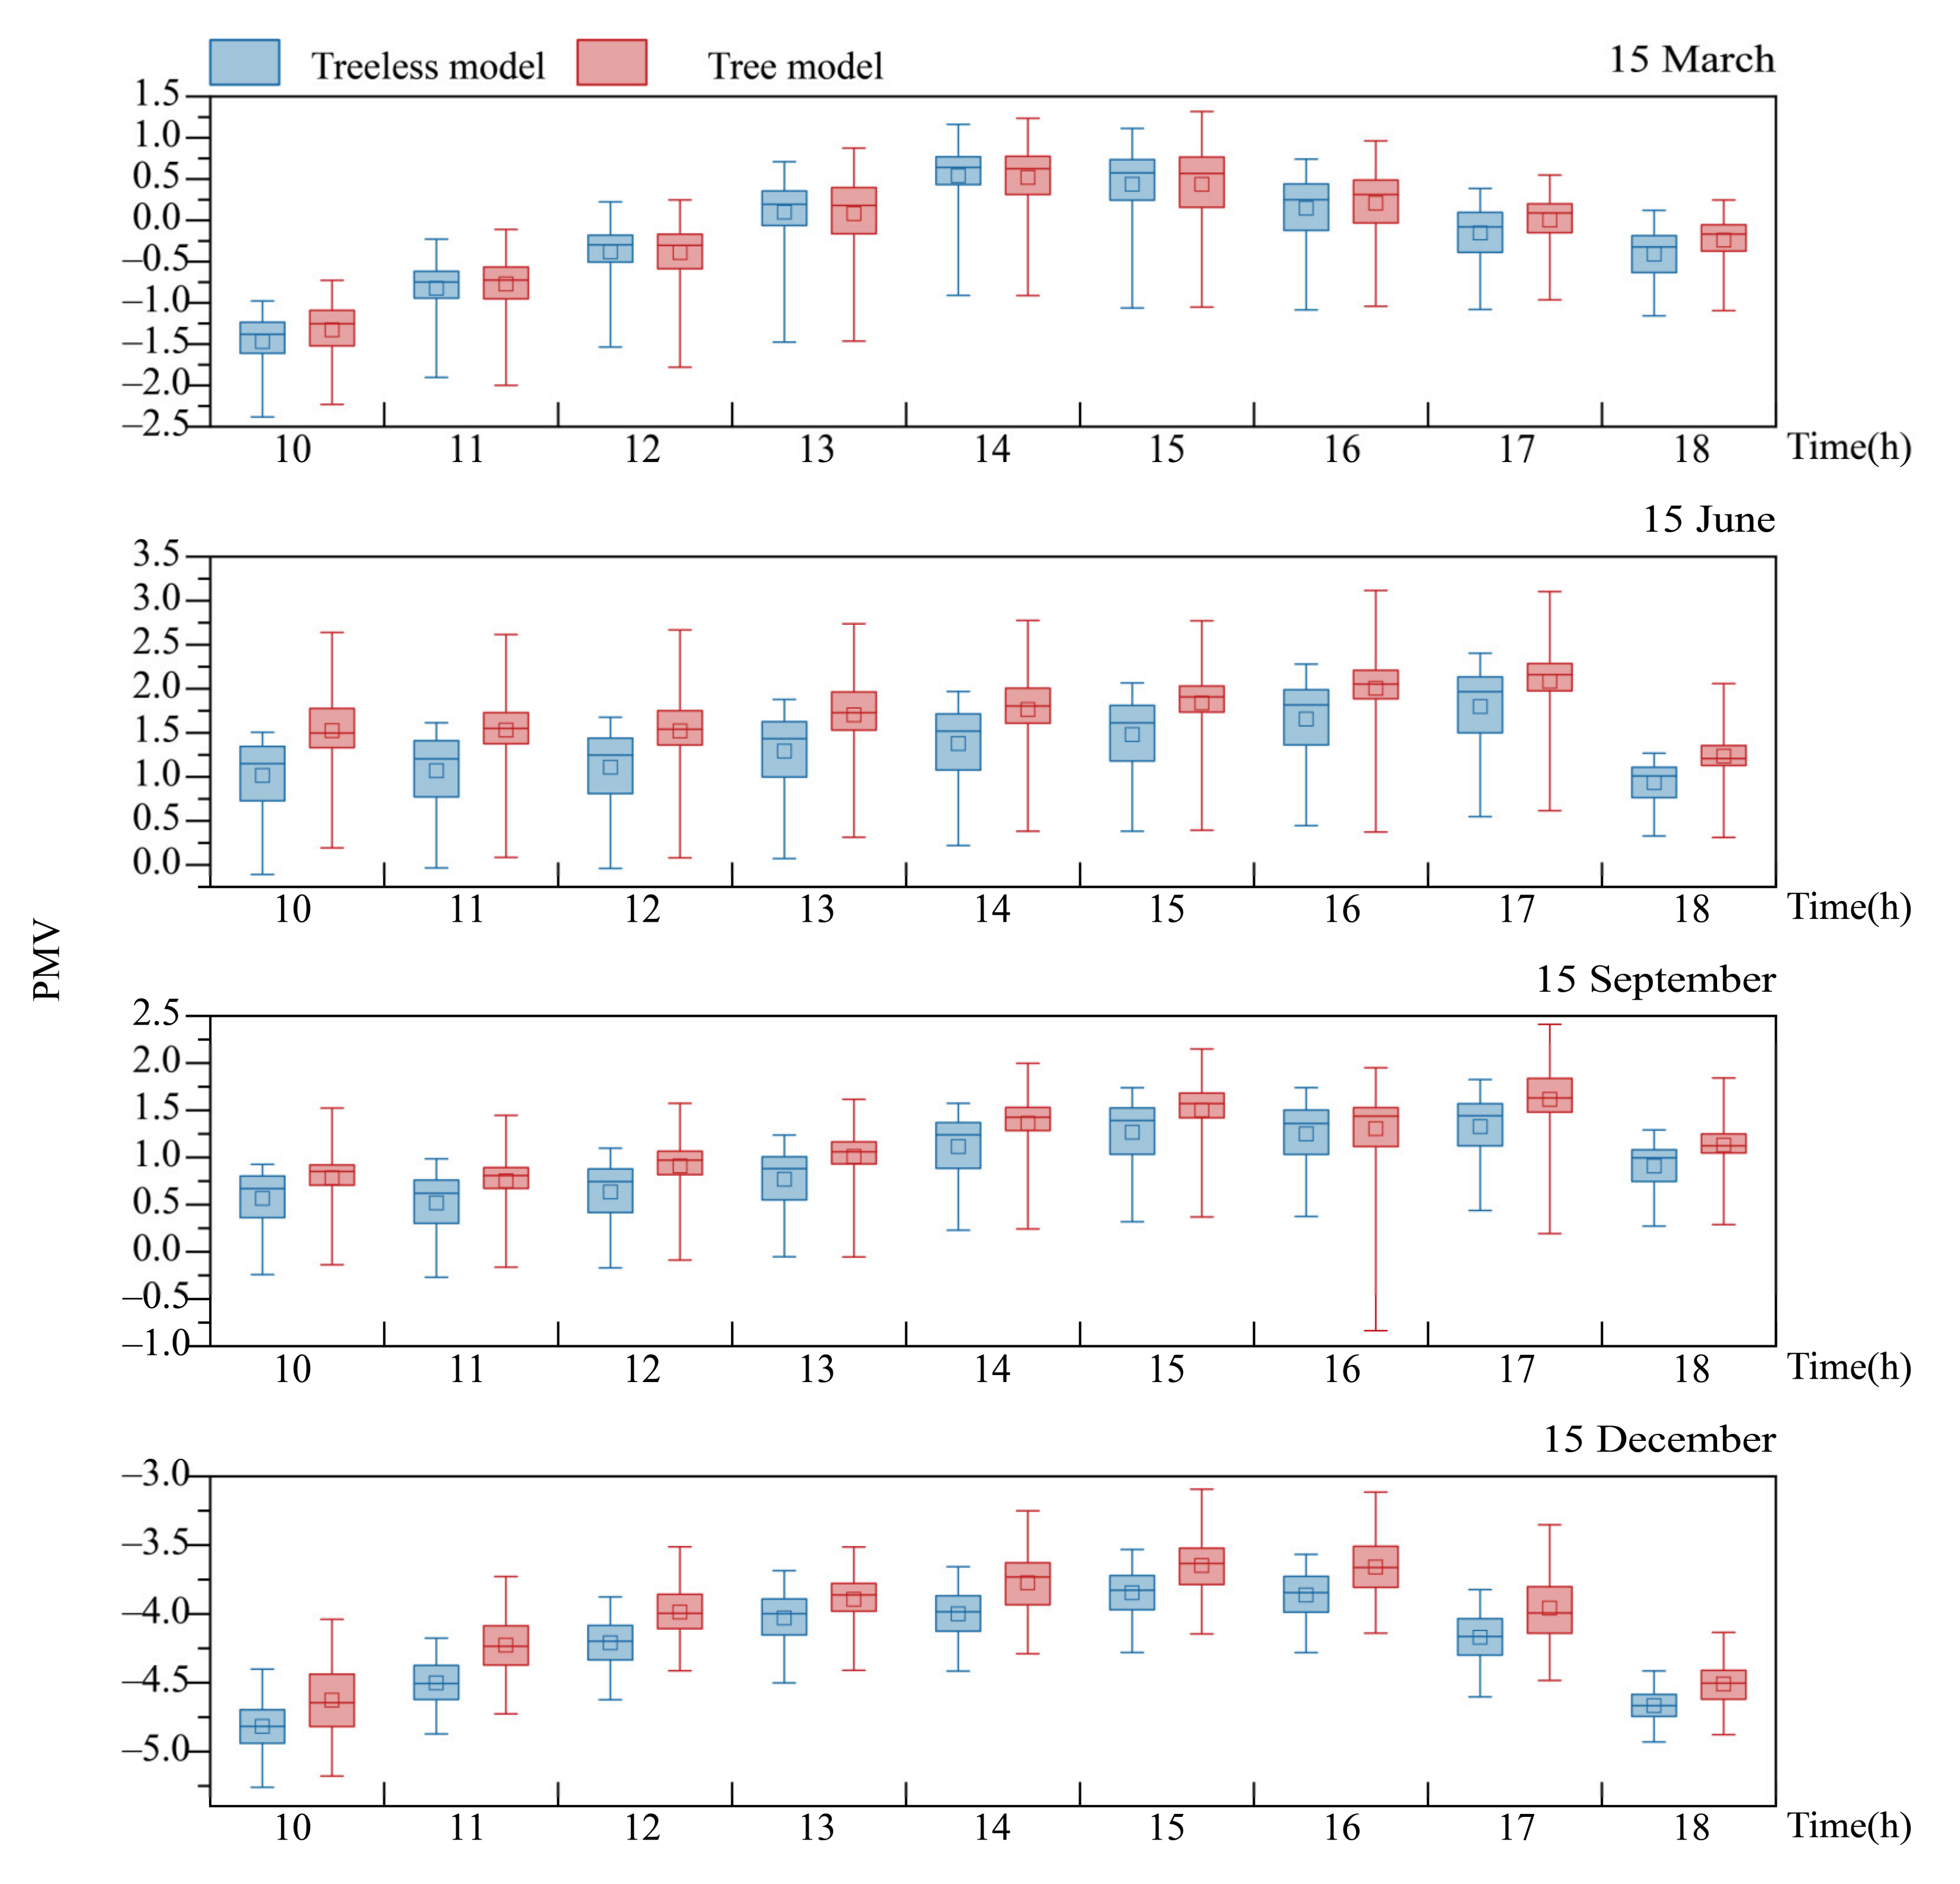
3.5. Results of Outdoor Thermal Comfort (PMV) between Buildings
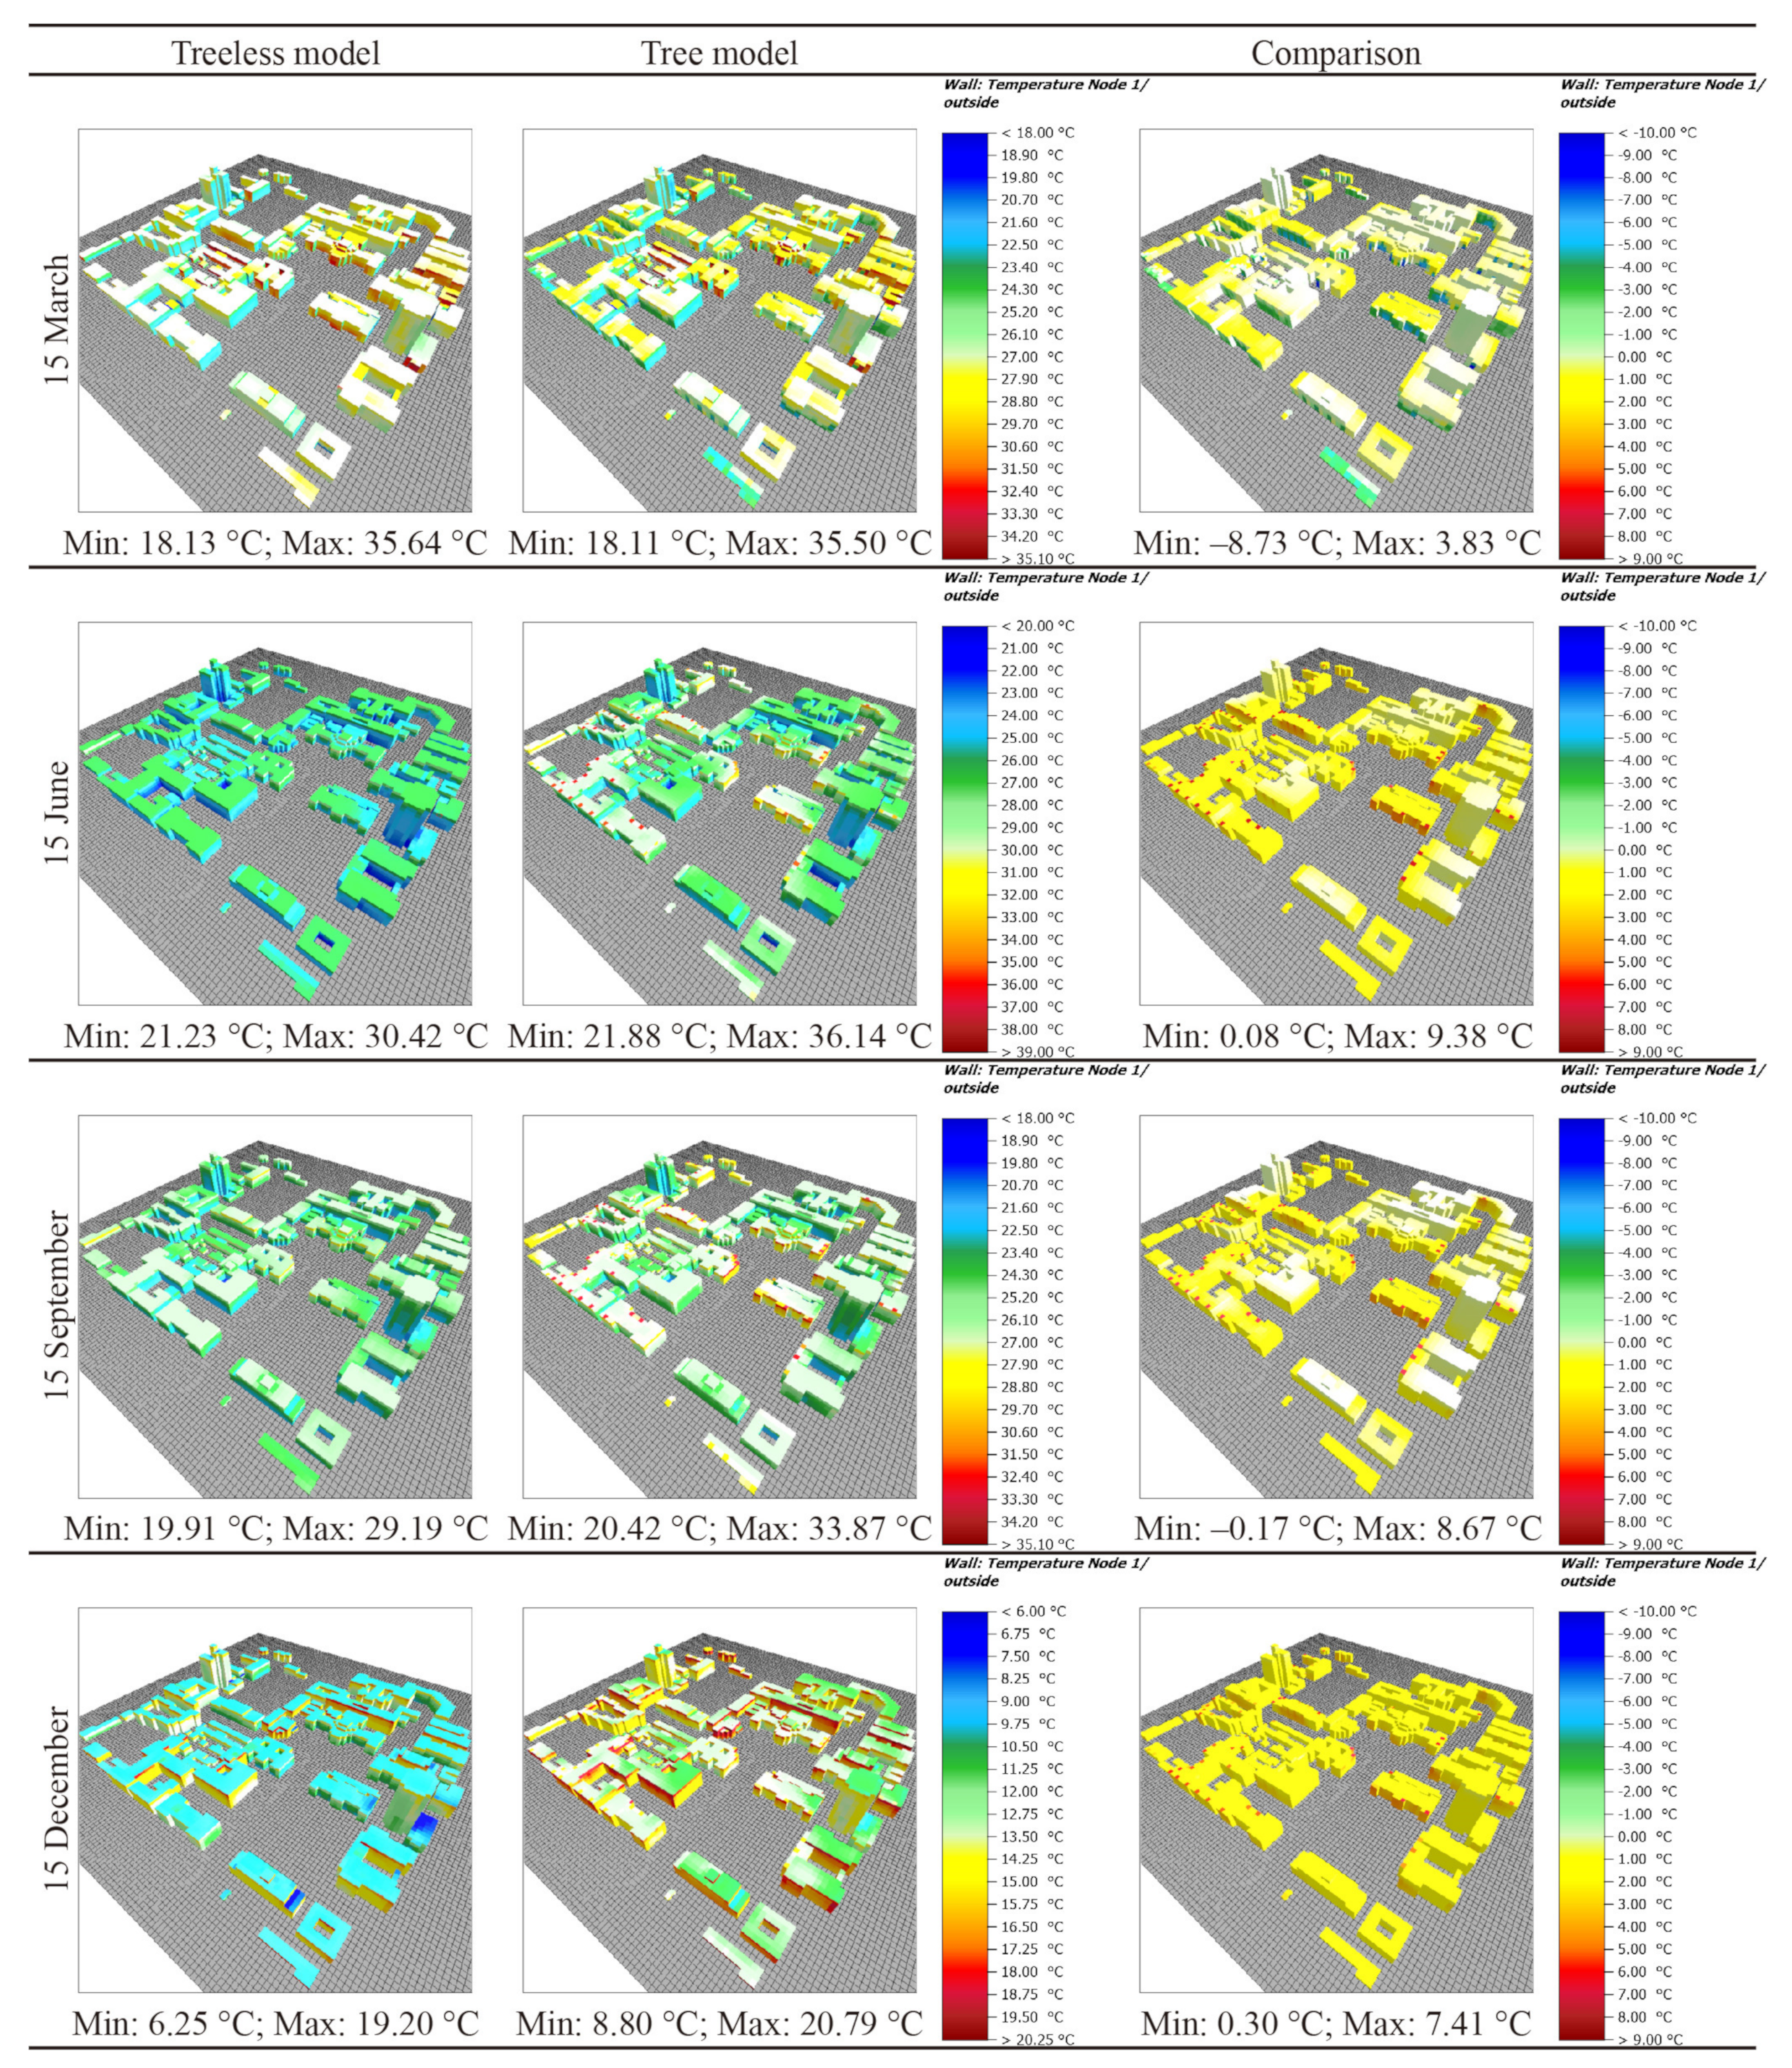
3.6. Results of Façade Temperature
3.7. Results of Overall Average Comparison
3.8. Results of Marquee Data
4. Discussion
5. Conclusions
Author Contributions
Funding
Conflicts of Interest
Appendix A

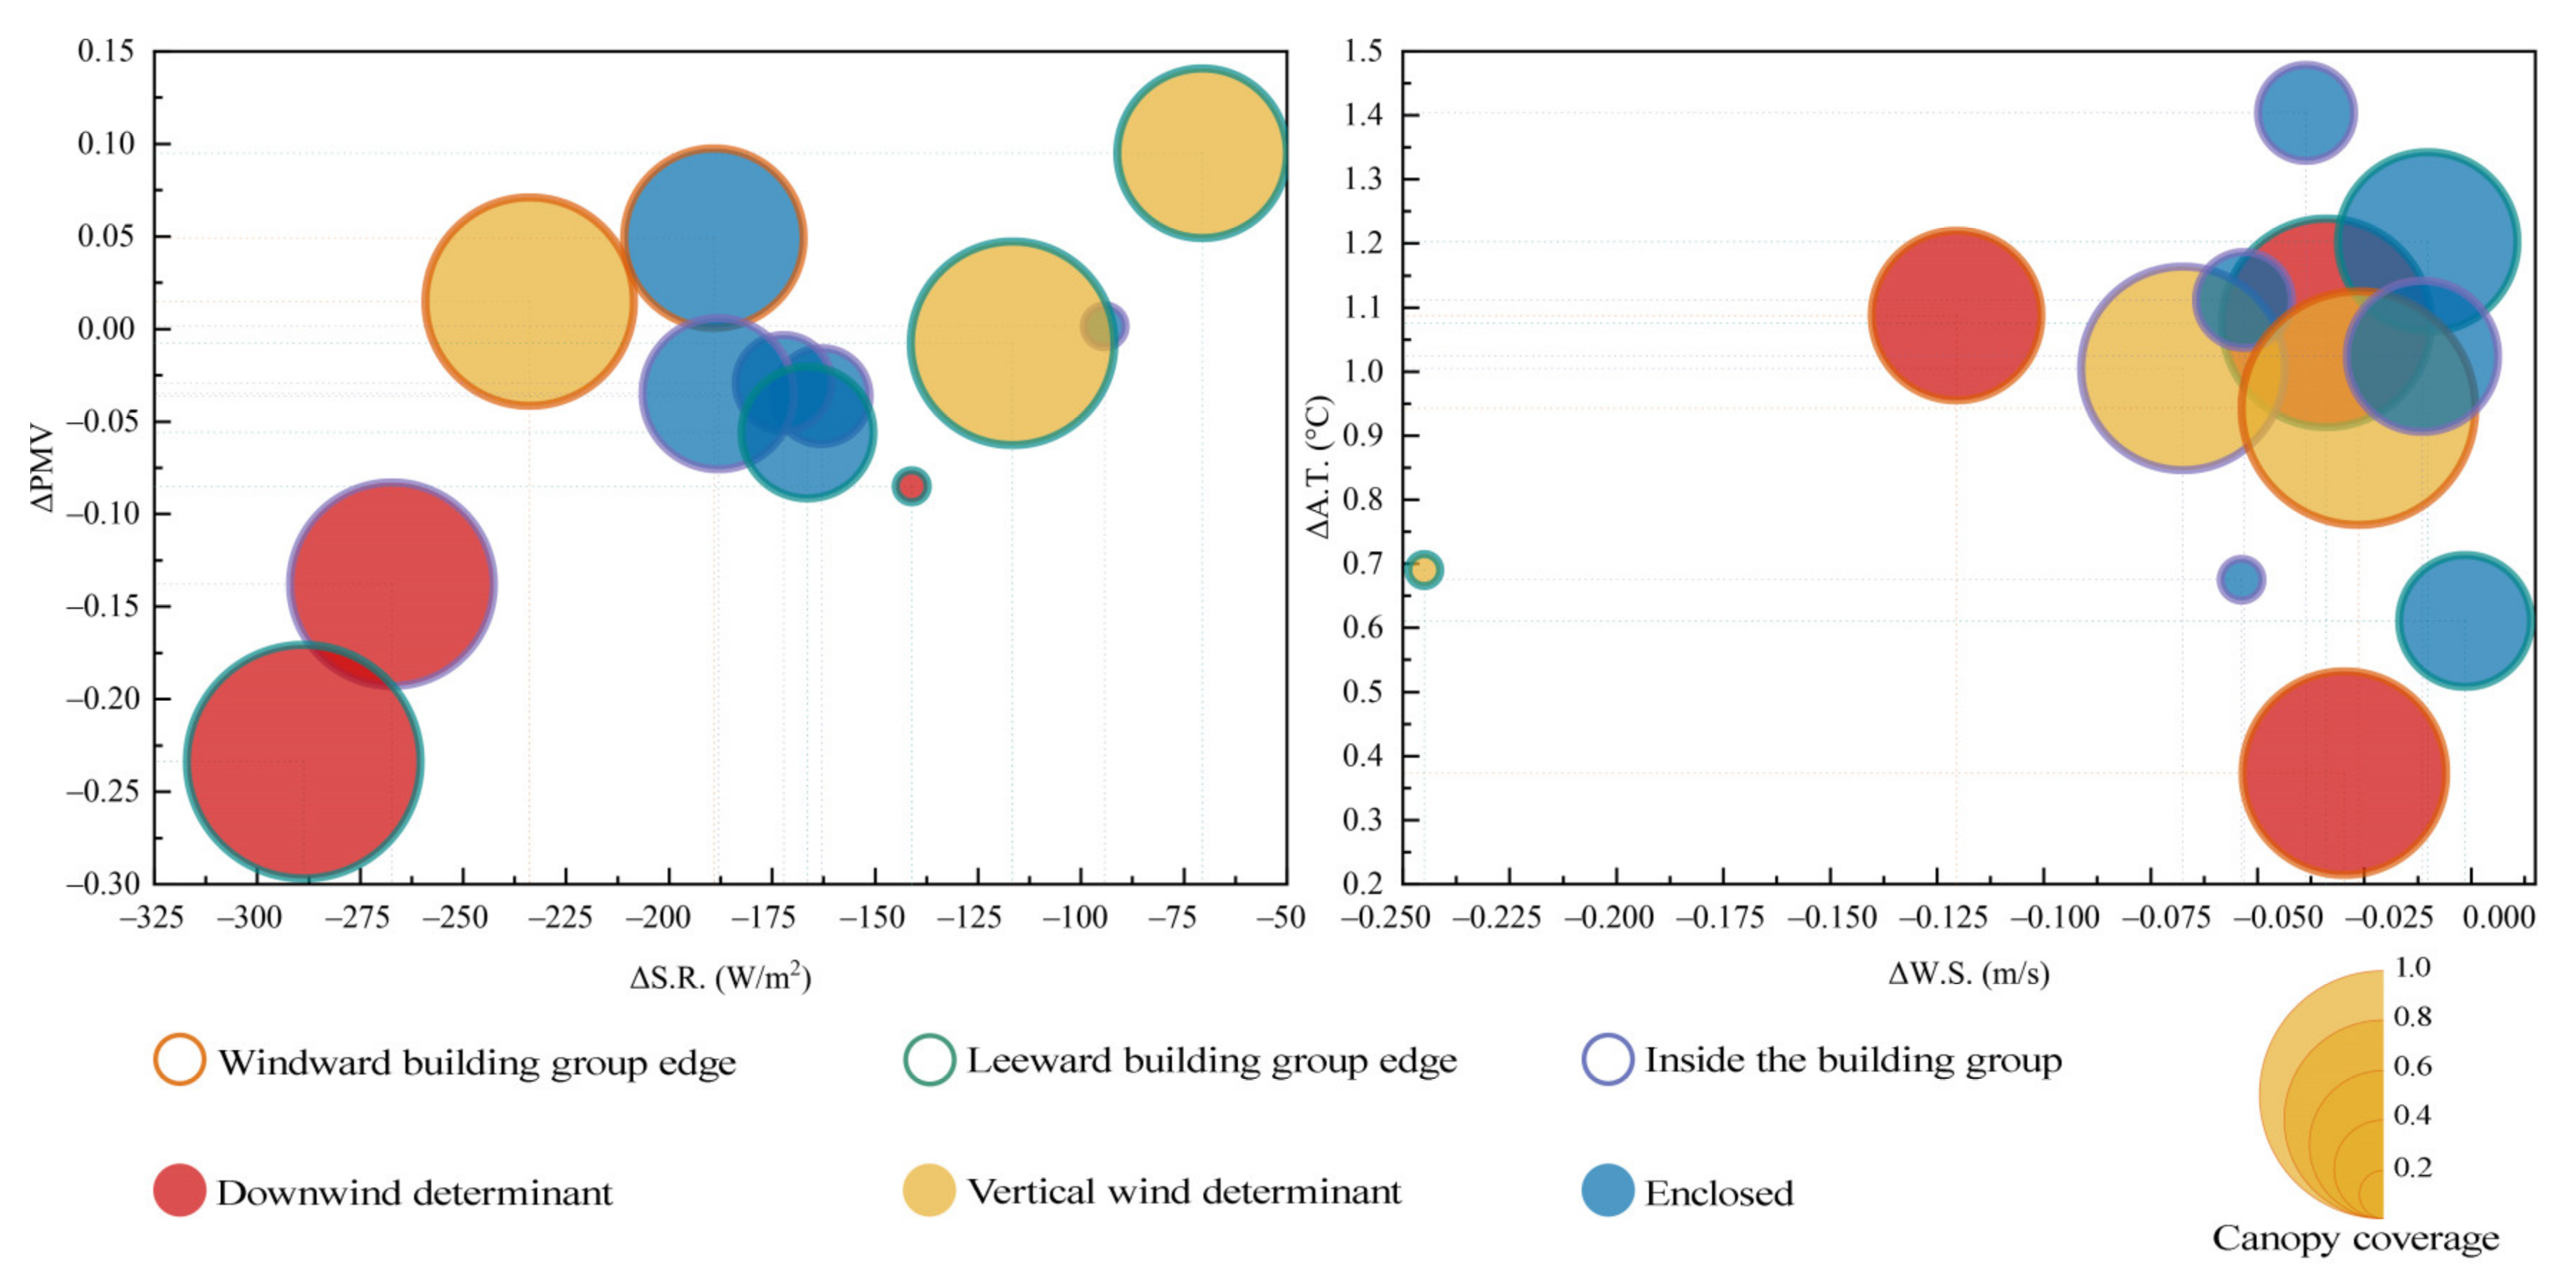
| (a). 15 March | |||||||
| Canopy Coverage | Layout | Location | ΔS.R. (W/m2) | ΔA.T. (°C) | ΔW.S. (m/s) | ΔPMV | |
| 1 | 0.866667 | VWD | WBGE | −233.884 | 0.295177 | 0.118485 | 0.014867 |
| 2 | 0.75 | E | WBGE | −189.122 | 0.274677 | 0.108939 | 0.049034 |
| 3 | 0.846154 | DD | IBG | −267.35 | 0.204117 | 0.009501 | −0.13796 |
| 4 | 0.2 | E | IBG | −94.313 | 0.187346 | 0.024717 | 0.001508 |
| 5 | 0.416667 | E | IBG | −163.057 | 0.300329 | −0.02448 | −0.03615 |
| 6 | 0.415 | E | IBG | −172.207 | 0.14311 | 0.050275 | −0.02917 |
| 7 | 0.712963 | VWD | LBGE | −70.6579 | 0.24253 | 0.009321 | 0.095042 |
| 8 | 0.969697 | DD | LBGE | −288.685 | −0.16867 | 0.232768 | −0.23363 |
| 9 | 0.636667 | E | IBG | −188.129 | 0.051496 | 0.088151 | −0.03499 |
| 10 | 0.559441 | E | LBGE | −166.405 | −0.02918 | 0.0913 | −0.05598 |
| 11 | 0.848485 | VWD | LBGE | −116.632 | 0.015353 | 0.085779 | −0.0078 |
| 12 | 0.157895 | DD | LBGE | −141.165 | 0.016937 | −0.17098 | −0.08489 |
| Wind direction: 12° | |||||||
| (b). 15 June | |||||||
| Canopy Coverage | Layout | Location | ΔS.R. (W/m2) | ΔA.T. (°C) | ΔW.S. (m/s) | ΔPMV | |
| 1 | 0.866667 | VWD | LBGE | −1.44717 | 1.607159 | −0.13122 | 0.663578 |
| 2 | 0.75 | E | LBGE | −1.03549 | 1.444576 | 0.368378 | 0.61605 |
| 3 | 0.846154 | DD | IBG | −1.76956 | 1.574533 | −0.04317 | 0.604991 |
| 4 | 0.2 | E | IBG | −1.33 | 1.319982 | −0.03592 | 0.440936 |
| 5 | 0.416667 | E | IBG | −2.44453 | 1.724289 | −0.17888 | 0.582411 |
| 6 | 0.415 | E | IBG | −2.44318 | 1.913297 | 0.031413 | 0.656675 |
| 7 | 0.712963 | VWD | WBGE | −2.68608 | 1.894526 | 0.131189 | 0.64751 |
| 8 | 0.969697 | DD | WBGE | −1.68921 | 1.089008 | 0.426054 | 0.54987 |
| 9 | 0.636667 | E | IBG | −2.73334 | 1.53011 | 0.261862 | 0.612494 |
| 10 | 0.559441 | E | WBGE | −1.21009 | 0.573616 | 0.24289 | 0.3408 |
| 11 | 0.848485 | VWD | WBGE | −1.53628 | 0.196246 | 0.247588 | 0.259214 |
| 12 | 0.157895 | DD | LBGE | −3.18532 | 0.016658 | 0.120382 | 0.120383 |
| Wind direction: 156° | |||||||
| (c). 15 September | |||||||
| Canopy Coverage | Layout | Location | ΔS.R. (W/m2) | ΔA.T. (°C) | ΔW.S. (m/s) | ΔPMV | |
| 1 | 0.866667 | DD | WBGE | −1.44088 | 0.891596 | 0.644554 | 0.464355 |
| 2 | 0.75 | E | WBGE | −0.97823 | 0.628945 | 0.642251 | 0.399441 |
| 3 | 0.846154 | VWD | IBG | −1.73729 | 0.743274 | 0.376512 | 0.384758 |
| 4 | 0.2 | E | IBG | −1.32415 | 1.071369 | 0.418308 | 0.370467 |
| 5 | 0.416667 | E | IBG | −2.44445 | 0.810564 | −0.0664 | 0.353771 |
| 6 | 0.415 | E | IBG | −2.45151 | 1.065336 | −0.0966 | 0.439253 |
| 7 | 0.712963 | DD | LBGE | −2.6319 | 1.175472 | 0.082519 | 0.466394 |
| 8 | 0.969697 | VWD | LBGE | −1.65825 | 1.262547 | 0.599528 | 0.561655 |
| 9 | 0.636667 | E | IBG | −2.68482 | 1.511156 | 0.536059 | 0.582903 |
| 10 | 0.559441 | E | WBGE | −1.17841 | 0.488601 | 0.631484 | 0.298461 |
| 11 | 0.848485 | DD | WBGE | −1.44598 | 0.458734 | 0.396177 | 0.291394 |
| 12 | 0.157895 | VWD | WBGE | −3.2256 | −0.02397 | 0.196467 | 0.08979 |
| Wind direction: 267° | |||||||
| (d). 15 December | |||||||
| Canopy Coverage | Layout | Location | ΔS.R. (W/m2) | ΔA.T. (°C) | ΔW.S. (m/s) | ΔPMV | |
| 1 | 0.866667 | DD | LBGE | −2.12521 | 1.076418 | −0.03395 | 0.434424 |
| 2 | 0.75 | E | LBGE | −1.41085 | 1.202791 | −0.01014 | 0.458446 |
| 3 | 0.846154 | VWD | IBG | −2.27264 | 1.005118 | −0.06748 | 0.384099 |
| 4 | 0.2 | E | IBG | −1.90624 | 0.675531 | −0.05376 | 0.245573 |
| 5 | 0.416667 | E | IBG | −3.11303 | 1.112071 | −0.05318 | 0.377153 |
| 6 | 0.415 | E | IBG | −3.14581 | 1.404079 | −0.03865 | 0.464138 |
| 7 | 0.712963 | DD | WBGE | −2.85953 | 1.087835 | −0.12042 | 0.386298 |
| 8 | 0.969697 | VWD | WBGE | −2.17563 | 0.942917 | −0.02643 | 0.411017 |
| 9 | 0.636667 | E | IBG | −2.77692 | 1.023979 | −0.0114 | 0.397938 |
| 10 | 0.559441 | E | LBGE | −1.7789 | 0.610644 | −0.00148 | 0.273837 |
| 11 | 0.848485 | DD | WBGE | −1.62501 | 0.373165 | −0.02964 | 0.210405 |
| 12 | 0.157895 | VWD | LBGE | −4.10567 | 0.690514 | −0.245 | 0.232986 |
| Wind direction: 129° | |||||||
References
- National Bureau of Statistics of China. Statistical Communiqué of the People’s Republic of China on the 2021 National Economic and Social Development; National Bureau of Statistics of China: Beijing, China, 2022.
- Chen, M.; Liu, W.; Lu, D. Challenges and the Way Forward in China’s New-Type Urbanization. Land Use Policy 2016, 55, 334–339. [Google Scholar] [CrossRef]
- Wang, Q.; Wu, S.D.; Zeng, Y.E.; Wu, B.W. Exploring the Relationship between Urbanization, Energy Consumption, and CO2 Emissions in Different Provinces of China. Renew. Sustain. Energy Rev. 2016, 54, 1563–1579. [Google Scholar] [CrossRef]
- Martinelli, L.; Lin, T.P.; Matzarakis, A. Assessment of the Influence of Daily Shadings Pattern on Human Thermal Comfort and Attendance in Rome during Summer Period. Build. Environ. 2015, 92, 30–38. [Google Scholar] [CrossRef]
- Lappen, C.-L.; Schumacher, C. Rapid urbanization and changes in spatiotemporal characteristics of precipitation in Beijing metropolitan area. J. Geophys. Res. 2014, 119, 2966–2989. [Google Scholar] [CrossRef]
- Hondula, D.M.; Georgescu, M.; Balling, R.C. Challenges Associated with Projecting Urbanization-Induced Heat-Related Mortality. Sci. Total Environ. 2014, 490, 538–544. [Google Scholar] [CrossRef]
- Kim, S.W.; Brown, R.D. Urban Heat Island (UHI) Intensity and Magnitude Estimations: A Systematic Literature Review. Sci. Total Environ. 2021, 779, 146389. [Google Scholar] [CrossRef]
- Tong, S.; Wong, N.H.; Tan, C.L.; Jusuf, S.K.; Ignatius, M.; Tan, E. Impact of Urban Morphology on Microclimate and Thermal Comfort in Northern China. Sol. Energy 2017, 155, 212–223. [Google Scholar] [CrossRef]
- Bowler, D.E.; Buyung-Ali, L.; Knight, T.M.; Pullin, A.S. Urban Greening to Cool Towns and Cities: A Systematic Review of the Empirical Evidence. Landsc. Urban Plan. 2010, 97, 147–155. [Google Scholar] [CrossRef]
- He, X.; Gao, W.; Wang, R. Impact of Urban Morphology on the Microclimate around Elementary Schools: A Case Study from Japan. Build. Environ. 2021, 206, 108383. [Google Scholar] [CrossRef]
- Nasrollahi, N.; Namazi, Y.; Taleghani, M. The Effect of Urban Shading and Canyon Geometry on Outdoor Thermal Comfort in Hot Climates: A Case Study of Ahvaz, Iran. Sustain. Cities Soc. 2021, 65, 102638. [Google Scholar] [CrossRef]
- Bouketta, S.; Bouchahm, Y. Numerical Evaluation of Urban Geometry’s Control of Wind Movements in Outdoor Spaces during Winter Period. Case of Mediterranean Climate. Renew. Energy 2020, 146, 1062–1069. [Google Scholar] [CrossRef]
- Chatzidimitriou, A.; Yannas, S. Street Canyon Design and Improvement Potential for Urban Open Spaces; the Influence of Canyon Aspect Ratio and Orientation on Microclimate and Outdoor Comfort. Sustain. Cities Soc. 2017, 33, 85–101. [Google Scholar] [CrossRef]
- Muniz-Gäal, L.P.; Pezzuto, C.C.; de Carvalho, M.F.H.; Mota, L.T.M. Urban Geometry and the Microclimate of Street Canyons in Tropical Climate. Build. Environ. 2020, 169, 106547. [Google Scholar] [CrossRef]
- Hang, J.; Sandberg, M.; Li, Y.; Claesson, L. Flow Mechanisms and Flow Capacity in Idealized Long-Street City Models. Build. Environ. 2010, 45, 1042–1053. [Google Scholar] [CrossRef]
- Tong, S.; Wong, N.H.; Jusuf, S.K.; Tan, C.L.; Wong, H.F.; Ignatius, M.; Tan, E. Study on Correlation between Air Temperature and Urban Morphology Parameters in Built Environment in Northern China. Build. Environ. 2018, 127, 239–249. [Google Scholar] [CrossRef]
- He, B.J.; Ding, L.; Prasad, D. Outdoor Thermal Environment of an Open Space under Sea Breeze: A Mobile Experience in a Coastal City of Sydney, Australia. Urban Clim. 2020, 31, 100567. [Google Scholar] [CrossRef]
- Li, Y.; Song, Y. Optimization of Vegetation Arrangement to Improve Microclimate and Thermal Comfort in an Urban Park. Int. Rev. Spat. Plan. Sustain. Dev. 2019, 7, 18–30. [Google Scholar] [CrossRef] [Green Version]
- Armson, D.; Stringer, P.; Ennos, A.R. The Effect of Tree Shade and Grass on Surface and Globe Temperatures in an Urban Area. Urban For. Urban Green. 2012, 11, 245–255. [Google Scholar] [CrossRef]
- Lin, T.P.; Tsai, K.T.; Liao, C.C.; Huang, Y.C. Effects of Thermal Comfort and Adaptation on Park Attendance Regarding Different Shading Levels and Activity Types. Build. Environ. 2013, 59, 599–611. [Google Scholar] [CrossRef]
- Duarte, D.H.S.; Shinzato, P.; dos Santos Gusson, C.; Alves, C.A. The Impact of Vegetation on Urban Microclimate to Counterbalance Built Density in a Subtropical Changing Climate. Urban Clim. 2015, 14, 224–239. [Google Scholar] [CrossRef]
- Palme, M.; Privitera, R.; La Rosa, D. The Shading Effects of Green Infrastructure in Private Residential Areas: Building Performance Simulation to Support Urban Planning. Energy Build. 2020, 229, 110531. [Google Scholar] [CrossRef]
- Oliveira, S.; Andrade, H.; Vaz, T. The Cooling Effect of Green Spaces as a Contribution to the Mitigation of Urban Heat: A Case Study in Lisbon. Build. Environ. 2011, 46, 2186–2194. [Google Scholar] [CrossRef]
- Perini, K.; Chokhachian, A.; Auer, T. Green Streets to Enhance Outdoor Comfort; Elsevier Inc.: Amsterdam, The Netherlands, 2018; ISBN 9780128123249. [Google Scholar]
- Jin, H.; Shao, T.; Zhang, R. Effect of Water Body Forms on Microclimate of Residential District. Energy Procedia 2017, 134, 256–265. [Google Scholar] [CrossRef]
- Salata, F.; Golasi, I.; Vollaro, A.D.L.; Vollaro, R.D.L. How High Albedo and Traditional Buildings’ Materials and Vegetation Affect the Quality of Urban Microclimate. A Case Study. Energy Build. 2015, 99, 32–49. [Google Scholar] [CrossRef]
- Well, F.; Ludwig, F. Blue–Green Architecture: A Case Study Analysis Considering the Synergetic Effects of Water and Vegetation. Front. Archit. Res. 2019, 9, 191–202. [Google Scholar] [CrossRef]
- Santamouris, M. Cooling the Cities—A Review of Reflective and Green Roof Mitigation Technologies to Fight Heat Island and Improve Comfort in Urban Environments. Sol. Energy 2014, 103, 682–703. [Google Scholar] [CrossRef]
- Watanabe, S.; Nagano, K.; Ishii, J.; Horikoshi, T. Evaluation of Outdoor Thermal Comfort in Sunlight, Building Shade, and Pergola Shade during Summer in a Humid Subtropical Region. Build. Environ. 2014, 82, 556–565. [Google Scholar] [CrossRef]
- Liu, W.; Zhang, Y.; Deng, Q. The Effects of Urban Microclimate on Outdoor Thermal Sensation and Neutral Temperature in Hot-Summer and Cold-Winter Climate. Energy Build. 2016, 128, 190–197. [Google Scholar] [CrossRef]
- Chen, X.; Gao, L.; Xue, P.; Du, J.; Liu, J. Investigation of Outdoor Thermal Sensation and Comfort Evaluation Methods in Severe Cold Area. Sci. Total Environ. 2020, 749, 141520. [Google Scholar] [CrossRef]
- Yang, X.; Li, Y.; Yang, L. Predicting and Understanding Temporal 3D Exterior Surface Temperature Distribution in an Ideal Courtyard. Build. Environ. 2012, 57, 38–48. [Google Scholar] [CrossRef]
- Xu, M.; Hong, B.; Mi, J.; Yan, S. Outdoor Thermal Comfort in an Urban Park during Winter in Cold Regions of China. Sustain. Cities Soc. 2018, 43, 208–220. [Google Scholar] [CrossRef]
- Nikolopoulou, M.; Lykoudis, S. Thermal Comfort in Outdoor Urban Spaces: Analysis across Different European Countries. Build. Environ. 2006, 41, 1455–1470. [Google Scholar] [CrossRef] [Green Version]
- Dardir, M.; Berardi, U. Development of Microclimate Modeling for Enhancing Neighborhood Thermal Performance through Urban Greenery Cover. Energy Build. 2021, 252, 111428. [Google Scholar] [CrossRef]
- Berry, R.; Livesley, S.J.; Aye, L. Tree Canopy Shade Impacts on Solar Irradiance Received by Building Walls and Their Surface Temperature. Build. Environ. 2013, 69, 91–100. [Google Scholar] [CrossRef]
- De Abreu-Harbich, L.V.; Labaki, L.C.; Matzarakis, A. Effect of Tree Planting Design and Tree Species on Human Thermal Comfort in the Tropics. Landsc. Urban Plan. 2015, 138, 99–109. [Google Scholar] [CrossRef]
- Morakinyo, T.E.; Kong, L.; Lau, K.K.L.; Yuan, C.; Ng, E. A Study on the Impact of Shadow-Cast and Tree Species on in-Canyon and Neighborhood’s Thermal Comfort. Build. Environ. 2017, 115, 1–17. [Google Scholar] [CrossRef]
- Hsieh, C.M.; Li, J.J.; Zhang, L.; Schwegler, B. Effects of Tree Shading and Transpiration on Building Cooling Energy Use. Energy Build. 2018, 159, 382–397. [Google Scholar] [CrossRef]
- Xu, M.; Hong, B.; Jiang, R.; An, L.; Zhang, T. Outdoor Thermal Comfort of Shaded Spaces in an Urban Park in the Cold Region of China. Build. Environ. 2019, 155, 408–420. [Google Scholar] [CrossRef]
- Shashua-Bar, L.; Tsiros, I.X.; Hoffman, M.E. A Modeling Study for Evaluating Passive Cooling Scenarios in Urban Streets with Trees. Case Study: Athens, Greece. Build. Environ. 2010, 45, 2798–2807. [Google Scholar] [CrossRef]
- Sabrin, S.; Karimi, M.; Nazari, R.; Pratt, J.; Bryk, J. Effects of Different Urban-Vegetation Morphology on the Canopy-Level Thermal Comfort and the Cooling Benefits of Shade Trees: Case-Study in Philadelphia. Sustain. Cities Soc. 2021, 66, 102684. [Google Scholar] [CrossRef]
- Feng, L.; Yang, S.; Zhou, Y.; Shuai, L. Exploring the Effects of the Spatial Arrangement and Leaf Area Density of Trees on Building Wall Temperature. Build. Environ. 2021, 205, 108295. [Google Scholar] [CrossRef]
- Salim, S.M.; Cheah, S.C.; Chan, A. Numerical Simulation of Dispersion in Urban Street Canyons with Avenue-like Tree Plantings: Comparison between RANS and LES. Build. Environ. 2011, 46, 1735–1746. [Google Scholar] [CrossRef]
- Park, M.; Hagishima, A.; Tanimoto, J.; Narita, K. ichi Effect of Urban Vegetation on Outdoor Thermal Environment: Field Measurement at a Scale Model Site. Build. Environ. 2012, 56, 38–46. [Google Scholar] [CrossRef]
- Tan, Z.; Lau, K.K.L.; Ng, E. Urban Tree Design Approaches for Mitigating Daytime Urban Heat Island Effects in a High-Density Urban Environment. Energy Build. 2016, 114, 265–274. [Google Scholar] [CrossRef]
- Abdi, B.; Hami, A.; Zarehaghi, D. Impact of Small-Scale Tree Planting Patterns on Outdoor Cooling and Thermal Comfort. Sustain. Cities Soc. 2020, 56, 102085. [Google Scholar] [CrossRef]
- Zhao, Y.; Chen, Y.; Li, K. A Simulation Study on the Effects of Tree Height Variations on the Façade Temperature of Enclosed Courtyard in North China. Build. Environ. 2022, 207, 108566. [Google Scholar] [CrossRef]
- Brozovsky, J.; Corio, S.; Gaitani, N.; Gustavsen, A. Evaluation of Sustainable Strategies and Design Solutions at High-Latitude Urban Settlements to Enhance Outdoor Thermal Comfort. Energy Build. 2021, 244, 111037. [Google Scholar] [CrossRef]
- Skelhorn, C.; Lindley, S.; Levermore, G. The Impact of Vegetation Types on Air and Surface Temperatures in a Temperate City: A Fine Scale Assessment in Manchester, UK. Landsc. Urban Plan. 2014, 121, 129–140. [Google Scholar] [CrossRef]
- Perini, K.; Chokhachian, A.; Dong, S.; Auer, T. Modeling and Simulating Urban Outdoor Comfort: Coupling ENVI-Met and TRNSYS by Grasshopper. Energy Build. 2017, 152, 373–384. [Google Scholar] [CrossRef]
- Labdaoui, K.; Mazouz, S.; Reiter, S.; Teller, J. Thermal Perception in Outdoor Urban Spaces under the Mediterranean Climate of Annaba, Algeria. Urban Clim. 2021, 39, 100970. [Google Scholar] [CrossRef]


| Data Logger | Temperature/Humidity | Wind Speed | Wind Direction | Solar Radiation | |
|---|---|---|---|---|---|
| Version | RX3003 | S-THB-M002 | S-WSB-M003 | S-WDB-M003 | S-LIB-M003 |
| Operating temperature | 40–+60 °C | −40–+75 °C | −40–+75 °C | −40–+70 °C | −40–+75 °C |
| Accuracy | - | T: ±0.21 ℃ RH: ±2.5% | ±1.1 m/s or ±4% | ±5° | ±10 W/m2 or ±5% |
| Resolution | - | T: 0.02 ℃ RH: 0.1% | 0.5 m/s | 1.4° | 1.25 W/m2 |
| Measurement range | - | T: −40–+75 ℃ RH: 0–100% | 0–76 m/s | 0–355° | 0–1280 W/m2 |
| Size (mm) | 186(H) × 181(L) × 118(W) | 10 × 35 | 410 × 16 | 460 × 200 | 41(H) × 32(Φ) |
| EnvironmentData | Sensor Model | Precision | Range | Resolution |
|---|---|---|---|---|
| Temperature | DHT22 | <±0.5 °C | −40–80 °C | 0.1 °C |
| Humidity | ±2% RH | 20–90% RH | 1% RH | |
| Light intensity | BH1750FVI | 1 lx | 1–65535 lx | 1 lx |
| CO2 concentration | CCS811 | 1 ppm | 400–29,206 ppm | 1 ppm |
| TVOC concentration | 1 ppb | 0–32,768 ppb | 1 ppb |
| Materials | ID | Reflection | Emissivity | Specific Heat [J/(kg K)] | Thermal Conductivity [W/(mK)] |
|---|---|---|---|---|---|
| Moderate insulation | 000000 | 0.50 | 0.90 | 850 | 1.60 |
| Concrete wall (cast dense) | 0000C5 | 0.30 | 0.90 | 840 | 1.90 |
| Brick wall (aerated) | 0000B1 | 0.40 | 0.90 | 840 | 0.30 |
| Brick wall (burned) | 0000B2 | 0.40 | 0.90 | 650 | 0.44 |
| Brick wall (reinforced) | 0000B3 | 0.40 | 0.90 | 840 | 1.10 |
| Vegetation | ID | Albedo | LAD |
|---|---|---|---|
| 50 cm grass | 0000XX | 0.20 | 0.30 |
| 25 m trees | 01HLDL | 0.18 | 0.30 |
| 15 m trees | 0000SK | 0.20 | 0.30 |
| Surface | ID | Albedo | Emissivity |
|---|---|---|---|
| Loamy soil | 000000 | 0.00 | 0.98 |
| Asphalt road | 0000ST | 0.20 | 0.90 |
| Sensor Point | MAPE | MSE | RMSE (°C) |
|---|---|---|---|
| A | 18.6% | 0.88 | 0.94 |
| B | 17.5% | 0.60 | 0.77 |
| C | 17.5% | 1.08 | 1.04 |
| D | 18.6% | 0.44 | 0.67 |
| Average | 18.05% | 0.75 | 0.855 |
Publisher’s Note: MDPI stays neutral with regard to jurisdictional claims in published maps and institutional affiliations. |
© 2022 by the authors. Licensee MDPI, Basel, Switzerland. This article is an open access article distributed under the terms and conditions of the Creative Commons Attribution (CC BY) license (https://creativecommons.org/licenses/by/4.0/).
Share and Cite
Deng, L.; Jia, X.; Wang, W.; Hussain, S.A. Revealing Impacts of Trees on Modeling Microclimate Behavior in Spaces between Buildings through Simulation Monitoring. Buildings 2022, 12, 1168. https://doi.org/10.3390/buildings12081168
Deng L, Jia X, Wang W, Hussain SA. Revealing Impacts of Trees on Modeling Microclimate Behavior in Spaces between Buildings through Simulation Monitoring. Buildings. 2022; 12(8):1168. https://doi.org/10.3390/buildings12081168
Chicago/Turabian StyleDeng, Lirui, Xibei Jia, Wei Wang, and Syed Asad Hussain. 2022. "Revealing Impacts of Trees on Modeling Microclimate Behavior in Spaces between Buildings through Simulation Monitoring" Buildings 12, no. 8: 1168. https://doi.org/10.3390/buildings12081168