


Selection of Circular Proposals in Building Projects: An MCDM Model for Lifecycle Circularity Assessments Using AHP


Abstract
:
1. Introduction
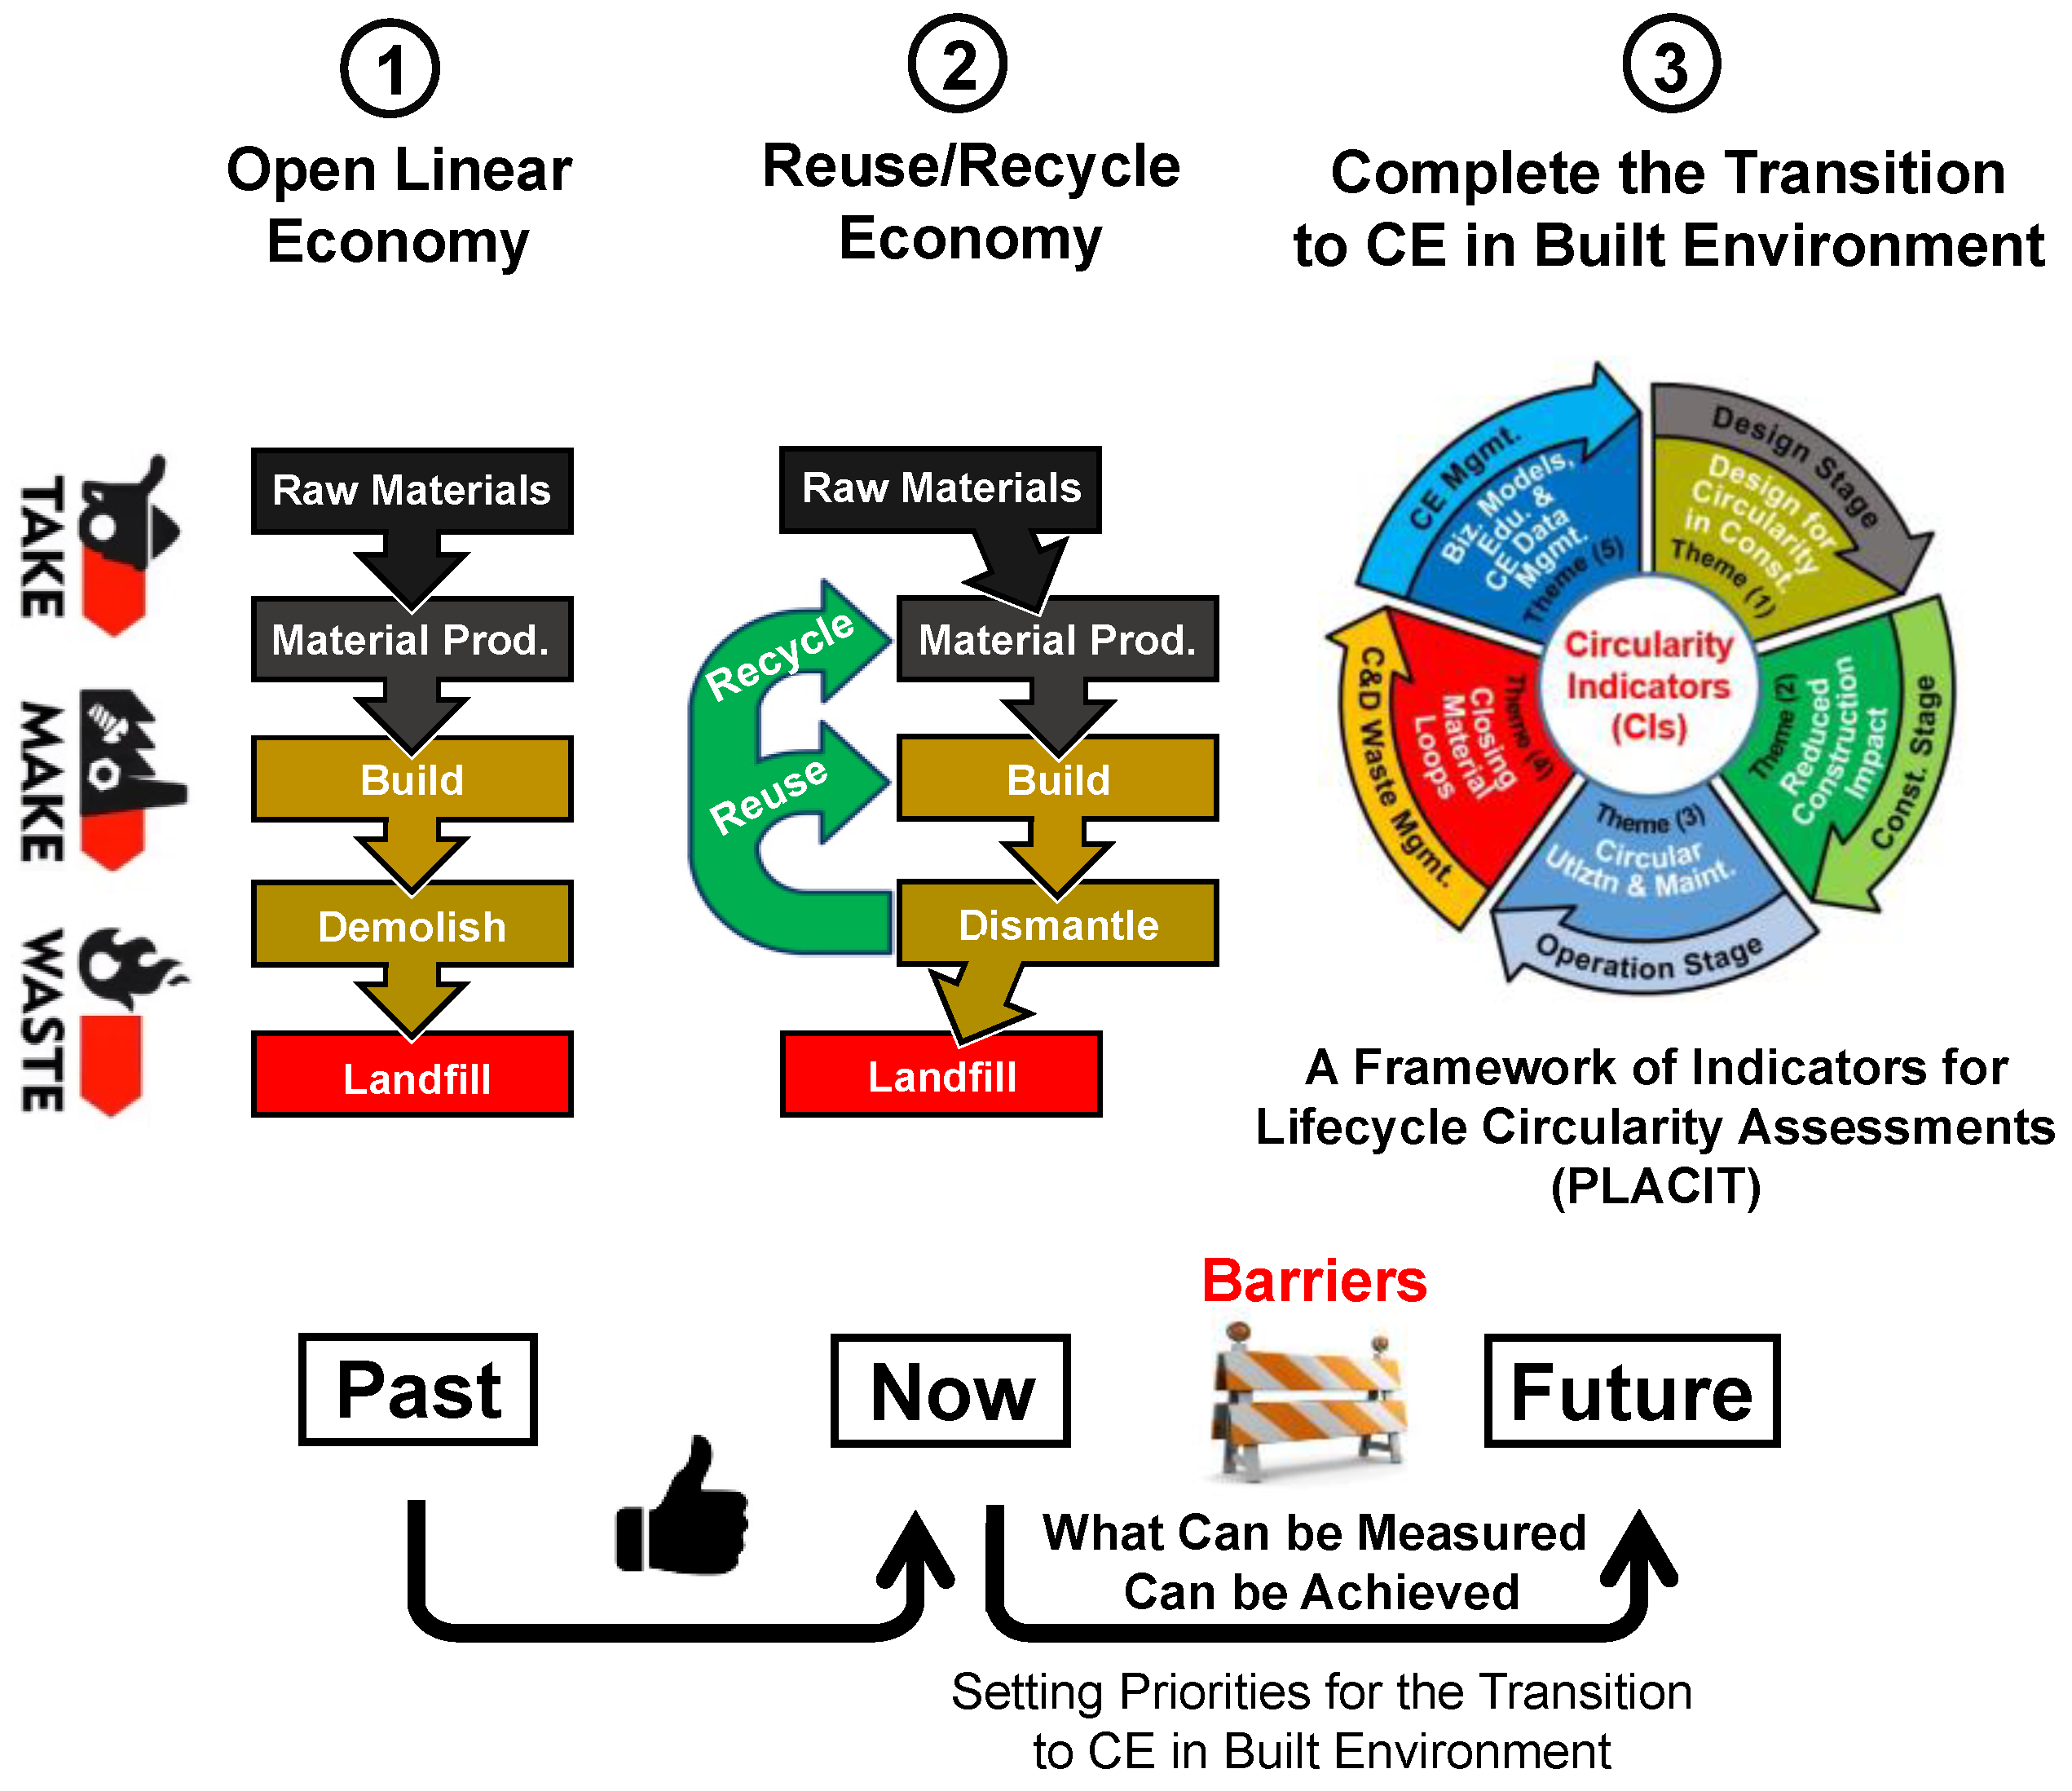
1.1. Background
1.2. Circularity Assessment in Building Projects
1.3. A Conceptual Model for CAs of Building Proposals
1.4. MCDM as a New Pathway to Digital Transformation within Circular Built Environment
1.5. Aim and Objectives
- To develop an MCDM model based on the PLACIT framework to facilitate the selection of circular proposals in building projects using AHP.
- To establish priorities/weightings of the decision-making elements included in the proposed model, i.e., CTs and CIs, using feedback from building practitioners from an online questionnaire survey.
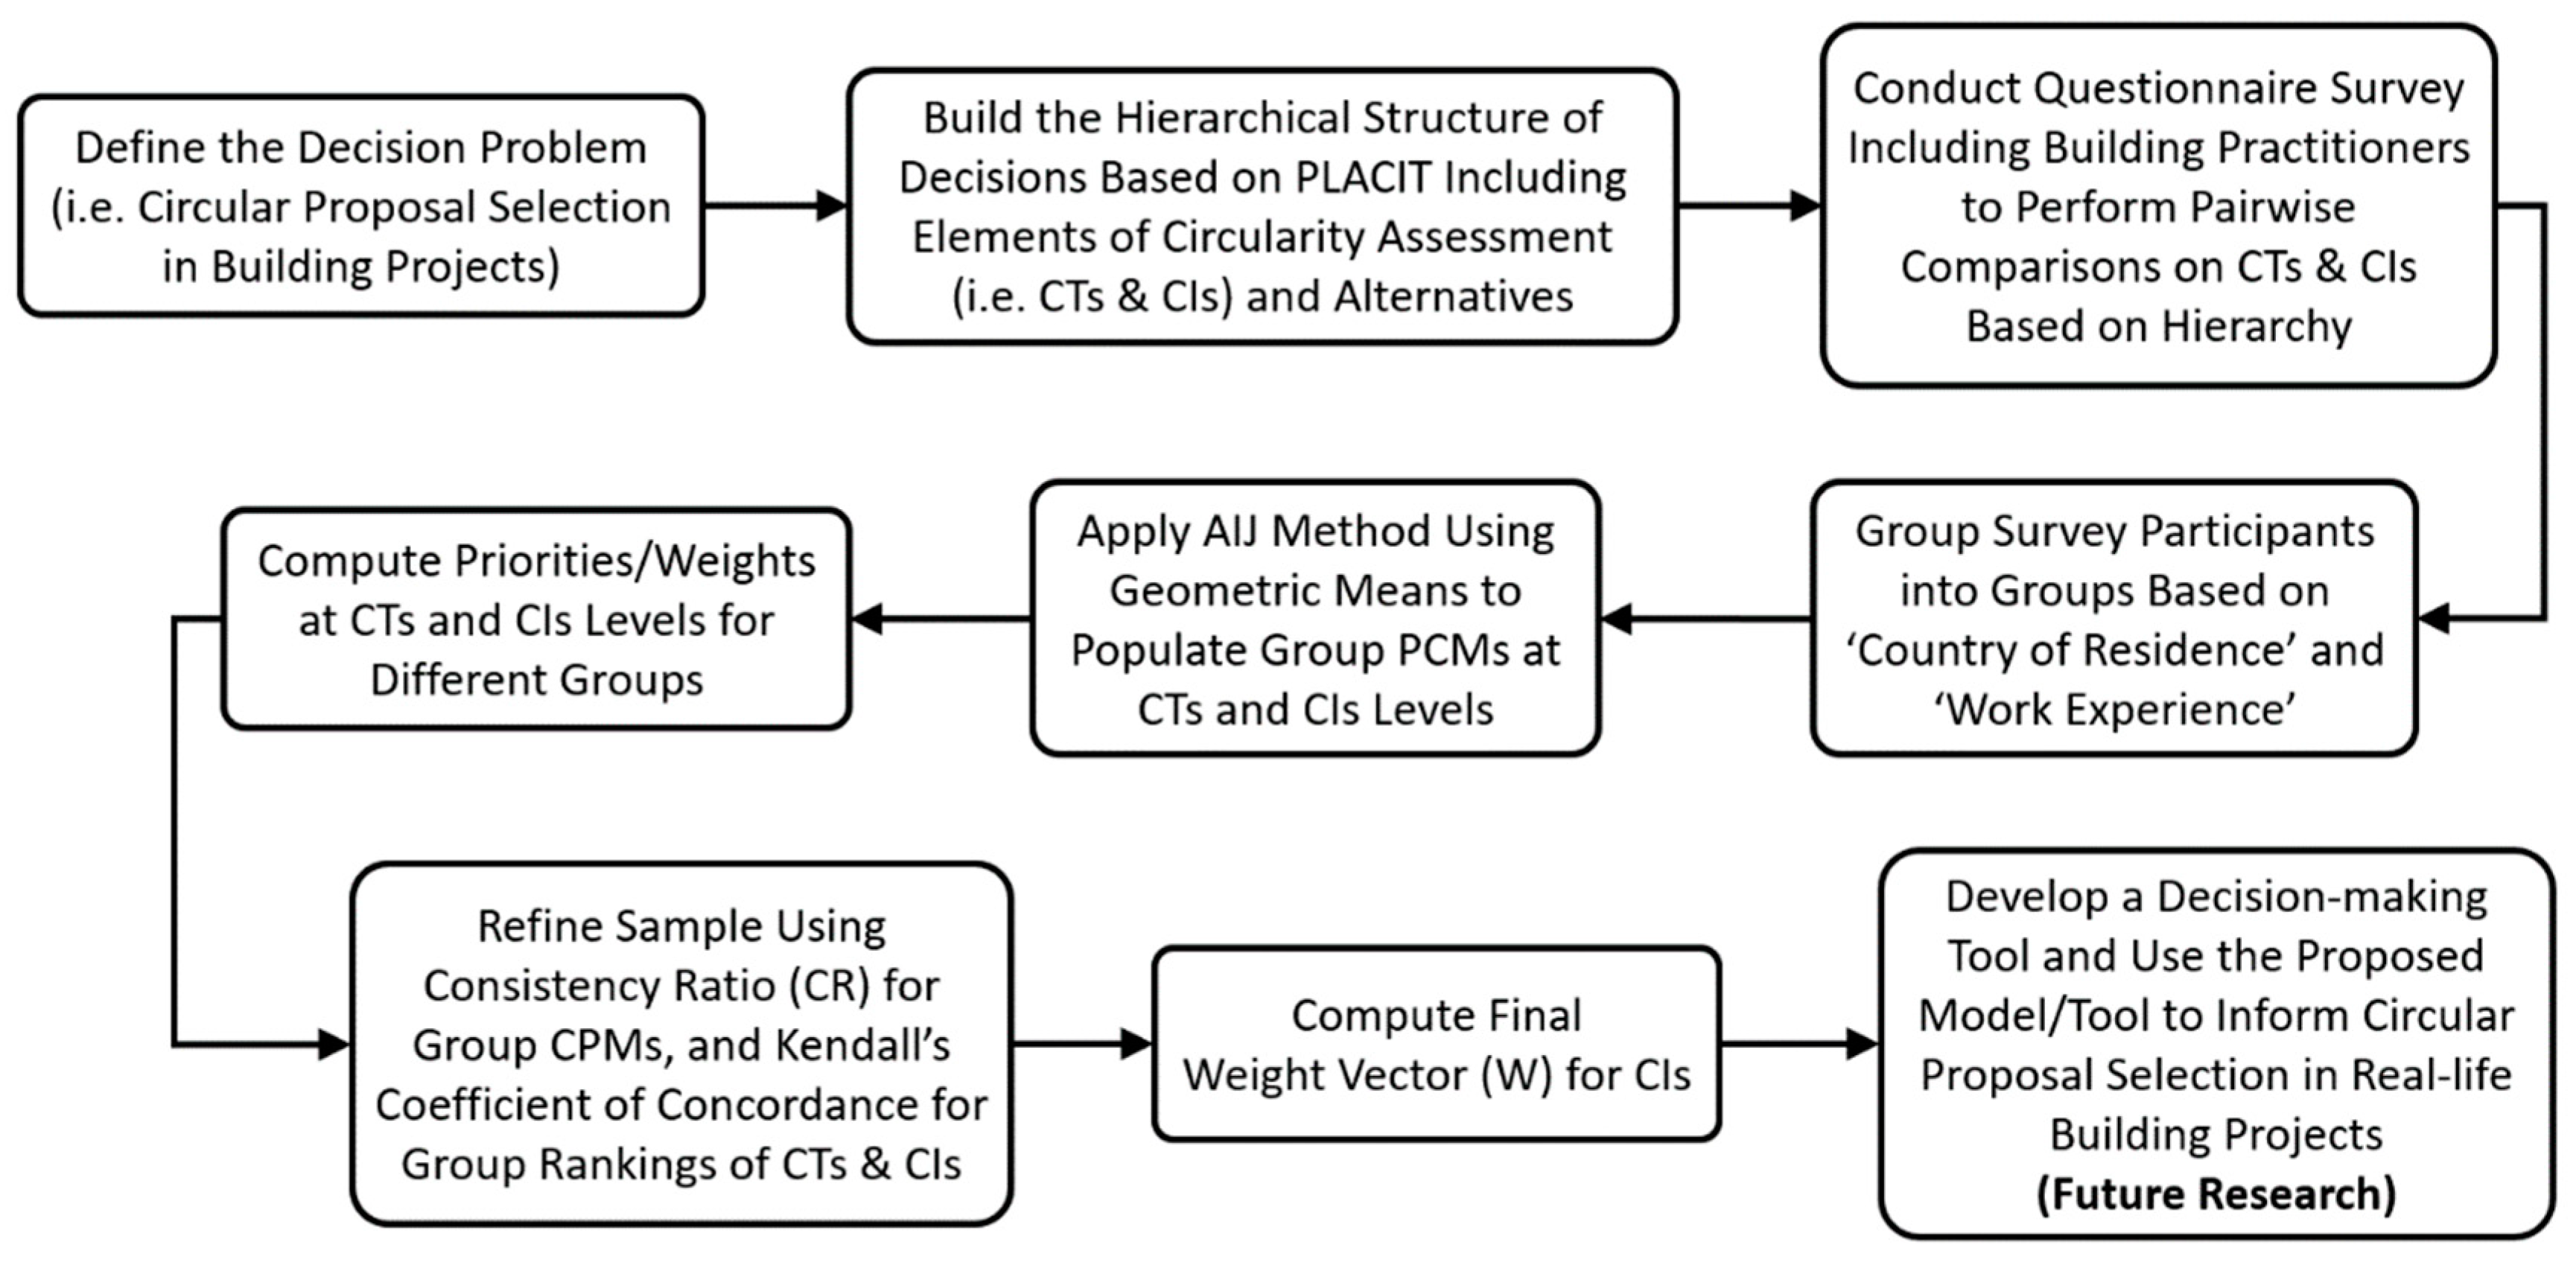
2. Materials and Methods
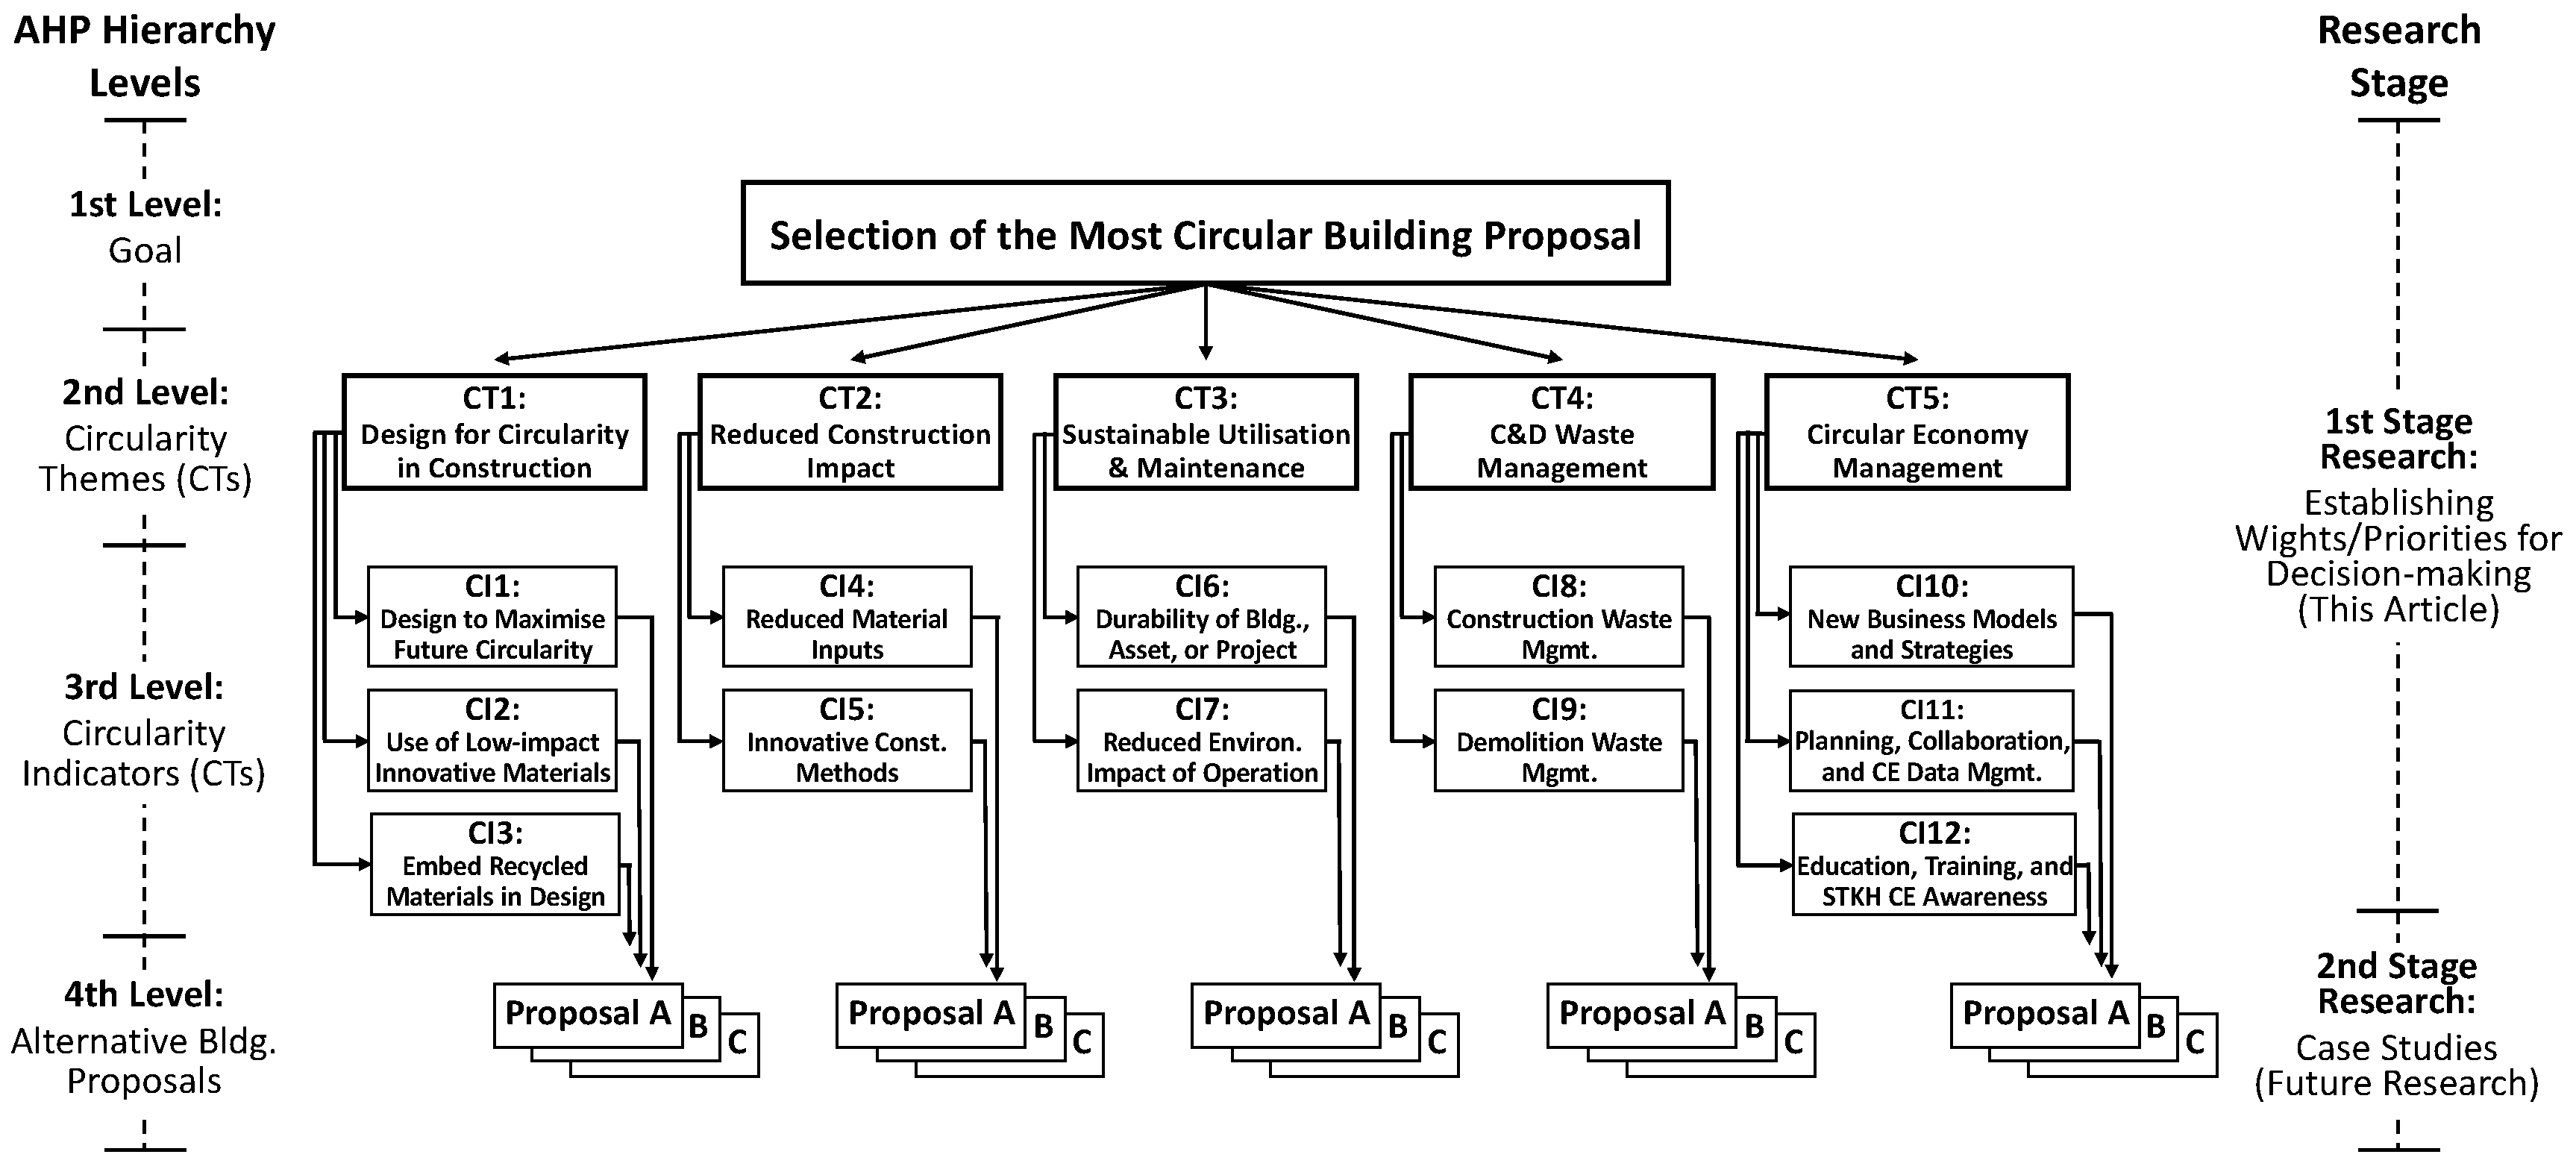
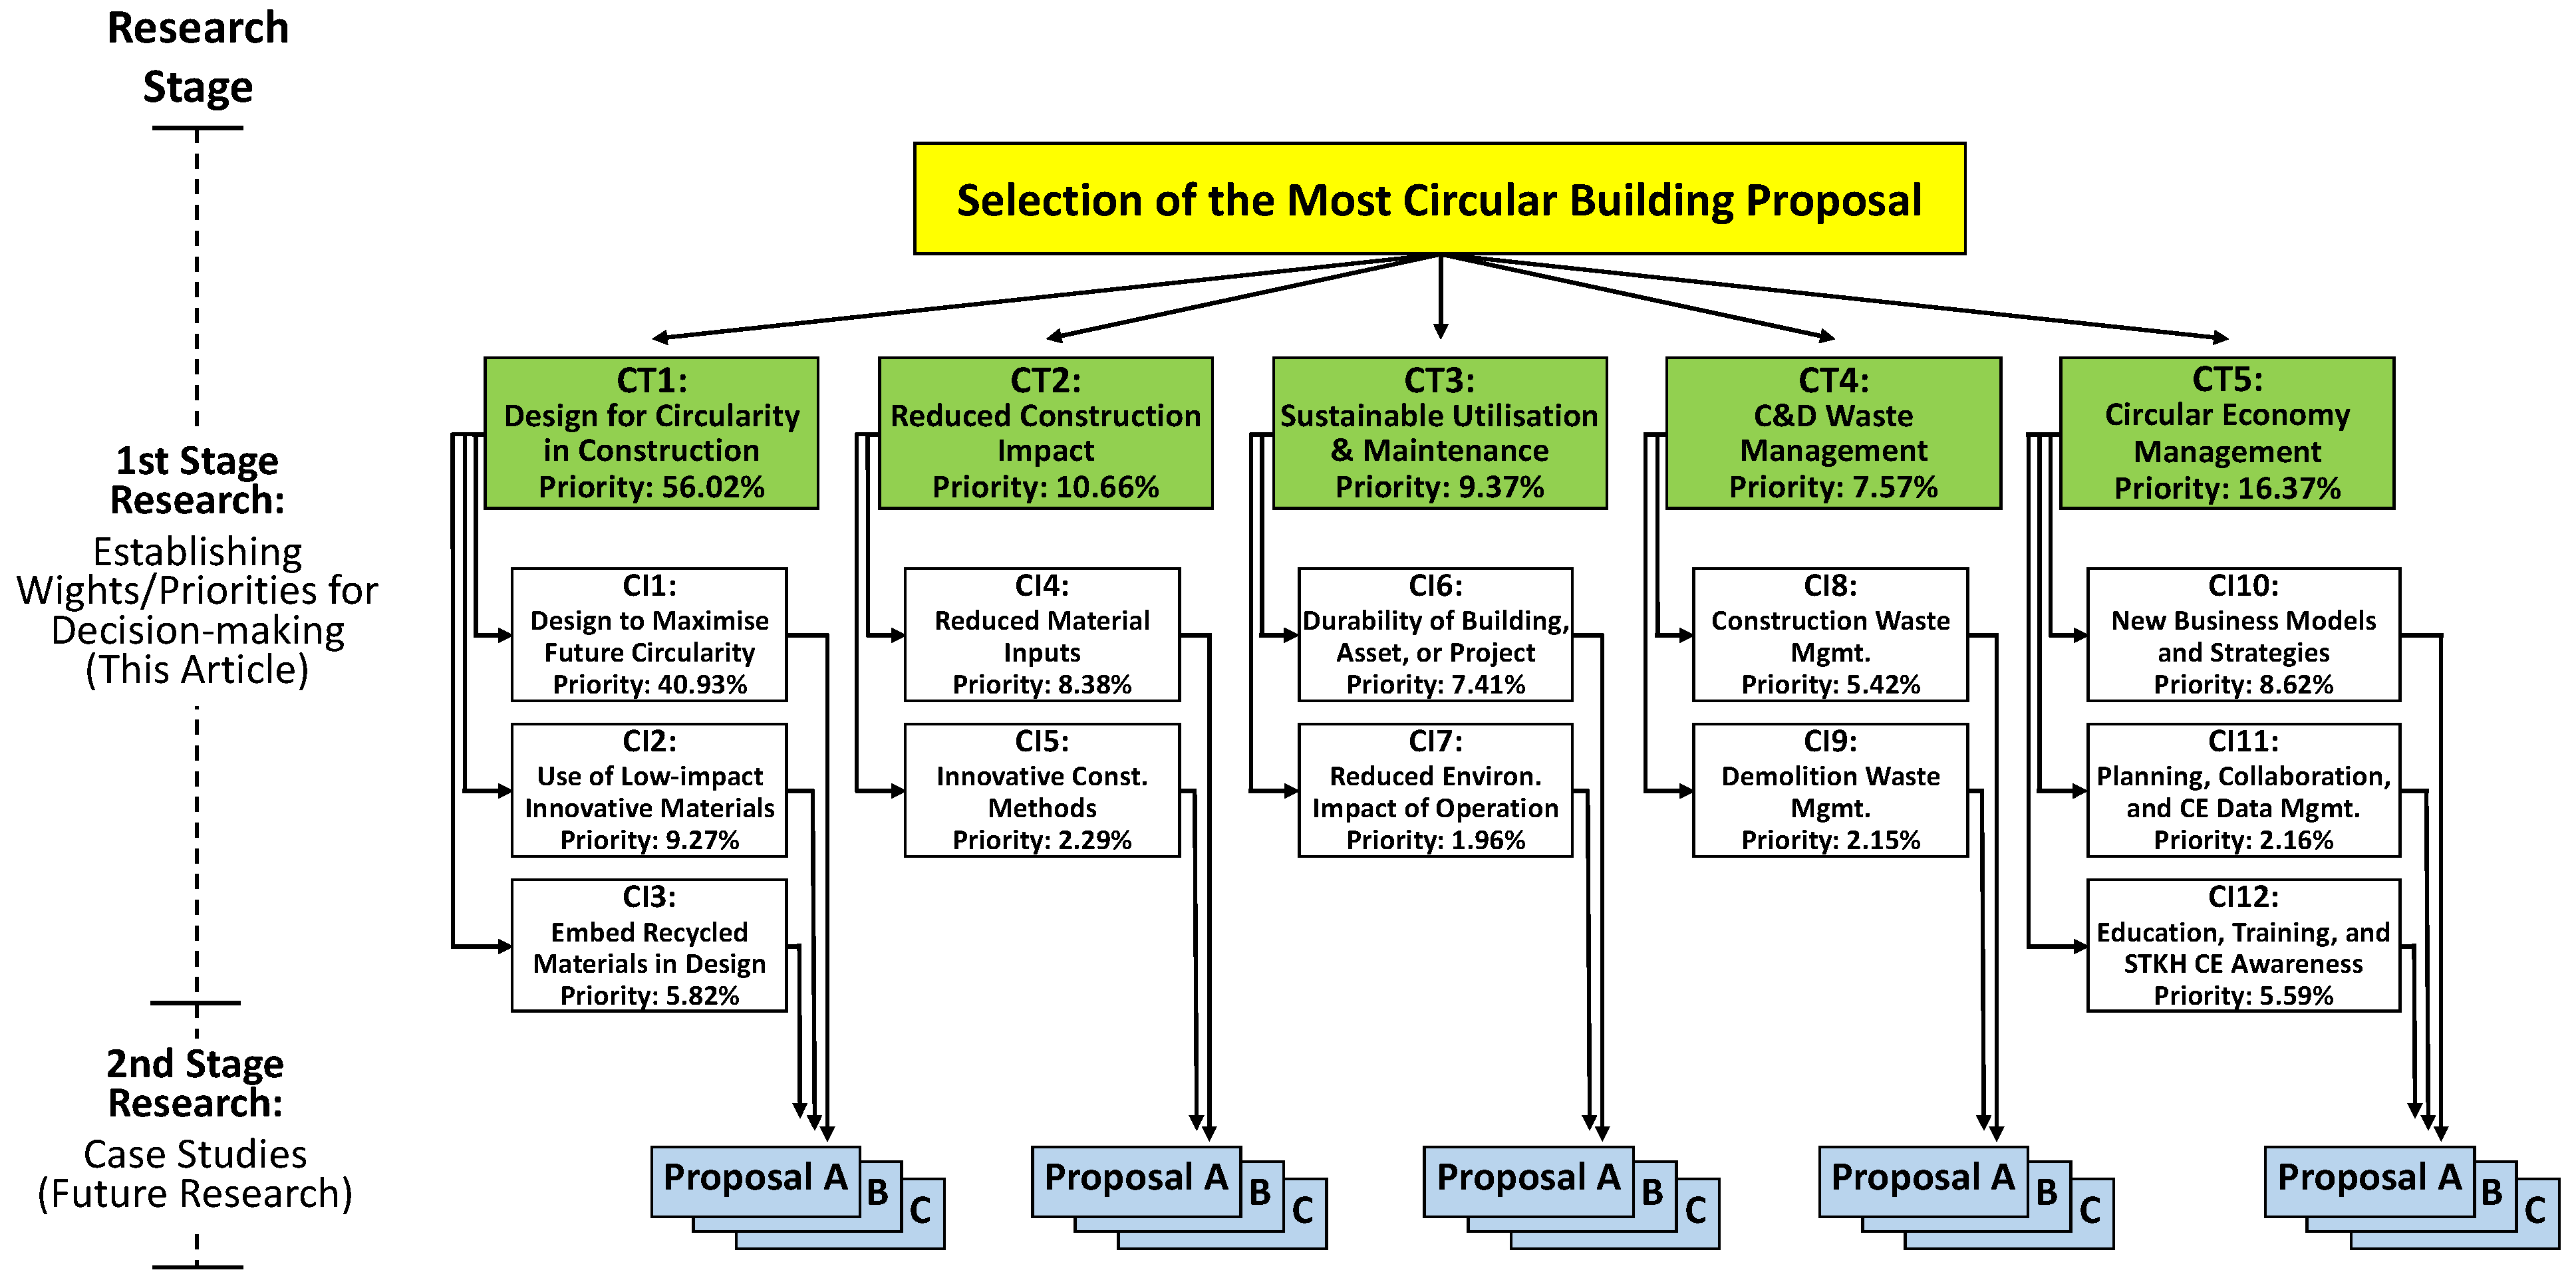
2.1. Description of the Proposed AHP Model

| n | 1 | 2 | 3 | 4 | 5 | 6 | 7 | 8 |
|---|---|---|---|---|---|---|---|---|
| RI | 0 | 0 | 0.58 | 0.9 | 1.12 | 1.24 | 1.32 | 1.41 |
2.2. Data Collection and Analysis: The Questionnaire Survey
| Kendall’s-Tau Value Range | Interpretation |
|---|---|
| −1 to 0 | Lack of agreement |
| 0 to 0.20 | Poor agreement |
| 0.21 to 0.40 | Fair agreement |
| 0.41 to 0.60 | Moderate agreement |
| 0.61 to 0.80 | Good agreement |
| 0.81 to 1 | Strong agreement |
3. Results
3.1. Establishing Priorities for Circularity Assessment
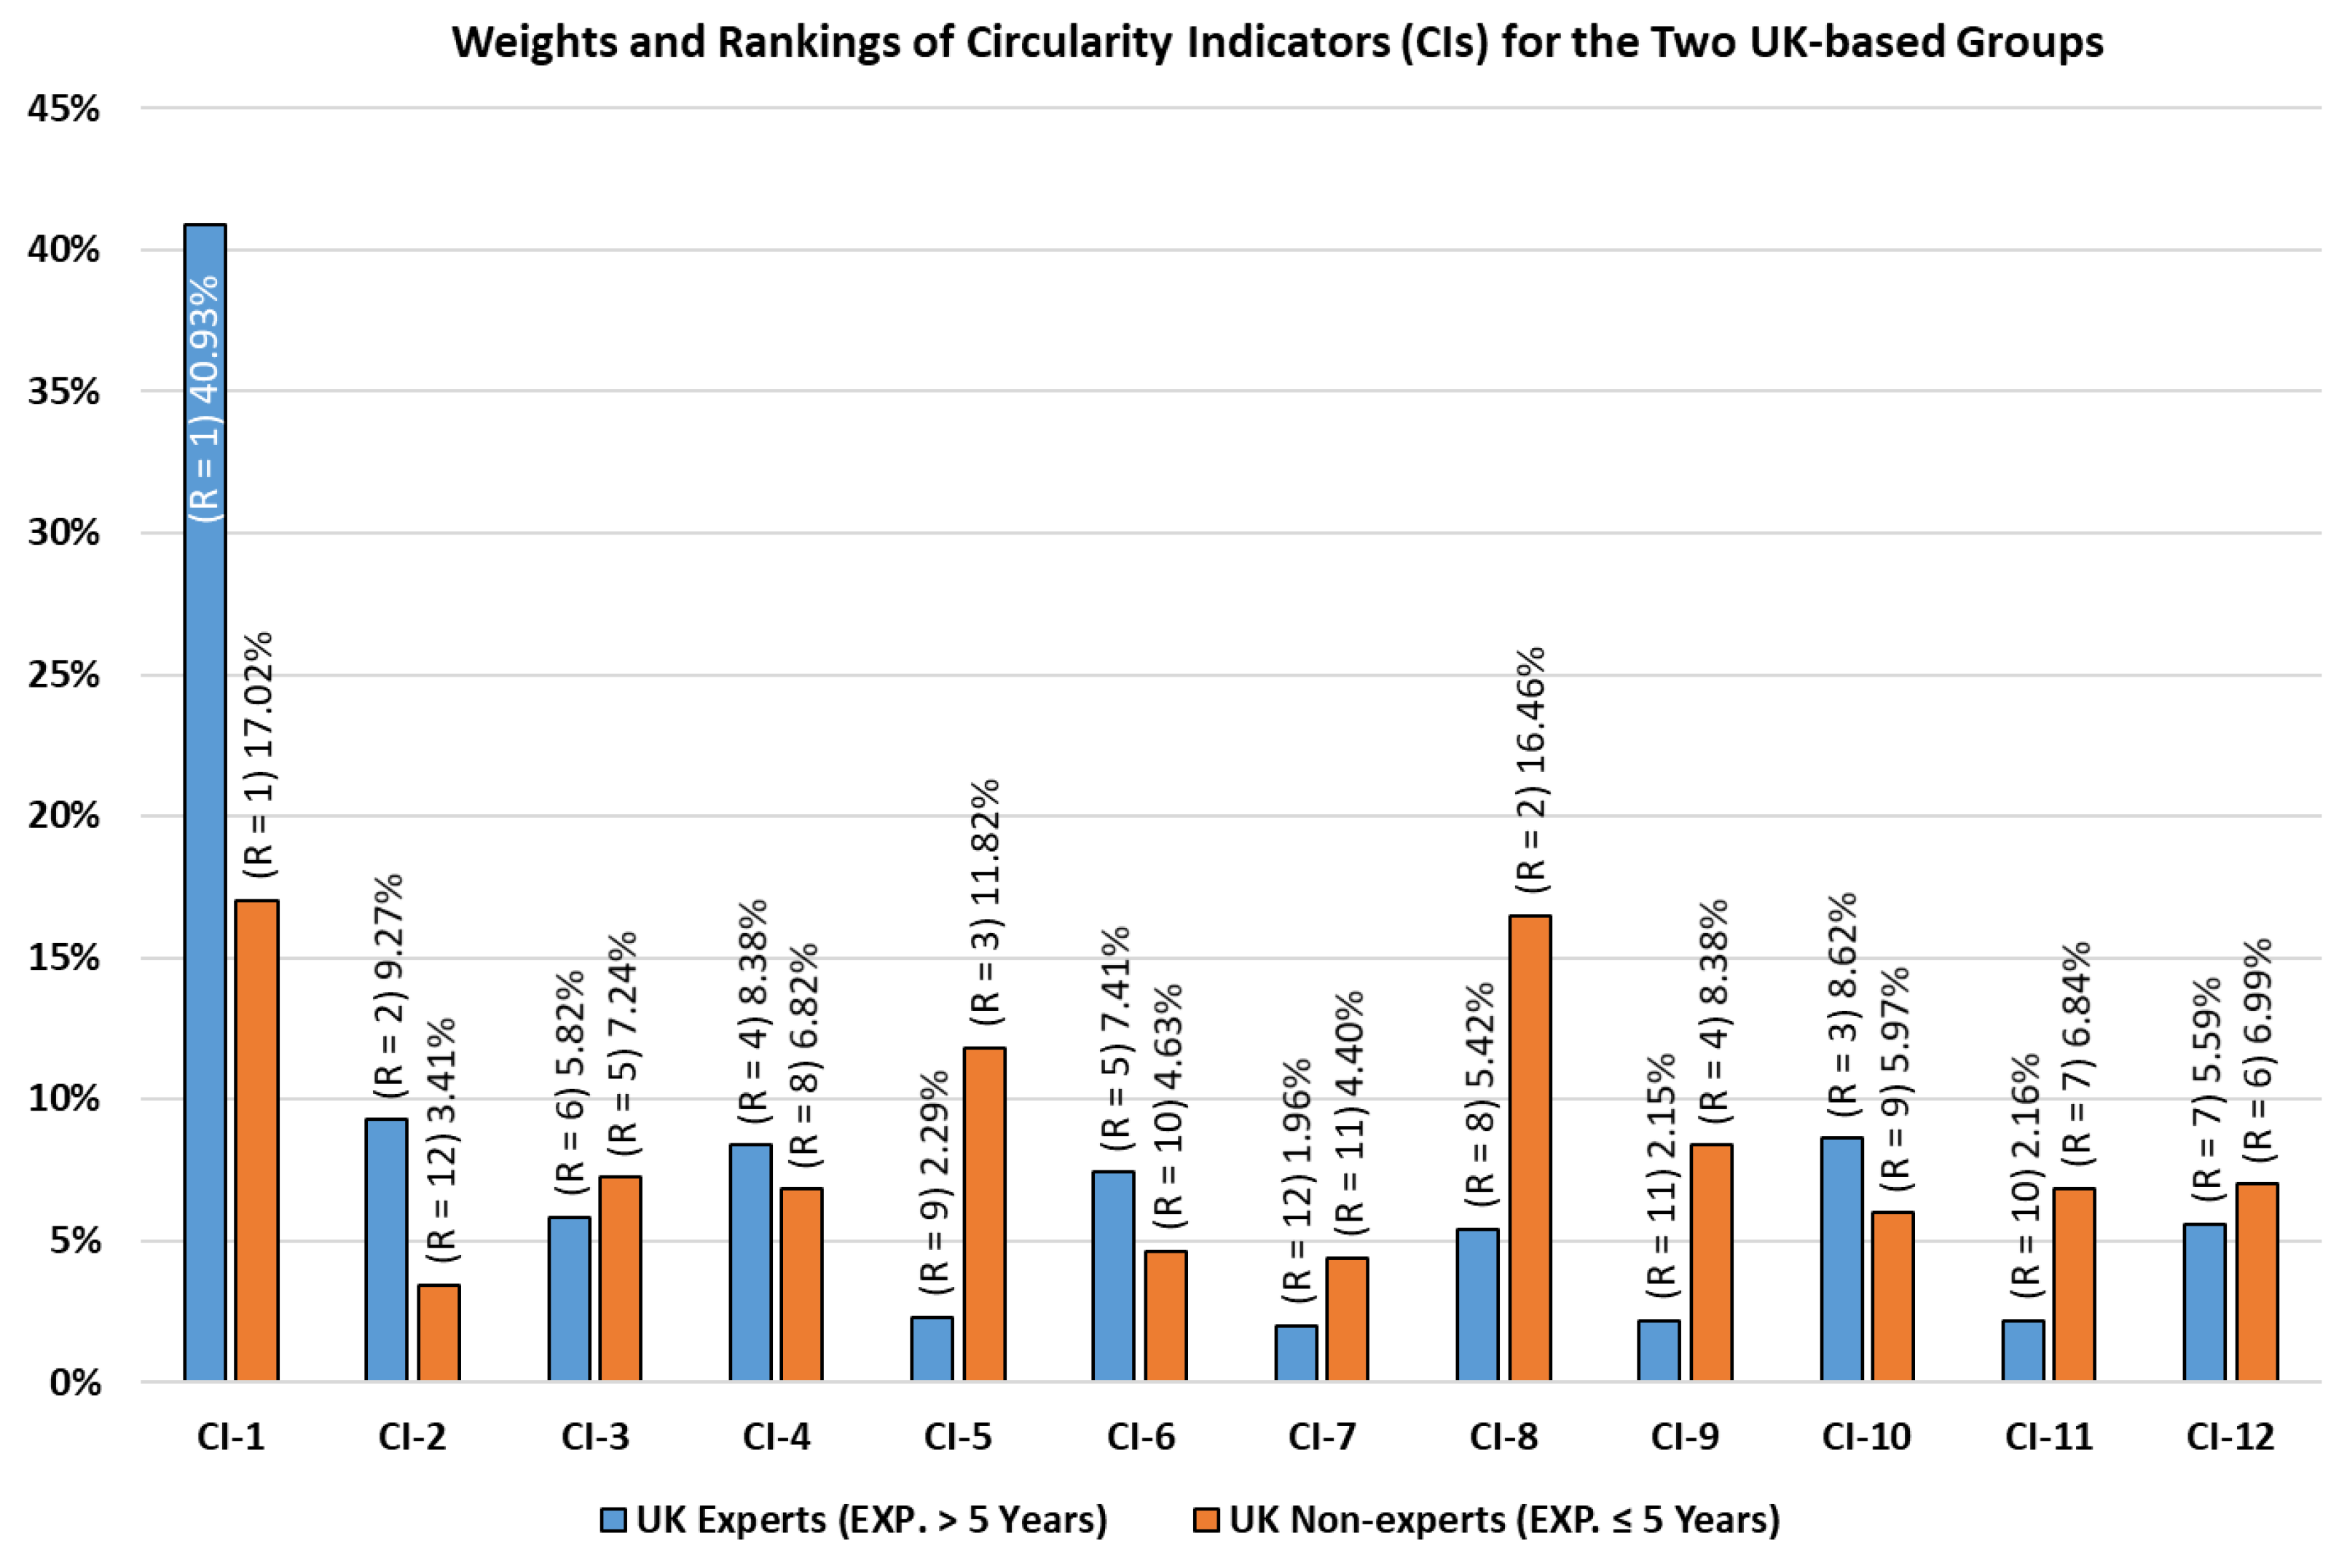
3.2. Influence of Work Experience on Priorities of CA
4. Discussion
4.1. Setting Priorities to Complete the Transition to CE
4.2. Theoretical Contribution
4.3. Practical Contribution
5. Conclusions
Author Contributions
Funding
Institutional Review Board Statement
Informed Consent Statement
Data Availability Statement
Acknowledgments
Conflicts of Interest
References
- Karmakar, A.; Delhi, V.S.K. Construction 4.0: What We Know and Where We Are Headed. J. Inf. Technol. Constr. 2021, 26, 526–545. [Google Scholar] [CrossRef]
- Torgautov, B.; Zhanabayev, A.; Tleuken, A.; Turkyilmaz, A.; Mustafa, M.; Karaca, F. Circular Economy: Challenges and Opportunities in the Construction Sector of Kazakhstan. Buildings 2021, 11, 501. [Google Scholar] [CrossRef]
- European Commission. Level(s): Taking Action on the TOTAL Impact of the Construction Sector. Available online: https://ec.europa.eu/environment/eussd/pdf/LEVEL(S)%20CONFERENCE%20REPORT.pdf (accessed on 17 December 2021).
- Lopes, M.; Flavell, R. Project Appraisal—A Framework to Assess Non-Financial Aspects of Projects during the Project Life Cycle. Int. J. Proj. Manag. 1998, 16, 223–233. [Google Scholar] [CrossRef]
- Akalu, M.M. Re-Examining Project Appraisal and Control: Developing a Focus on Wealth Creation. Int. J. Proj. Manag. 2001, 19, 375–383. [Google Scholar] [CrossRef]
- Rogers, M.; Duffy, A. Engineering Project Appraisal; John Wiley & Sons: Hoboken, NJ, USA, 2012. [Google Scholar]
- Green, S.D.; Sergeeva, N. The Contested Privileging of Zero Carbon: Plausibility, Persuasiveness and Professionalism. Build. Cities 2020, 1, 491–503. [Google Scholar] [CrossRef]
- Cambier, C.; Galle, W.; De Temmerman, N. Research and Development Directions for Design Support Tools for Circular Building. Buildings 2020, 10, 142. [Google Scholar] [CrossRef]
- Geraedts, R.; van der Voordt, T.; Remøy, H. Conversion Potential Assessment Tool. In Building Urban Resilience through Change of Use; Wilkinson, S.J., Remøy, H., Eds.; John Wiley & Sons, Ltd.: Chichester, UK, 2018; pp. 121–151. [Google Scholar]
- Patel, H.; Green, S.D. Beyond the Performance Gap: Reclaiming Building Appraisal through Archival Research. Build. Res. Inf. 2020, 48, 469–484. [Google Scholar] [CrossRef]
- Foster, G. Circular Economy Strategies for Adaptive Reuse of Cultural Heritage Buildings to Reduce Environmental Impacts. Resour. Conserv. Recycl. 2020, 152, 104507. [Google Scholar] [CrossRef]
- Hossain, M.U.; Ng, S.T.; Antwi-Afari, P.; Amor, B. Circular Economy and the Construction Industry: Existing Trends, Challenges and Prospective Framework for Sustainable Construction. Renew. Sustain. Energy Rev. 2020, 130, 109948. [Google Scholar] [CrossRef]
- Núñez-Cacho Utrilla, P.; Górecki, J.; Maqueira, J.M. Simulation-Based Management of Construction Companies under the Circular Economy Concept—Case Study. Buildings 2020, 10, 94. [Google Scholar] [CrossRef]
- EMF (Ellen MacArthur Foundation) towards the Circular Economy: Economic and Business Rationale for an Accelerated Transition. Available online: https://www.werktrends.nl/app/uploads/2015/06/Rapport_McKinsey-Towards_A_Circular_Economy.pdf (accessed on 30 August 2021).
- Barreiro-Gen, M.; Lozano, R. How Circular Is the Circular Economy? Analysing the Implementation of Circular Economy in Organisations. Bus. Strategy Environ. 2020, 29, 3484–3494. [Google Scholar] [CrossRef]
- EMF (Ellen MacArthur Foundation). Circularity Indicators: An Approach to Measuring Circularity (Project Overview). Available online: https://emf.thirdlight.com/link/yybss1obhtdv-ub419h/@/preview/1?o (accessed on 1 May 2022).
- Harris, S.; Martin, M.; Diener, D. Circularity for Circularity’s Sake? Scoping Review of Assessment Methods for Environmental Performance in the Circular Economy. Sustain. Prod. Consum. 2021, 26, 172–186. [Google Scholar] [CrossRef]
- Van Ewijk, S.; Park, J.Y.; Chertow, M.R. Quantifying the System-Wide Recovery Potential of Waste in the Global Paper Life Cycle. Resour. Conserv. Recycl. 2018, 134, 48–60. [Google Scholar] [CrossRef]
- Kristensen, H.S.; Mosgaard, M.A. A Review of Micro Level Indicators for a Circular Economy—Moving Away from the Three Dimensions of Sustainability? J. Clean. Prod. 2020, 243, 118531. [Google Scholar] [CrossRef]
- De Pascale, A.; Arbolino, R.; Szopik-Depczyńska, K.; Limosani, M.; Ioppolo, G. A Systematic Review for Measuring Circular Economy: The 61 Indicators. J. Clean. Prod. 2021, 281, 124942. [Google Scholar] [CrossRef]
- Sanchez, B.; Haas, C. Capital Project Planning for a Circular Economy. Constr. Manag. Econ. 2018, 36, 303–312. [Google Scholar] [CrossRef]
- Abadi, M.; Sammuneh, M.A. Integrating Circular Economy and Constructability Research: An Initial Development of a Lifecycle “Circularity” Assessment Framework and Indicators. In Proceedings of the 36th Annual ARCOM Conference, Glascow, UK, 7–8 September 2020; pp. 516–525. [Google Scholar]
- Abadi, M.; Moore, D.R.; Sammuneh, M.A. A Framework of Indicators to Measure Project Circularity in Construction Circular Economy. Proc. Inst. Civ. Eng.-Manag. Procure. Law 2022, 175, 54–66. [Google Scholar] [CrossRef]
- Tokazhanov, G.; Galiyev, O.; Lukyanenko, A.; Nauyryzbay, A.; Ismagulov, R.; Durdyev, S.; Turkyilmaz, A.; Karaca, F. Circularity Assessment Tool Development for Construction Projects in Emerging Economies. J. Clean. Prod. 2022, 362, 132293. [Google Scholar] [CrossRef]
- EMF (Ellen McArthur Foundation). Circularity in the Built Environment: Case Studies. Available online: https://emf.thirdlight.com/link/bpso50t2ia56-9bw2n5/@/preview/1?o (accessed on 1 May 2022).
- UKGBC (The UK Green Building Council). Circular Economy Guidance for Construction Clients. Available online: https://www.ukgbc.org/ (accessed on 1 May 2022).
- Ghisellini, P.; Cialani, C.; Ulgiati, S. A Review on Circular Economy: The Expected Transition to a Balanced Interplay of Environmental and Economic Systems. J. Clean. Prod. 2016, 114, 11–32. [Google Scholar] [CrossRef]
- Kirchherr, J.; Reike, D.; Hekkert, M. Conceptualizing the Circular Economy: An Analysis of 114 Definitions. Resour. Conserv. Recycl. 2017, 127, 221–232. [Google Scholar] [CrossRef]
- Suárez-Eiroa, B.; Fernández, E.; Méndez-Martínez, G.; Soto-Oñate, D. Operational Principles of Circular Economy for Sustainable Development: Linking Theory and Practice. J. Clean. Prod. 2019, 214, 952–961. [Google Scholar] [CrossRef]
- Pomponi, F.; Moncaster, A. Circular Economy for the Built Environment: A Research Framework. J. Clean. Prod. 2017, 143, 710–718. [Google Scholar] [CrossRef] [Green Version]
- Korhonen, J.; Honkasalo, A.; Seppälä, J. Circular Economy: The Concept and Its Limitations. Ecol. Econ. 2018, 143, 37–46. [Google Scholar] [CrossRef]
- Sauvé, S.; Bernard, S.; Sloan, P. Environmental Sciences, Sustainable Development and Circular Economy: Alternative Concepts for Trans-Disciplinary Research. Environ. Dev. 2016, 17, 48–56. [Google Scholar] [CrossRef] [Green Version]
- De los Rios, I.C.; Charnley, F.J.S. Skills and Capabilities for a Sustainable and Circular Economy: The Changing Role of Design. J. Clean. Prod. 2017, 160, 109–122. [Google Scholar] [CrossRef]
- Preston, F. A Global Redesign? Shaping the Circular Economy. Available online: https://www.chathamhouse.org/2012/03/global-redesign-shaping-circular-economy (accessed on 1 May 2022).
- European Environment Agency. Circular Economy in Europe: Developing the Knowledge Base. Available online: https://www.eea.europa.eu/publications/circular-economy-in-europe (accessed on 1 May 2022).
- Elia, V.; Gnoni, M.G.; Tornese, F. Measuring Circular Economy Strategies through Index Methods: A Critical Analysis. J. Clean. Prod. 2017, 142, 2741–2751. [Google Scholar] [CrossRef]
- Su, B.; Heshmati, A.; Geng, Y.; Yu, X. A Review of the Circular Economy in China: Moving from Rhetoric to Implementation. J. Clean. Prod. 2013, 42, 215–227. [Google Scholar] [CrossRef]
- Camacho-Otero, J.; Ordoñez, I. Circularity Assessment in Companies: Conceptual Elements for Developing Assessment Tools. In Proceedings of the the 23rd International Sustainable Development Research Society Conference, Bogota, Colombia, 14–16 June 2017; pp. 14–16. [Google Scholar]
- Bonacorsi, L. Measuring Circularity: A Critical Analysis of Some Relevant Indicators. Available online: https://papers.ssrn.com/sol3/papers.cfm?abstract_id=3741953 (accessed on 1 May 2022).
- Zhang, N.; Han, Q.; de Vries, B. Building Circularity Assessment in the Architecture, Engineering, and Construction Industry: A New Framework. Sustainability 2021, 13, 12466. [Google Scholar] [CrossRef]
- Kubbinga, B.; Bamberger, M.; van Noort, E.; van den Reek, D.; Blok, M.; Roemers, G.; Hoek, J.; Faes, K. A Framework for Circular Buildings—Indicators for Possible Inclusion in BREEAM. Available online: https://www.circle-economy.com/resources/a-framework-for-circular-buildings (accessed on 16 July 2022).
- De Oliveira, C.T.; Dantas, T.E.T.; Soares, S.R. Nano and Micro Level Circular Economy Indicators: Assisting Decision-Makers in Circularity Assessments. Sustain. Prod. Consum. 2021, 26, 455–468. [Google Scholar] [CrossRef]
- Antonini, E.; Boeri, A.; Lauria, M.; Giglio, F. Reversibility and Durability as Potential Indicators for Circular Building Technologies. Sustainability 2020, 12, 7659. [Google Scholar] [CrossRef]
- Hamida, M.B.; Jylhä, T.; Remøy, H.; Gruis, V. Circular Building Adaptability and Its Determinants—A Literature Review. Int. J. Build. Pathol. Adapt. 2022, 1–23. [Google Scholar] [CrossRef]
- Sagan, J.; Sobotka, A. Analysis of Factors Affecting the Circularity of Building Materials. Materials 2021, 14, 7296. [Google Scholar] [CrossRef] [PubMed]
- Cottafava, D.; Ritzen, M. Circularity Indicator for Residential Buildings: Addressing the Gap between Embodied Impacts and Design Aspects. Resour. Conserv. Recycl. 2021, 164, 105120. [Google Scholar] [CrossRef]
- Zimmermann, R.K.; Kanafani, K.; Rasmussen, F.N.; Andersen, C.; Birgisdóttir, H. LCA-Framework to Evaluate Circular Economy Strategies in Existing Buildings. IOP Conf. Ser. Earth Environ. Sci. 2020, 588, 042044. [Google Scholar] [CrossRef]
- Gravagnuolo, A.; Angrisano, M.; Nativo, M. Evaluation of Environmental Impacts of Historic Buildings Conservation through Life Cycle Assessment in a Circular Economy Perspective. Aestimum 2021, 241–272. [Google Scholar] [CrossRef]
- Khadim, N.; Agliata, R.; Marino, A.; Thaheem, M.J.; Mollo, L. Critical Review of Nano and Micro-Level Building Circularity Indicators and Frameworks. J. Clean. Prod. 2022, 357, 131859. [Google Scholar] [CrossRef]
- Sawhney, A.; Riley, M.; Irizarry, J. Construction 4.0: An Innovation Platform for the Built Environment; Routledge: Oxfordshire, UK, 2020. [Google Scholar]
- Tsolakis, N.; Harrington, T.S.; Srai, J.S. Digital Supply Network Design: A Circular Economy 4.0 Decision-Making System for Real-World Challenges. Prod. Plan. Control 2021, 1–26. [Google Scholar] [CrossRef]
- Durmisevic, E.; Guerriero, A.; Boje, C.; Domange, B.; Bosch, G. Development of a Conceptual Digital Deconstruction Platform with Integrated Reversible BIM to Aid Decision Making and Facilitate a Circular Economy. In Proceedings of the the Joint Conference CIB W78-LDAC, Luxembourg, 11–15 October 2021; Volume 2021, pp. 11–15. [Google Scholar]
- Balwada, J.; Samaiya, S.; Mishra, R.P. Packaging Plastic Waste Management for a Circular Economy and Identifying a Better Waste Collection System Using Analytical Hierarchy Process (AHP). Procedia CIRP 1990, 98, 270–275. [Google Scholar]
- Han, Y.; Wang, Z.; Lu, X.; Hu, B. Application of AHP to Road Selection. ISPRS Int. J. Geo-Inf. 2020, 9, 86. [Google Scholar] [CrossRef] [Green Version]
- Li, H.; Ni, F.; Dong, Q.; Zhu, Y. Application of Analytic Hierarchy Process in Network Level Pavement Maintenance Decision-Making. Int. J. Pavement Res. Technol. 2018, 11, 345–354. [Google Scholar] [CrossRef]
- Duleba, S.; Moslem, S. Examining Pareto Optimality in Analytic Hierarchy Process on Real Data: An Application in Public Transport Service Development. Expert Syst. Appl. 2019, 116, 21–30. [Google Scholar] [CrossRef]
- Moeinaddini, M.; Khorasani, N.; Danehkar, A.; Darvishsefat, A.A.; Zienalyan, M. Siting MSW Landfill Using Weighted Linear Combination and Analytical Hierarchy Process (AHP) Methodology in GIS Environment (Case Study: Karaj). Waste Manag. 2010, 30, 912–920. [Google Scholar] [CrossRef] [PubMed]
- Mayhoub, M.; El Sayad, Z.; Ali, A.; Ibrahim, M. Assessment of Green Building Materials’ Attributes to Achieve Sustainable Building Façades Using AHP. Buildings 2021, 11, 474. [Google Scholar] [CrossRef]
- Darko, A.; Chan, A.P.C.; Ameyaw, E.E.; Owusu, E.K.; Pärn, E.; Edwards, D.J. Review of Application of Analytic Hierarchy Process (AHP) in Construction. Int. J. Constr. Manag. 2019, 19, 436–452. [Google Scholar] [CrossRef]
- Waris, M.; Panigrahi, S.; Mengal, A.; Soomro, M.I.; Mirjat, N.H.; Ullah, M.; Azlan, Z.S.; Khan, A. An Application of Analytic Hierarchy Process (AHP) for Sustainable Procurement of Construction Equipment: Multicriteria-Based Decision Framework for Malaysia. Math. Probl. Eng. 2019, 2019, 6391431. [Google Scholar] [CrossRef]
- Cuadrado, J.; Zubizarreta, M.; Rojí, E.; García, H.; Larrauri, M. Sustainability-Related Decision Making in Industrial Buildings: An AHP Analysis. Math. Probl. Eng. 2015, 2015, 157129. [Google Scholar] [CrossRef] [Green Version]
- Al-Atesh, E.A.; Rahmawati, Y.; Zawawi, N.A.W.A.; Utomo, C. A Decision-Making Model for Supporting Selection of Green Building Materials. Int. J. Constr. Manag. 2021, 1–12. [Google Scholar] [CrossRef]
- Filho, M.V.A.P.M.; da Costa, B.B.F.; Najjar, M.; Figueiredo, K.V.; de Mendonça, M.B.; Haddad, A.N. Sustainability Assessment of a Low-Income Building: A BIM-LCSA-FAHP-Based Analysis. Buildings 2022, 12, 181. [Google Scholar] [CrossRef]
- Zoghi, M.; Rostami, G.; Motalleb, F. Material Selection in Design for Deconstruction Using Kano Model, Fuzzy-AHP and TOPSIS Methodology. Available online: https://journals.sagepub.com/doi/abs/10.1177/0734242X211013904 (accessed on 18 October 2021).
- Díaz-López, C.; Carpio, M.; Martín-Morales, M.; Zamorano, M. Defining Strategies to Adopt Level(s) for Bringing Buildings into the Circular Economy. A Case Study of Spain. J. Clean. Prod. 2021, 287, 125048. [Google Scholar] [CrossRef]
- Kumar, P.; Singh, R.K.; Kumar, V. Managing Supply Chains for Sustainable Operations in the Era of Industry 4.0 and Circular Economy: Analysis of Barriers. Resour. Conserv. Recycl. 2021, 164, 105215. [Google Scholar] [CrossRef]
- Duleba, S.; Moslem, S. Sustainable Urban Transport Development with Stakeholder Participation, an AHP-Kendall Model: A Case Study for Mersin. Sustainability 2018, 10, 3647. [Google Scholar] [CrossRef] [Green Version]
- Saaty, T.L.; Vargas, L.G. Models, Methods, Concepts & Applications of the Analytic Hierarchy Process, 2nd ed.; Springer: New York, NY, USA, 2012. [Google Scholar]
- Saaty, T.L. Multicriteria Decision Making: The Analytic Hierarchy Process; McGraw-Hill: New York, NY, USA, 1980. [Google Scholar]
- Forman, E.; Peniwati, K. Aggregating Individual Judgments and Priorities with the Analytic Hierarchy Process. Eur. J. Oper. Res. 1998, 108, 165–169. [Google Scholar] [CrossRef]
- Escobar, M.T.; Aguarón, J.; Moreno-Jiménez, J.M. A Note on AHP Group Consistency for the Row Geometric Mean Priorization Procedure. Eur. J. Oper. Res. 2004, 153, 318–322. [Google Scholar] [CrossRef]
- Saaty, T.L. Decision Making with the Analytic Hierarchy Process. Int. J. Serv. Sci. 2008, 1, 83–98. [Google Scholar] [CrossRef] [Green Version]
- Aczél, J.; Saaty, T.L. Procedures for Synthesizing Ratio Judgements. J. Math. Psychol. 1983, 27, 93–102. [Google Scholar] [CrossRef]
- Ghorbanzadeh, O.; Moslem, S.; Blaschke, T.; Duleba, S. Sustainable Urban Transport Planning Considering Different Stakeholder Groups by an Interval-AHP Decision Support Model. Sustainability 2018, 11, 9. [Google Scholar] [CrossRef] [Green Version]
- Barzilai, J.; Cook, W.D.; Golany, B. Consistent Weights for Judgements Matrices of the Relative Importance of Alternatives. Oper. Res. Lett. 1987, 6, 131–134. [Google Scholar] [CrossRef]
- Krejčí, J.; Stoklasa, J. Aggregation in the Analytic Hierarchy Process: Why Weighted Geometric Mean Should Be Used Instead of Weighted Arithmetic Mean. Expert Syst. Appl. 2018, 114, 97–106. [Google Scholar] [CrossRef]
- Doloi, H. Application of AHP in Improving Construction Productivity from a Management Perspective. Constr. Manag. Econ. 2008, 26, 841–854. [Google Scholar] [CrossRef]
- Kim, S.-Y.; Nguyen, V.T. An AHP Framework for Evaluating Construction Supply Chain Relationships. KSCE J. Civ. Eng. 2018, 22, 1544–1556. [Google Scholar] [CrossRef]
- Stewart, T. A Critical Survey on the Status of Multiple Criteria Decision Making Theory and Practice. Omega 1992, 20, 569–586. [Google Scholar] [CrossRef]
- Cheng, E.W.L.; Li, H. Construction Partnering Process and Associated Critical Success Factors: Quantitative Investigation. J. Manag. Eng. 2002, 18, 194–202. [Google Scholar] [CrossRef]
- Saaty, T.L. A Scaling Method for Priorities in Hierarchical Structures. J. Math. Psychol. 1977, 15, 234–281. [Google Scholar] [CrossRef]
- Saunders, M.; Lewis, P.; Thornhill, A. Research Methods for Business Student; Pearson Education Limited: London, UK, 2007. [Google Scholar]
- Croux, C.; Dehon, C. Influence Functions of the Spearman and Kendall Correlation Measures. Stat. Methods Appl. 2010, 19, 497–515. [Google Scholar] [CrossRef] [Green Version]
- Solomon, M. Groupthink versus The Wisdom of Crowds: The Social Epistemology of Deliberation and Dissent. South. J. Philos. 2006, 44, 28–42. [Google Scholar] [CrossRef]
- Abubakar, A.M.; Elrehail, H.; Alatailat, M.A.; Elçi, A. Knowledge Management, Decision-Making Style and Organizational Performance. J. Innov. Knowl. 2019, 4, 104–114. [Google Scholar] [CrossRef]
- Eberhardt, L.C.M.; van Stijn, A.; Nygaard Rasmussen, F.; Birkved, M.; Birgisdottir, H. Development of a Life Cycle Assessment Allocation Approach for Circular Economy in the Built Environment. Sustainability 2020, 12, 9579. [Google Scholar] [CrossRef]


| Criticism | Description |
|---|---|
| Criticism 1 | CE literature and related practices tend to have narrower objectives and engage with conceptual discussions about individual CE concepts [27,28,29]. |
| Criticism 2 | The construction CE literature lacks a holistic framework for systematic assessment of ‘circularity’ throughout different project/product lifecycles [30,31]. |
| Criticism 3 | This situation does not allow for the granular comparison of circularity within different options being considered for a project brief and, therefore, does not facilitate decision-making, i.e., option selection [21,25,26]. |
| Criticism 4 | Existing frameworks tend to emphasise material flows rather than material reduction [32,33,34]. |
| Criticism 5 | Research mostly considers functionality at the meso level for organisations having little direct influence/engagement (through an explicit business case) with practice (micro level); minimal engagement with the operational management of circularity [35,36,37]. |
| Criticism 6 | There is a need for a more stratified approach to support multiple-criteria DM [38,39]. |
| Circularity Themes (CTs) | Circularity Indicators (CIs) |
|---|---|
| Design for Circularity in Construction (Design Stage) |
|
| Reduced Construction Impact (Construction Stage) |
|
| Sustainable Utilisation and Maintenance (Operation Stage) |
|
| C&D Waste Management (Closing Material Loops) |
|
| CE Management (Business Models, Education and Data Mgmt.) |
|
| Intensity of Importance | Definition | Explanation |
|---|---|---|
| 1 | Equal Importance | The two elements contribute equally to circularity assessment |
| 3 or 3* | Moderate Importance | An element is lightly favoured over another |
| 5 or 5* | Strong Importance | An element is strongly favoured over another |
| 7 or 7* | Demonstrated Importance | Dominance of an element is demonstrated in practice |
| 9 or 9* | Absolute Importance | Absolute dominance of an element is affirmed at the highest level |
| 2, 4, 6, 8 | Intermediate Values | Used to compromise between judgements in data analysis |
| Eigenvector (Weight Vector) | Theme 1 0.5602 | Theme 2 0.1066 | Theme 3 0.0937 | Theme 4 0.0757 | Theme 5 0.1637 | |
|---|---|---|---|---|---|---|
| Theme 1 | 0.5602 | 1.0000 | 6.0491 | 6.0832 | 4.9856 | 4.3334 |
| Theme 2 | 0.1066 | 0.1653 | 1.0000 | 2.7718 | 0.9577 | 0.4524 |
| Theme 3 | 0.0937 | 0.1644 | 0.3608 | 1.0000 | 2.6480 | 0.6639 |
| Theme 4 | 0.0757 | 0.2006 | 1.0442 | 0.3776 | 1.0000 | 0.4534 |
| Theme 5 | 0.1637 | 0.2308 | 2.2106 | 1.5063 | 2.2056 | 1.0000 |
| Code (CTi) | Non-UK (N = 13) | UK and Exp. > 5 (N = 10) | UK and Exp. ≤ 5 (N = 10) | |||
|---|---|---|---|---|---|---|
| Global Priority | Rank | Global Priority | Rank | Global Priority | Rank | |
| CT1 | 46.29% | 1 | 56.02% | 1 | 27.67% | 1 |
| CT2 | 15.69% | 3 | 10.66% | 3 | 18.64% | 4 |
| CT3 | 12.70% | 4 | 9.37% | 4 | 9.04% | 5 |
| CT4 | 9.36% | 5 | 7.57% | 5 | 24.85% | 2 |
| CT5 | 15.96% | 2 | 16.37% | 2 | 19.81% | 3 |
| λmax | 5.6176 | 5.3990 | 5.2945 | |||
| CInd | 0.1544 | 0.0997 | 0.0736 | |||
| CR | 0.1379 > 0.1 | 0.0891 < 0.1 | 0.0657 < 0.1 | |||
| CT Code | CI Code | Circularity Indicators (CIs) | UK and Exp. > 5 Years (N = 10) | UK and Exp. ≤ 5 Years (N = 10) | ||||
|---|---|---|---|---|---|---|---|---|
| Local Priority | Global Priority | Global Rank | Local Priority | Global Priority | Global Rank | |||
| CT1 | CI-1 | Design Solutions to Maximise Future Circularity | 73.05% | 40.93% | 1 | 61.52% | 17.02% | 1 |
| CI-2 | Use of Low-impact Innovative Materials | 16.55% | 9.27% | 2 | 12.32% | 3.41% | 12 | |
| CI-3 | Embed Recycled Materials in Design | 10.39% | 5.82% | 6 | 26.16% | 7.24% | 5 | |
| CT2 | CI-4 | Reduced Material Inputs | 78.56% | 8.38% | 4 | 36.57% | 6.82% | 8 |
| CI-5 | Innovative Construction Methods | 21.44% | 2.29% | 9 | 63.43% | 11.82% | 3 | |
| CT3 | CI-6 | Durability of Building, Asset or Project | 79.06% | 7.41% | 5 | 51.29% | 4.63% | 10 |
| CI-7 | Reduced Environmental Impact of Operation | 20.94% | 1.96% | 12 | 48.71% | 4.40% | 11 | |
| CT4 | CI-8 | Construction Waste Management | 71.58% | 5.42% | 8 | 66.26% | 16.46% | 2 |
| CI-9 | Demolition Waste Management | 28.42% | 2.15% | 11 | 33.74% | 8.38% | 4 | |
| CT5 | CI-10 | New Business Models and Strategies | 52.65% | 8.62% | 3 | 30.16% | 5.97% | 9 |
| CI-11 | Planning, Collaboration, and CE Data Mgmt. | 13.21% | 2.16% | 10 | 34.54% | 6.84% | 7 | |
| CI-12 | Education, Training and Stakeholder CE Awareness | 34.14% | 5.59% | 7 | 35.30% | 6.99% | 6 | |
| CT Code | ‘UK Experts’ (Exp. > 5) | ‘UK Non-Experts’ (Exp. ≤ 5) | nc | nd |
|---|---|---|---|---|
| CT1 | 1 | 1 | 4 | 0 |
| CT5 | 2 | 3 | 2 | 1 |
| CT2 | 3 | 4 | 1 | 1 |
| CT3 | 4 | 5 | 0 | 1 |
| CT4 | 5 | 2 | - | - |
| Sum | 7 | 3 |
| CI Code | ‘UK Experts’ (Exp. > 5) | ‘UK Non-Experts’ (Exp. ≤ 5) | nc | nd |
|---|---|---|---|---|
| CI-1 | 1 | 1 | 11 | 0 |
| CI-2 | 2 | 12 | 0 | 10 |
| CI-10 | 3 | 9 | 2 | 7 |
| CI-4 | 4 | 8 | 2 | 6 |
| CI-6 | 5 | 10 | 1 | 6 |
| CI-3 | 6 | 5 | 3 | 3 |
| CI-12 | 7 | 6 | 2 | 3 |
| CI-8 | 8 | 2 | 4 | 0 |
| CI-5 | 9 | 3 | 3 | 0 |
| CI-11 | 10 | 7 | 1 | 1 |
| CI-9 | 11 | 4 | 1 | 0 |
| CI-7 | 12 | 11 | - | - |
| Sum | 30 | 36 |
Publisher’s Note: MDPI stays neutral with regard to jurisdictional claims in published maps and institutional affiliations. |
© 2022 by the authors. Licensee MDPI, Basel, Switzerland. This article is an open access article distributed under the terms and conditions of the Creative Commons Attribution (CC BY) license (https://creativecommons.org/licenses/by/4.0/).
Share and Cite
Abadi, M.; Moore, D.R. Selection of Circular Proposals in Building Projects: An MCDM Model for Lifecycle Circularity Assessments Using AHP. Buildings 2022, 12, 1110. https://doi.org/10.3390/buildings12081110
Abadi M, Moore DR. Selection of Circular Proposals in Building Projects: An MCDM Model for Lifecycle Circularity Assessments Using AHP. Buildings. 2022; 12(8):1110. https://doi.org/10.3390/buildings12081110
Chicago/Turabian StyleAbadi, Mohamed, and David R. Moore. 2022. "Selection of Circular Proposals in Building Projects: An MCDM Model for Lifecycle Circularity Assessments Using AHP" Buildings 12, no. 8: 1110. https://doi.org/10.3390/buildings12081110