4.1.2. Response Spectrum Analysis
- (1)
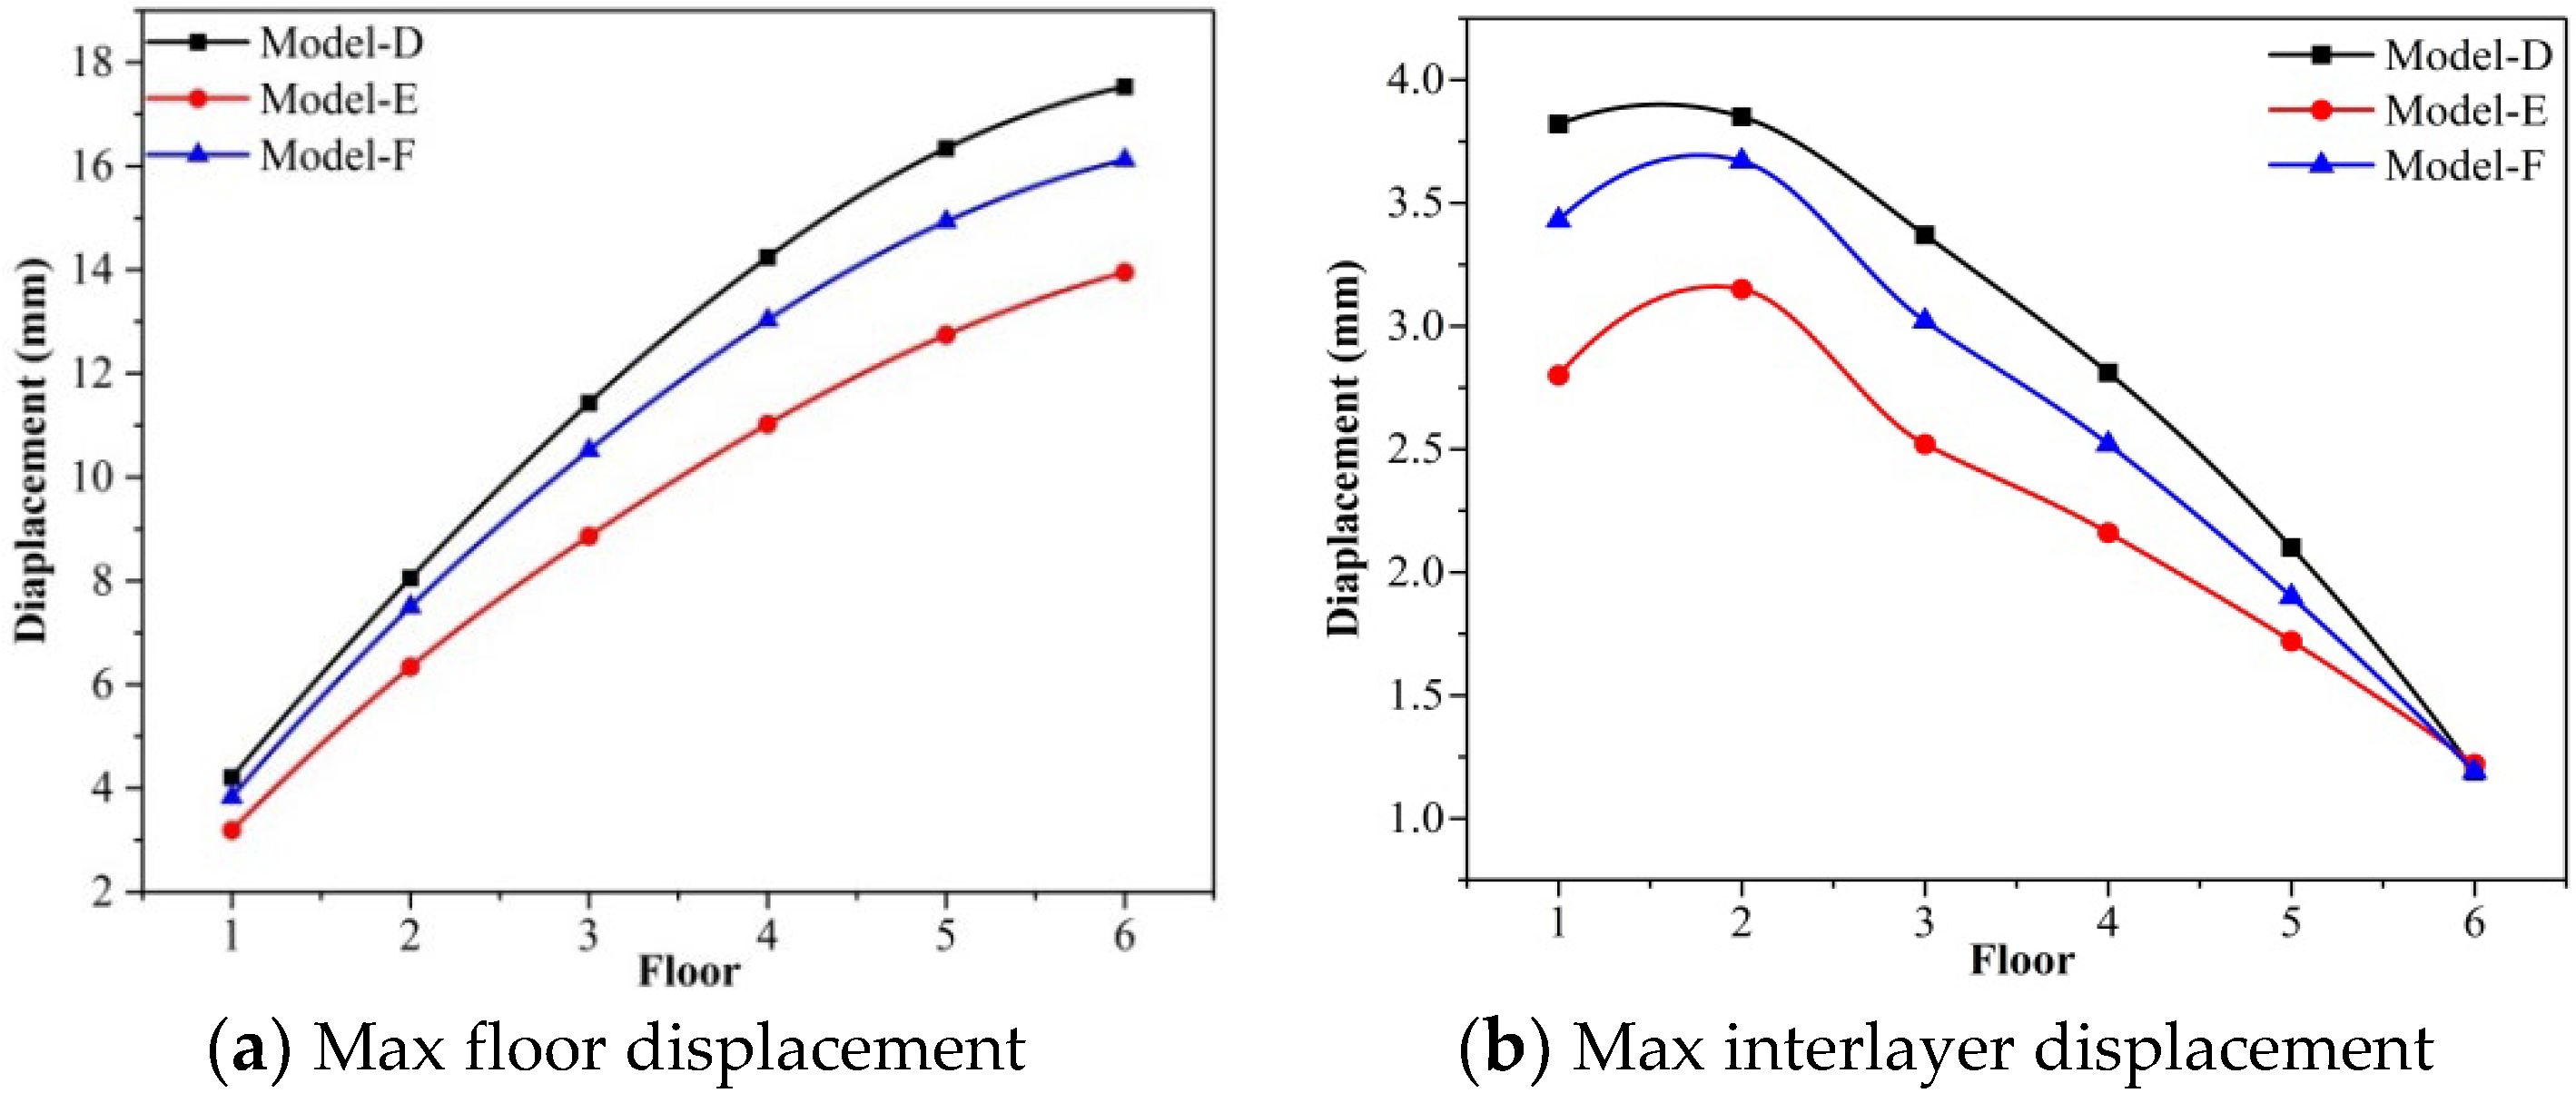
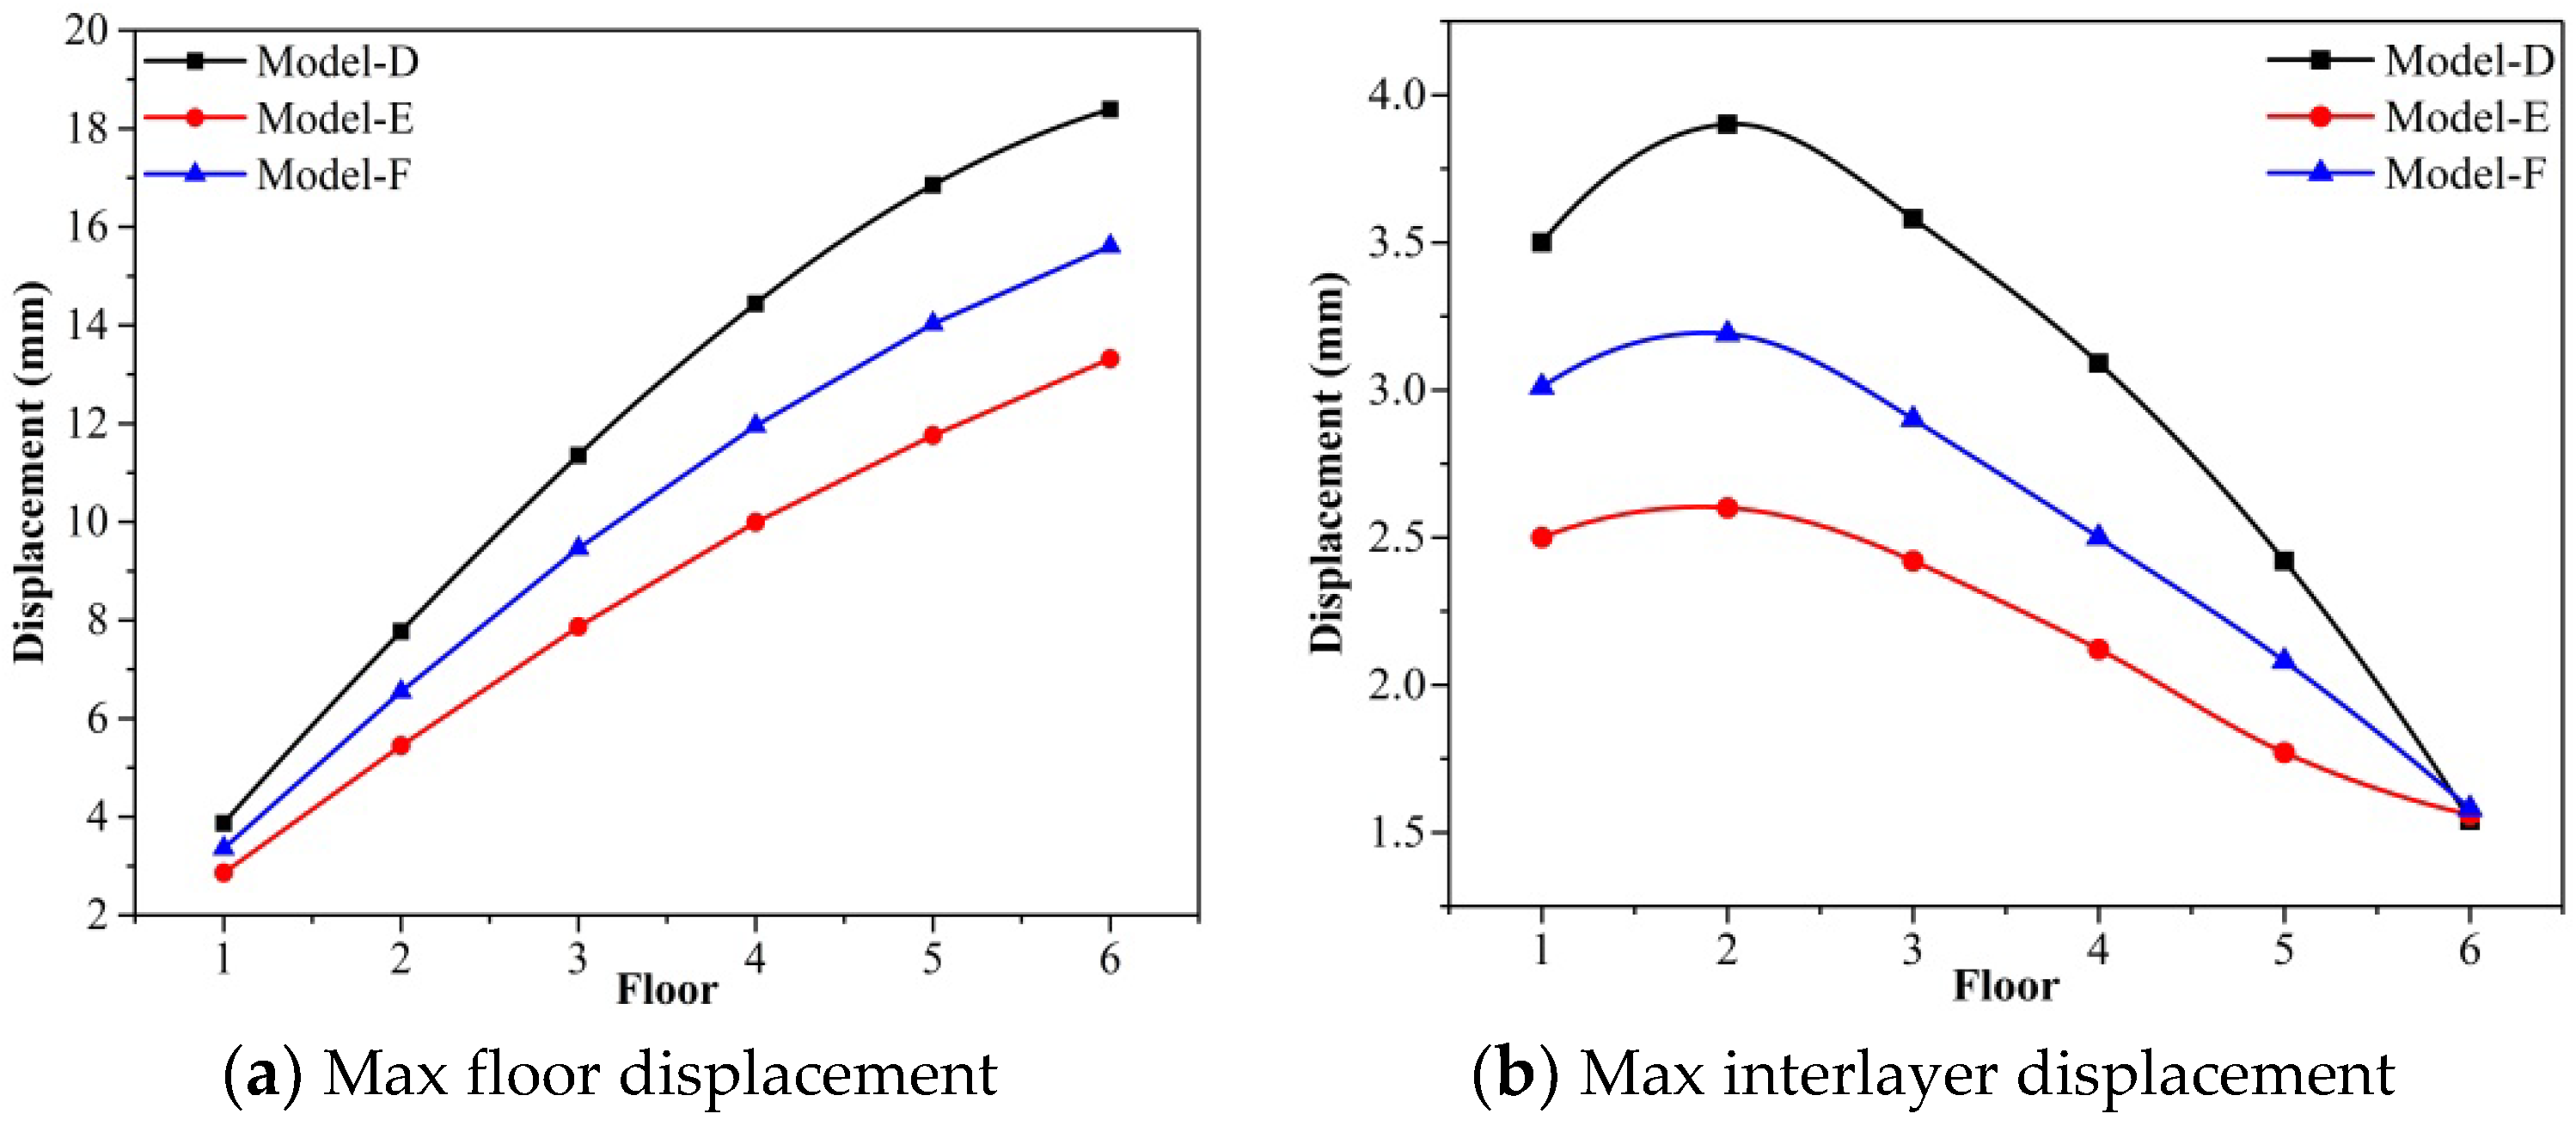
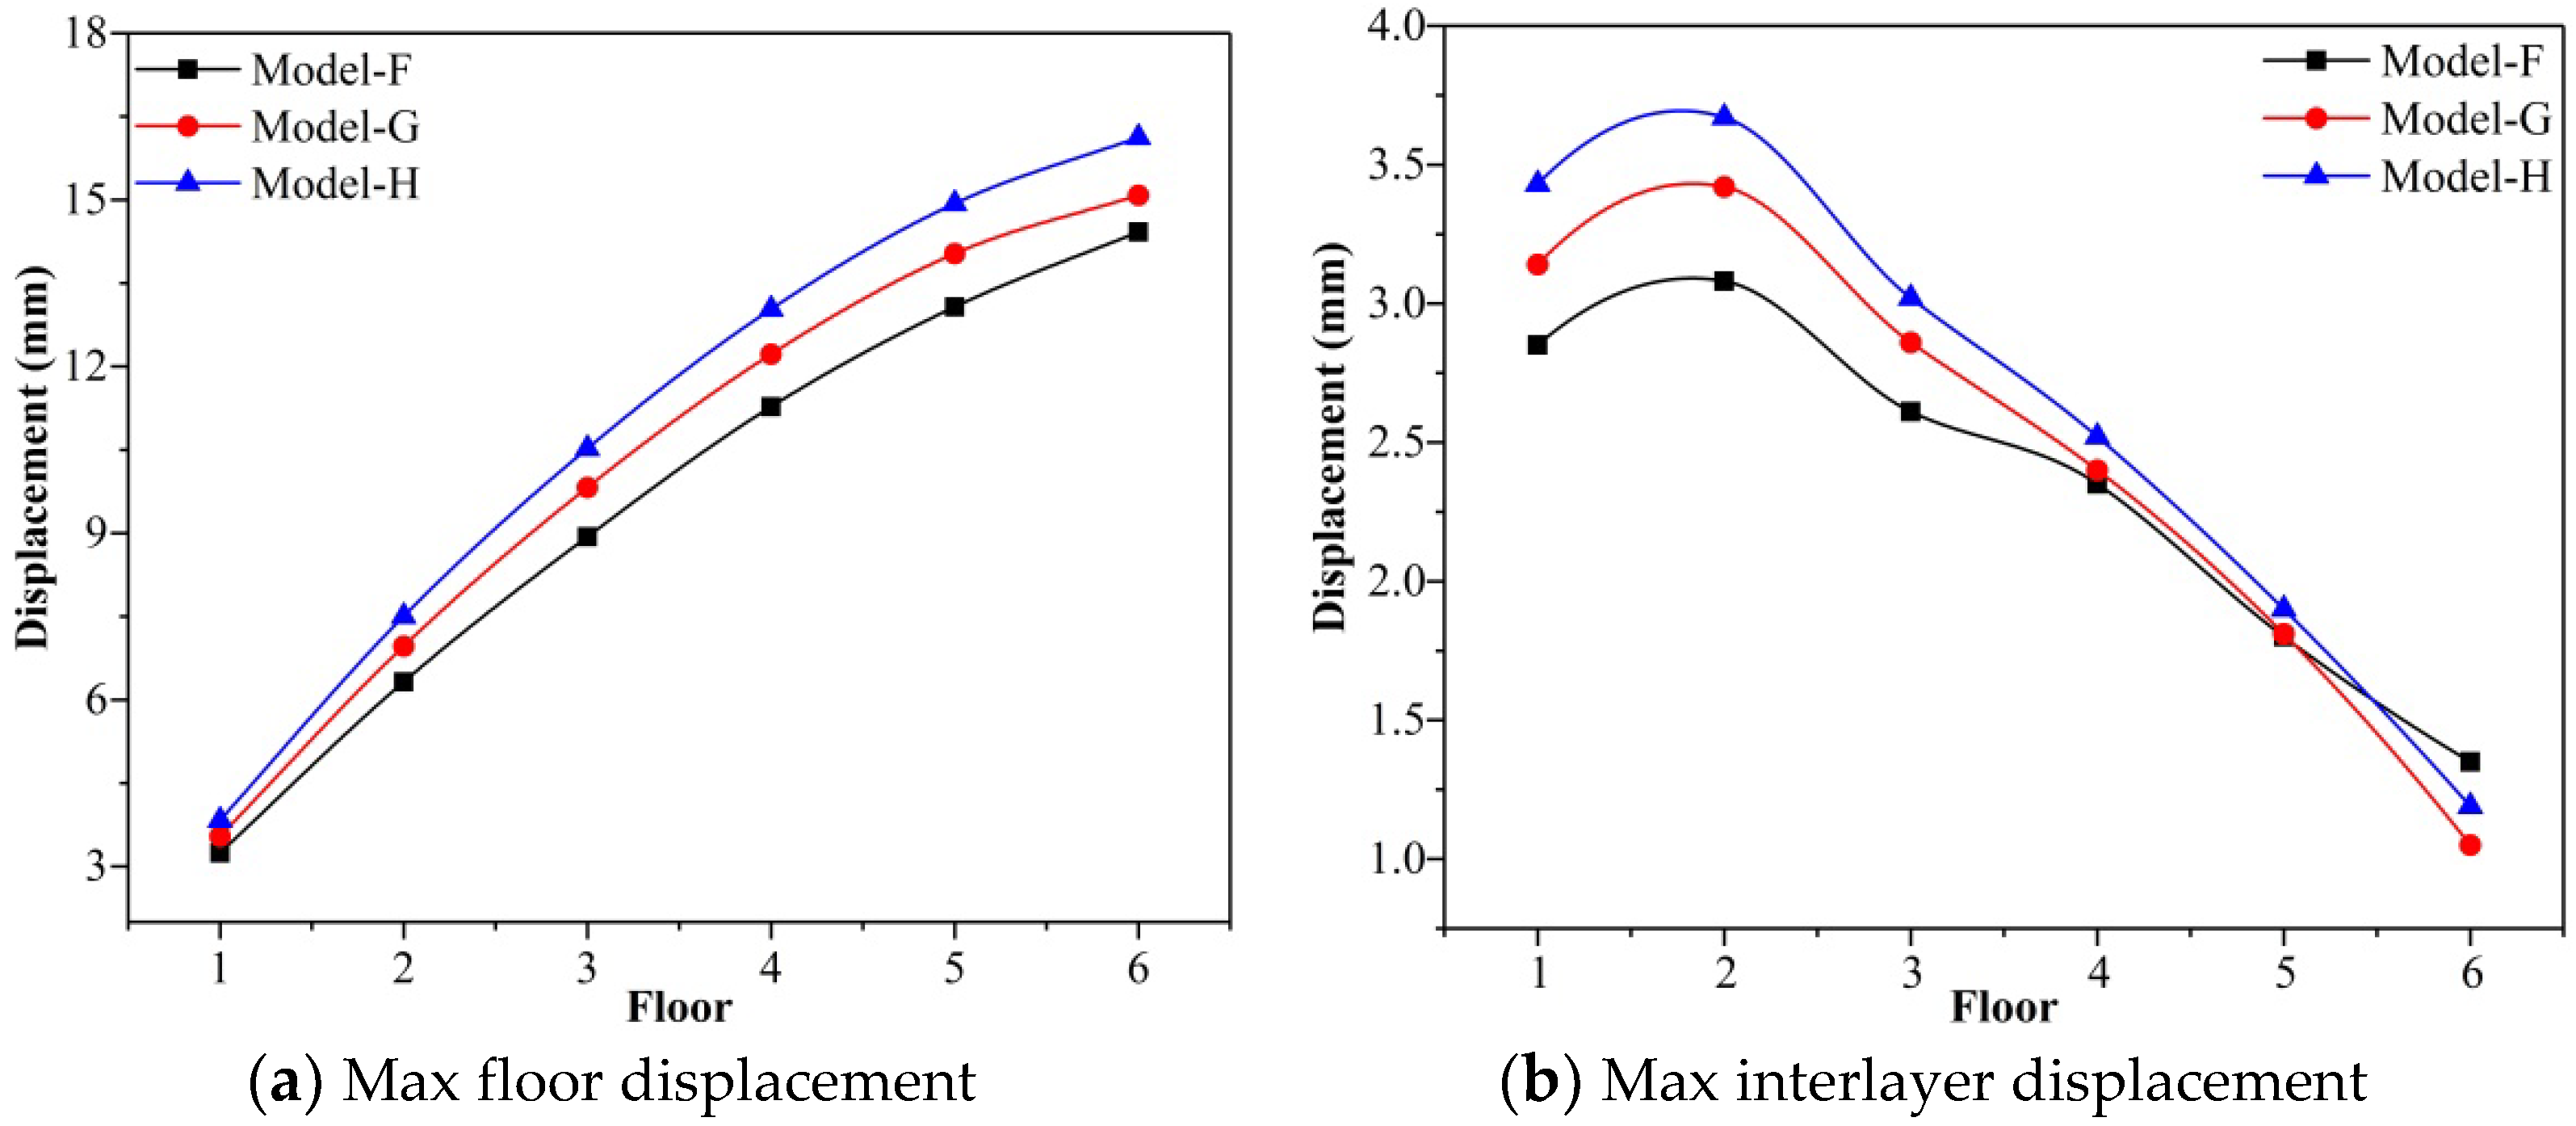
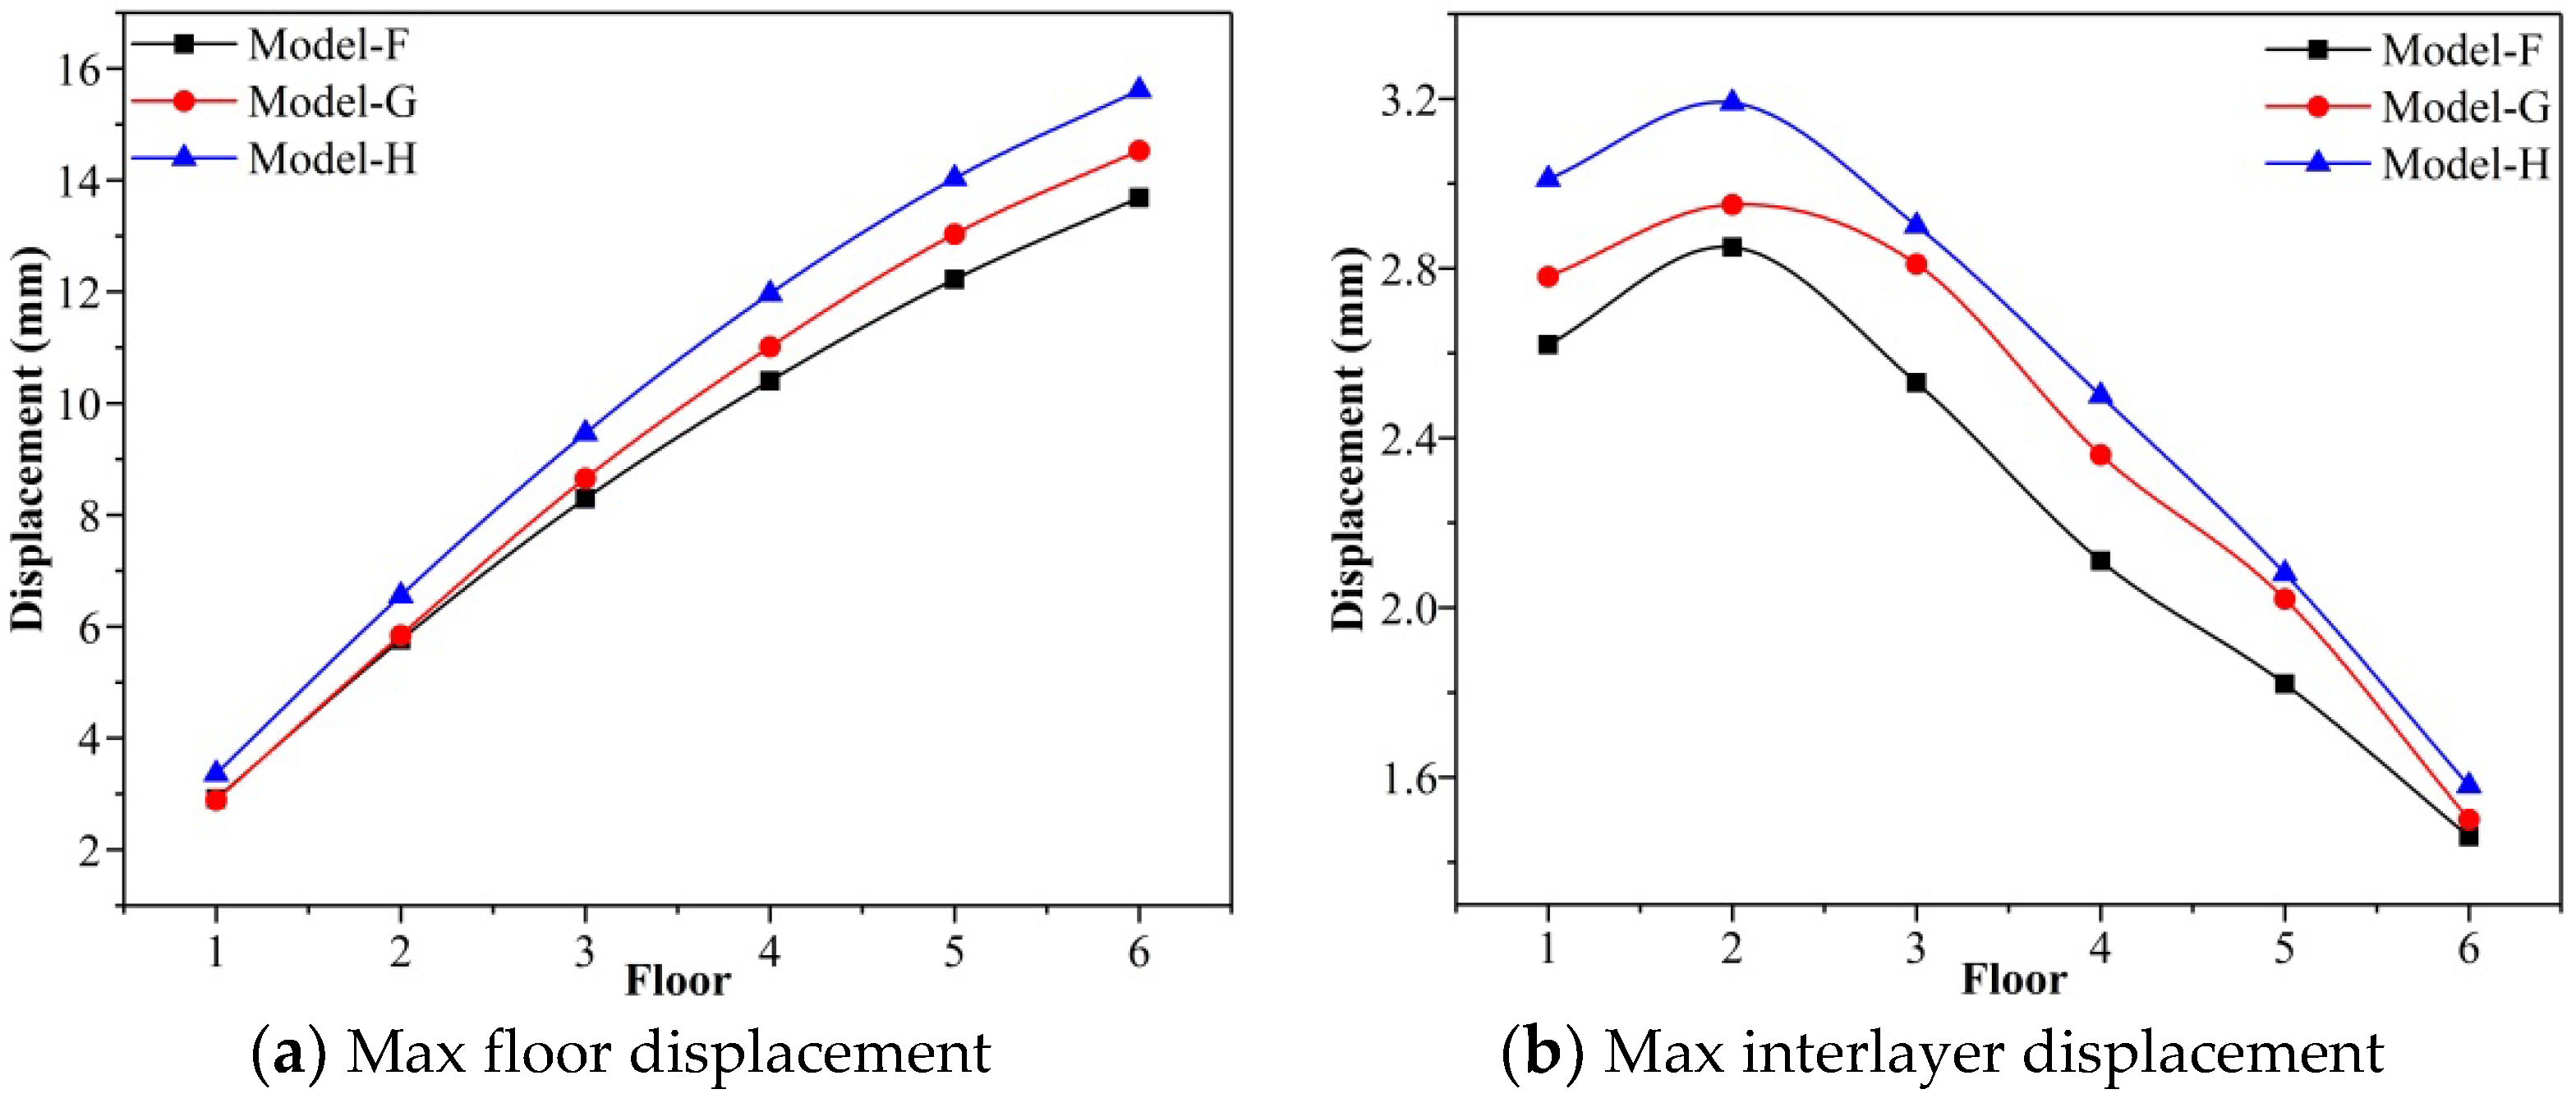
Maximum horizontal displacement
The maximum elastic inter-story drift should meet the requirements of the code when checking the seismic deformation of the structure following frequent earthquakes. For reinforced concrete frame structures, the limit value of the inter-story drift angle is 1/550, and the smaller the elastic inter-story drift angle, the stiffer the structure. The definition of the interlayer displacement angle is also realized by the definition of the horizontal displacement. To reduce excessive horizontal displacement, it is often necessary to improve the lateral stiffness of the building. Because excessive horizontal displacement will pose security risks to the structure and affect the comfort of use, it is of great research significance to control the horizontal displacement of the structure.
The floor displacement and interlayer displacement of the models in the X- and Y-directions are shown in
Figure 9 and
Figure 10. The structure had the maximum interlayer displacement angle on the second floor. This was less than 1/550, which meets the code requirements. Comparing the interlayer displacement angle in the X-direction and Y-direction, the value in Y-direction was lower. After considering the participation of stairs in the calculation, the maximum interlayer displacement angle in two directions decreased significantly, which indicates that the addition of stairs improves the lateral stiffness of the structure. A comparison of model E and model F found that the interlayer displacement angle of model F was significantly larger than model E, indicating that the lateral stiffness will be reduced after the adoption of the sliding bearing.
- (2)
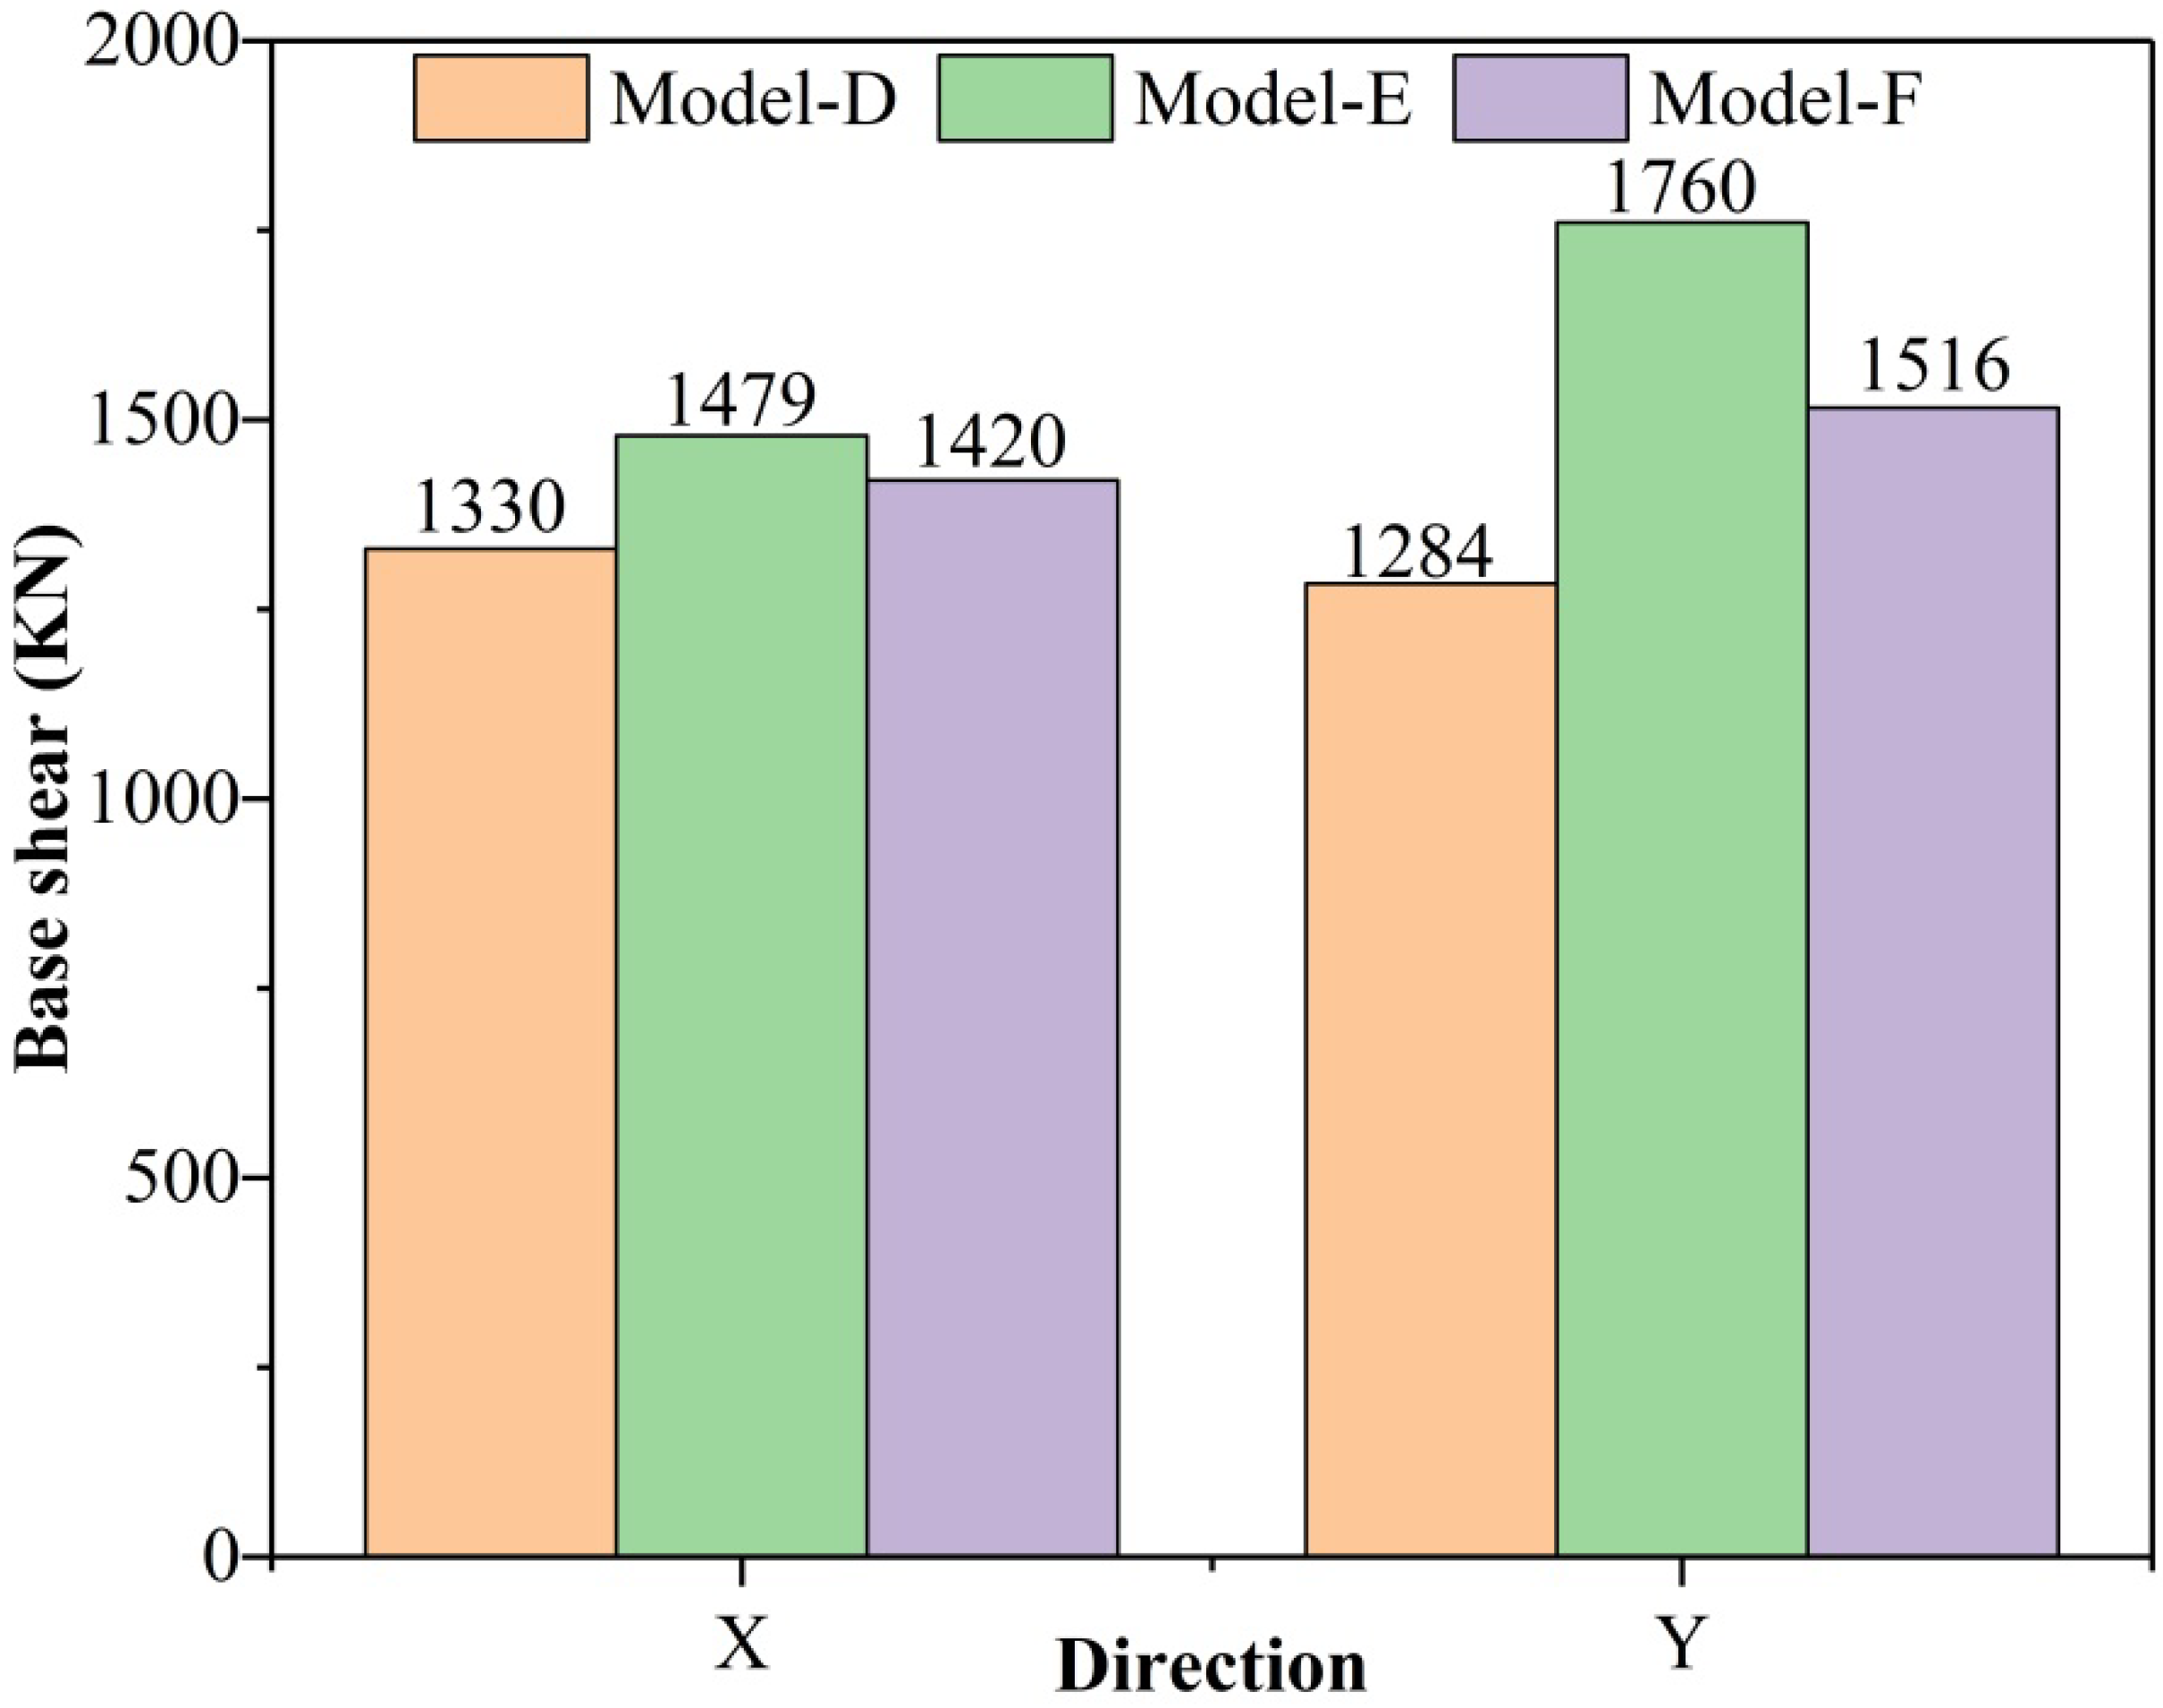
Maximum base shear
The comparison of the base shear of each model under the X- and Y-direction earthquake is shown in
Figure 11. In
Figure 11, the base shear in two directions of model D was relatively close, and the base shear in the Y-direction of both model E and model F was greater than the base shear in the X-direction. The base shear of model E was larger than model D, which indicates that after considering the staircase, the seismic force on the structure increased due to the bracing effect of the staircase slab, and the Y-direction exceeded 37%. The force difference between model D and the actual model E was obvious, illustrating that following the traditional design approach will substantially underestimate the seismic effect on the structure and exacerbate the damage to the building. Compared to model E, the base shear of model F was reduced, and the decrease in the Y-direction was more significant.
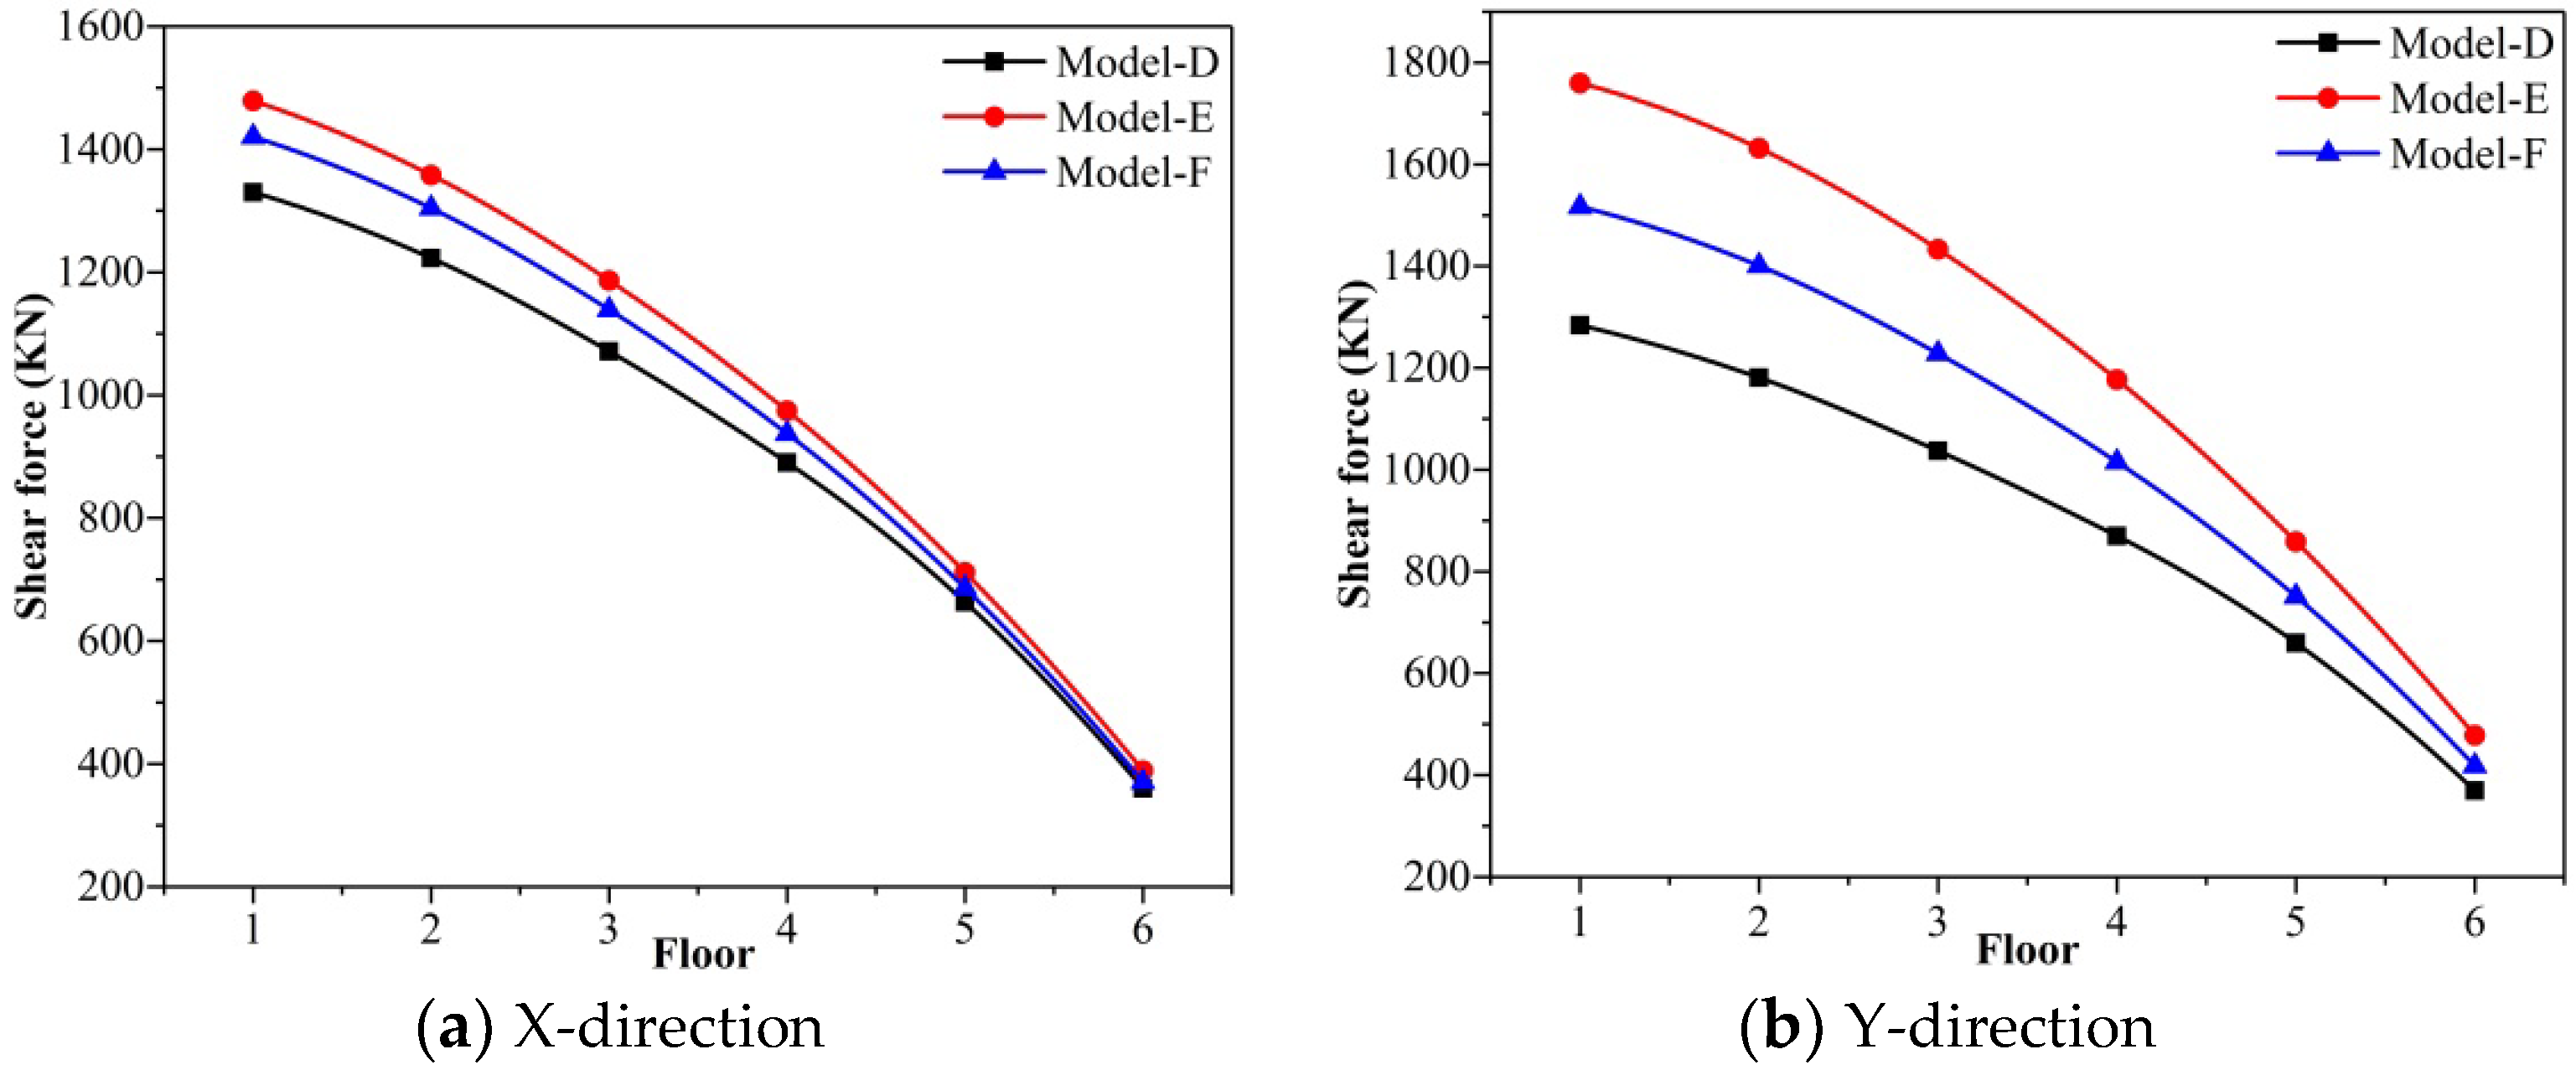
Figure 12 depicts the maximum interlaminar shear forces of each model in the X- and Y-directions. The interlaminar shear force of the bottom was the largest. With the increase in floors, the shear force decreased. Factoring the stairs into the calculation affects the stiffness of the layers; this is more significant on the bottom layer. As the floor height increases, the effect of this impact weakens. The growth rate of model E in the X-direction was 11.2% at the bottom layer and 8% at the top layer. The growth rate of model E in the Y-direction was 37.1% at the bottom and 29.5% at the top. The story stiffness in the Y-direction was found to be more sensitive to the impact of stairs, and the increase was also greater than in the X-direction under the same circumstances. For model F with a sliding connection, the influence will be weaker than in model E, which indicates that the sliding bearing will weaken the seismic response of the building.
- (3)
Frame force
The previous section found that when stairs are factored into the calculation of the structure, the stiffness of the building in the Y-direction obviously changes. This section will study the X-direction earthquake action under different internal force distributions based on whether the stairs participate in the structure calculation. This paper only selected the frame columns KZ1 and KZ3 at the opposite corners of the staircase and the frame beams KL1–KL4 for comparative analysis. The comparison of internal forces of the beam-column components in different models under the X-direction earthquake is shown in
Table 3,
Table 4 and
Table 5.
The changing trend of KL1’s shear force and bending moment with the number of floors was the same. The internal force value of model E was slightly larger than that of model D. The maximum difference was the bending moment of the second floor, with a difference of 21.2%, and the minimum difference was the shear force of the first floor, with a difference of 4.0%. The internal force value of model F was larger than model D; the largest difference was the fourth-floor shear force, the difference was more than one time, and the smallest difference was the sixth-floor shear force.
For KL2: Unlike KL1, the internal force of model D did not decrease much with the number of floors. From the bottom to the top floor, the shear force and bending moment decreased by 45.7% and 50%, respectively. The internal forces of KL2 in model E and model F were similar to those in KL1. The internal forces of the three models decreased as the number of layers increased, and the decrease ratio of model D was the smallest, within 10%, and the decrease rate of the other two models was larger, more than 20% for each layer. The shear force of model F in the first layer was more than three times that of model D. With the increase in the number of layers, the gap gradually closed, and the change in the bending moment value was similar to the shear force.
For KL3, the changing trend in the shear force and bending moment was the same as KL1. The order of internal force values from largest to smallest was model F > model E > model D, and the decrease rate of the three models was similar. For KL4, the changing trend of internal force was similar to KL2, the decrease in model F and model E was significantly greater than model D, and the internal force value of the model F was not much different from model D.
For KZ1, the internal force also decreased as the number of layers increased, and the feature was model E > model F > model D. The axial force of the first layer increased from 51.3 kN of model D to 132 kN of model E, with an increase of 157.3%. The shear force increased from 28.1 kN to 55.1 kN, with an increase of 96.1%, and the bending moment increased from 51.3 kN·m to 71.4 kN·m, with an increase of 39.2%. For KZ3, the changing trend was consistent with KZ1, the difference between model E and model D was the largest, and between model E and model F it was the smallest. The axial force changed from 112.7 kN to 188.2 kN, which increased by 67.0%, and the shear force changed from 14 kN to 19.4 kN, which increased by 38.6%. The bending moment increased from 30 kN·m to 45.7 kN·m, with an increase of 52.3%.
For the frame beams and columns, the internal force values on the top floors of each model did not change because there were no stairs, which indicates that the influence of stairs on the internal force of the structure is focused on the floor that has staircases, and the influence on the floors without stairs is small.
To sum up, the internal forces of the structural components gradually decrease as the number of floors increases, and the presence or absence of stairs has a greater impact on the internal forces of structural members. When there are stairs in the structure, the stiffness of the building will be increased, and it will be able to bear more seismic action. The internal force of the structural components is also significantly greater than that of the structure without stairs. The frame column’s internal force of model F was smaller than that of model E. The frame beam’s shear force and bending moment are magnified, so the influence should be considered in structural design.
- (4)
Internal force of components
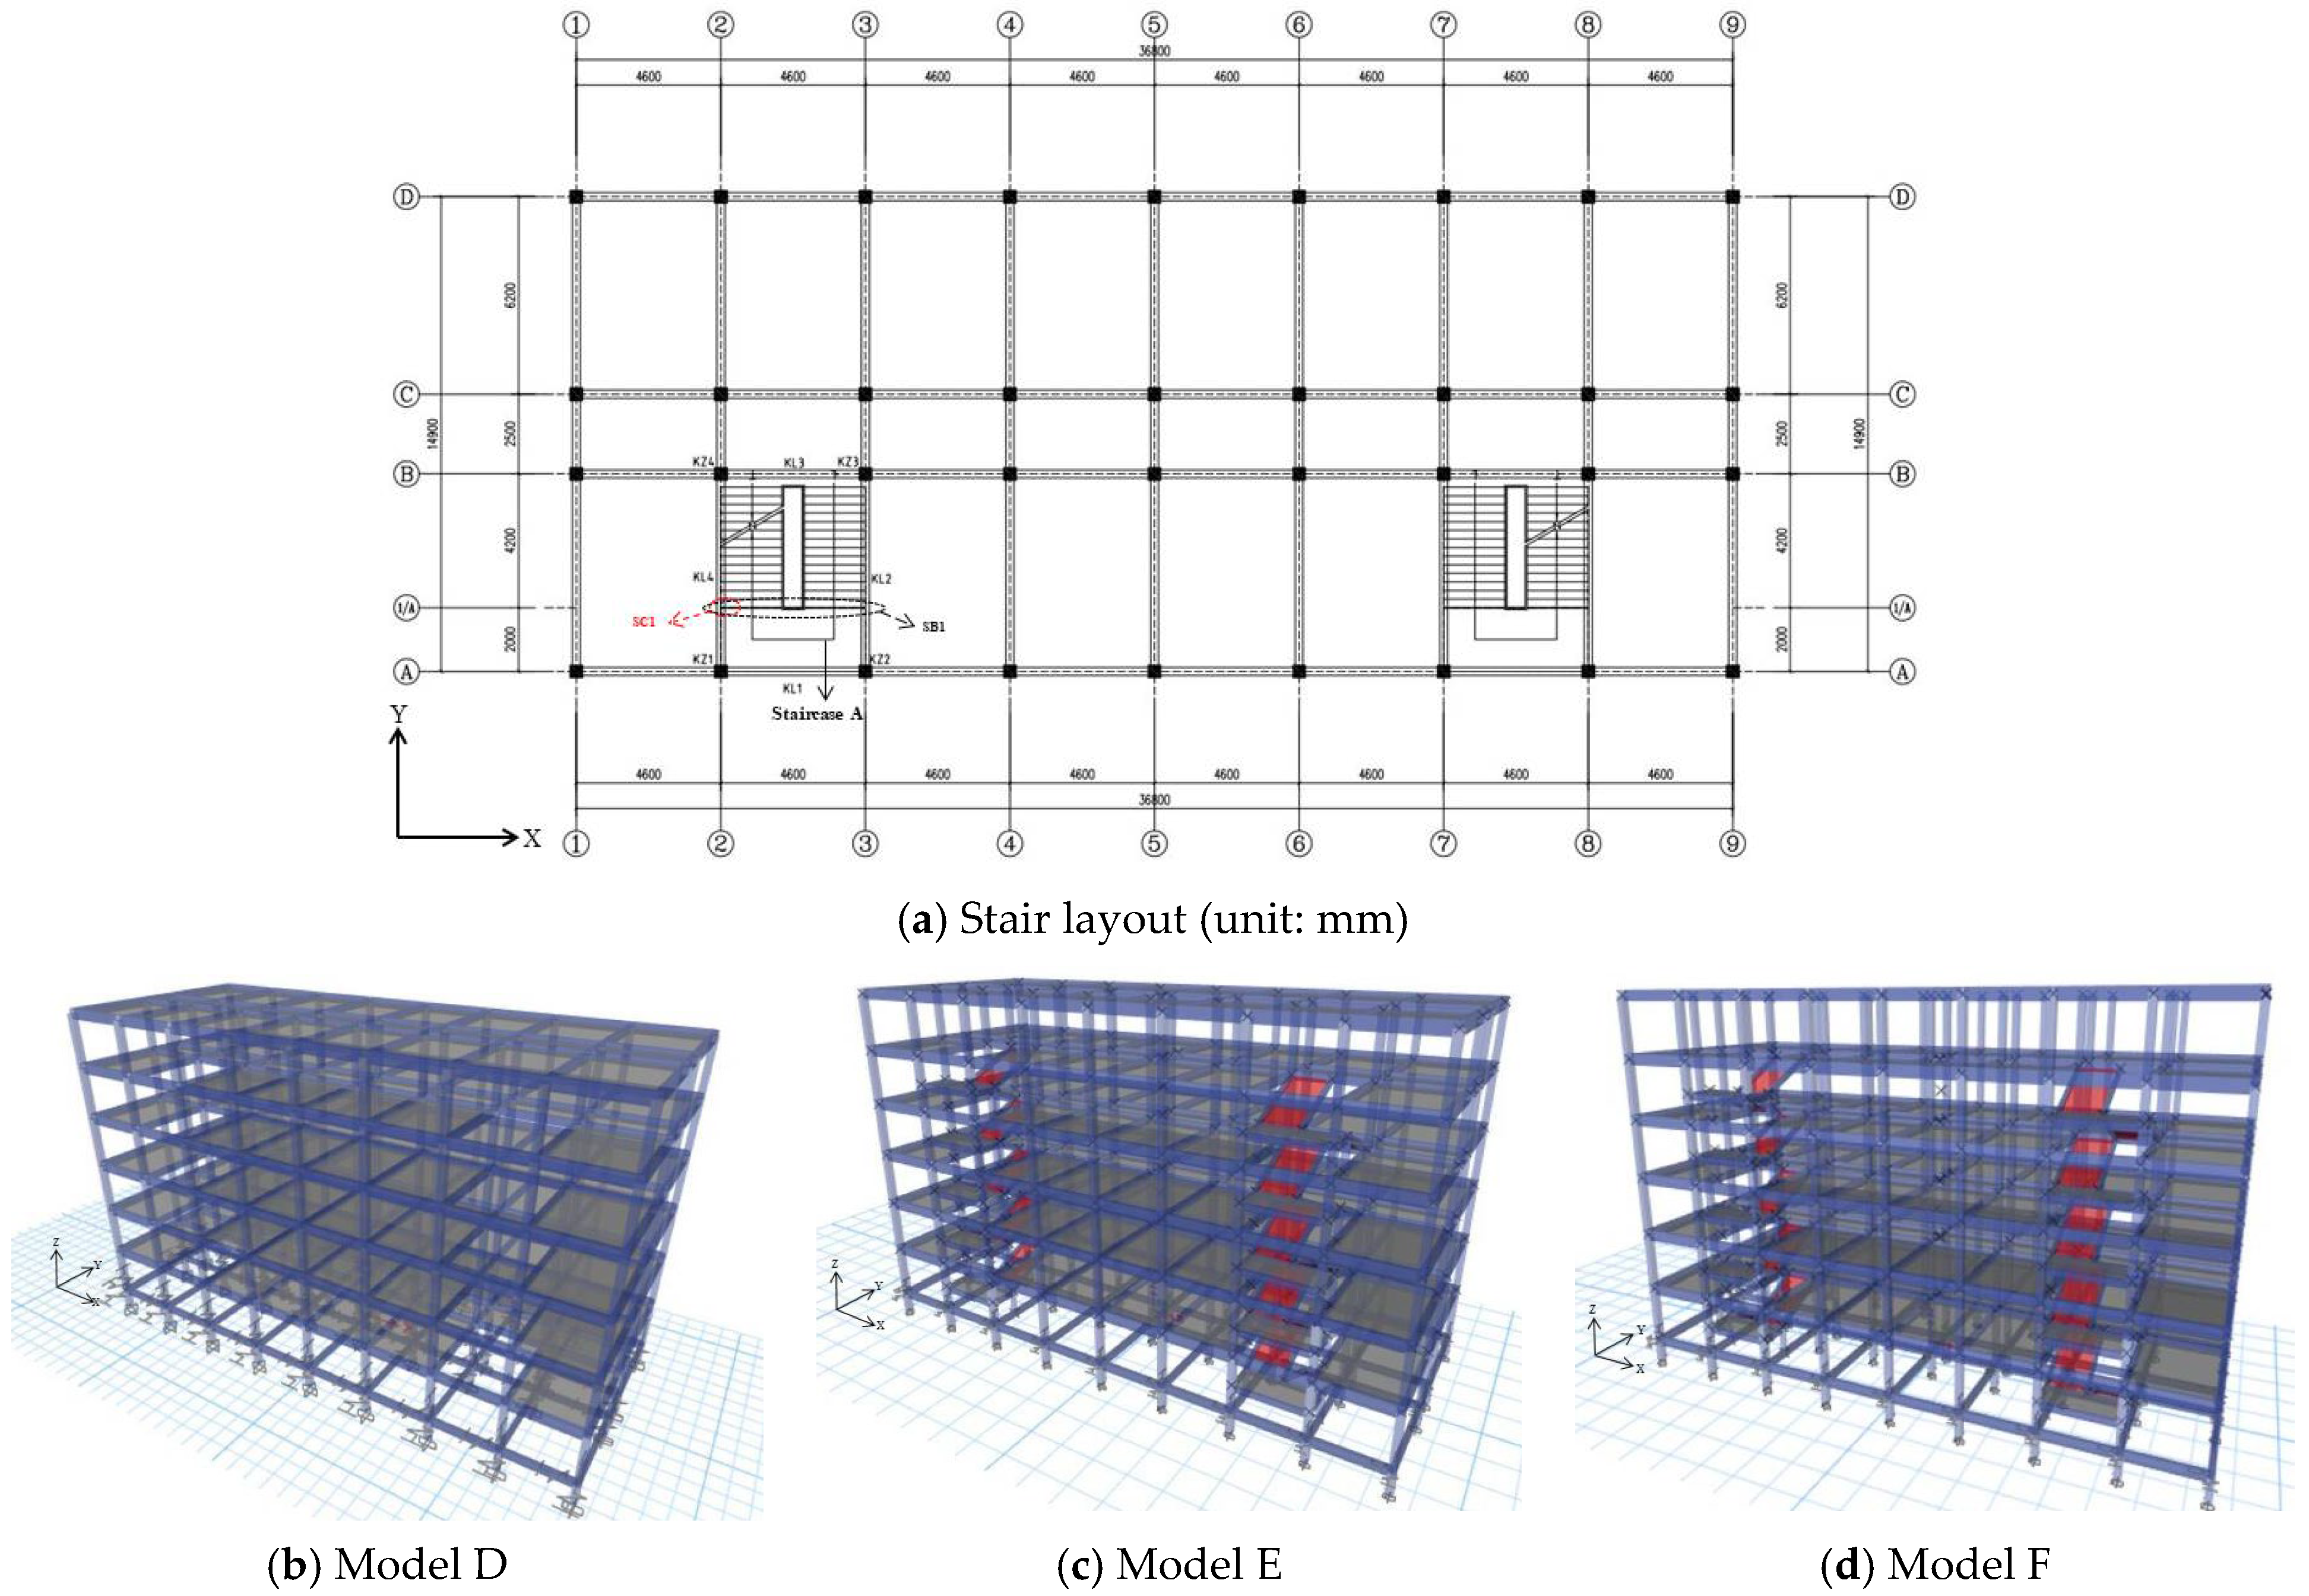
Changing the connection mode of stairs will have a corresponding impact on the internal force of the staircase frame. It is conceivable that the internal forces of the stair components, which are the components of the stair units, will also change accordingly. In this section, the A-B/2-3 axis staircase (The staircase A in
Figure 5a) is used to study the trends in the change in the internal force of the stair beams and stair columns under the X-direction earthquake action.
- (a)
Stair columns
As the top of the stair column is connected with the stair beam, it is easy for an earthquake to damage the top of the column.
Table 6 compares the axial force and shear force of the stair column (SC1 in
Figure 5a) at the intersection of the 1/A axis and 2 axis. After the sliding connection bearing was adopted, the axial force and shear force of the stair column are significantly reduced; the shear value of each layer was reduced by more than 50%, and the shear value of the first layer by 73.2%. The shear force of the stair column with the fixed connection was more than 2.5 times that with the sliding connection, which indicates that the sliding bearing can increase the structure’s stiffness and mitigate the damage to the column top.
- (b)
Stair beams
According to the traditional design method, it is difficult for the reinforcement of the stair beam to meet the needs of the complex stress state during an earthquake, which can lead to failure.
Table 7 compares the shear force and bending moment of the stair beam at the intersection of axis 1/A and axes 2–3 (The SB1 in
Figure 5a). The internal forces of model F were weaker than those of model E, and the decrease in the shear force was more pronounced, which indicates that the sliding connection can improve the stress state of the stair beam and reduce the damage caused by an earthquake.
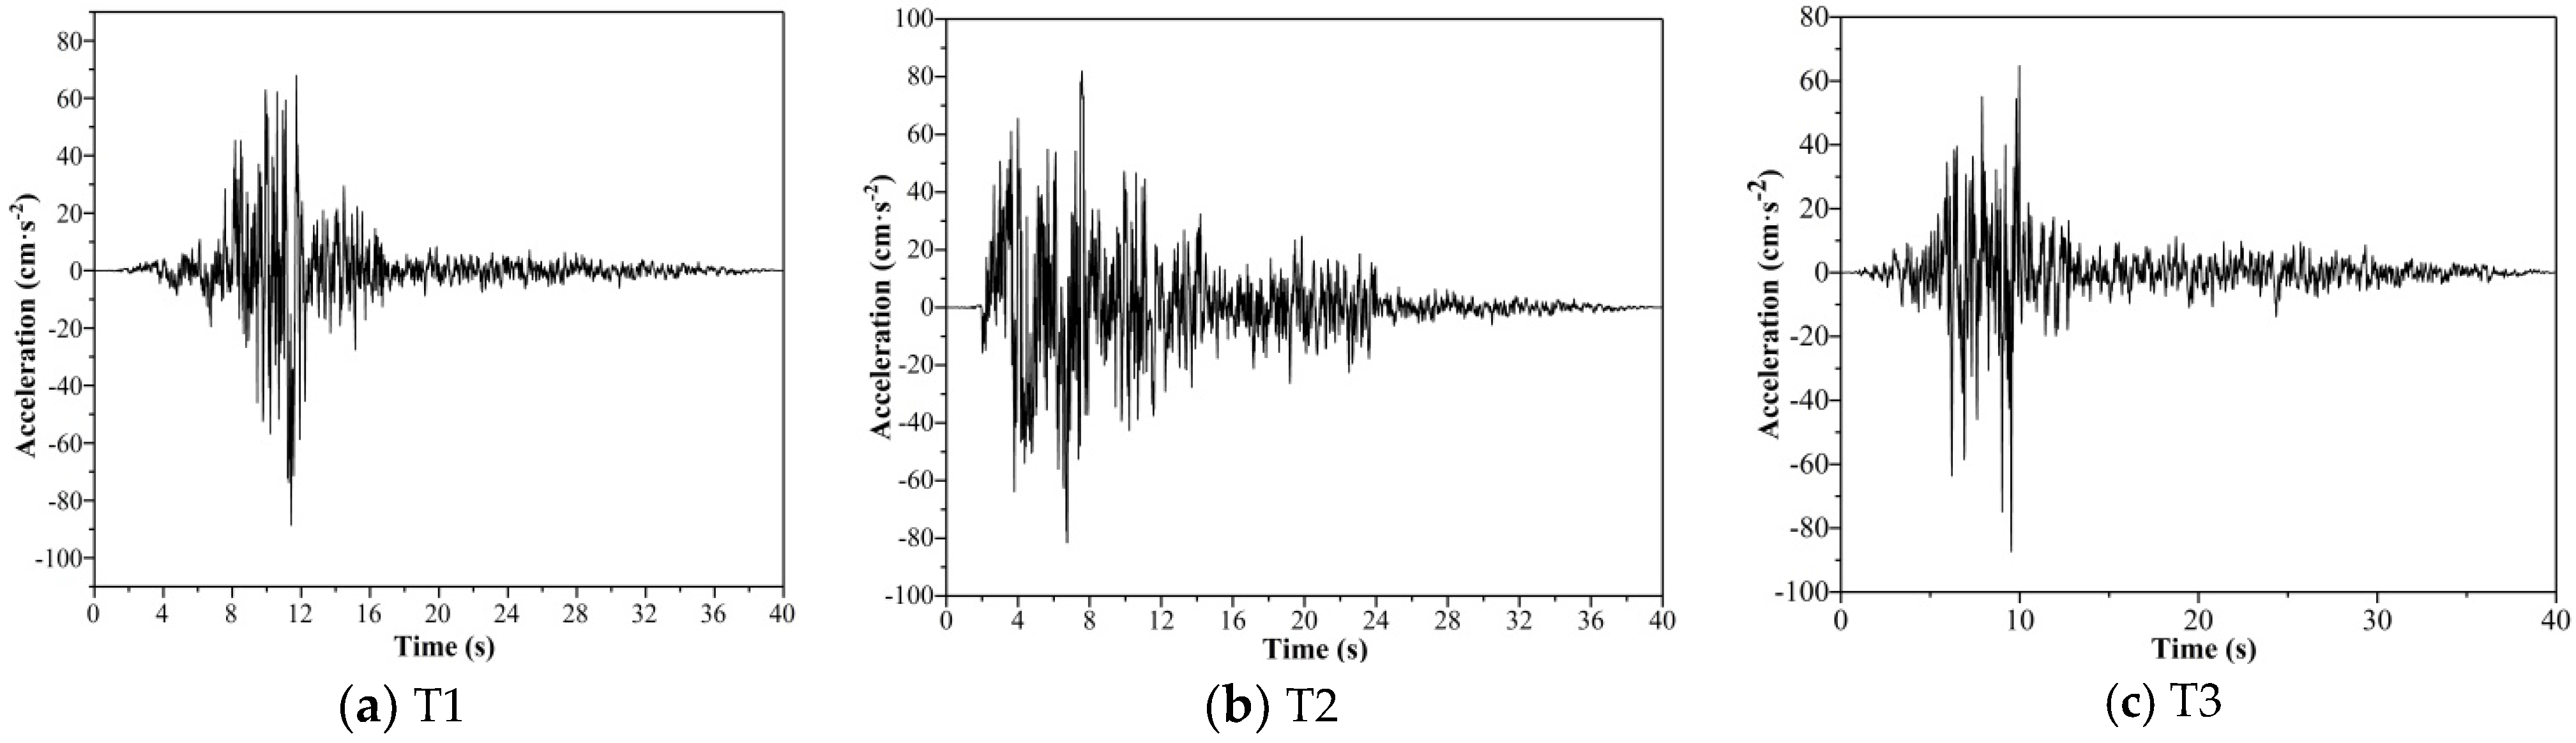
4.1.3. Time History Analysis
When using ETABS for the time history analysis, factors such as the site type of the model, the fortification intensity, and the principle of seismic wave selection, the Coalinga wave (T1), Whittier–Narrows wave (T2), and an artificial wave (T3) were selected, respectively. The duration of the three seismic waves was 40 s. Three seismic waves were input horizontally and bidirectionally, and the nonlinear dynamic response of the structure was analyzed under the seismic fortification intensity of six degrees. After checking, it can be seen that the shear force at the bottom of the building obtained under the three seismic waves met the requirements of the specification. The time–history curve of each seismic wave is shown in
Figure 13.
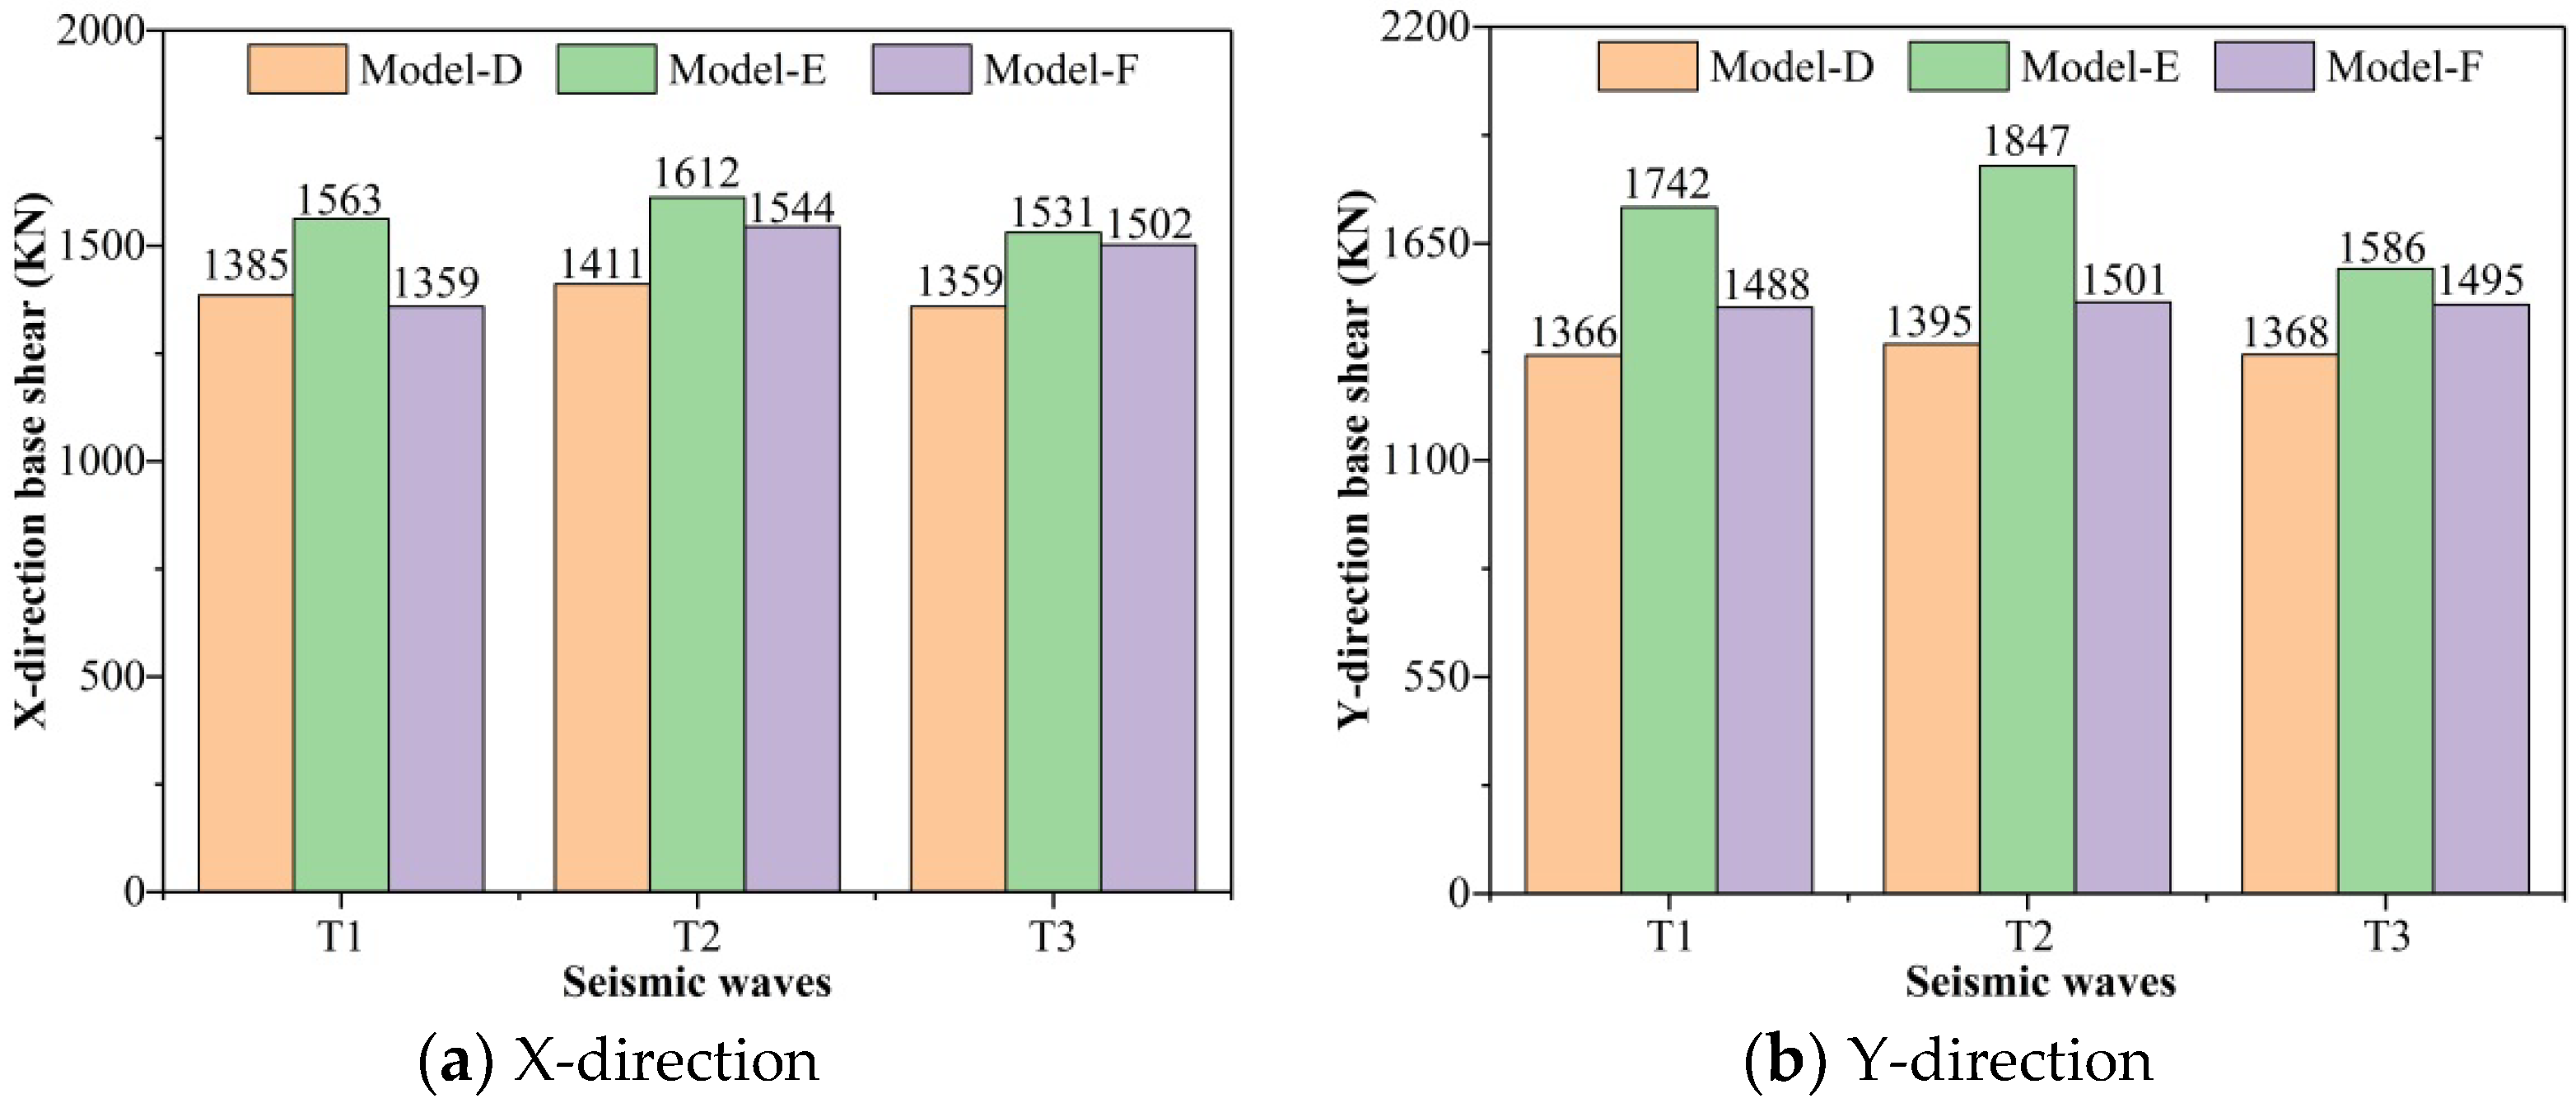
- (1)
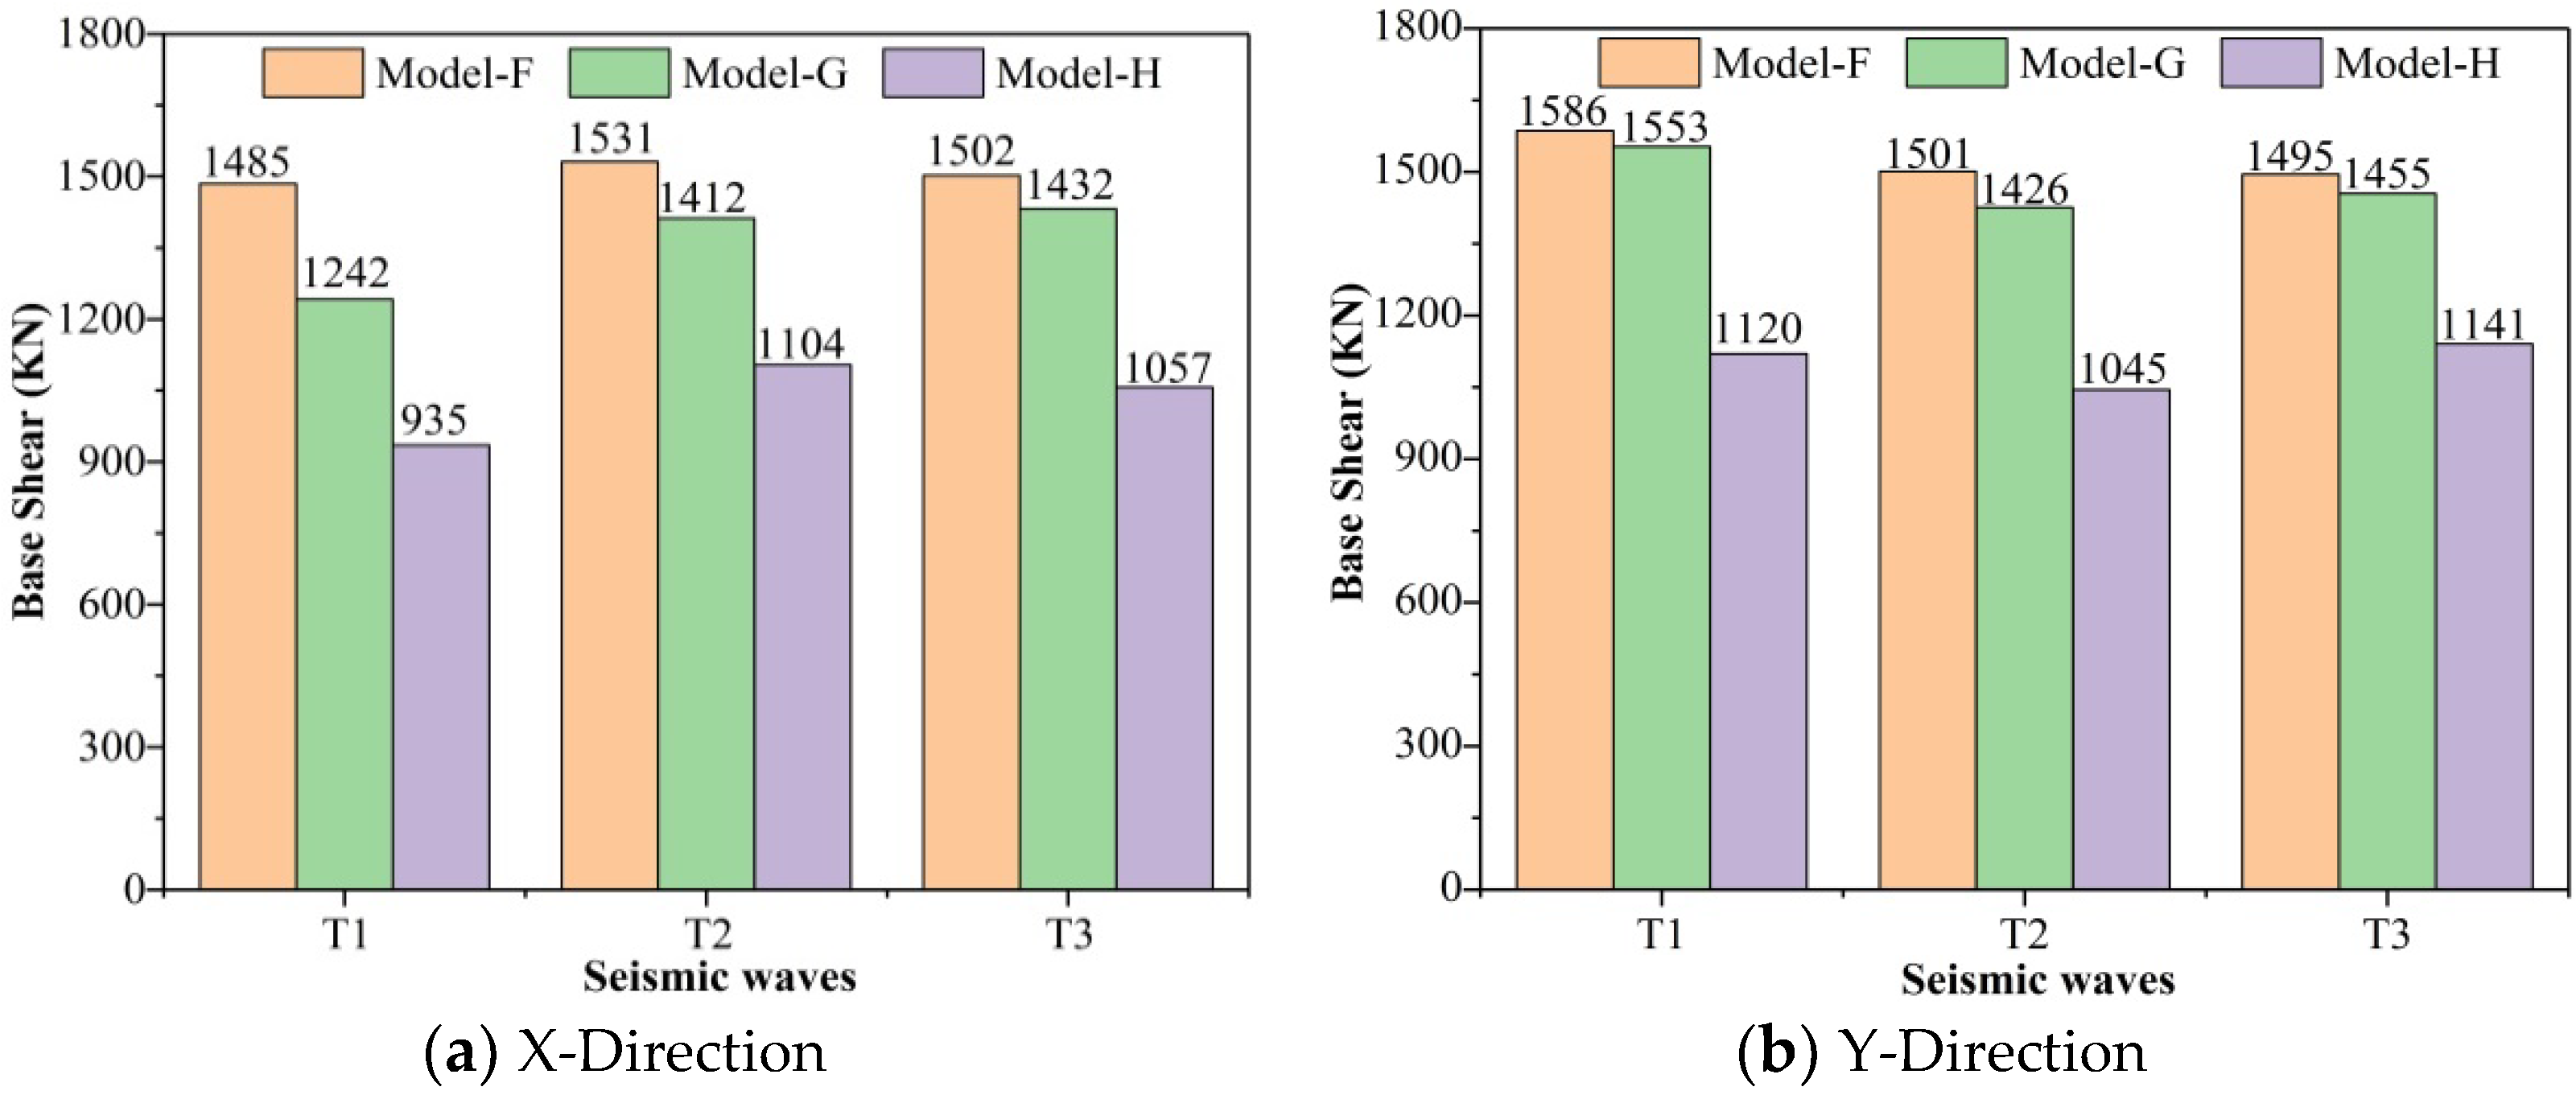
Maximum base shear
Table 8 and
Table 9 depict the maximum base shear force and corresponding time of the model under the action of each seismic wave.
Figure 14 shows the maximum base shear of each model in the X- and Y-directions under each seismic wave.
The maximum base shear of the three models was 1395 kN, 1847 kN, and 1501 kN. Under the three seismic waves, the three models showed similar trends. The seismic response under T2 was the largest, so different seismic waves will produce different seismic actions, with different impacts on the structure. Under the same seismic wave, each model had a different seismic response. The seismic response of model E was the largest, similar to the results of the response spectrum analysis. The results showed that considering the role of stairs in the seismic analysis will increase the base shear of the structure. Compared to the fixed connection, the sliding bearing can reduce the seismic response of the stairs, increase the energy dissipation capacity of the building, and improve the seismic performance of the frame structure.
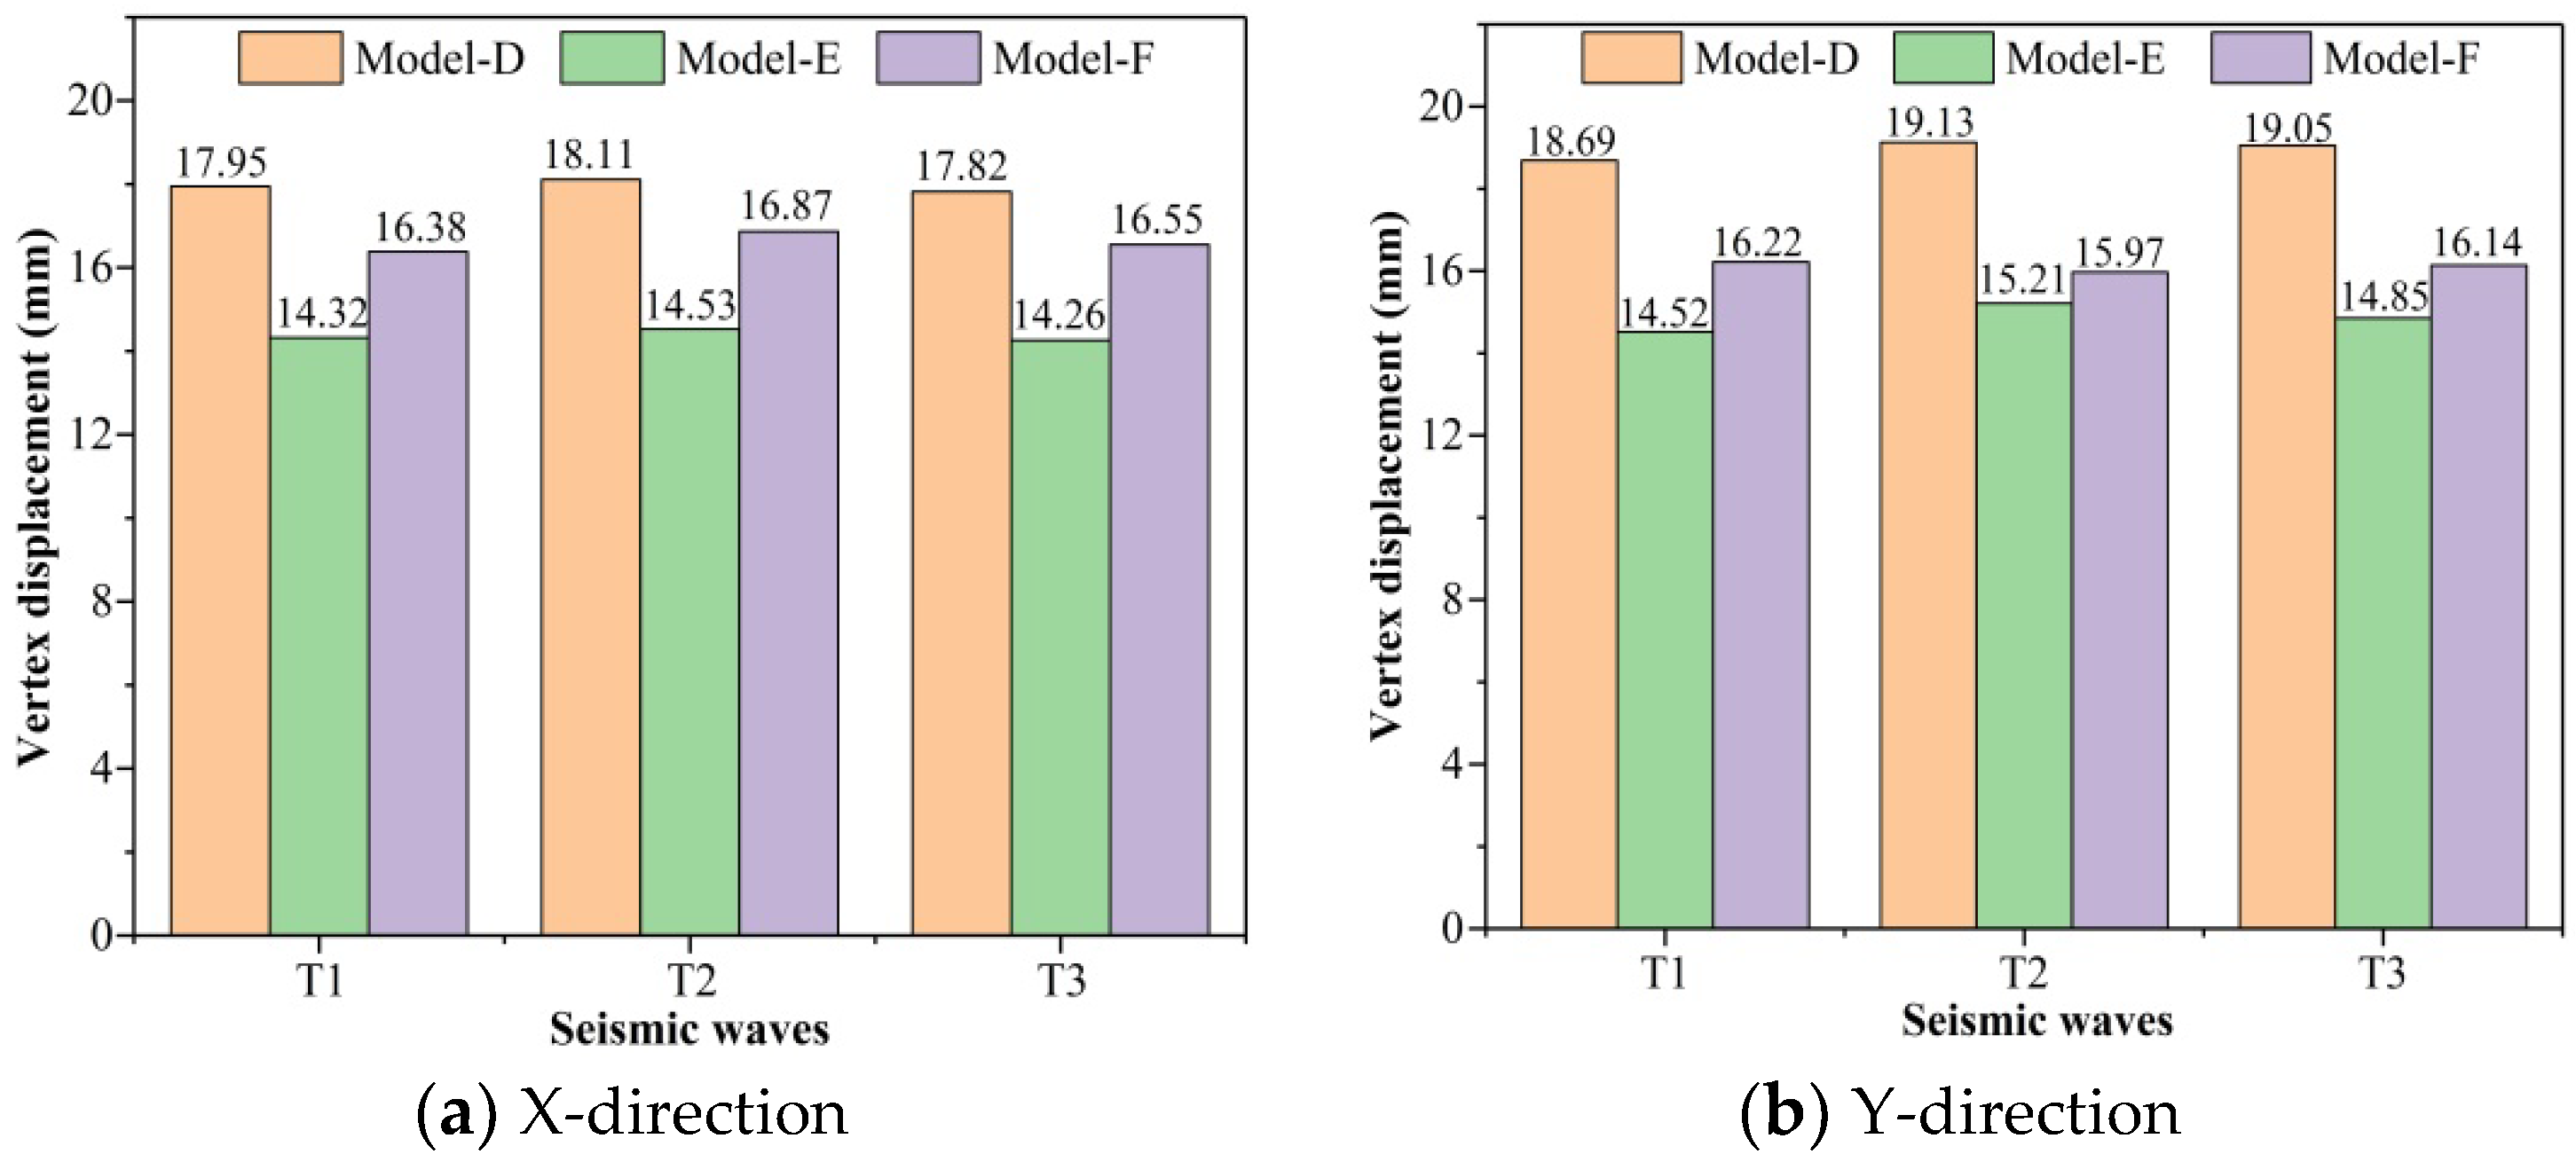
- (2)
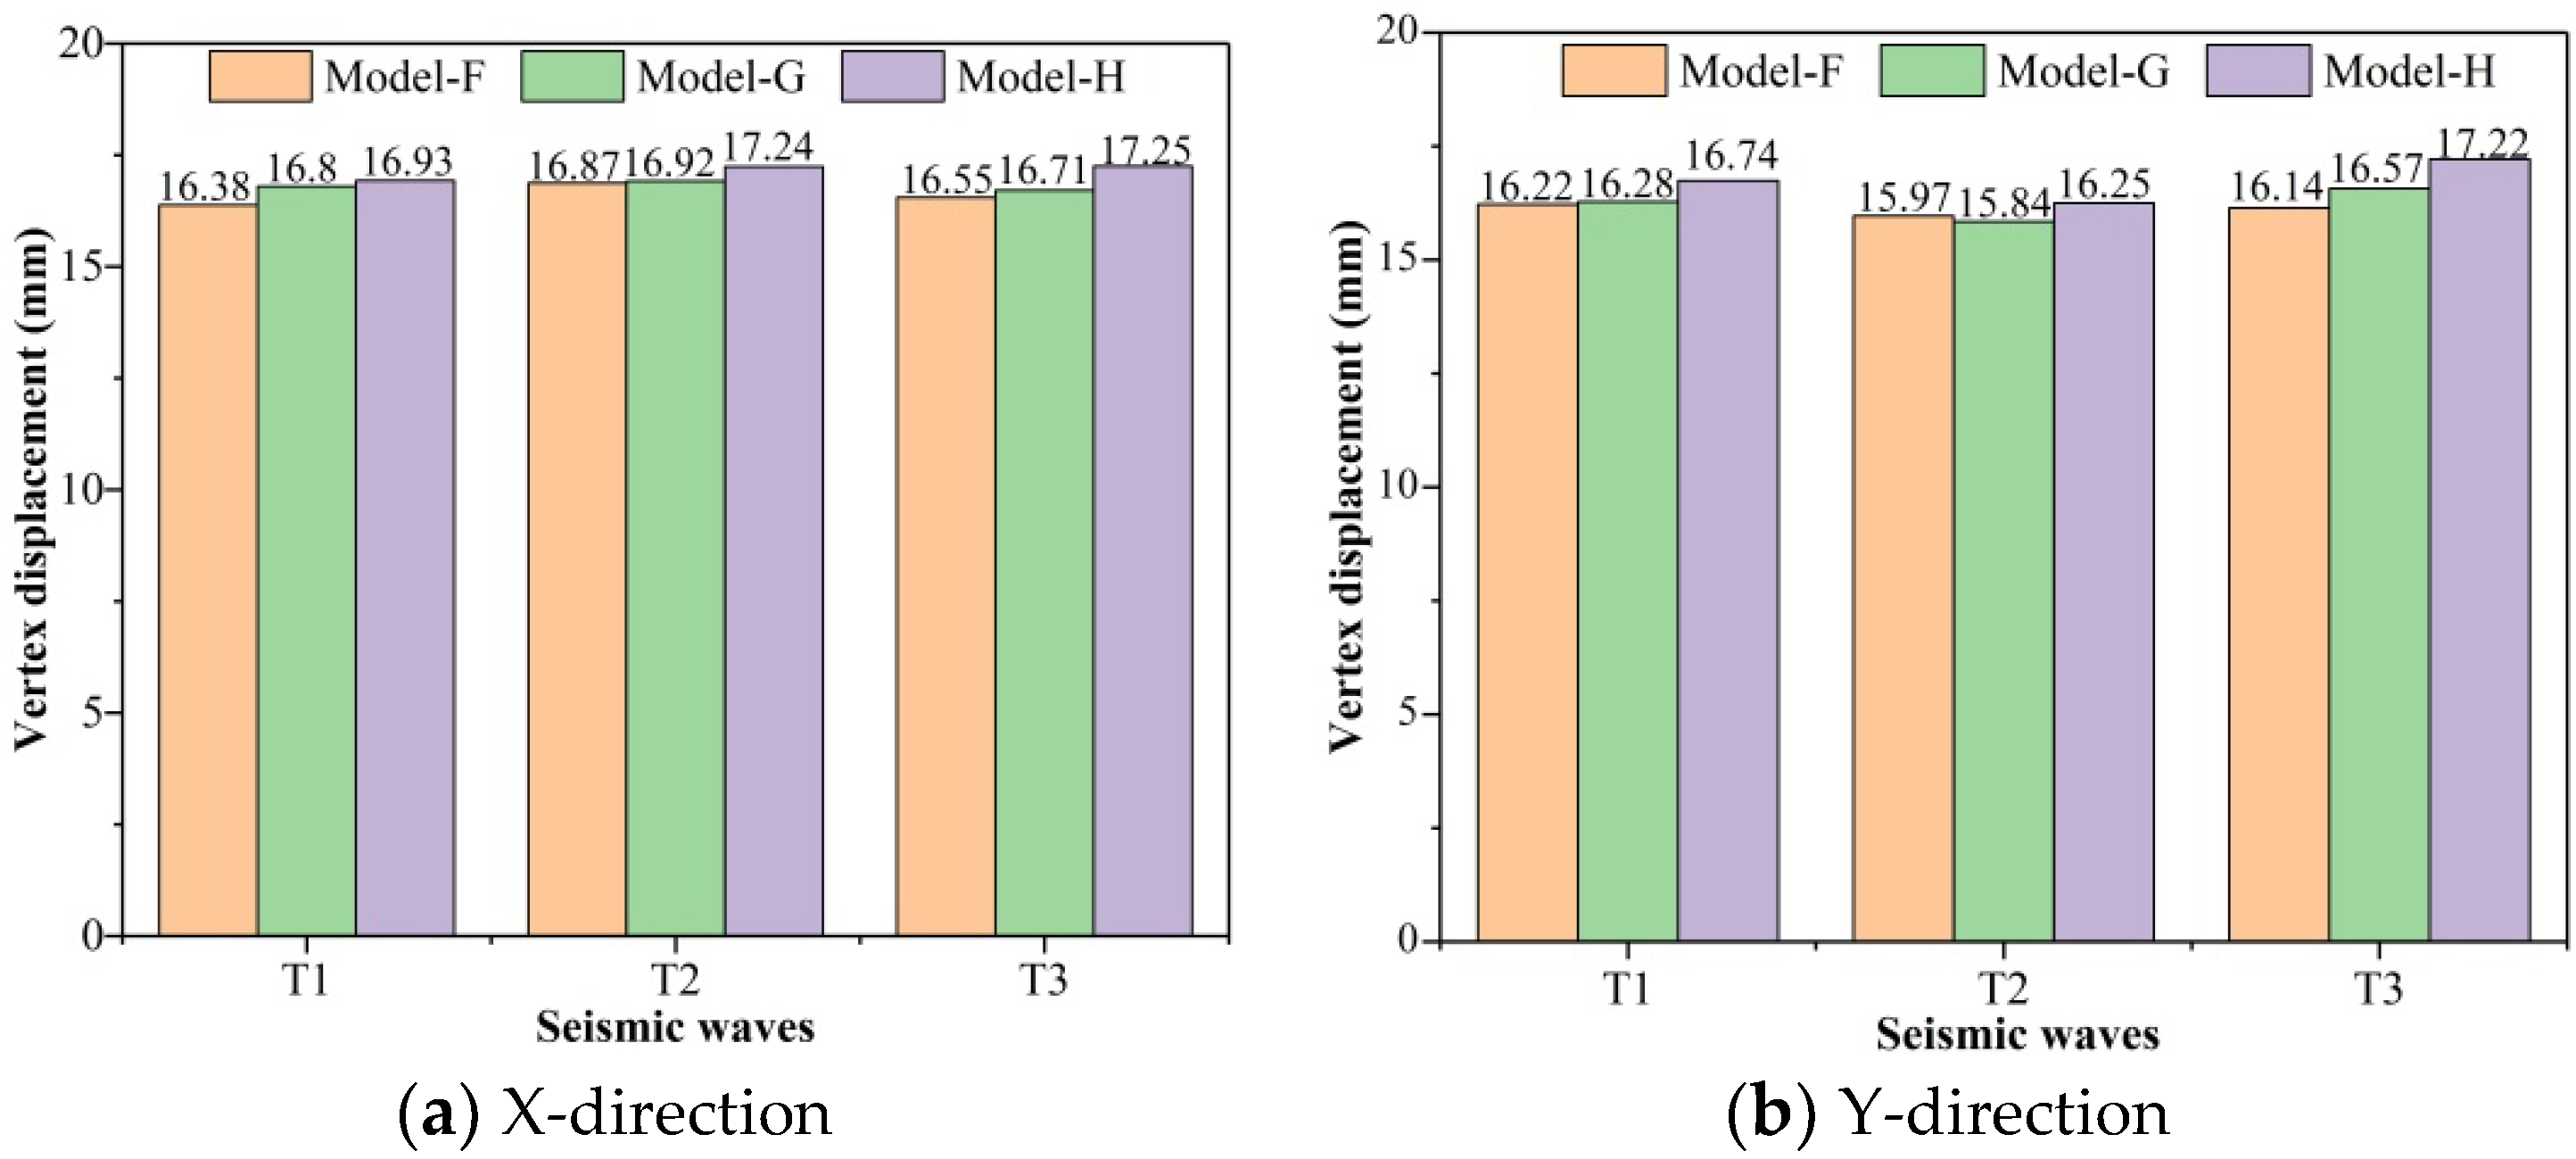
Maximum vertex displacement
The maximum vertex displacement and corresponding time of each model under the action of each seismic wave were sorted and counted as shown in
Table 10 and
Table 11. The comparison of vertex displacement of each model in the X- and Y-directions is shown in
Figure 15.
The maximum vertex displacements of the same model under the action of three seismic waves were not different, and can be arranged in order as T2 > T3 > T1. The seismic response of the same seismic wave on different structures was also different, and the trend of the three models was similar. Under the T2 seismic wave, the vertex displacement of model D was the largest among the three models, and the maximum in the Y-direction was 19.13 mm. Under the T3 seismic wave, the vertex displacement of model E was the smallest, and the minimum value was 14.26 mm in the X-direction. The results show that the fixed connection can effectively reduce the maximum vertex displacement of the structure and increase the structural integrity.
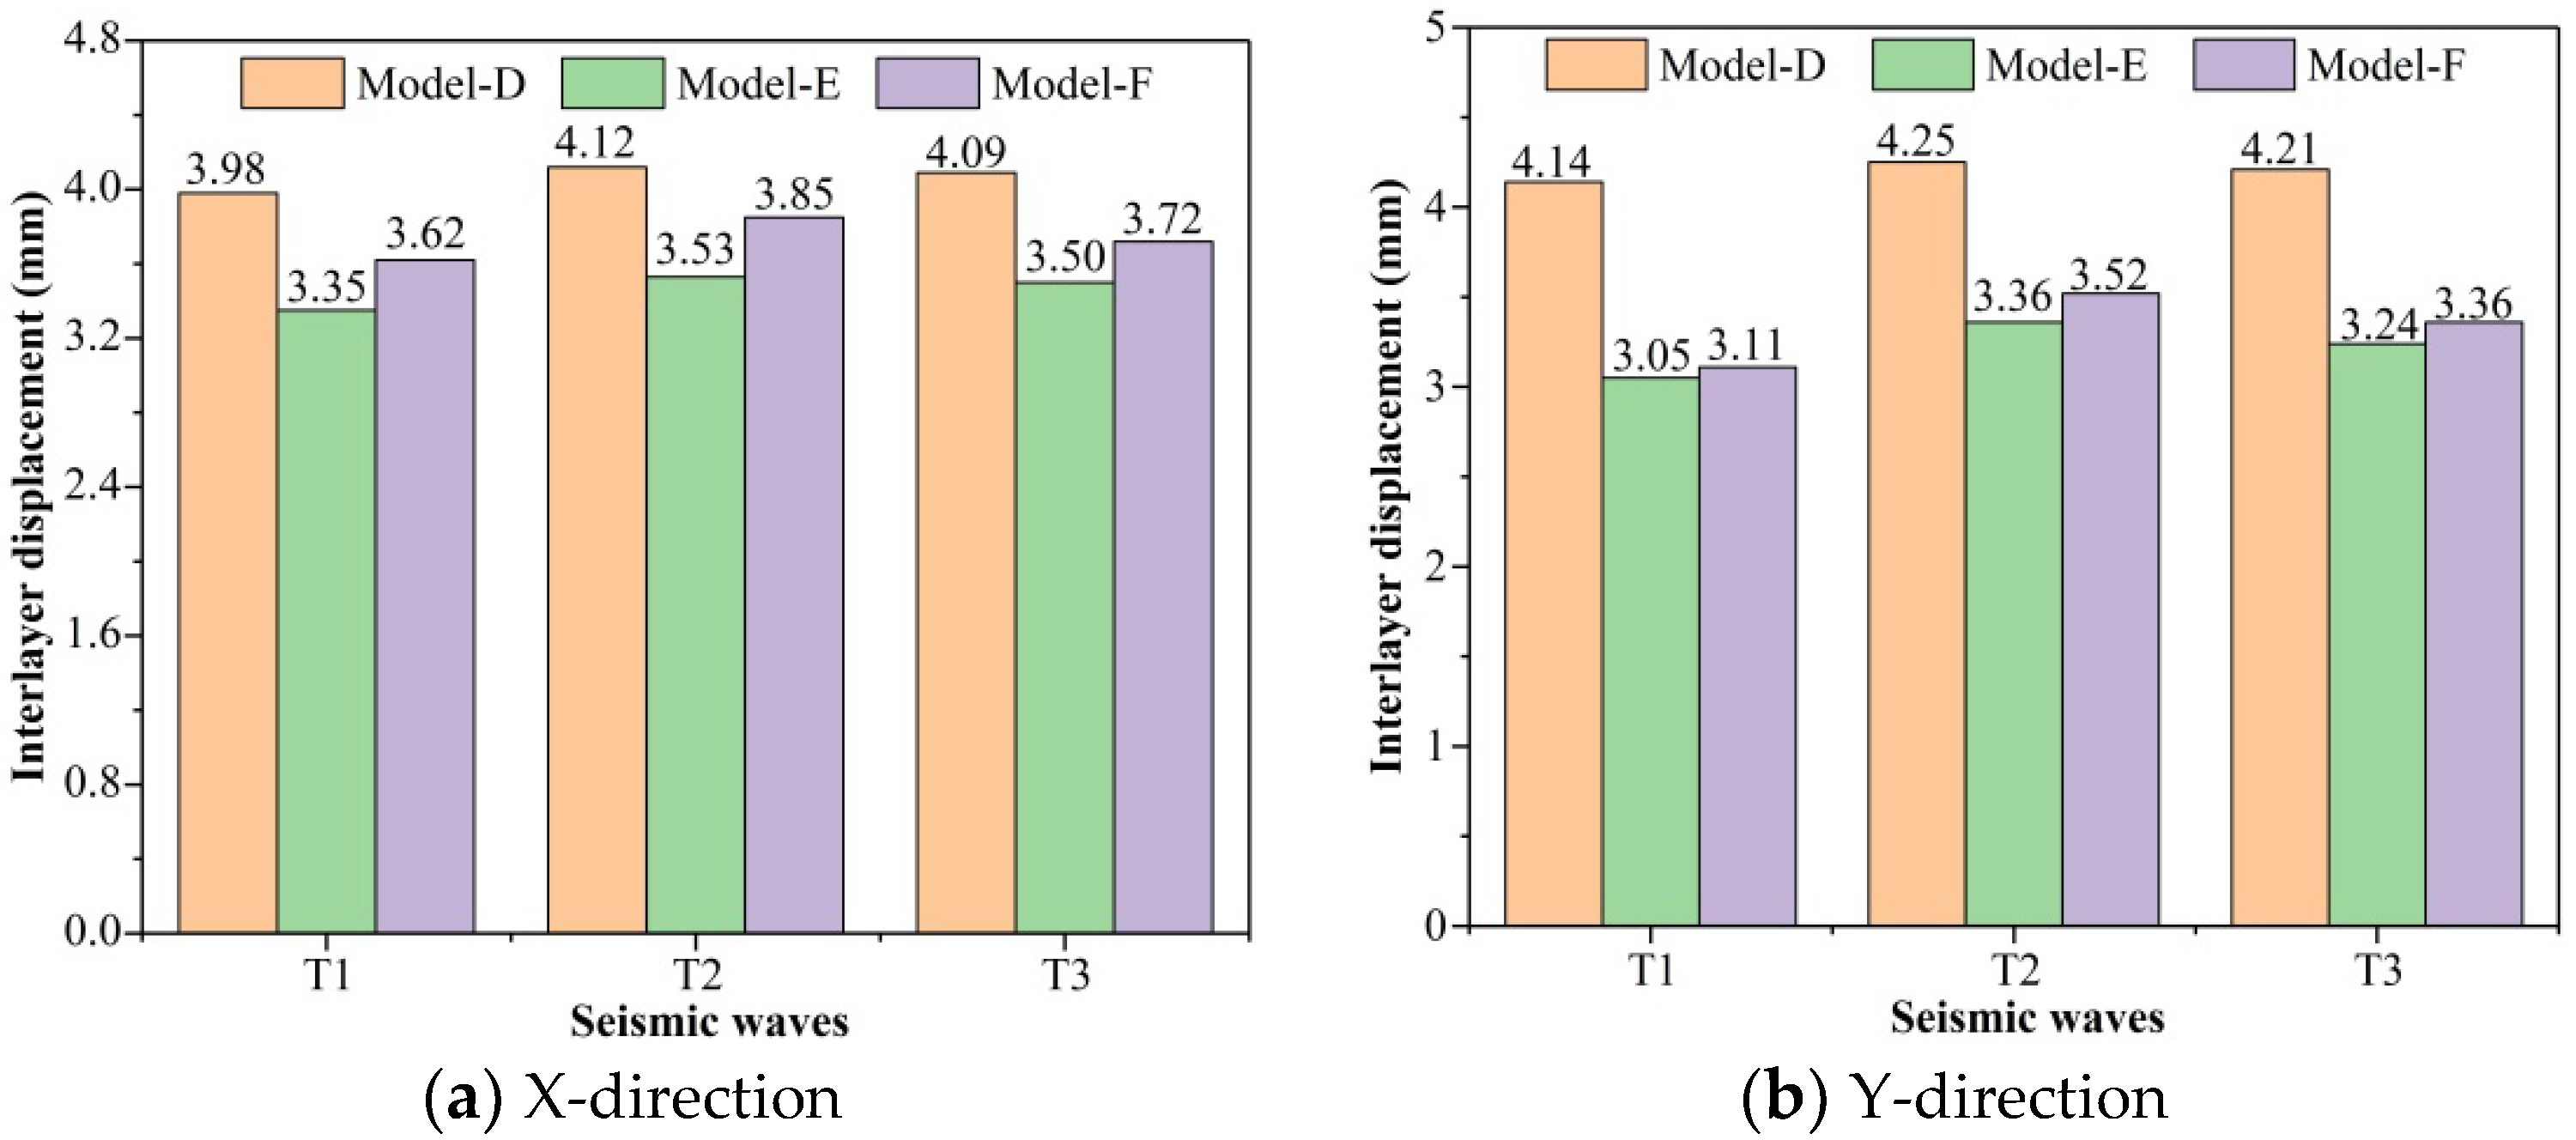
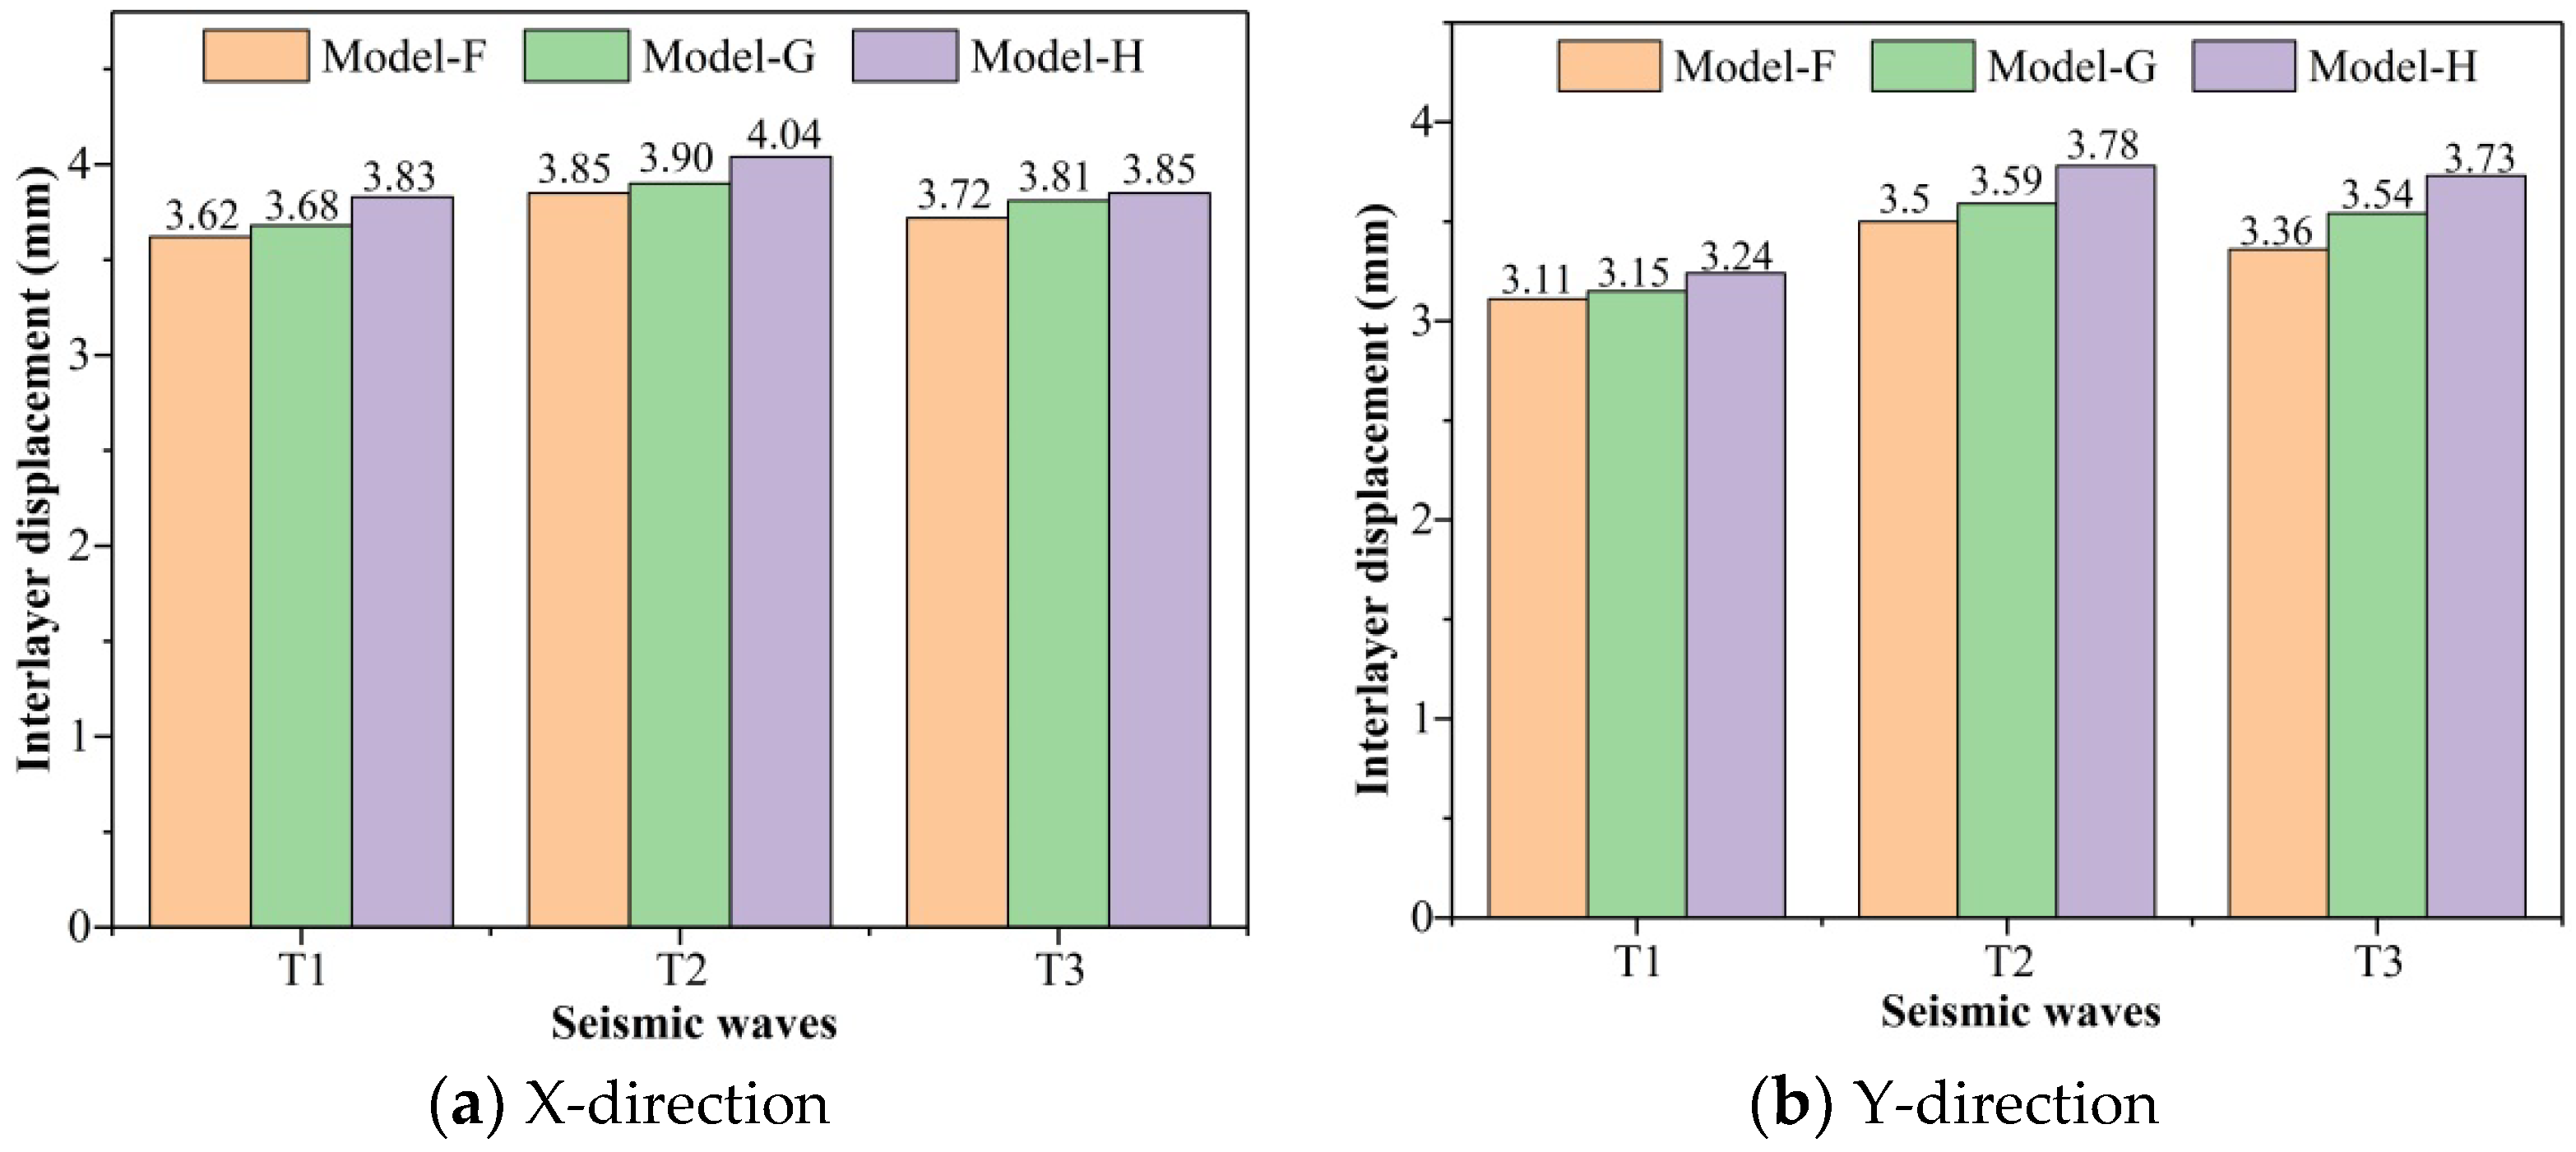
- (3)
Maximum interlayer displacement
The maximum interlayer displacement and corresponding time of each model under the action of each seismic wave are listed in
Table 12 and
Table 13. The comparison of the maximum interlayer displacement of each model in the X- and Y-directions is shown in
Figure 16.
Under the action of each seismic wave, the maximum interlayer displacement in the X- and Y-directions of the three models was close to the results obtained by the response spectrum analysis, and the difference was less than 10%. On the whole, the results are consistent with the response spectrum analysis, which verifies the reliability of the time history analysis method and can act as a reference for structural seismic performance analysis. The displacement of the T3 wave was closer to the results of response spectrum analysis than the other two waves. The maximum interlayer displacement of different structures appeared at different times under the same seismic wave, so it is necessary to select the appropriate seismic wave according to the actual situation of the building site to obtain more accurate data.


