Article

Estimation of Energy Profile and Possible Energy Savings of Unclassified Buildings

by
Aleksandrs Geikins
,
Anatolijs Borodinecs
* and
Vladislavs Jacnevs
Department of Heat Engineering and Technology, Riga Technical University, Kipsalas Street 6, LV-1048 Riga, Latvia
*
Author to whom correspondence should be addressed.
Buildings 2022, 12(7), 974; https://doi.org/10.3390/buildings12070974
Submission received: 9 June 2022 / Revised: 27 June 2022 / Accepted: 4 July 2022 / Published: 8 July 2022
(This article belongs to the Topic Building Energy Efficiency)

Abstract

:
In the European Union, only 1% of the building stock is renovated every year. According to the EU strategy, around 75% of the existing building stock needs to be renovated by 2050. Energy efficiency programs mainly support residential and public building stocks; this article considers military dormitories as a type of unclassified building. It is very important to improve energy efficiency to reduce energy consumption and improve the microclimate in these buildings, since the staff is there 24/7. This paper analyzes the energy consumption and measures the indoor air quality in 13 nonrenovated military dormitories. The personnel in unclassified buildings have limited options for remote work in the case of COVID-19 outbreak. Thus, the retrofitting and maintenance of such buildings must be planned carefully. There is a significant lack of IAQ measurements in unclassified buildings. This study presents a wide analysis of energy consumption, indoor air parameters, and occupant satisfaction. On the basis of real data, four retrofitting scenarios were evaluated in IDA ICE dynamic simulation software. The simulation results showed that, in the case of a deep renovation scenario, the theoretical energy savings could be 77.6–79.3% of the used energy. This paper discusses the solar energy potential of onsite energy production for increasing the efficiency and energy supply resilience of unclassified buildings. The results of this study can be applied to other countries with climate conditions similar to Latvia.

1. Introduction

According to the International Energy Agency (IEA) data, the total final energy consumption in the world by the building sector was unchanged in 2019 (compared to 2018), accounting for about 35–40% [1]; however, CO2 emissions from buildings comprise about 28% of total global energy-related CO2 emissions [2]. COVID-19 restrictions have increased the electricity consumption of residential buildings by 40% as millions of people are now circumscribed to their homes [3]. In recent years, there has been a desire for the population to use more energy-efficient household and office appliances and lead a “greener” lifestyle, which, in the long term, can lead to a decrease in electricity consumption in the building sector [4,5]. However, presently, buildings consume more than 55% of the world’s electricity [6] Of course, many studies have focused on the effects of COVID-19 on energy consumption and CO2 reduction [7,8,9,10]. In general, the global energy consumption and global CO2 emissions were about 3.8% and 5% lower, respectively, in Q1 of 2020, relative to Q1 of 2019 [11], but this depended entirely on the effects of closing industries and companies (especially in the service sector) during the pandemic economic turmoil, as well as travel restrictions and lockdown measures. However, we must remember the time after the pandemic, because the impact on energy consumption and CO2 emissions due to COVID-19 is a temporary effect; thus, there will be an urgent need to rebalance the economic recovery, limit CO2 emissions, and achieve carbon neutrality goals in the post-COVID-19 era [12].
Retrofitting of the existing building stock is considered as one of the key priorities to improve energy efficiency around the world. According to the European Commission, in 2021, around 35% of EU buildings were over 50 years old and almost 75% of the building stock was inefficient [13]. The high energy consumption of buildings is largely associated with energy losses and gains from the building envelope. On average, less than 1% of building stock in the EU is renovated each year, with national rates ranging from 0.4% to 1.2% and the rate of deep renovation in the EU ranging from 0.2% to 0.3% [14,15,16]. To remedy this, EU Member States have developed long-term renovation strategies to renovate about 75% of the existing building stock to near-zero-energy buildings (NZEB) by 2050 [17].
Energy efficiency promotion programs mostly support residential and public building stocks, but there are no support programs for specific nonresidential buildings such as military structures (barracks), police departments, prison facilities, and fire stations [18].
However, due to the recent advent of stricter local building regulations, common EU directives, influx of EU funds, government programs on a national level, establishment of a state-owned development finance institution for state aid programs, etc., there has been a gradual increase in planned (and already commissioned) renovation projects in other building categories as well, including unclassified buildings.
According to the NATO Secretary General’s Annual Report 2019 [19], energy monitoring and camp simulation for energy efficiency are modern-day challenges in overall energy security. According to data provided by NATO, innovative storage solutions save up to 50–80% of regular fuel. The NATO Secretary General’s Annual Report 2020 mentioned that work has continued to strengthen the energy effectiveness in the military to reduce the dependency on fossil fuels, ease the logistical burden, and reduce emissions [20]. In addition, extra oil expenditure [21] causes rapid penetration of renewable energy sources in military buildings and campuses. A complex approach to the retrofitting of military buildings allowed reducing energy consumption by 75% in all climates [22]. This sector may include not only specific military and police buildings but also relevant buildings such as museums and training facilities [23,24].
Unclassified buildings make up about 1% of the total building stock, and even such a small share should be taken into account in terms of energy efficiency, because these buildings are typically occupied 24/7 and use up to five times more energy than a typical apartment building per 1 m2 [25]. Even during the COVID-19 pandemic, they were typically occupied in contrast to, for example, office buildings. The COVID-19 pandemic has also created new priorities; for example, the quality of the indoor environment has gained more weight at the expense of energy consumption, with new ventilation systems in demand [26]. Retrofitting of unclassified type of buildings can reduce energy consumption, as well as improve indoor microclimate and air quality, which is very important for occupants [25]. However, the energy profiles and energy balance of unclassified buildings have not been sufficiently investigated. Thus, the lack of precise input data can lead to non-price-based energy audits and incorrect estimation of energy savings.
Many examples of studies estimating the energy consumption of different building types used the IDA Indoor Climate and Energy (IDA ICE) dynamic simulation program [27,28,29,30]. This study provides initial data on energy simulation and IAQ in military dormitories. However, advanced indoor air pollutant distribution was not taken into consideration. For military garages or temporary tents heated with a diesel generator, the results of a previous study [31] should be considered for more detailed analysis of air distribution. However, wider application of renewable energy sources has also been observed for mobile off-grid tents [32,33,34,35,36]. Thus, special attention must be paid to sustainable retrofitting of the existing unclassified building stock with a deep focus on renewable energy and indoor air quality. Pioneering work was conducted in [37,38,39,40], providing key parameters and aspects to be taken into consideration during the development of sustainable retrofitting packages at both a building and a campus scale. This paper presents different dynamic energy simulation scenarios for evaluating the energy consumption in unclassified buildings (military dormitories). To develop the scenario, we used real thermal energy consumption data (measured and calculated) in unclassified buildings, taking into account indoor air quality measurements in dormitories. Considering that the occupants of unclassified buildings wear uniforms, the indoor microclimate significantly affects their level of satisfaction and productivity.

2. Materials and Methods

The research methodology incorporated the development of theoretical building prototype models. Models were developed on the basis of the typical layout of a military dormitory. It is necessary to perform thermal energy consumption calculations for the selected buildings, as each unclassified building subcategory may have different structural characteristics and requirements with regard to building design, materials, heat transfer coefficients, indoor comfort level, and other thermal parameters. Building prototype models were validated on the basis of real on-site measurements. Models were used to evaluate five simulated retrofitting scenarios. Dynamic simulations were performed in IDA ICE 4.8s software. Within the scope of this study, 13 military dormitories with a total area of about 49,400 m2 [41] were analyzed. Most of the analyzed buildings were constructed before the 1990s, and they feature a rather unsatisfactory thermal performance (poor thermal insulation, excessive air infiltration through the external envelope, heat loss through windows, thermal bridges, no heat recovery, etc.). In addition to the poor initial technical conditions, these unclassified buildings have not undergone proper energy retrofits or energy audits due to the data privacy and limited access to such buildings.
As there is no publicly available database containing construction data and performance characteristics of each individual unclassified building, thorough and detailed prototype models were developed to represent a typical military building (dormitory). Furthermore, these building prototype models were necessary to perform thermal energy consumption calculations for the selected buildings, as each unclassified building subcategory may have different structural characteristics and requirements with regard to building design, materials, heat transfer coefficients, indoor comfort level, and other thermal parameters. The standardized heat transfer coefficients of building construction elements largely define the thermal energy consumption of a building and, therefore, are at the base of the thermal energy consumption equation. These coefficients are defined by the Latvian Construction Standard LBN 002-19 “Thermotechnics of Building Envelopes” (Normative Values of Heat Transmittance Coefficients) [42].
The required annual thermal energy (kWh/m2) for the building prototype was calculated in accordance with Cabinet of Ministers Republic of Latvia Regulations no. 222 “Methods for calculating the energy performance of buildings and rules for energy certification of buildings” (8 April 2021) [43], which is referred to in LBN 002-19. The annual thermal energy consumption (kWh) across the given timeline for each building category (residential, public, or industrial) is determined by calculating specific thermal energy consumption (kWh/m2) and compiling data on the floor area of the respective building stock (m2). Thus, the annual thermal energy demand for a prototype building (kWh/m2) can be determined using the equation below [43,44].
E a n n u a l = Σ U i A i + Σ ψ j l j + Σ χ k + V a i r c 24 D h e a t T i n T o u t 1000 A b η Q i n + Q s o l ,
where Ui is the heat transfer coefficient of the building construction element (W/(m2∙K)), Ai is the area of the respective construction element of the building prototype model (m2), Ψj is the heat transfer coefficient of the linear thermal bridge (W/(m∙K)), lj is the length of the linear thermal bridge (m), χk is the heat transfer coefficient of the point thermal bridge (W/m∙K), Vair is the ventilation air volumetric flowrate (m3/h), c is the air heat capacity per volume (= 0.34 Wh/(m3 × oK)), Dheat is the number of heating days, Tin is the average set-point temperature in the assessment (heating or cooling) period (°C), Tout is the average external temperature in the calculation period (°C), Ab is the total floor area of the building (m2), η is the gain use coefficient for heating in accordance with Regulation or Standard LVS EN ISO 52016-1:2017 [45], Qint is the interior gain of the whole building in the assessment period t (Wh), and Qsol is the solar heat gain of the whole building in the assessment period t (Wh).
Q s o l = Σ A s o l E s o l 1000 A b ,
where Asol is the area used for collecting useful solar energy of the building (m2), Esol is the solar irradiation in the assessment period t per area Asol (Wh/m2).
The indoor air quality was measured by EXTECH SD800. The measurement ranges and respective accuracies were as follows: CO2—0 to 4000 ppm (±40 ppm for <1000 ppm and ±5% for >1000 ppm); temperature—−0 °C to 50 °C (±0.8 °C); humidity—10% to 90% RH (±4% RH). The outdoor CO2 concentration measured during the study was 480 ppm.

3. Results

3.1. Data on Real Thermal Energy Consumption in Unclassified Buildings

According to publicly available data obtained from the Ministry of Economics of the Republic of Latvia, the average total annual energy consumption for military dormitories constructed before the 1990s is 212 kWh/m2. However, the combined thermal energy consumption (for space heating and hot water use) in some of the analyzed unclassified buildings may even exceed 270 kWh/m2, which is a clear indicator of low thermal energy performance.
These data cover all types of military dormitories. During the period before the year 1945, 15% (total area 4775 m2), from 1945 to 1970, 23% (12,151 m2), and, from 1971 to 1990, 54% (26,617 m2) of buildings served as national defense military facilities, in contrast to 8% (5884 m2) since 1991 (see Figure 1).
To compare the actual energy consumption versus theoretical energy consumption, energy auditing and measurements were conducted in the same set of military dormitories through the period 9 July 2015 to 1 July 2021. The average energy consumption was reduced in line with the building construction date, indicating the gradual improvement in the implementation of better building thermal performance practices over time. Some of the buildings potentially underwent energy retrofits that eventually resulted in better thermal energy performance (Figure 2).
The total average measured annual energy consumption for military dormitories was 270 kWh/m2, while the average calculated (theoretical) energy consumption for military dormitories was 186 kWh/m2 (~31% lower than measured). The theoretical data represent data from energy audits reports provided by third parties. This discrepancy clearly indicated the poor actual performance of the military dormitories with reference to the theoretically acceptable energy performance based on current building energy efficiency requirements. Another factor for the high degree of discrepancy between the actual (measured) and theoretical (calculated) energy consumption results is due to the probable deviation in the input values vs. actual values (hot water consumption, indoor temperature, supply air exchange rate, airtightness of the building envelope, etc.). Since the input data for unclassified buildings are not defined by local norms, energy auditors typically take into consideration simplified input data used for civil (residential and/or public) buildings, which may result in a high degree of mismatch between actual and theoretical performance.

3.2. Indoor Air Quality Measurements in Unclassified Dormitories

Surveys of unclassified building occupants in uniforms (see Figure 3) were conducted in this study and compared with data obtained from occupants of residential buildings. Unclassified building occupants are subjected to an indoor microclimate that can significantly affect their level of satisfaction and productivity due to uniforms. In order to monitor diurnal changes of various parameters (in this case, indoor air temperature, relative humidity, and CO2 concentration) and characterize the conditions of the indoor environment, a series of measurements were performed.
Under normal circumstances, the outfit of a soldier working indoors basically consists of level 1 underwear and utility fatigues, which have an approximate clothing factor (CLO) of 1.4 [46]. However, according to the same study, a cold uniform has a CLO of 4.20.
In the scope of the study, indoor air parameters such as temperature, relative humidity, and CO2 concentration were measured in 13 buildings. These buildings represent a typical layout and occupancy profile. The measurements were coupled with thermal comfort survey data and analysis for various types of premises, such as dormitories, working rooms, and study rooms. For example, the data for a room in a dormitory built before 1960 are shown in Figure 4 and Figure 5.
Similar measurements were performed for various types of premises, and the average data for all 13 military dormitories are summarized in Table 1.
The measured indoor air temperature ranged from 15.8 °C to 22.6 °C, with an average temperature of 20.6 °C, which is below the recommended range of 19 °C to 22 °C required for human thermal comfort.
Relative humidity varied from 17.3% to 53.7%, with an average of 33.6%, which is lower than the recommended value for human comfort. Increases in relative humidity were observed in the evening, night, and morning.
The CO2 concentration was within the normative values and did not exceed 1000 ppm. The low relative humidity, together with low CO2 values, indicates a high ventilation rate. Although this could be considered as a good indicator, knowing that there is no mechanical ventilation system installed suggests that all the ventilation is uncontrolled through the windows and cracks in the building envelope.
In order to compare the results of the measurements, a survey was conducted, in which 73 respondents of different ages and genders participated while at their workplace or performing daily service duties. The results of the survey are shown in Figure 6.
However, the selected approach differed from classic Fanger methodology; the survey results for the dormitory indoor comfort level showed that, in general, the people were not satisfied with the thermal comfort (they felt too cold). This, together with the fact that this room is meant for sleeping and that persons are not allowed to wear any pajamas, caused the dissatisfaction regarding thermal comfort. Therefore, it could be concluded that, for such rooms, the indoor temperature should be a little higher.
To test this, we used the thermal comfort tool developed by the University of California (Berkeley) [47]. It allows determining the compliance of indoor climate and clothing insulation with the requirements of ASHRAE 55-2020 and EN-16798 “Indoor environmental criteria”. In the case of a dormitory sleeping room, it can be seen that the optimal temperature would be about 22 °C.
The results of the measurements and the results of the survey showed that the surveyed unclassified building needs to be renovated/retrofitted in order to increase the comfort of the staff and improve the energy efficiency of the building, as very high energy losses were observed through the building’s envelope. It should be noted that the IAQ was measured using one sensor for each room. For practical long-term monitoring, it is recommended to use data from [48]. In this study, the constant monitoring system allowed selecting most optimal IAQ settings with respect to energy efficiency.

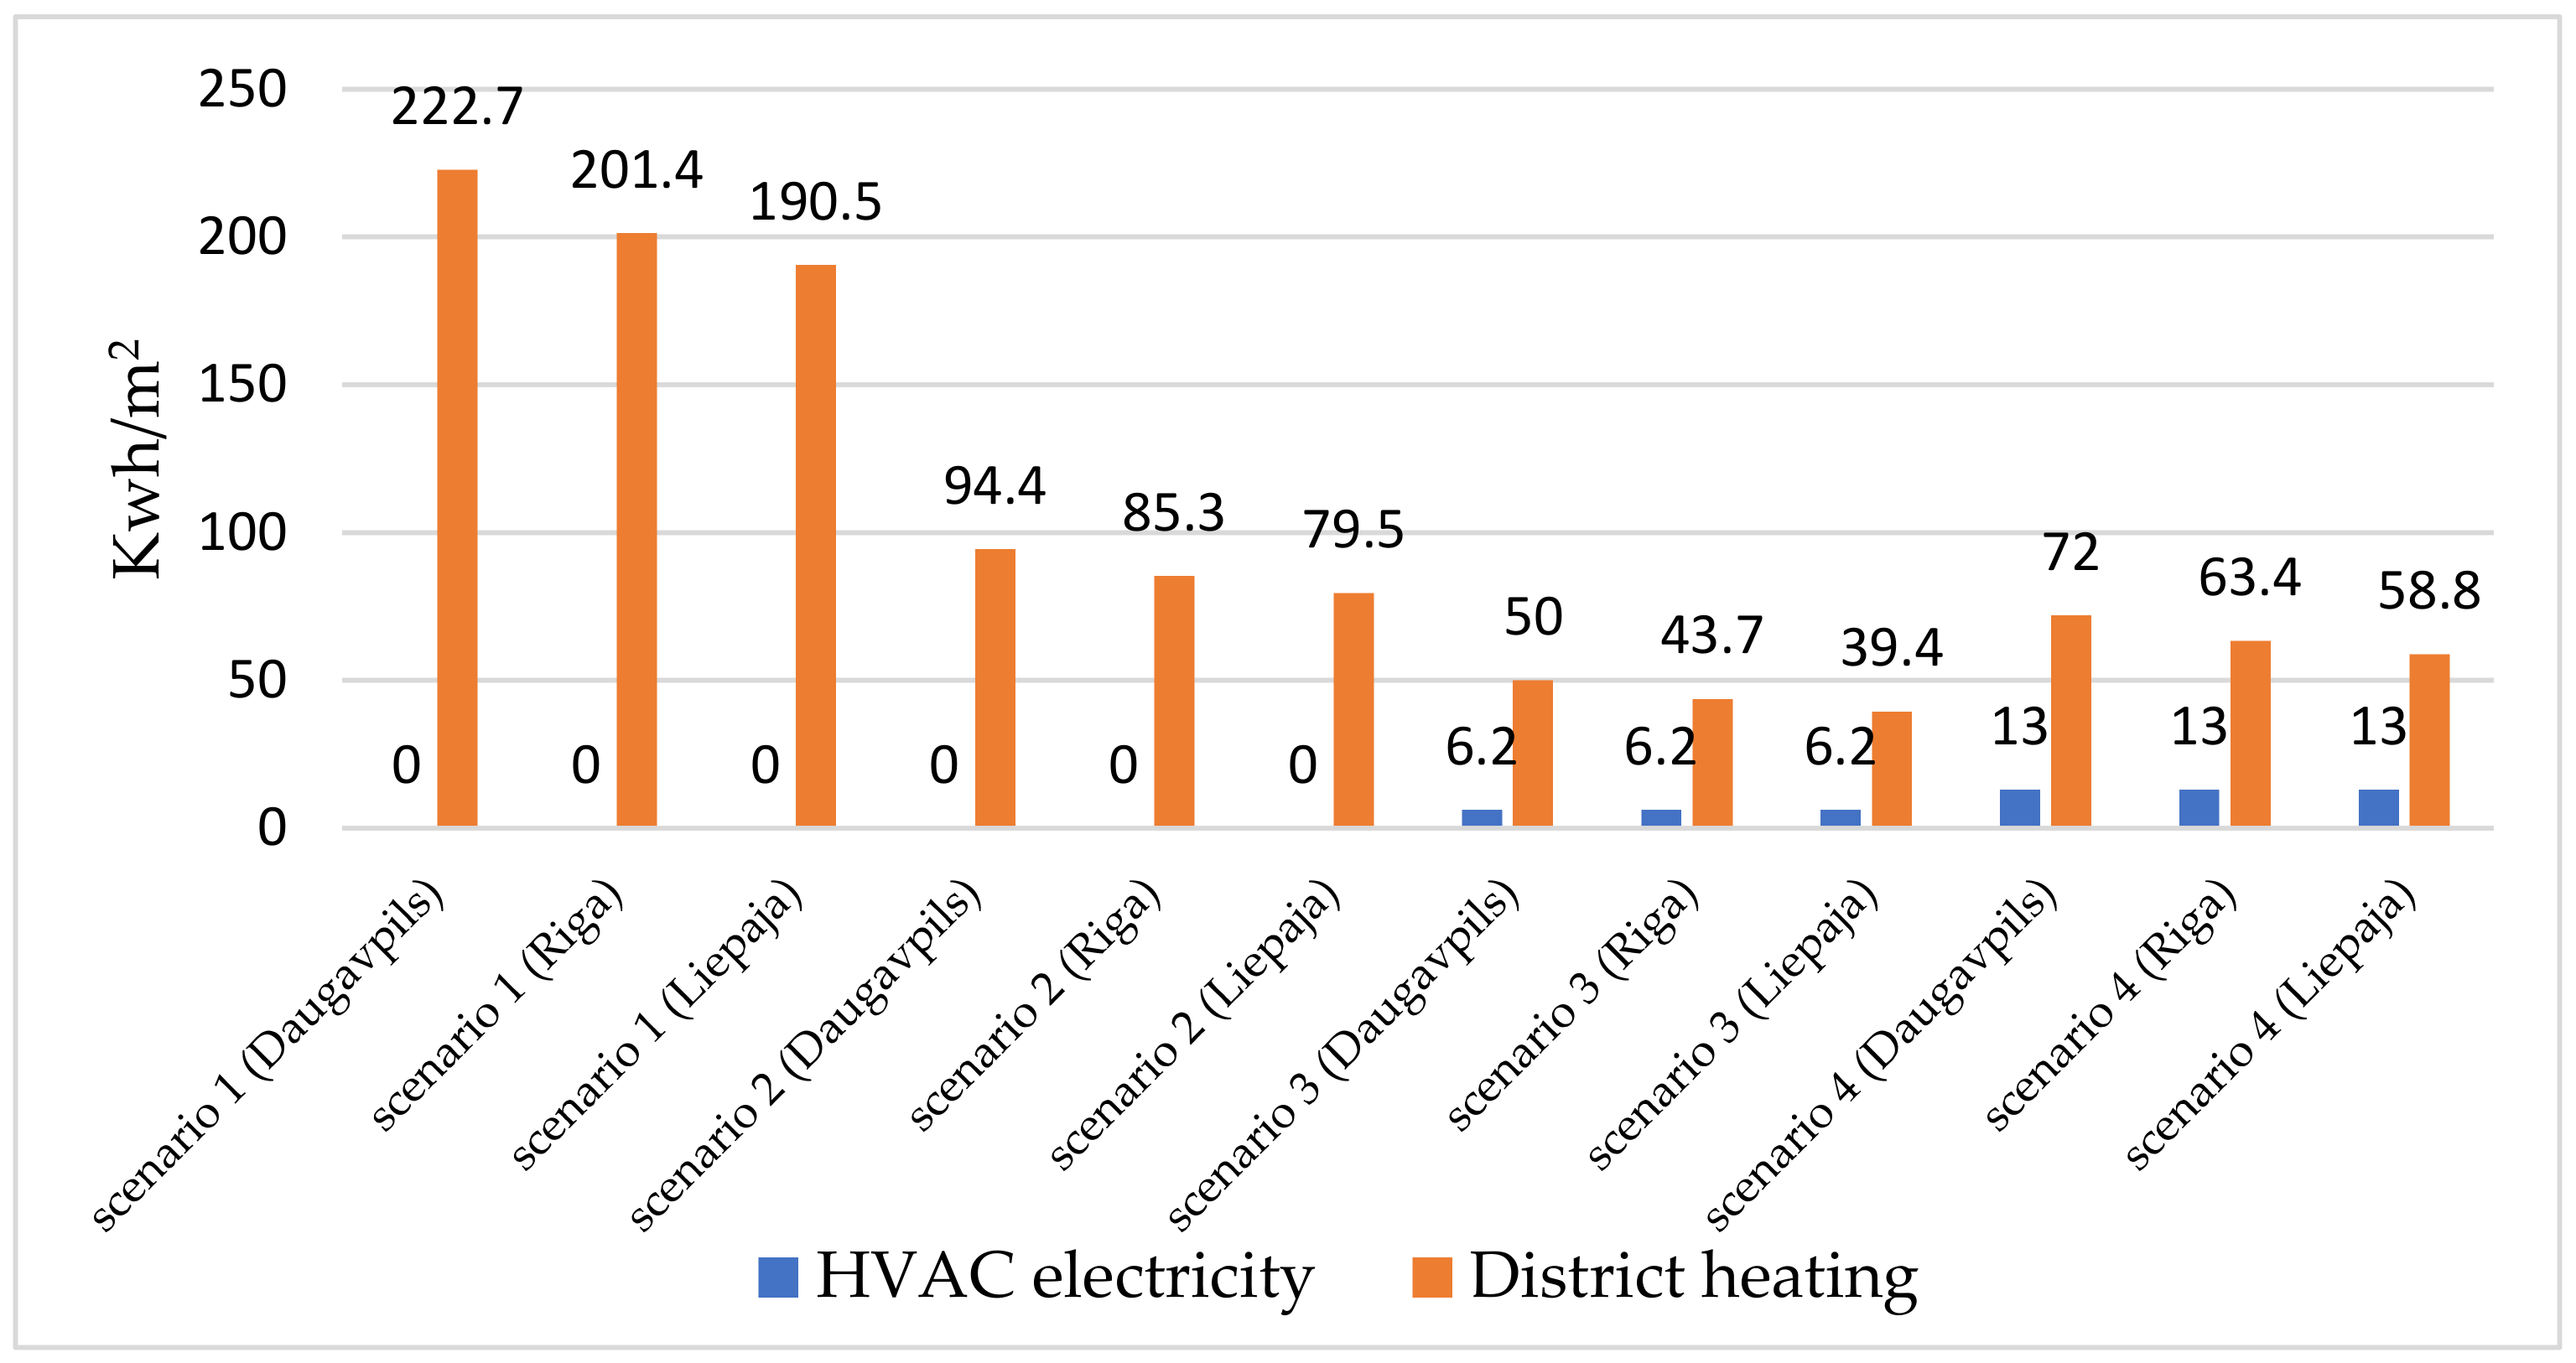
3.3. Theoretical Retrofitting Potential of Unclassified Dormitories

In this chapter, a theoretical estimation of energy consumption was performed for unclassified buildings (military dormitories) in Latvia with different renovation scenarios. The annual weather conditions in the dynamic simulation model were established using the climate file for three cities: Daugavpils (WMO: 265440), Riga (WMO: 264220), and Liepaja (WMO: 264060).
A single model of a building (see Figure 7) was used for all simulations, with a floor area of 618.0 m2 and volume of 1936.1 m3. The model’s envelope area was 1254.1 m2, 7.0% of which was window area. All zones had identical temperature set points of 21 °C as the minimum and 25 °C as the maximum.
For this simulation, it was assumed that there were four groups of zones—living room area, bathroom area, classrooms, and hallways/staircases with different occupancies and lighting schedules. All schedules followed a daily regime and were separated in two shifts (Figure 8).
Classrooms were occupied from Monday to Saturday from 9:30 a.m. to 6:00 p.m. with a 30 min break between 1:00 p.m. and 1:30 p.m. Living room areas were 100% occupied from 9:00 p.m. to 6:00 a.m. During the rest of the day, usage times of the classroom and the living room alternated between each other. The bathroom occupancy schedule was designed with three peaks from 6:00 a.m. to 8:00 a.m., from 12:00 p.m. to 1:00 p.m., and from 7:30 p.m. to 9:00 p.m. Hallways and staircases were assumed to be without occupants, and the lighting schedule was designed to always be on.
As a first step, a nonrenovated building with only window ventilation was analyzed (scenario 1). The next simulation represented a situation where the energy efficiency of the thermal envelope was improved (scenario 2). The third simulation added mechanical ventilation together with heat recovery (scenario 3). The final setup included better ventilation in living areas (scenario 4). Table 2 shows descriptions of the retrofitting scenarios and their results. It was not possible to precisely evaluate the initial nonrenovated scenario due to data restrictions and some measurement uncertainties.
The summarized simulation data are presented in Figure 9.
It is obvious that, when the dormitory was located in a milder and maritime climate, it positively affected the amount of required energy for the heating of the building. This circumstance helped to save 14.5% (scenario 1) to 21.2% (scenario 3) of energy depending on the considered scenario.
When considering a building with enclosing structures characterized by high U-values, it was possible to achieve a reduction in energy consumption by up to two-thirds of the initial amount (scenario 2).
When the new parameters after complete retrofitting works were applied (scenario 3), the heating energy usage dropped dramatically. This allowed saving 77.6–79.3% of the used energy (which gave the best result). Of course, this scenario represented an ideal situation, with perfect renovation and occupants always acting according to predefined schedules; however, other conditions completely matched current conditions, in addition to taking into account the 6.2 kWh/m2 of electricity needed to maintain the operation of mechanical ventilation. Despite this additional consumption, the positive effect of this improvement was evident.
Commenting on scenario 4, a more than twofold increase in energy consumption can be noted for both heating and HVAC electricity in each location (in comparison with scenario 3), along with 67.7% to 69.1% less consumption for heating purposes compared to scenario 1.

4. Potential of Onsite Energy Production for Increasing Unclassified Building Efficiency

For increasing the energy efficiency of unclassified buildings and achieving the goals set by EC, scenarios for the production of energy on site using renewable energy sources (solar collectors and panels) are considered.
In the first case, solar collectors are used for heat and heat water production. A real building built before 1970 was used; a military dormitory was modeled (see Figure 10) and simulated, using the parameters given in Table 3. Considering that this was a campus and each building was differently oriented, various simulations were performed, with placement of solar collectors on different sides of the sky (Figure 11). This study was performed to determine the best performance of solar collectors.
Initial conditions of solar collectors and solar voltaic are shown in Table 4 and Table 5.
In the second case, PV panels were used for electricity generation. All building parameters were similar to the first case. Electricity produced during the year for typical roof is shown in Figure 12.
On the basis of previous studies carried out in Latvia, it can be concluded that the use of solar energy is possible, with good results obtained in Latvian climate conditions in various areas of the national economy [49,50,51,52].
Integration of solar energy into the energy systems of unclassified buildings during renovation/retrofitting makes a good contribution to achieving the intended goals for conversion of the existing building stock to NZEBs.

5. Discussion

According to the Revision of the Energy Performance of Buildings Directive (EPBD) in 2021 [53], Member States are required to plan policies and measures to phase out fossil fuels in buildings by 2040. The revision of the EPBD also provides better visibility for the integration of renewable energy into energy performance certificates (EPCs). The new EPC template requires a clear indication of how much renewable energy production is compared to the building’s needs and how much it improves the building’s overall emissions.
Unclassified buildings and especially military buildings have a completely different energy profile compared to apartment and office buildings. The main factors which directly affect the energy consumption and operation of HVAC systems are the high-energy peak loads, workers’ dress code, limited access for detailed energy audits, less reliable data on energy consumption due to data protection, and limited options to place a IAQ sensors in desired locations.

6. Conclusions

In the scope of this study, an analysis of indoor air quality and energy consumption for Latvian military dormitories was performed. Latvia represents a cold climate with an average of 3900–4200 heating degree days.
According to the extensive analysis of calculated and measured data of the energy consumption for 13 nonrenovated military dormitories, it was concluded that the total average measured annual energy consumption was 270 kWh/m2, while the average calculated energy consumption for military dormitories was 186 kWh/m2. This shows that buildings do not have a proper building management system, and that there is a low energy awareness of occupants.
In the scope of this study, the indoor air quality measurements were performed in 13 nonrenovated military dormitories. Analysis of the obtained data showed an average indoor air temperature of 20.6 °C, average relative humidity of 33.6%, and CO2 concentration of 588 ppm. It can be concluded, knowing that there is no mechanical ventilation system installed, that uncontrolled air infiltration occurs through the nonrenovated building envelope. Hence, additional heating load is used to maintain comfortable internal conditions inside buildings. The relatively low CO2 concentration can be explained by very short peak loads in separate rooms due to the brief presence of occupants.
Dynamic simulations help to evaluate different renovation scenarios for buildings with different uses, where standardized solutions may not decrease energy consumption to the extent shown by calculations. On the basis of the simulation results, the theoretical energy savings were calculated for four scenarios. In the case of the deep renovation scenario, savings of 77.6–79.3% of the used energy were determined. The main saving potential can be achieved by more precise control of ventilation systems. However, the larger internal heat gains due to a higher occupancy density allow reaching better energy efficiency in comparison to regular office buildings. The extra energy efficiency can be achieved by installation of renewable energy systems. However, the maximal energy performance is limited by the orientation of existing buildings. A typical south-oriented roof receives solar radiation during the year of up to 350 MWh on the active surface of the collectors, which can be shared with buildings with less efficient orientation.

Author Contributions

Conceptualization, A.G. and A.B.; methodology, A.B.; software, V.J.; validation, A.G. and A.B.; formal analysis, A.G.; investigation, A.G. and A.B.; resources, A.B.; data curation, A.B.; writing—original draft preparation, A.G.; writing—review and editing, A.B.; visualization, V.J.; supervision, A.B. All authors read and agreed to the published version of the manuscript.

Funding

This work was supported by the European Social Fund within the Project No 8.2.2.0/20/I/008 “Strengthening of Ph.D. students and academic personnel of Riga Technical University and BA School of Business and Finance in the strategic fields of specialization” of the Specific Objective 8.2.2 “To strengthen academic staff of higher-education institutions in strategic specialization areas” of the Operational Program “Growth and Employment”.

Institutional Review Board Statement

Not applicable.

Informed Consent Statement

Not applicable.

Data Availability Statement

Not applicable.

Conflicts of Interest

The authors declare no conflict of interest.

References

  1. Ascione, F.; De Masi, R.F.; Mastellone, M.; Vanoli, G.P. Building rating systems: A novel review about capabilities, current limits and open issues. Sustain. Cities Soc. 2022, 76, 103498. [Google Scholar] [CrossRef]
  2. UNEP. 2020 Global Status Report for Buildings and Construction: Towards a Zero-Emission, Efficient and Resilient Buildings and Construction; United Nations Environment Programme: Nairobi, Kenya, 2020; Available online: https://wedocs.unep.org/20.500.11822/34572 (accessed on 5 June 2022).
  3. Broom, D. These 3 Charts Show What COVID-19 Has Done to Global Energy Demand. The World Economic Forum, 3 August 2020. Available online: https://www.weforum.org/agenda/2020/08/covid19-change-energy-electricity-use-lockdowns-falling-demand/(accessed on 25 January 2022).
  4. Lebedeva, K.; Borodinecs, A.; Krumins, A.; Tamane, A.; Dzelzitis, E. Potential of End-User Electricity Peak Load Shift in Latvia. Latv. J. Phys. Tech. Sci. 2021, 58, 32–44. [Google Scholar] [CrossRef]
  5. Millers, R.; Korjakins, A.; Lešinskis, A.; Borodinecs, A. Cooling Panel with Integrated PCM Layer: A Verified Simulation Study. Energies 2020, 13, 5715. [Google Scholar] [CrossRef]
  6. IEA. The Critical Role of Buildings; IEAr: Paris, France, 2019; Available online: https://iea.blob.core.windows.net/assets/026bff1b-821d-48bc-8a0e-7c10280c62bc/Perspectives_for_the_Clean_Energy_Transition_2019.pdf (accessed on 5 June 2022).
  7. Jiang, P.; Van Fan, Y.; Klemeš, J.J. Impacts of COVID-19 on energy demand and consumption: Challenges, lessons and emerging opportunities. Appl. Energy 2021, 285, 116441. [Google Scholar] [CrossRef]
  8. Andreoni, V. Estimating the European CO2 emissions change due to COVID-19 restrictions. Sci. Total Environ. 2021, 769, 145115. [Google Scholar] [CrossRef]
  9. Alava, J.J.; Singh, G.G. Changing air pollution and CO2 emissions during the COVID-19 pandemic: Lesson learned and future equity concerns of post-COVID recovery. Environ. Sci. Policy 2022, 130, 1–8. [Google Scholar] [CrossRef]
  10. Aktar, M.A.; Alam, M.; Al-Amin, A.Q. Global economic crisis, energy use, CO2 emissions, and policy roadmap amid COVID-19. Sustain. Prod. Consum. 2021, 26, 770–781. [Google Scholar] [CrossRef]
  11. World Nuclear News. IEA Charts COVID-19 Decline in Global Energy Demand and Emissions. World Nuclear News, 30 April 2020. Available online: https://www.world-nuclear-news.org/Articles/Global-energy-demand-and-emissions-impacted-by-COV(accessed on 25 January 2022).
  12. Yang, C.; Hao, Y.; Irfan, M. Energy consumption structural adjustment and carbon neutrality in the post-COVID-19 era. Struct. Chang. Econ. Dyn. 2021, 59, 442–453. [Google Scholar] [CrossRef]
  13. European Commission. Energy Performance of Buildings Directive. 2021. Available online: https://energy.ec.europa.eu/topics/energy-efficiency/energy-efficient-buildings/energy-performance-buildings-directive_en (accessed on 5 June 2022).
  14. European Commission. In Focus: Energy Efficiency in Buildings. 2020. Available online: https://ec.europa.eu/info/news/focus-energy-efficiency-buildings-2020-lut-17 (accessed on 5 June 2022).
  15. Esser, A.; Dunne, A.; Meeusen, T.; Quaschning, S. Comprehensive Study of Building Energy Renovation Activities and the Uptake of Nearly Zero-Energy Buildings in the EU; European Commission: Brussels, Belgium, 2019. [Google Scholar]
  16. Dimdina, I.; Lešinskis, A.; Krumiņš, E.; Krumiņš, V.; Šnidere, L.; Zagorskis, V. Indoor air quality and energy efficiency in multi-apartment buildings before and after renovation: A case study of two buildings in Riga. In Proceedings of the Civil Engineering ’11—3rd International Scientific Conference, Jelgava, Latvia, 12–13 May 2011; pp. 236–242. Available online: https://ortus.rtu.lv/science/en/publications/13342 (accessed on 5 June 2022).
  17. Mikola, A.; Hamburg, A.; Kuusk, K.; Kalamees, T.; Voll, H.; Kurnitski, J. The impact of the technical requirements of the renovation grant on the ventilation and indoor air quality in apartment buildings. Build. Environ. 2022, 210, 108698. [Google Scholar] [CrossRef]
  18. Borodinecs, A.; Geikins, A.; Prozuments, A. Energy consumption and retrofitting potential of Latvian unclassified buildings. In Smart Innovation, Systems and Technologies; Springer: Singapore, 2020; Volume 163, pp. 319–326. [Google Scholar]
  19. NATO. Secretary General’s Annual Report 2019. 2020. Available online: https://www.nato.int/cps/en/natohq/topics_174399.htm (accessed on 5 June 2022).
  20. NATO. Secretary General’s Annual Report 2020. 2021. Available online: https://www.nato.int/nato_static_fl2014/assets/pdf/2021/3/pdf/sgar20-en.pdf (accessed on 5 June 2022).
  21. Wang, K.-H.; Su, C.-W.; Lobonţ, O.-R.; Umar, M. Whether crude oil dependence and CO2 emissions influence military expenditure in net oil importing countries? Energy Policy 2021, 153, 112281. [Google Scholar] [CrossRef]
  22. Katalenich, S.M.; Jacobson, M.Z. Renewable energy and energy storage to offset diesel generators at expeditionary contingency bases. J. Def. Model. Simul. 2021, 1–15. [Google Scholar] [CrossRef]
  23. Ristić, S.S.; Polić-Radovanović, S.R.; Jegdić, B.V.; Slavica, R.; Suzana, P.-R.; Bore, V.J. Investigation of the energy efficiency of the military museum building by infrared thermography. Vojnoteh. Glas. 2013, 61, 182–199. [Google Scholar] [CrossRef]
  24. Woody, A.; Latino, A.; Simihtis, P.M. Energy master planning toward net zero energy installation—U.S. Military Academy, West Point. ASHRAE Trans. 2015, 121, 141. [Google Scholar]
  25. Borodinecs, A.; Prozuments, A.; Zajacs, A.; Zemitis, J. Magazine of Civil Engineering Retrofitting of fire stations in cold climate regions. Mag. Civ. Eng. 2019, 90, 85–92. [Google Scholar] [CrossRef]
  26. Ascione, F.; De Masi, R.F.; Festa, V.; Gigante, A.; Ruggiero, S.; Vanoli, G.P. Hide details Thermal and energy performance of a nearly zero-energy building in Mediterranean climate: The gap between designed and monitored loads of space heating and cooling systems. Energy Sources Part A Recovery Util. Environ. Eff. 2022, 44, 732–747. [Google Scholar] [CrossRef]
  27. Amasyali, K.; El-Gohary, N. Hybrid approach for energy consumption prediction: Coupling data-driven and physical approaches. Energy Build. 2022, 259, 111758. [Google Scholar] [CrossRef]
  28. Millers, R.; Korjakins, A.; Lesinskis, A. Thermally Activated Concrete Slabs with Integrated PCM Materials. E3S Web Conf. 2019, 111, 01080. [Google Scholar] [CrossRef] [Green Version]
  29. Vujnović, N.; Dović, D. Cost-optimal energy performance calculations of a new nZEB hotel building using dynamic simulations and optimization algorithms. J. Build. Eng. 2021, 39, 102272. [Google Scholar] [CrossRef]
  30. Tuominen, P.; Holopainen, R.; Eskola, L.; Jokisalo, J.; Airaksinen, M. Calculation method and tool for assessing energy consumption in the building stock. Build. Environ. 2014, 75, 153–160. [Google Scholar] [CrossRef]
  31. Szczepanik-Scislo, N.; Scislo, L. Comparison of CFD and Multizone Modeling from Contaminant Migration from a Household Gas Furnace. Atmosphere 2021, 12, 79. [Google Scholar] [CrossRef]
  32. Lee, D.; Iacocca, M.; Joshi, Y. Energy usage modeling for heating and cooling of off-grid shelters. J. Build. Eng. 2021, 35, 102054. [Google Scholar] [CrossRef]
  33. Ii, P.; Estimation, A.D.L. Portable Solar Power: Mobile Elemental Power; 2015; pp. 1–6. [Google Scholar]
  34. US Navy testing mobile regenerative fuel cell/solar system. Fuel Cells Bull. 2013, 2013, 1–6. [CrossRef]
  35. McCulley, J.K. Portable solar power: Mobile elemental power plant II. In Proceedings of the 2015 IEEE Conference on Technologies for Sustainability (SusTech), Ogden, UT, USA, 30 July–1 August 2015. [Google Scholar] [CrossRef]
  36. Bogdanovics, R.; Borodinecs, A.; Zemitis, J.; Zajacs, A. Using a mobile modular energy unit with PV panels for heating. ASHRAE J. 2021, 63, 38–47. [Google Scholar]
  37. Berardi, U.; Tomassoni, E.; Khaled, K. A Smart Hybrid Energy System Grid for Energy Efficiency in Remote Areas for the Army. Energies 2020, 13, 2279. [Google Scholar] [CrossRef]
  38. Zhivov, A.; Liesen, R.J.; Richter, S.; Jank, R.; Underwood, D.M.; Neth, D.; Woody, A.; Björk, C. Energy performance optimization for Army installations. Build. Serv. Eng. Res. Technol. 2013, 34, 87–101. [Google Scholar] [CrossRef]
  39. Tulley, J.; Zhivov, A.; Clark, B. Deep energy retrofit of presidio army barracks. ASHRAE Trans. 2017, 123, 39–54. [Google Scholar]
  40. Zhivov, A.M.; Case, M.P. Toward net zero energy military installations. In NATO Science for Peace and Security Series C: Environmental Security; Springer: Dordrecht, The Netherlands, 2017. [Google Scholar] [CrossRef]
  41. The State Construction Control Bureau of Latvia. Buildings Owned, Managed and Used by the Government Institutions with Total Floor Area > 250 m2. 2021. Available online: https://www.bvkb.gov.lv/lv/media/1961/download (accessed on 5 June 2022).
  42. Cabinet of Ministers Republic of Latvia. Regulations Regarding the Latvian Construction Standard LBN 002-19, Thermotechnics of Building Envelopes; Cabinet of Ministers Republic of Latvia: Riga, Latvia, 2019. [Google Scholar]
  43. Cabinet of Ministers Republic of Latvia. Cabinet Regulation No. 222—Methods for Calculating the Energy Performance of Buildings and Rules for Energy Certification of Buildings; Cabinet of Ministers Republic of Latvia: Riga, Latvia, 2021. [Google Scholar]
  44. Cabinet of Ministers Republic of Latvia. Building Energy Efficiency Calculation Methods and Building Energy Certification Rules; Cabinet of Ministers Republic of Latvia: Riga, Latvia, 2021. [Google Scholar]
  45. LVS EN ISO 52016-1:2017; Energy Performance of Buildings—Energy Needs for Heating and Cooling, Internal Temperatures and Sensible and Latent Heat Loads—Part 1: Calculation Procedures. International Organization for Standardization: Geneva, Switzerland, 2017. Available online: https://www.iso.org/standard/65696.html (accessed on 5 June 2022).
  46. Goldman, R.F.; Kampmann, B. Handbook on Clothing—Biomedical Effects of Military Clothing and Equipment Systems; 2007; p. 321. Available online: http://www.environmental-ergonomics.org/Handbook%20on%20Clothing%20-%202nd%20Ed.pdf (accessed on 5 June 2022).
  47. Tartarini, F.; Schiavon, S.; Cheung, T.; Hoyt, T. CBE Thermal Comfort Tool: Online tool for thermal comfort calculations and visualizations. SoftwareX 2020, 12, 100563. [Google Scholar] [CrossRef]
  48. Scislo, L.; Szczepanik-Scislo, N. Air Quality Sensor Data Collection and Analytics with IoT for an Apartment with Mechanical Ventilation. In Proceedings of the 2021 11th IEEE International Conference on Intelligent Data Acquisition and Advanced Computing Systems: Technology and Applications (IDAACS), Cracow, Poland, 22–25 September 2021; Volume 2, pp. 932–936. [Google Scholar] [CrossRef]
  49. Shipkovs, P.; Lebedeva, K.; Migla, L.; Kashkarova, G. Renewable energy resources effective use for rural development. In Proceedings of the 15th International Scientific Conference on Engineering for Rural Development, Jelgava, Latvia, 25–27 May 2016; pp. 481–487. [Google Scholar]
  50. Lauka, D.; Pakere, I.; Blumberga, D. First solar power plant in Latvia. Analysis of operational data. Energy Procedia 2018, 147, 162–165. [Google Scholar] [CrossRef]
  51. Lebedeva, K.; Krumins, A.; Tamane, A.; Dzelzitis, E. Analysis of Latvian Households’ Potential Participation in the Energy Market as Prosumers. Clean Technol. 2021, 3, 437–449. [Google Scholar] [CrossRef]
  52. Attia, S.; Eleftheriou, P.; Xeni, F.; Morlot, R.; Ménézo, C.; Kostopoulos, V.; Betsi, M.; Kalaitzoglou, I.; Pagliano, L.; Cellura, M.; et al. Overview and future challenges of nearly zero energy buildings (nZEB) design in Southern Europe. Energy Build. 2017, 155, 439–458. [Google Scholar] [CrossRef]
  53. European Commission. Proposal for a Directive of the European Parliament and of the Council on the Energy Performance of Buildings (Recast); European Commission: Brussels, Belgium, 2021; 426; Available online: https://opac.oireachtas.ie/Data/Library3/Documents%20Laid/2021/pdf/DECCdocslaid230821_230821_115442.pdf (accessed on 5 June 2022).
Figure 1. National defense military dormitories.
Buildings 12 00974 g001
Figure 2. Calculated and measured annual energy consumption in analyzed military dormitories.
Buildings 12 00974 g002
Figure 3. Clothing of a soldier working indoors.
Buildings 12 00974 g003
Figure 4. Measurements of temperature and relative humidity for a dormitory room.
Buildings 12 00974 g004
Figure 5. Measurements of CO2 concentration for a dormitory room.
Buildings 12 00974 g005
Figure 6. Respondents’ satisfaction level with the indoor air humidity and indoor temperature.
Buildings 12 00974 g006
Figure 7. Building model.
Buildings 12 00974 g007
Figure 8. Designed schedules for occupancy and lighting: (a) living room area, (b) bathroom area, (c) classrooms, and (d) hallways/staircases.
Buildings 12 00974 g008
Figure 9. Comparison of energy consumption in different scenarios.
Buildings 12 00974 g009
Figure 10. Building model.
Buildings 12 00974 g010
Figure 11. Solar radiation on the active surface of the collectors during the year.
Buildings 12 00974 g011
Figure 12. Electricity produced during the year.
Buildings 12 00974 g012
Table 1. Average measurement data of indoor air parameters.
Indoor
Temperature (t, °C)
Relative
Humidity (%)
Indoor CO2
Concentration
(PPM)
Building_121.633.6586
Building_220.335.1521
Building_320.550.8739
Building_421.753.7620
Building_522.617.3487
Building_619.846.3632
Building_721.637.3487
Building_818.930.7753
Building_920.124.3550
Building_1015.830.2743
Building_1121.119.3551
Building_1221.830.8584
Building_1321.827.7394
Average20.633.6588
Table 2. Description of retrofitting scenarios and their results.
U-Values, W/m2∙KAir Flow of Wind Dependent
Infiltration at Pressure
Difference 50 Pa, m3/(h·m2 ext.surf)
Exhaust Air Heat
Recovery, %
Air
Exchange Rate, ACH
LocationHVAC
Electricity, kWh/m2
District Heating, kWh/m2
Scenario 1Windows—2.6
Walls—0.9
Floor—0.8
Roof—0.9
400.5Daugavpils0222.7
Riga0201.4
Liepaja0190.5
Scenario 2Windows—1.1
Walls—0.16
Floor—0.16
Roof—0.10
1.500.5Daugavpils094.4
Riga085.3
Liepaja079.5
Scenario 3Windows—1.1
Walls—0.16
Floor—0.16
Roof—0.10
1.5800.5Daugavpils6.250
Riga6.243.7
Liepaja6.239.4
Scenario 4Windows—1.1
Walls—0.16
Floor—0.16
Roof—0.10
1.5800.5 *Daugavpils13.072
Riga13.063.4
Liepaja13.058.8
* In this scenario, eight living rooms in the barracks had an increased air exchange rate of 2.5 L/(s·m2) according to the D2 national building code of Finland.
Table 3. Building parameters.
LocationFloor Area, m2Volume,
m3
Land Area, m2Window/Ratio of Enclosing Structures, %Average U—Value,
W/(m2·K)
Roof Side Area,
m2
Slope of the Roof
Riga3297.211,664.5832.16.400.968250430°
Table 4. Solar collector parameters.
Collector AreaNumber of CollectorsArea Occupied by Collectors
385 m218076%
Table 5. PV parameters.
Number of PV PanelsRated Capacity,
W
MPP Voltage, VMPP
Current, A
Total Capacity, kWpPV Area,
m2
32576 W1324.3718.43371.2
Publisher’s Note: MDPI stays neutral with regard to jurisdictional claims in published maps and institutional affiliations.

