
Influence of Crumb Rubber and Coconut Coir on Strength and Durability Characteristics of Interlocking Paving Blocks

 ,
,  and
and 
Abstract
:1. Introduction
2. Materials and Methods
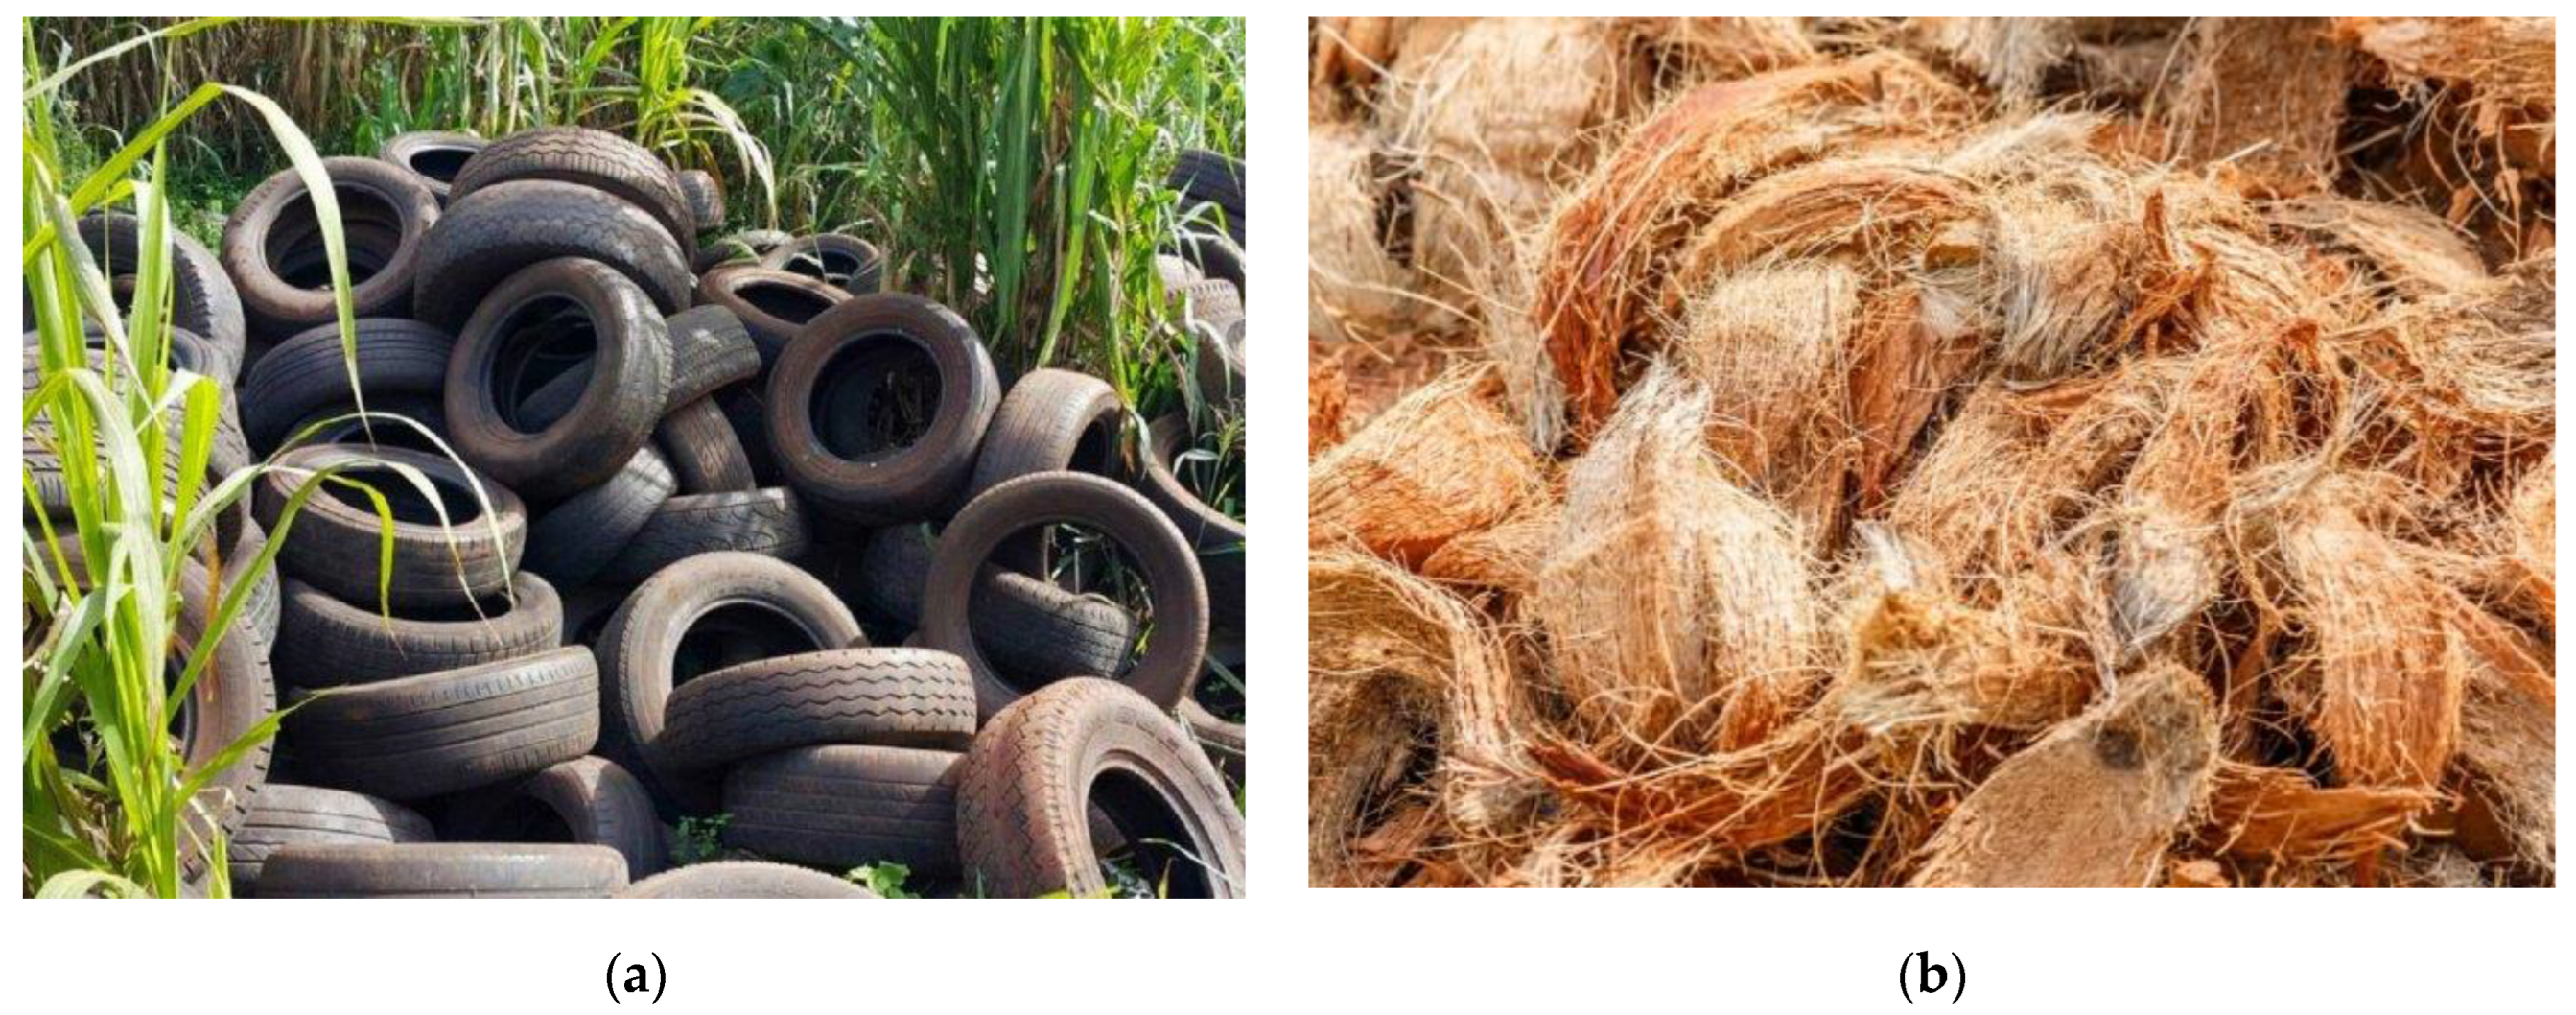
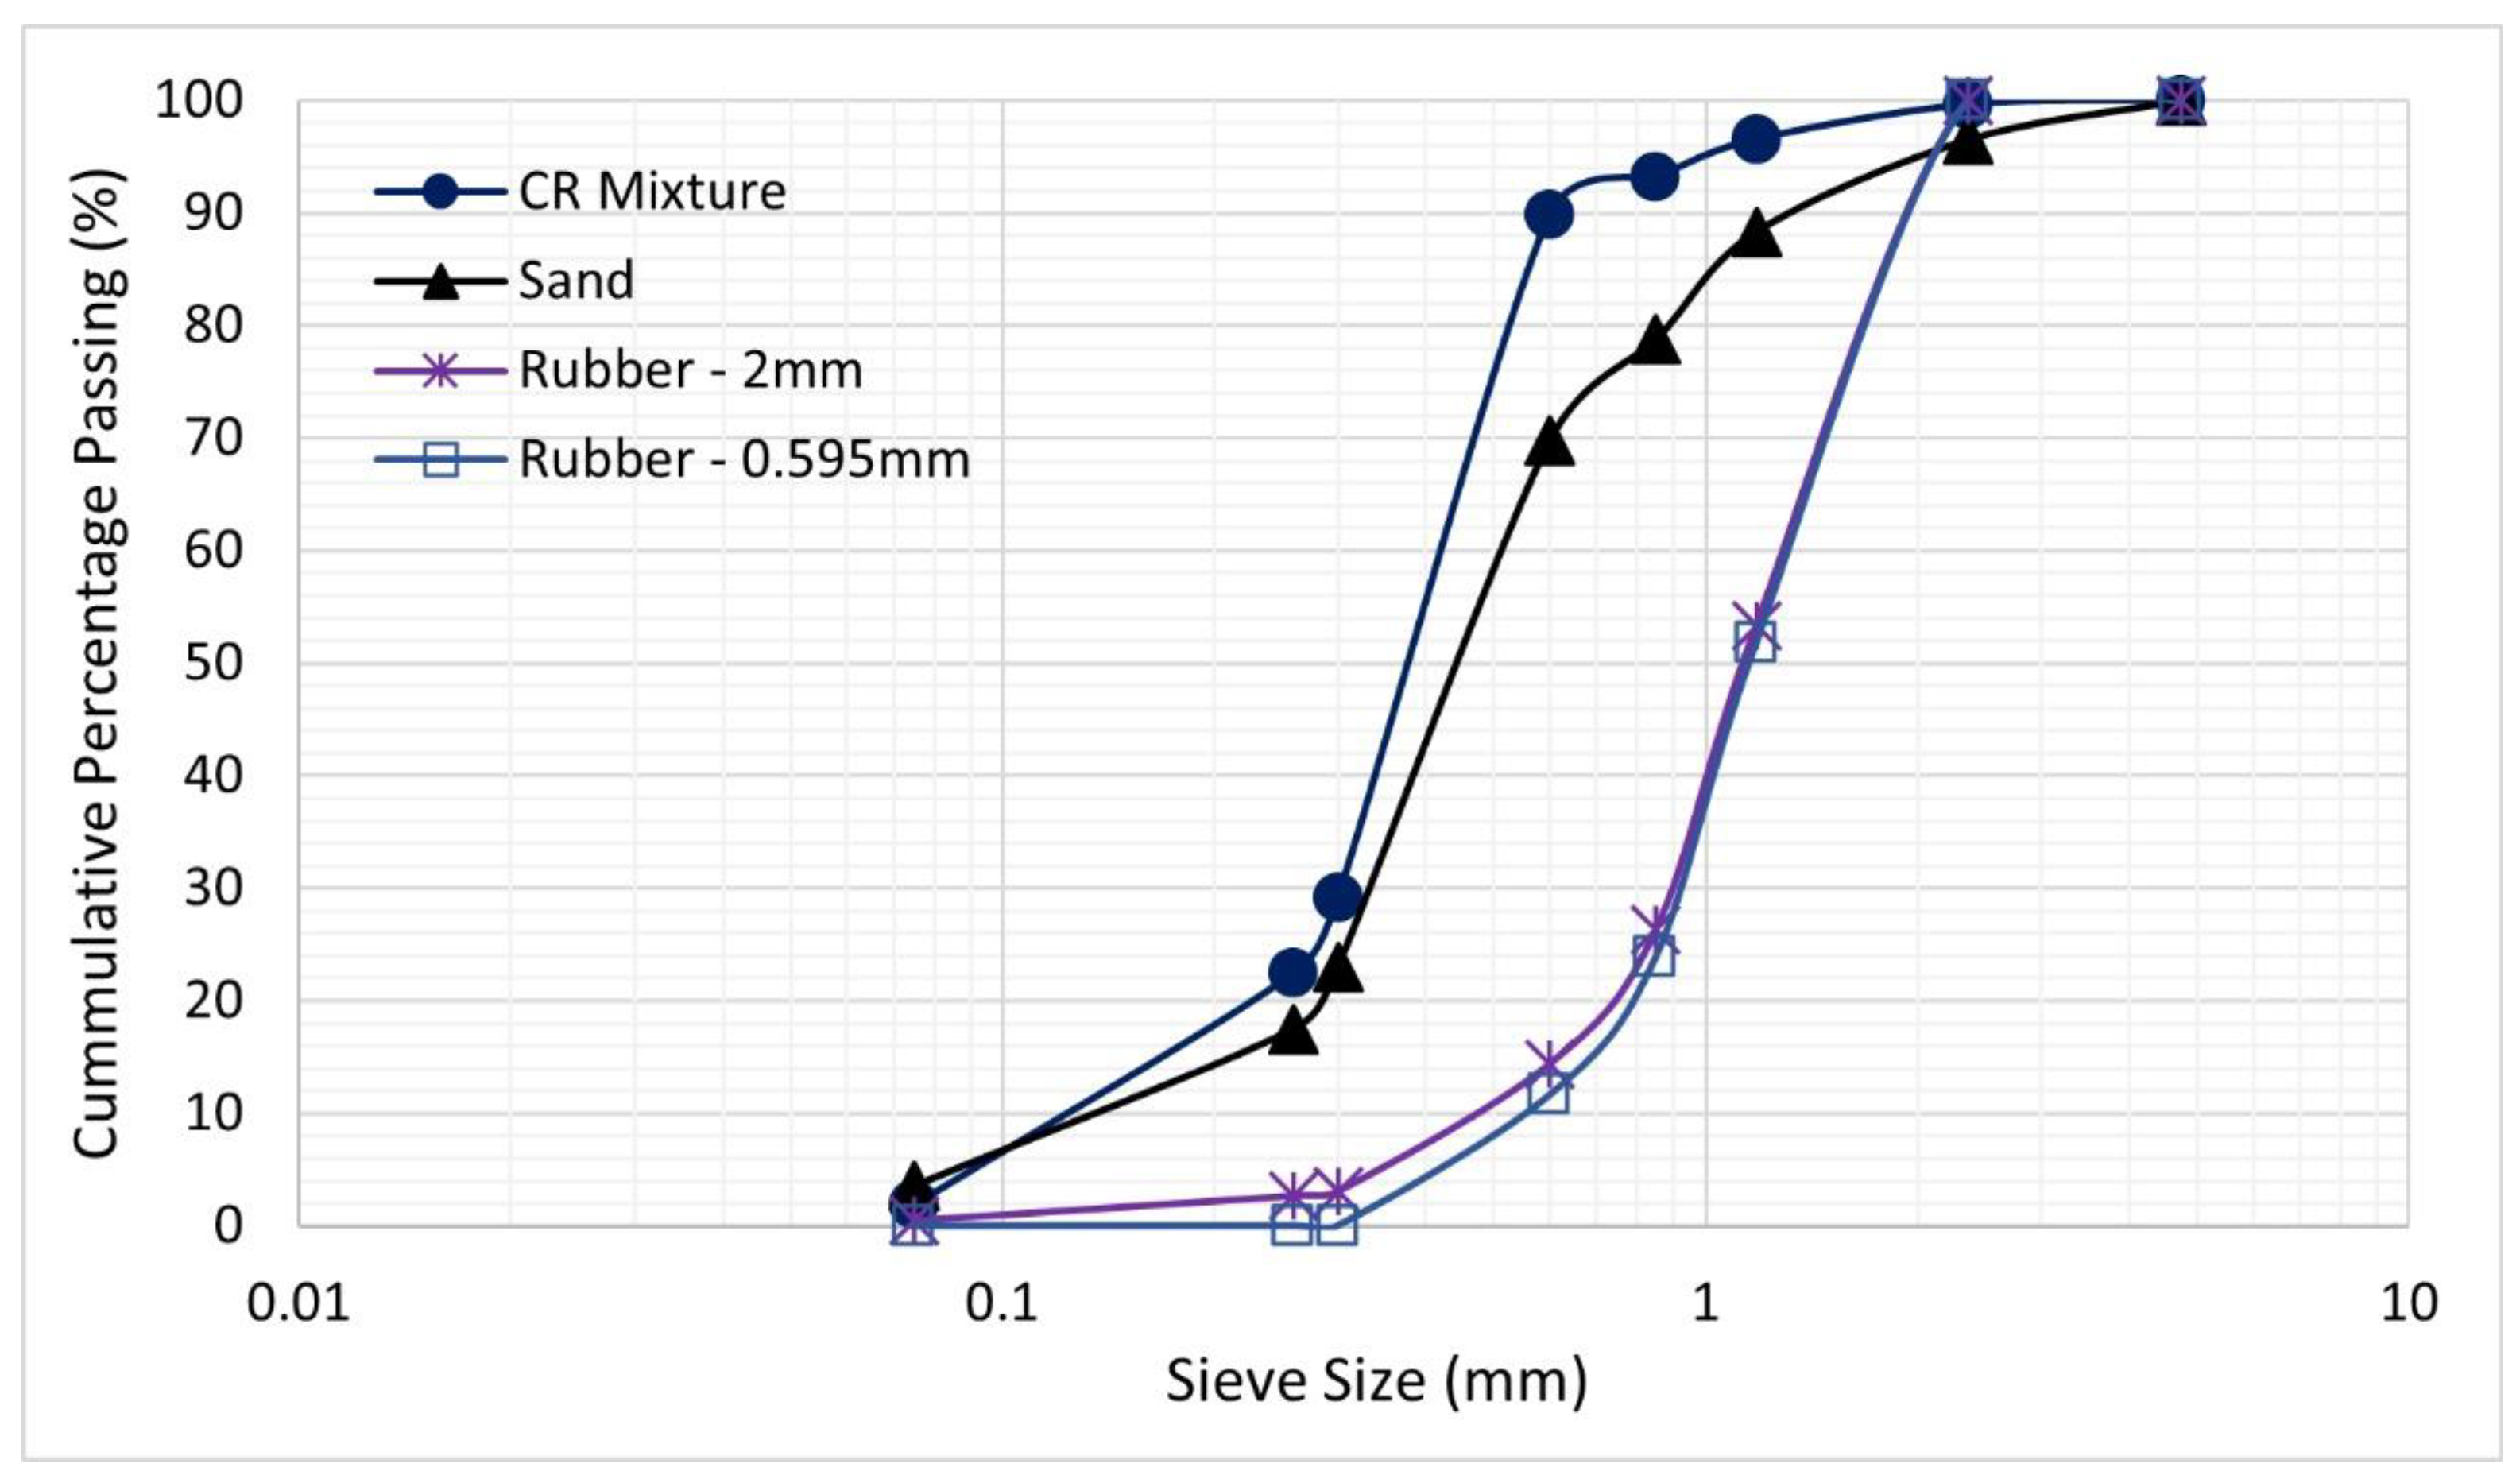
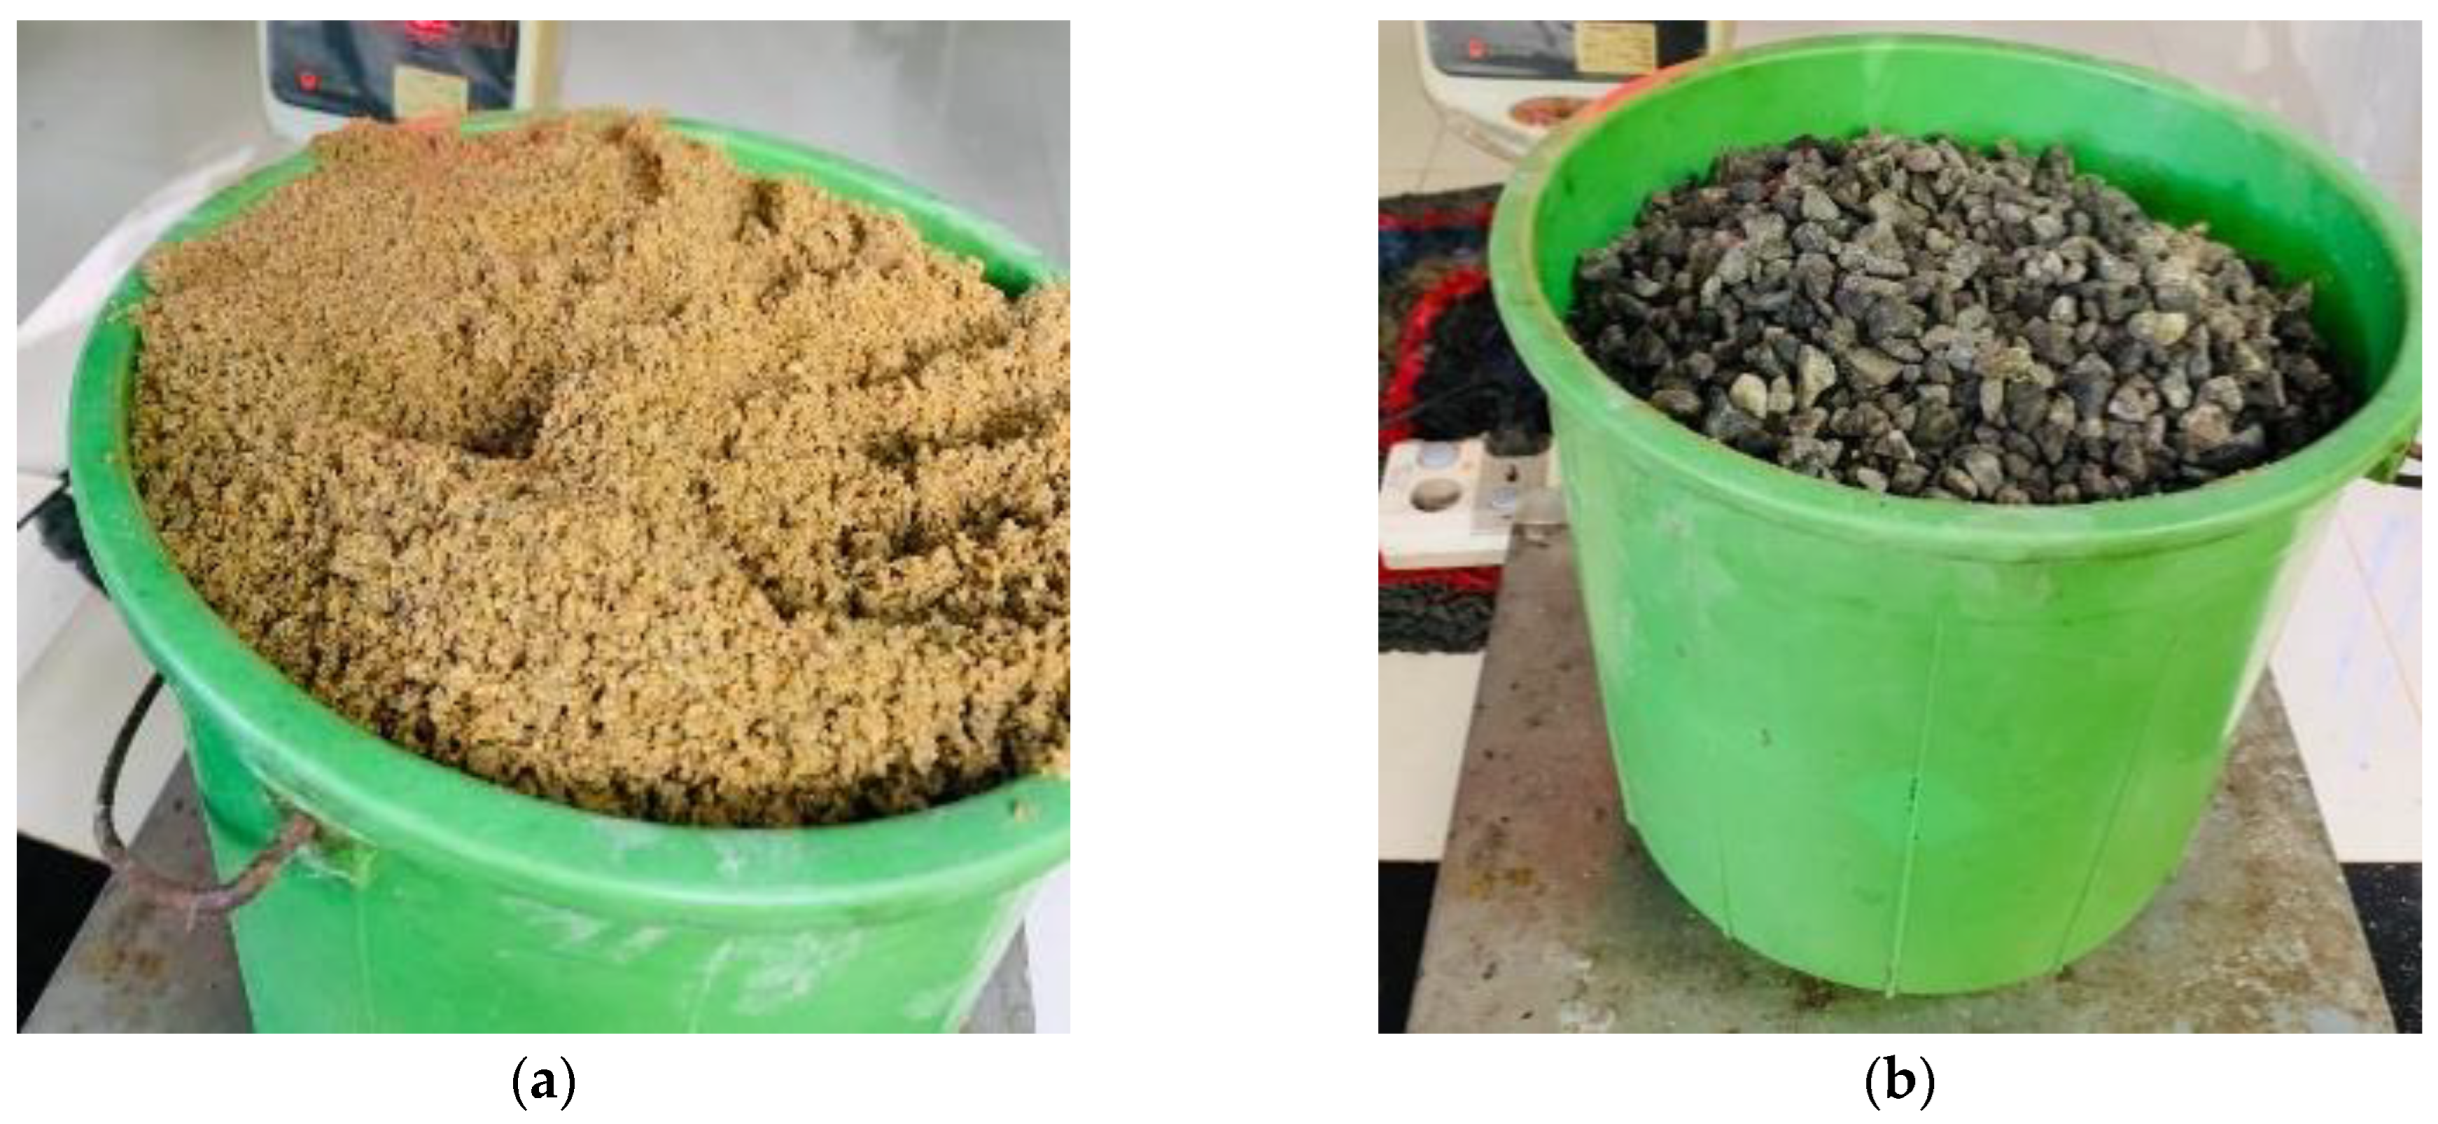
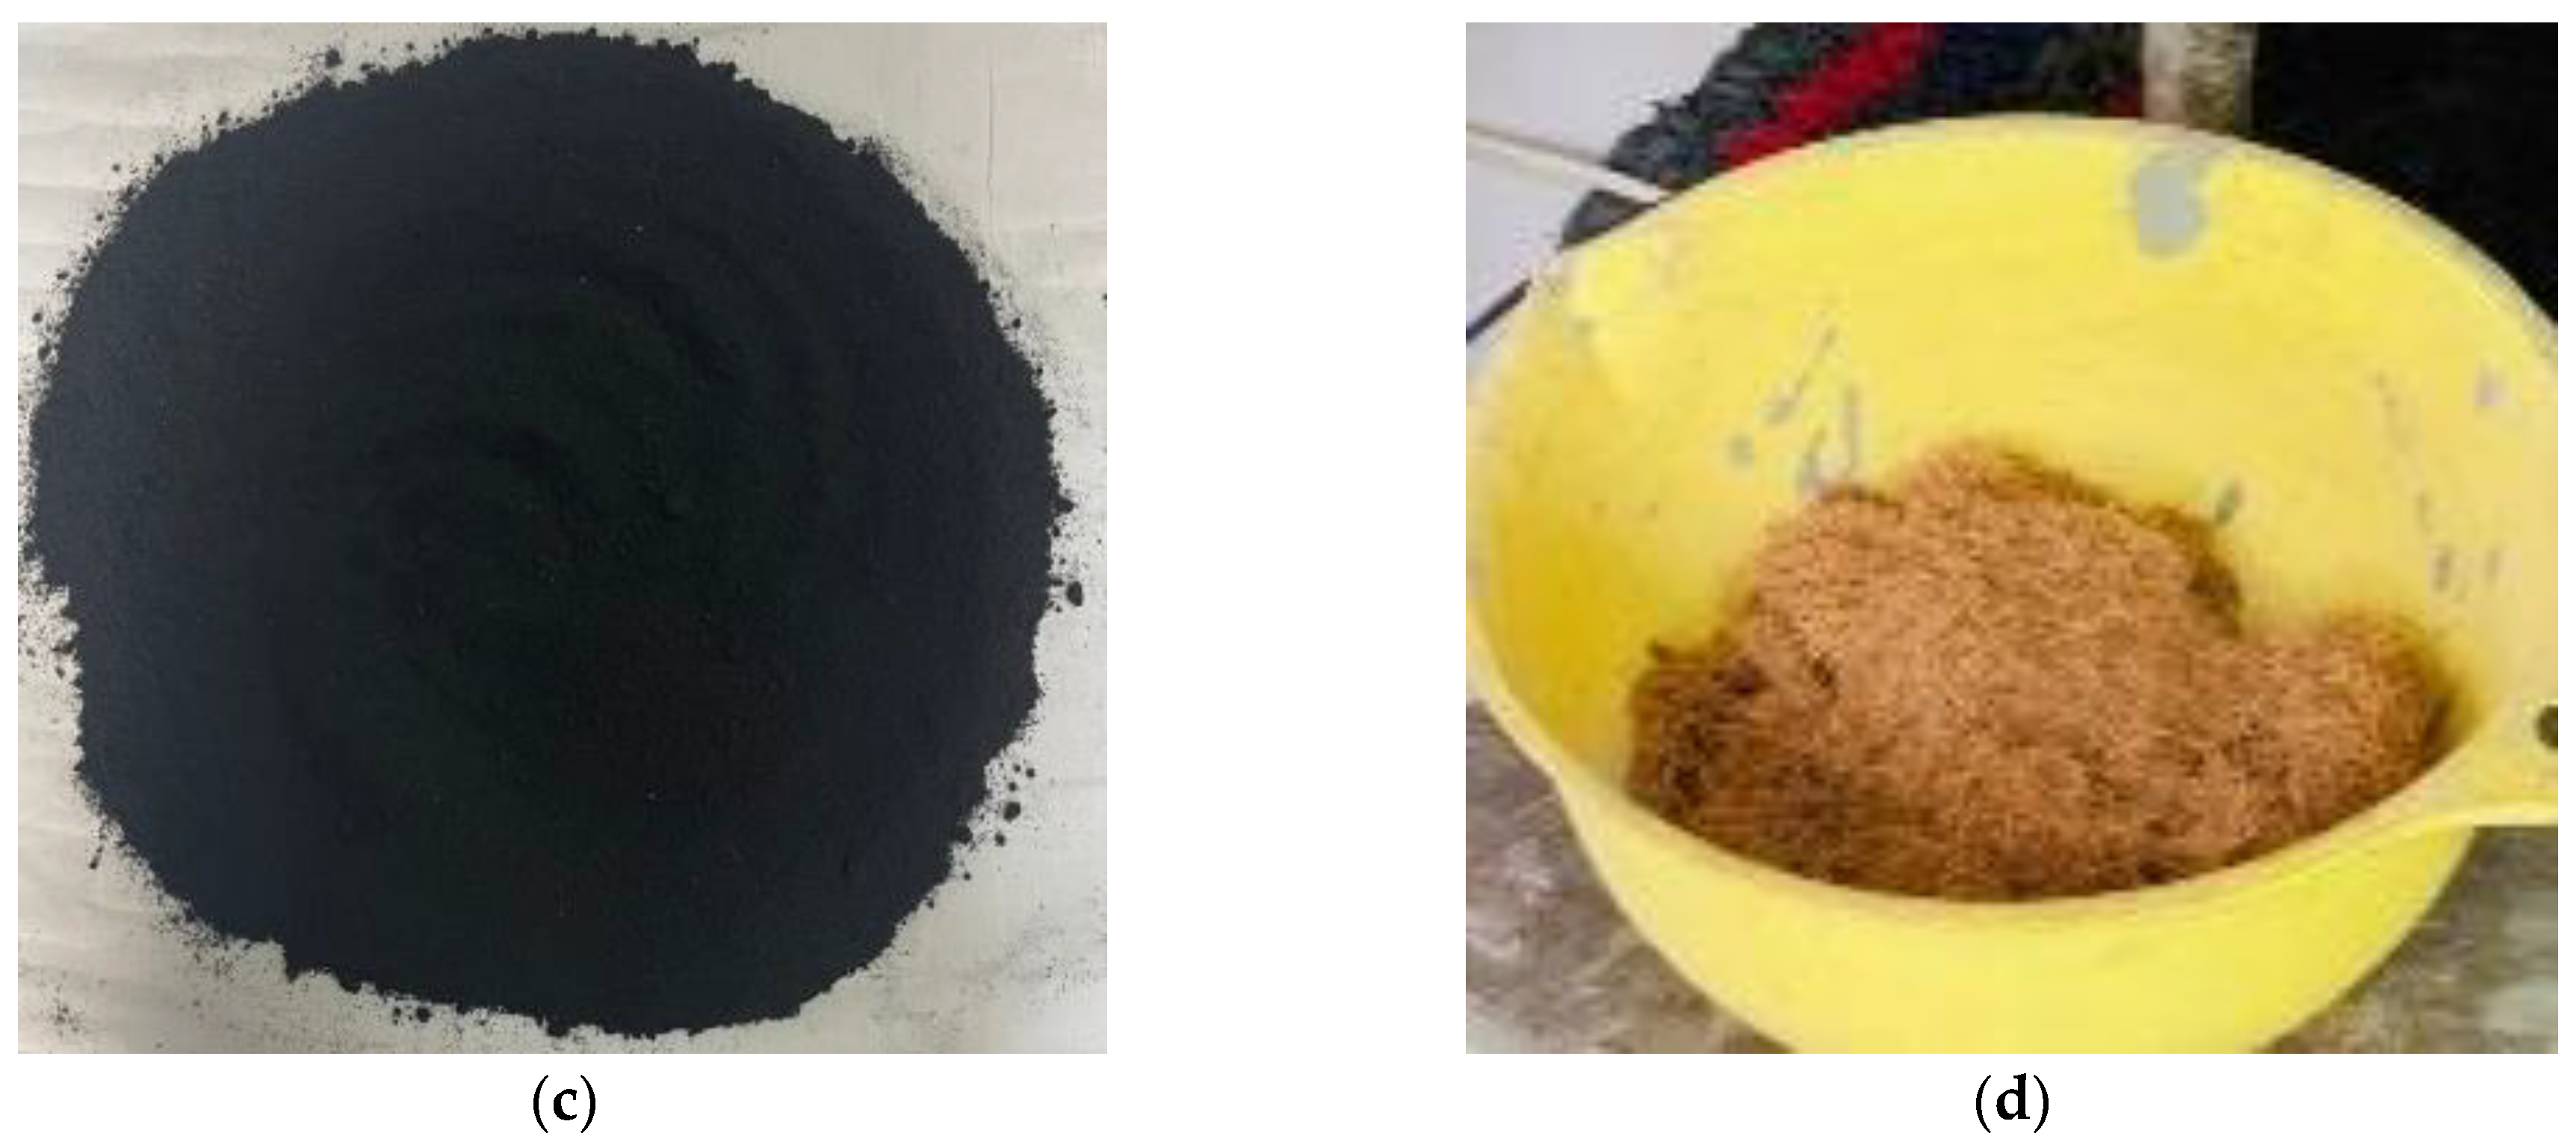
2.1. Materials
2.2. Sample Preparation
2.3. Interlocking (Paver) Block Testing
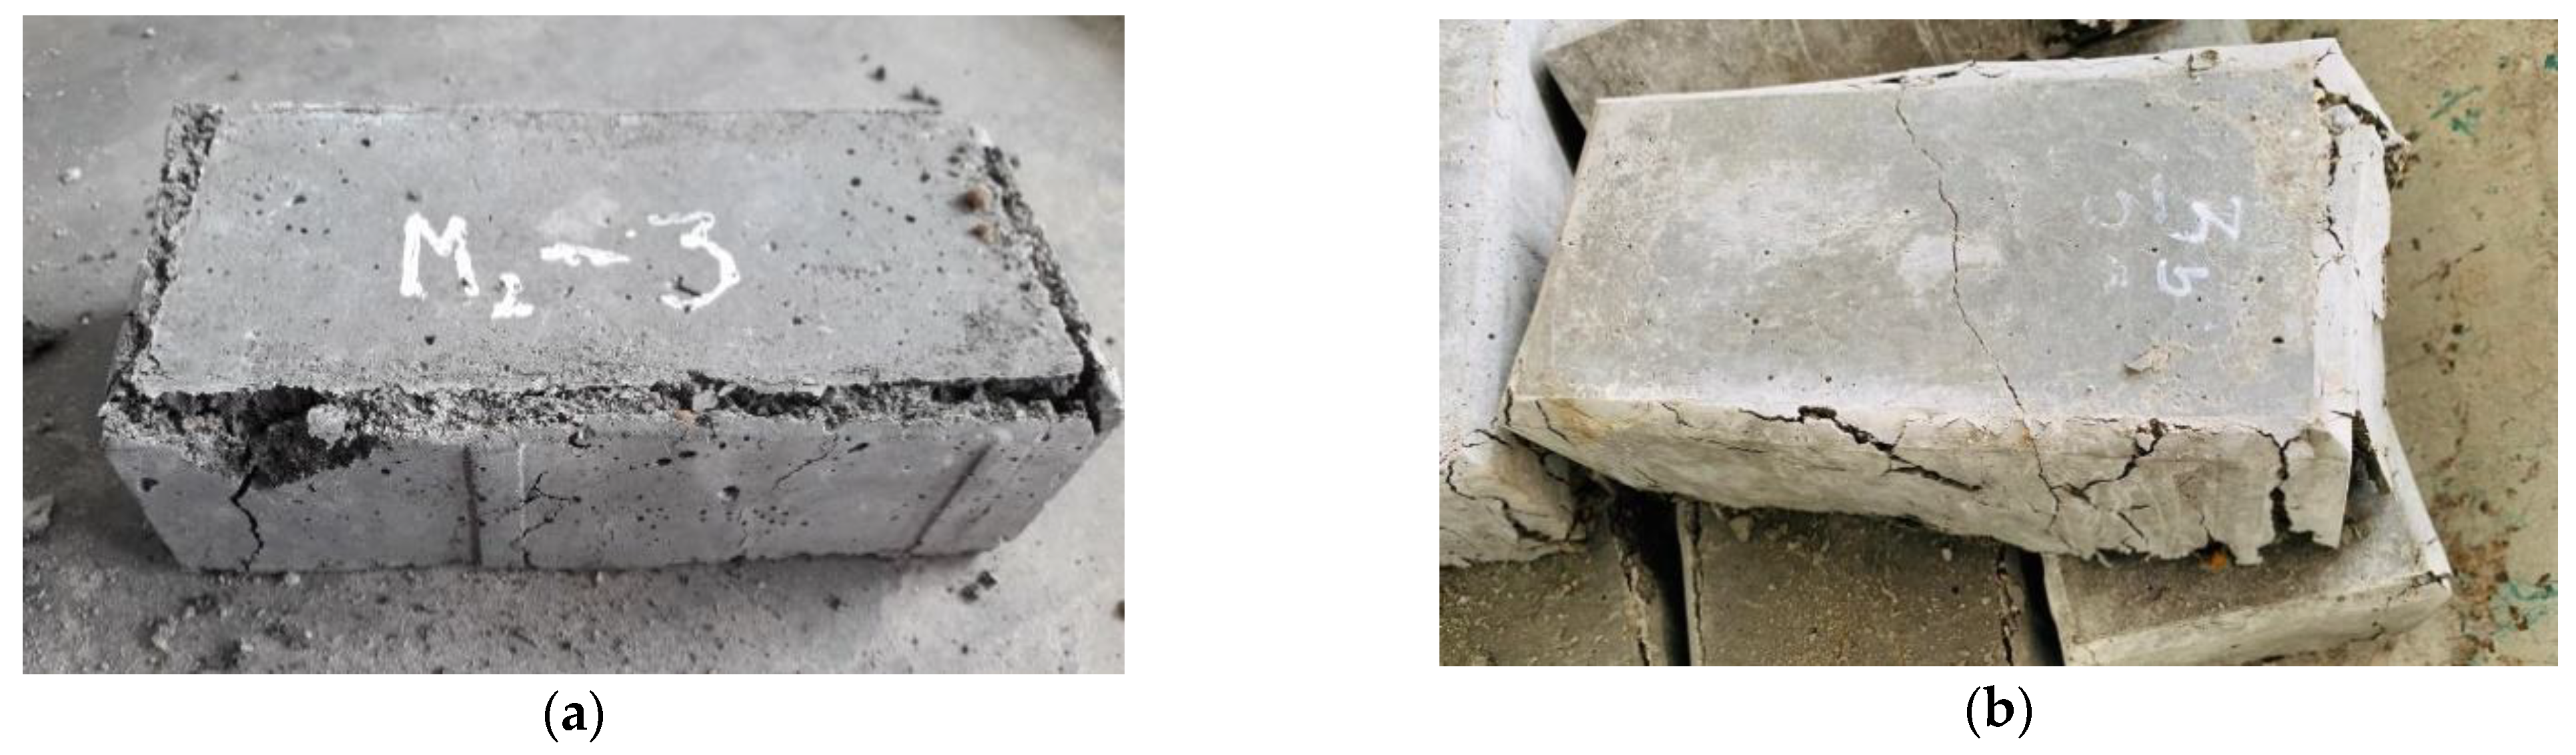
2.3.1. Compressive Strength
2.3.2. Abrasion Resistance
2.3.3. Splitting Tensile Strength
2.3.4. Skid Resistance
2.3.5. Water Absorption
2.3.6. Cost of an Interlocking Paving Block
3. Results and Discussion
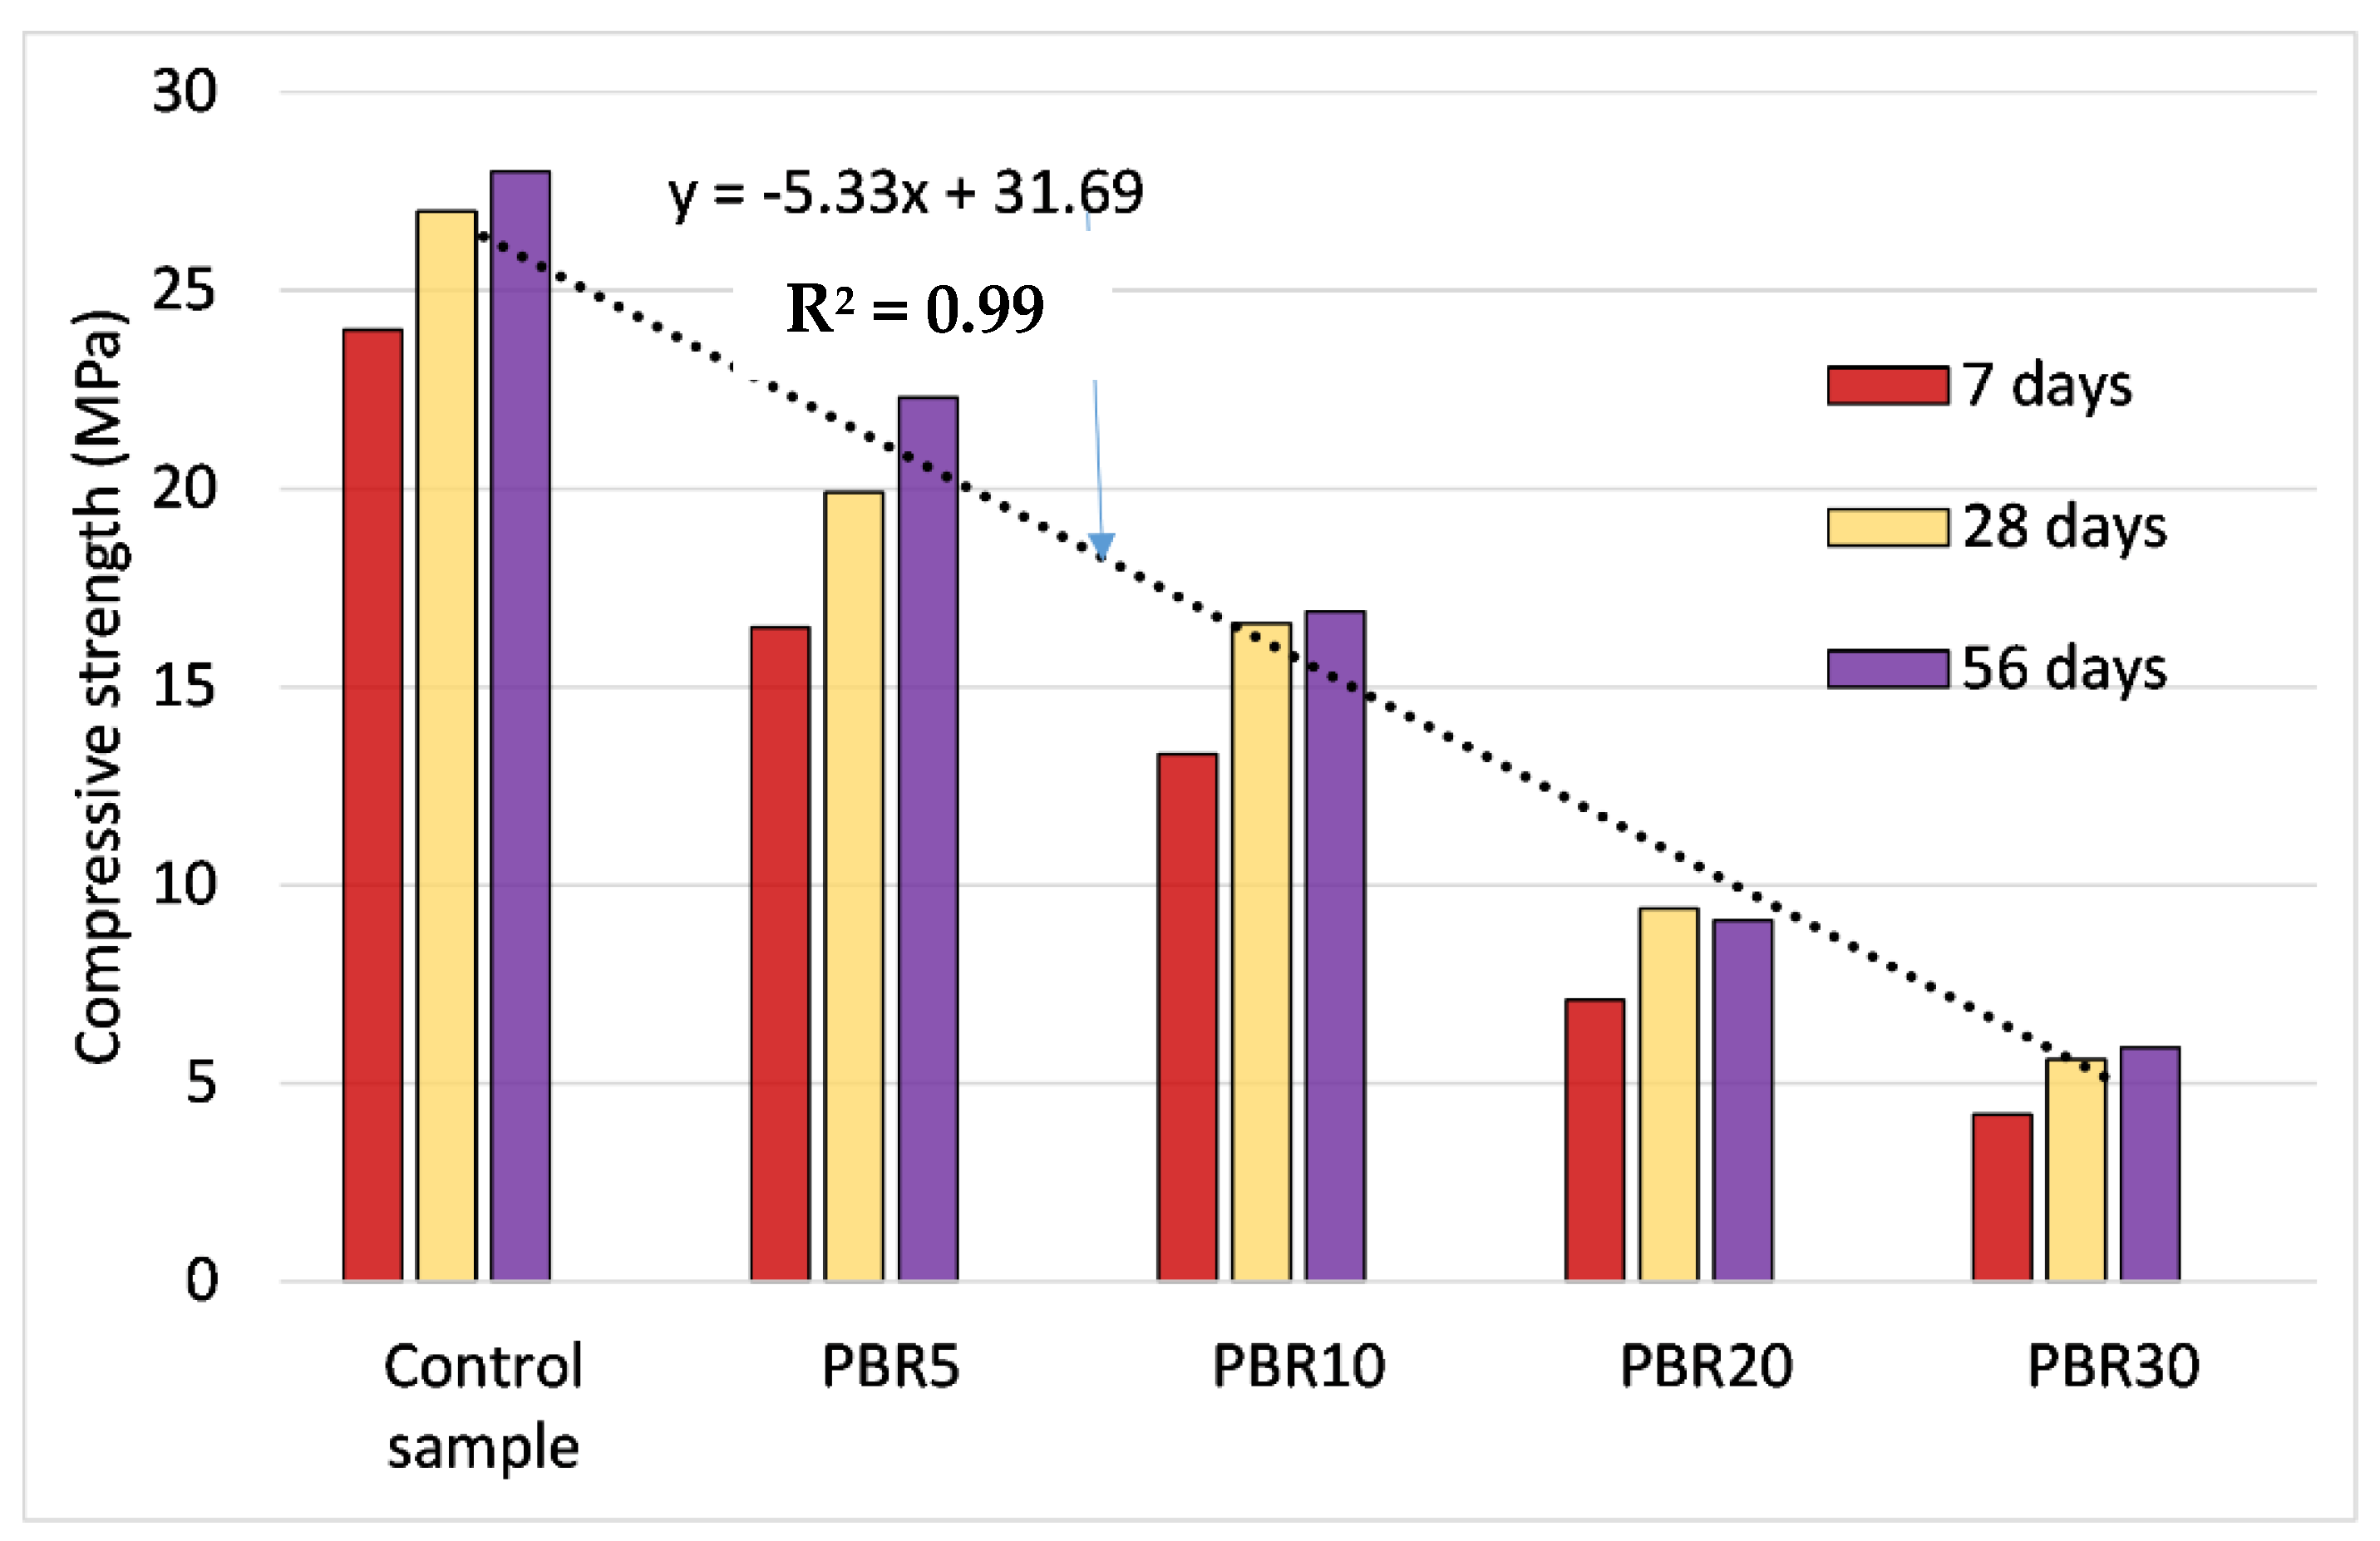
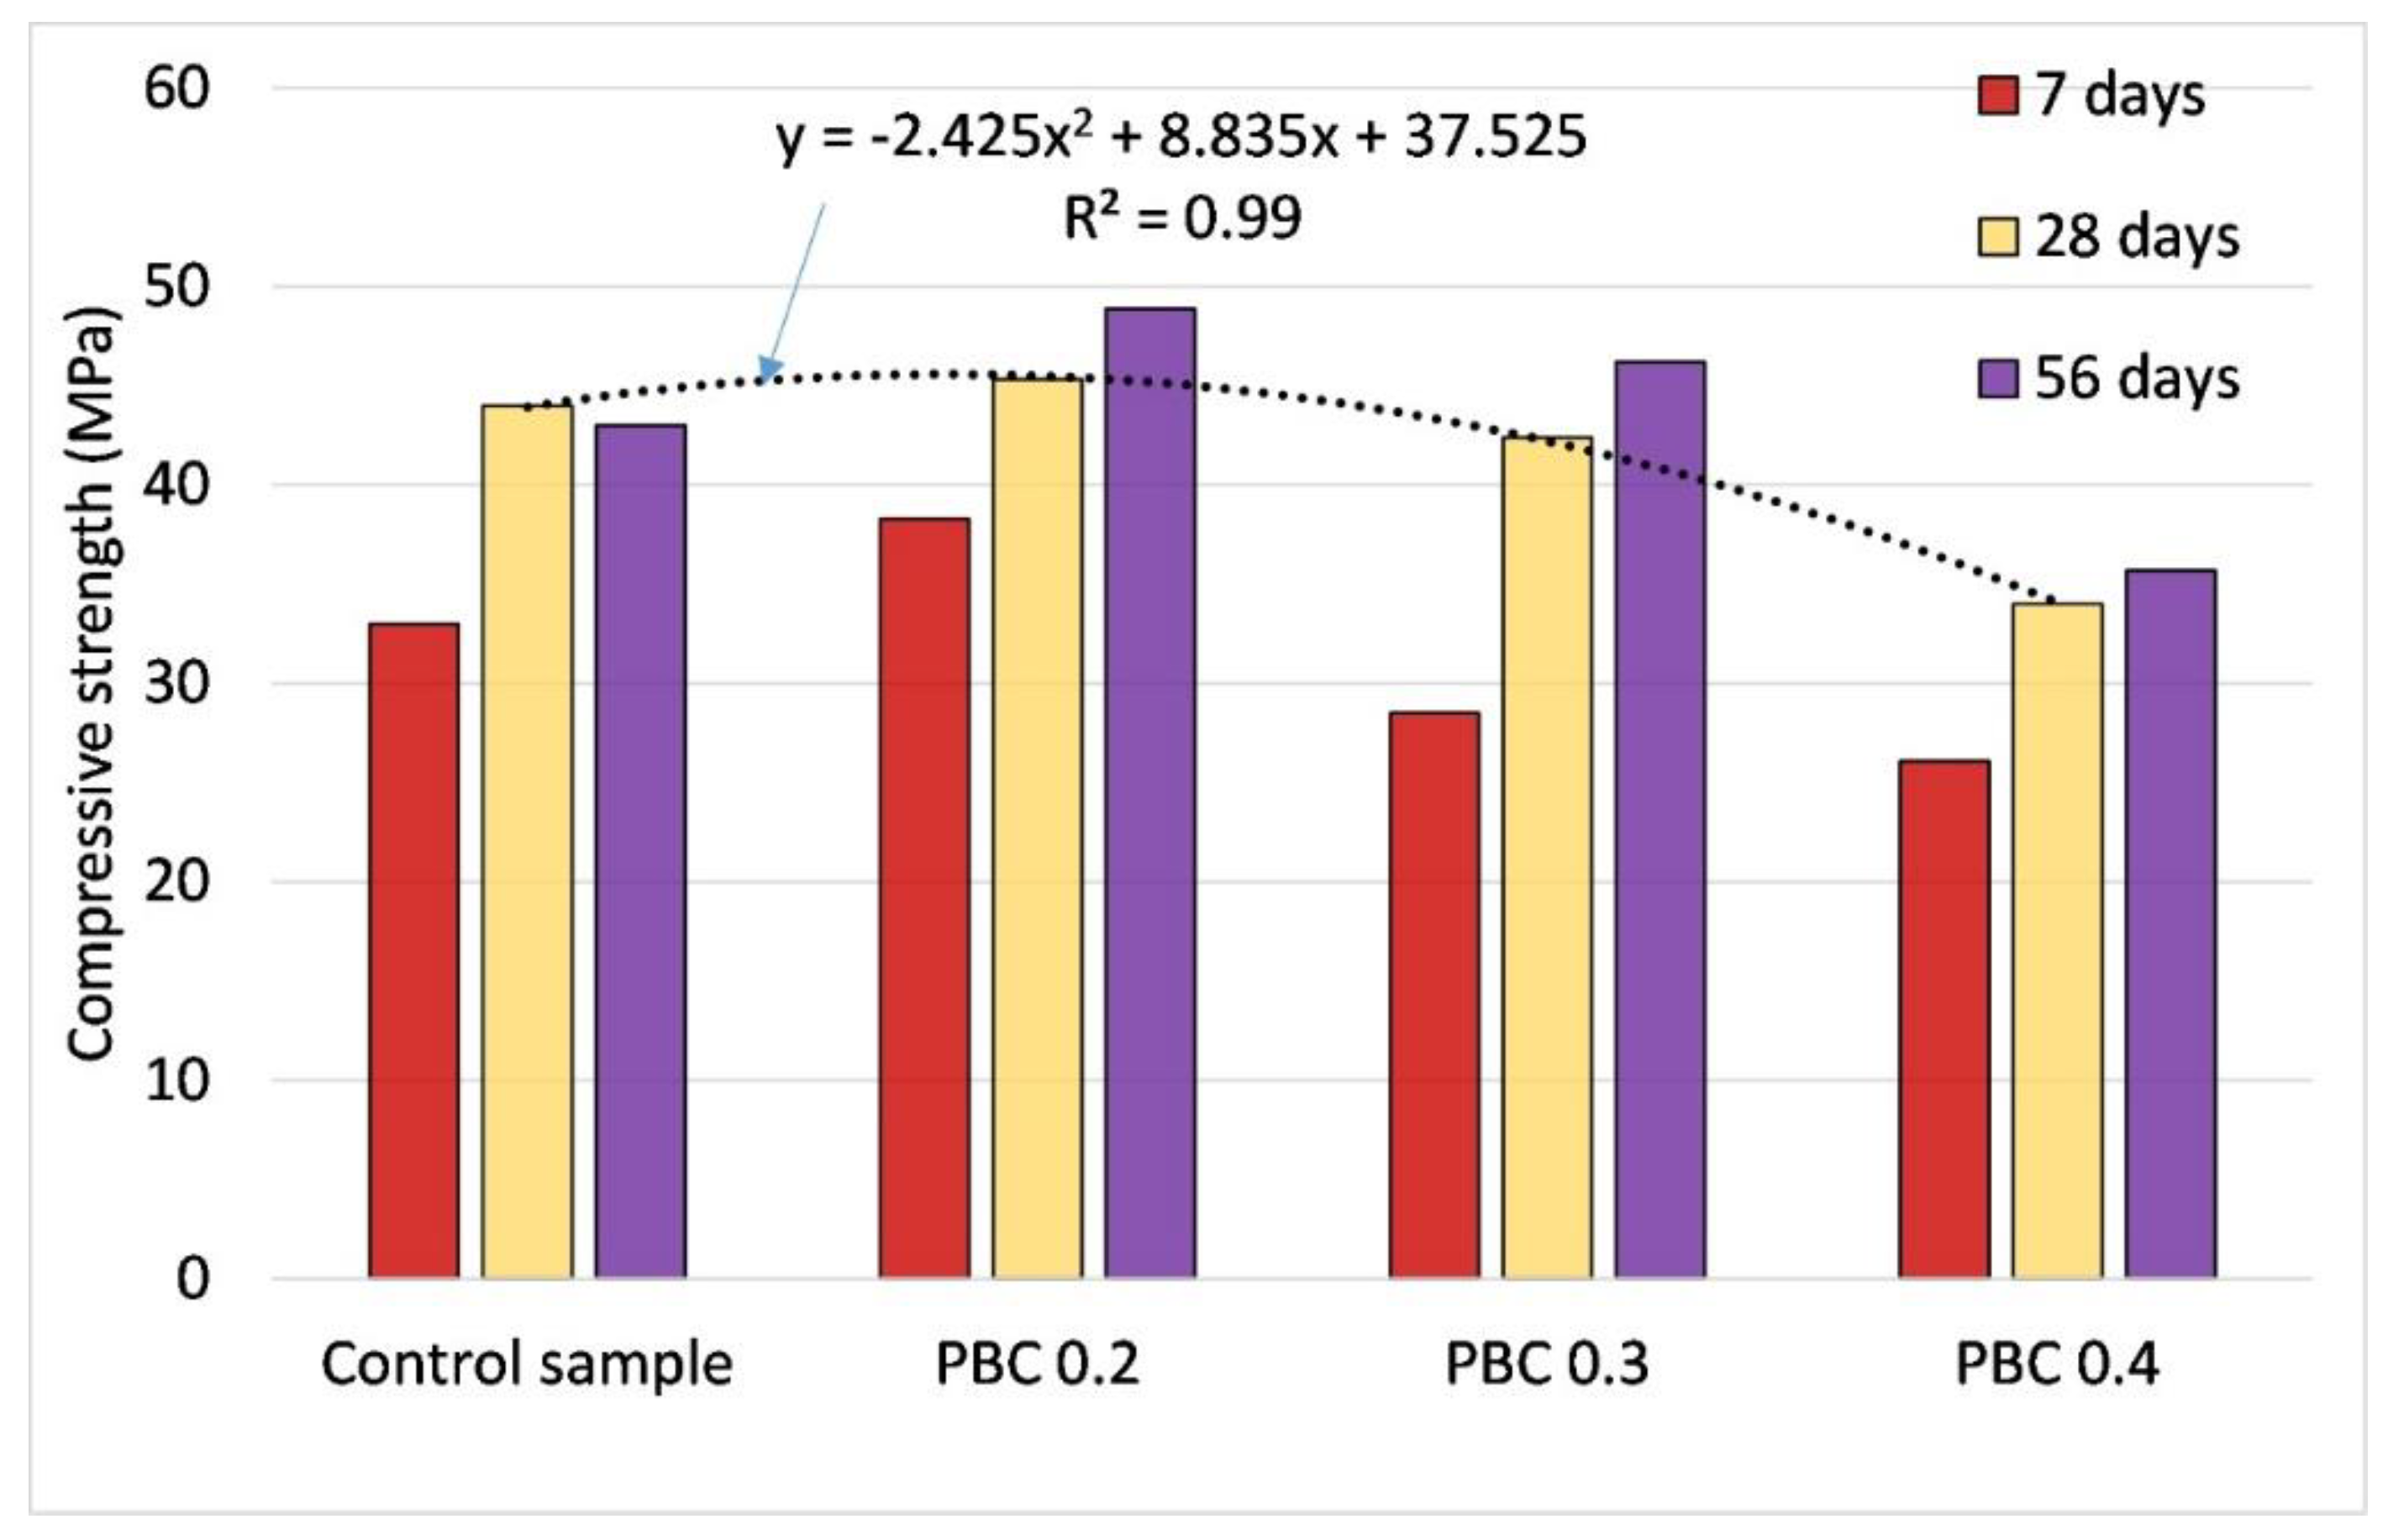
3.1. Compressive Strength
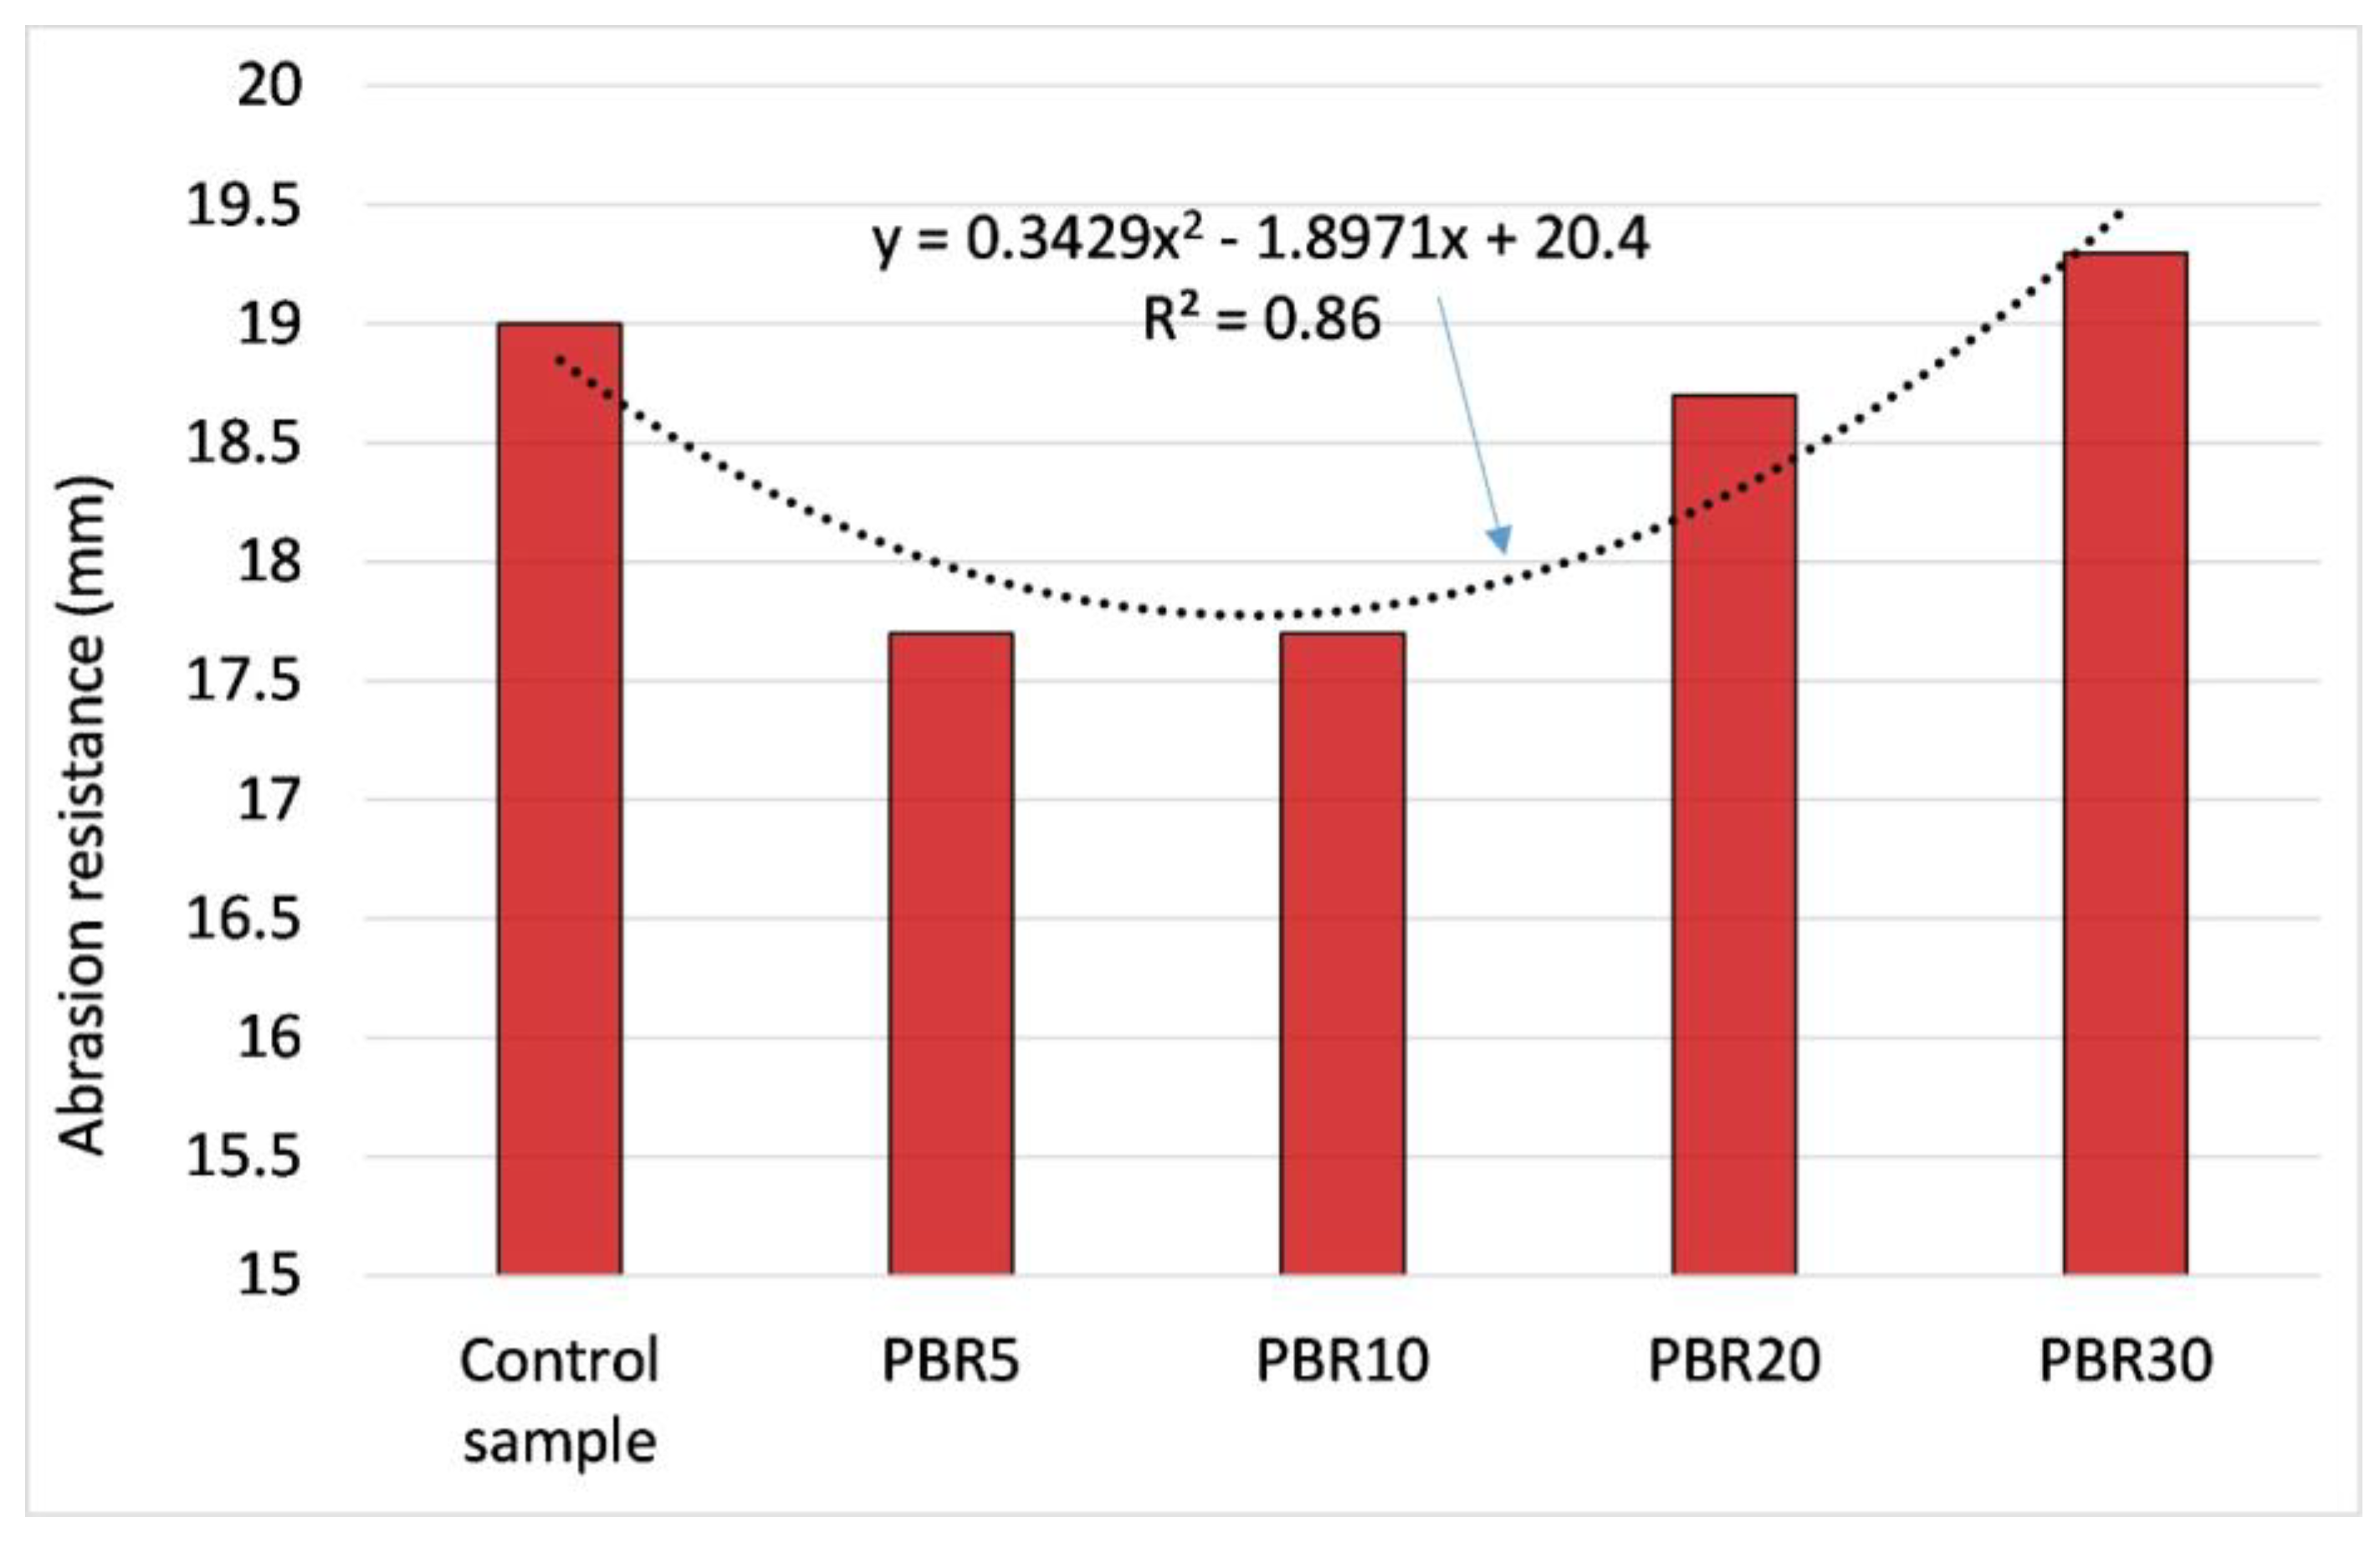
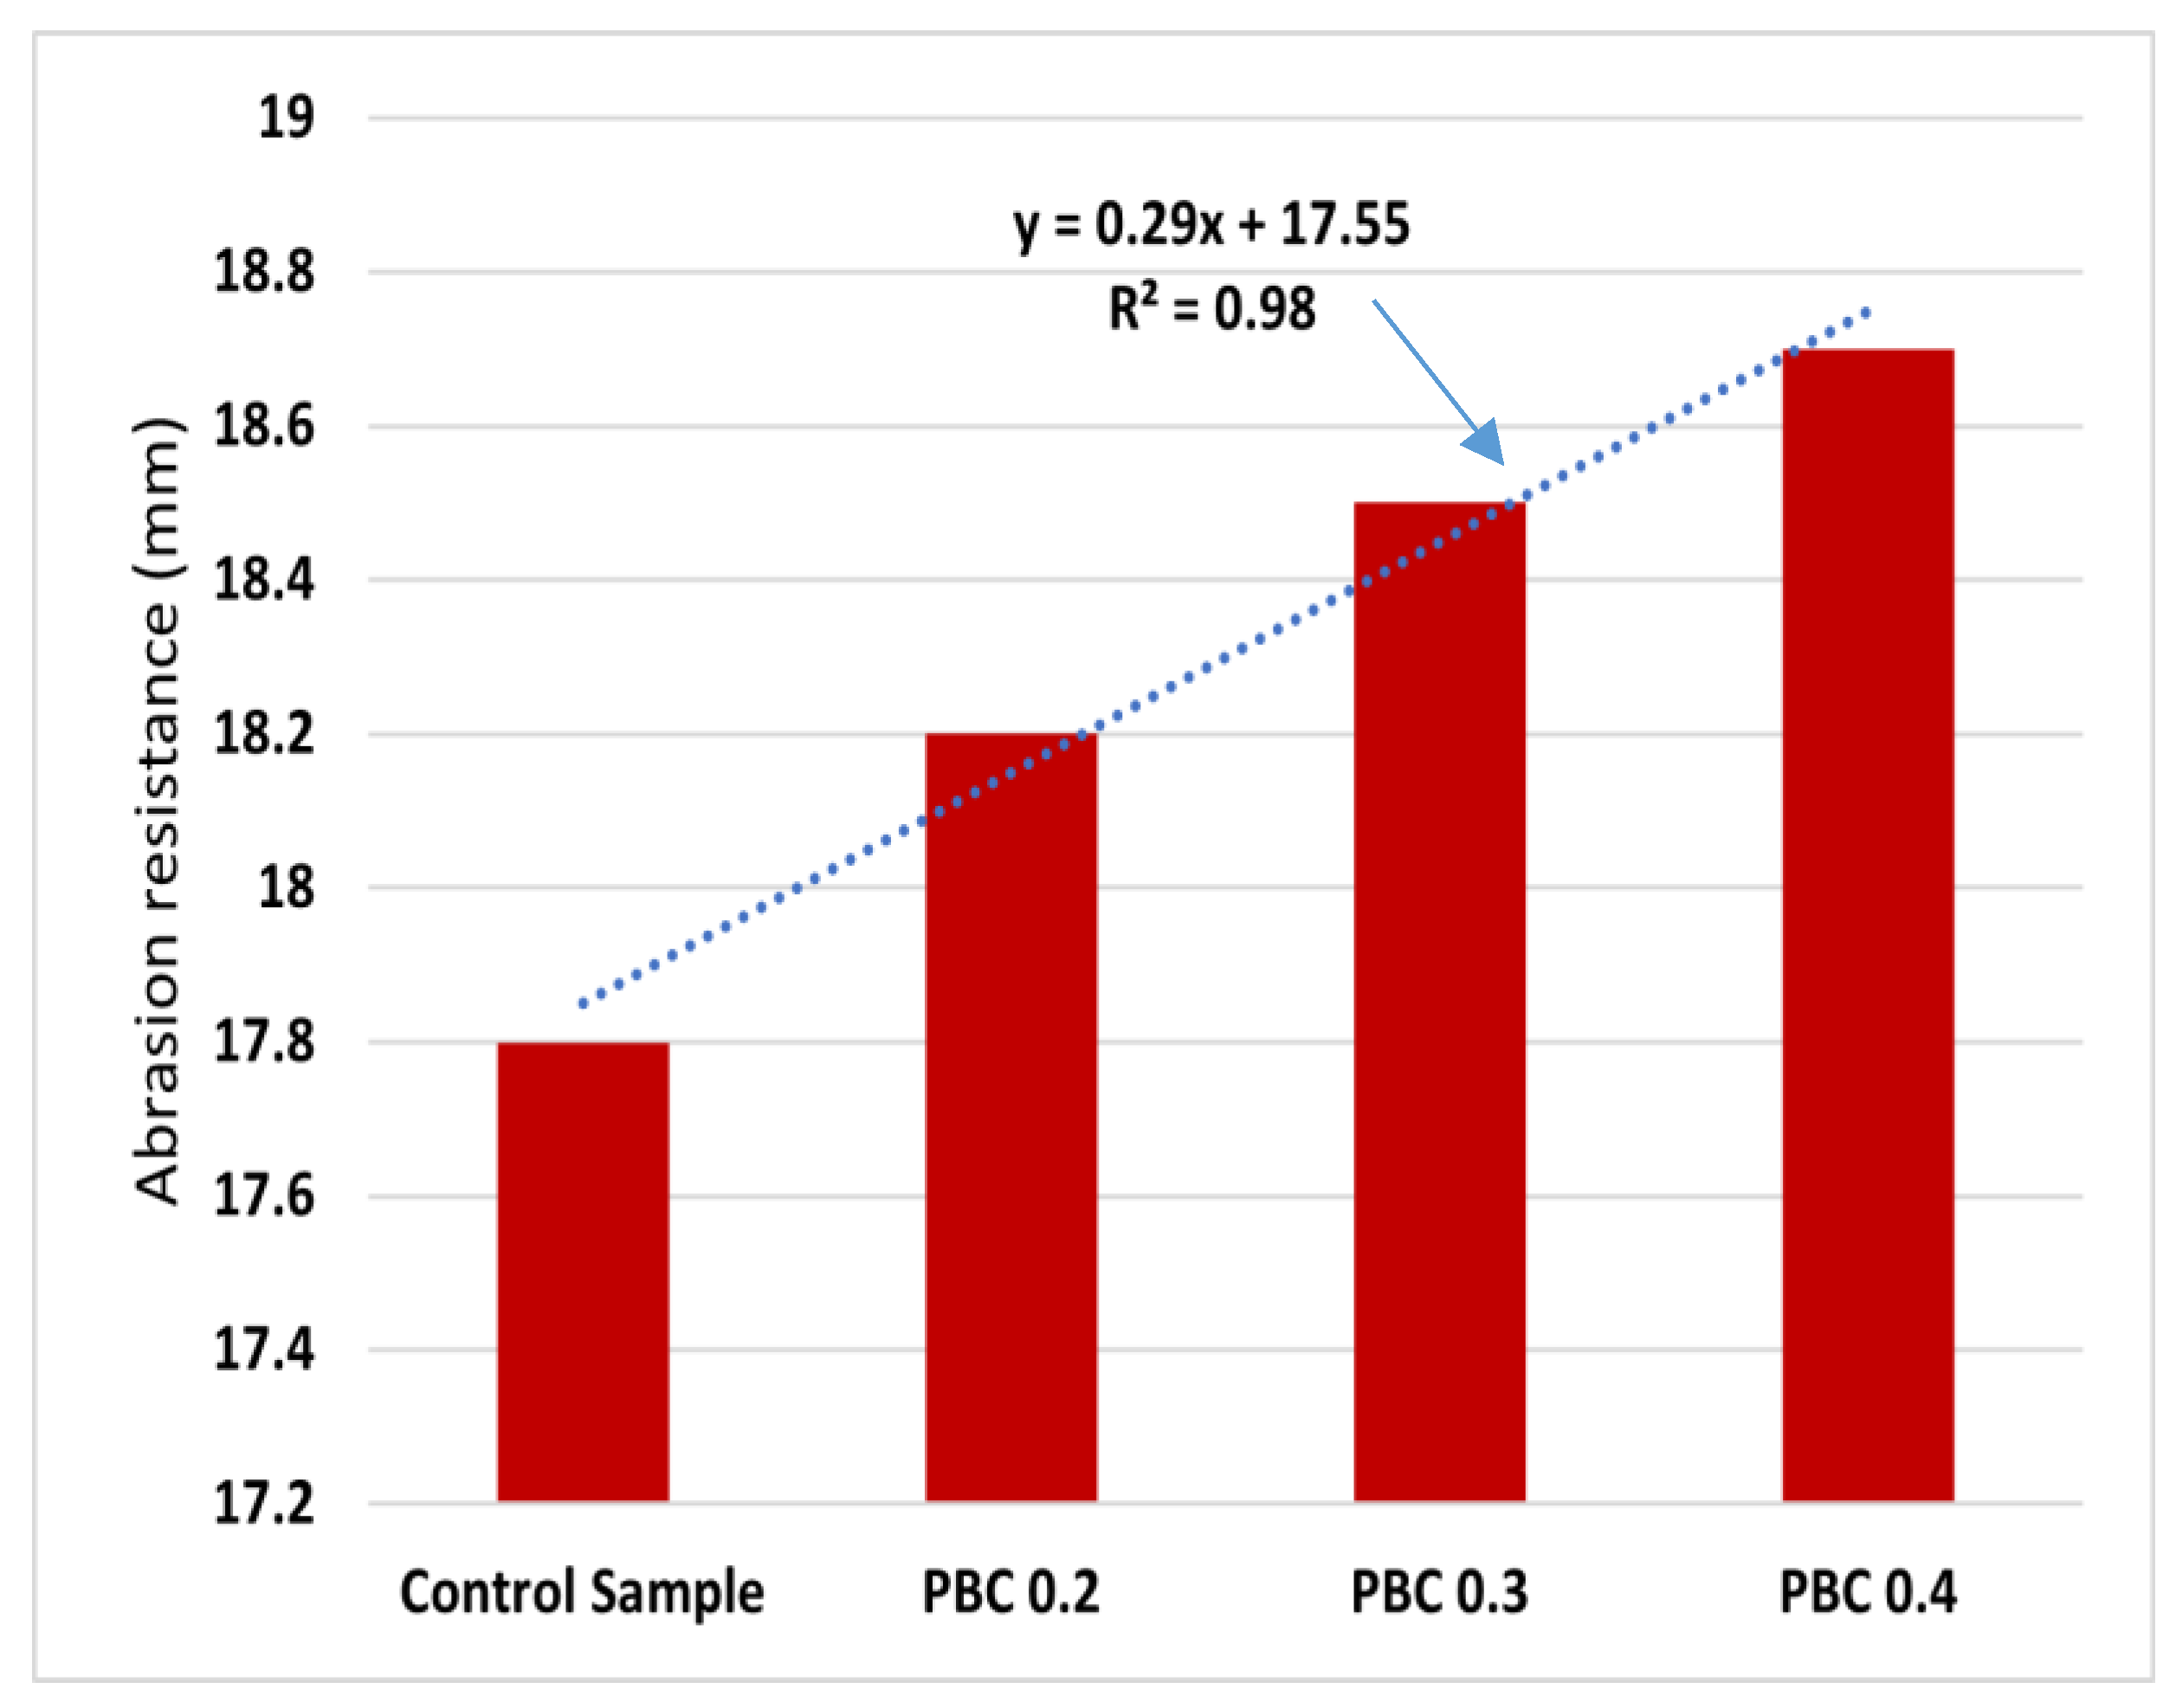
3.2. Abrasion Resistance
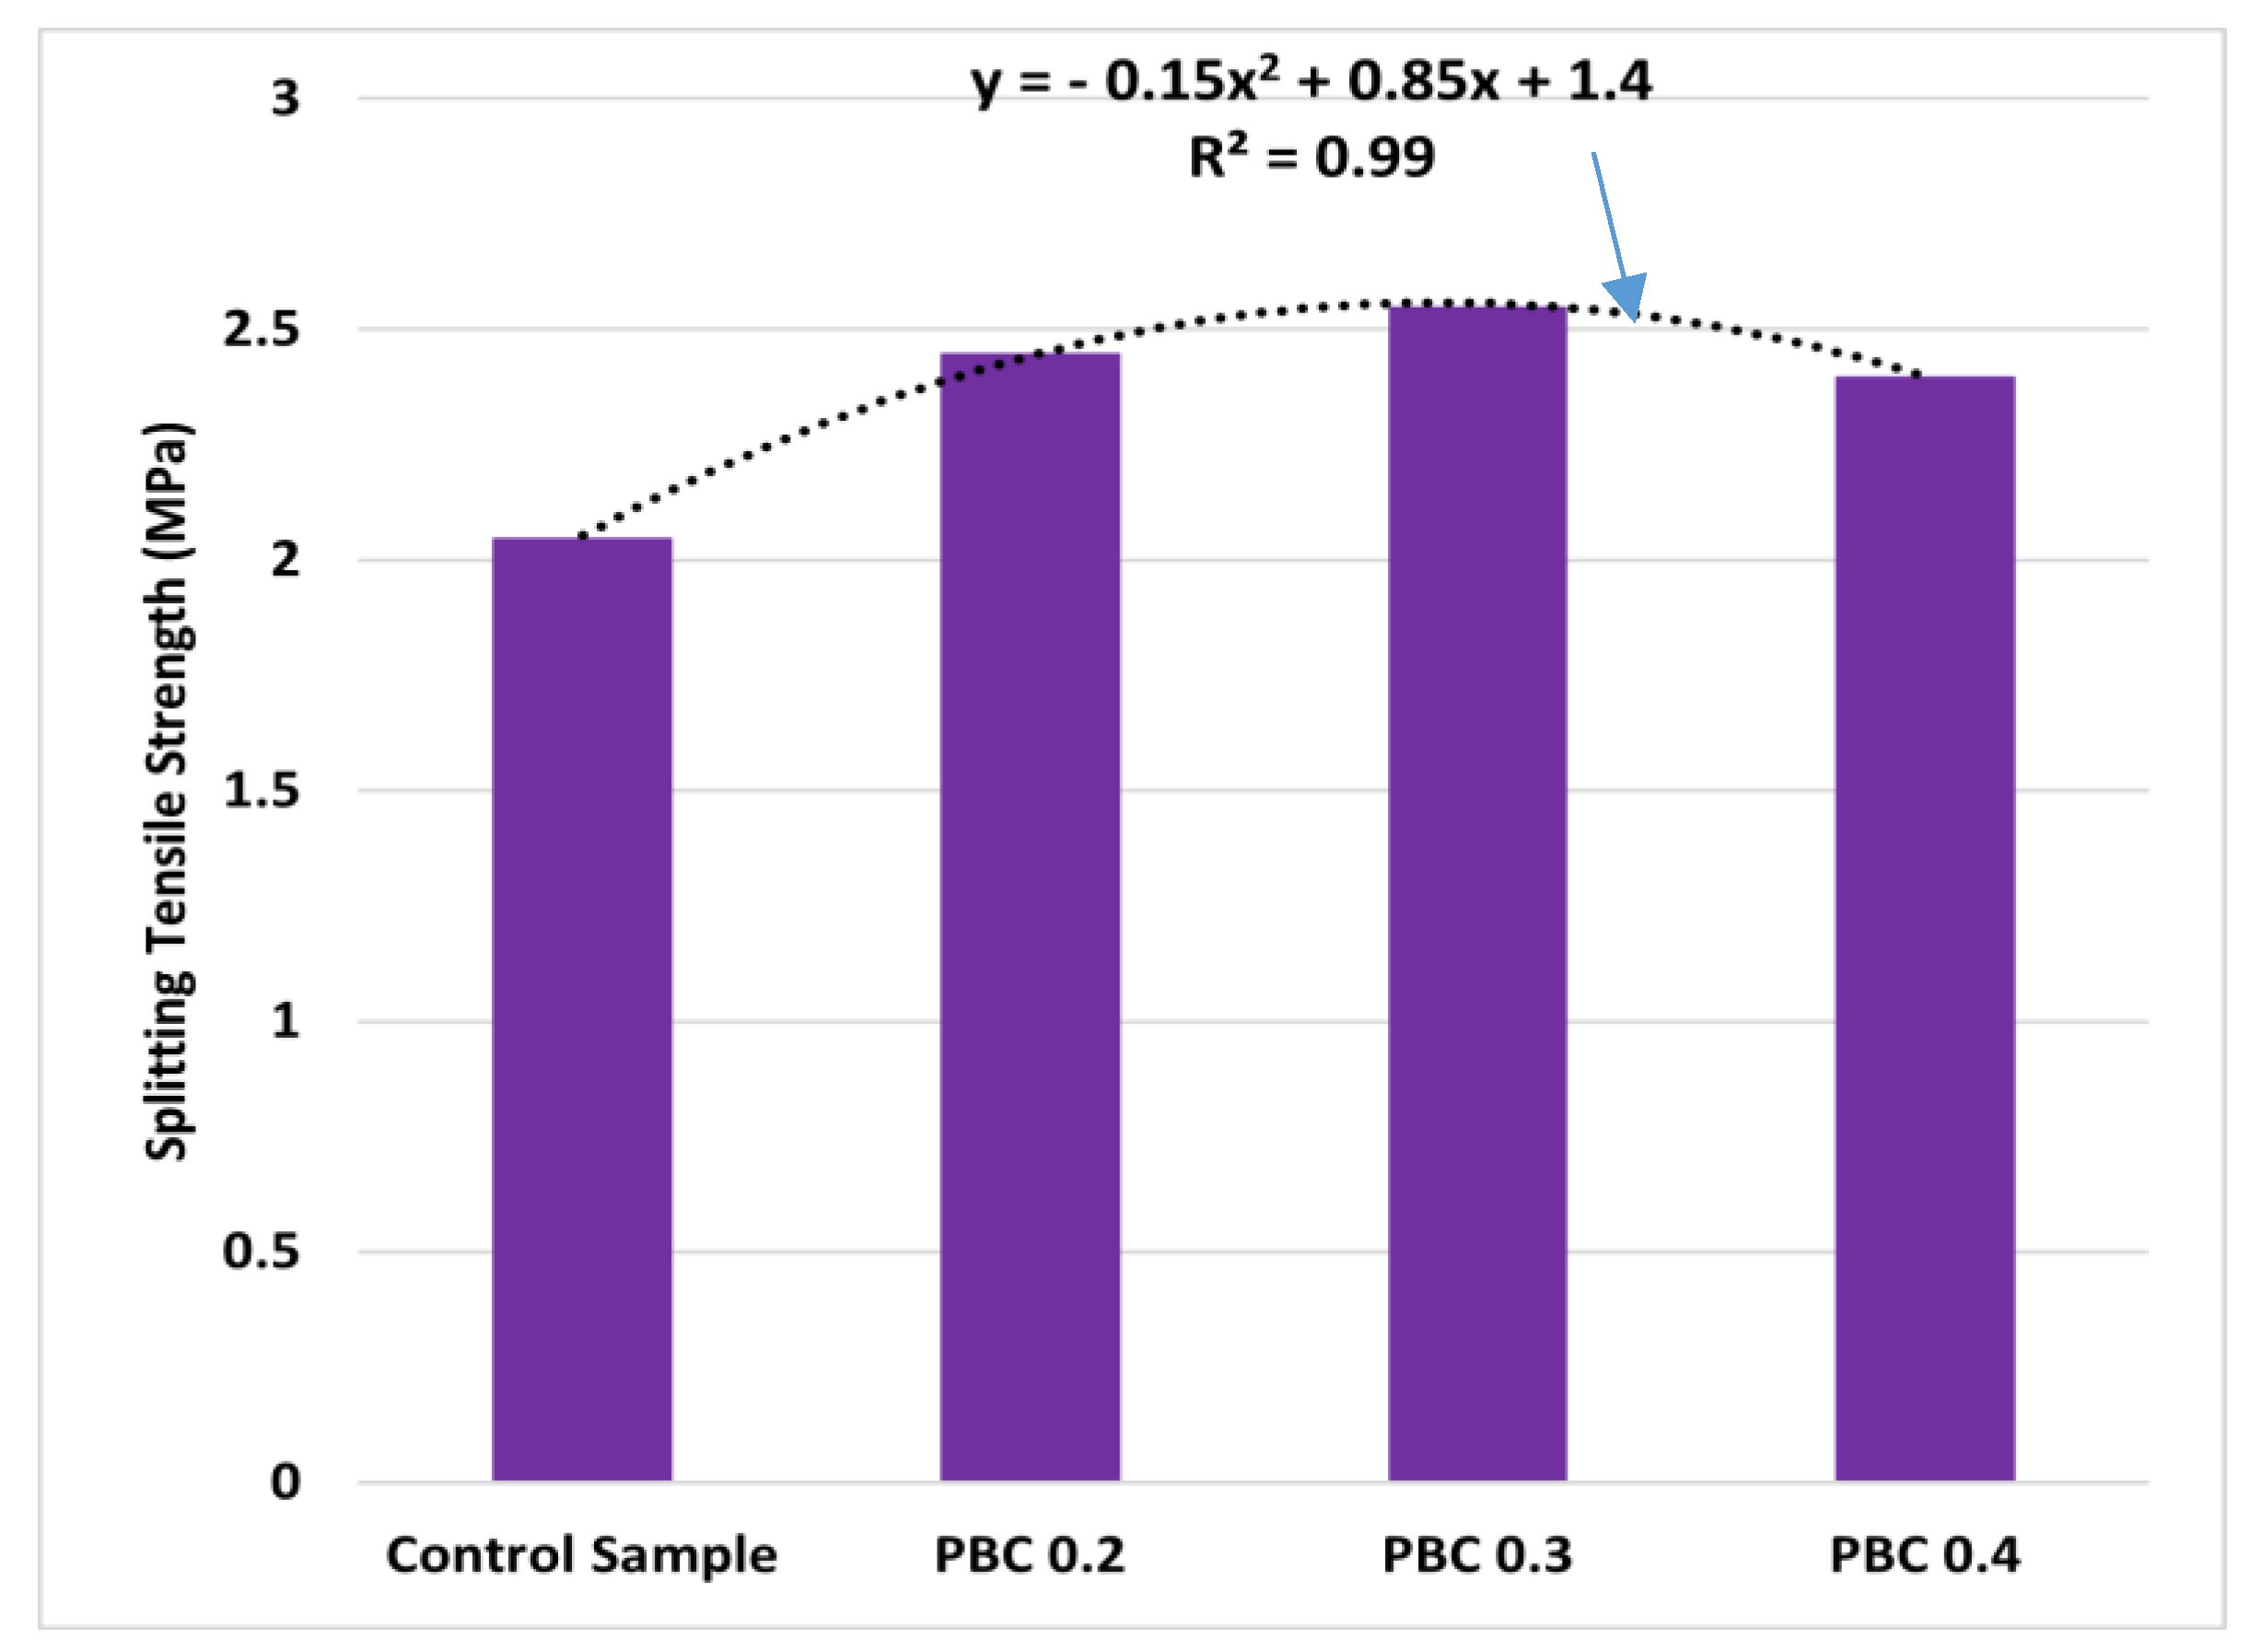
3.3. Splitting Tensile Strength
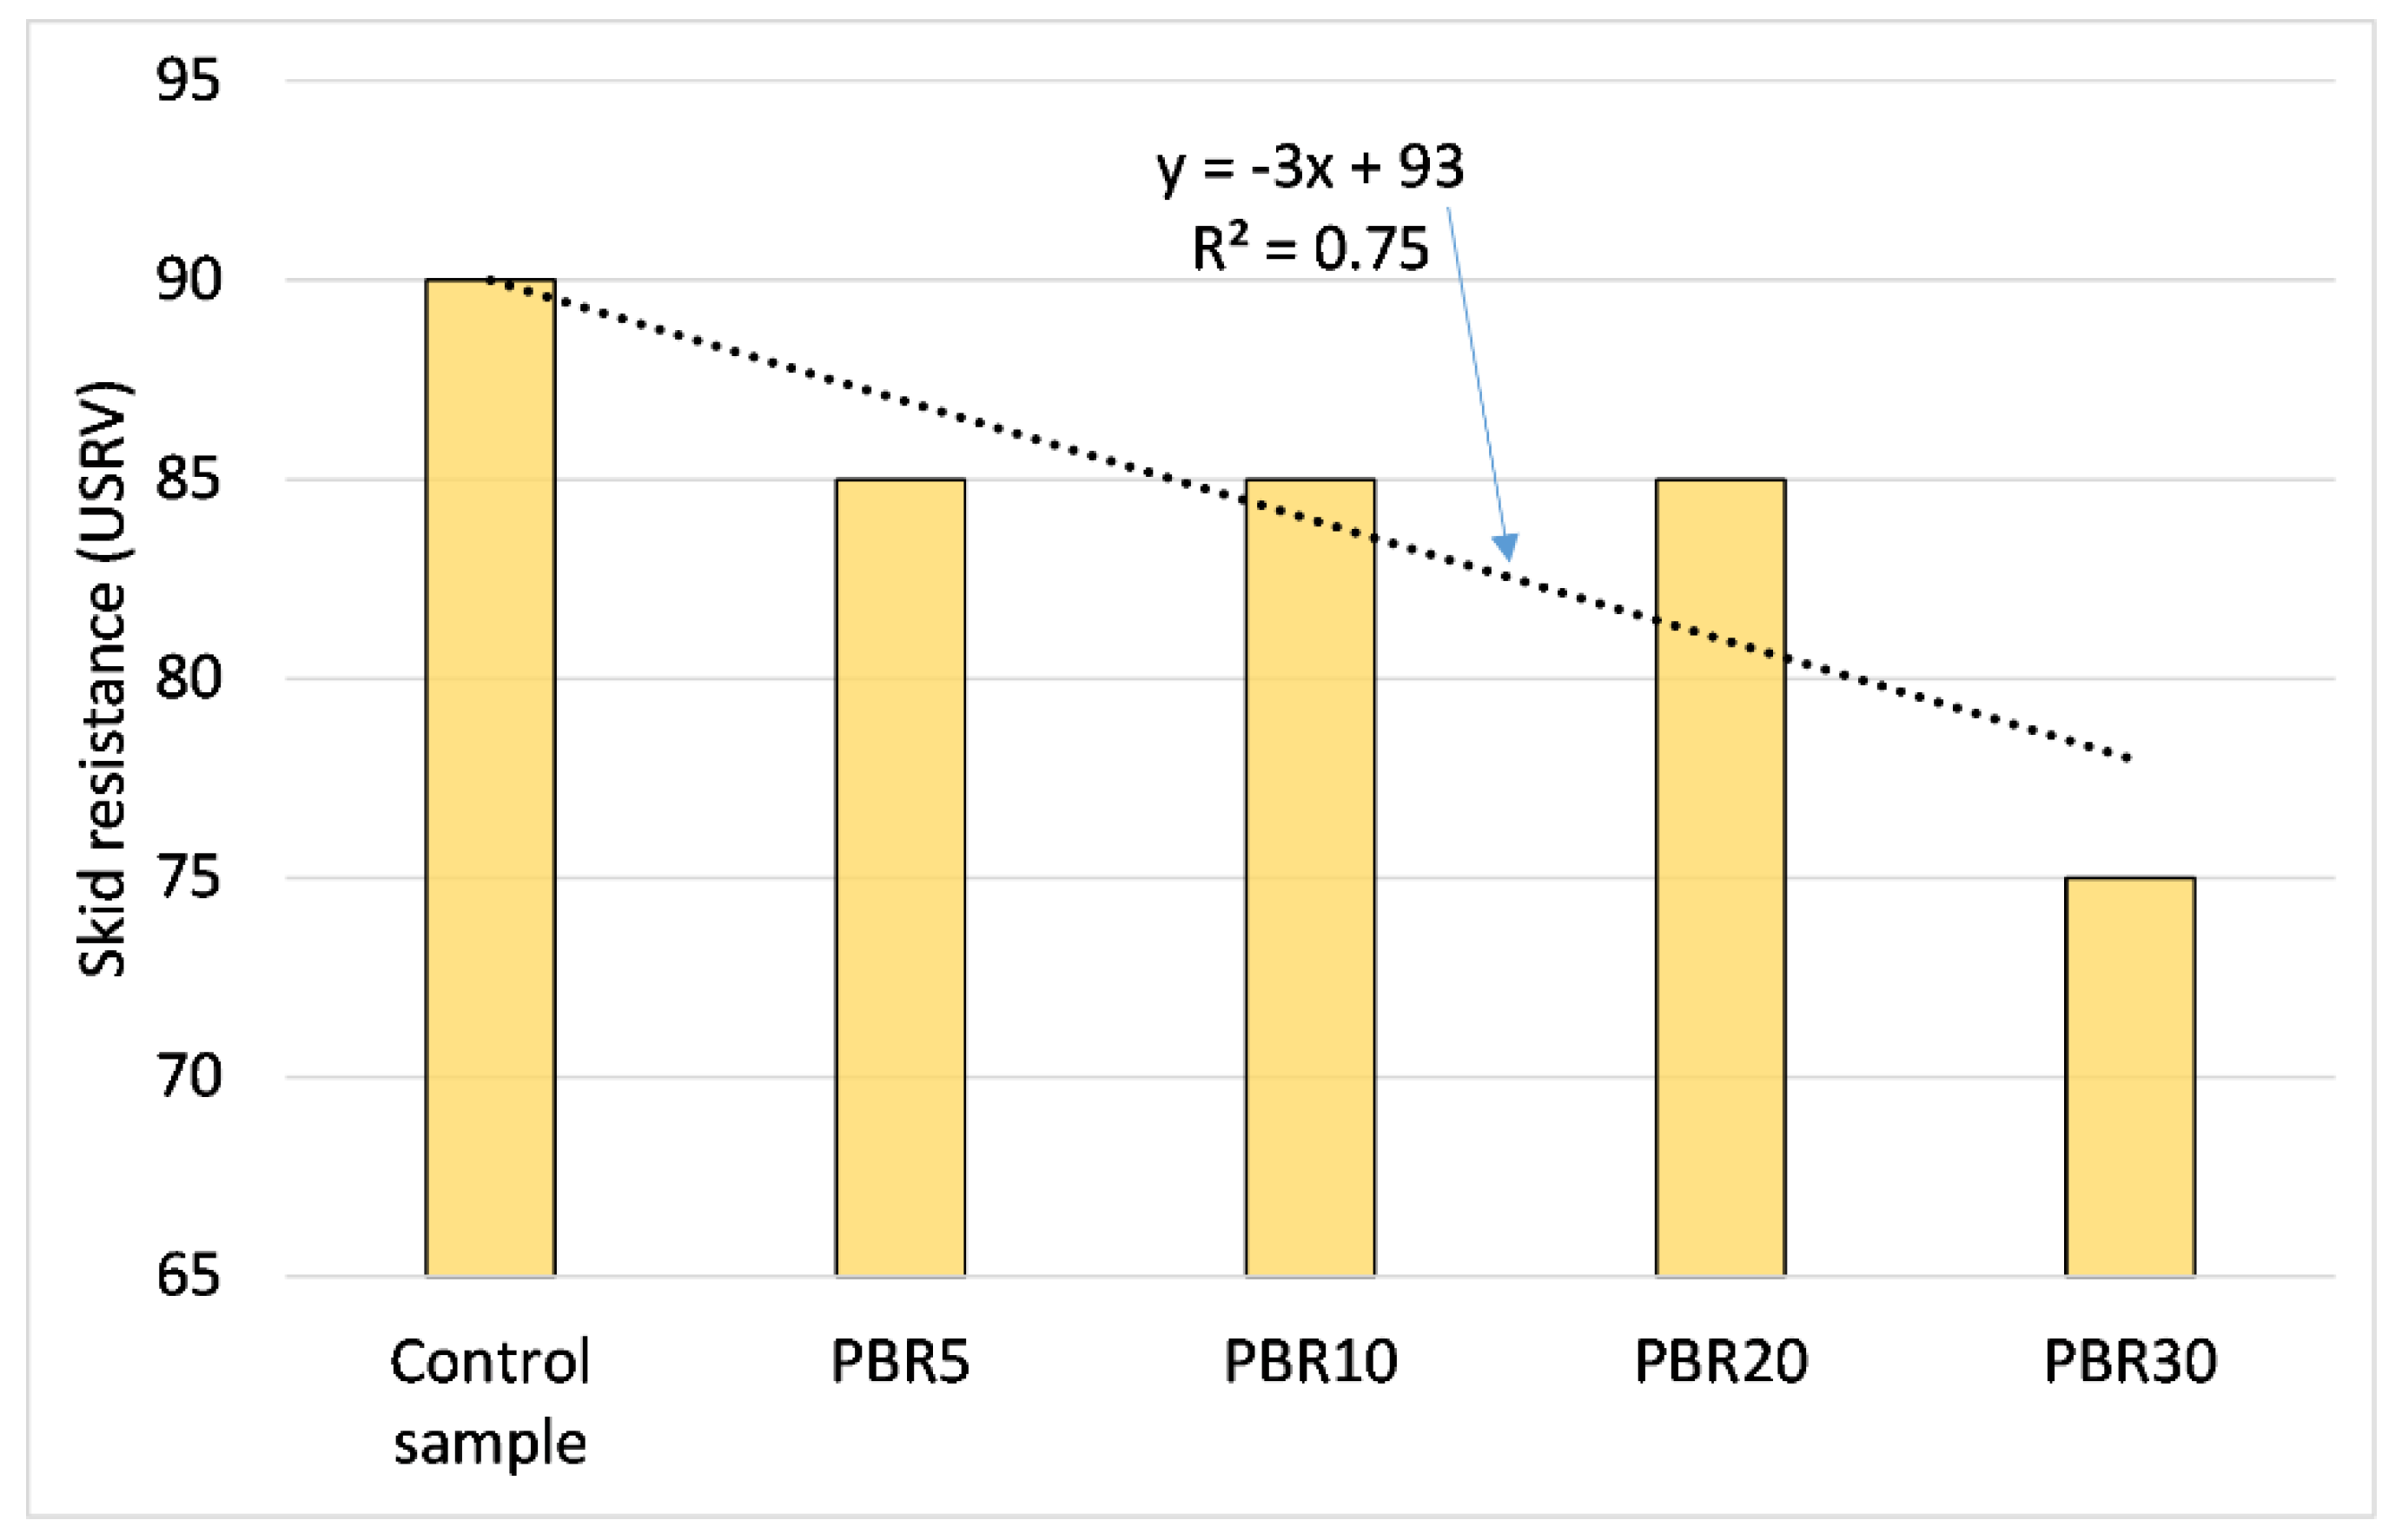
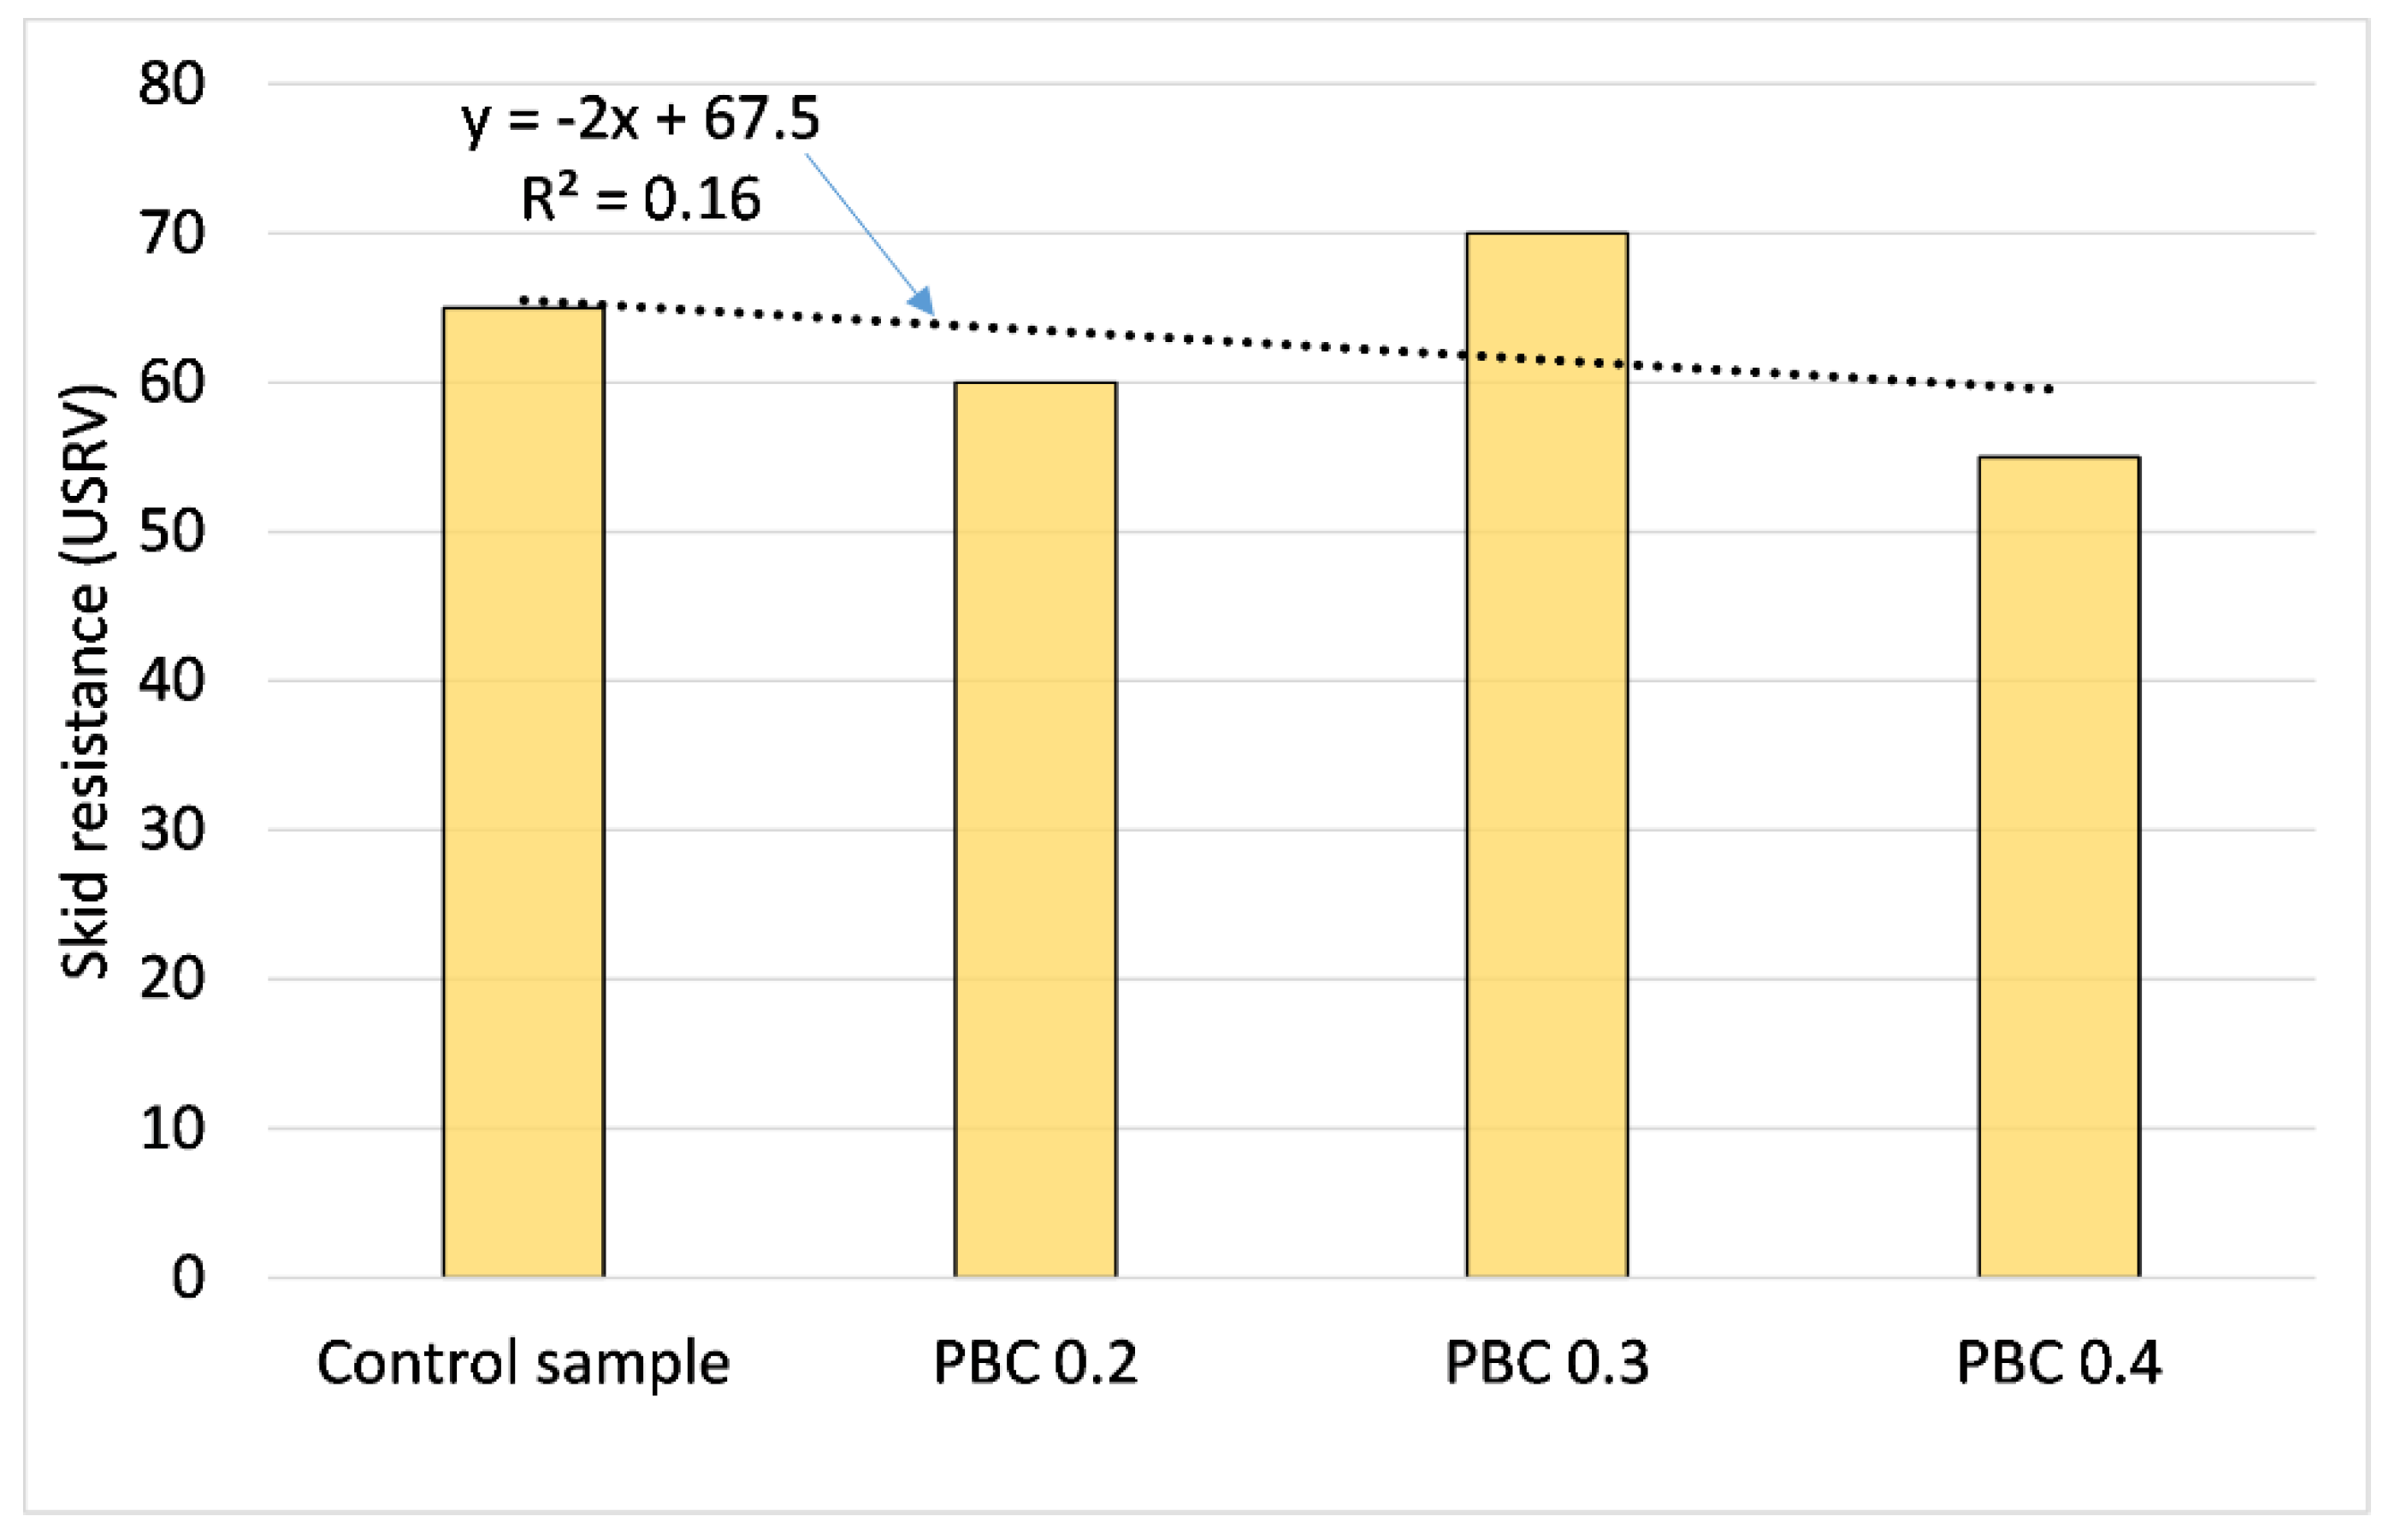
3.4. Skidding Resistance
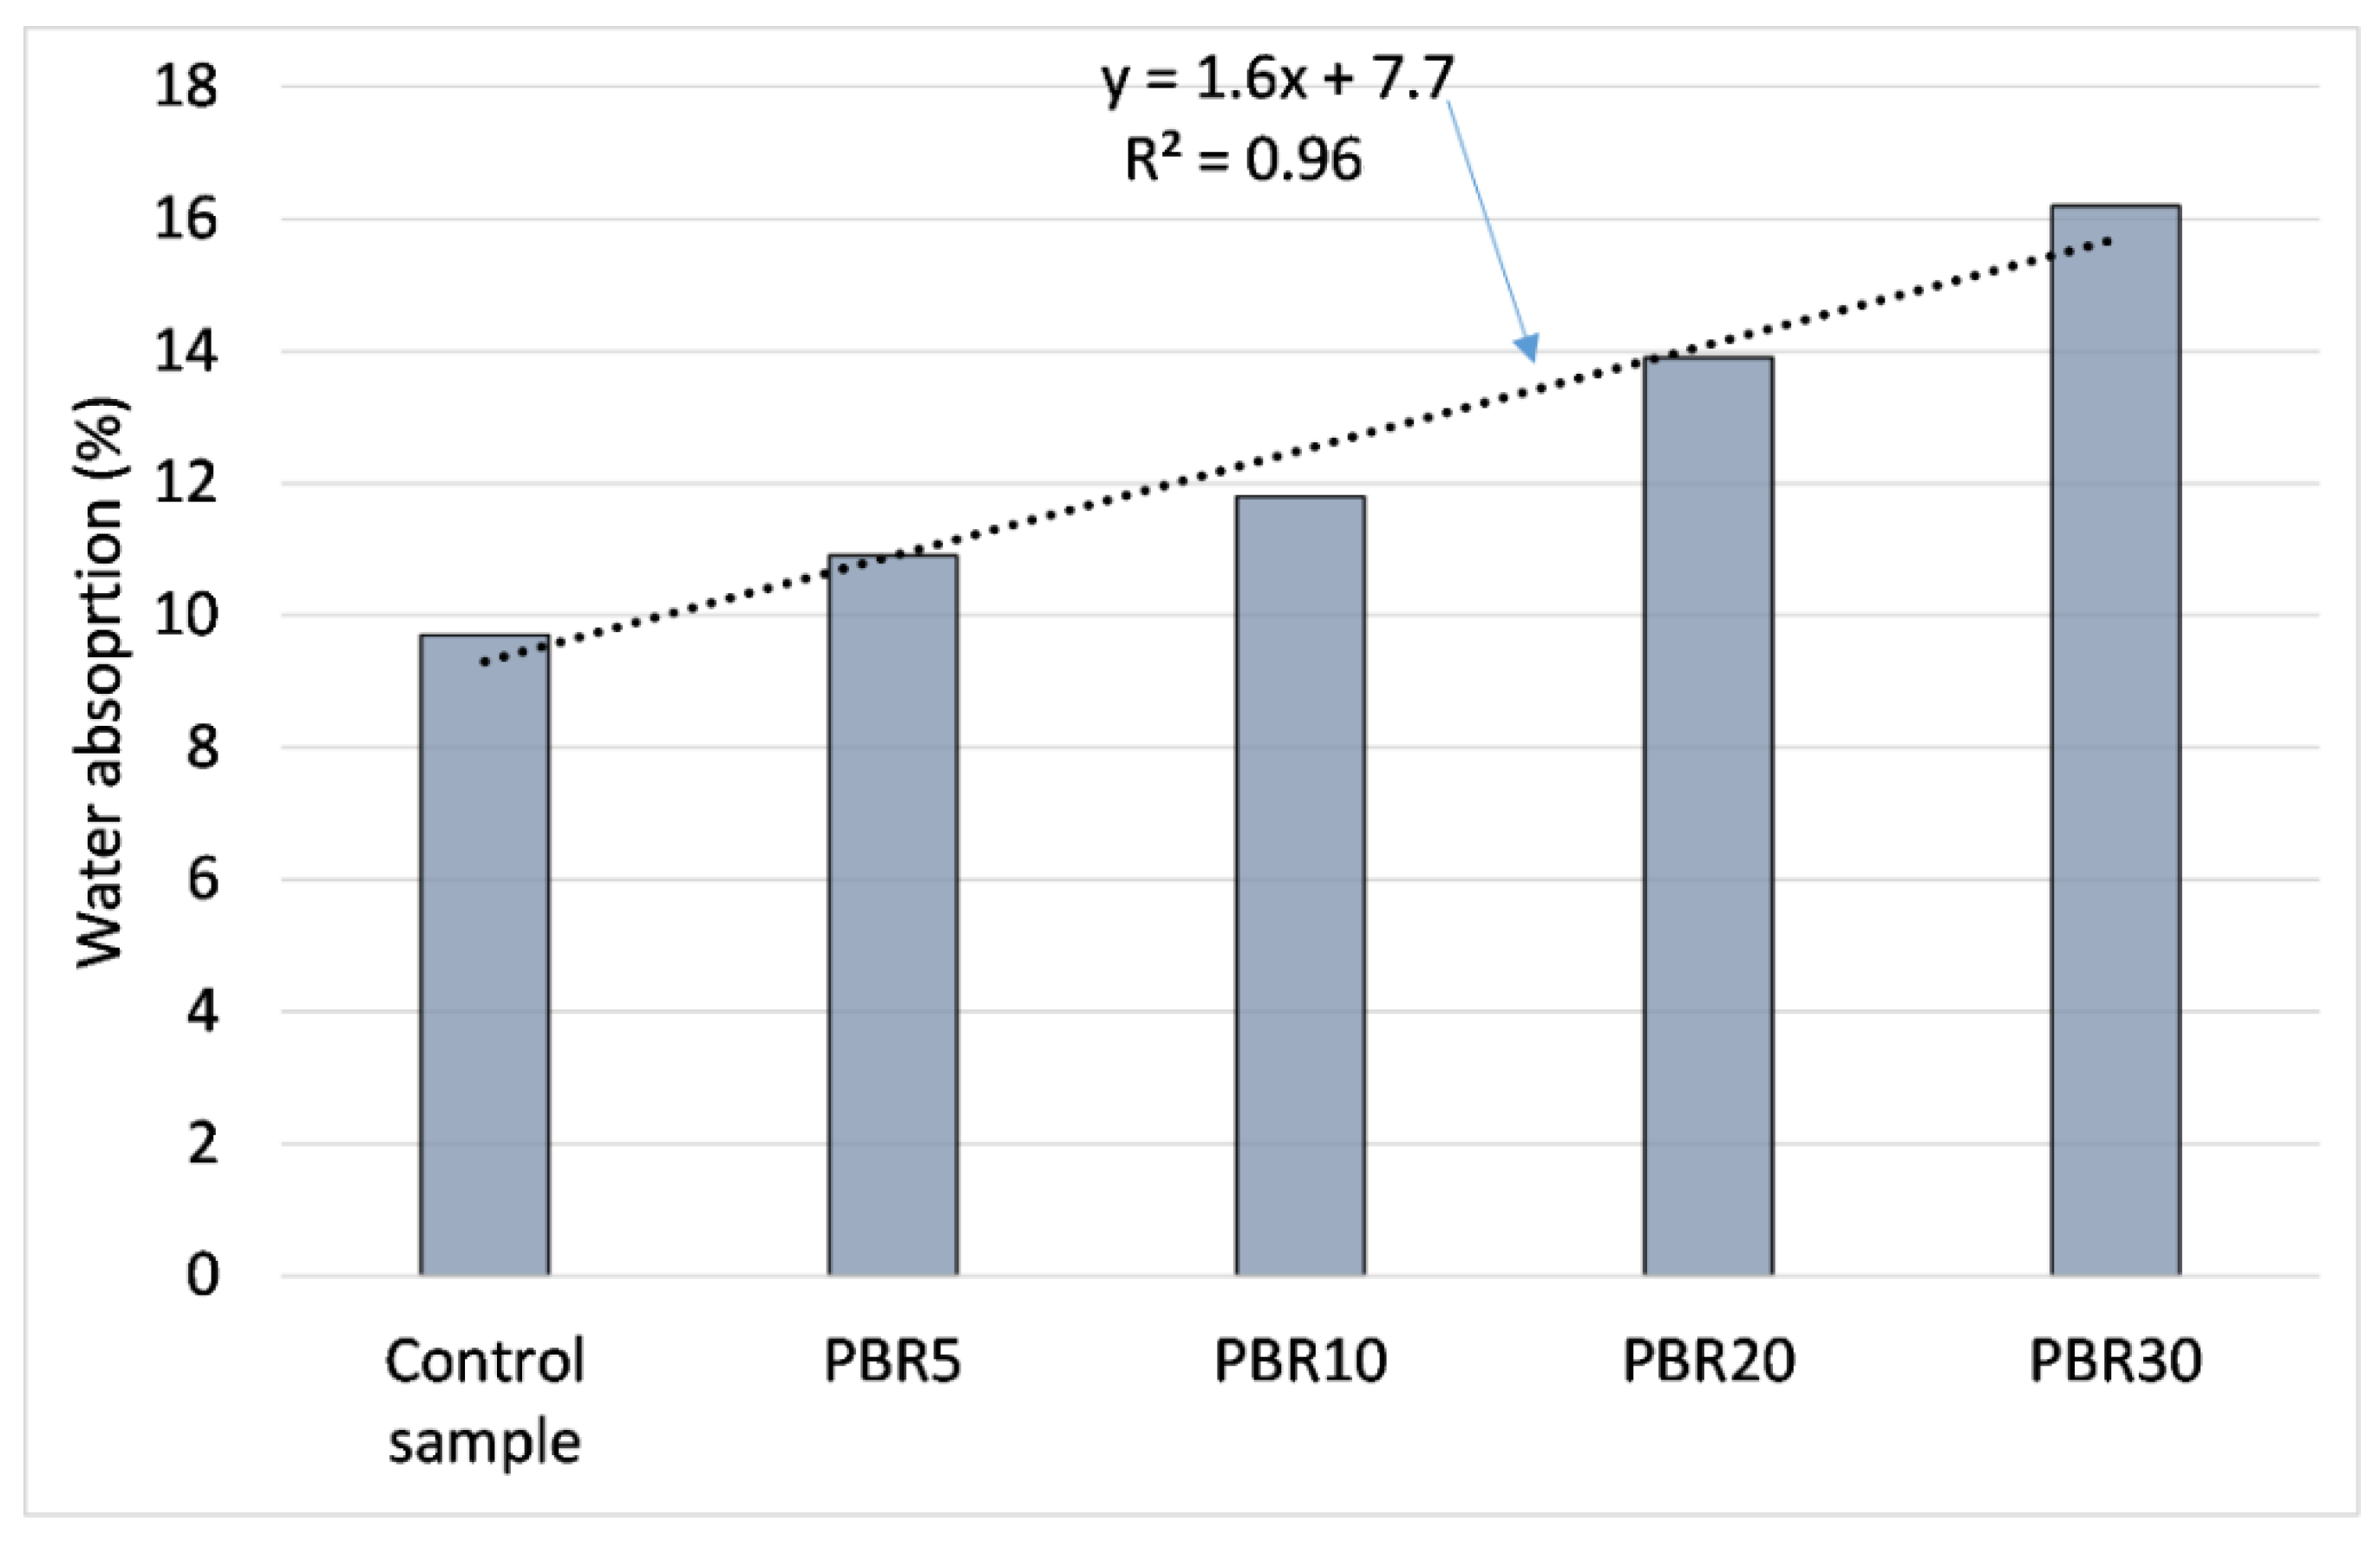
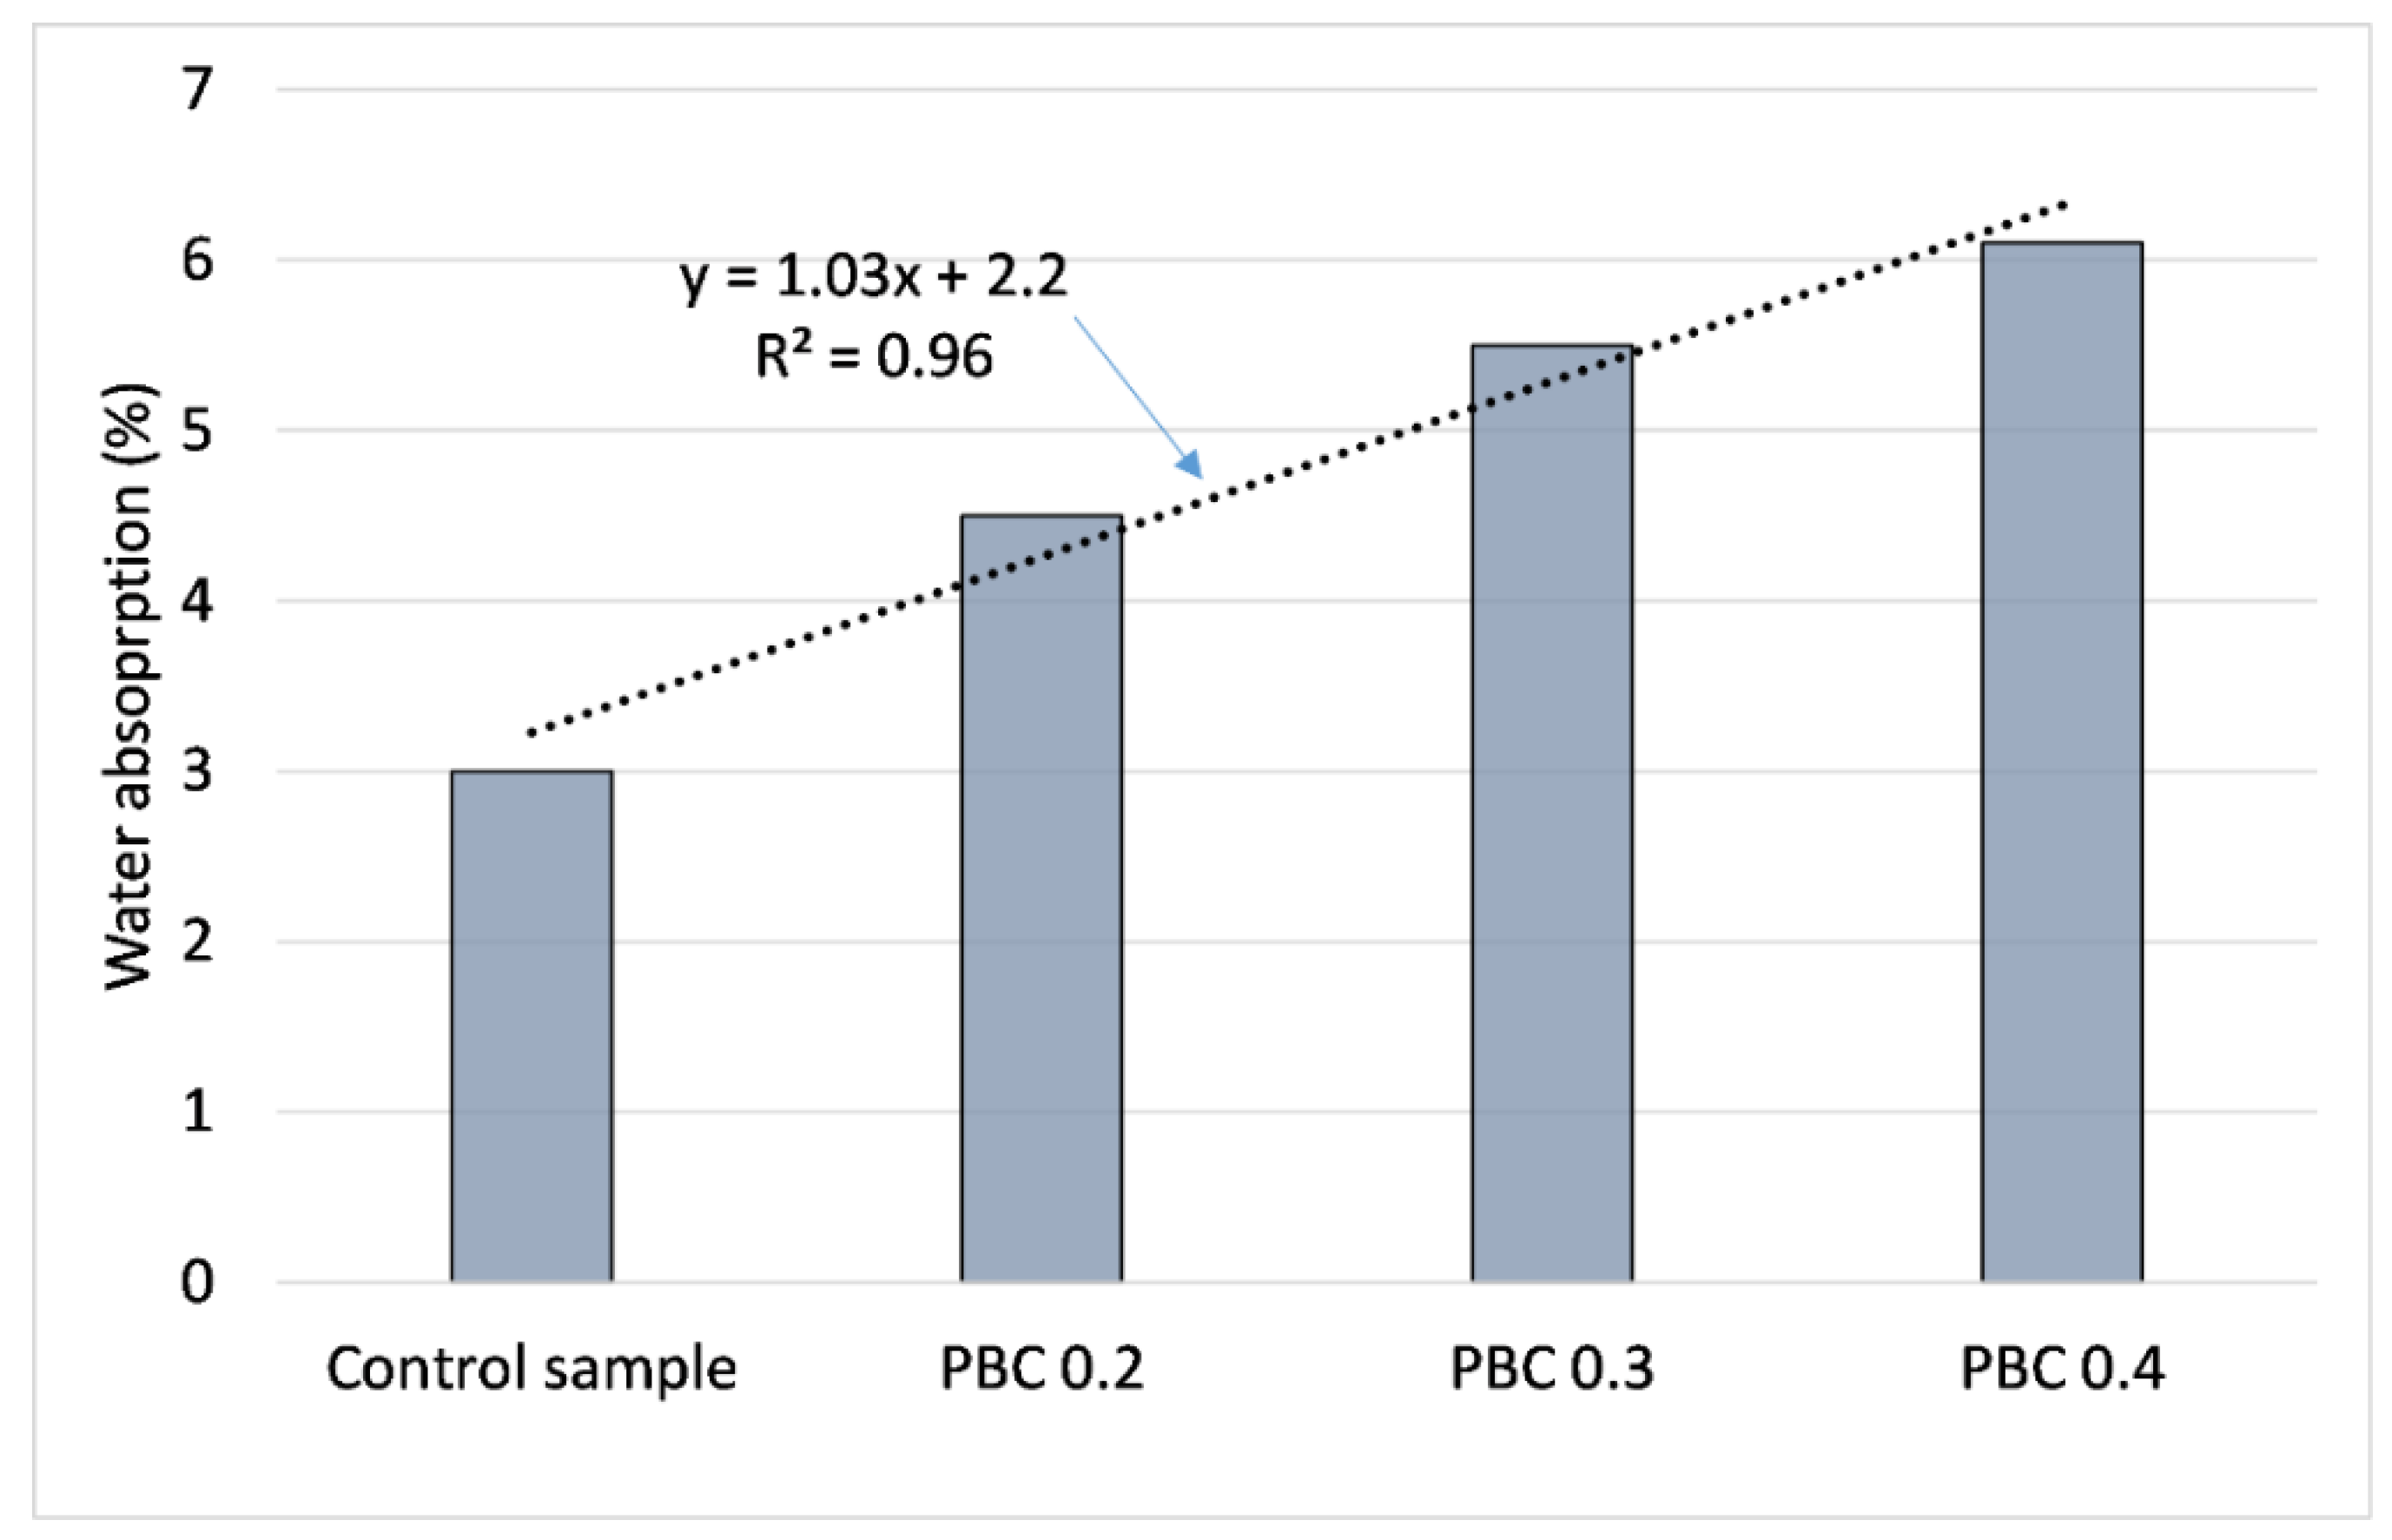
3.5. Water Absorption
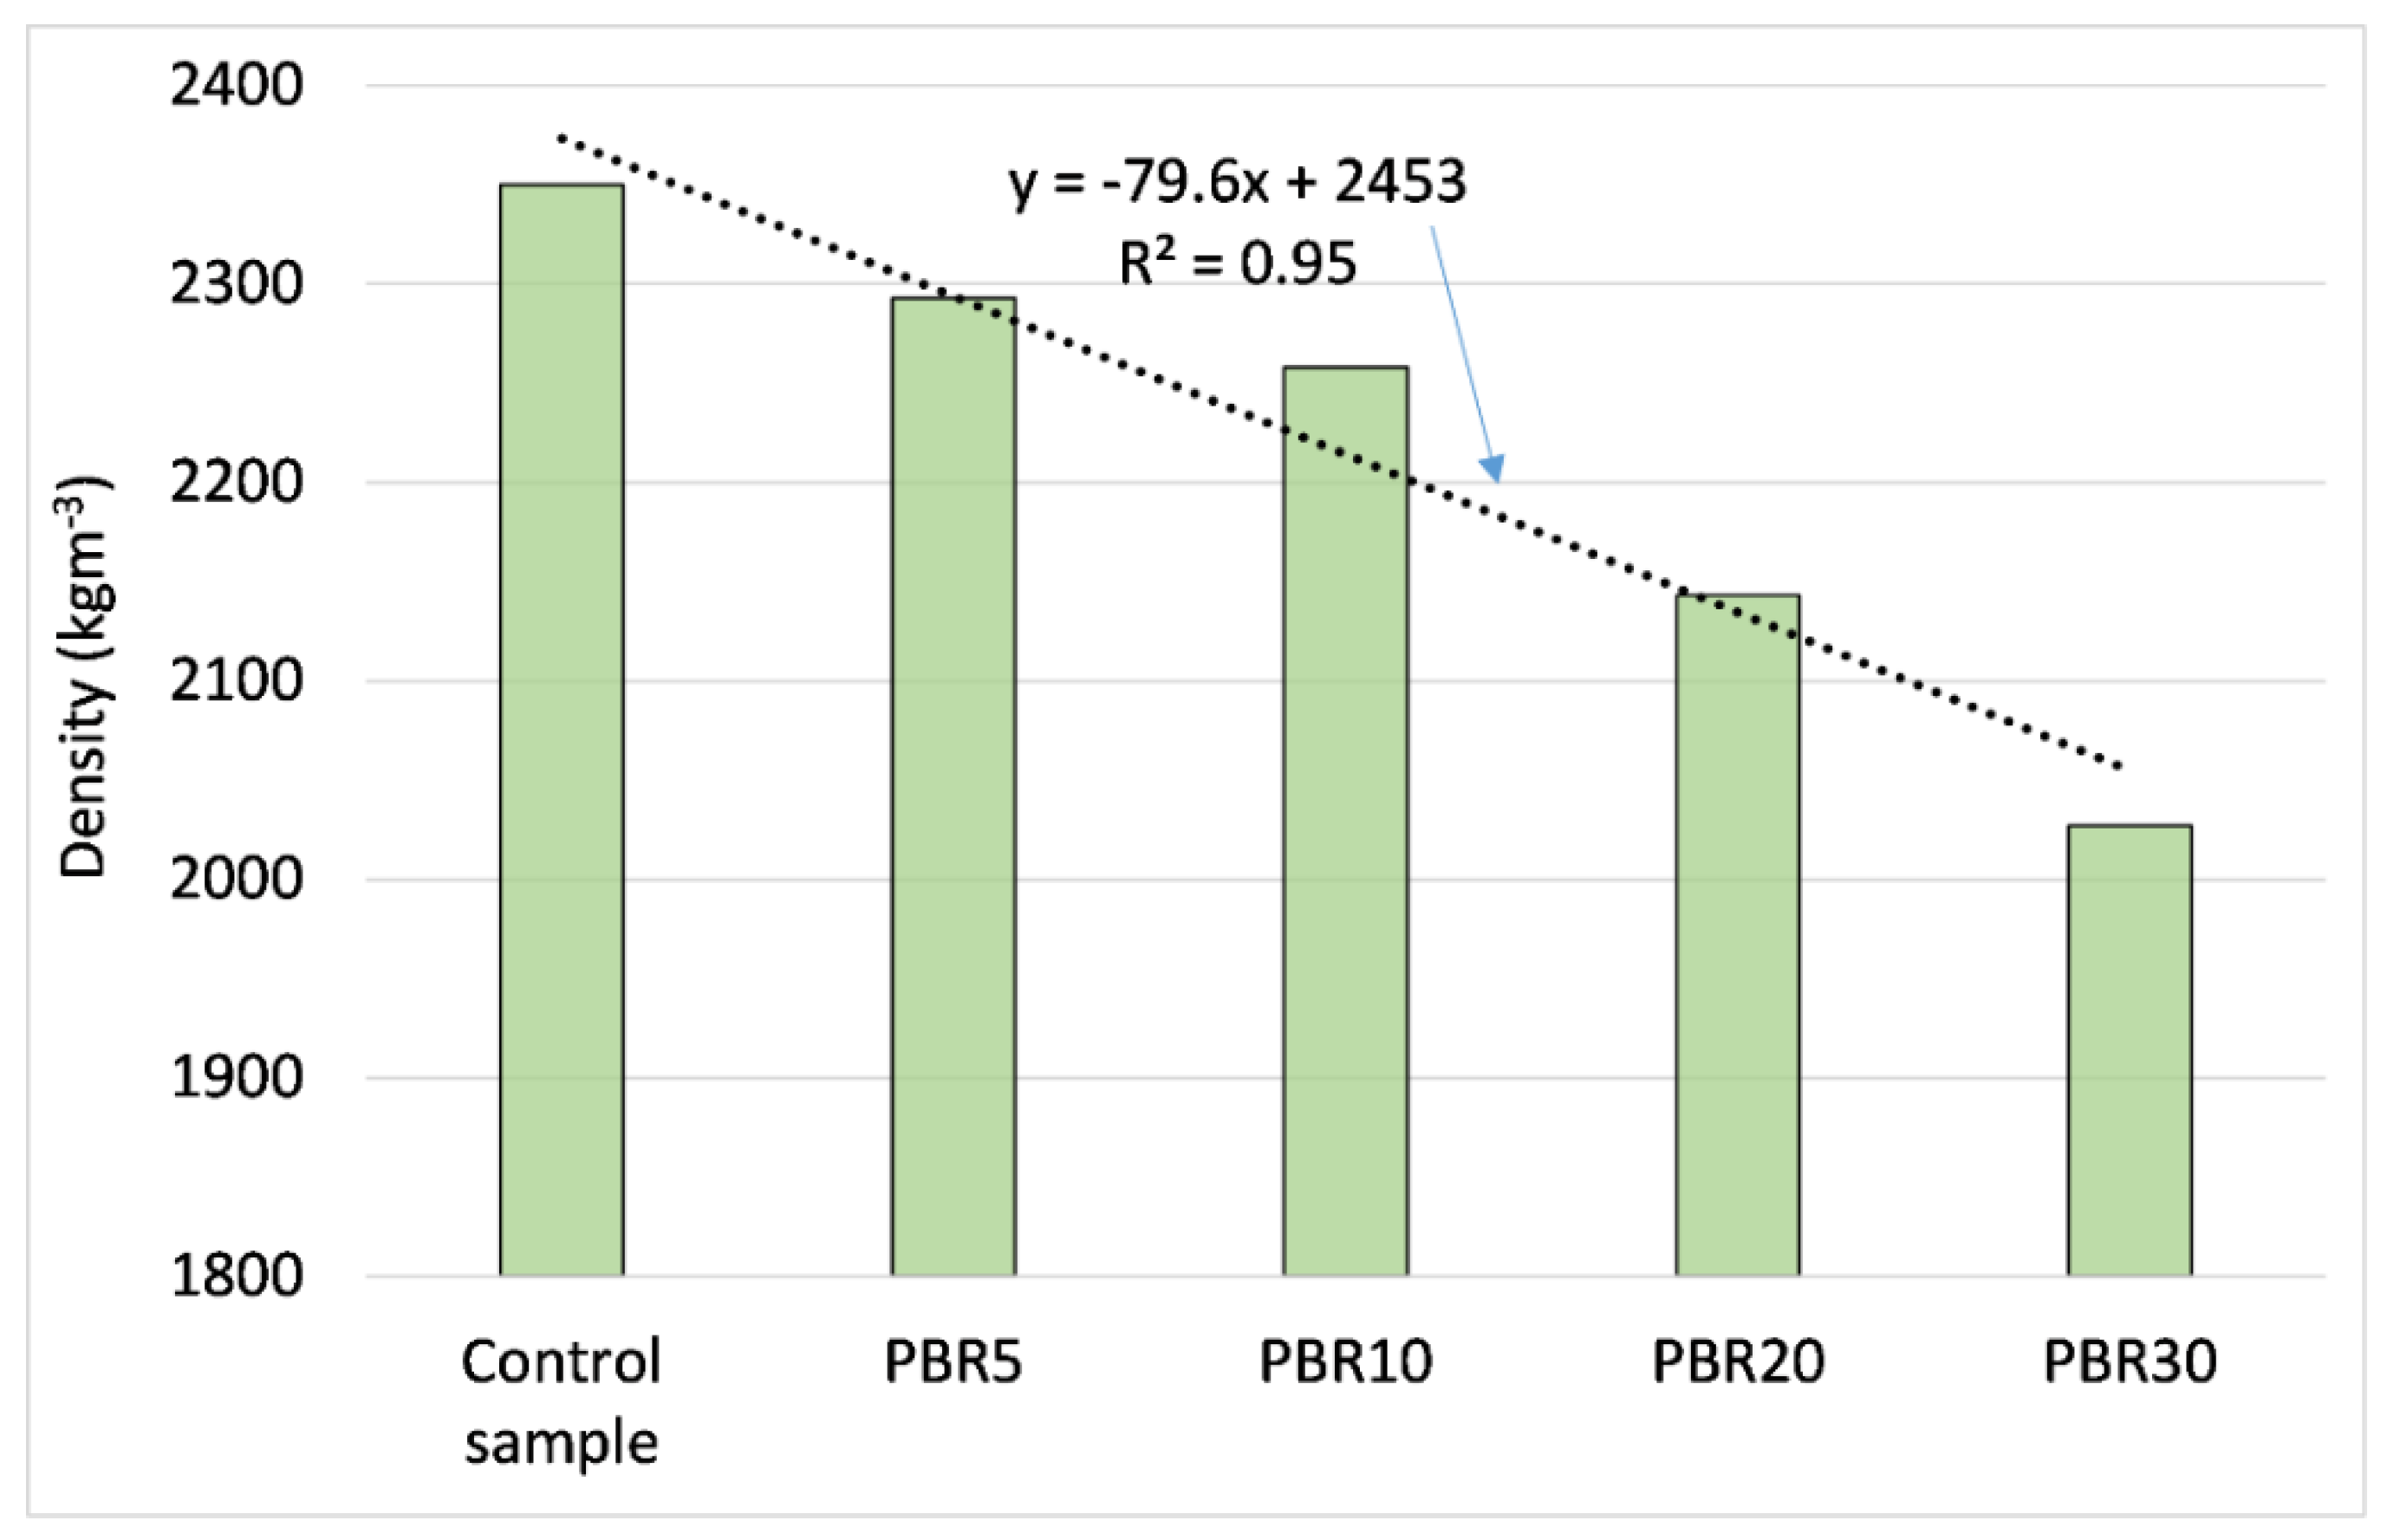
3.6. Density Analysis
3.7. Cost Analysis of Interlocking Paving Blocks
3.7.1. Crumb Rubber (Batch 1)
3.7.2. Coconut Coir Fibers (Batch 2)
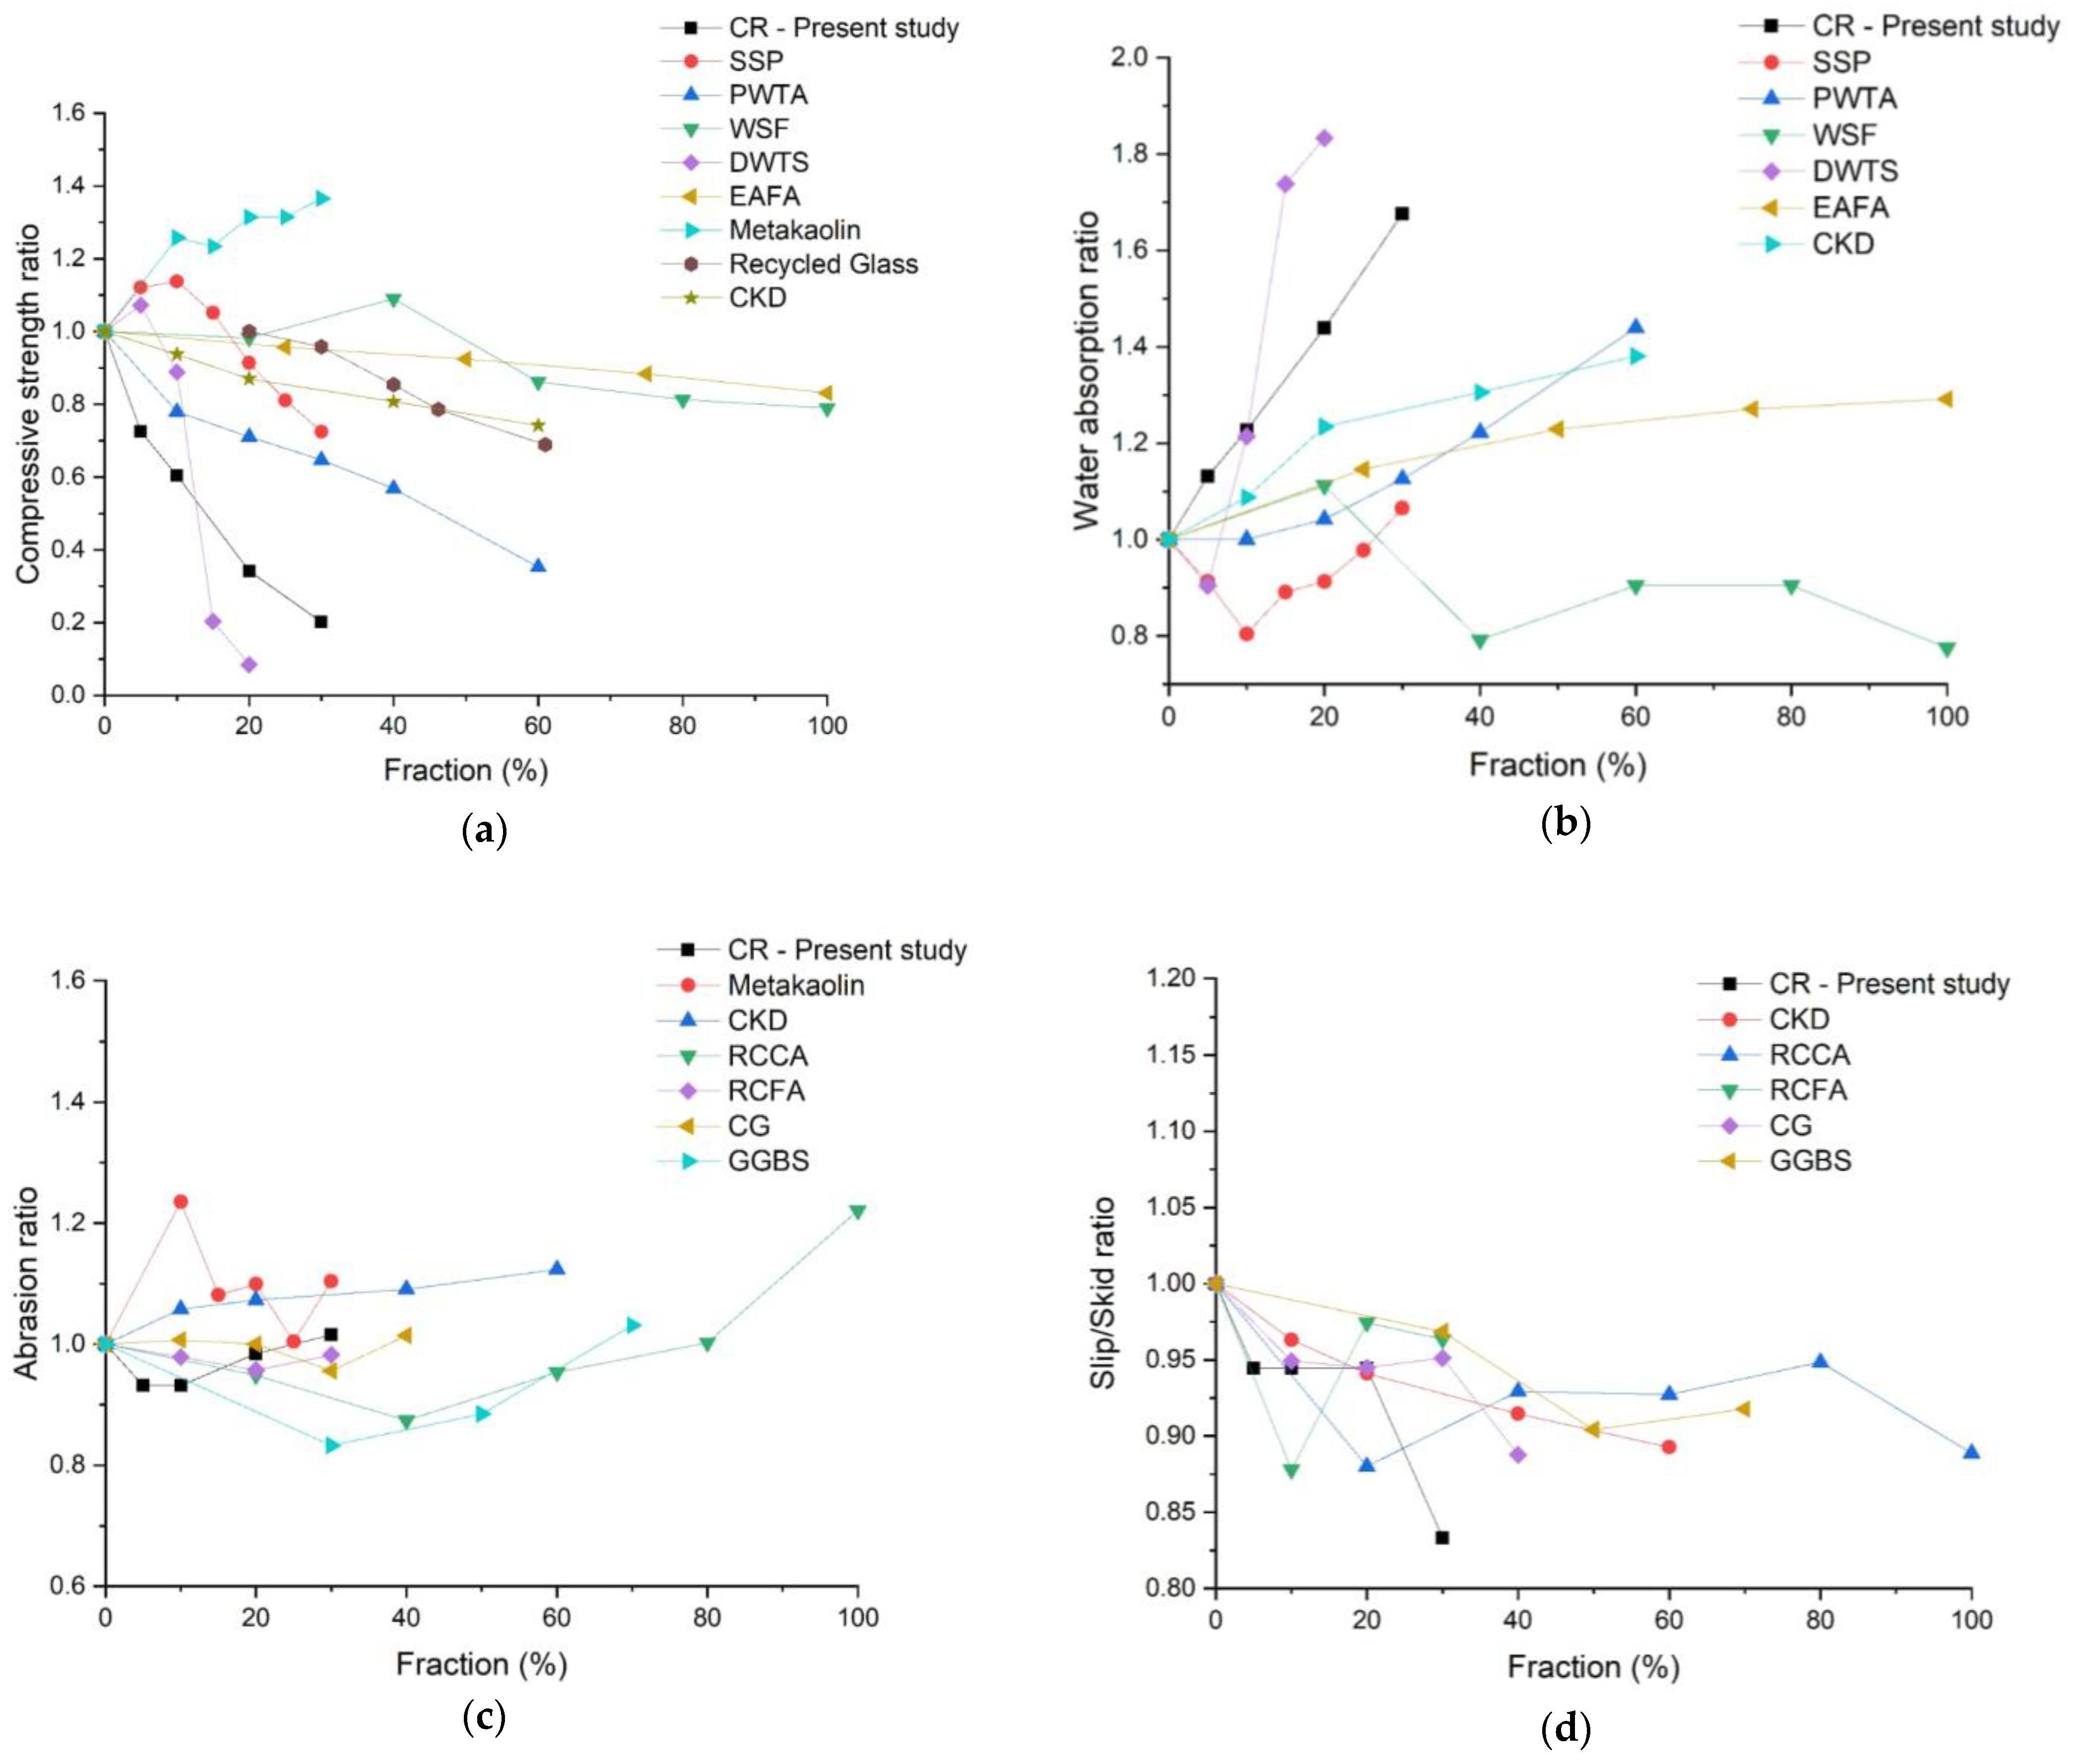
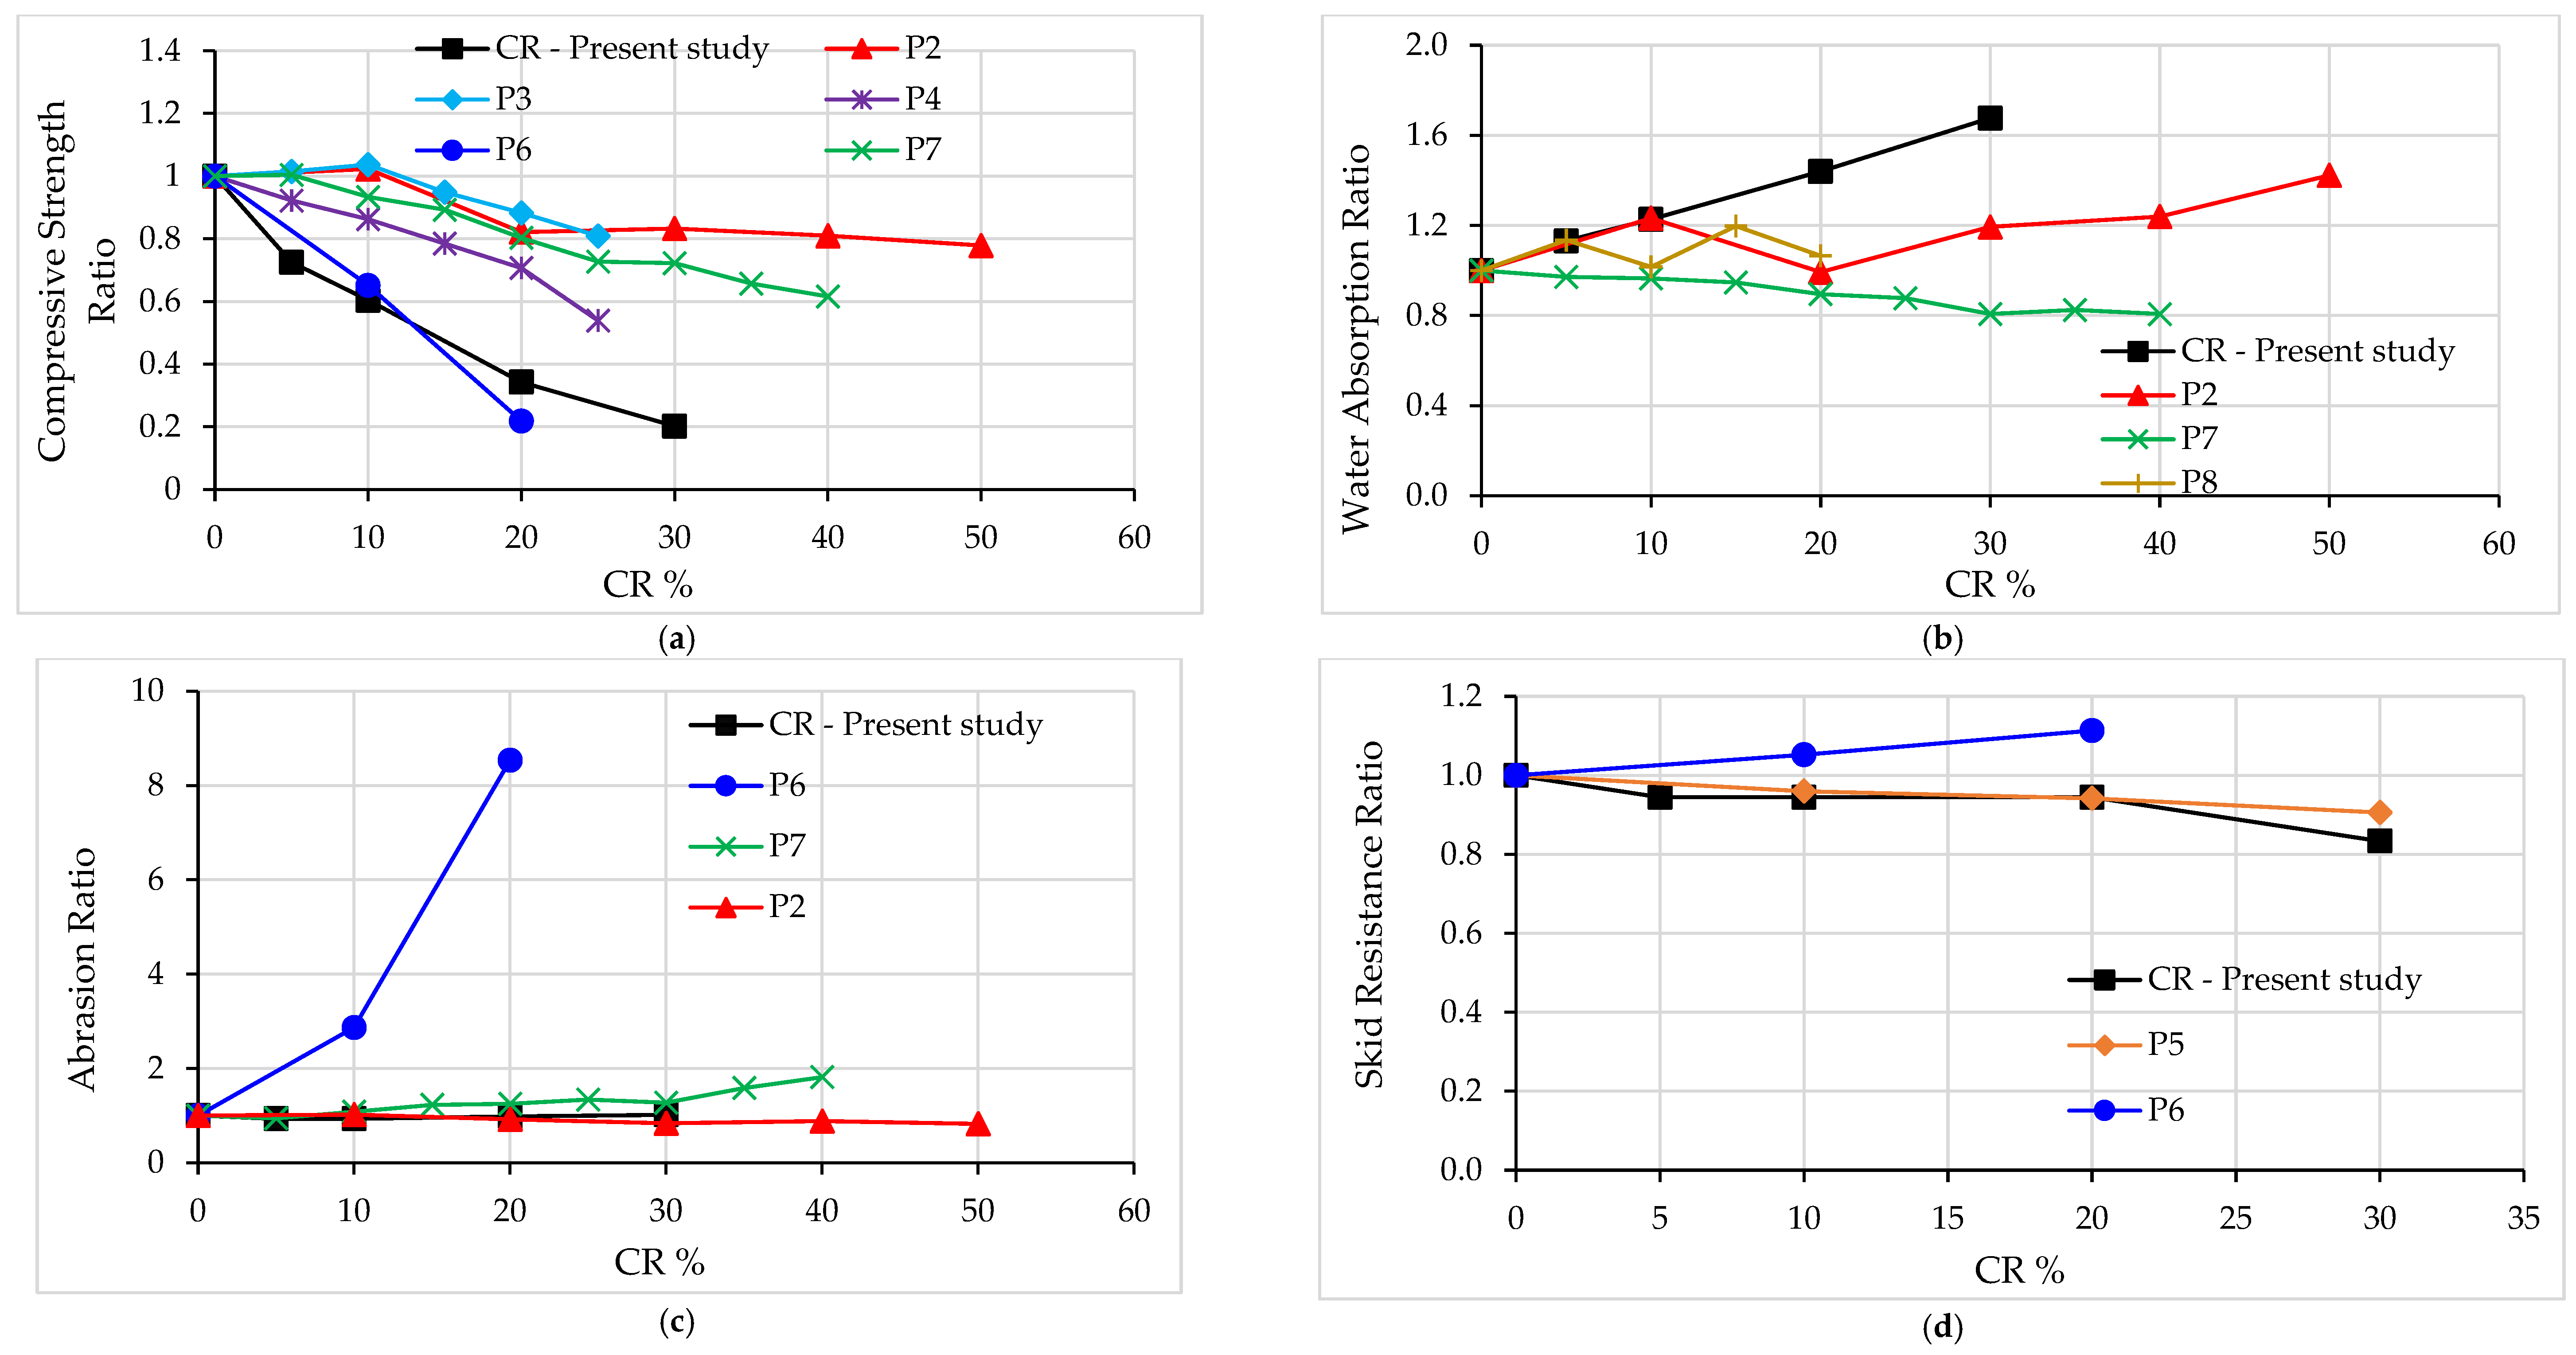
3.8. Comparison of Results with Related Work
3.8.1. Comparison of CR-Based IPB Results with Previous Work
3.8.2. Comparison of CCF-Based IPB Results with Previous Work
3.9. Limitations
- The study did not investigate the effect of CR on the split tensile strength and the effect of CCF on the density of IPBs. It was assumed that the addition of CCF (<0.5%) would not have a significant impact on the density. However, further studies are recommended in this regard.
- The blocks were examined using naked-eye observations. Therefore, the effect of CR and CCF on the microstructure of IPB was not discovered in this study. Such visualization will be imperative to interpret the results observed for various properties (Water absorption, compressive strength, etc.).
- The study limited its CR fraction to 30% and CCF fraction to 0.4%. However, the CCF fraction showcased some variations where different results could have been observed if the CCF content had increased. However, the results obtained from the present study do not rule out the findings to be elaborated in a future study, as interesting observations were noted. Therefore, it is recommended to add CCF within a relatively more extensive range to explore the relationships between the strength and durability characteristics.
- Experiments were limited to properties of durability and strength. However, further studies are encouraged on properties such as shrinkage, impact energy, etc.
- Further testing of each property, including a greater number of samples, will provide a clearer understanding of the trend of the results obtained.
- This study used manual compaction and mechanical vibrations for batch 1 and batch 2 blocks, respectively. However, we have highlighted the variation in compaction method. Therefore, for future studies, the authors recommend using a different sample preparation method.
4. Conclusions
- The compressive strength of IPB decreases with adding CR. Blocks with 5% and 10% CR satisfied the class 4 specification as per SLS1425. However, at 0.2% of CCF, the compressive strength of IPB has increased. Further increase in CCF content resulted in a reduction in compressive strength.
- Splitting tensile strength is significantly improved when the percentage of coconut coir fibers’ addition by weight increases from 0% to 0.3% in 28 days splitting tensile strength test and decreases to 0.4% CCF level. It is believed that the lignin content and low cellulose content make IPB stronger and more durable up to a limited extent.
- The presence of CR increases the air content present, increasing the water absorption of the IPB mixes. The increase in air void content decreases the density of the block, which is observed in the density results obtained in the study (density of the blocks decreased from 2350 kg/m3 to 2027 kg/m3 for mixes with 0% to 30% CR, respectively). As a result of manual compaction, the water absorption values were relatively larger compared to the obtained results for batch 2 (with CCF) samples. For batch 2, water absorption increased from 3.00% to 6.1% when the CCF fraction increases from 0% to 0.4%. This occurs due to the hydrophilic nature of the coconut coir fibers.
- The specific density of rubber is low thus, the higher the amount of CR partially substituted in the IPB, the lower the density of the IPB.
- PBR5 and PBR10 IPBs displayed the highest abrasion resistance. Abrasion depth has an overall increase in the presence of CR and CCF. However, a reduction is observed for PBR20 and PBR30, regardless of the overall trend. Furthermore, the obtained values comply with the values specified in SLS 1425 and BS EN 1338 (<20 mm).
- The skid resistance of the CR-based IPB satisfied SLS 1425 (>55 USRV) and BS EN 1338 (>75 USRV) recommendations. However, IPBs with CCF only satisfied the specification given in the SLS1425 standard (>55 USRV).
- The cost-effectiveness of these coconut coir-based interlocking paving blocks is significant. As a waste material, CCF improves the strength and durability characteristics of IPB without affecting its cost. As coconut coir is dumped as a waste and can be collected for a free or very low price in the local context. For batch 1, the IPB from the PBR10 mix was recommended as the optimum fraction of CR, because increasing the CR percentage beyond 10% decreased the block’s compressive strength.
Author Contributions
Funding
Data Availability Statement
Acknowledgments
Conflicts of Interest
References
- Interlocking Concrete Pavement Institute. How Do Interlocking Pavers Work. PaveShare: A Segmental Paving Resource for Landscape Architects. Available online: http://www.paveshare.org/1/post/2012/01/how-do-interlocking-pavers-work.html (accessed on 10 November 2021).
- Limbachiya, V.; Ganjian, E.; Claisse, P. Strength, durability and leaching properties of concrete paving blocks incorporating GGBS and SF. Constr. Build. Mater. 2016, 113, 273–279. [Google Scholar] [CrossRef]
- Concrete Paving Blocks: An Overview. Final Technical Report. Available online: https://www.wsdot.wa.gov/research/reports/fullreports/319.1.pdf (accessed on 1 December 2021).
- Edayadiyil, J.B.; Mathew, S.; Joy, M. A methodology for the effective use of materials in concrete paving block. IOP Conf. Ser. Mater. Sci. Eng. 2021, 1114, 012011. [Google Scholar] [CrossRef]
- Interlocking Concrete Paver Blocks. Available online: https://www.nbmcw.com/product-technology/construction-chemicals-waterproofing/concrete-admixtures/interlocking-concrete-paver-blocks.html (accessed on 10 November 2021).
- Elnouhy, H.; Zeedan, S. Performance evaluation of interlocking paving units in aggressive environments. HBRC J. 2012, 8, 81–90. [Google Scholar] [CrossRef] [Green Version]
- Palanikumar, P.U.K.E. Structural Design of Interlocking Concrete Paving Block. Int. J. Eng. Res. 2016, 5, 230–232. [Google Scholar] [CrossRef]
- Unilock. Design Considerations for Interlocking Concrete Pavements. Available online: https://3vfdf1d71bfa9odb2zenhe14-wpengine.netdna-ssl.com/wp-content/uploads/sites/10/mp/files/assets/files/design-considerations-interlocking-pavements17.pdf (accessed on 10 December 2021).
- Sojobi, A.; Aladegboye, O.; Awolusi, T. Green interlocking paving units. Constr. Build. Mater. 2018, 173, 600–614. [Google Scholar] [CrossRef]
- Estolano, A.M.; de Lima, N.B.; Junior, R.V.; Belarmino, M.K.; Silva, A.I.; Nascimento, C.; Oliveira, N.T.; Lima, V.; Ioras, R.U.; Oliveira, R.A.; et al. Concrete paving blocks: Structural, thermodynamic, fluorescence, optical and mechanical properties. J. Mol. Struct. 2019, 1184, 443–451. [Google Scholar] [CrossRef]
- Sadek, D.M.; El-Attar, M.M.; Ali, A.M. Physico-mechanical and durability characteristics of concrete paving blocks incorporating cement kiln dust. Constr. Build. Mater. 2017, 157, 300–312. [Google Scholar] [CrossRef]
- Wang, X.; Chin, C.S.; Xia, J. Material Characterization for Sustainable Concrete Paving Blocks. Appl. Sci. 2019, 9, 1197. [Google Scholar] [CrossRef] [Green Version]
- Bhandari, P. Experimental Investigation on Corrugated Interlocking Paving Blocks (CIPB) for strength and durability study. Int. J. Mod. Trends Eng. Res. 2016, 3, 86–90. [Google Scholar]
- Santos, C.; Valentina, L.O.V.D.; Cuzinsky, F.; Witsmiszyn, L. Interlocking Concrete Paving Blocks Produced with Foundry Sand Waste. Mater. Sci. Forum 2018, 912, 191–195. [Google Scholar] [CrossRef]
- Olofinnade, O.; Morawo, A.; Okedairo, O.; Kim, B. Solid waste management in developing countries: Reusing of steel slag aggregate in eco-friendly interlocking concrete paving blocks production. Case Stud. Constr. Mater. 2021, 14, e00532. [Google Scholar] [CrossRef]
- Abdullah, A.; Lee, C. Effect of Treatments on Properties of Cement-fiber Bricks Utilizing Rice Husk, Corncob and Coconut Coir. Procedia Eng. 2017, 180, 1266–1273. [Google Scholar] [CrossRef]
- Grammelis, P.; Margaritis, N.; Dallas, P.; Rakopoulos, D.; Mavrias, G. A Review on Management of End of Life Tires (ELTs) and Alternative Uses of Textile Fibers. Energies 2021, 14, 571. [Google Scholar] [CrossRef]
- Technical Guidelines on Solid Waste Management in Sri Lanka. Available online: https://www.cea.lk/web/en/publication (accessed on 4 April 2021).
- Kordoghli, S.; Paraschiv, M.; Kuncser, R.; Tazerout, M.; Prisecaru, M.; Zagrouba, F.; Georgescu, I. Managing the environmental hazards of waste tires. J. Eng. Stud. Res. 2016, 1–20, 50–60. [Google Scholar] [CrossRef]
- Tsang, H.H. Uses of Scrap Rubber Tires. In Rubber: Types, Properties and Uses; Tsang, H.H., Ed.; Nova Science Publishers: New York, NY, USA, 2013; pp. 477–491. [Google Scholar]
- Ling, T.C.; Nor, H.M.; Hainin, M.R.; Lim, S.K. Long-term strength of rubberised concrete paving blocks. Proc. Inst. Civ. Eng. Constr. Mater. 2010, 163, 19–26. [Google Scholar] [CrossRef]
- Ling, T.C.; Nor, H. Granulated waste tyres in concrete paving block. In Proceedings of the 6th Asia-Pacific Structural Engineering and Construction Conference, Kuala Lumpur, Malaysia, 5–6 September 2006. [Google Scholar]
- Murugan, R.B.; Natarajan, C.; Chen, S.-E. Material development for a sustainable precast concrete block pavement. J. Traffic Transp. Eng. 2016, 3, 483–491. [Google Scholar] [CrossRef] [Green Version]
- Murugan, R.B.; Natarajan, C. Investigation on the use of waste tyre crumb rubber in concrete paving blocks. Comput. Concr. 2017, 20, 311–318. [Google Scholar] [CrossRef]
- da Silva, F.M.; Barbosa, L.A.G.; Lintz, R.C.C.; Jacintho, A.E.P. Investigation on the properties of concrete tactile paving blocks made with recycled tire rubber. Constr. Build. Mater. 2015, 91, 71–79. [Google Scholar] [CrossRef]
- Ganjian, E.; Khorami, M.; Maghsoudi, A.A. Scrap-tyre-rubber replacement for aggregate and filler in concrete. Constr. Build. Mater. 2009, 23, 1828–1836. [Google Scholar] [CrossRef]
- Siddika, A.; Al Mamun, M.A.; Alyousef, R.; Amran, Y.H.M.; Aslani, F.; Alabduljabbar, H. Properties and utilizations of waste tire rubber in concrete: A review. Constr. Build. Mater. 2019, 224, 711–731. [Google Scholar] [CrossRef]
- Nor, H.; Lim, S.K.; Ling, T.C. Using recycled waste tyres in concrete paving blocks. Proc. Ice Waste Resour. Manag. 2010, 163, 37–45. [Google Scholar] [CrossRef]
- Chu, S.; Poon, C.S.; Lam, C.; Li, L. Effect of natural and recycled aggregate packing on properties of concrete blocks. Constr. Build. Mater. 2021, 278, 122247. [Google Scholar] [CrossRef]
- Syed, H.; Nerella, R.; Madduru, S.R.C. Role of coconut coir fiber in concrete. Mater. Today Proc. 2020, 27, 1104–1110. [Google Scholar] [CrossRef]
- Ali, M.; Liu, A.; Sou, H.; Chouw, N. Mechanical and dynamic properties of coconut fibre reinforced concrete. Constr. Build. Mater. 2012, 30, 814–825. [Google Scholar] [CrossRef]
- Kochova, K.; Gauvin, F.; Schollbach, K.; Brouwers, H. Using alternative waste coir fibres as a reinforcement in cement-fibre composites. Constr. Build. Mater. 2019, 231, 117121. [Google Scholar] [CrossRef]
- Navya, G.; Roa, J.V. Experimental Investigation on Properties Concrete Paver Block with the Inclusion of Natural Fibers. J. Eng. Res. Appl. 2014, 4, 34–38. [Google Scholar]
- Amaral, L.F.; de Carvalho, J.P.R.G.; da Silva, B.M.; Delaqua, G.C.G.; Monteiro, S.N.; Vieira, C.M.F. Development of ceramic paver with ornamental rock waste. J. Mater. Res. Technol. 2019, 8, 599–608. [Google Scholar] [CrossRef]
- SLS 107:2008 Part 1; Specification for Ordinary Prtland Cement. Sri Lanka Standards Institute: Colombo, Sri Lanka, 2008.
- Sri Lankan Standards. Concrete Paving Blocks—Requirements. Available online: http://www.slsi.lk/index.php?option=com_content&view=featured&Itemid=101&lang=en (accessed on 7 December 2021).
- BS EN 1338:2003; British Standards. Concrete Paving Blocks—Requirements and Test Methods. British Standards Institution: London, UK, 2003. Available online: https://www.thenbs.com/PublicationIndex/documents/details?Pub=BSI&DocID=263759 (accessed on 6 December 2021).
- C15 Committee. Specification for Solid Concrete Interlocking Paving Units; ASTM International: West Conshohocken, PA, USA, 2013. [Google Scholar] [CrossRef]
- SLS 1425 Part 1; Specification for Concrete Paving Blocks: Part 1: Requirements. Sri Lanka Standards Institute: Colombo, Sri Lanka, 2011.
- SLS 1425 Part 2; Specification for Concrete Paving Blocks: Part 2: Requirements. Sri Lanka Standards Institute: Colombo, Sri Lanka, 2011.
- Ling, T.-C.; Nor, H.; Hainin, M.R.; Chik, A.A. Laboratory performance of crumb rubber concrete block pavement. Int. J. Pavement Eng. 2009, 10, 361–374. [Google Scholar] [CrossRef]
- Nataraja, M.C.; Das, L. A Study on the Strength Properties of Paver Blocks Made from Unconventional Materials. J. Mech. Civ. Eng. 2014, 4, 1–5. Available online: https://www.semanticscholar.org/paper/A-study-on-the-strength-properties-of-paver-blocks-Nataraja-Das/073ff4a991a9dfe933ae713a5c59eb3e6df53b56 (accessed on 10 November 2021).
- Purwanto, P.; Priastiwi, Y.A. Testing of Concrete Paving Blocks the BS EN 1338:2003 British and European Standard Code. Teknik 2008, 29, 80–84. [Google Scholar] [CrossRef]
- Singh, M. Coal bottom ash. In Waste and Supplementary Cementitious Materials in Concrete; Elsevier: Amsterdam, The Netherlands, 2018; pp. 3–50. [Google Scholar] [CrossRef]
- Sukontasukkul, P.; Chaikaew, C. Concrete Pedestrian Block Containing Crumb Rubber from Recycled Tires. Sci. Technol. Asia 2005, 10, 1–8. [Google Scholar]
- Aslantas, O. A Study on Abrasion Resistance of Concrete Paving Blocks; Natural and Applied Sciences of Middle East Technical University: Ankara, Turkey, 2004. [Google Scholar]
- Haktanir, T.; Ari, K. Indirect Determination of Splitting strength and abrasion resistance of concrete paving blocks as a function of dry bulk specific gravity and ultrasonic pulse velocity. Mater. Constr. 2005, 55, 5–12. [Google Scholar] [CrossRef] [Green Version]
- Mavroulidou, M.; Figueiredo, J. Discarded Tyre Rubber as Concrete Aggregate: A Possible Outlet for Used Tyres. In Proceedings of the 2013 International Conference on Current Trends in Engineering and Technology (ICCTET), Coimbatore, India, 3 July 2010; Volume 12, pp. 359–367. [Google Scholar]
- Hussain, I.; Ali, B.; Rashid, M.U.; Amir, M.T.; Riaz, S.; Ali, A. Engineering properties of factory manufactured paving blocks utilizing steel slag as cement replacement. Case Stud. Constr. Mater. 2021, 15, e00755. [Google Scholar] [CrossRef]
- Djamaluddin, A.R.; Caronge, M.A.; Tjaronge, M.; Lando, A.T.; Irmawaty, R. Evaluation of sustainable concrete paving blocks incorporating processed waste tea ash. Case Stud. Constr. Mater. 2019, 12, e00325. [Google Scholar] [CrossRef]
- Liu, Y.; Zhuge, Y.; Chow, C.W.; Keegan, A.; Li, D.; Pham, P.N.; Huang, J.; Siddique, R. Utilization of drinking water treatment sludge in concrete paving blocks: Microstructural analysis, durability and leaching properties. J. Environ. Manag. 2020, 262, 110352. [Google Scholar] [CrossRef]
- Evangelista, B.L.; Rosado, L.P.; Penteado, C. Life cycle assessment of concrete paving blocks using electric arc furnace slag as natural coarse aggregate substitute. J. Clean. Prod. 2018, 178, 176–185. [Google Scholar] [CrossRef]
- de Rosso, L.T.; de Melo, J.V.S. Impact of incorporating recycled glass on the photocatalytic capacity of paving concrete blocks. Constr. Build. Mater. 2020, 259, 119778. [Google Scholar] [CrossRef]
- Soni, R.; Mathur, D. An Experimental Study on Using of Commercialized Crumb Rubber in Interlocking Concrete Paver Block. Int. J. Recent Res. Rev. 2020, 13, 25–29. [Google Scholar]
- Aboelkheir, M.G.; Thomas, S.; de Souza, F.G.; Filho, R.D.T.; Celestino, R.; Filho, S.T.; de Carvalho, F.V.; Maranhão, F.D.S.; Pereira, E.D.; da Costa, V.C.; et al. Influence of UV-modified GTR on the properties of interlocking concrete paving units. J. Mol. Struct. 2021, 1234, 130110. [Google Scholar] [CrossRef]
- Ling, T.-C. Effects of compaction method and rubber content on the properties of concrete paving blocks. Constr. Build. Mater. 2012, 28, 164–175. [Google Scholar] [CrossRef]


| Material | CR (Batch 01) | CCF (Batch 02) | |||||||
|---|---|---|---|---|---|---|---|---|---|
| PBR0 | PBR5 | PBR10 | PBR20 | PBR30 | PBC0 | PBC0.2 | PBC0.3 | PBC0.4 | |
| Cement (kg) | 525.00 | 525.00 | 525.00 | 525.00 | 525.00 | 525.00 | 525.00 | 525.00 | 525.00 |
| Sand (kg) | 883.30 | 839.10 | 795.00 | 706.60 | 618.30 | 883.30 | 883.30 | 883.30 | 883.30 |
| Coarse Aggregate (kg) | 1400.00 | 1400.00 | 1400.00 | 1400.00 | 1400.00 | 1400.00 | 1400.00 | 1400.00 | 1400.00 |
| Crumb Rubber (kg) | - | 44.10 | 88.30 | 176.60 | 265.00 | - | - | - | - |
| Coconut Coir (kg) | - | - | - | - | - | - | 3.88 | 5.82 | 7.76 |
| W/C ratio | 0.50 | 0.50 | 0.50 | 0.50 | 0.50 | 0.50 | 0.44 | 0.48 | 0.55 |
| SLS 1425 [36] | BS EN 1338 [37] | IS 15658 | ASTM C936 [38] | |
|---|---|---|---|---|
| Compressive Strength (N/mm2) | ≥50 MPa (Class 1) | - | 30–55 MPa | ≥55.2 MPa |
| ≥40 MPa (Class 2) | ||||
| ≥30 MPa (Class 3) | ||||
| ≥15 MPa (Class 4) | ||||
| Abrasion Resistance | ≤20 mm | ≤20 mm | - | ≤15 cm3/50 cm2 (volume loss) |
| Spitting Tensile strength (N/mm2) | - | ≥3.6 | - | - |
| Skid Resistance (USRV) | ≥55 USRV | 40–75 USRV (Low skid potential) ≥75 USRV (Extremely low potential to slip) | - | - |
| Water Absorption (%) | ≤6% | ≤6% | ≤6% | ≤5% |
| Batch ID | % Replaced/Added | Compressive Strength (MPa) | Abrasion Resistance (mm) | Splitting Tensile (MPa) | Skid Resistance (USRV) | Water Absorption (%) | Density (kg/m3) | ||
|---|---|---|---|---|---|---|---|---|---|
| 7 Days | 28 Days | 56 Days | |||||||
| Control sample | 0 | 24.0 | 27.0 | 28.0 | 19.0 | - | 90.0 | 9.7 | 2350.0 |
| PBR5 | 5 | 16.5 | 19.9 | 22.3 | 17.7 | - | 85.0 | 10.9 | 2293.0 |
| PBR10 | 10 | 13.3 | 16.6 | 16.9 | 17.7 | - | 85.0 | 11.8 | 2258.0 |
| PBR20 | 20 | 7.1 | 9.4 | 9.1 | 18.7 | - | 85.0 | 13.9 | 2143.0 |
| PBR30 | 30 | 4.2 | 5.6 | 5.9 | 19.3 | - | 75.0 | 16.2 | 2027.0 |
| Control sample | 0 | 33.0 | 44.0 | 43.0 | 17.8 | 2.1 | 65.0 | 3.0 | - |
| PBC0.2 | 0.2 | 38.3 | 45.3 | 48.9 | 18.2 | 2.5 | 60.0 | 4.5 | - |
| PBC0.3 | 0.3 | 28.5 | 42.4 | 46.2 | 18.4 | 2.6 | 70.0 | 5.5 | - |
| PBC0.4 | 0.4 | 26.1 | 34.0 | 35.7 | 18.7 | 2.4 | 55.0 | 6.1 | - |
| Material | Unit | Unit Price (USD) | PBR0 | PBR5 | PBR10 | PBR20 | PBR30 | |||||
|---|---|---|---|---|---|---|---|---|---|---|---|---|
| Quantity (Unit) | Price (USD) | Quantity (Unit) | Price (USD) | Quantity (Unit) | Price (USD) | Quantity (Unit) | Price (USD) | Quantity (Unit) | Price (USD) | |||
| Cement | 50 Kg Bag | 2.9410 | 0.6300 (kg) | 0.0370 | 0.6300 (kg) | 0.0370 | 0.6300 (kg) | 0.0370 | 0.6300 (kg) | 0.0370 | 0.6300 (kg) | 0.0370 |
| Sand | 1 Cube | 44.7060 | 0.0004 (m3) | 0.0060 | 0.0004 (m3) | 0.0060 | 0.0004 (m3) | 0.0050 | 0.0004 (m3) | 0.0050 | 0.0003 (m3) | 0.0040 |
| Crushed Aggregate | 1.25 Cube | 25.2940 | 0.0006 (m3) | 0.0040 | 0.0006 (m3) | 0.0040 | 0.0006 (m3) | 0.0040 | 0.0006 (m3) | 0.0040 | 0.0006 (m3) | 0.0040 |
| Crumb Rubber | 1 Kg | 0.1320 | - | - | 0.0500 (kg) | 0.0060 | 0.1100 (kg) | 0.0150 | 0.2100 (kg) | 0.0280 | 0.3200 (kg) | 0.0420 |
| Total Price per Block (USD) | 0.0470 | 0.0530 | 0.0610 | 0.0740 | 0.0870 | |||||||
| Material | Compacted Weight (per 1 Block) | Bulk Weight (per 1 Block) | Bulk Weight + 5% Wastage (per 1 Block) |
|---|---|---|---|
| Cement | 441.93 g | 530.32 g | 556.83 g |
| Fine Aggregate-River Sand | 743.57 g | 892.28 g | 936.89 g |
| Coarse Aggregate-Chips | 1178.49 g | 1414.19 g | 1484.90 g |
| 0.2% Coconut Coir by weight | - | - | 5.96 g |
| 0.3% Coconut Coir by weight | - | - | 8.94 g |
| 0.4% Coconut Coir by weight | - | - | 11.92 g |
| Material | Unit | Unit Price (USD) | Quantity Required per Block (g) | Price of material per Block (USD) |
|---|---|---|---|---|
| Cement | 50 Kg Bag | 2.941 | 556.830 | 0.032 |
| Fine Aggregate-River Sand | 1 Cube (2.83 m3) | 44.706 | 936.890 | 0.006 |
| Coarse Aggregate-Chips | 1 Cube (2.83 m3) | 25.294 | 1484.900 | 0.004 |
| 0.2% Coconut Coir by weight | 1 Kg | 0.015 | 5.960 | <0.0002 |
| 0.3% Coconut Coir by weight | 1 Kg | 0.015 | 8.940 | <0.0002 |
| 0.4% Coconut Coir by weight | 1 Kg | 0.015 | 11.920 | <0.0002 |
| Alternative Material Used | Replacement (R)/Addition (A) | Replaced Material | Properties Considered | References |
|---|---|---|---|---|
| Crumb Rubber (CR) | R | Sand | CS | This study |
| WA | ||||
| AR | ||||
| SR | ||||
| Steel Slag Powder (SSP) | R | Cement | CS | Hussain et al. [49] |
| WA | ||||
| Processed Waste Tea Ash (PWTA) | R | Cement | CS | Djamaluddin et al. [50] |
| WA | ||||
| Crushed Waste Slag Furnace (WSF) | R | Sand | CS | Olofinnade et al. [15] |
| WA | ||||
| Drinking-Water Treatment Sludge (DWTS) | R | Sand | CS | Liu et al. [51] |
| WA | ||||
| Electric Arc Furnace Aggregate (EAFA) | R | Natural Coarse Aggregate | CS | Evangelista et al. [52] |
| WA | ||||
| Metakaolin | A | - | CS | Estolano et al. [10] |
| AR | ||||
| Recycled Glass | R | Mineral aggregate | CS | Torres de Rosso and Victor Staub de Melo [53] |
| Cement Kiln Dust (CKD) | R | Cement | CS | Sadek et al. [11] |
| WA | ||||
| AR | ||||
| SR | ||||
| Recycled Concrete Coarse Aggregate (RCCA) | R | Coarse aggregate | AR and SR | Wang et al. [12] |
| Recycled Concrete Fine Aggregate (RCFA) | Fine aggregate | |||
| Crushed Glass (CG) | Coarse aggregate | |||
| Ground Granulated Blast Furnace Slag (GGBS) | Cement |
| Paper No. | References | Rubber Type | Rubber Size | Replaced Material | Properties Considered |
|---|---|---|---|---|---|
| P1 | This study | CR | Mesh 30 and 2 mm–(50% each) | Sand | CS |
| WA | |||||
| AR | |||||
| SR | |||||
| P2 | Silva et al. [25] | CR | 1.18 mm–2.36 mm | Sand | CS |
| WA | |||||
| AR | |||||
| P3 | Murugan and Natarajan [24] | CR | 4.75 mm–0.15 mm | Sand | CS |
| P4 | Murugan et al. [23] | CR | 4.75 mm–0.075 mm | Sand | CS |
| P5 | Nor et al. [28] | CR | Passing BS sieve No. 4 (4.75 mm) | Sand | SR |
| P6 | Sukontasukkul and Chaikaew [45] | CR | No.6 (Passing Sieve No.6); No.20 (Passing Sieve No.20)–50% each | Fine and Coarse Aggregate (50% each) | CS |
| AR | |||||
| SR | |||||
| P7 | Soni and Mathur [54] | CR | 4.75 mm–0.075 mm | Sand | CS |
| WA | |||||
| AR | |||||
| P8 | Aboelkheir et al. [55] | Ground Tire Rubber (GTR) | 120 mesh | Fine aggregate | WA |
| References | The Material Used in the Study | Substituted (S)/Added (A) Amount | 28-Days Compressive Strength (N/mm2) | Ratio to Control Sample |
|---|---|---|---|---|
| This study | Coconut Coir | 0% | 42.95 | 1.00 |
| 0.2% (A) | 45.30 | 1.05 | ||
| 0.3% (A) | 42.35 | 0.99 | ||
| 0.4% (A) | 34.04 | 0.79 | ||
| Djamaluddin et al. [51] | Processed waste tea ash substituted for Cement | 0% | 19.81 | 1.00 |
| 10% (S) | 15.46 | 0.78 | ||
| 20% (S) | 14.12 | 0.71 | ||
| 30% (S) | 12.10 | 0.61 | ||
| 40% (S) | 10.24 | 0.52 | ||
| 60% (S) | 7.01 | 0.35 | ||
| Hussain et al. [50] | Steel slag powder substituted for Cement | 0% | 60.30 | 1.00 |
| 5% (S) | 67.60 | 1.12 | ||
| 10% (S) | 68.60 | 1.14 | ||
| 15% (S) | 63.40 | 1.05 | ||
| 20% (S) | 55.10 | 0.91 | ||
| 25% (S) | 48.90 | 0.81 | ||
| 30% (S) | 43.70 | 0.72 | ||
| Olofinnade et al. [15] | Waste Furnace slag substituted for sand | 0% | 22.80 | 1.00 |
| 20% (S) | 22.50 | 0.99 | ||
| 40% (S) | 25.30 | 1.11 | ||
| 60% (S) | 19.90 | 0.87 | ||
| 80% (S) | 18.90 | 0.83 | ||
| 100% (S) | 18.10 | 0.79 | ||
| Sadek et al. [11] | Cement kiln dust substituted for cement | 0% | 62.30 | 1.00 |
| 10% (S) | 58.40 | 0.94 | ||
| 20% (S) | 54.20 | 0.87 | ||
| 40% (S) | 50.30 | 0.81 | ||
| 60% (S) | 46.20 | 0.74 | ||
| 20% (A) | 65.90 | 1.06 | ||
| Evangelista et al. [53] | Electric arc furnace aggregate substituted for coarse aggregate | 0% | 49.10 | 1.00 |
| 25% (S) | 47.00 | 0.96 | ||
| 50% (S) | 45.40 | 0.92 | ||
| 75% (S) | 43.40 | 0.88 | ||
| 100% (S) | 40.80 | 0.83 |
| References | Material Used in the Study | Substituted (S)/Added (A) Amount | 28-Days Abrasion Resistance (mm) | Ratio to Control Sample |
|---|---|---|---|---|
| This study | Coconut Coir | 0% | 17.80 | 1.00 |
| 0.2% (A) | 18.20 | 1.02 | ||
| 0.3% (A) | 18.40 | 1.03 | ||
| 0.4% (A) | 18.70 | 1.05 | ||
| Sadek et al. [11] | Cement kiln dust substituted for cement | 0% | 19.74 | 1.00 |
| 10% (S) | 20.88 | 1.06 | ||
| 20% (S) | 21.19 | 1.07 | ||
| 40% (S) | 21.53 | 1.09 | ||
| 60% (S) | 22.18 | 1.12 | ||
| 20% (A) | 19.50 | 0.99 | ||
| Wang et al. [12] | Recycled concrete coarse aggregate substituted for coarse aggregate | 0% | 29.25 | 1.00 |
| 20% (S) | 27.59 | 0.94 | ||
| 40% (S) | 25.42 | 0.87 | ||
| 60% (S) | 27.91 | 0.95 | ||
| 80% (S) | 29.22 | 0.99 | ||
| 100% (S) | 35.49 | 1.21 | ||
| Recycled concrete fine aggregates substituted for Sand | 0% | 29.25 | 1.00 | |
| 10% (S) | 28.73 | 0.98 | ||
| 20% (S) | 27.99 | 0.96 | ||
| 30% (S) | 28.73 | 0.98 | ||
| Crushed Glass substituted for Coarse aggregate | 0% | 29.25 | 1.00 | |
| 10% (S) | 29.40 | 1.00 | ||
| 20% (S) | 29.25 | 1.00 | ||
| 30% (S) | 28.06 | 0.96 | ||
| 40% (S) | 29.70 | 1.02 | ||
| Crumb Rubber substituted for Sand | 0% | 29.18 | 1.00 | |
| 1% (S) | 30.79 | 1.06 | ||
| 2% (S) | 28.76 | 0.99 | ||
| 3% (S) | 28.22 | 0.97 | ||
| Granulated blast furnace slag substituted for cement | 0% | 29.28 | 1.00 | |
| 30% (S) | 24.35 | 0.83 | ||
| 50% (S) | 25.94 | 0.89 | ||
| 70% (S) | 30.07 | 1.03 |
| References | Material Used in the Study | Substituted (S)/Added (A) Amount | 28-Days Splitting Tensile Strength (N/mm2) | Ratio to Control Sample |
|---|---|---|---|---|
| This study | Coconut Coir | 0% | 2.05 | 1.00 |
| 0.2% (A) | 2.45 | 1.20 | ||
| 0.3% (A) | 2.55 | 1.24 | ||
| 0.4% (A) | 2.40 | 1.17 | ||
| Olofinnade et al. [15] | Waste Furnace slag substituted for sand | 0% | 2.53 | 1.00 |
| 20% (S) | 2.73 | 1.08 | ||
| 40% (S) | 2.30 | 0.91 | ||
| 60% (S) | 2.19 | 0.87 | ||
| 80% (S) | 2.11 | 0.83 | ||
| 100% (S) | 1.73 | 0.68 | ||
| Sadek et al. [11] | Cement kiln dust substituted for cement | 0% | 4.71 | 1.00 |
| 10% (S) | 4.63 | 0.98 | ||
| 20% (S) | 4.16 | 0.88 | ||
| 40% (S) | 3.87 | 0.82 | ||
| 60% (S) | 3.63 | 0.77 | ||
| 20% (A) | 5.11 | 1.08 | ||
| Wang et al. [12] | Recycled concrete coarse aggregate substituted for coarse aggregate | 0% | 11.18 | 1.00 |
| 20% (S) | 11.61 | 1.04 | ||
| 40% (S) | 10.19 | 0.911 | ||
| 60% (S) | 9.03 | 0.81 | ||
| 80% (S) | 8.60 | 0.77 | ||
| 100% (S) | 6.26 | 0.56 | ||
| Recycled concrete fine aggregates substituted for Sand | 0% | 11.30 | 1.00 | |
| 10% (S) | 10.67 | 0.94 | ||
| 20% (S) | 10.33 | 0.91 | ||
| 30% (S) | 7.40 | 0.65 | ||
| Crushed Glass substituted for Coarse aggregate | 0% | 11.31 | 1.00 | |
| 10% (S) | 12.35 | 1.09 | ||
| 20% (S) | 12.50 | 1.11 | ||
| 30% (S) | 12.42 | 1.10 | ||
| 40% (S) | 12.79 | 1.13 | ||
| Crumb Rubber substituted for Sand | 0% | 11.30 | 1.00 | |
| 1% (S) | 9.54 | 0.84 | ||
| 2% (S) | 8.04 | 0.71 | ||
| 3% (S) | 5.46 | 0.48 | ||
| Granulated blast furnace slag substituted for cement | 0% | 11.18 | 1.00 | |
| 30% (S) | 12.62 | 1.13 | ||
| 50% (S) | 12.88 | 1.15 | ||
| 70% (S) | 9.32 | 0.83 |
| References | Material Used in the Study | Substituted (S)/Added (A) Amount | 28-Days Skid Resistance | Ratio to Control Sample |
|---|---|---|---|---|
| This study | Coconut Coir | 0% | 65.00 (USRV) | 1.00 |
| 0.2% (A) | 60.00 (USRV) | 0.92 | ||
| 0.3% (A) | 70.00 (USRV) | 1.08 | ||
| 0.4% (A) | 55.00 (USRV) | 0.85 | ||
| Sadek et al. [11] | Cement kiln dust substituted for cement | 0% | 68.00 (USRV) | 1.00 |
| 10% (S) | 65.50 (USRV) | 0.96 | ||
| 20% (S) | 64.00 (USRV) | 0.94 | ||
| 40% (S) | 62.20 (USRV) | 0.91 | ||
| 60% (S) | 60.70 (USRV) | 0.89 | ||
| 20% (A) | 69.30 (USRV) | 1.02 | ||
| Wang et al. [12] | Recycled concrete coarse aggregate substituted for coarse aggregate | 0% | 90.46 (BPN) | 1.00 |
| 20% (S) | 79.42 (BPN) | 0.88 | ||
| 40% (S) | 83.77 (BPN) | 0.93 | ||
| 60% (S) | 83.72 (BPN) | 0.93 | ||
| 80% (S) | 85.71 (BPN) | 0.95 | ||
| 100% (S) | 79.95 (BPN) | 0.88 | ||
| Recycled concrete fine aggregates substituted for Sand | 0% | 90.55 (BPN) | 1.00 | |
| 10% (S) | 79.32 (BPN) | 0.88 | ||
| 20% (S) | 88.19 (BPN) | 0.97 | ||
| 30% (S) | 87.00 (BPN) | 0.96 | ||
| Crushed Glass substituted for Coarse aggregate | 0% | 90.47 (BPN) | 1.00 | |
| 10% (S) | 85.75 (BPN) | 0.95 | ||
| 20% (S) | 85.28 (BPN) | 0.94 | ||
| 30% (S) | 85.98 (BPN) | 0.95 | ||
| 40% (S) | 79.95 (BPN) | 0.88 | ||
| Crumb Rubber substituted for Sand | 0% | 90.23 (BPN) | 1.00 | |
| 1% (S) | 88.76 (BPN) | 0.98 | ||
| 2% (S) | 85.28 (BPN) | 0.95 | ||
| 3% (S) | 87.25 (BPN) | 0.97 | ||
| Granulated blast furnace slag substituted for cement | 0% | 90.29 (BPN) | 1.00 | |
| 30% (S) | 87.43 (BPN) | 0.97 | ||
| 50% (S) | 81.71 (BPN) | 0.90 | ||
| 70% (S) | 82.57 (BPN) | 0.91 | ||
| Ling [56] | Crumb Rubber substituted for sand | 0% | 78.00 (BPN) | 1.00 |
| 10% (S) | 74.00 (BPN) | 0.95 | ||
| 20% (S) | 69.00 (BPN) | 0.88 | ||
| 30% (S) | 64.00 (BPN) | 0.82 |
| References | Material Used in the Study | Substituted (S)/Added (A) Amount | 28-Days Water Absorption (%) | Normalized Value |
|---|---|---|---|---|
| This study | Coconut Coir | 0% | 3.00 | 1.00 |
| 0.2% (A) | 4.51 | 1.50 | ||
| 0.3% (A) | 5.48 | 1.83 | ||
| 0.4% (A) | 6.05 | 2.01 | ||
| Djamaluddin et al. [51] | Processed waste tea ash substituted for Cement | 0% | 7.71 | 1.00 |
| 10% (S) | 7.76 | 1.00 | ||
| 20% (S) | 8.04 | 1.04 | ||
| 30% (S) | 8.81 | 1.14 | ||
| 40% (S) | 9.63 | 1.25 | ||
| 60% (S) | 11.23 | 1.46 | ||
| Hussain et al. [50] | Steel slag powder substituted for Cement | 0% | 5.15 | 1.00 |
| 5% (S) | 4.70 | 0.91 | ||
| 10% (S) | 4.14 | 0.80 | ||
| 15% (S) | 4.59 | 0.89 | ||
| 20% (S) | 4.70 | 0.91 | ||
| 25% (S) | 5.04 | 0.98 | ||
| 30% (S) | 5.49 | 1.07 | ||
| Olofinnade et al. [15] | Waste Furnace slag substituted for sand | 0% | 5.40 | 1.00 |
| 20% (S) | 6.00 | 1.11 | ||
| 40% (S) | 4.30 | 0.80 | ||
| 60% (S) | 4.90 | 0.91 | ||
| 80% (S) | 4.90 | 0.91 | ||
| 100% (S) | 4.20 | 0.77 | ||
| Sadek et al. [11] | Cement kiln dust substituted for cement | 0% | 2.39 | 1.00 |
| 10% (S) | 2.60 | 1.09 | ||
| 20% (S) | 2.95 | 1.23 | ||
| 40% (S) | 3.12 | 1.31 | ||
| 60% (S) | 3.30 | 1.38 | ||
| 20% (A) | 2.29 | 0.96 | ||
| Evangelista et al. [53] | Electric arc furnace aggregate substituted for coarse aggregate | 0% | 4.80 | 1.00 |
| 25% (S) | 5.50 | 1.15 | ||
| 50% (S) | 5.90 | 1.23 | ||
| 75% (S) | 6.10 | 1.27 | ||
| 100% (S) | 6.20 | 1.29 |
Publisher’s Note: MDPI stays neutral with regard to jurisdictional claims in published maps and institutional affiliations. |
© 2022 by the authors. Licensee MDPI, Basel, Switzerland. This article is an open access article distributed under the terms and conditions of the Creative Commons Attribution (CC BY) license (https://creativecommons.org/licenses/by/4.0/).
Share and Cite
Gamage, S.; Palitha, S.; Meddage, D.P.P.; Mendis, S.; Azamathulla, H.M.; Rathnayake, U. Influence of Crumb Rubber and Coconut Coir on Strength and Durability Characteristics of Interlocking Paving Blocks. Buildings 2022, 12, 1001. https://doi.org/10.3390/buildings12071001
Gamage S, Palitha S, Meddage DPP, Mendis S, Azamathulla HM, Rathnayake U. Influence of Crumb Rubber and Coconut Coir on Strength and Durability Characteristics of Interlocking Paving Blocks. Buildings. 2022; 12(7):1001. https://doi.org/10.3390/buildings12071001
Chicago/Turabian StyleGamage, Sajani, Sandini Palitha, D. P. P. Meddage, Shayani Mendis, Hazi Md. Azamathulla, and Upaka Rathnayake. 2022. "Influence of Crumb Rubber and Coconut Coir on Strength and Durability Characteristics of Interlocking Paving Blocks" Buildings 12, no. 7: 1001. https://doi.org/10.3390/buildings12071001