
Mechanical Responses of Slurry Shield Underpassing Existing Bridge Piles in Upper-Soft and Lower-Hard Composite Strata

 , ,
, ,
Abstract
:1. Introduction
2. Theory on Impact Control for Shield Underpassing Deep Foundation Buildings Subjected to Complex Geological Conditions
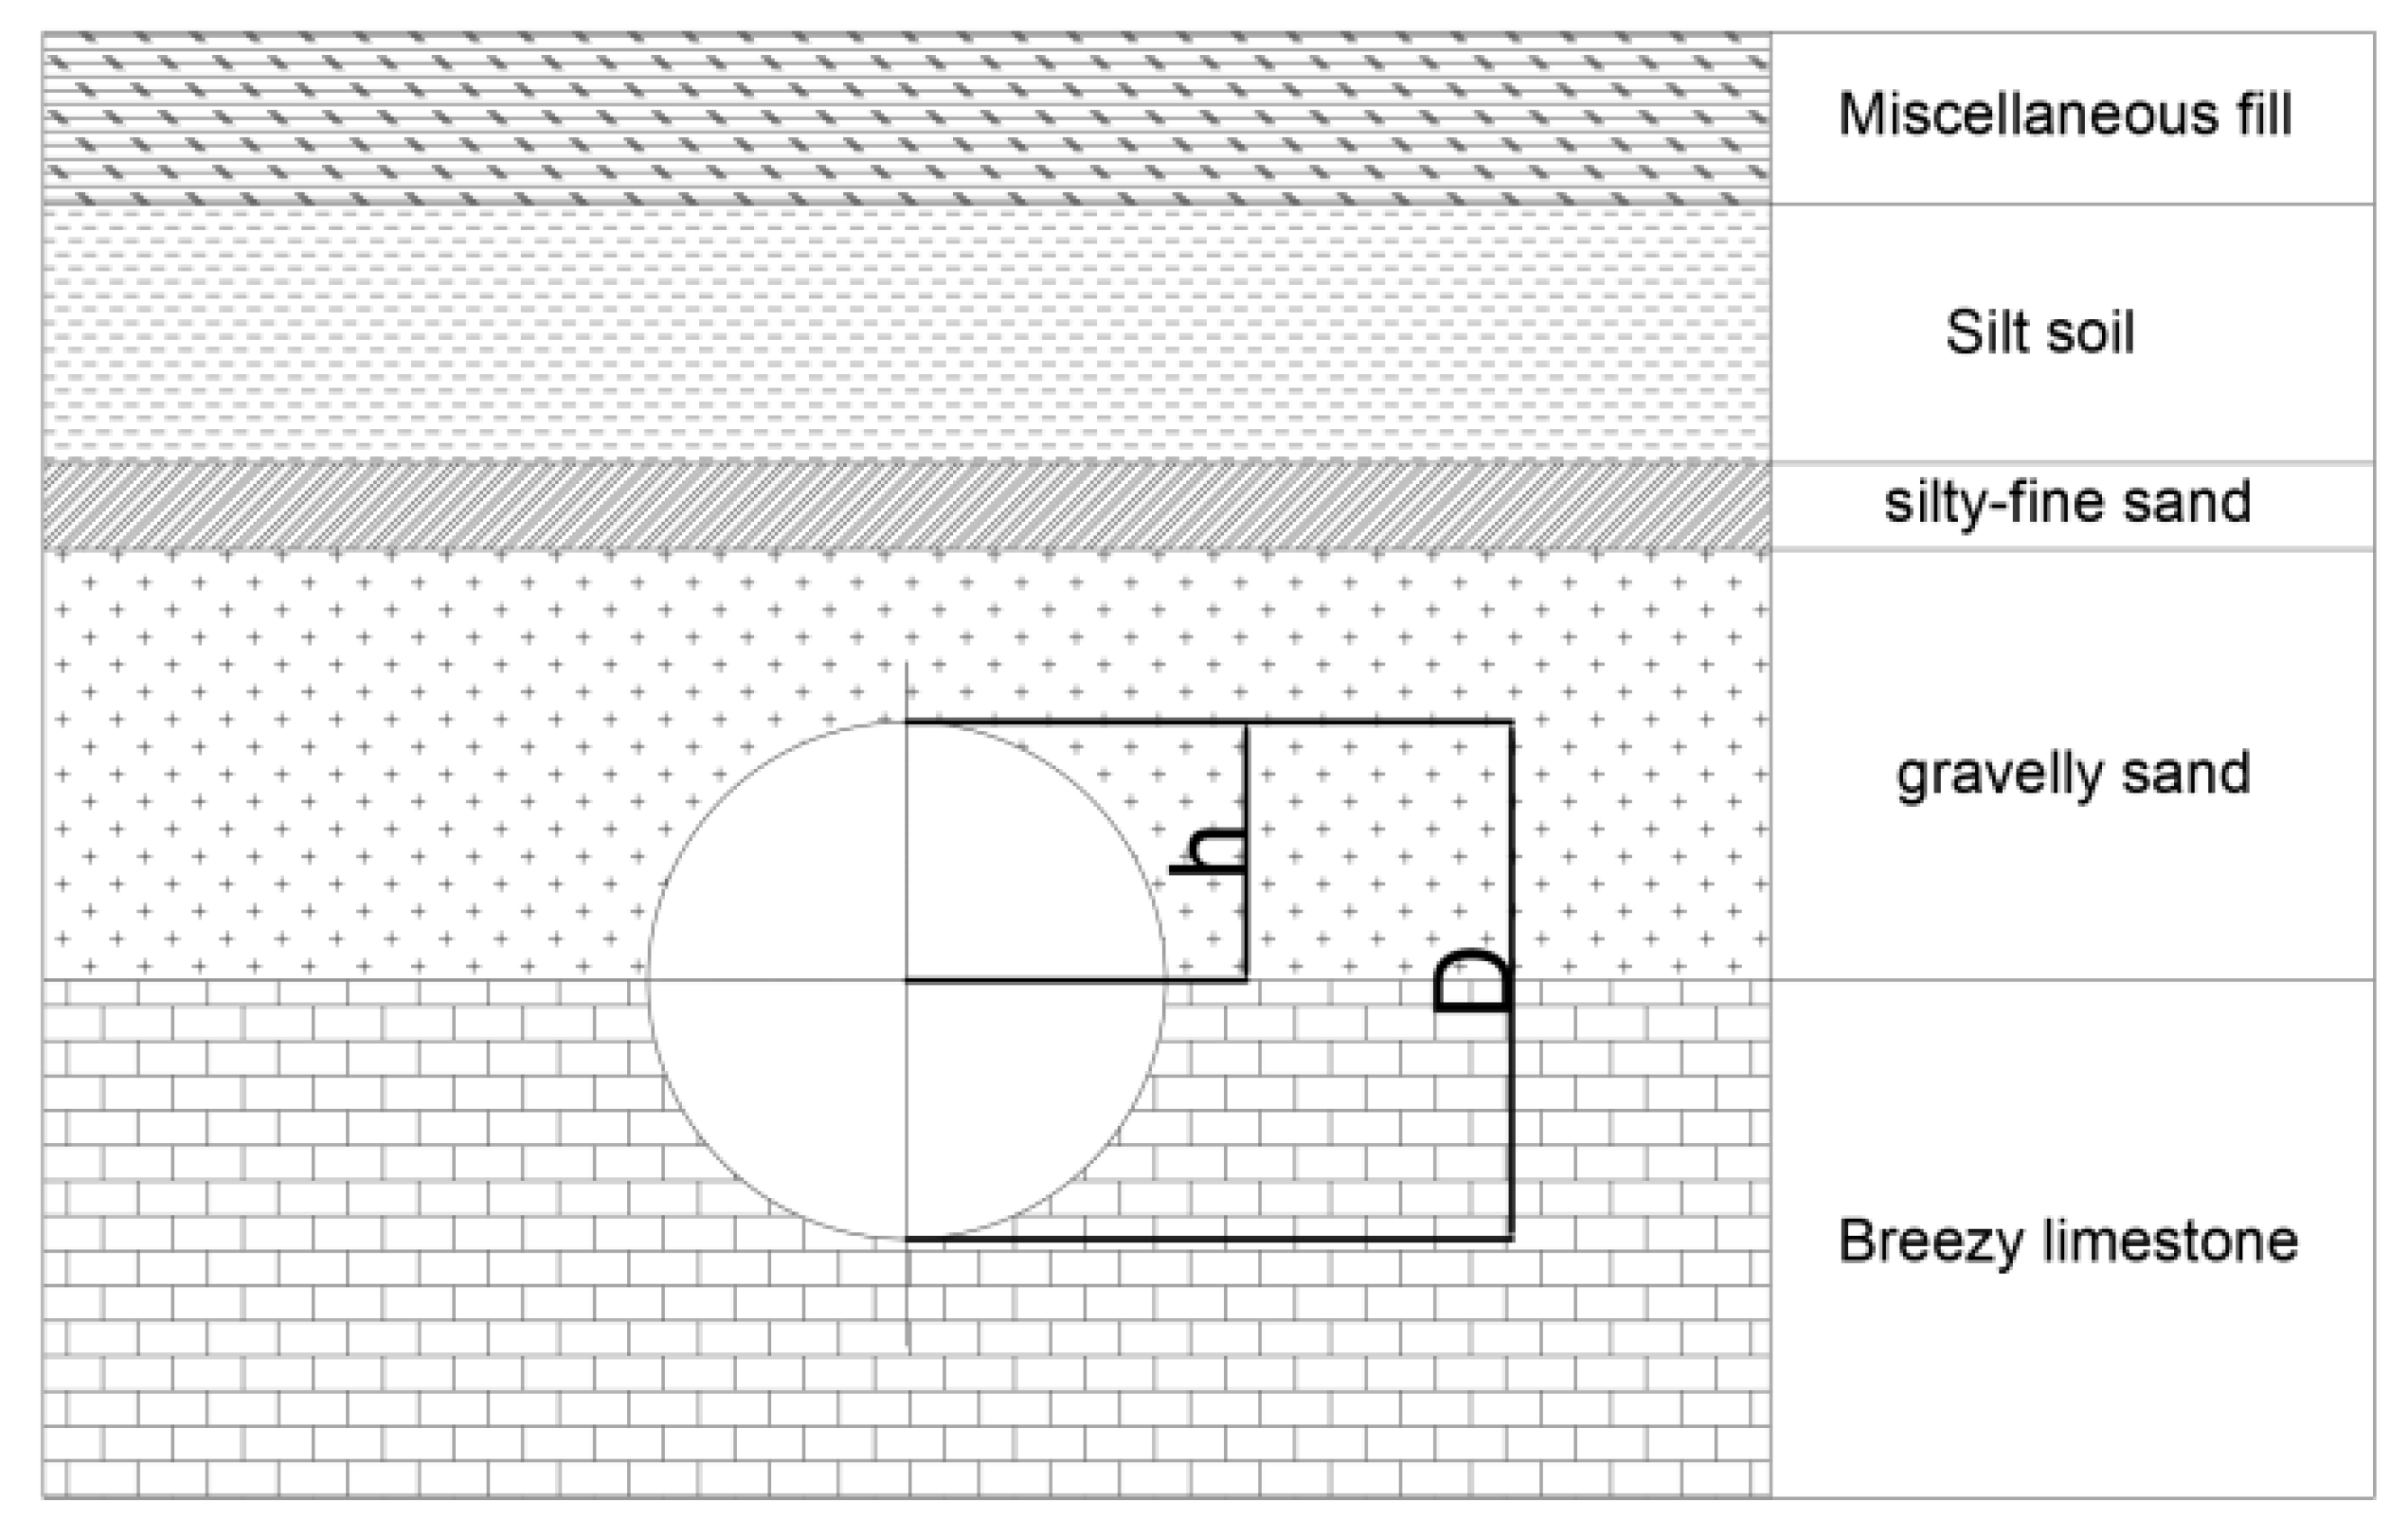
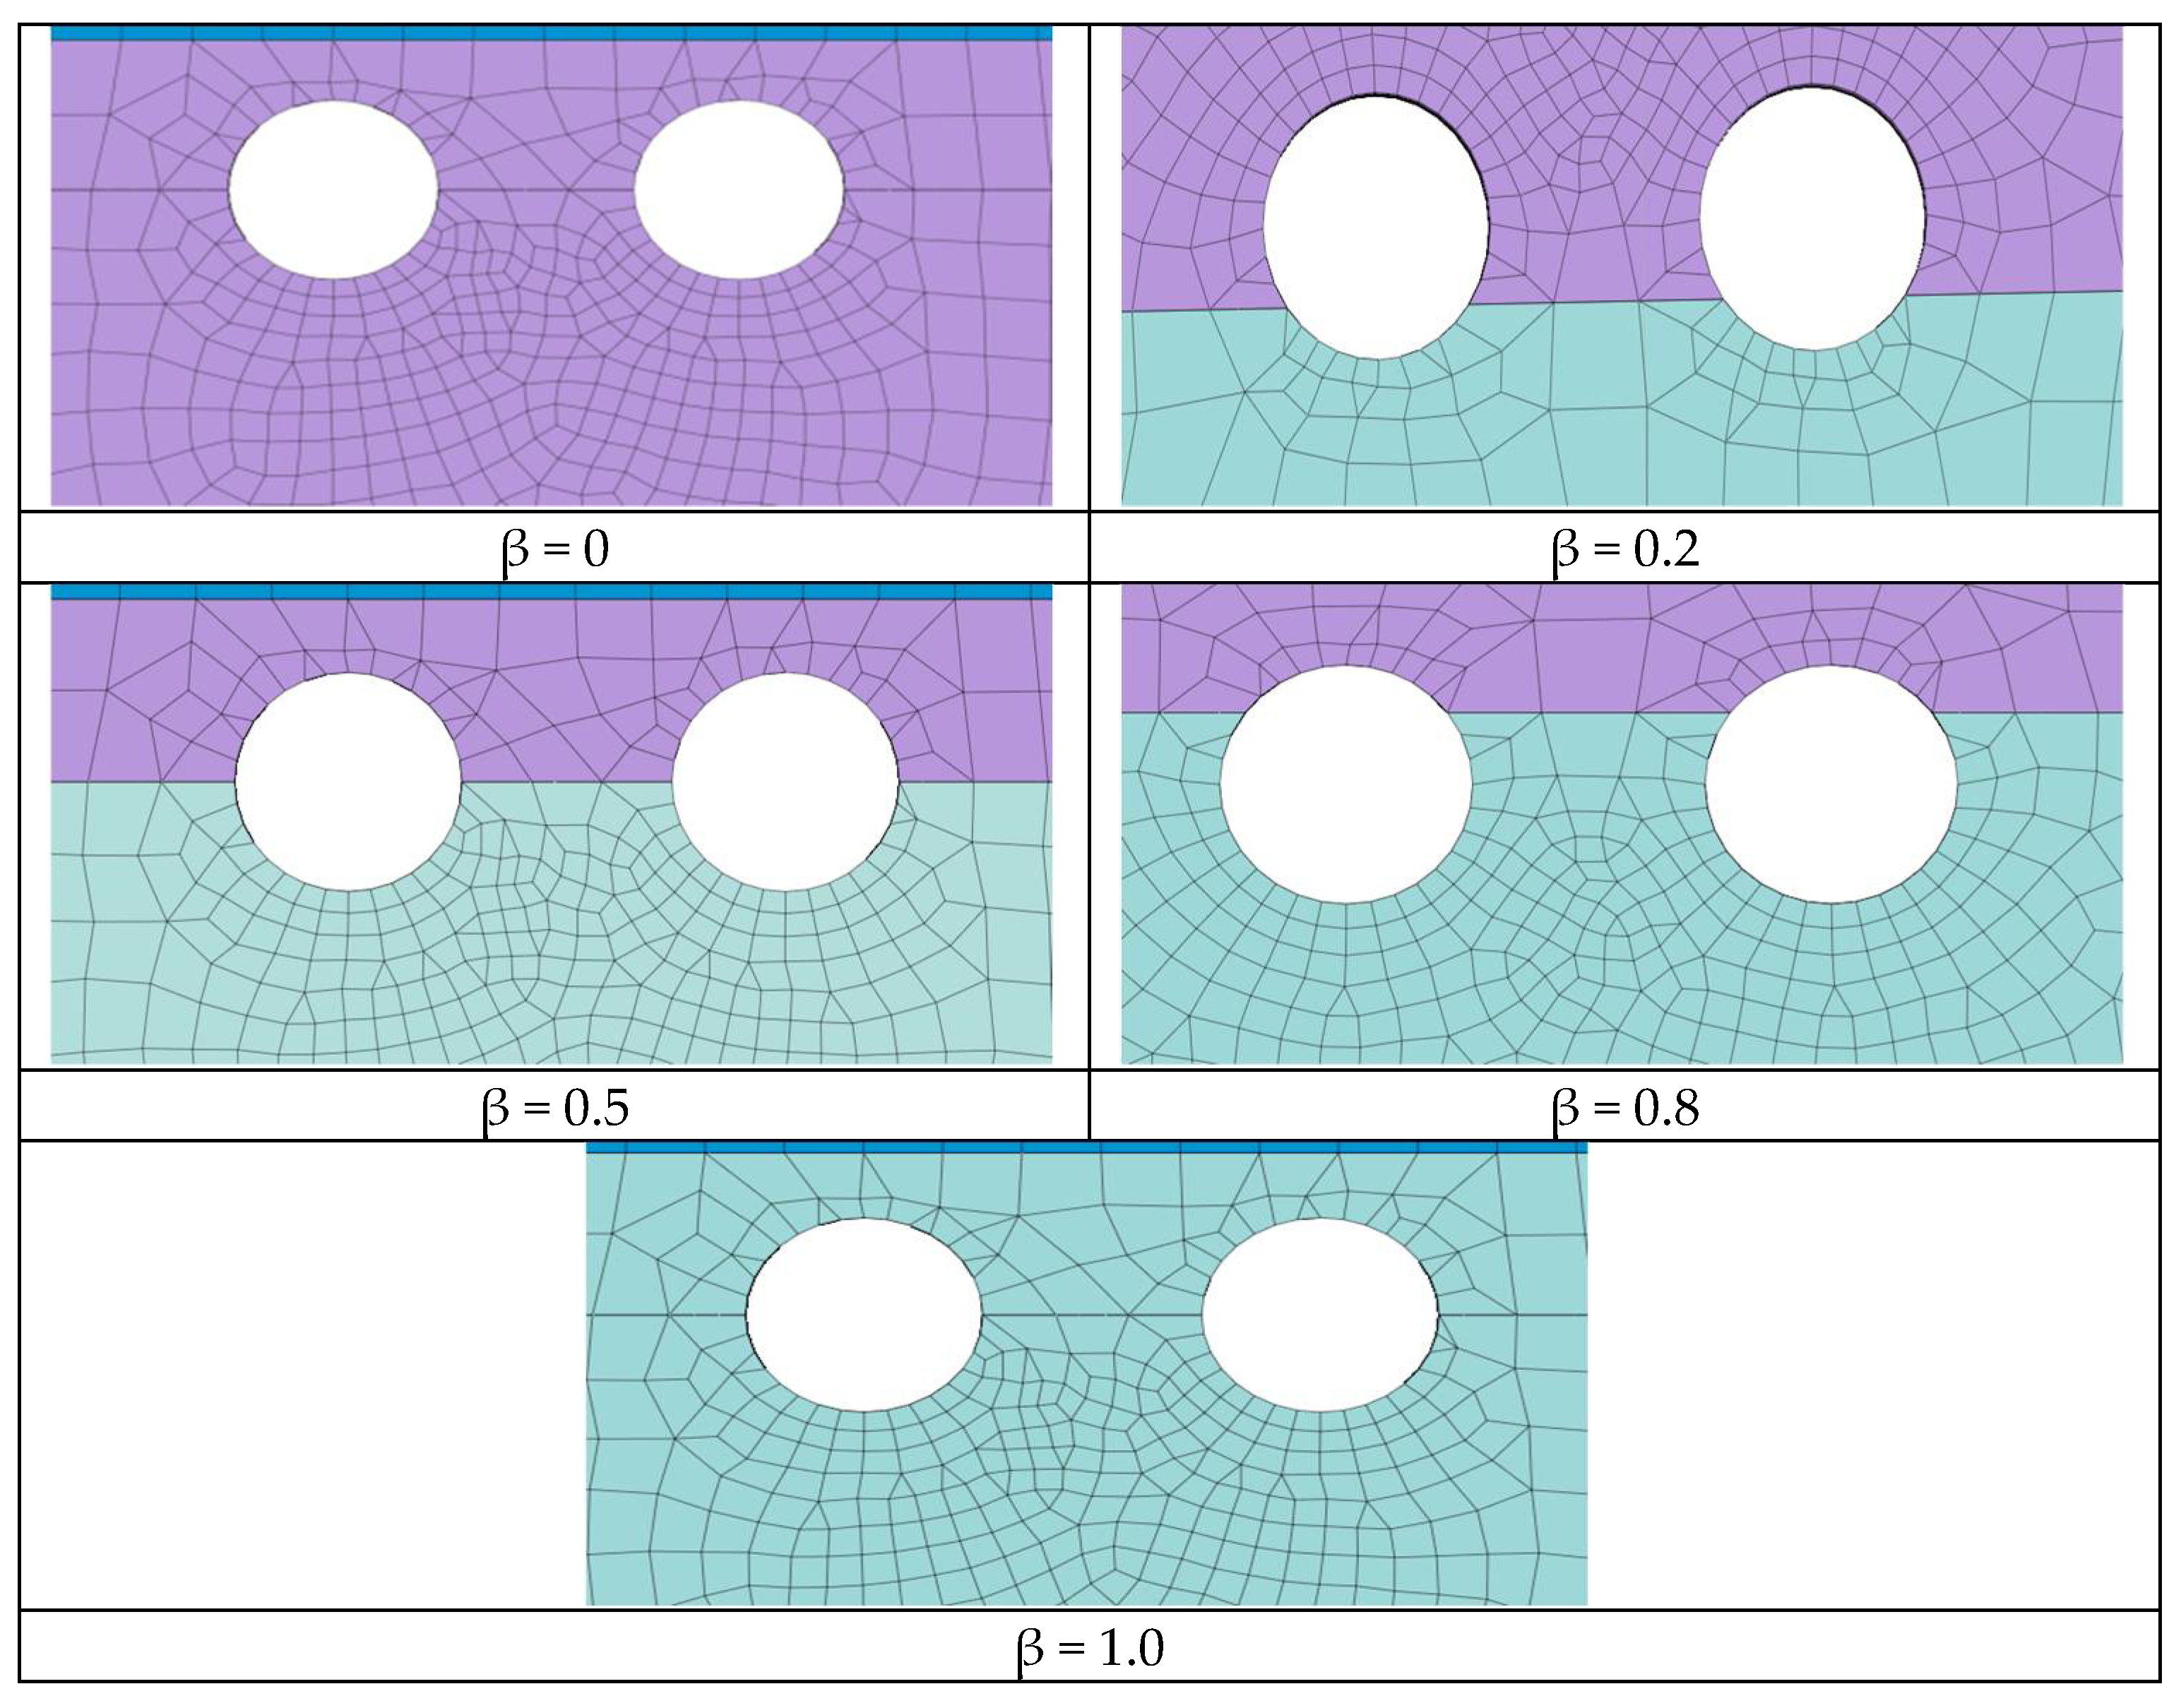
2.1. Definition of Hard-Rock Height Ratio at Shield-Boring Face
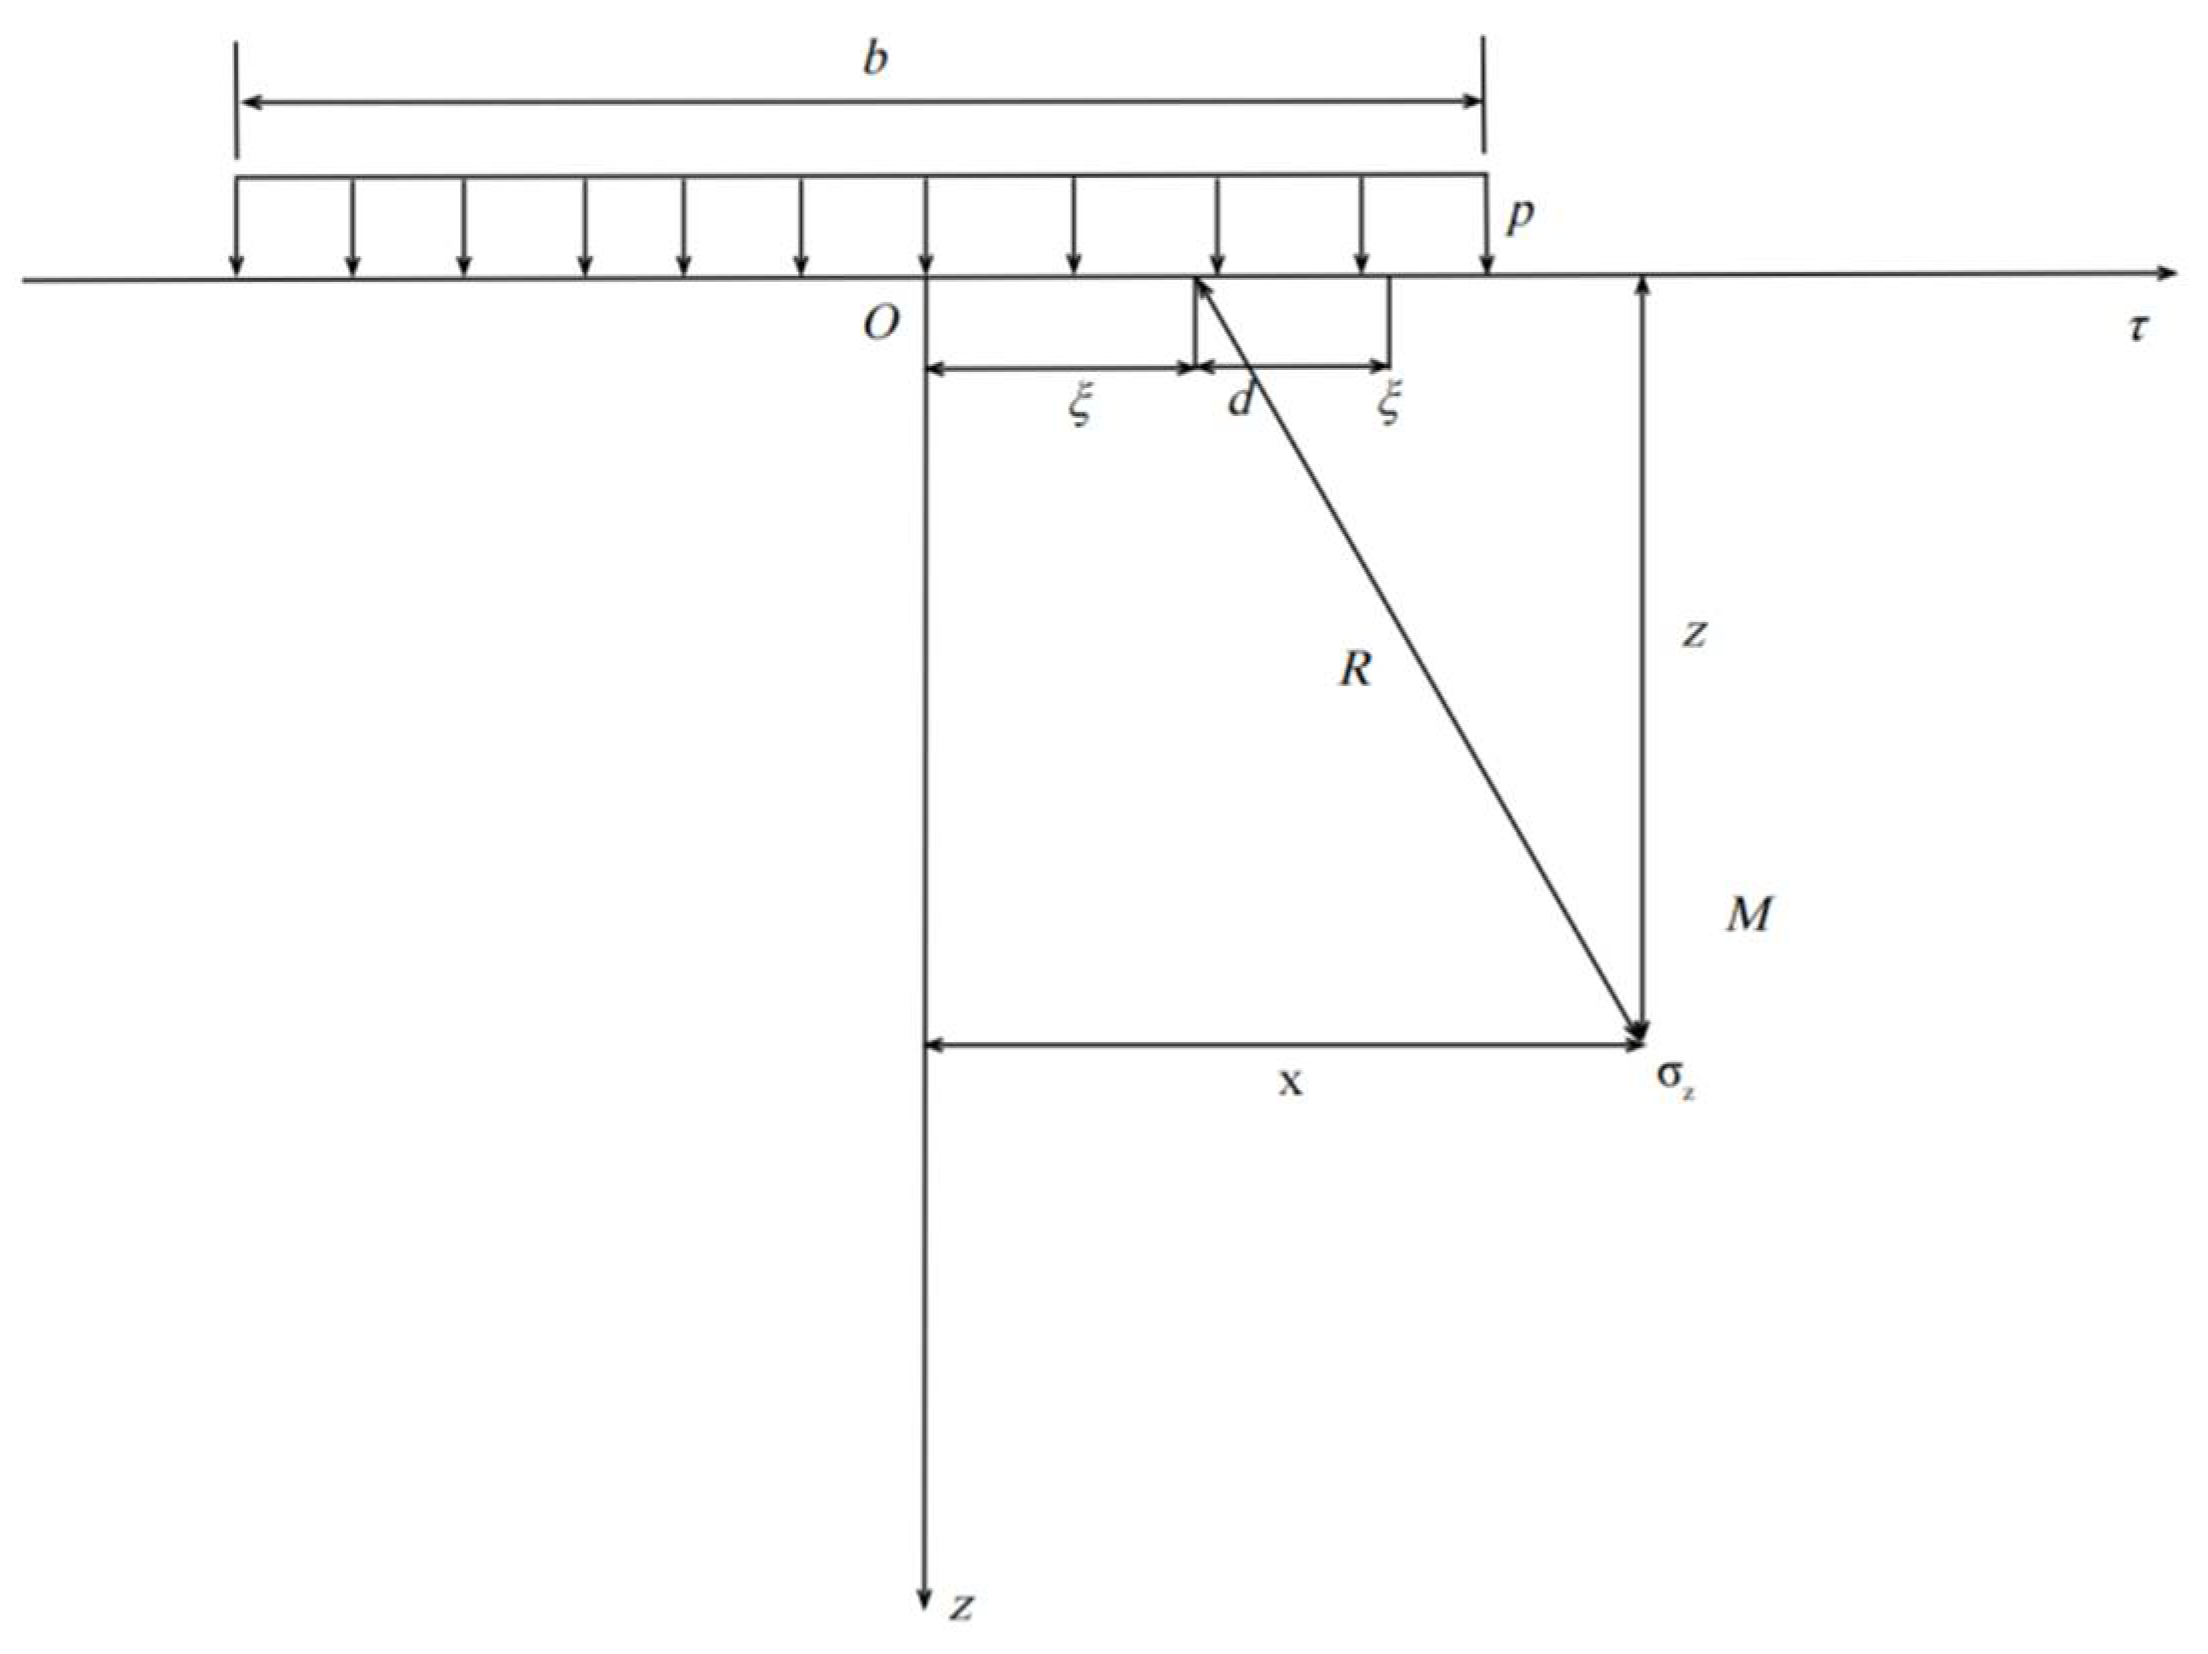
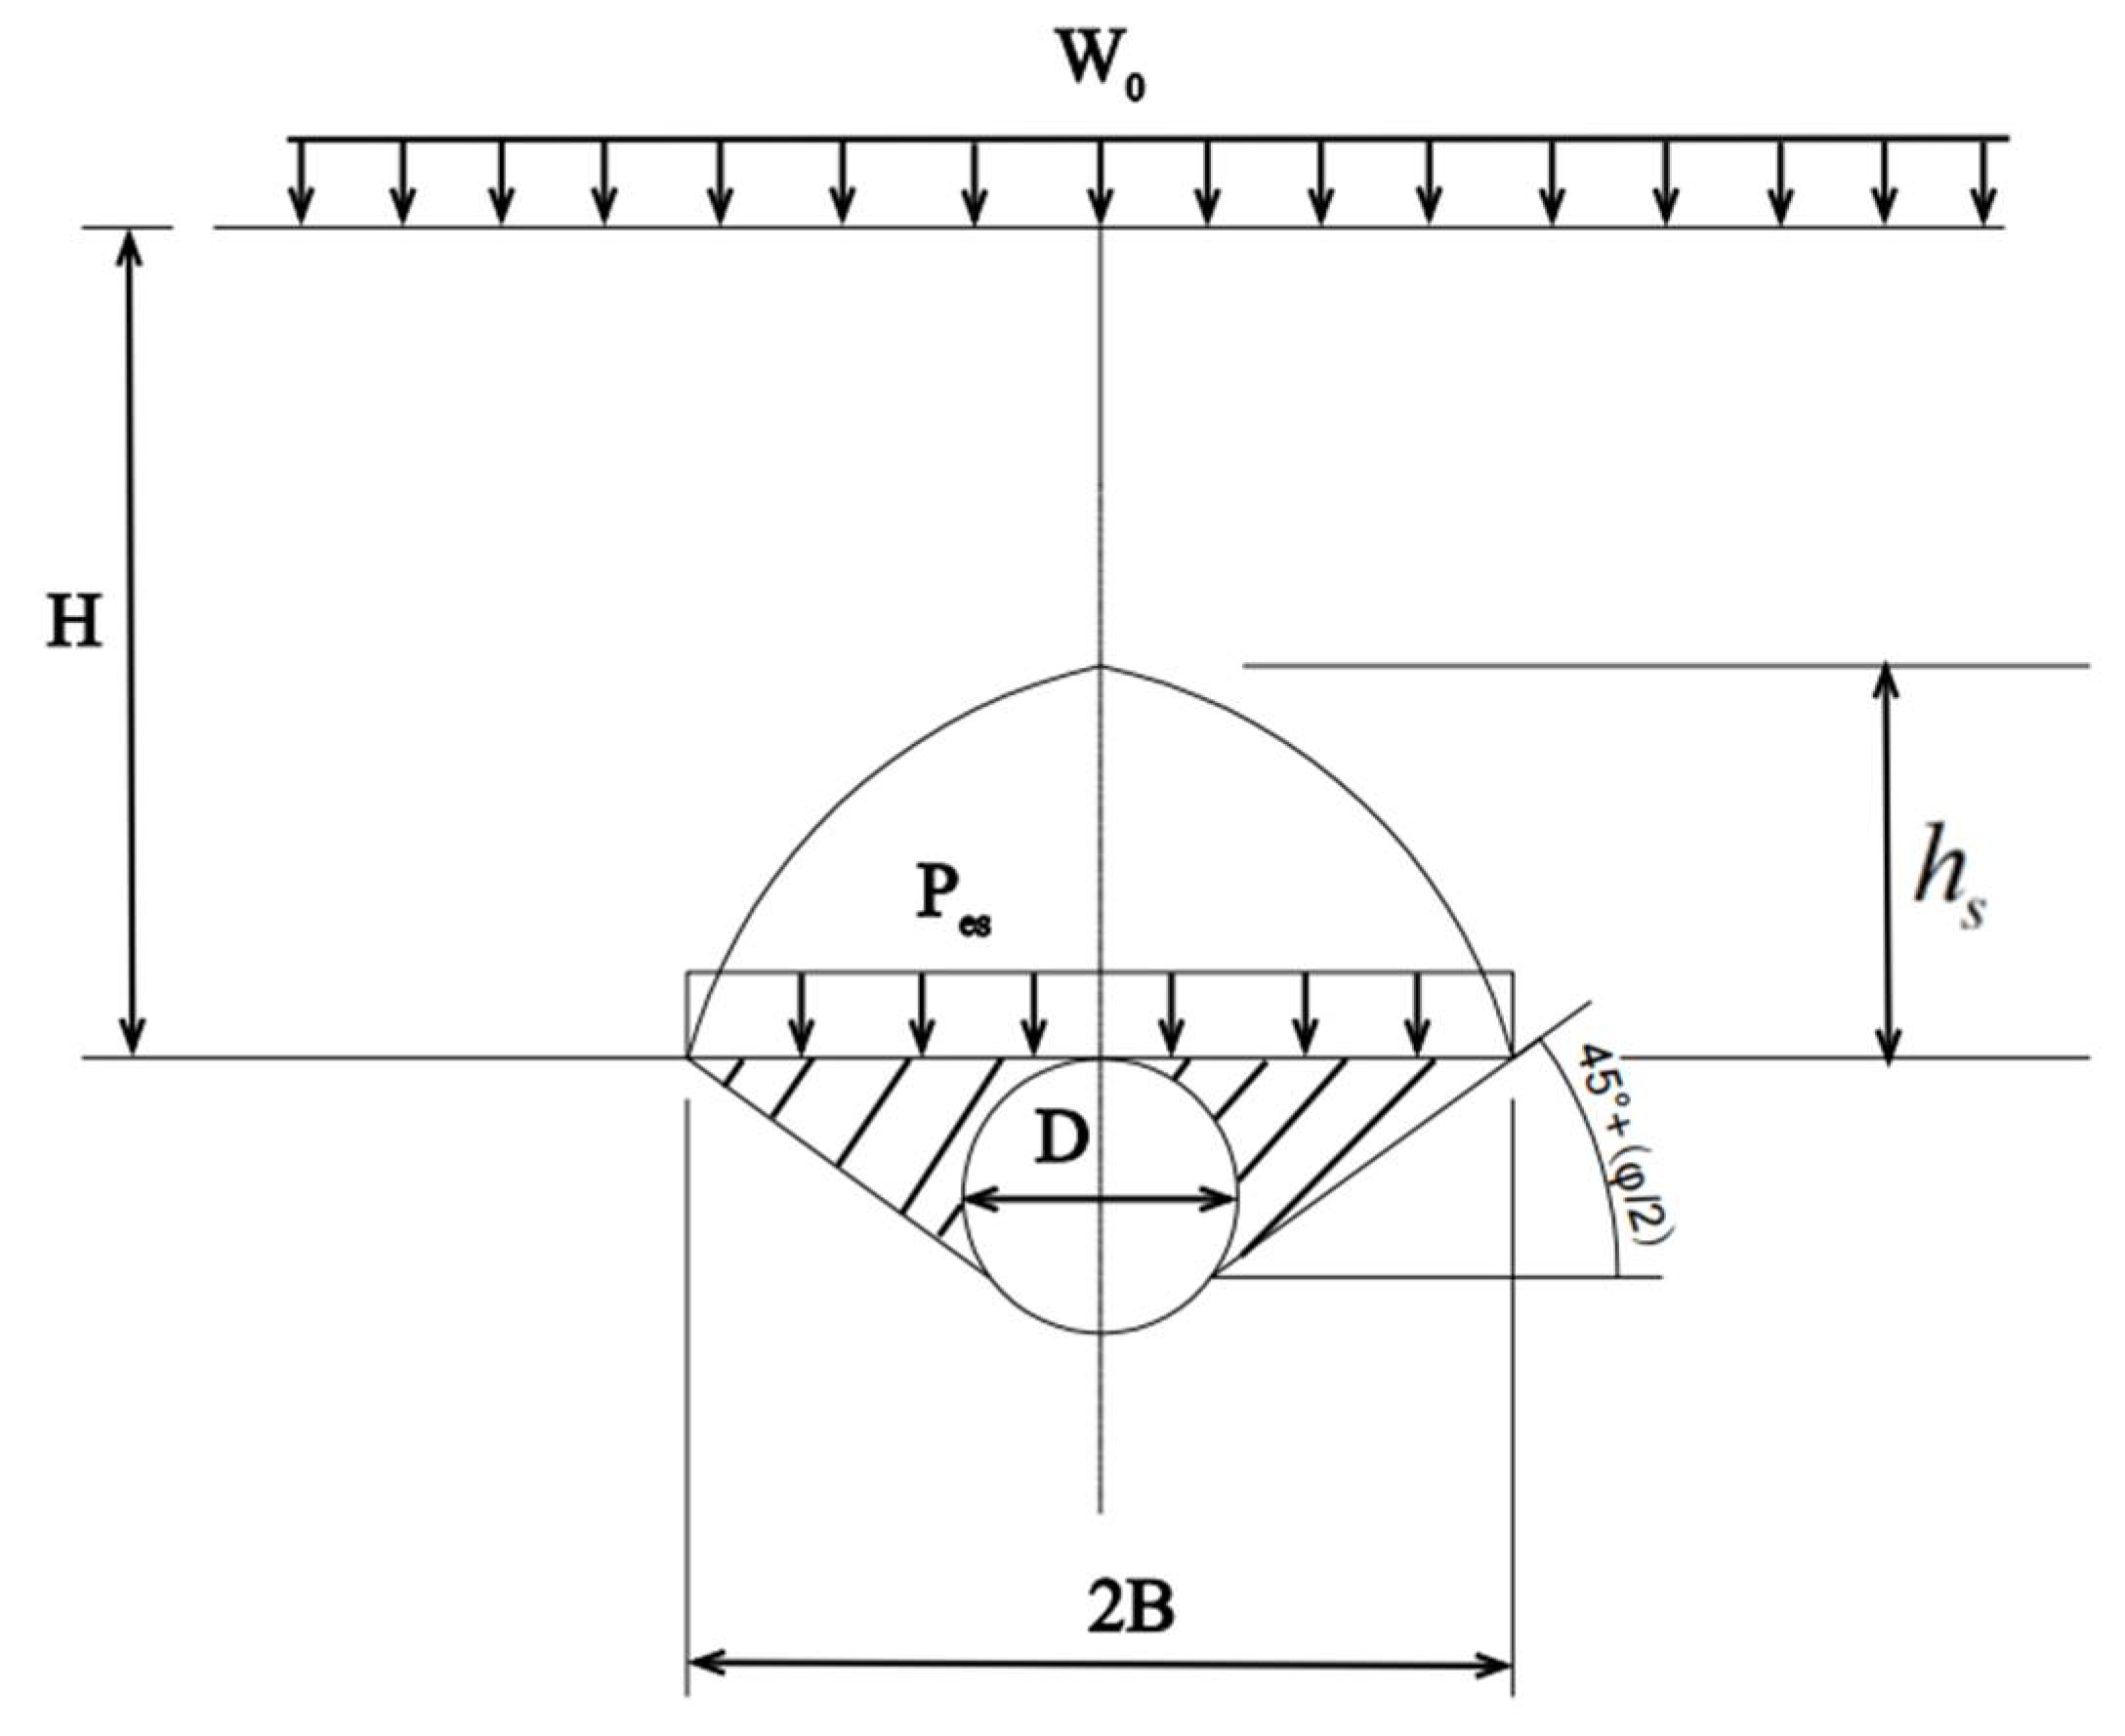
2.2. Calculation of Additional Stress on Buildings (Structures) in the Shield Underpassing Area
2.3. Control of Shield Tunneling Construction Parameters
- (1)
- Driving Pressure
- (i)
- Soil and Water Pressures
- (ii)
- Additional Stress
- (iii)
- Net-base Pressure
- (2)
- Synchronous Grouting Volume
- (3)
- Synchronous Grouting Pressure
3. Data Simulation of the Shield Underpassing Bridge Piles
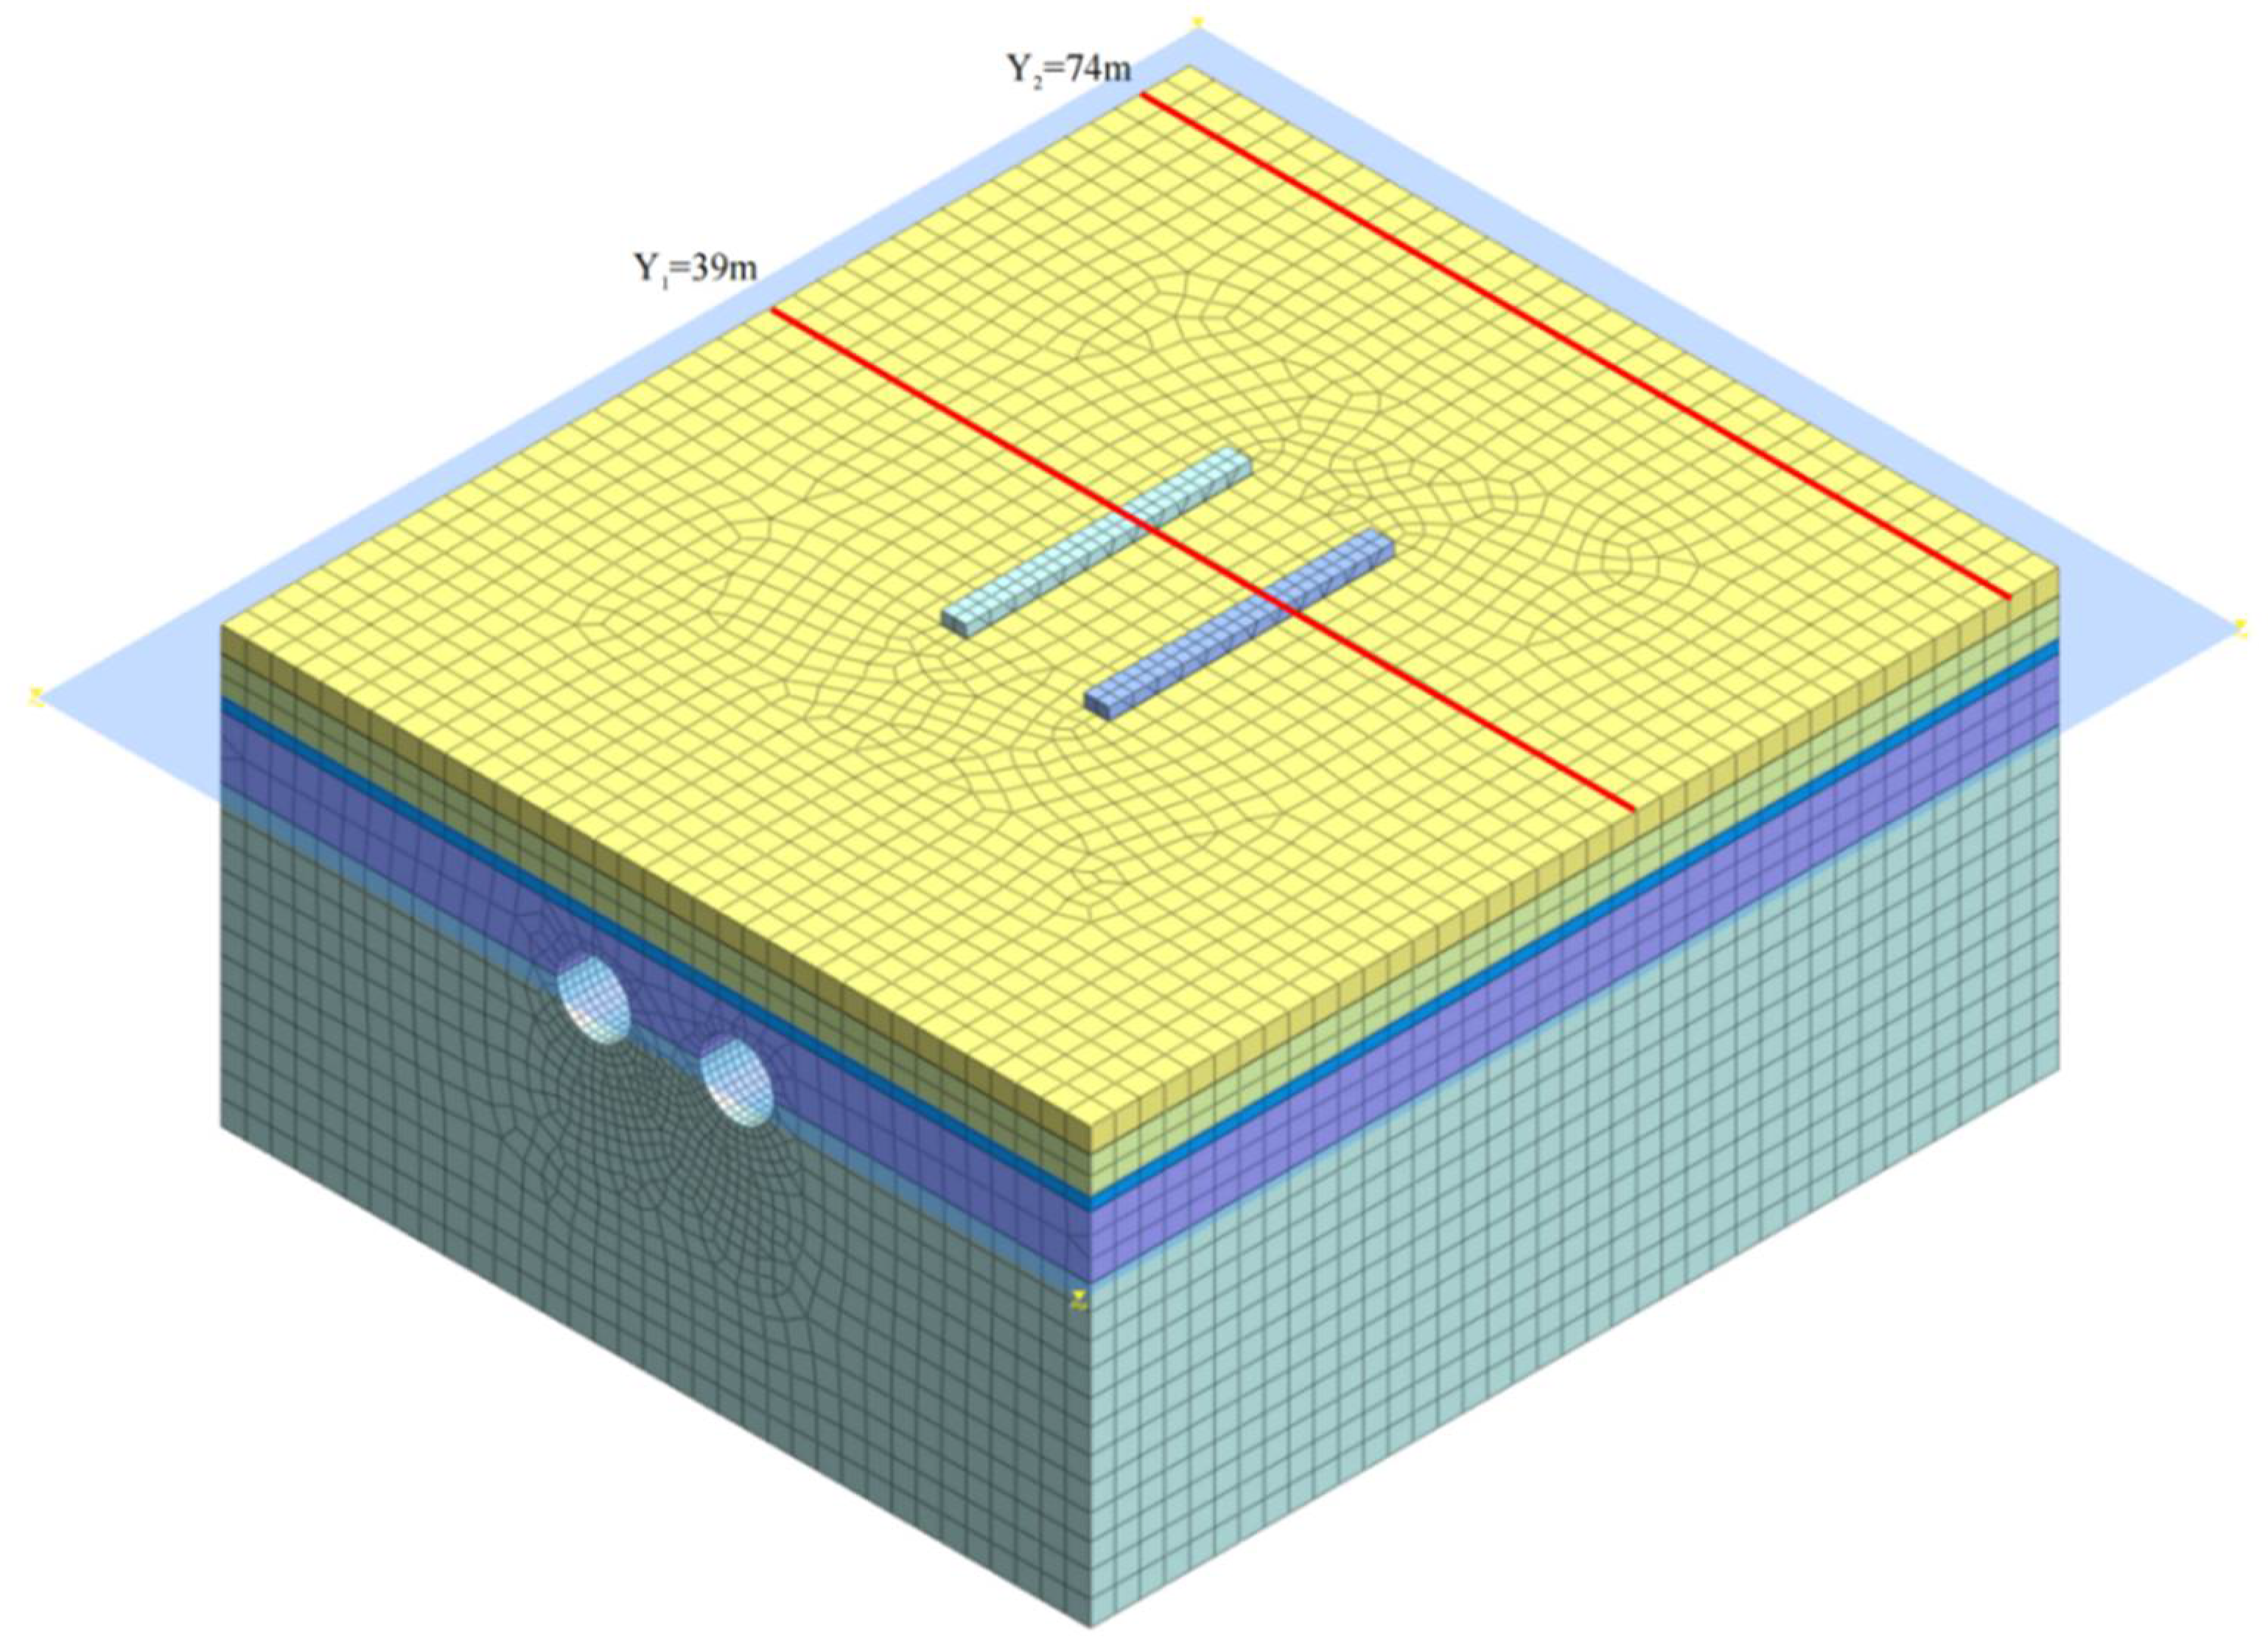
3.1. Simulation of Stratigraphy and Structure
- Soil layers: The distribution of geotechnical layers of the strata from top to bottom are: miscellaneous fill, silty soil, fine sand, medium to coarse sand, and slightly weathered limestone. The location of the shield palm lied between the medium coarse sand and the slightly weathered limestone, and the groundwater level was set at −4.7 m. Each geotechnical layer was simulated using the Mohr–Coulomb local structure, i.e., its elastic–plastic deformation was considered.
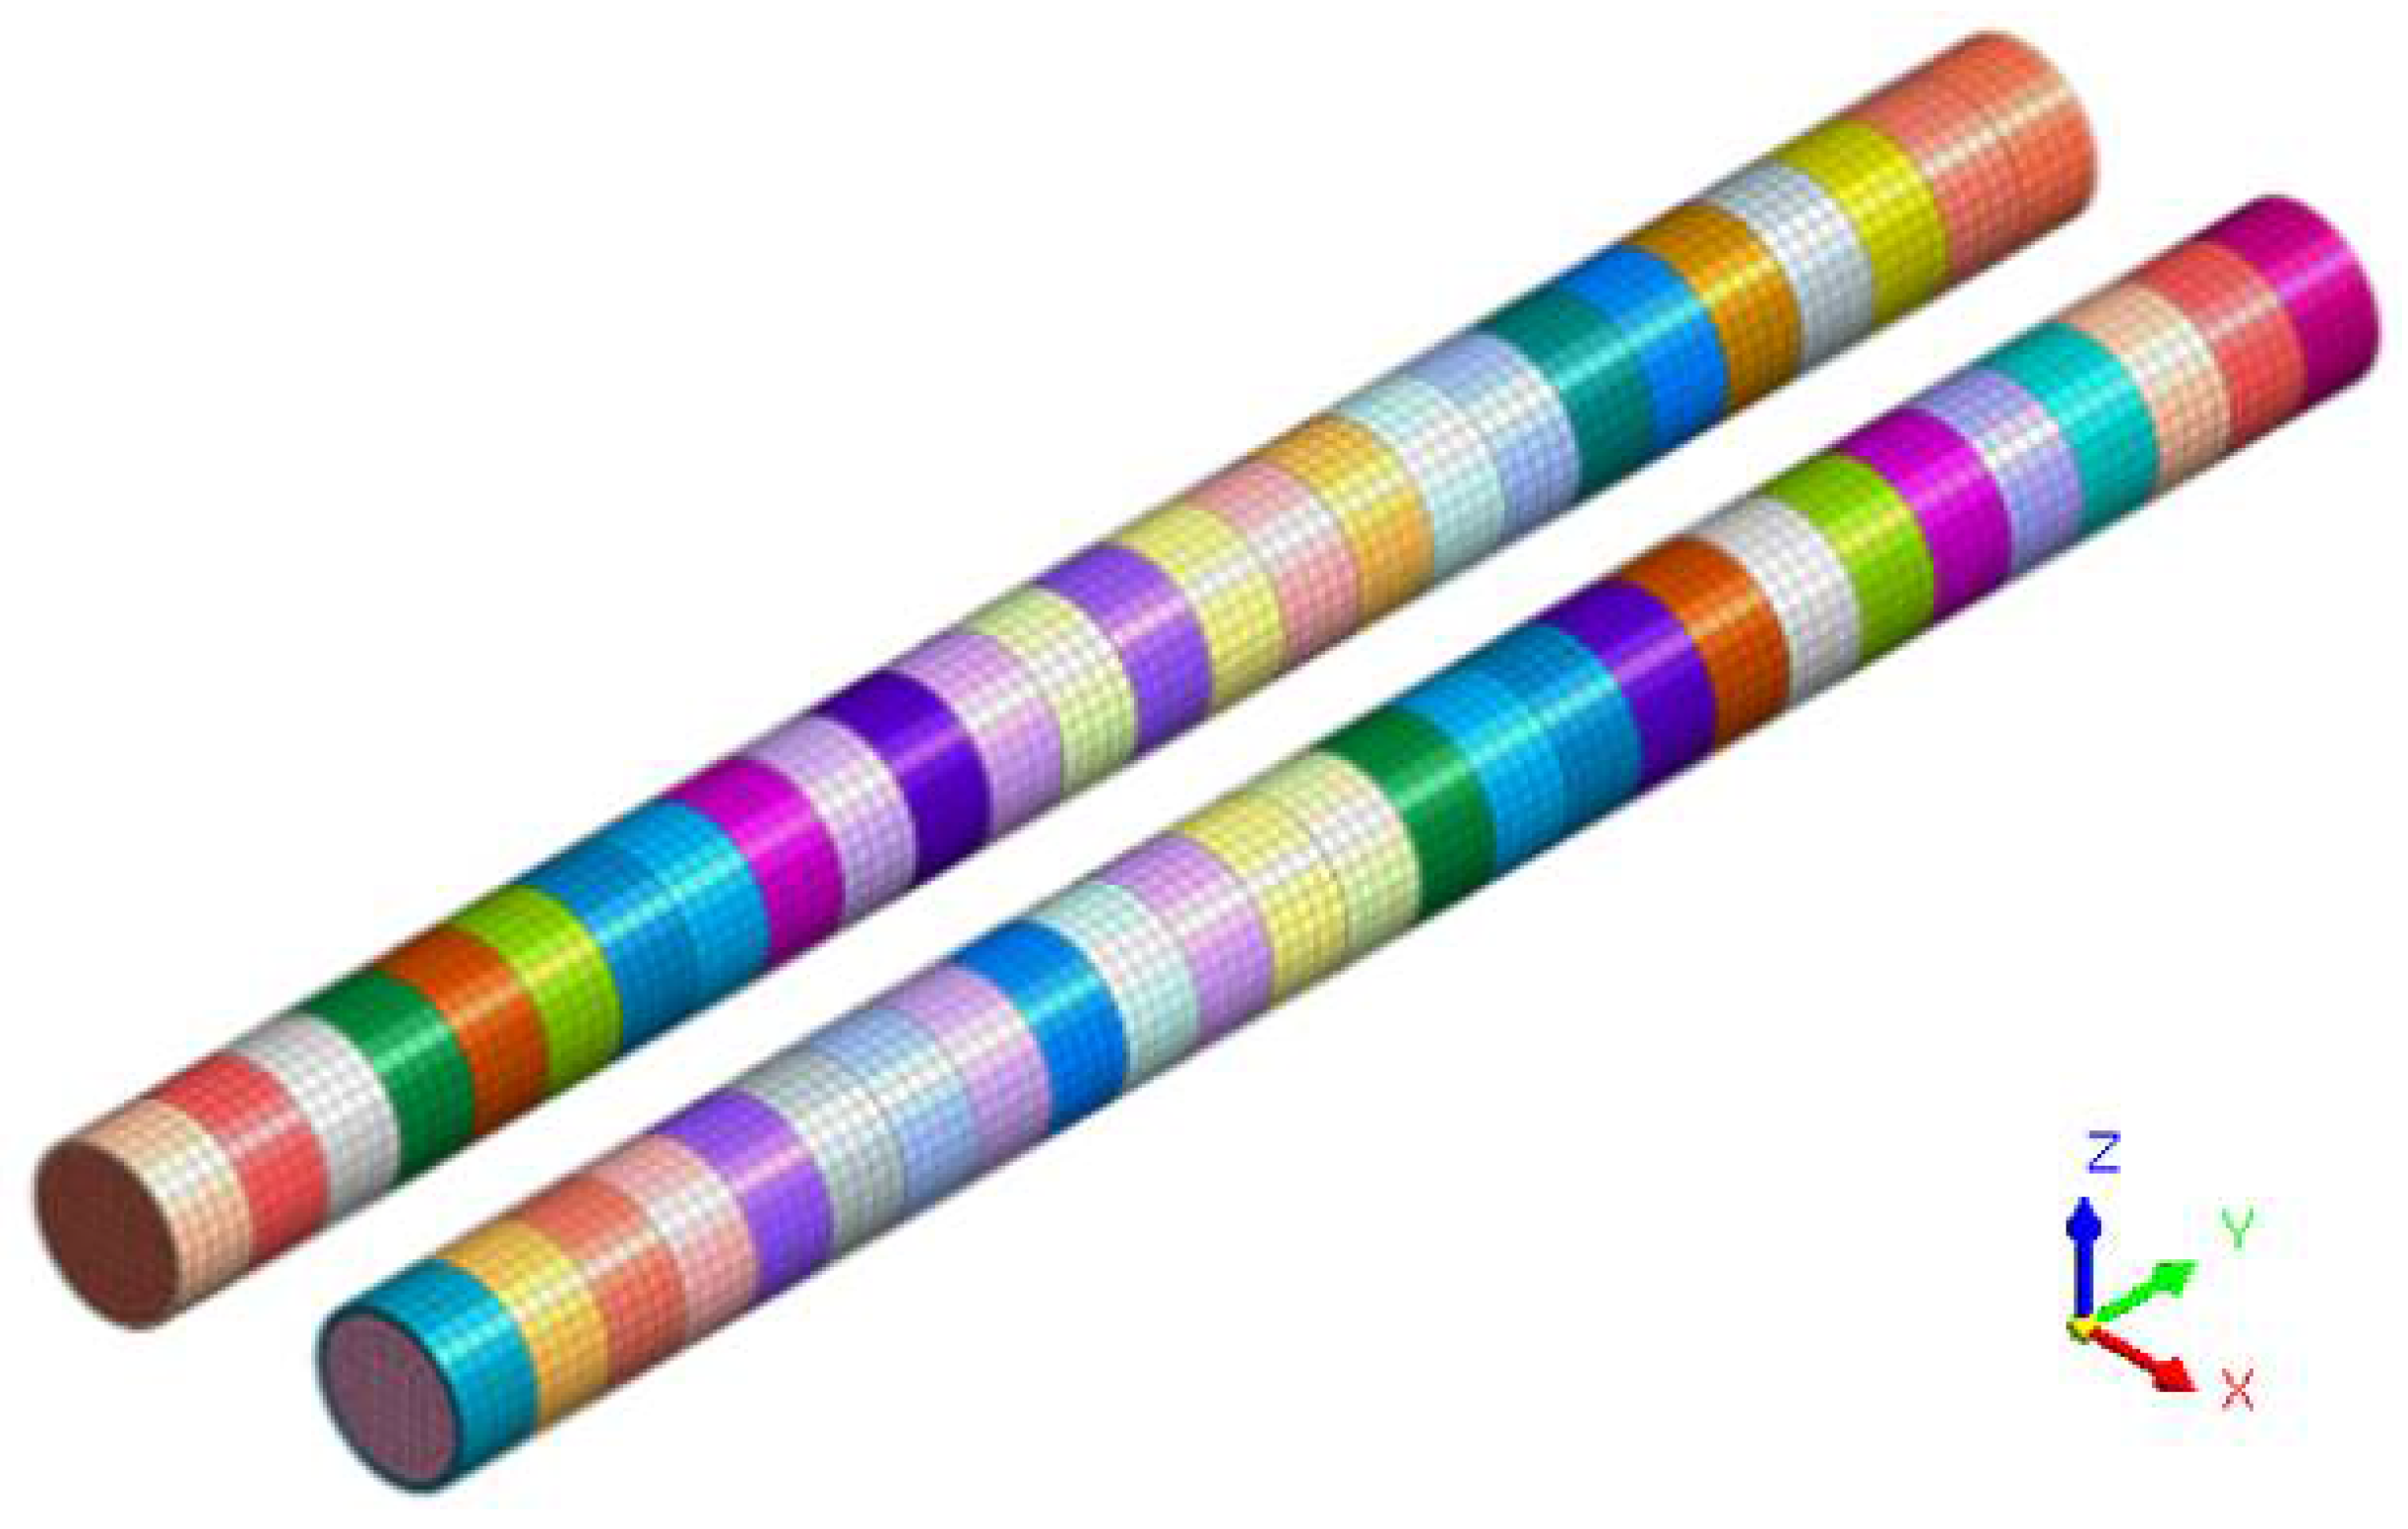
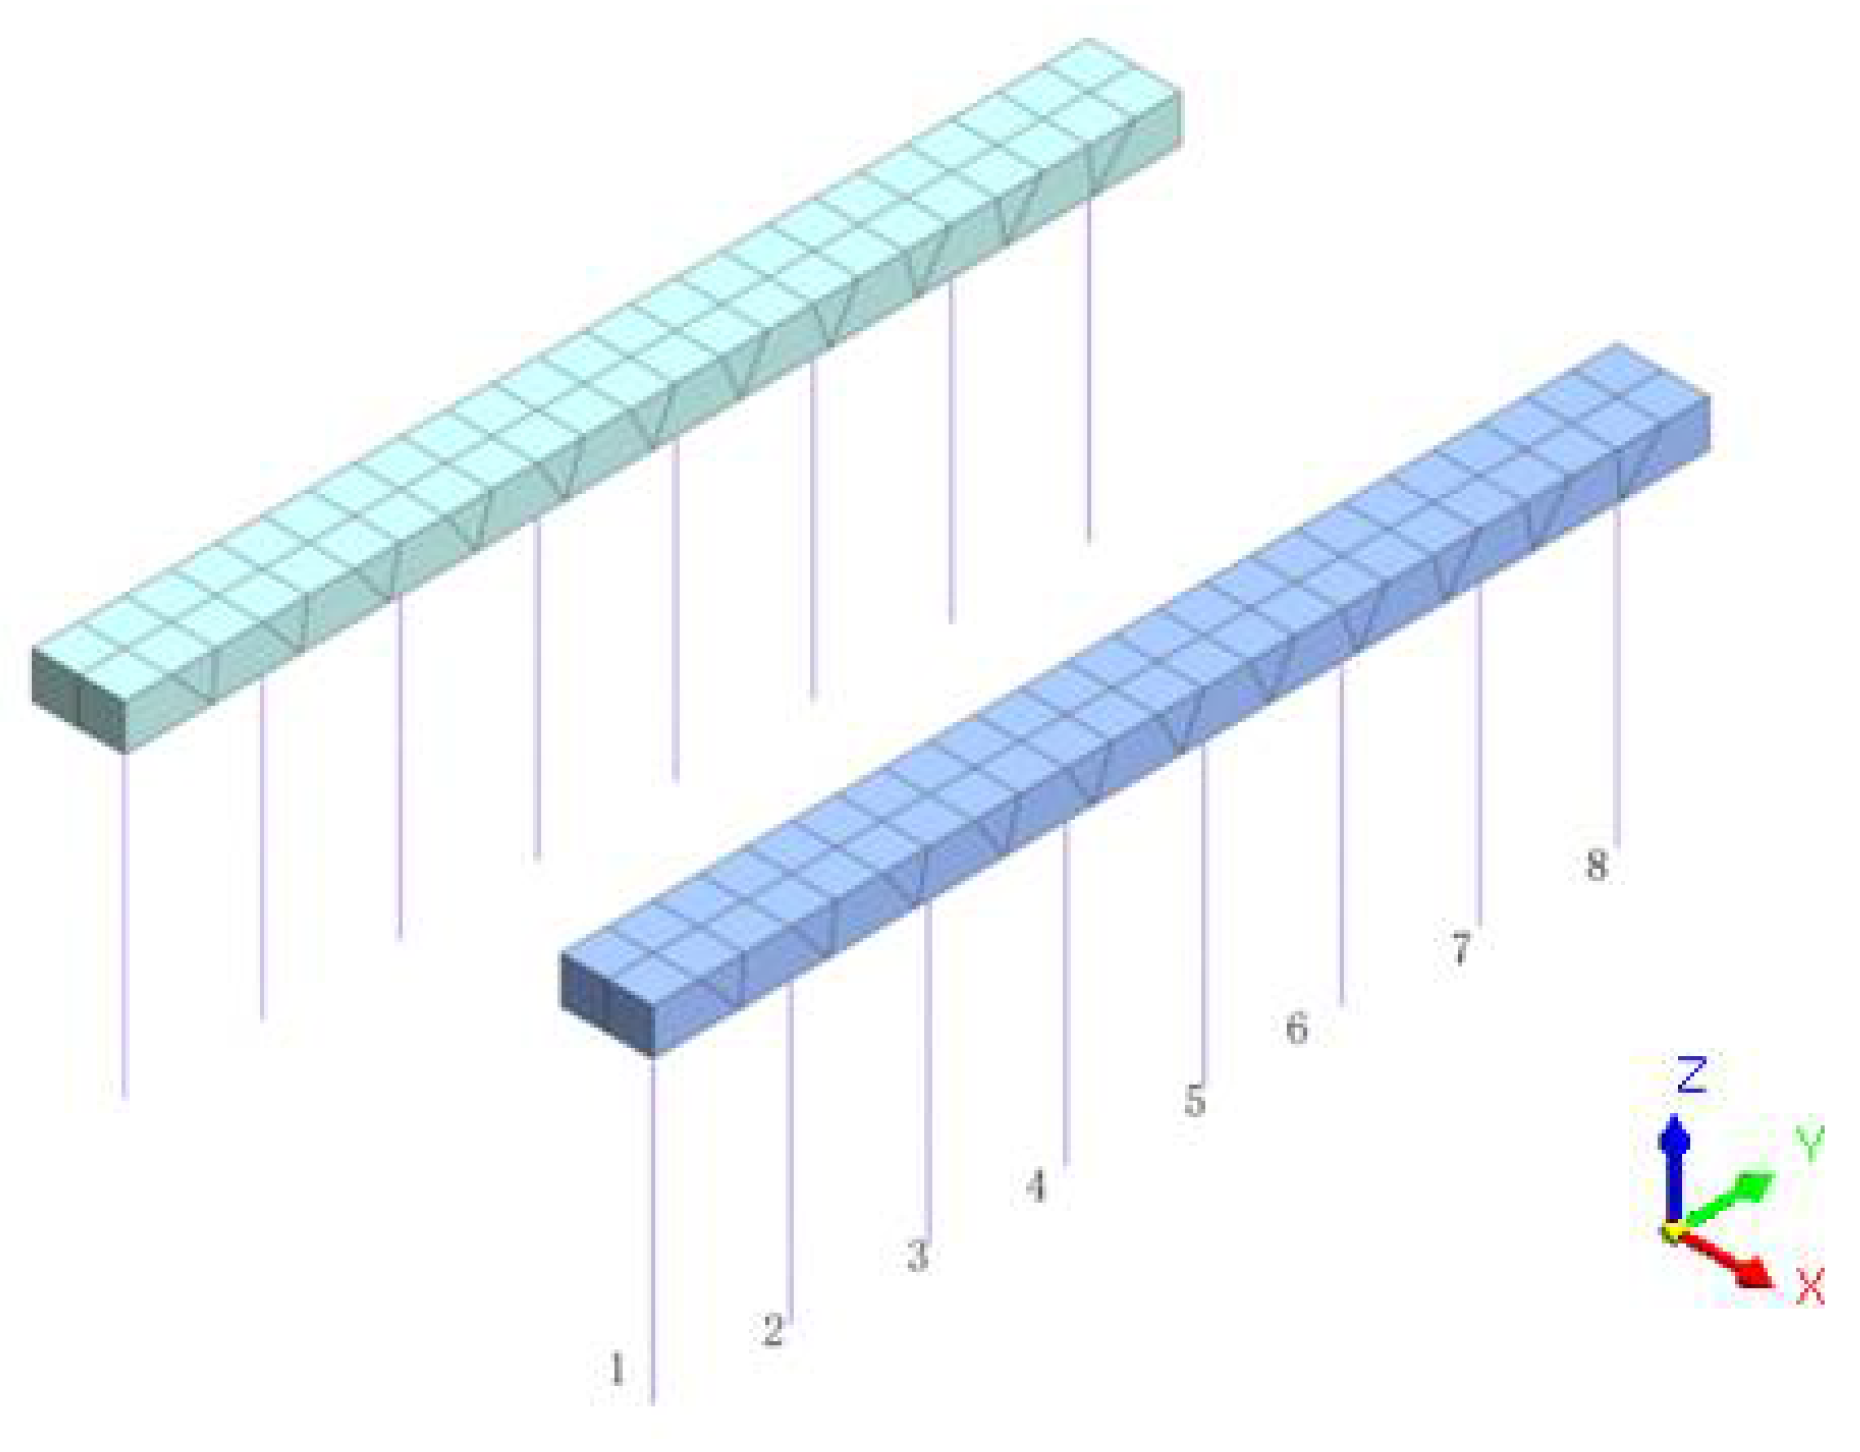
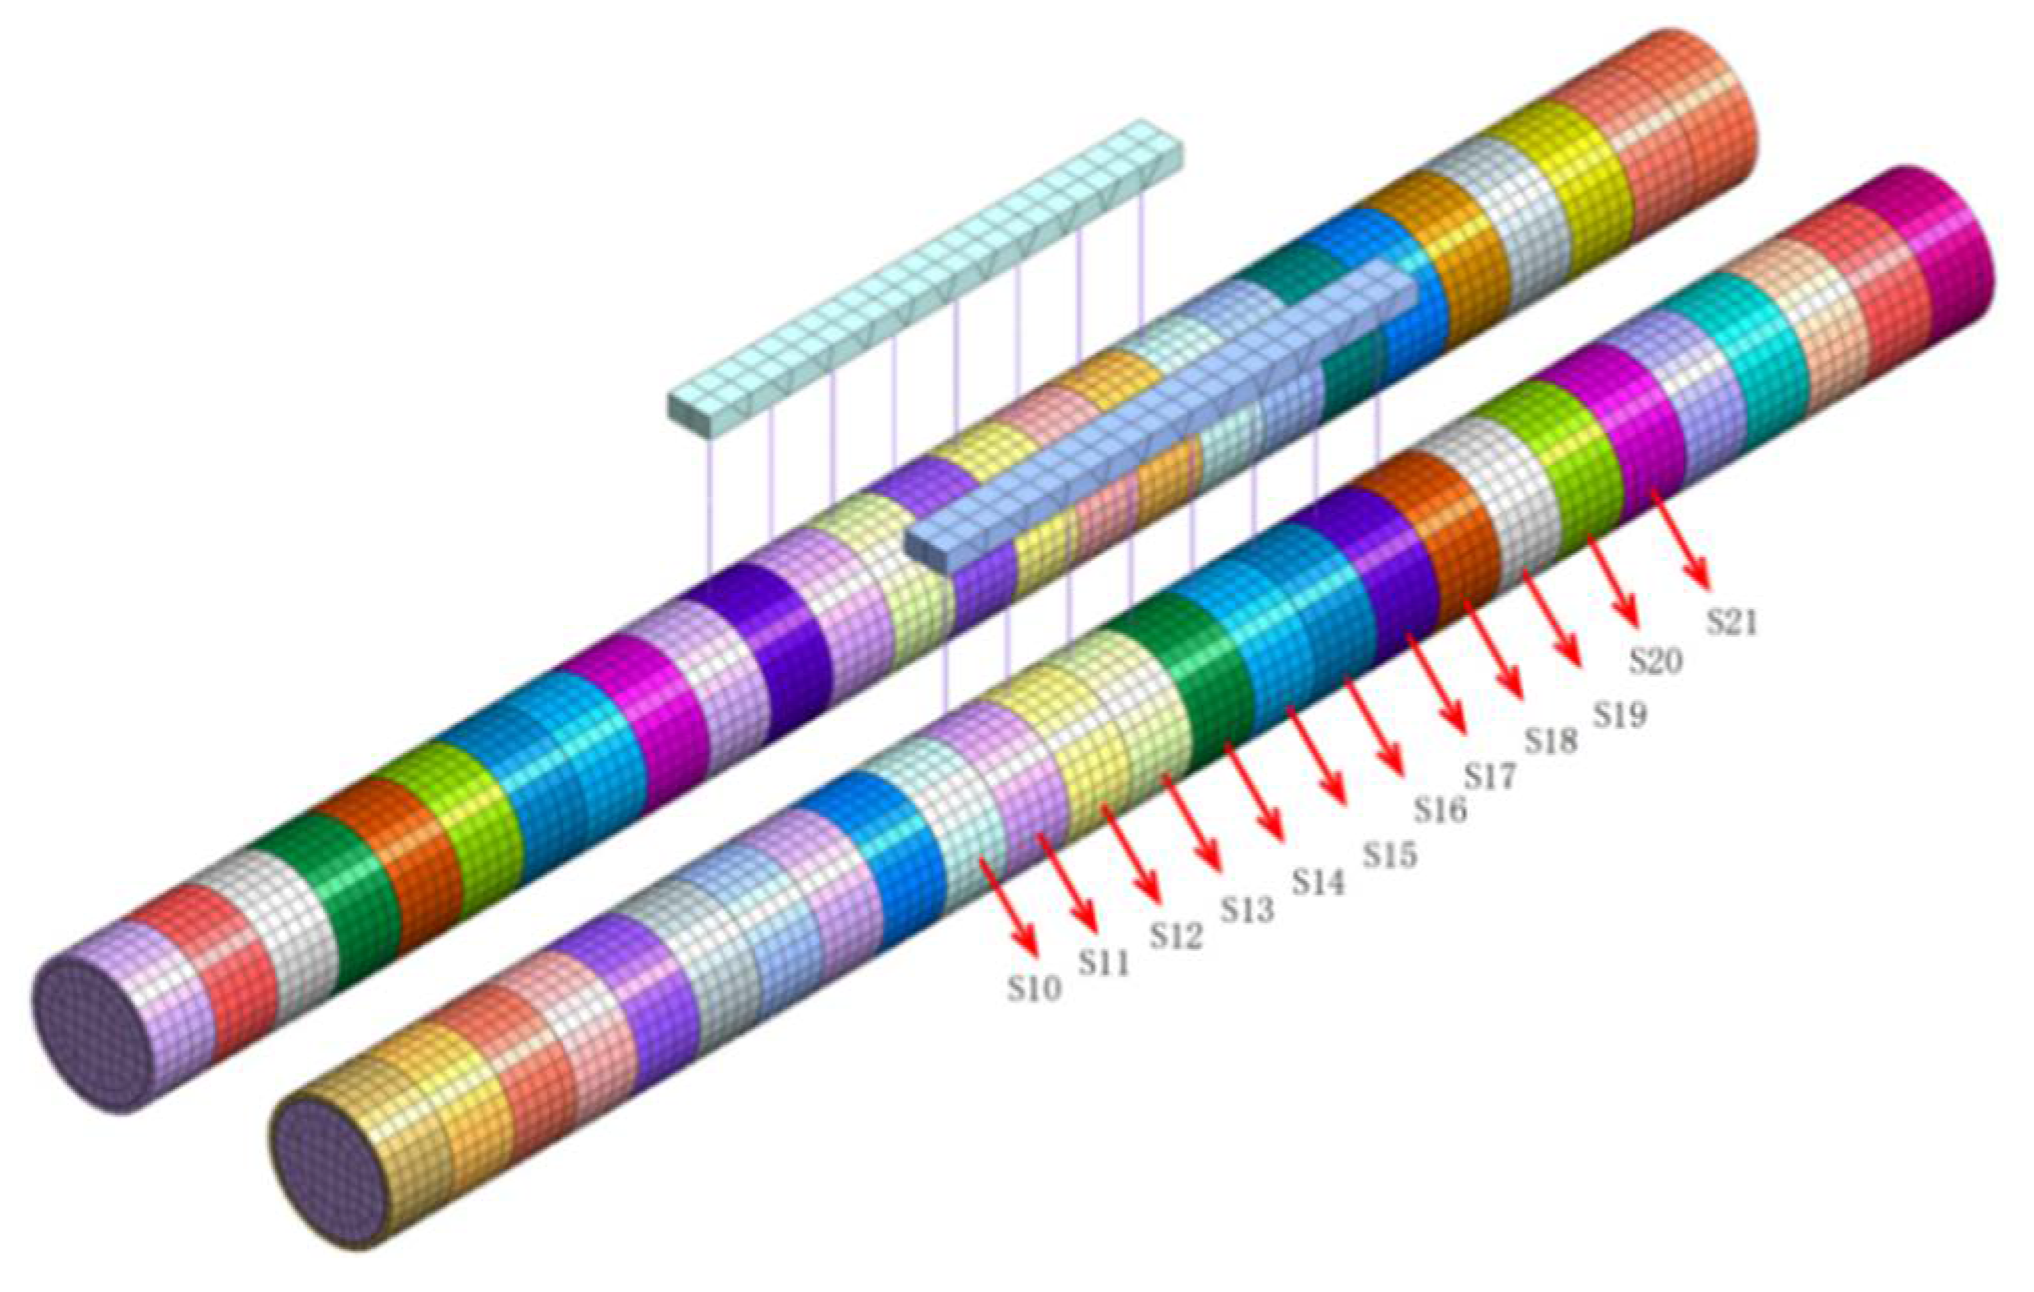
- Shield segments: The diameter of the shield tunnel tube sheet was 6 m, each section was 3 m long, and a total of 26 sections of tube sheet were simulated for each of the two-lane tunnels, as shown in Figure 4. The shield tube piece should not consider the circumferential stiffness, and cannot ignore the longitudinal stiffness discount situation.
- 3.
- Grouting layer: To simulate synchronous grouting as accurately as possible, this study used the “equal generation layer” assumption to simulate the grouting layer, i.e., the factors that are difficult to quantify in the grouting process are generalized to obtain a relatively homogeneous “equal generation layer” with the same thickness. At the same time, the hardening process of the cement mortar from low strength (at the beginning of grouting) to high strength (at a later stage), and the decrease of the grouting pressure from the initial value to 0 MPa, were simulated by increasing the strength of the “equivalent layer” and by decreasing the grouting pressure in two steps. In this study, the thickness of the “equivalent layer” for the synchronous grouting of the shield tunnel was taken as δ = 0.3 m.
- 4.
- Bearing platform and pile foundation: The height of the existing bearing platform was 1 m, the length of the infill pile was 7.5 m, the pile diameter was 480 mm, and the group pile arrangement is shown in Figure 5. The distance between the top of the tunnel vault and the bottom of the pile foundation of the bearing platform was 1.4 m.
3.2. Simulation of Different Hard-Rock Height Ratios at the Shield Tunneling Face
3.3. Construction Parameters and Deformation Control
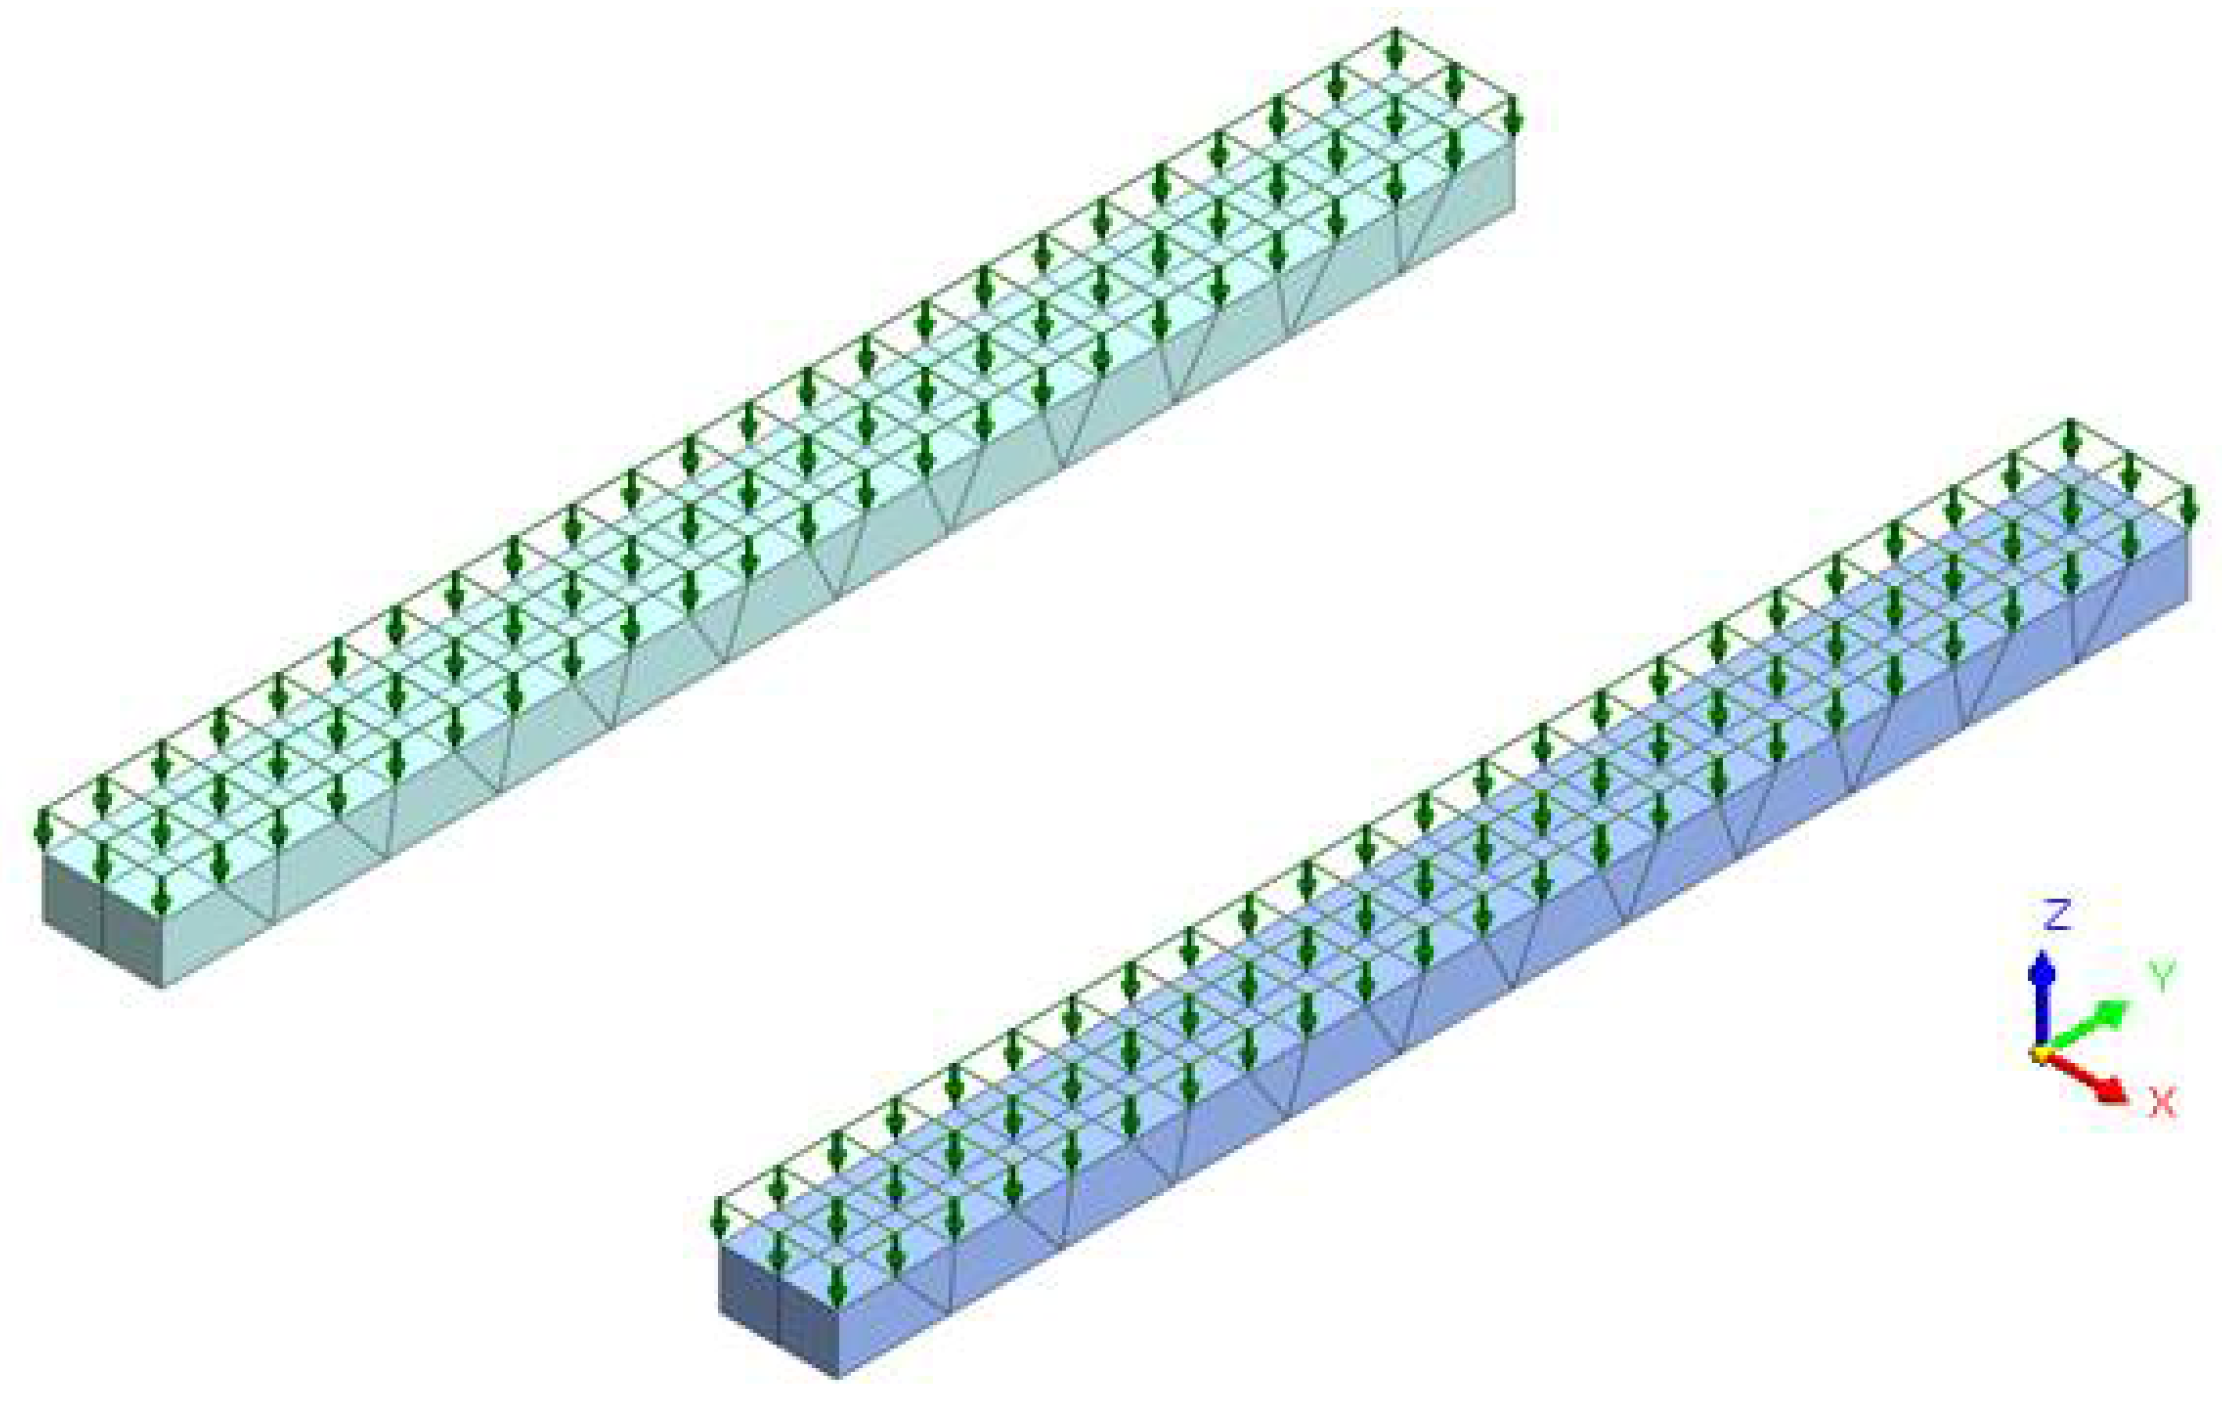
- Loads
- 2.
- Shield Construction Parameters
- 3.
- Allowable disturbance
3.4. Construction Phase Simulation
- (1)
- Initial ground stress: All the soil layers were activated at this stage along with the overall model constraints and self-weight. We set the groundwater level to −4.7 m and checked the displacement clearing.
- (2)
- Pile foundation bearing construction simulation: This stage activated the bearing structure, pile foundation, and bearing loads. Given that there was no need to consider the effect of displacement after the completion of the bearing and pile foundation, we checked the displacement clearance.
- (3)
- Simulation of shield tunnel construction: At this stage, two shield tunnel excavations were simulated, namely the right tunnel (first) and the left tunnel (second). Each shield tunnel was 78 m long and was divided into 26 excavation sections.
4. Mechanical Response of Shield Underpassing Bridge Piles at Different Hard-Rock Height Ratios
- (1)
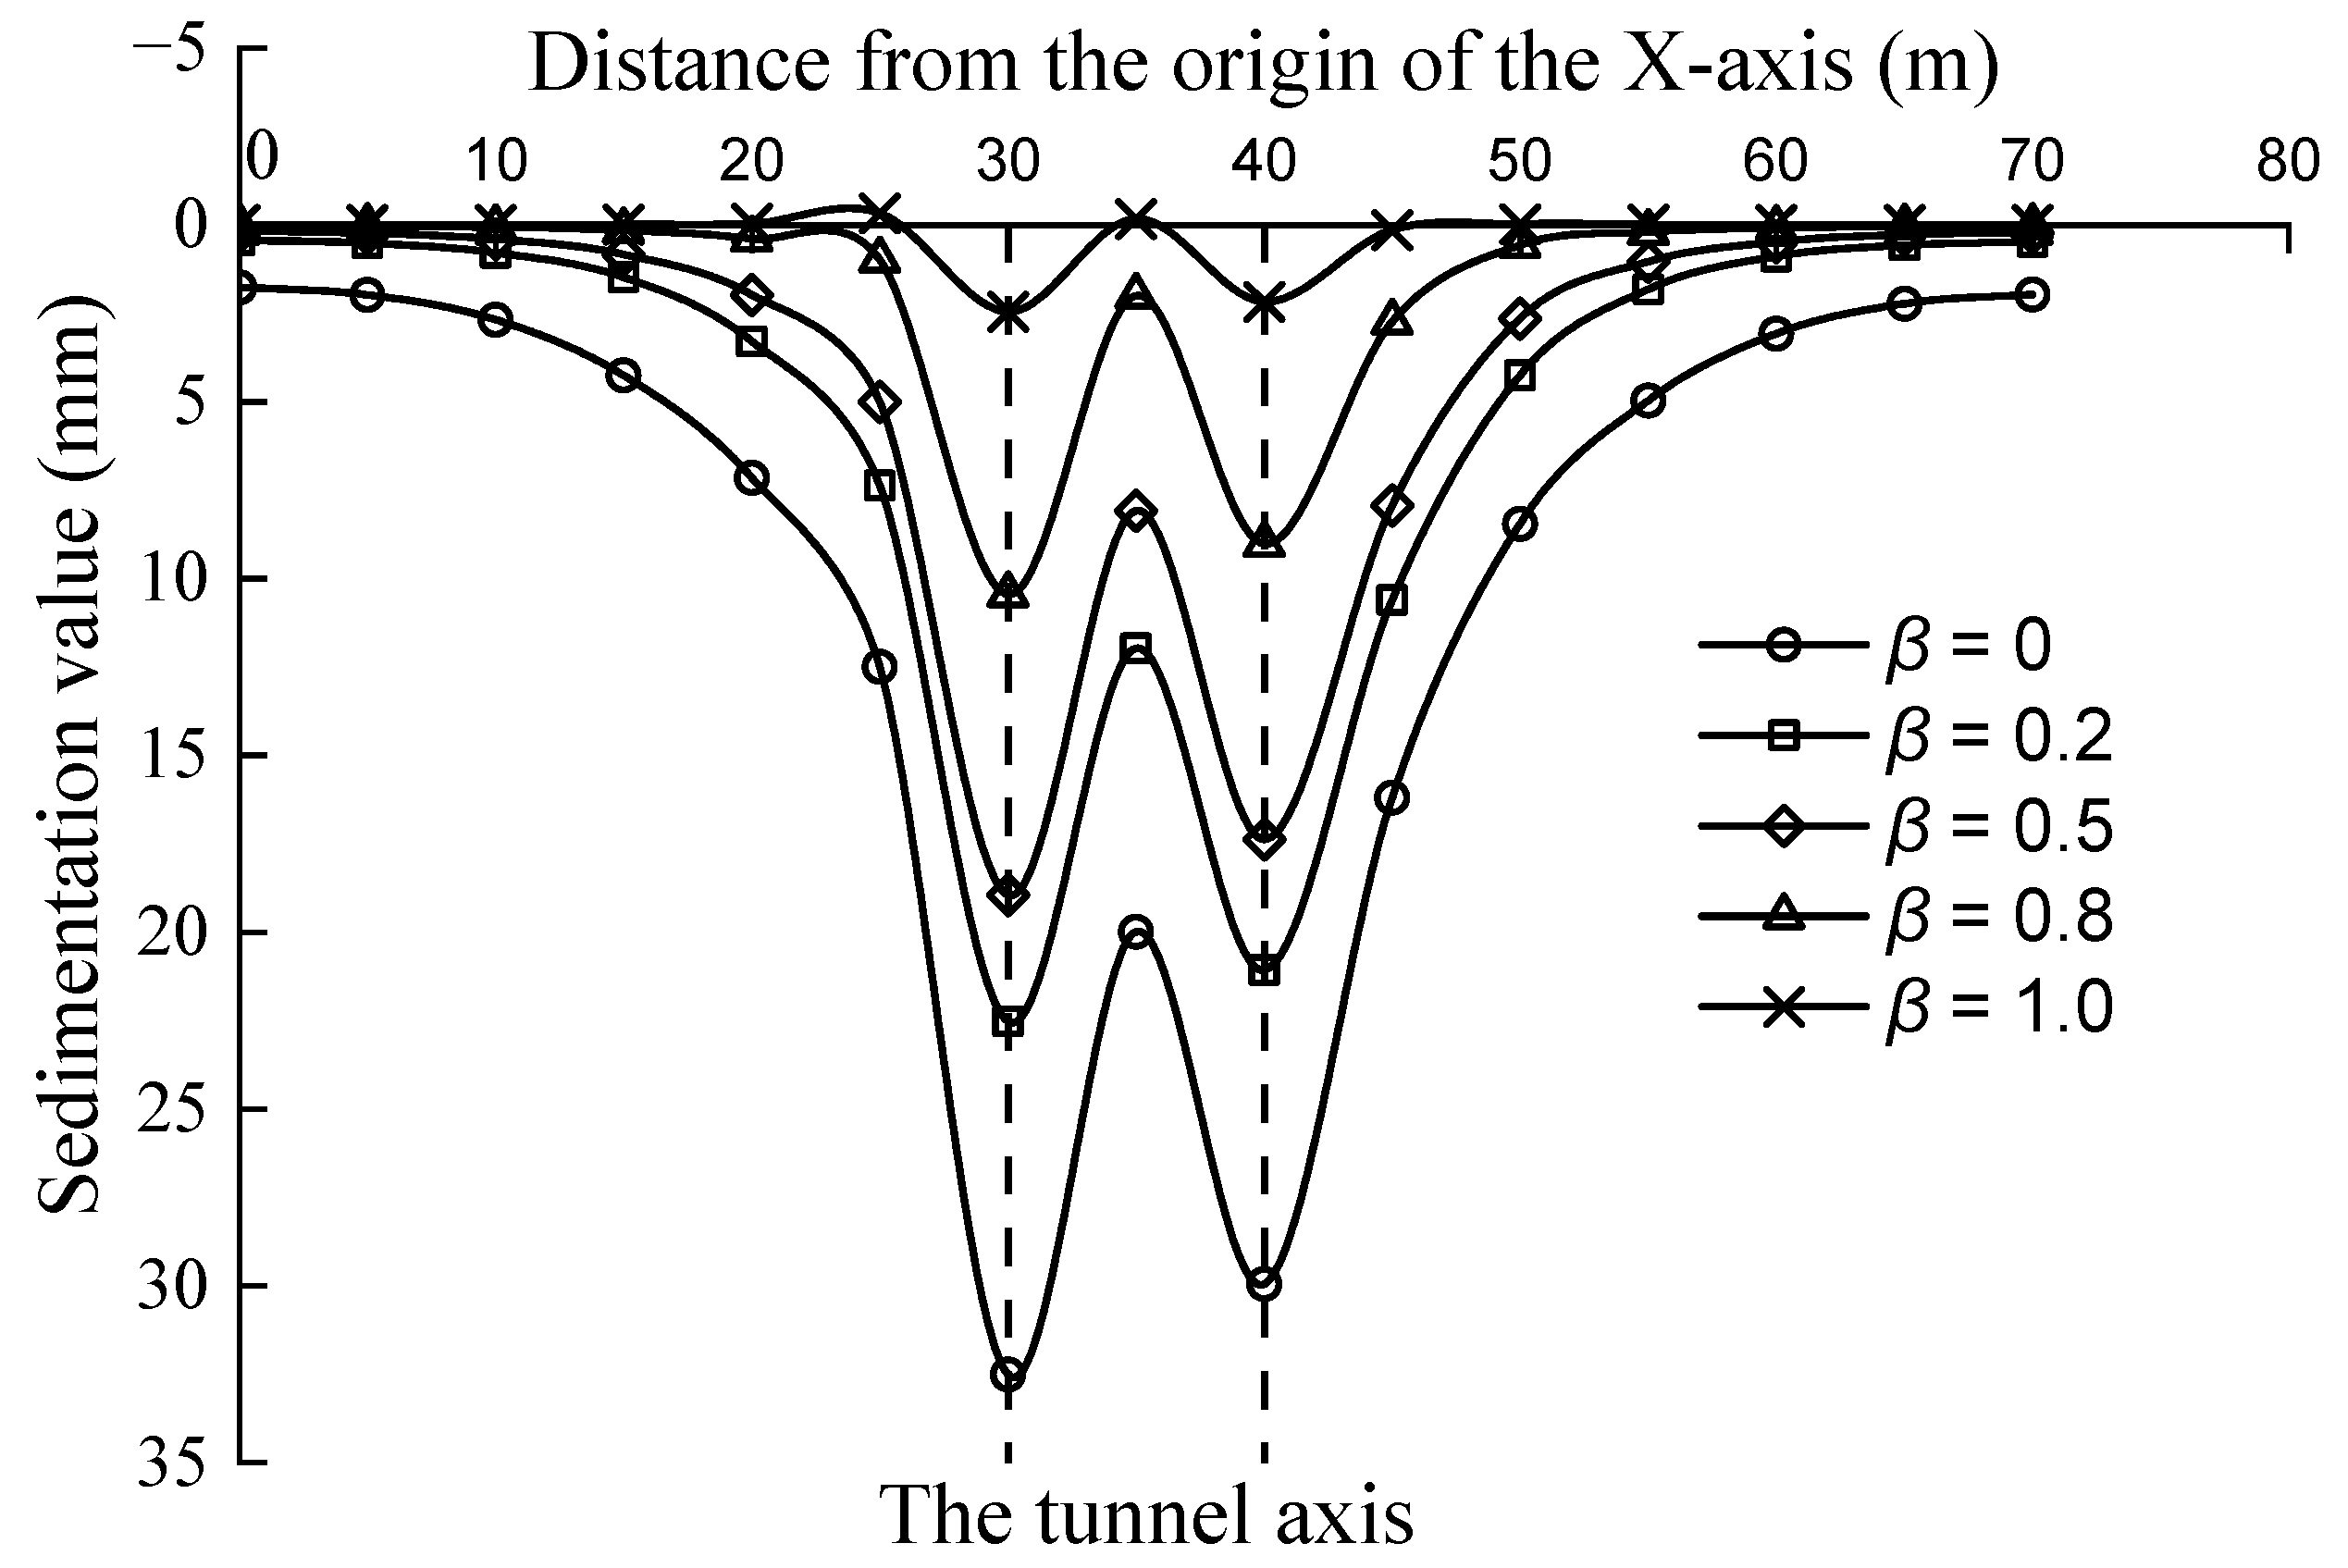
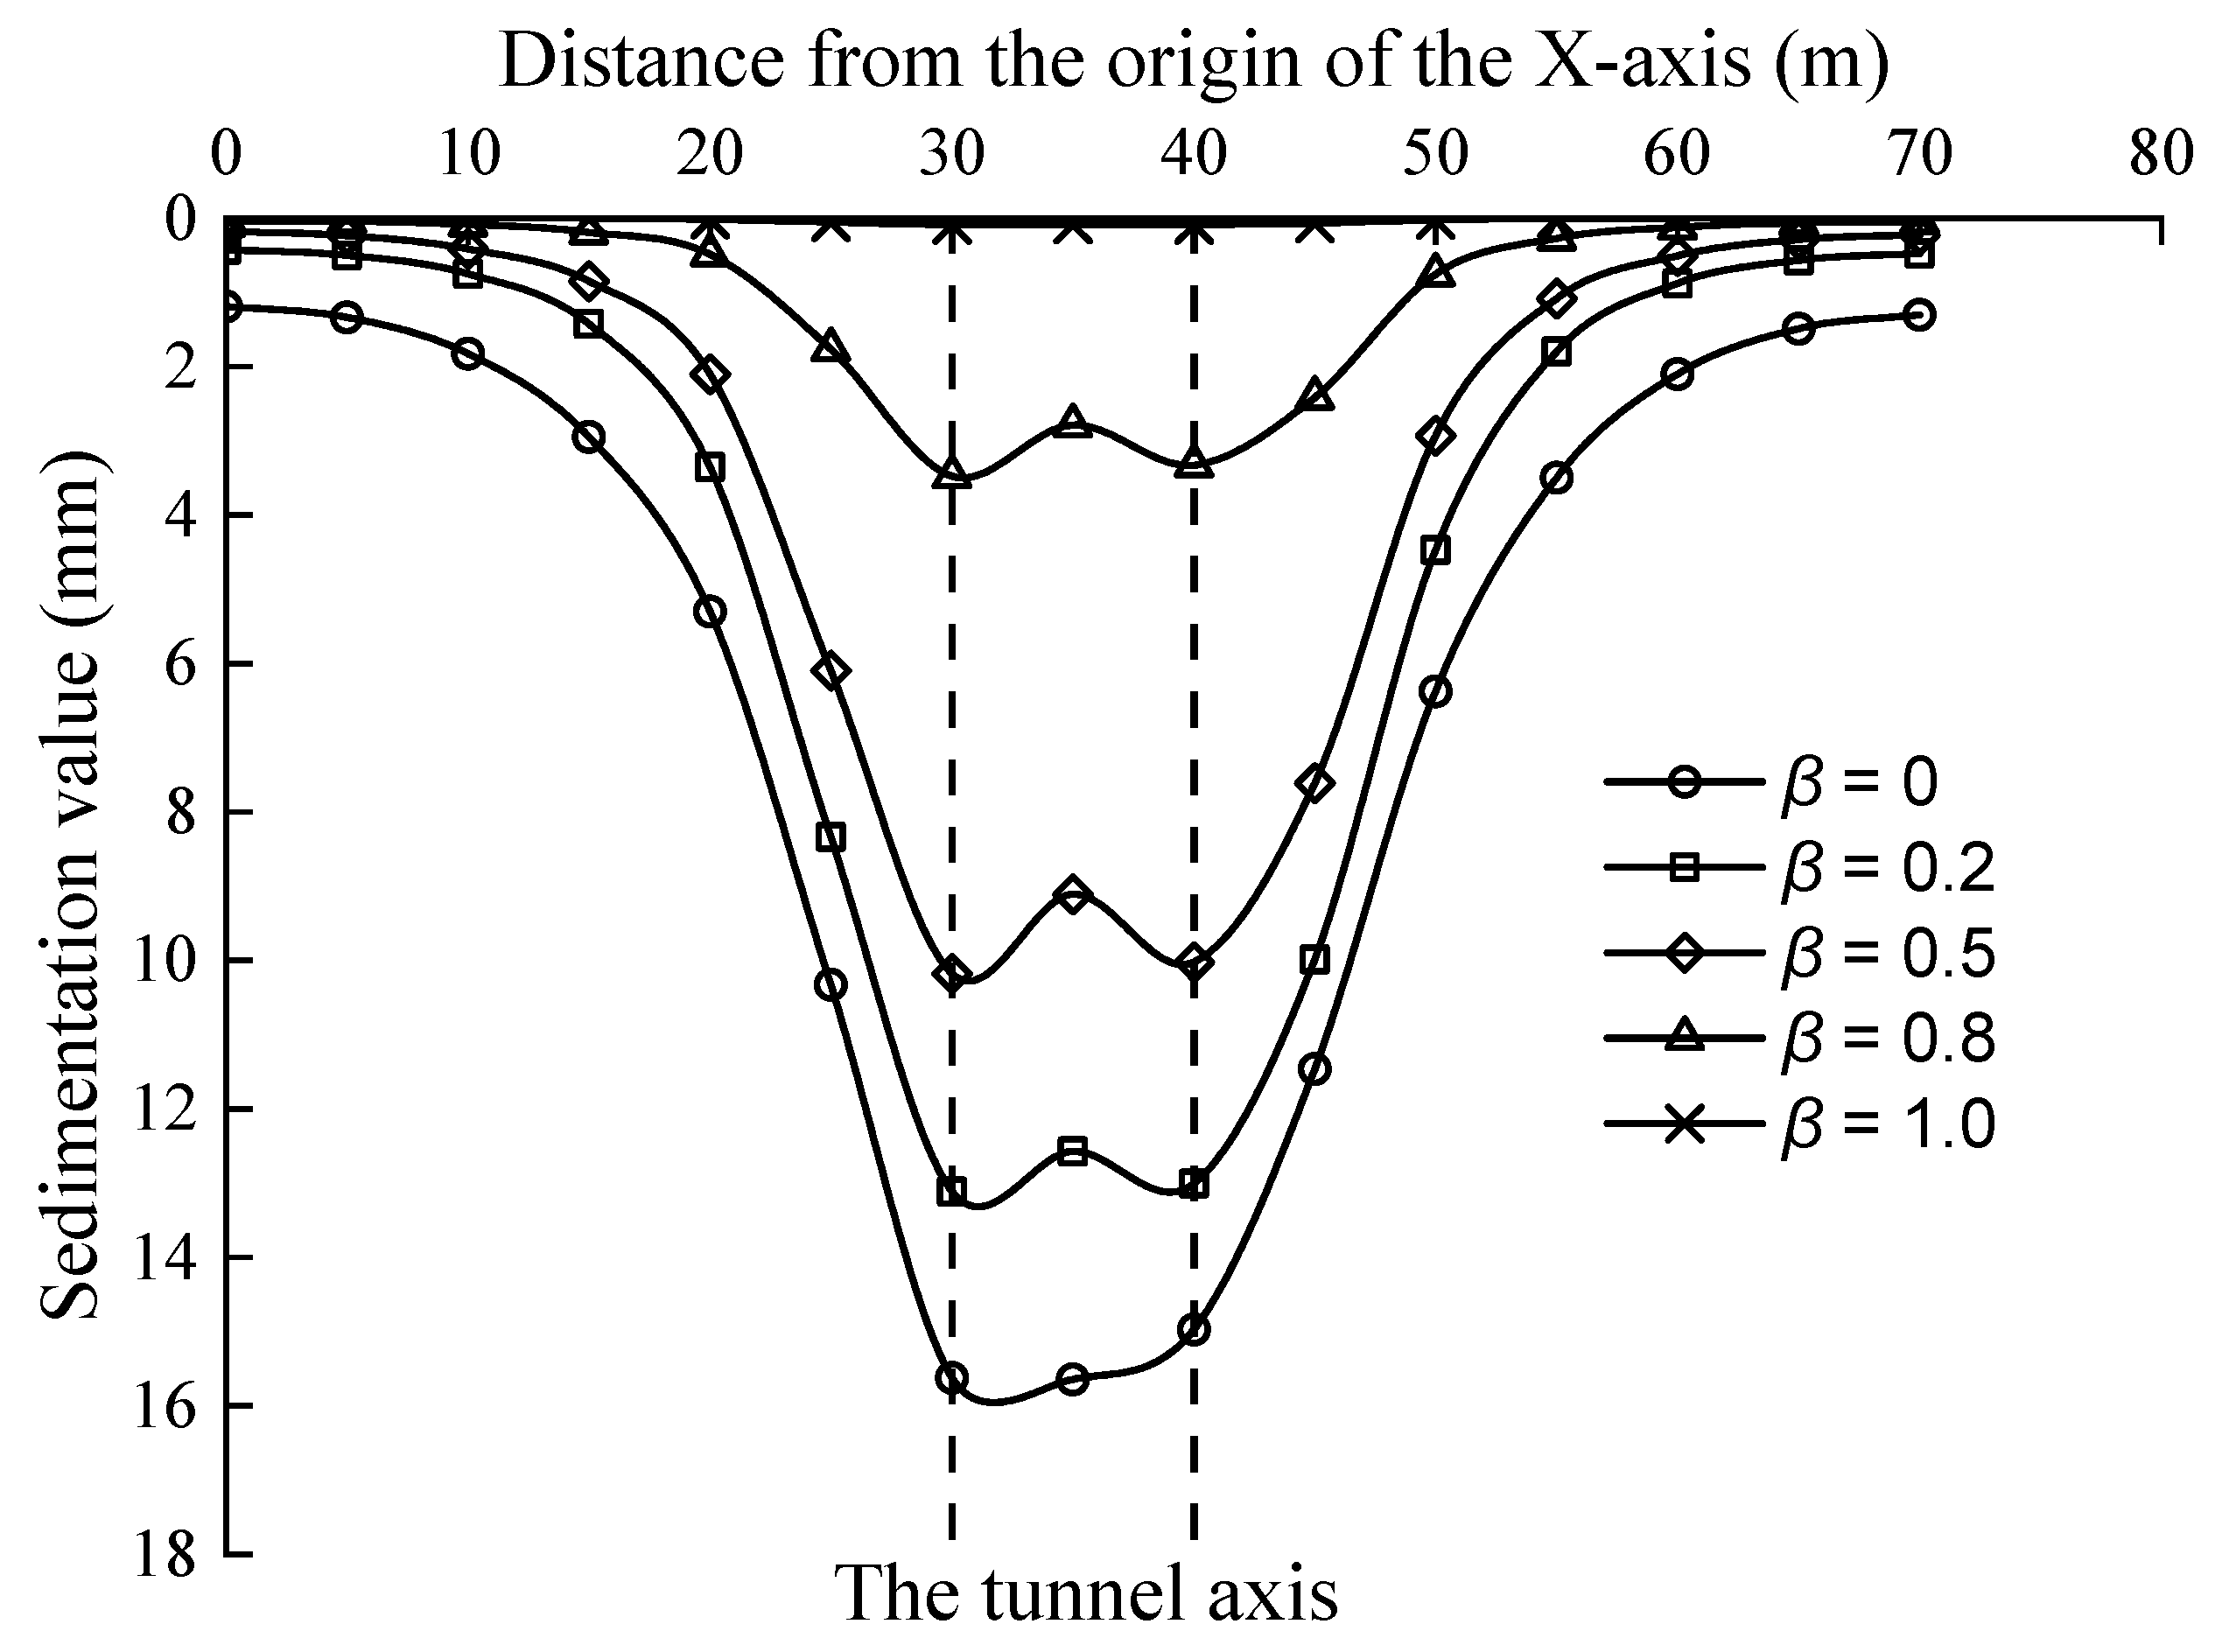
- Surface Settlement Analysis
- (2)
- Single-Pile Settlement Analysis
- (3)
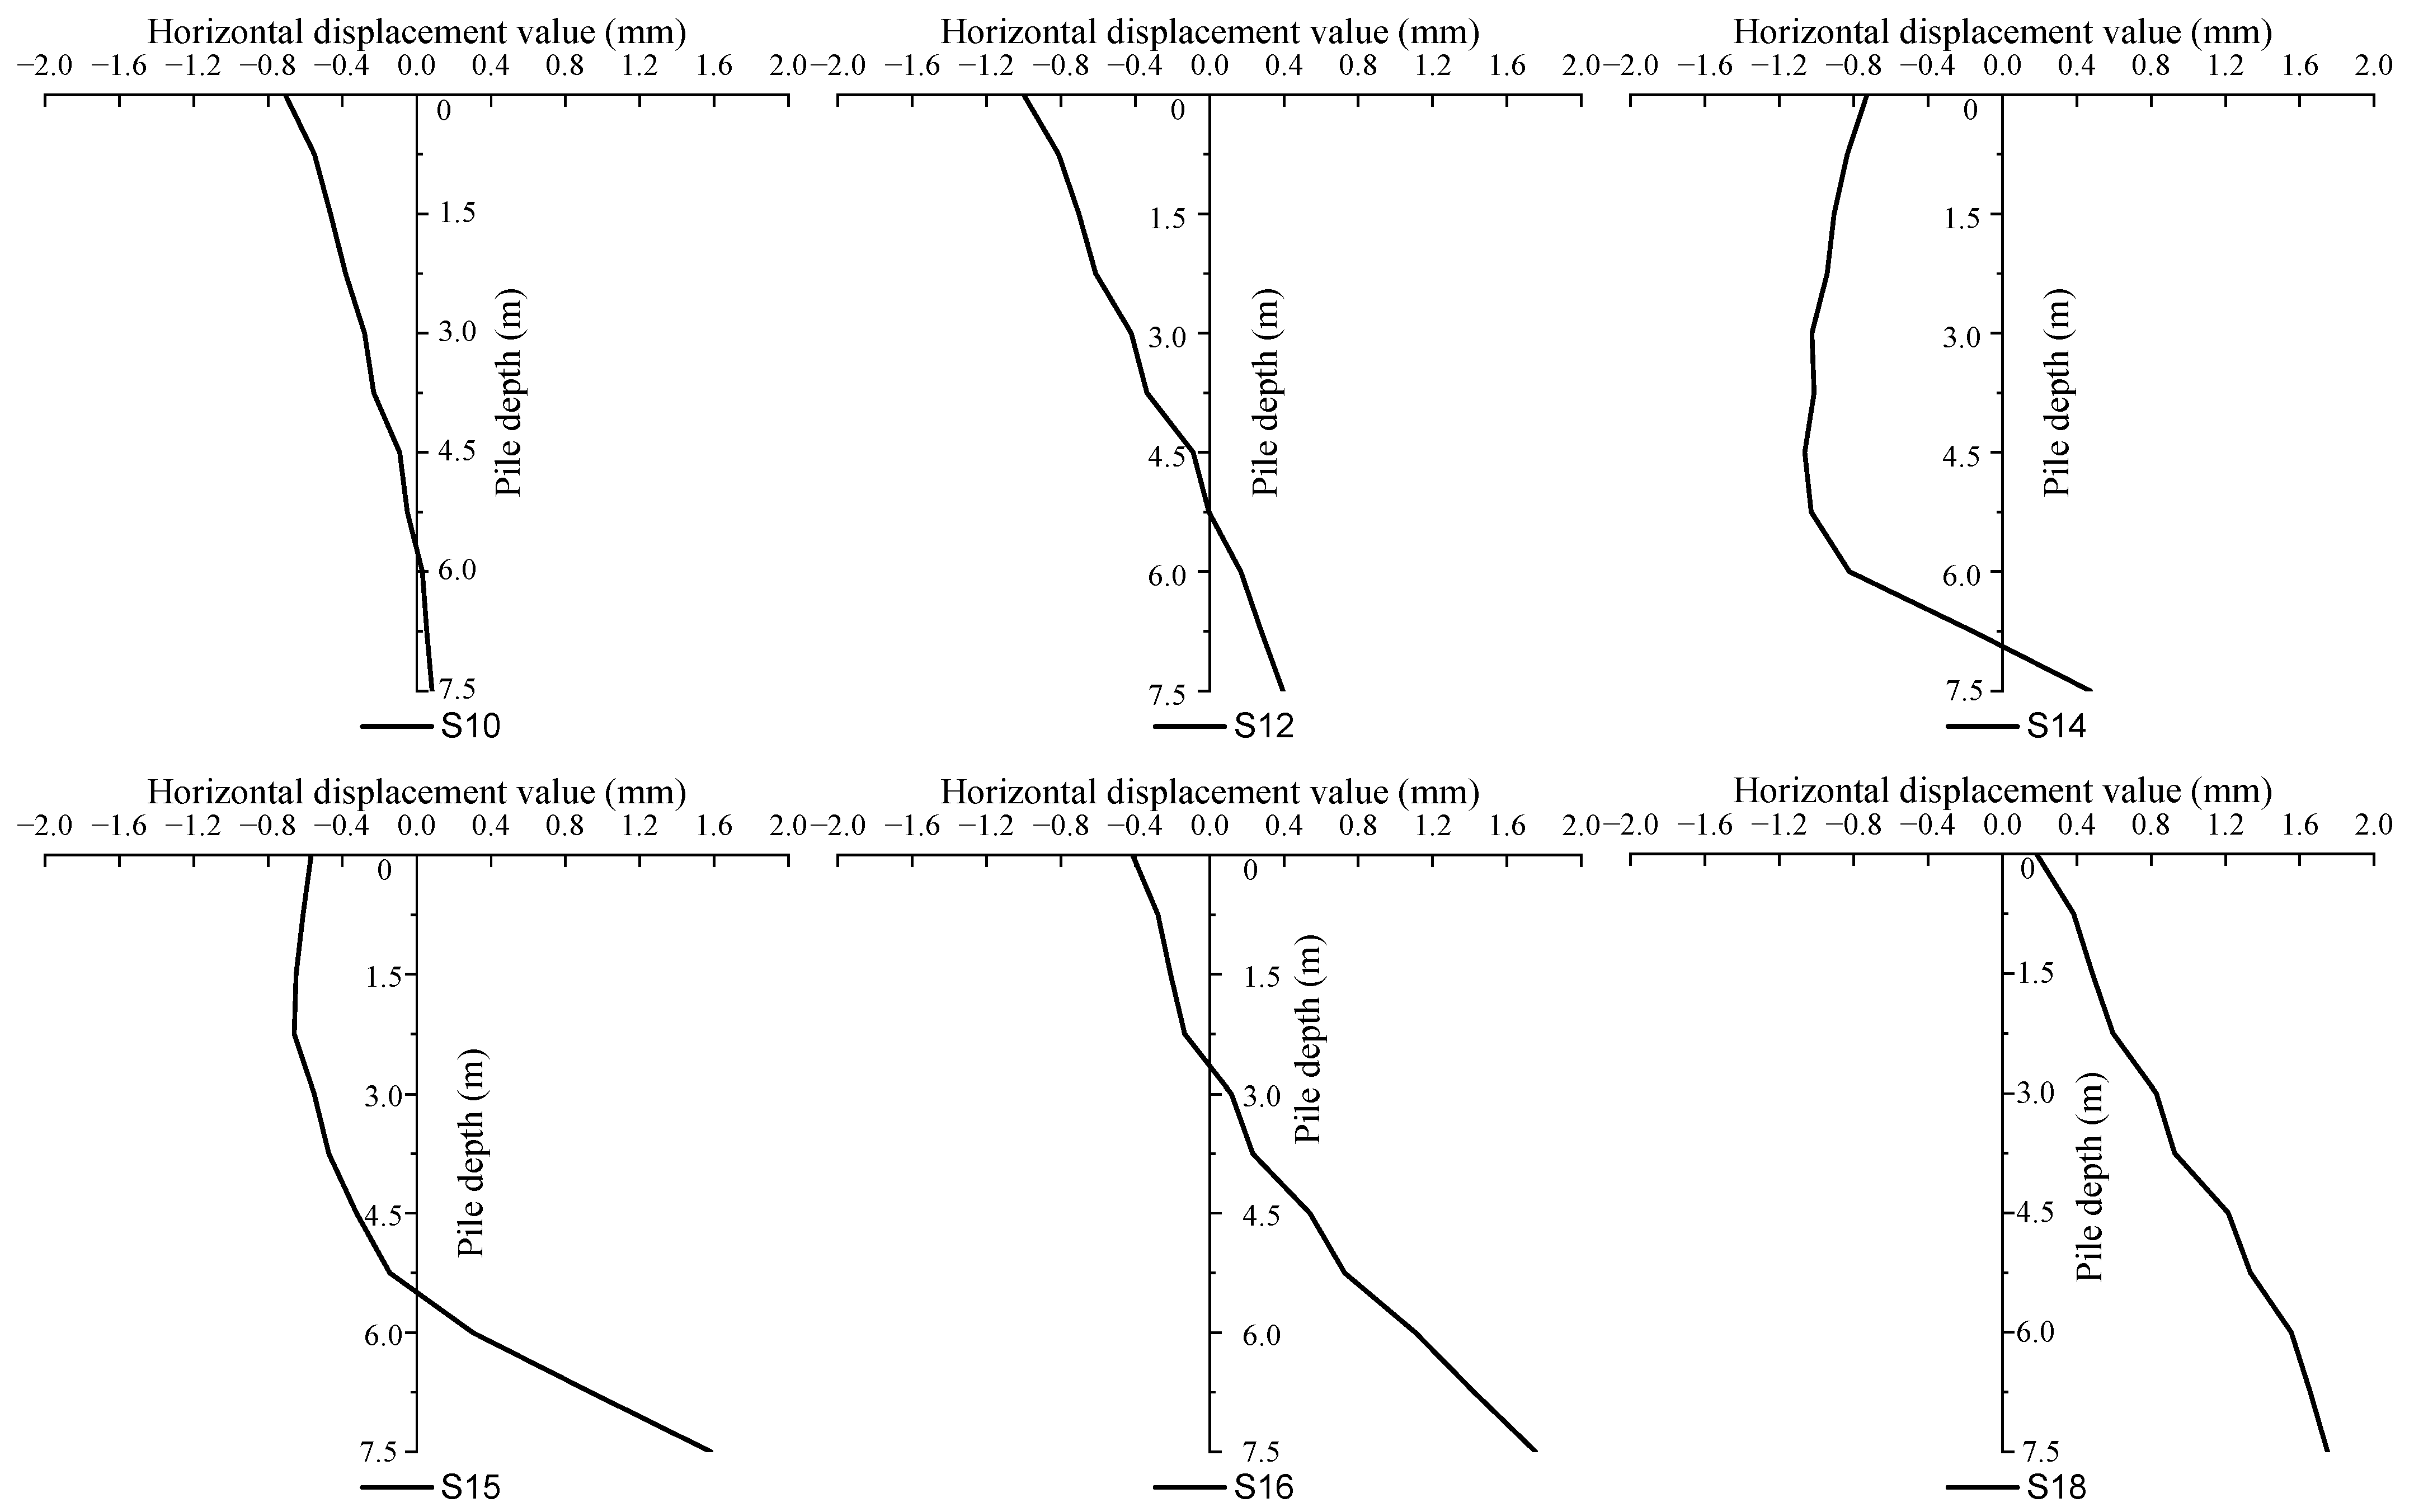
- Analysis of Horizontal Displacement of Single Pile
- (4)
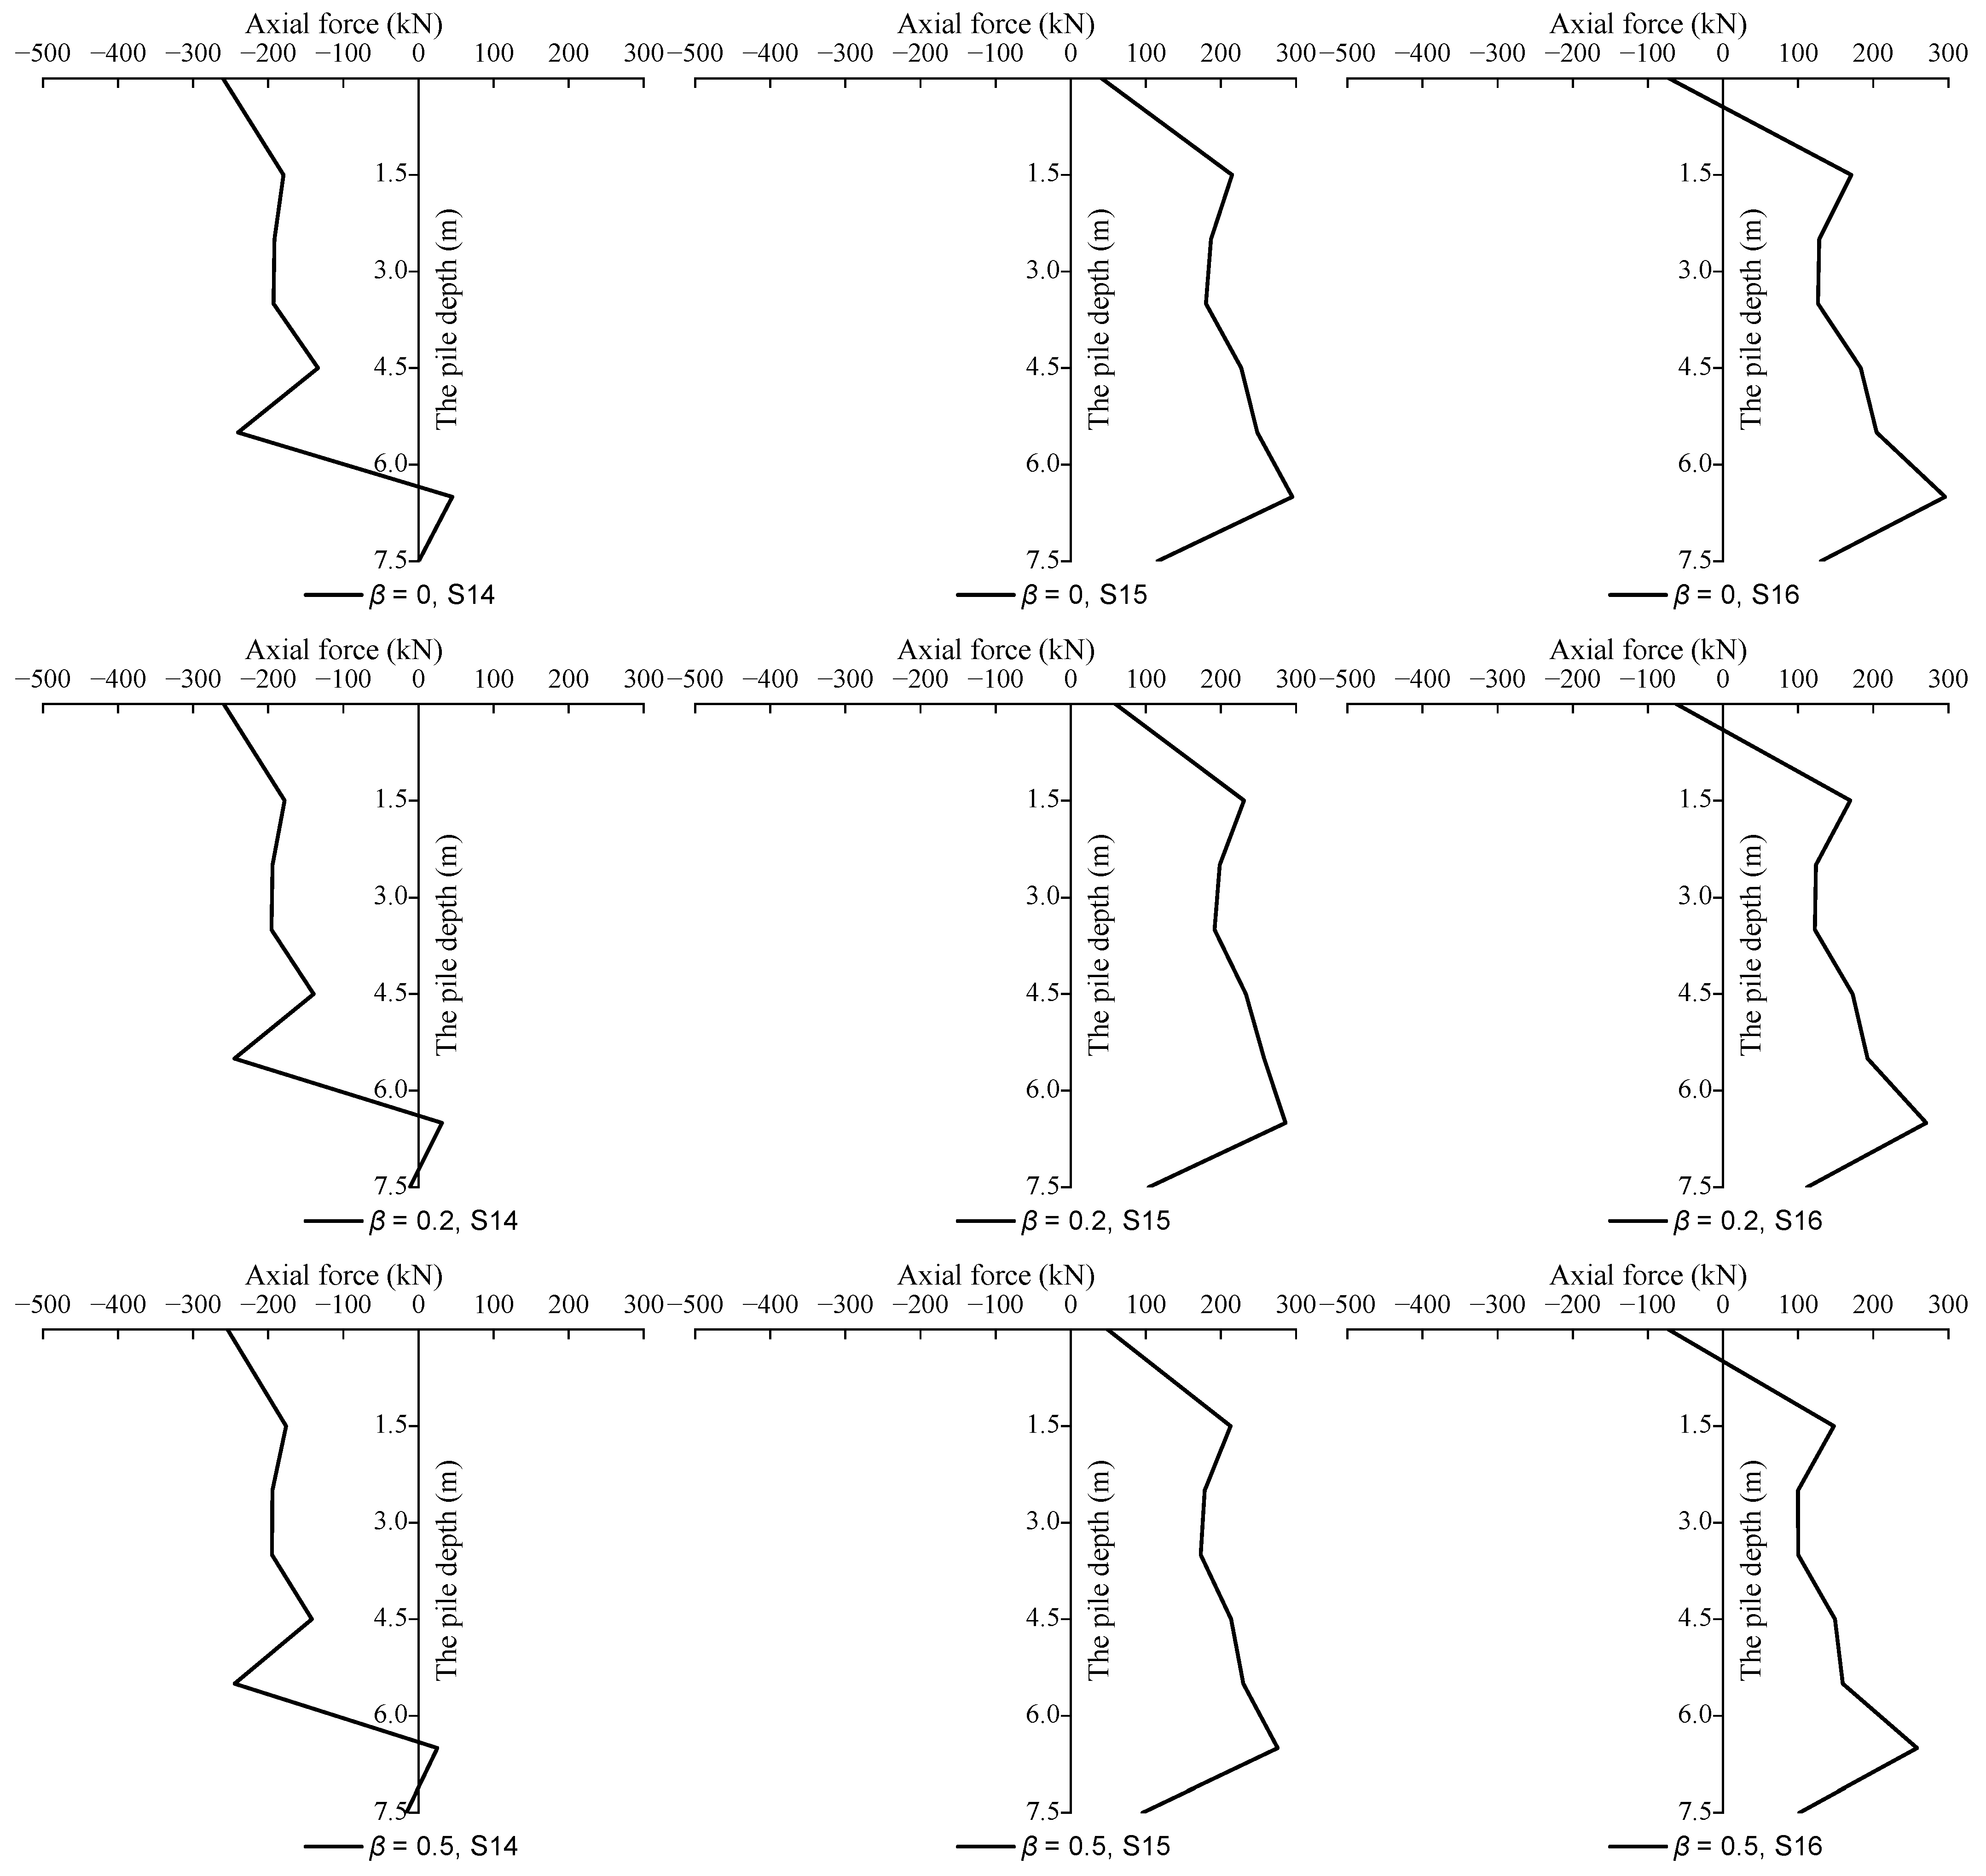
- Pile Shaft Force Analysis
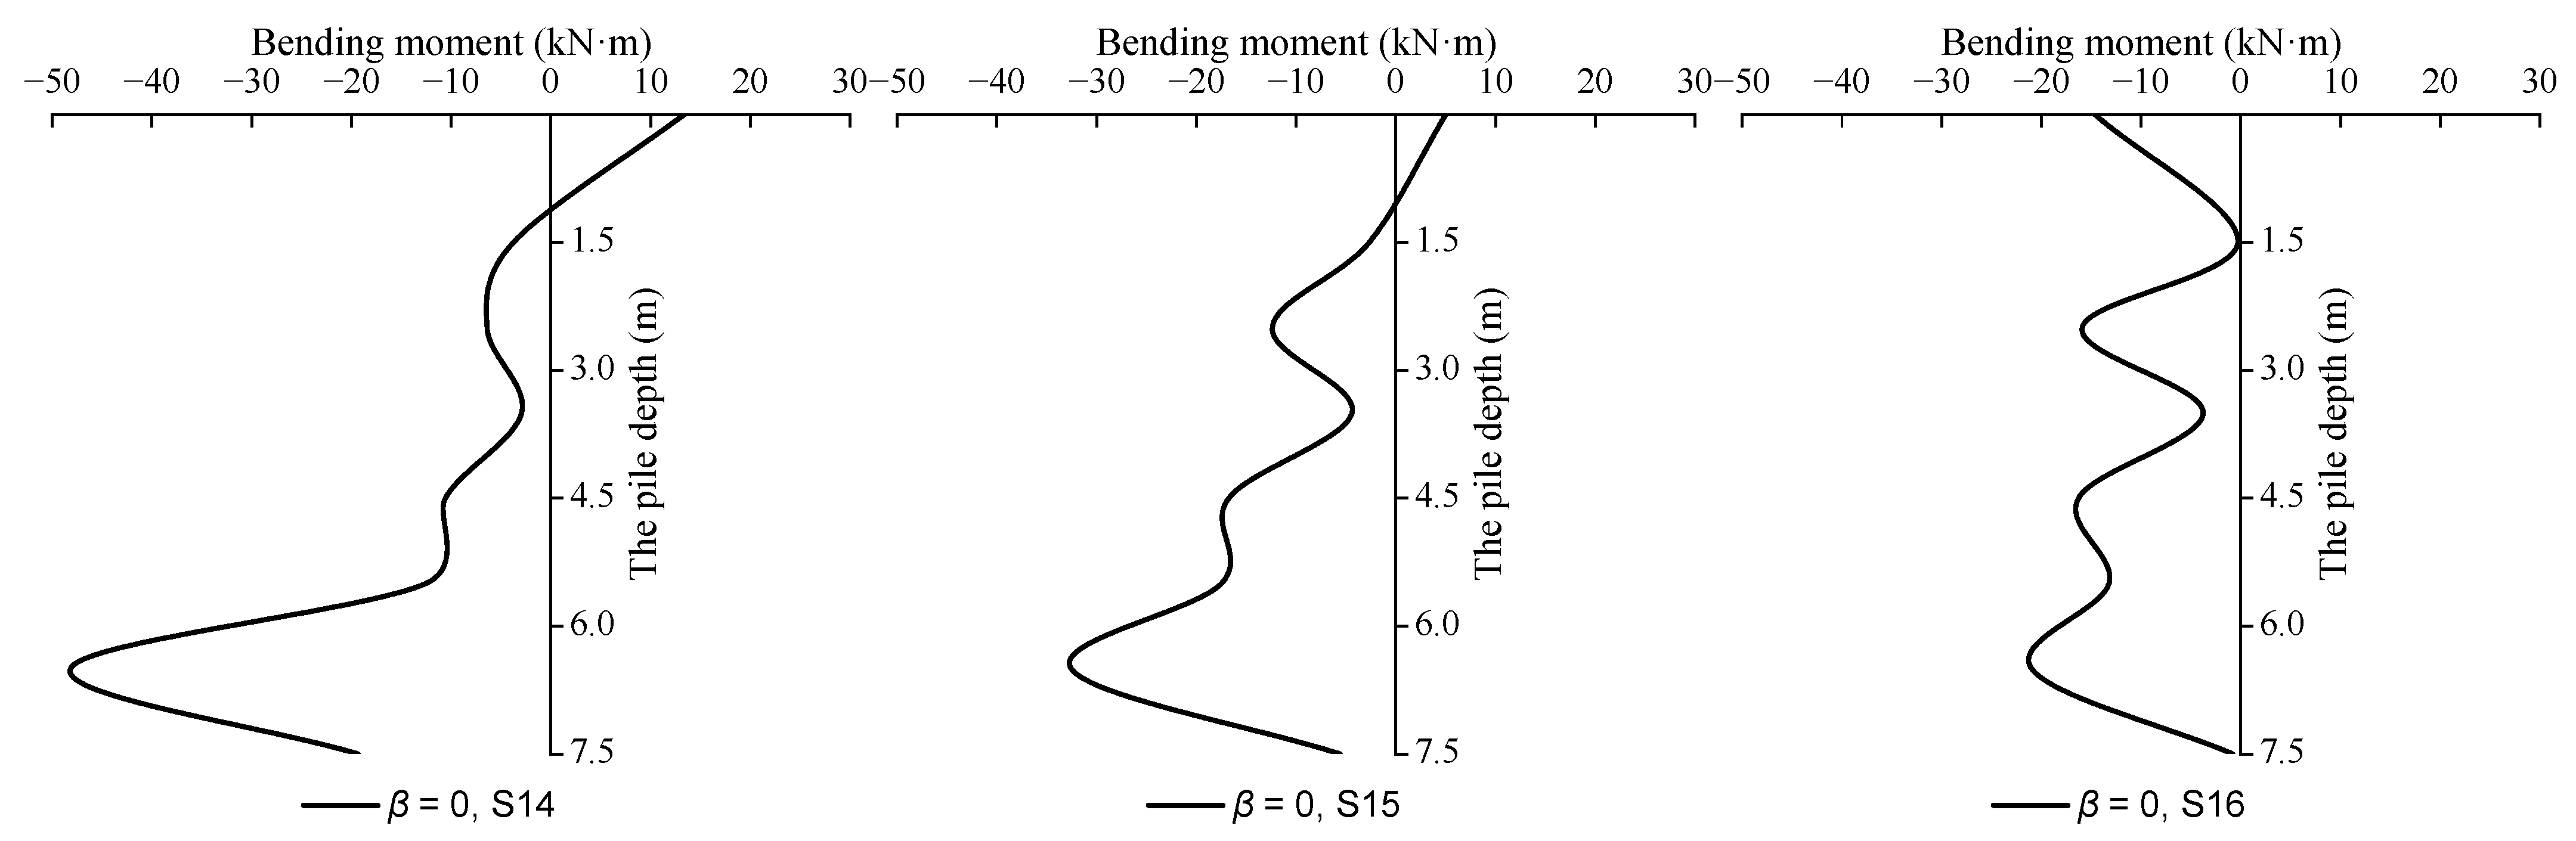
- (5)
- Pile Bending Moment Analysis
5. Mechanical Response of Shield Underpassing Pile Foundation under Different Pile Top Loads
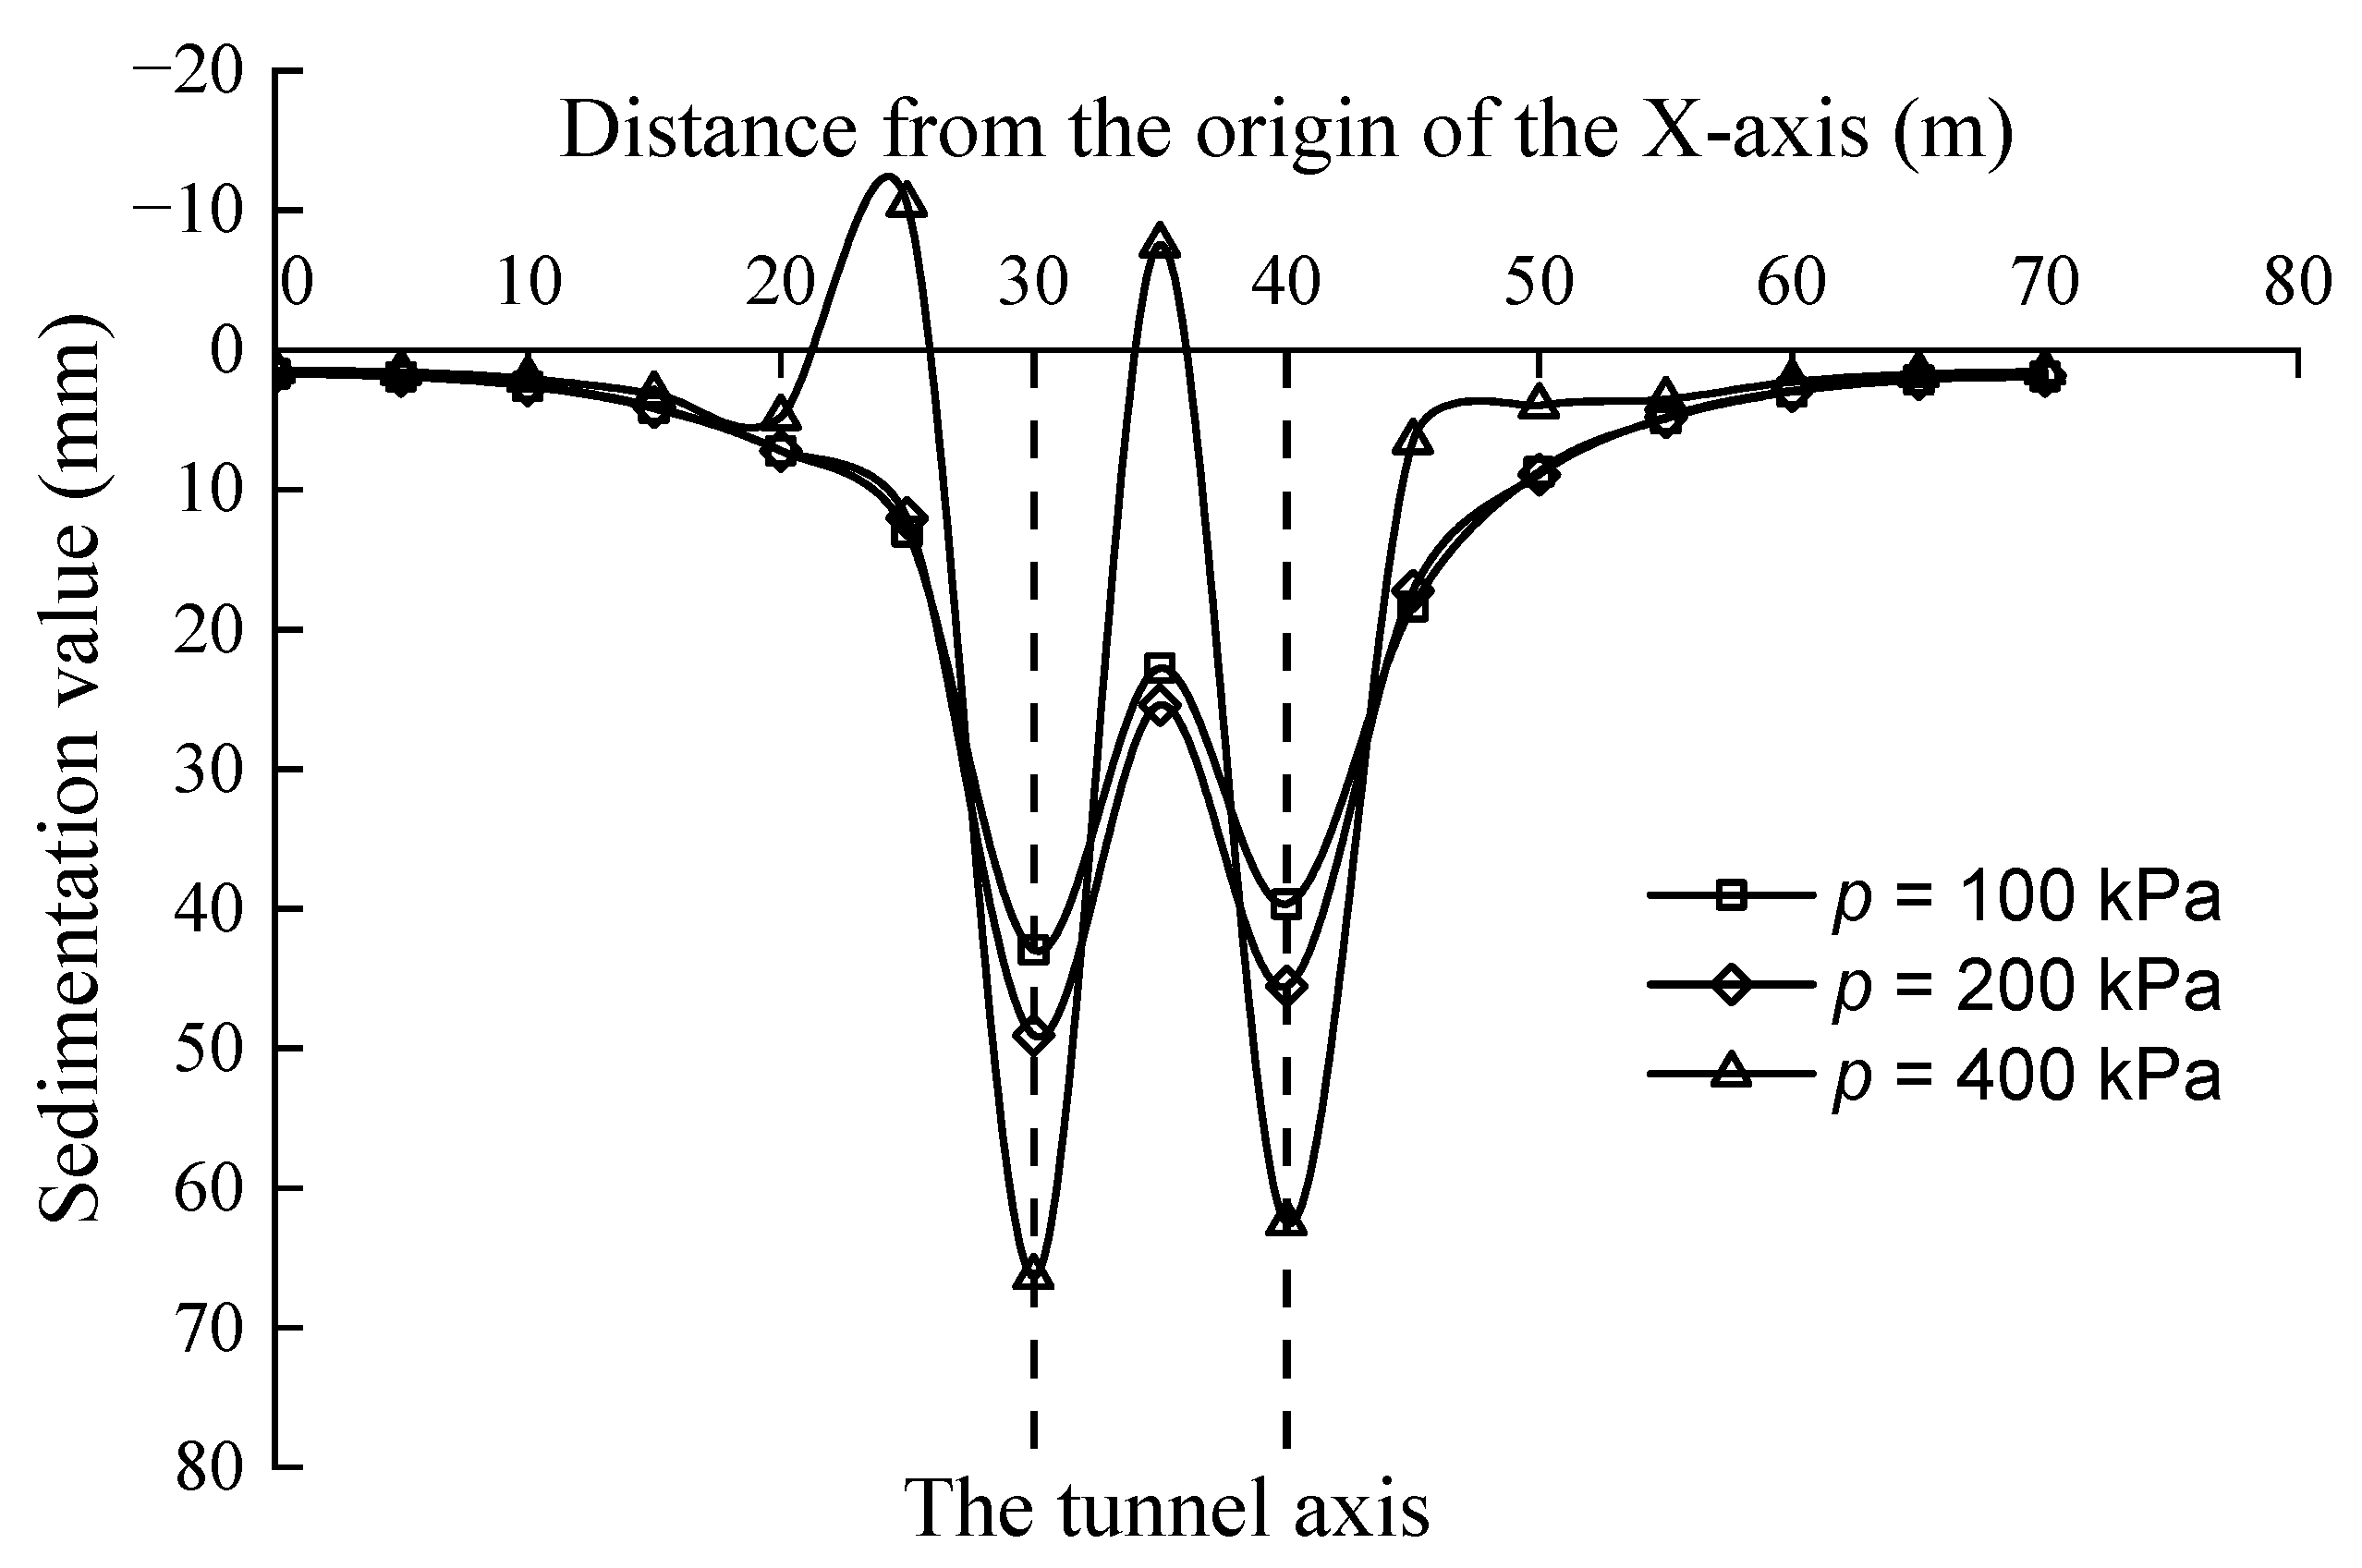
- (1)
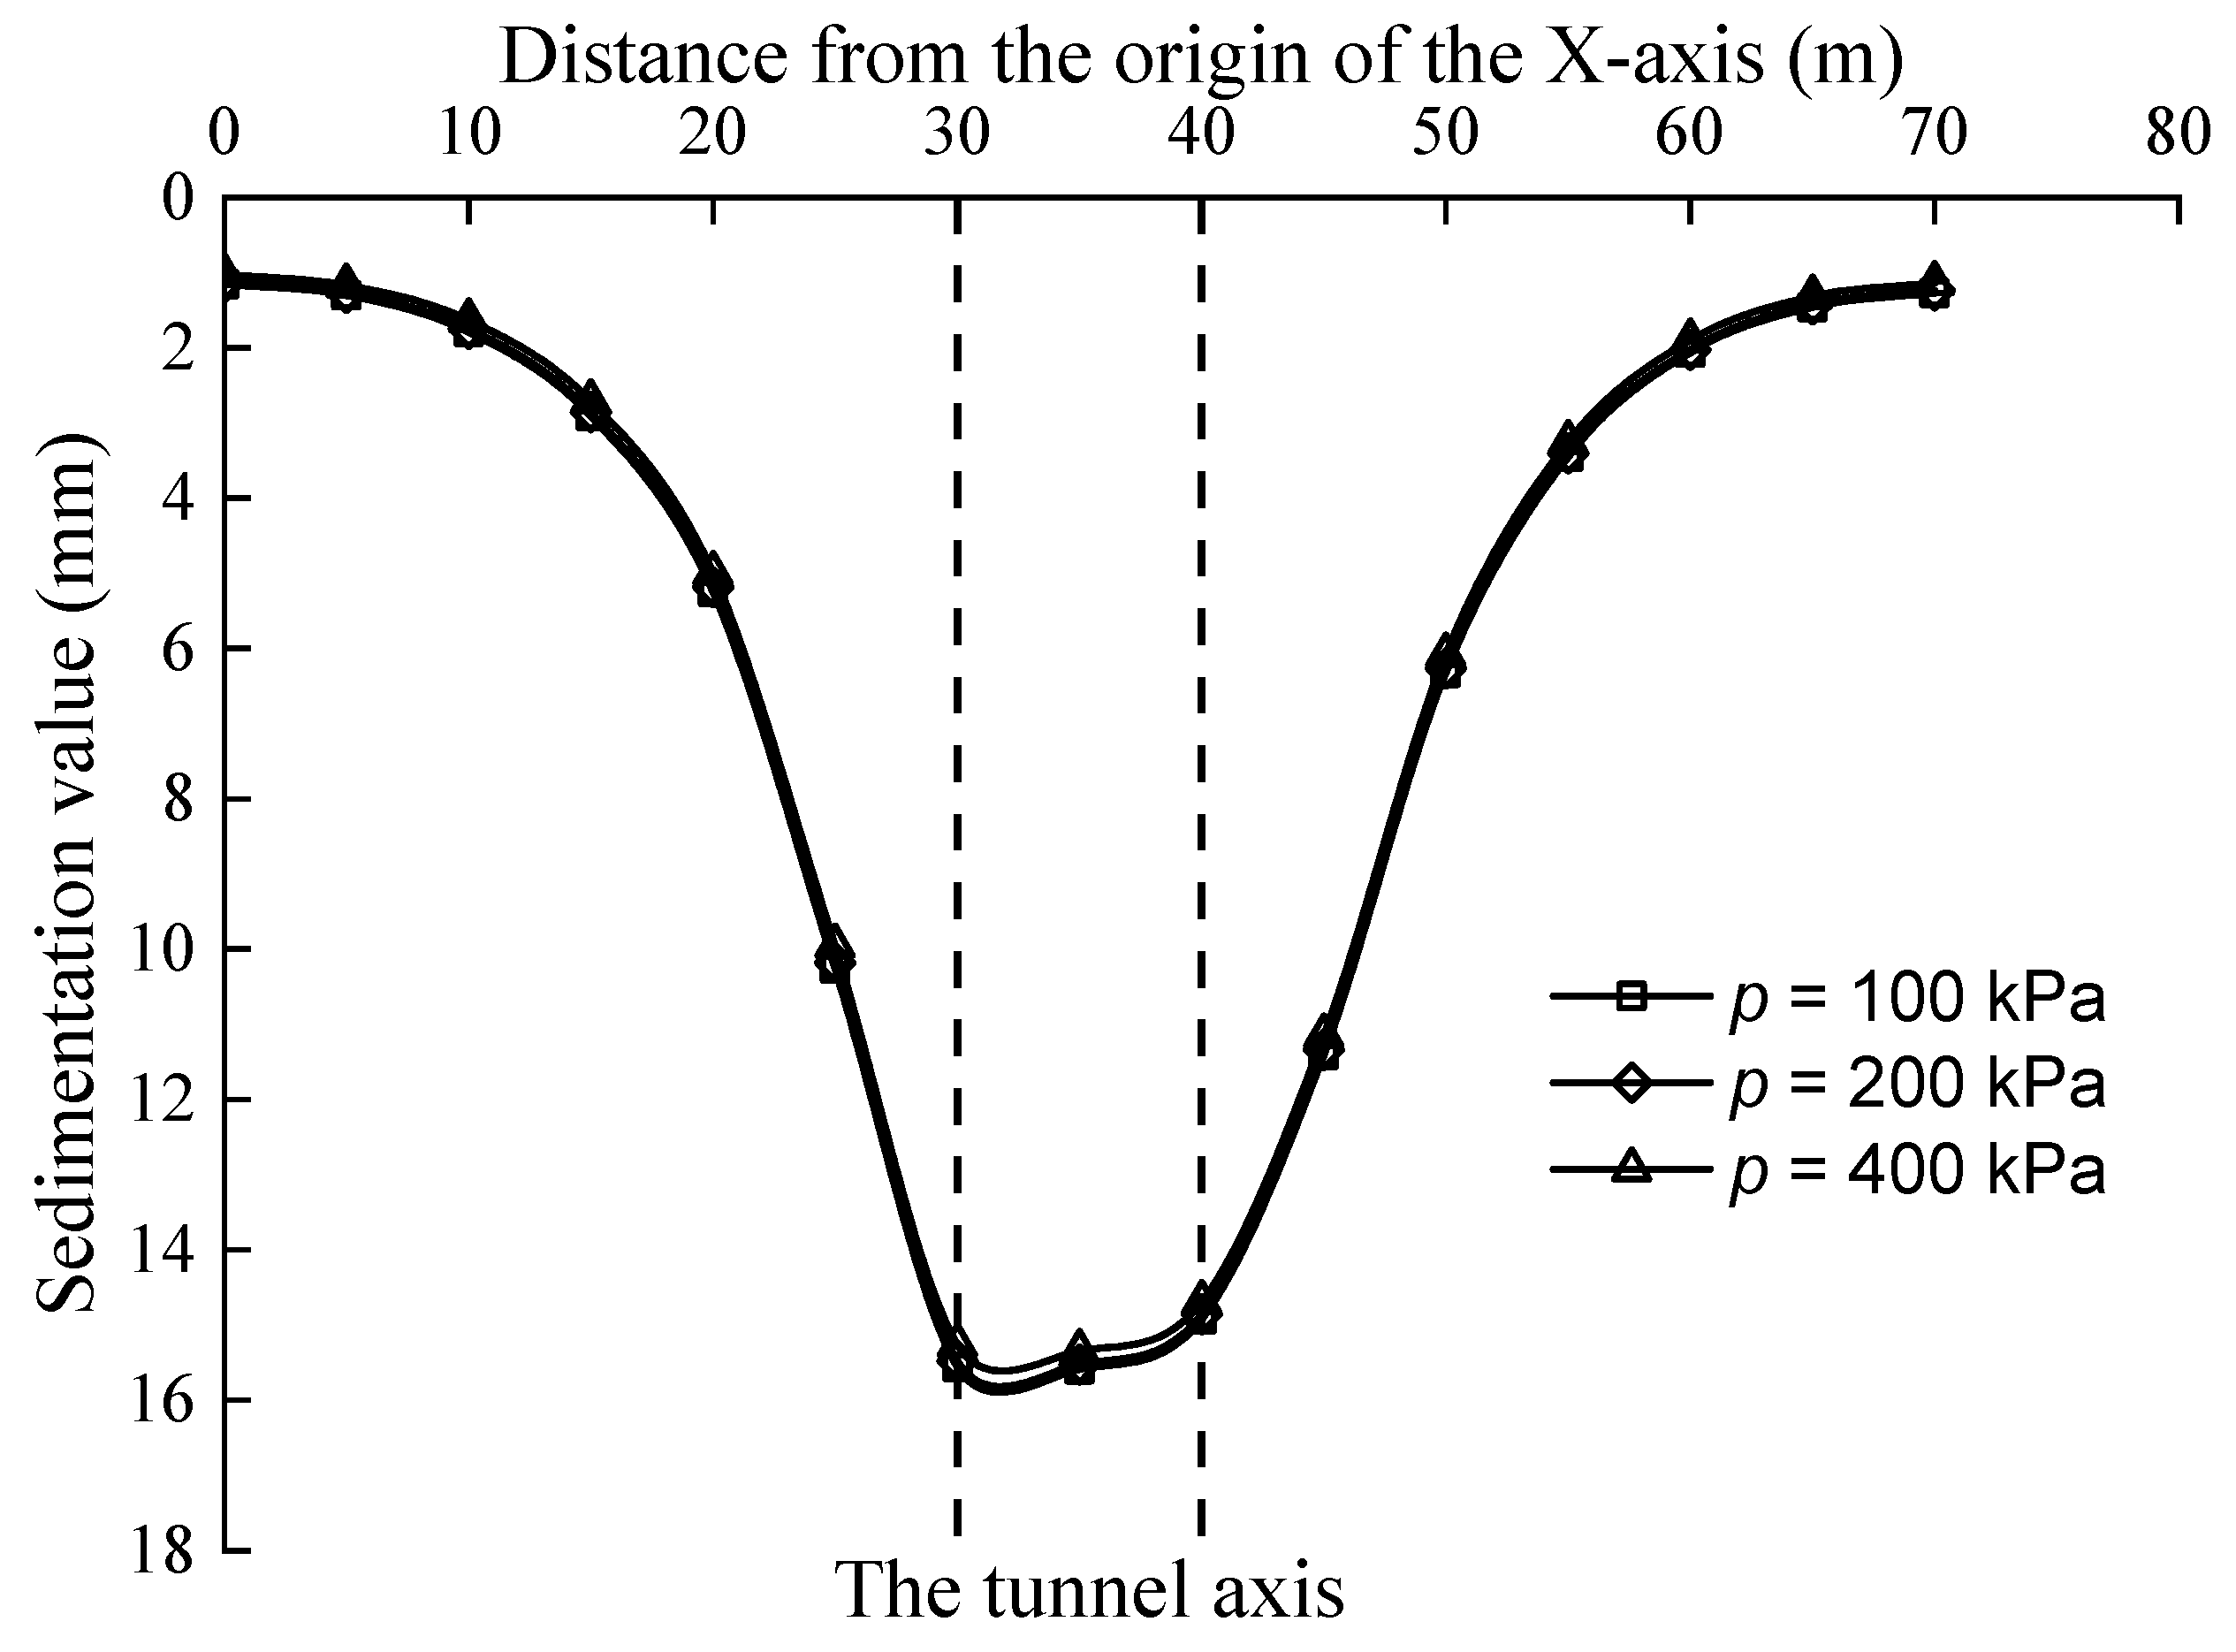
- Surface Settlement Analysis
- (2)
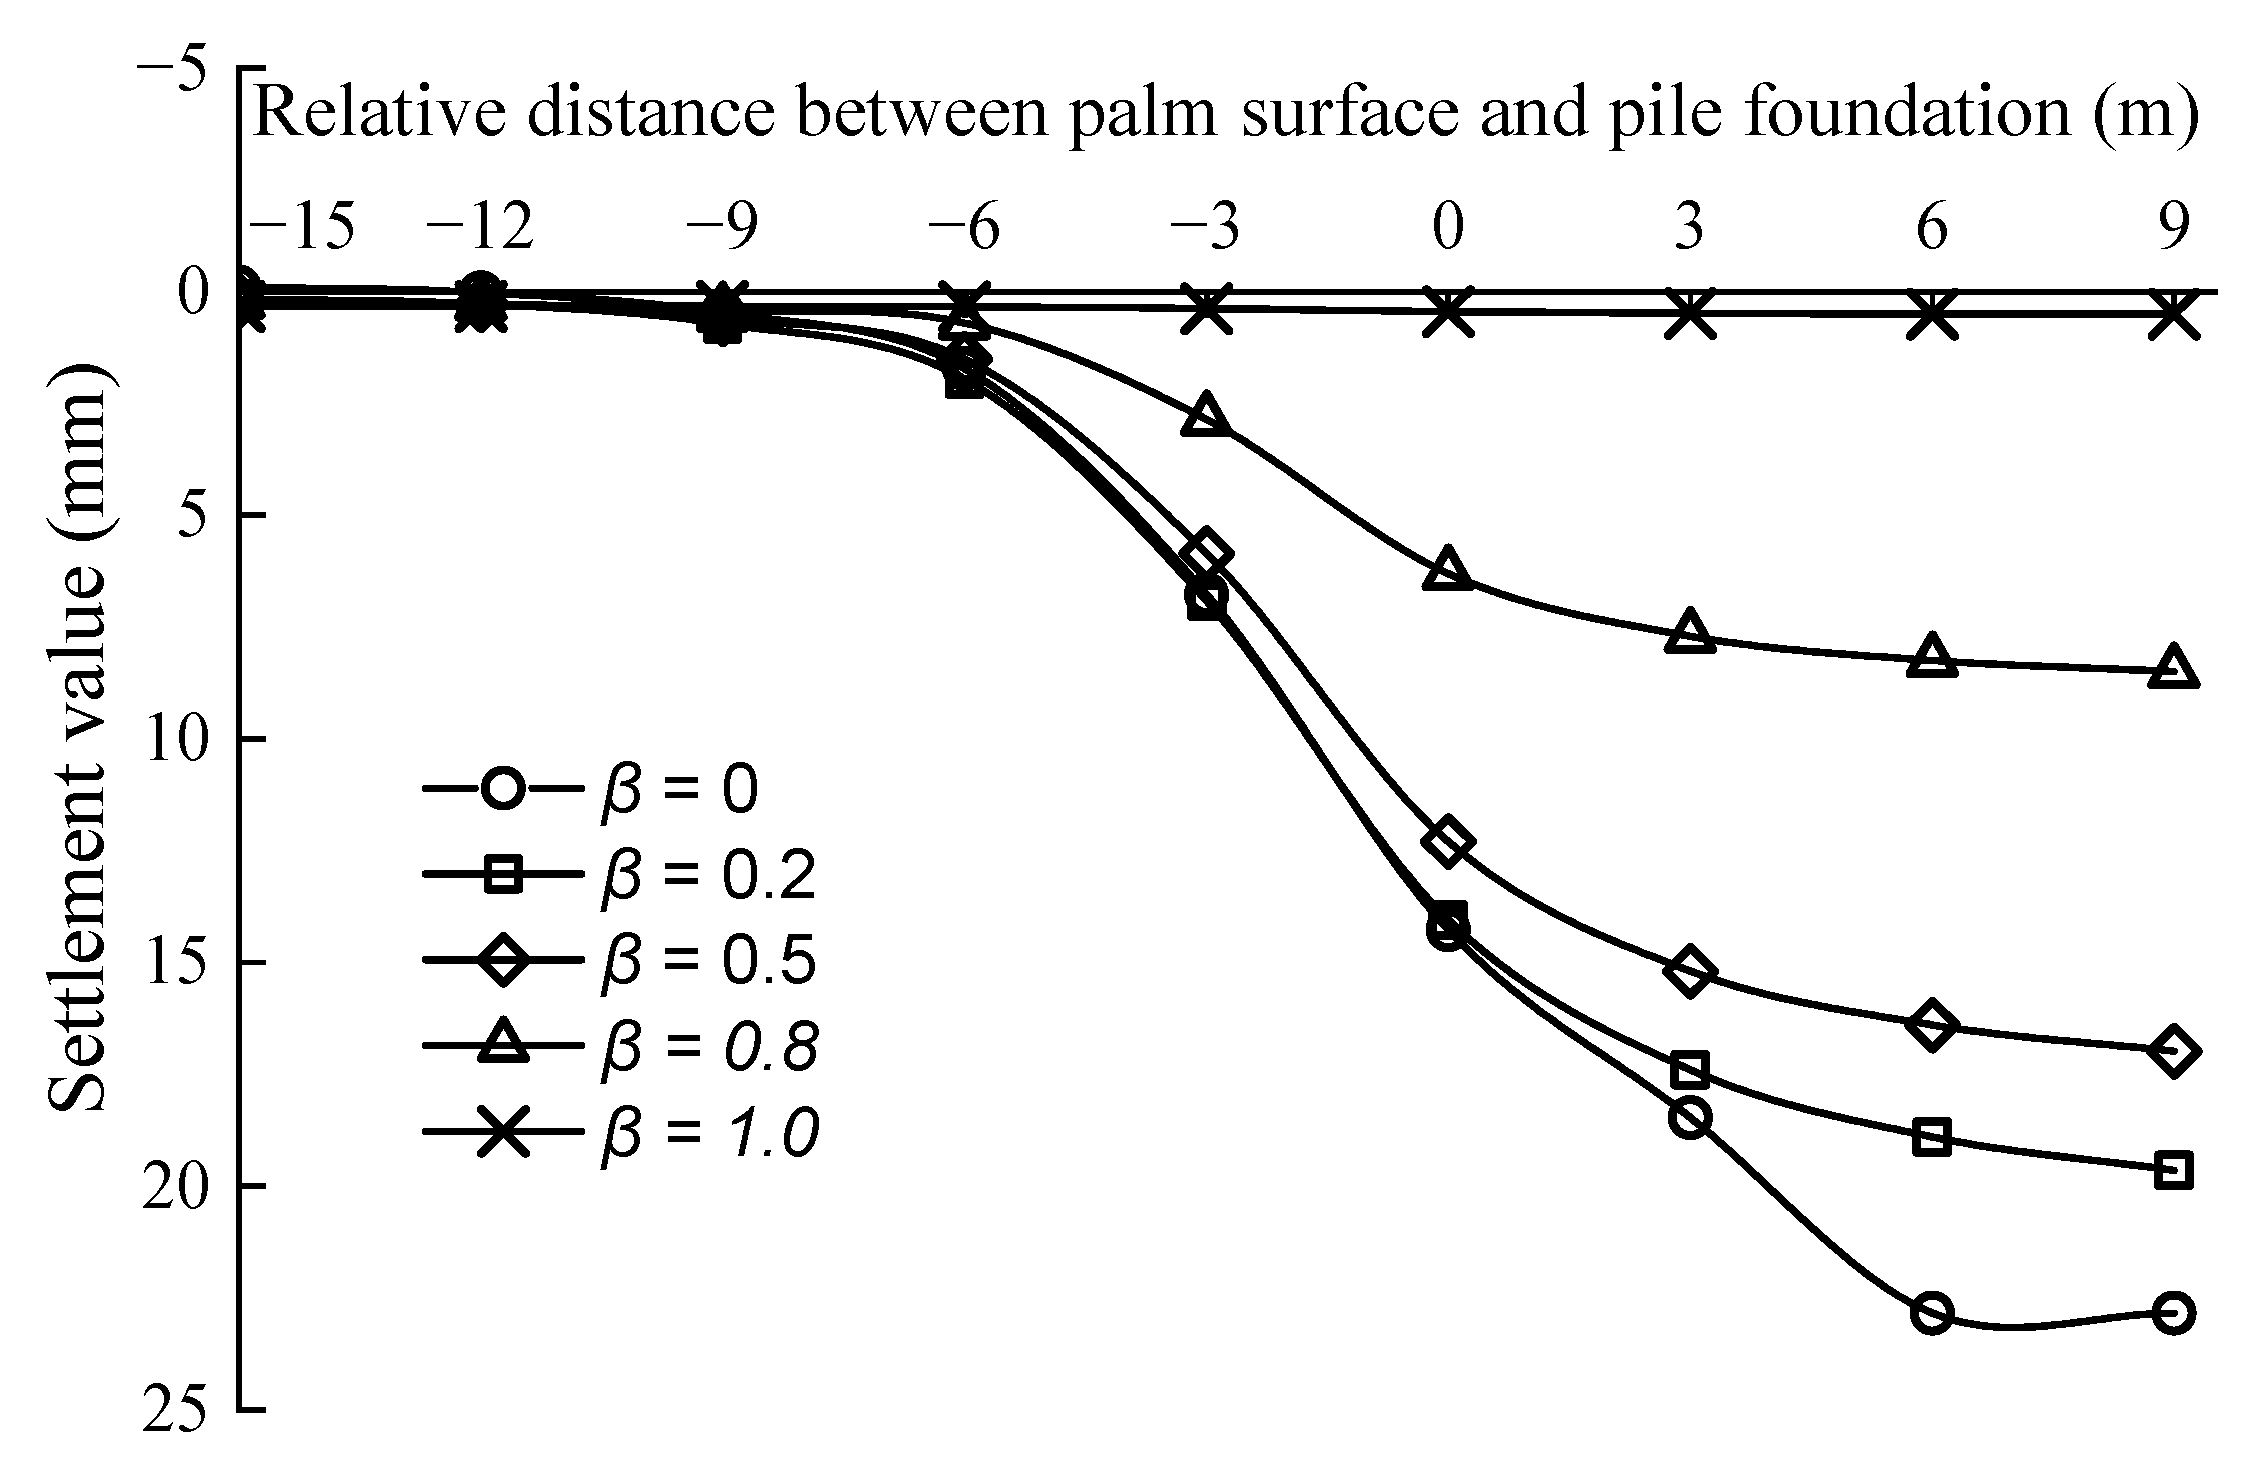
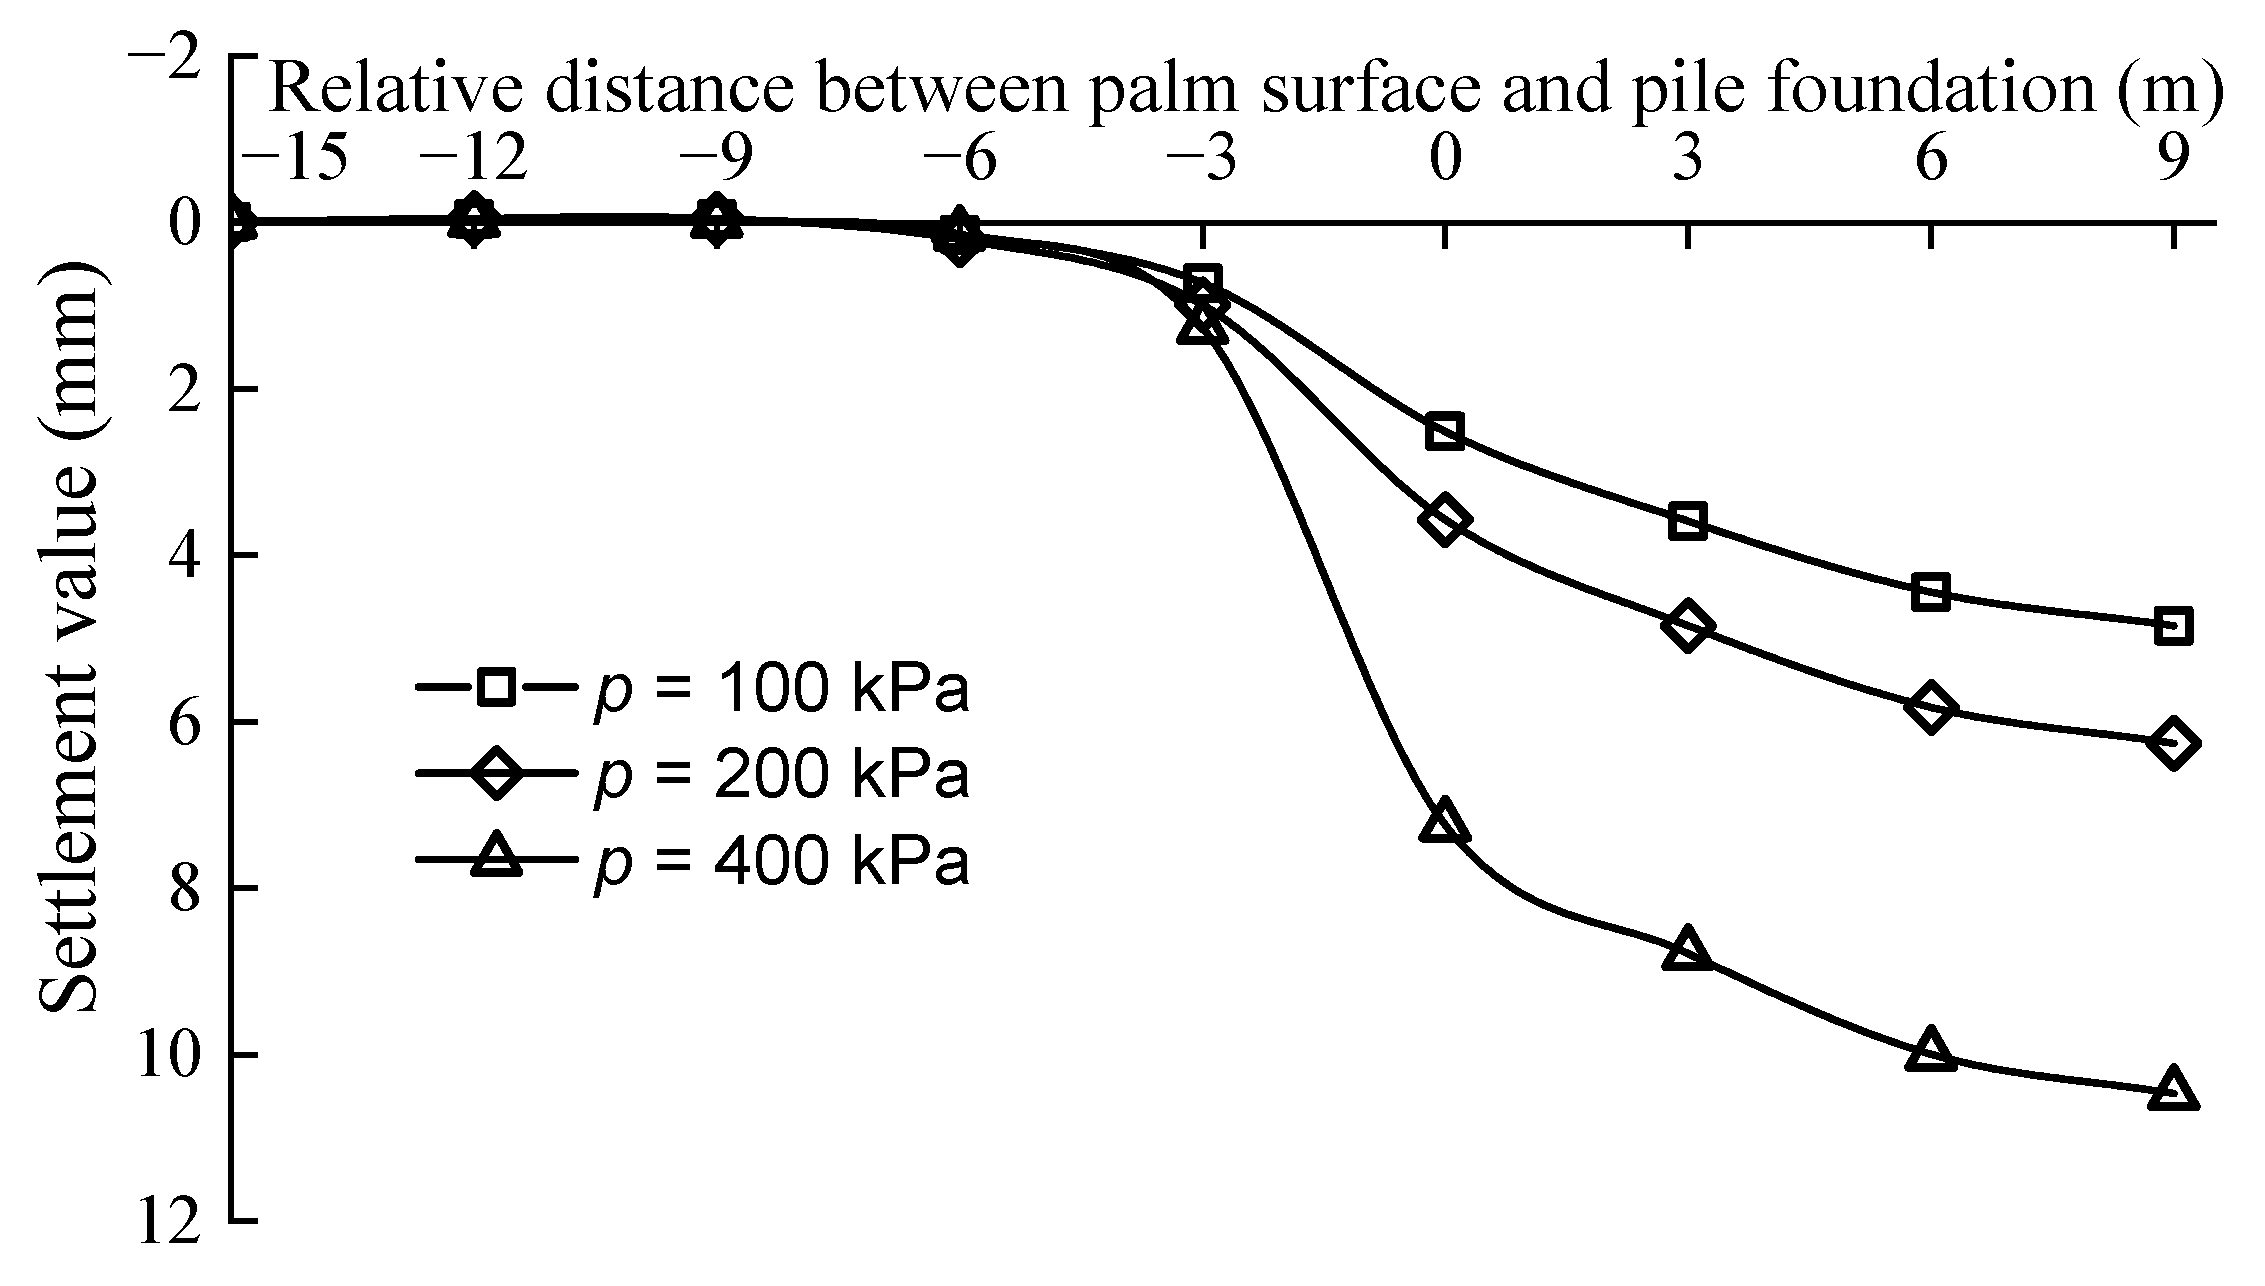
- Single-Pile Settlement Analysis
- (3)
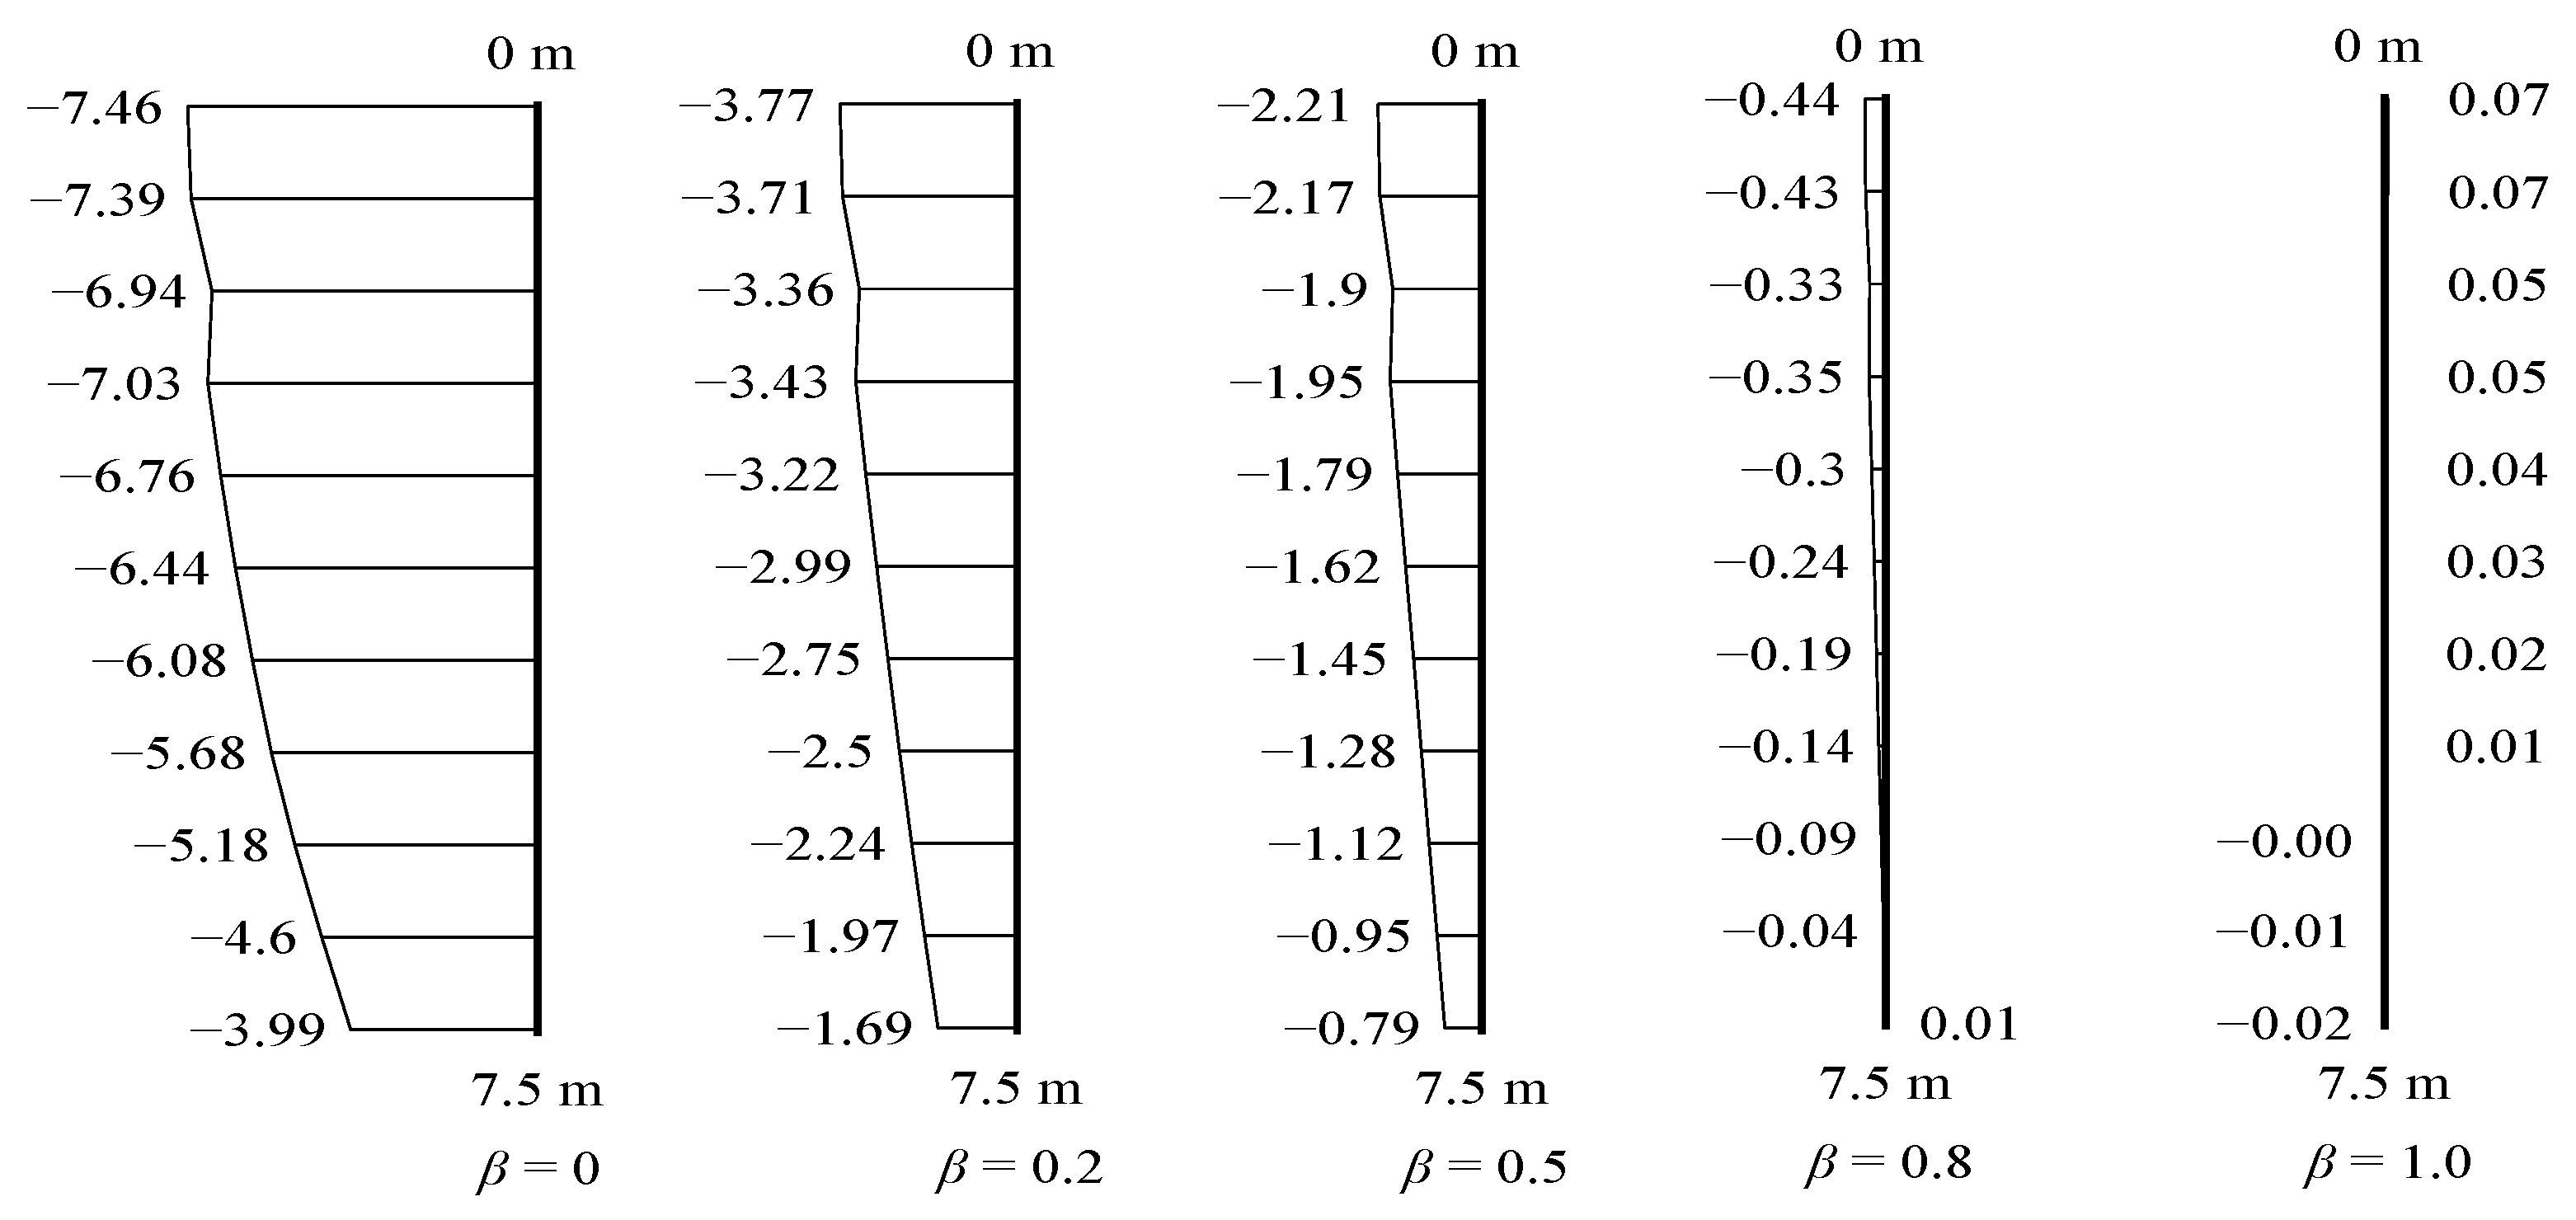
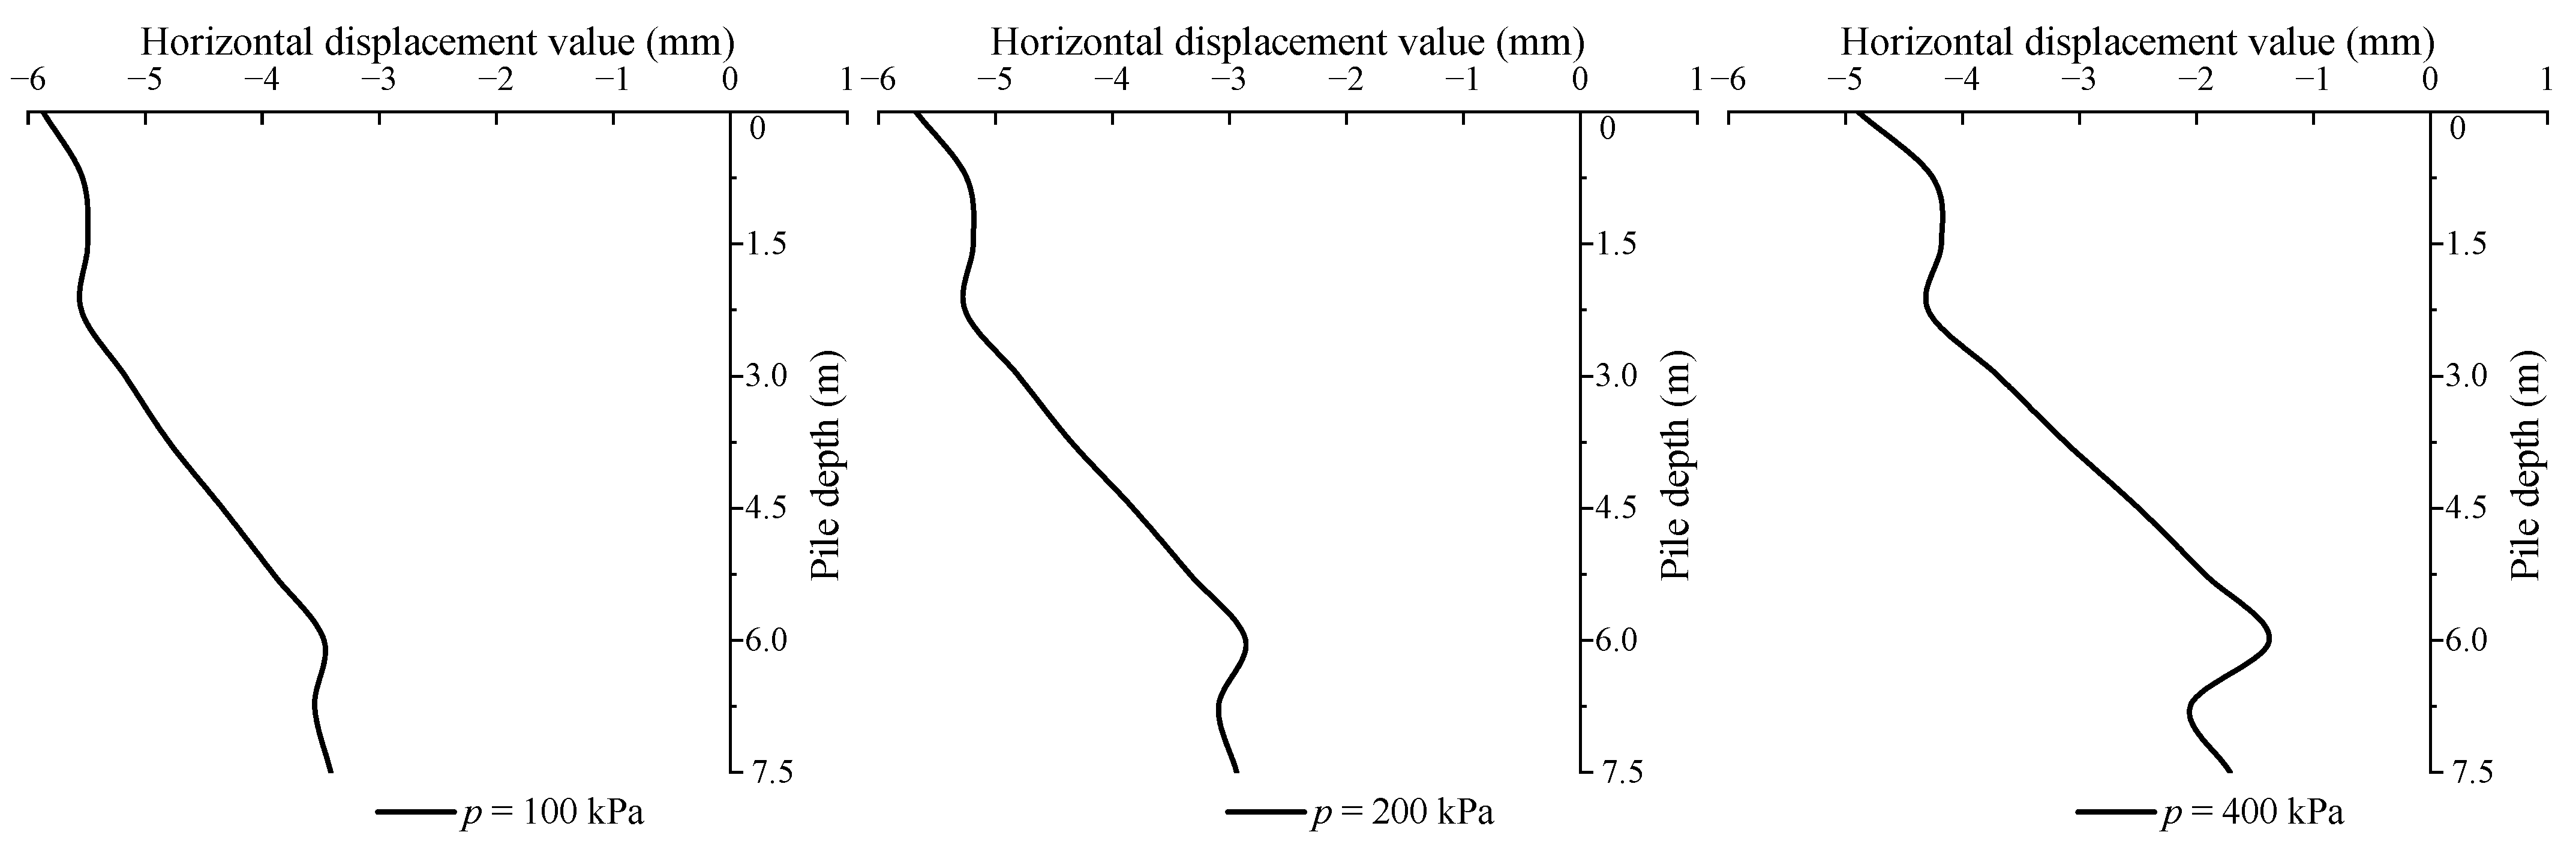
- Analysis of Horizontal Displacement of Single Pile
- (4)
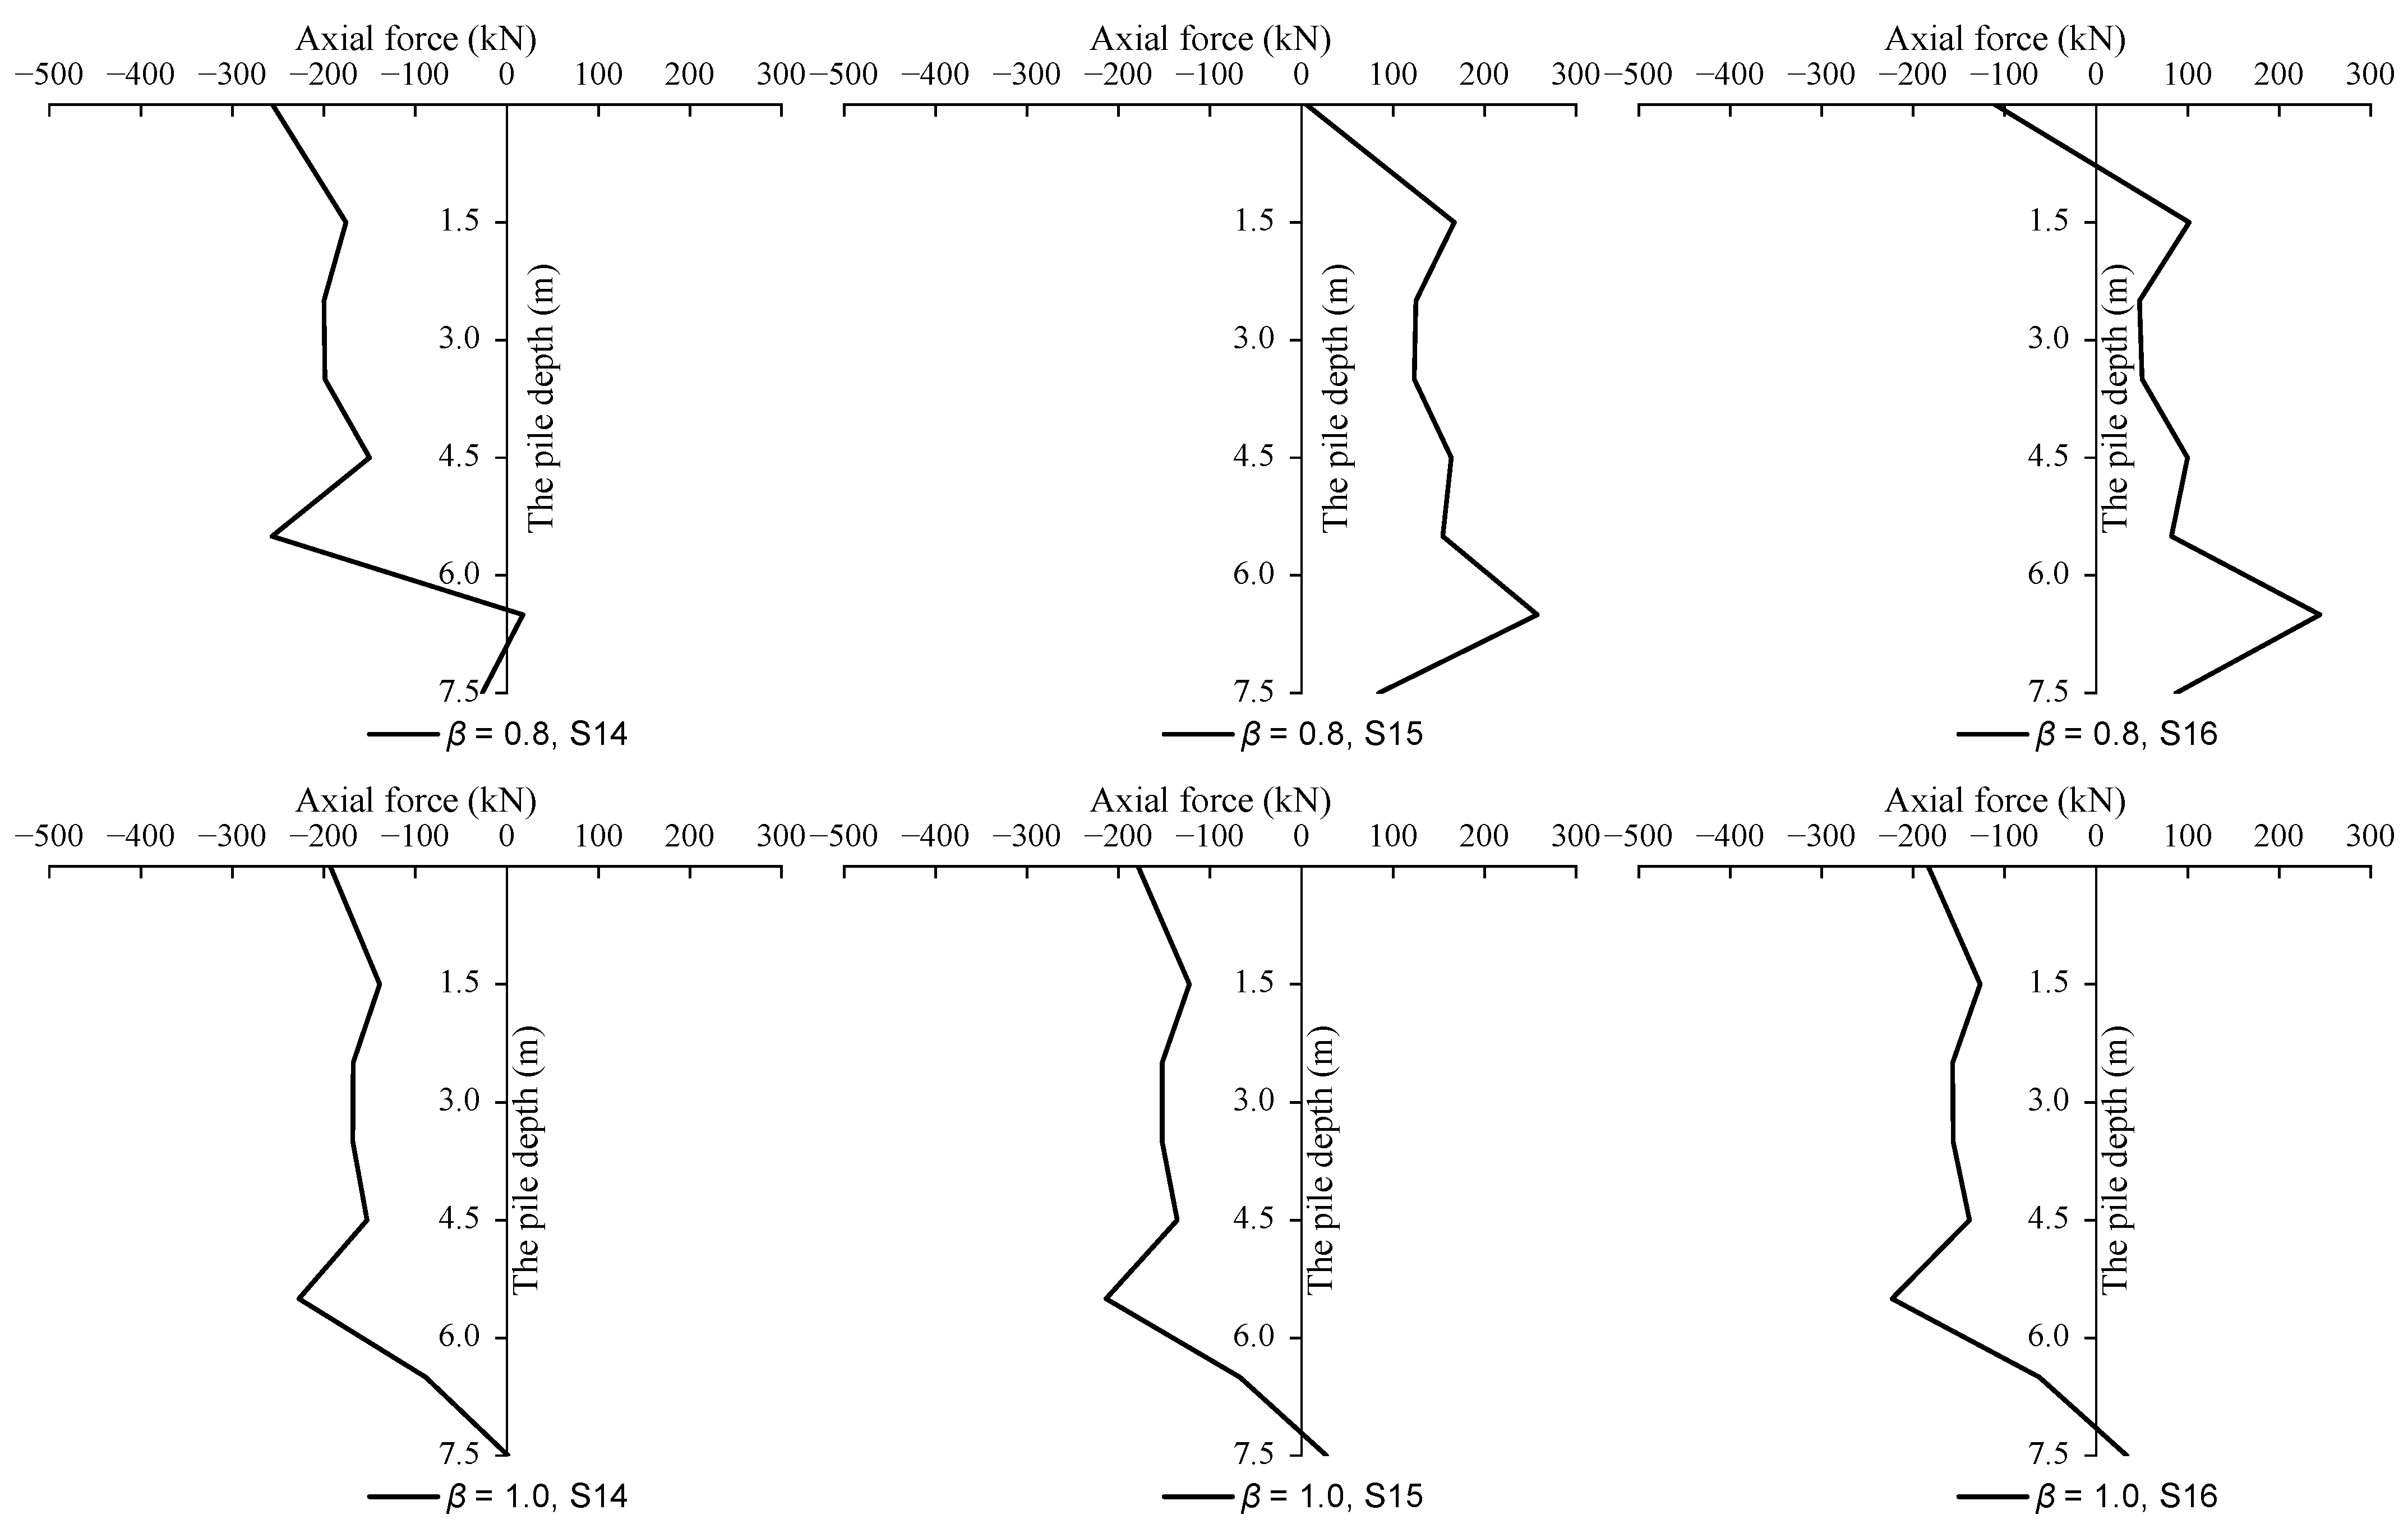
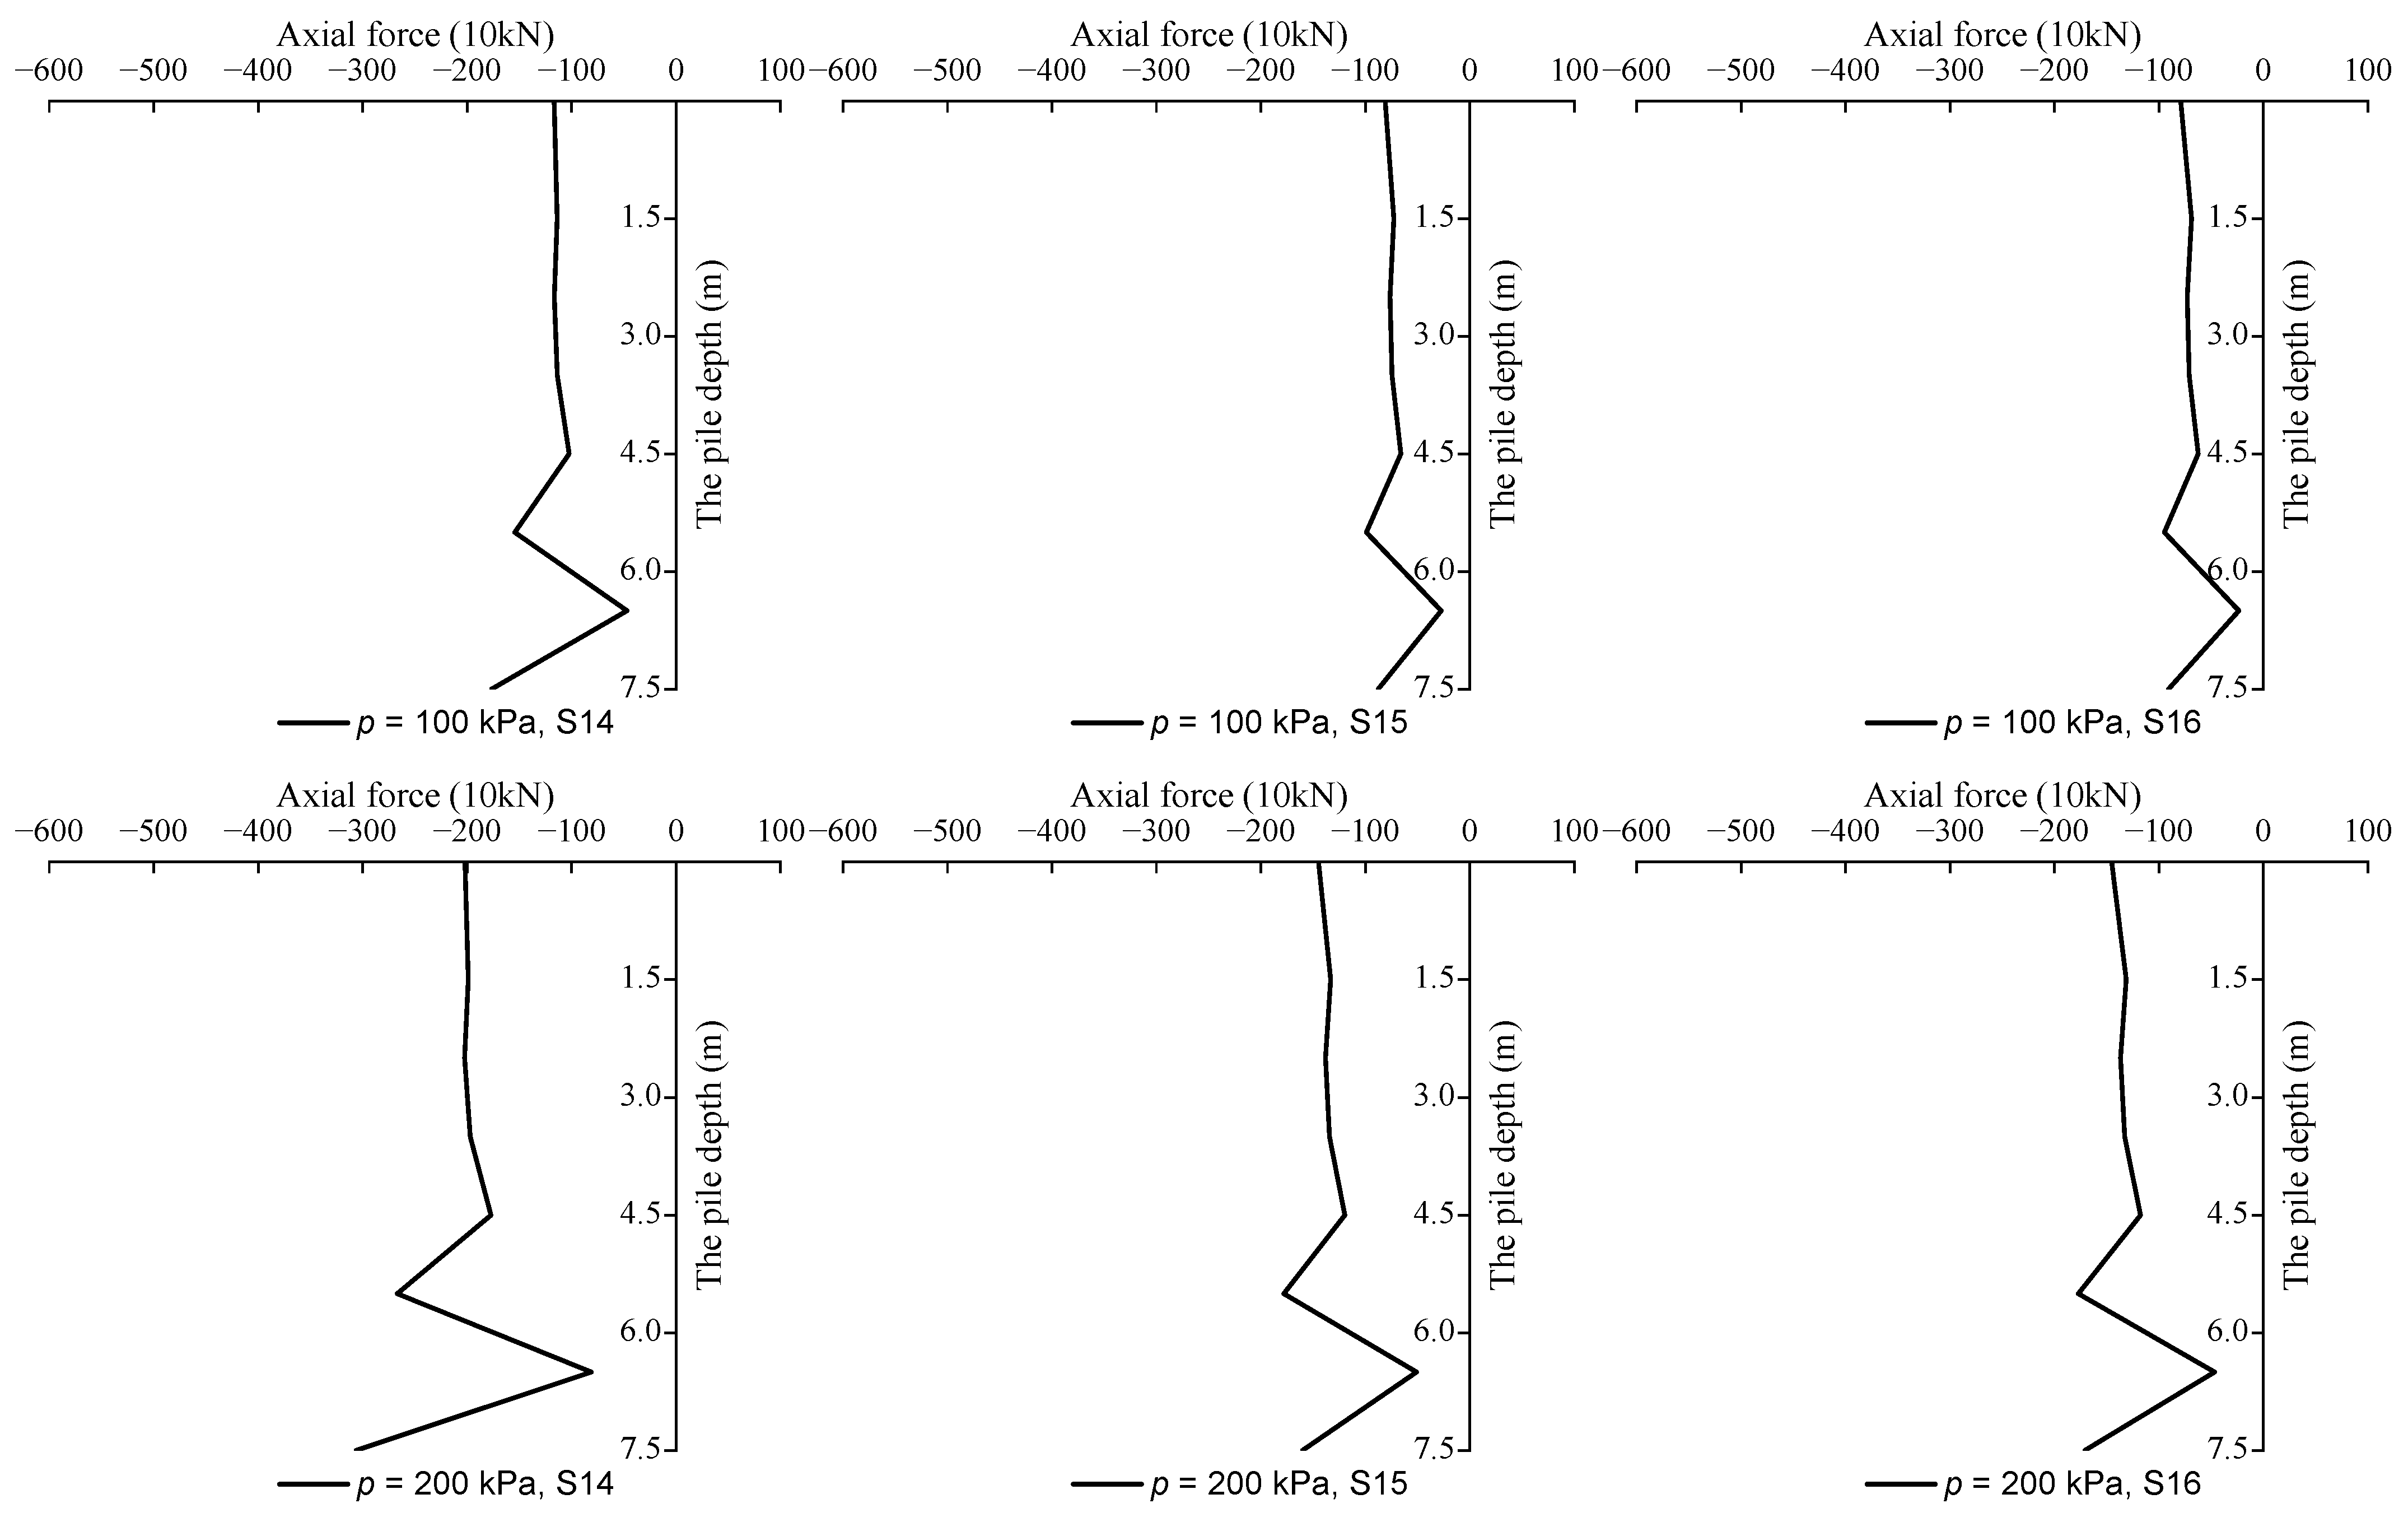
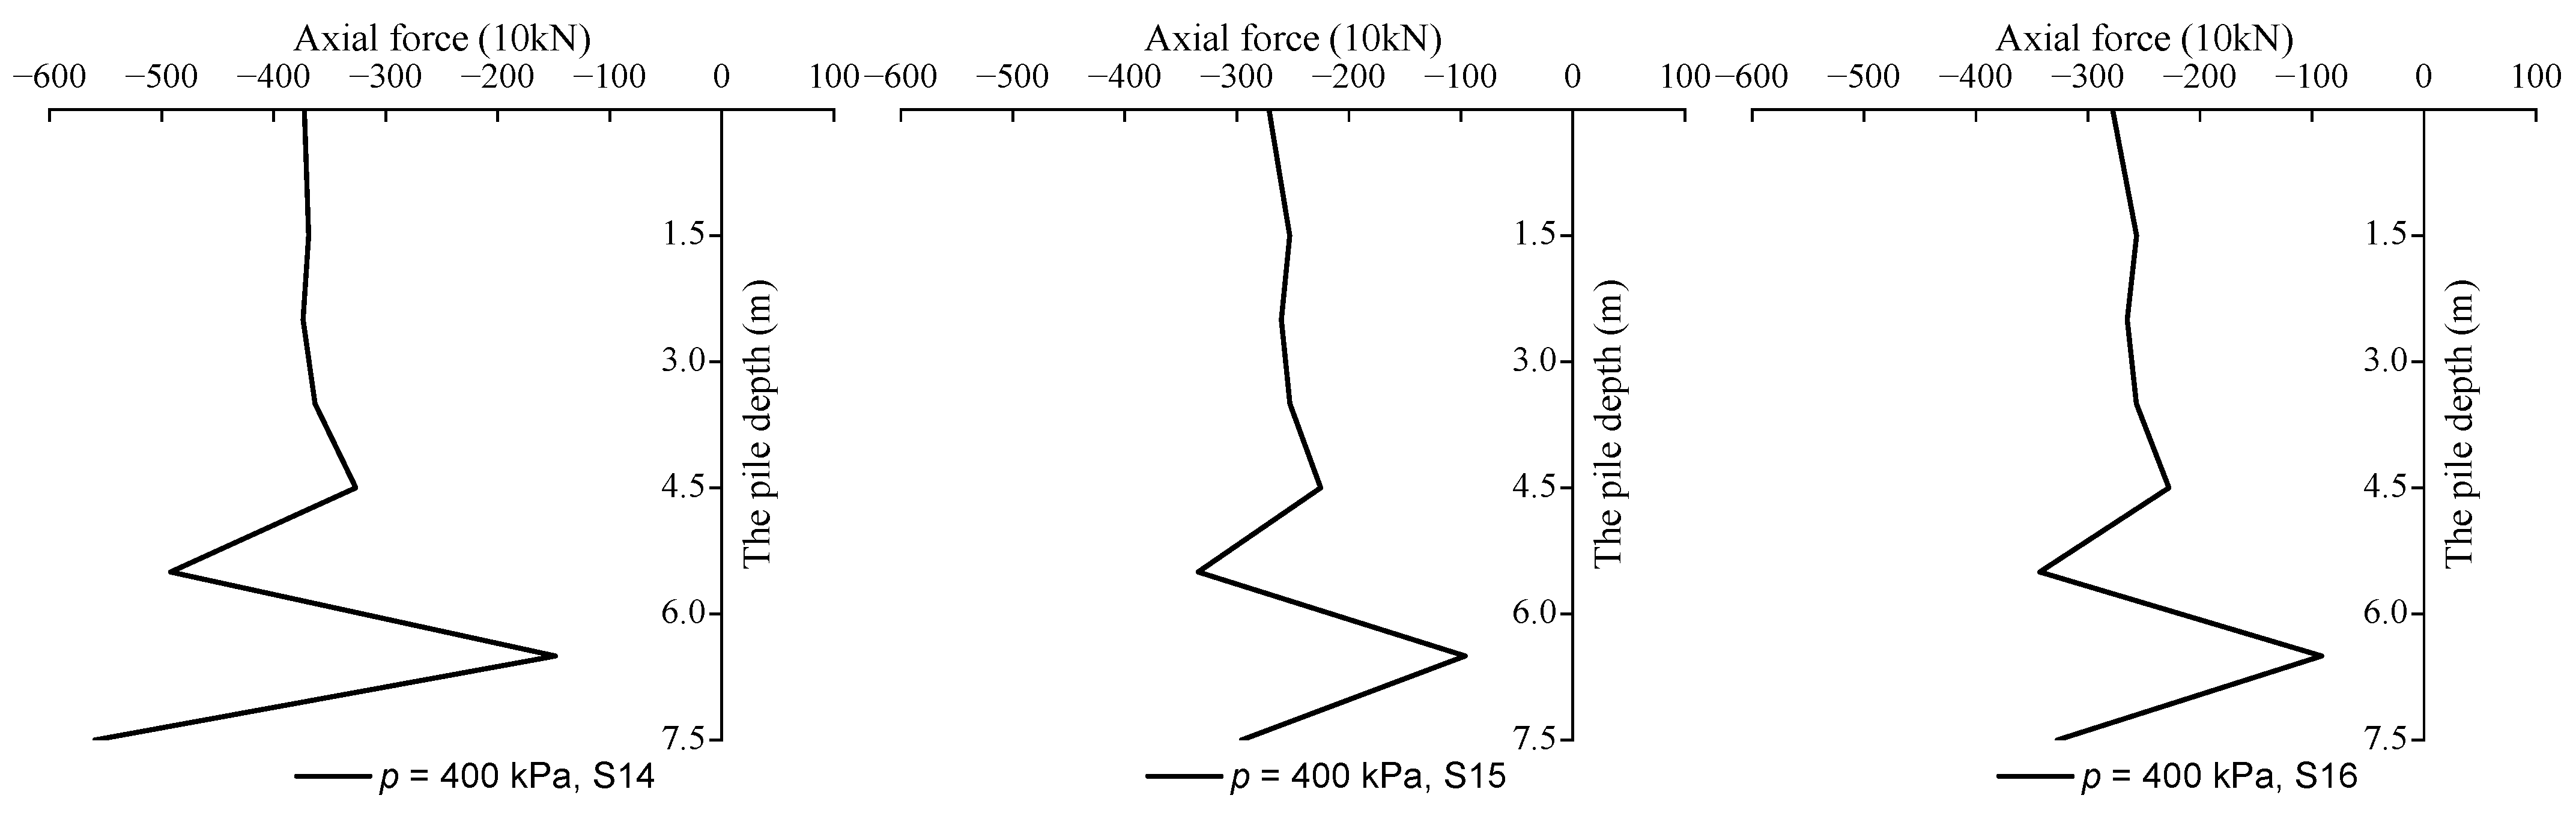
- Pile Shaft Force Analysis
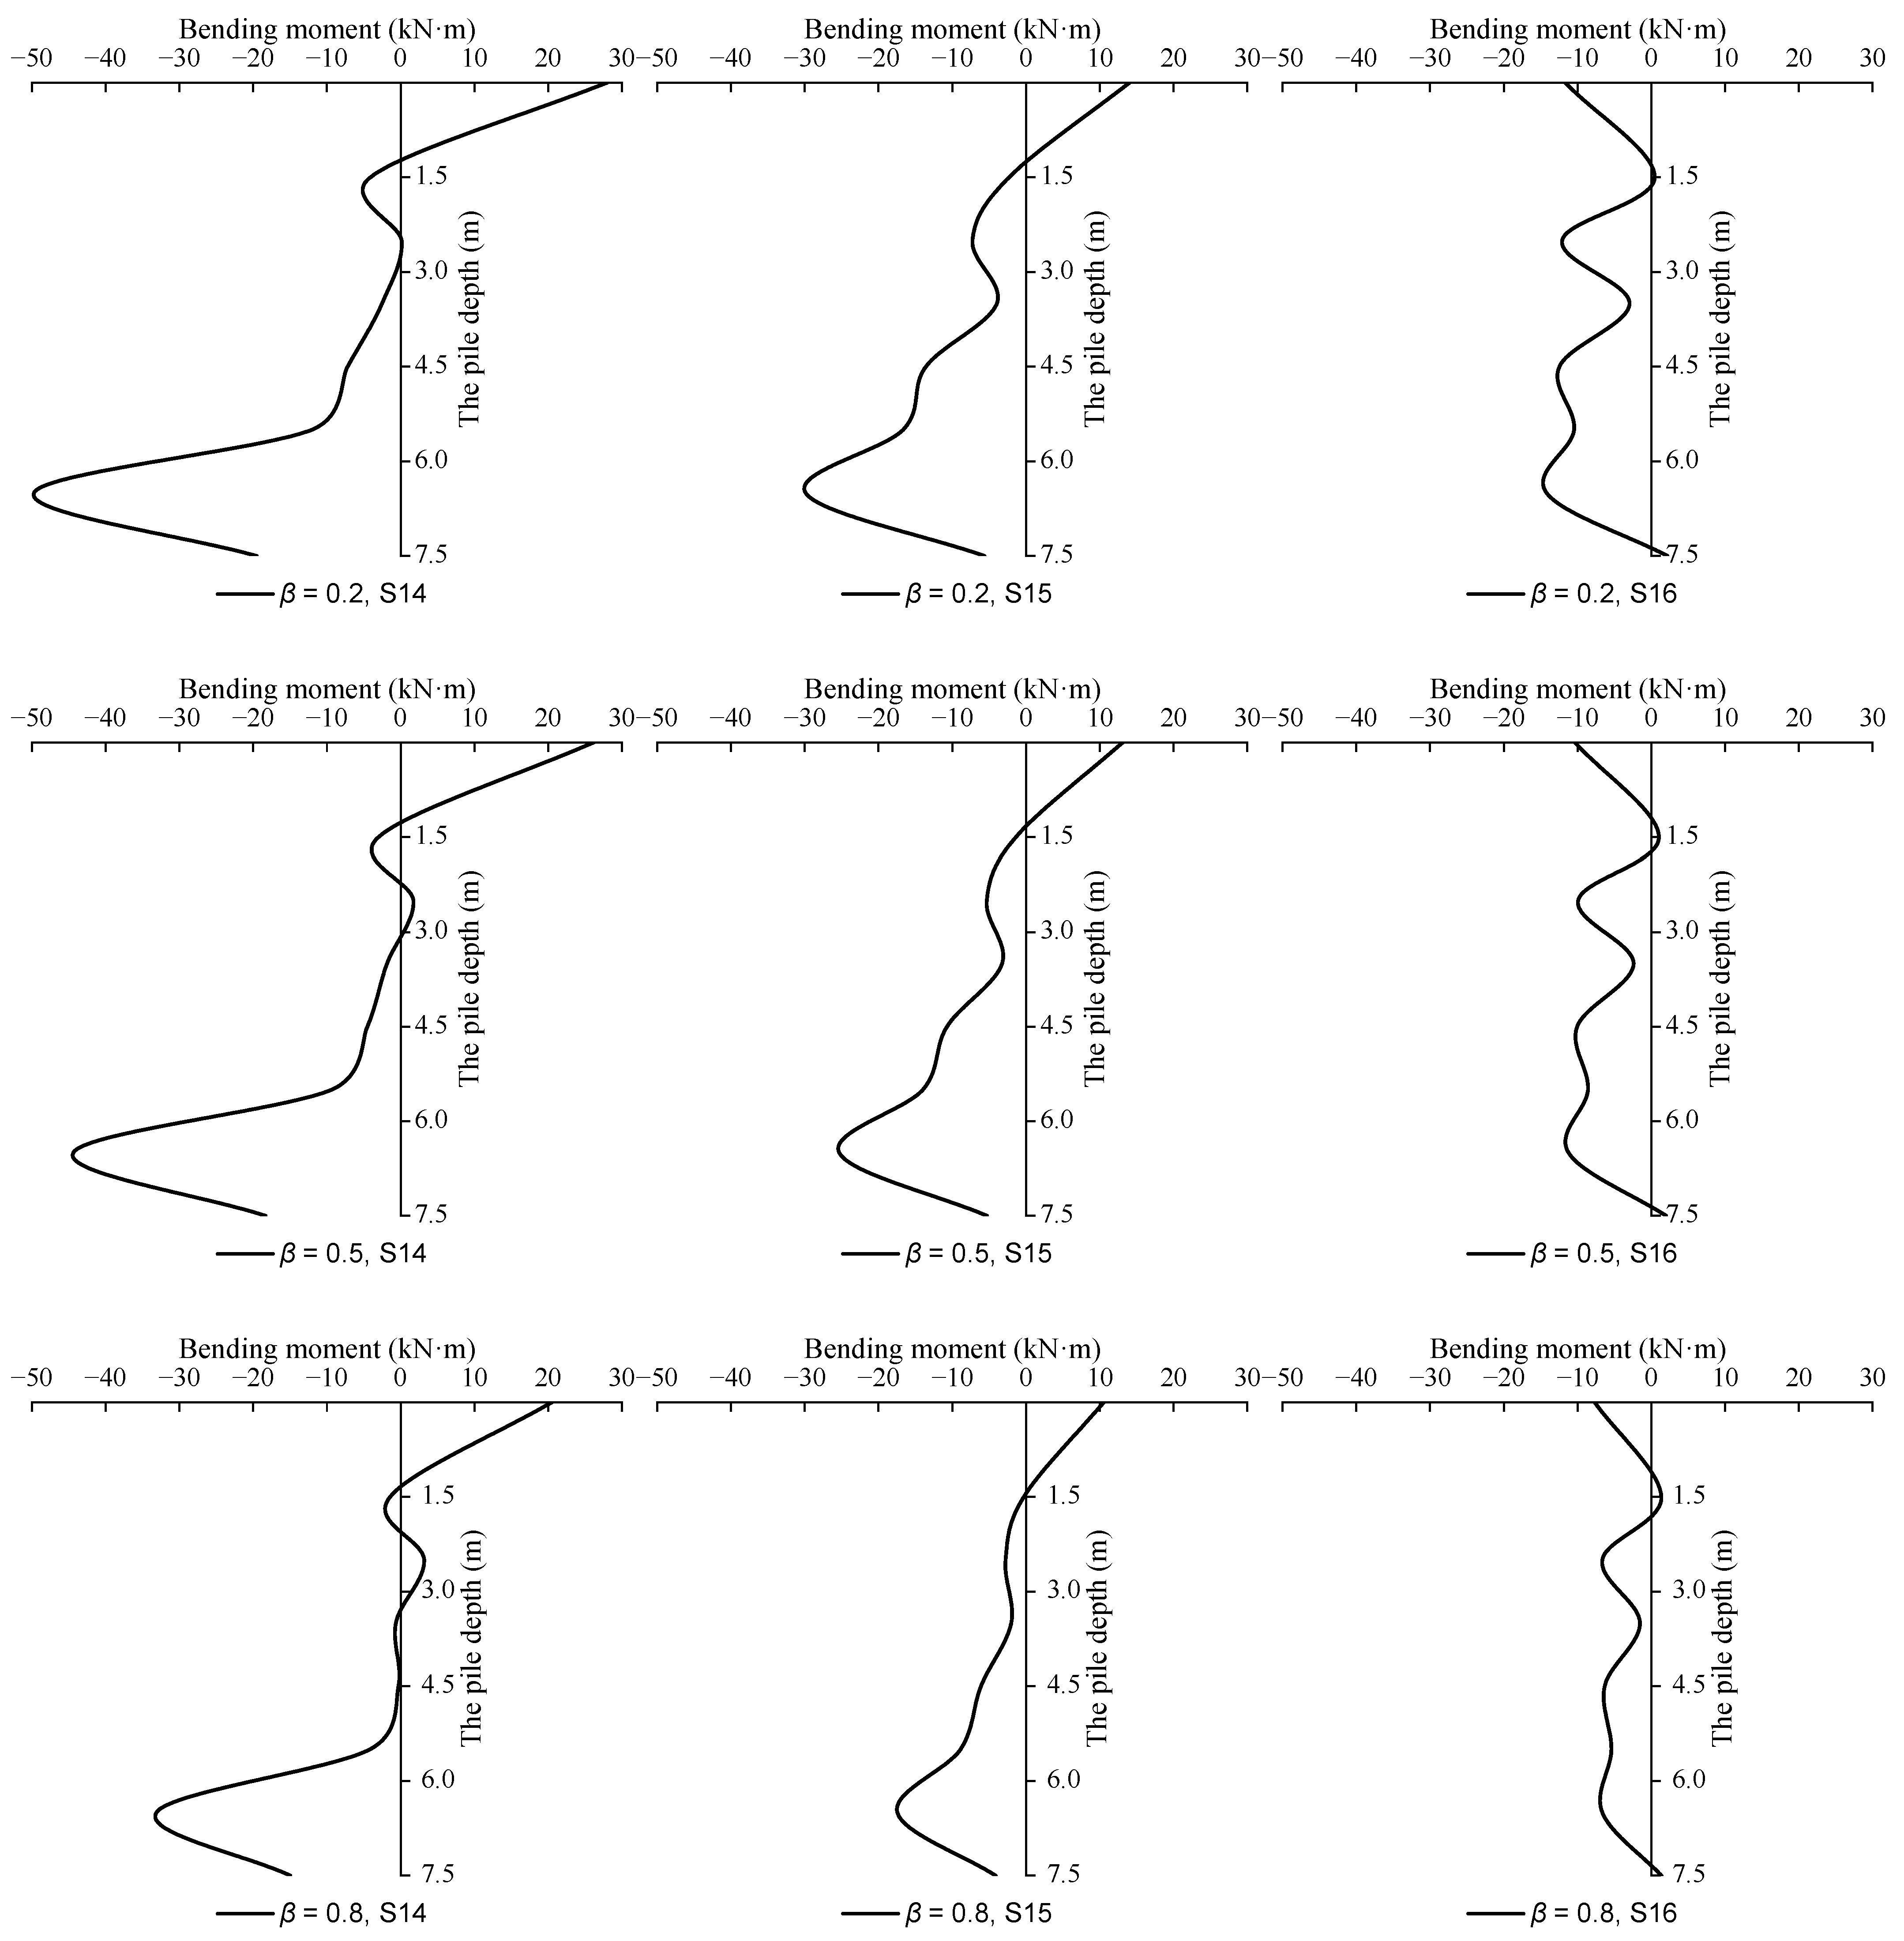
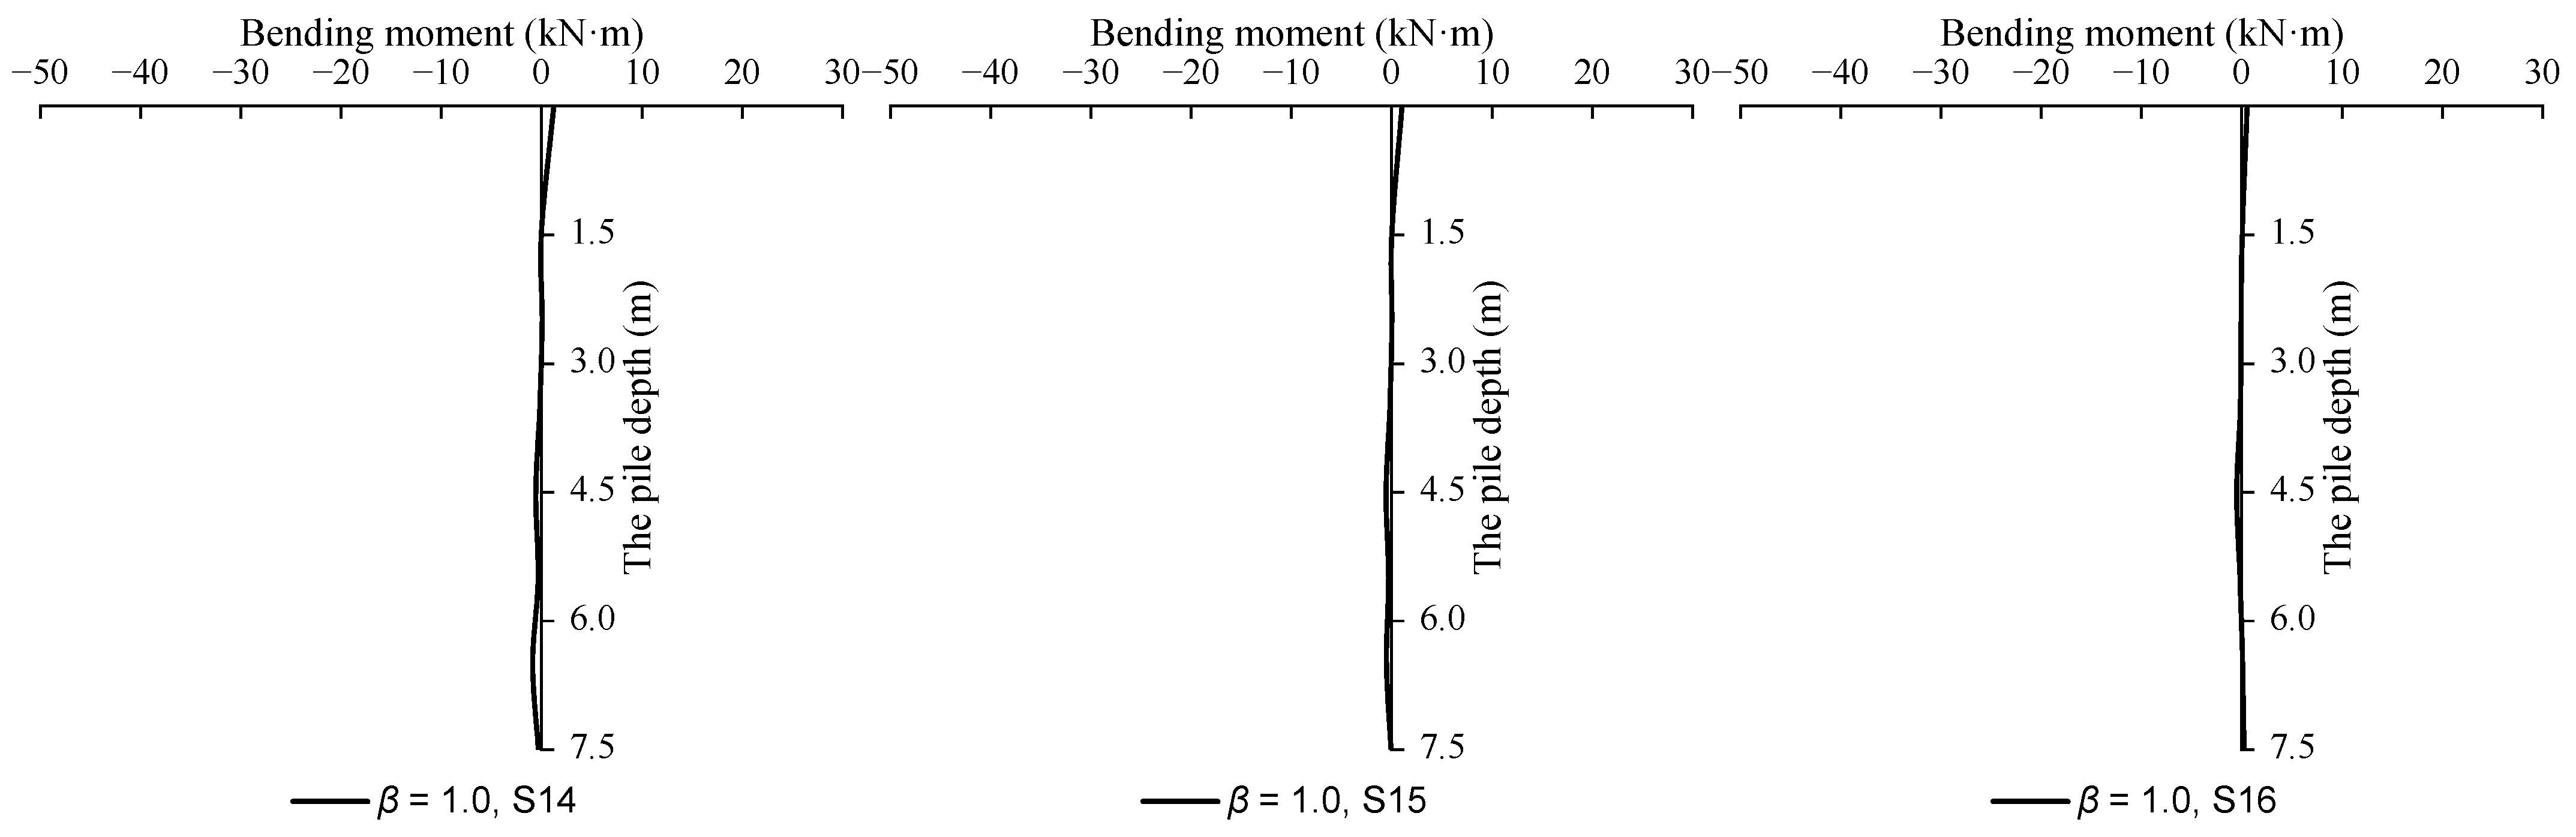
- (5)
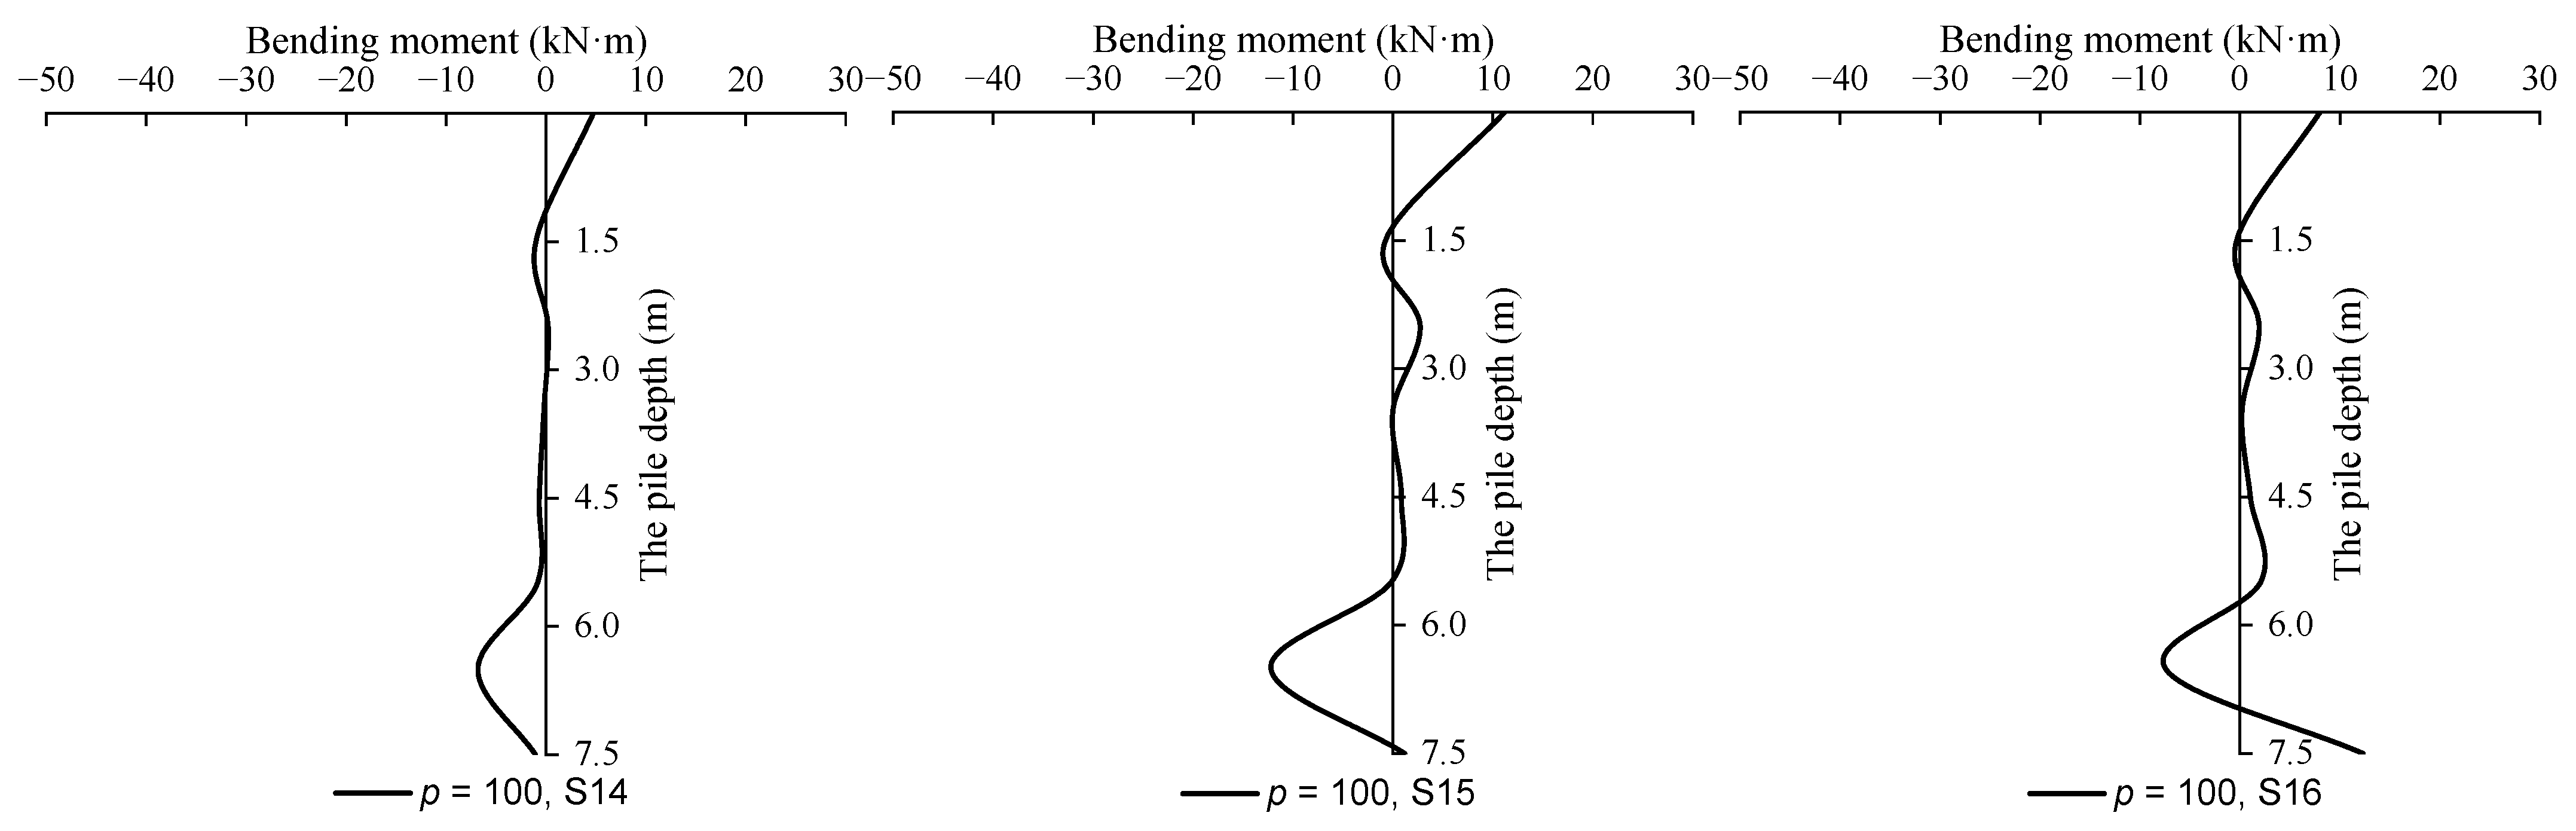
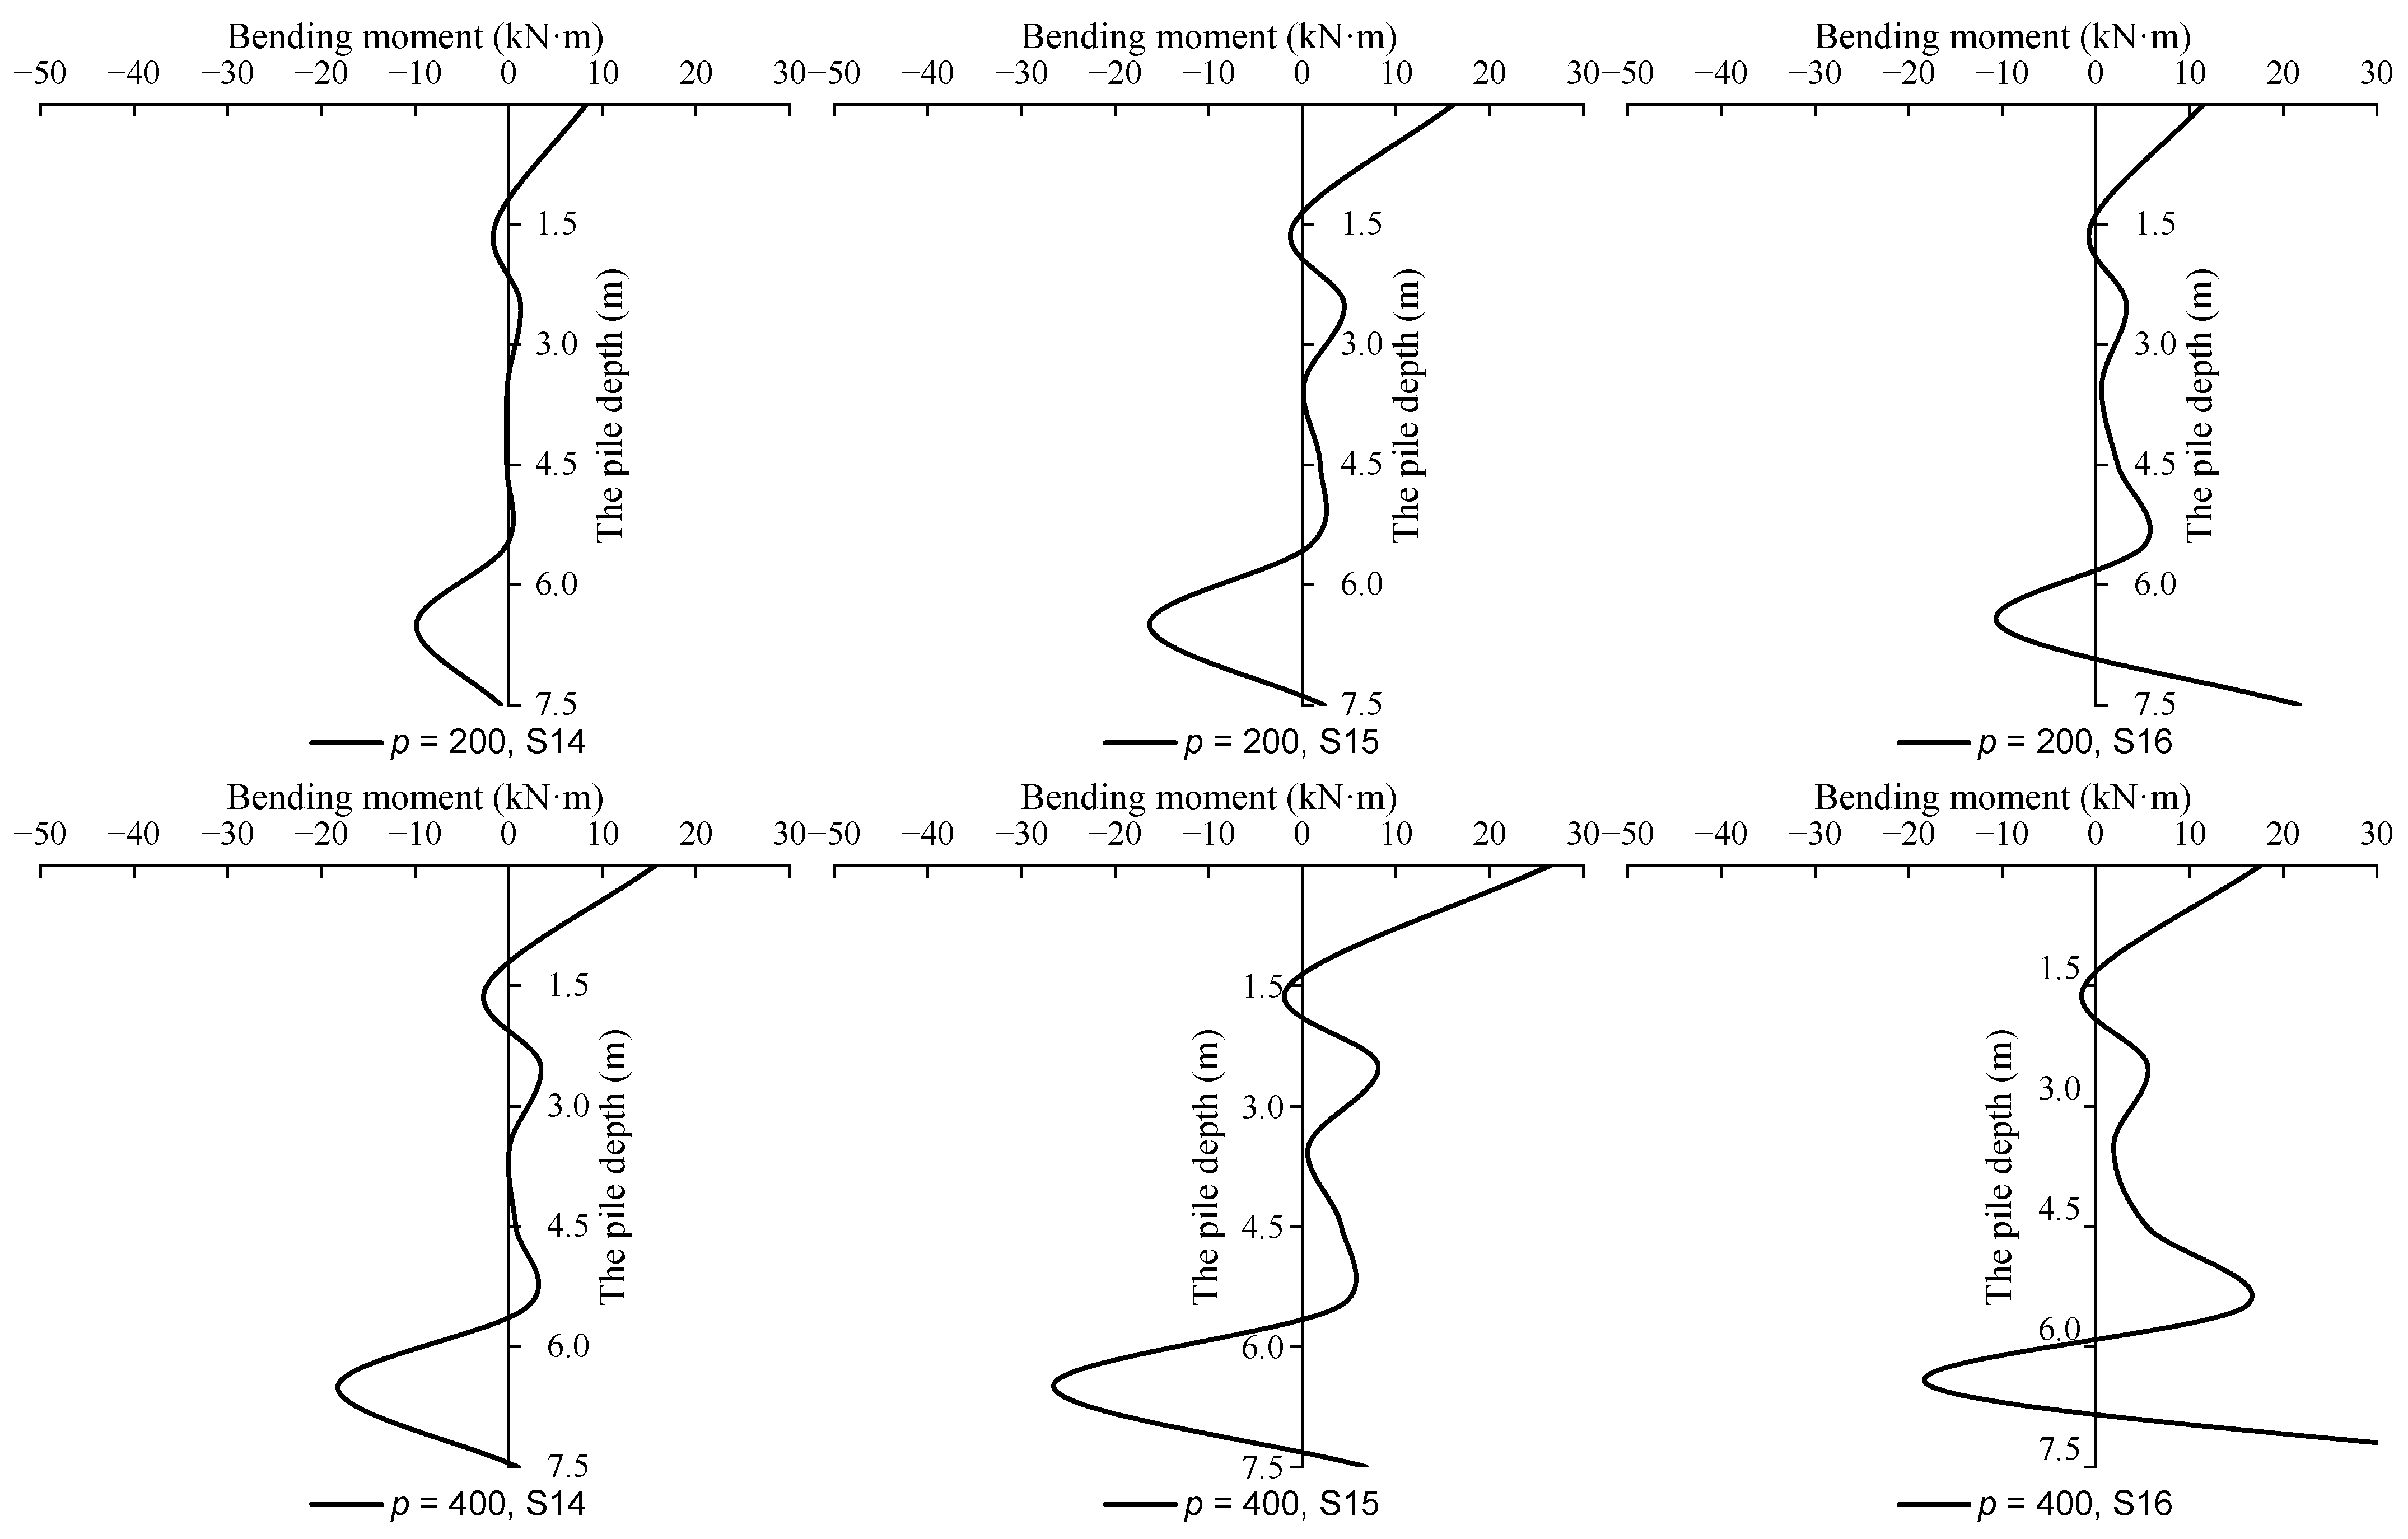
- Pile Bending Moment Analysis
6. Conclusions
- The ground surface above the existing bridge piles exhibited significant sensitivity. When additional stresses were ignored, the width and depth of the surface subsidence increased as the hard-rock ratios decreased, and the maximum settlement was within the determined allowable range. In addition, when the pile top load was significant, the local uplift and excessive surface settlement increased the risk of ground cracking and collapse.
- The influence area of the single-pile settlement was mainly within 9 m from the single pile to the palm surface. In addition, the load applied to the piles reduced the settlement, but increased the horizontal displacement of a single pile. However, the increasing effect on the horizontal displacement decreased with an increase in the load.
- The internal force of a single pile is significantly influenced by the pile top load. The analysis showed that as the pile top bending moment increased, the pile axial tension induced by shield construction decreased. This indicates that the appropriate amount of top load improved the pile deformation caused by shield construction.
- Construction disturbance was maintained within the allowable range for hard-rock height ratios greater than or equal to 0.8. Therefore, monitoring measures and foundation reinforcements should be adjusted promptly according to the variation in the actual stratigraphic distribution in the upper-soft and lower-hard composite strata.
7. Further Development
Author Contributions
Funding
Data Availability Statement
Conflicts of Interest
References
- Ng, C.; Fong, K.; Liu, H. The effects of existing horseshoe-shaped tunnel sizes on circular crossing tunnel interactions: Three-dimensional numerical analyses. Tunn. Undergr. Space Technol. 2018, 77, 68–79. [Google Scholar] [CrossRef] [Green Version]
- He, Z.; Li, C.; He, Q.; Liu, Y.; Chen, J. Numerical Parametric Study of Countermeasures to Alleviate the Tunnel Excavation Effects on an Existing Tunnel in a Shallow-Buried Environment near a Slope. Appl. Sci. 2020, 10, 608. [Google Scholar] [CrossRef] [Green Version]
- Li, S.; Li, P.; Zhang, M.; Liu, Y. Influence of Approaching Excavation on Adjacent Segments for Twin Tunnels. Appl. Sci. 2019, 10, 98. [Google Scholar] [CrossRef] [Green Version]
- Li, X.L.; Wang, B.L.; Li, X.; Ji, C. Analysis of Anti-Floating Measures and Construction Parameters of Shield Tunnel through River under Ultra-Shallow Covering. Appl. Mech. Mater. 2013, 2545, 628–634. [Google Scholar] [CrossRef]
- Xu, H.Q.; Xiao, C.J.; Liu, W.L.; Zuo, Y.Z.; Wei, C.Q. Numerical Study on Karst Treatment Technology of Wuhan Metro Line 6. IOP Conf. Ser. Earth Environ. Sci. 2020, 571, 012090. [Google Scholar] [CrossRef]
- Qiu, J.; Liu, H.; Lai, J.; Lai, H.; Chen, J.; Wang, K. Investigating the Long-Term Settlement of a Tunnel Built over Improved Loessial Foundation Soil Using Jet Grouting Technique. J. Perform. Constr. Facil. 2018, 32, 04018066. [Google Scholar] [CrossRef]
- He, S.; Lai, J.; Li, Y.; Wang, K.; Wang, L.; Zhang, W. Pile group response induced by adjacent shield tunnelling in clay: Scale model test and numerical simulation—ScienceDirect. Tunn. Undergr. Space Technol. 2022, 120, 104039. [Google Scholar] [CrossRef]
- Li, Z.; Chen, Z.; Wang, L.; Zeng, Z.; Gu, D. Numerical simulation and analysis of the pile underpinning technology used in shield tunnel crossings on bridge pile foundations. Undergr. Space 2020, 6, 396–408. [Google Scholar] [CrossRef]
- Al-Omari, R.R.; Al-Soud, M.S.; Al-Zuhairi, O.I. Effect of Tunnel Progress on the Settlement of Existing Piled Foundation. Studia Geotech. Mech. 2019, 41, 102–113. [Google Scholar] [CrossRef] [Green Version]
- Wu, H.N.; Zhang, P.; Chen, R.P.; Lin, X.T.; Liu, Y. Ground Response to Horizontal Spoil Discharge Jet Grouting with Impacts on the Existing Tunnels. J. Geotech. Geoenviron. Eng. 2020, 146, 05020006. [Google Scholar] [CrossRef]
- Zhao, C.; Lei, M.; Shi, C.; Cao, H.; Yang, W.; Deng, E. Function mechanism and analytical method of a double layer pre-support system for tunnel underneath passing a large-scale underground pipe gallery in water-rich sandy strata: A case study. Tunn. Undergr. Space Technol. Inc. Trenchless Technol. Res. 2021, 115, 104041. [Google Scholar] [CrossRef]
- Li, Y.; Zhang, W. Investigation on passive pile responses subject to adjacent tunnelling in anisotropic clay. Comput. Geotech. 2020, 127, 103782. [Google Scholar] [CrossRef]
- Ma, W.; Liu, J.; Zhang, L. Analysis of the impact of large-diameter shield construction adjacent to the side of the pile foundation. IOP Conf. Ser. Earth Environ. Sci. 2021, 634, 012109. [Google Scholar] [CrossRef]
- Mirsepahi, M.; Nayeri, A.; Lajevardi, S.H.; Mirhosseini, S.M. Effect of multi-faced twin tunneling in different depths on a single pile. Innov. Infrastruct. Solut. 2021, 6, 42. [Google Scholar] [CrossRef]
- Mo, P.Q.; Marshall, A.M.; Fang, Y. Cavity Expansion-Contraction-Based Method for Tunnel-Soil-Pile Interaction in a Unified Clay and Sand Model: Drained Analysis. Int. J. Geomech. 2021, 21. [Google Scholar] [CrossRef]
- Loganathan, N.; Poulos, H.G.; Stewart, D.P. Centrifuge model testing of tunnelling-induced ground and pile deformations. Géotechnique 2000, 50, 283–294. [Google Scholar] [CrossRef]
- Huang, K.; Sun, Y.W.; Zhou, D.Q.; Li, Y.J.; Jiang, M.; Huang, X.Q. Influence of water-rich tunnel by shield tunneling on existing bridge pile foundation in layered soils. J. Cent. South Univ. 2021, 28, 2574–2588. [Google Scholar] [CrossRef]
- Soomro, M.A.; Mangi, N.; Xiong, H.; Kumar, M.; Mangnejo, D.A. Centrifuge and numerical modelling of stress transfer mechanisms and settlement of pile group due to twin stacked tunnelling with different construction sequences. Comput. Geotech. 2020, 121, 103449. [Google Scholar] [CrossRef]
- Boonsiri, I.; Takemura, J. Observation of Ground Movement with Existing Pile Groups Due to Tunneling in Sand Using Centrifuge Modelling. Geotech. Geol. Eng. 2015, 33, 621–640. [Google Scholar] [CrossRef]
- Abuallan, F.M.; Jusoh, S.N.; Sohaie, H.; Marto, A.; Mohamad, H.; Rahim, A. Physical model on effects of tunnelling towards single piles under zoned of influence. IOP Conf. Ser. Mater. Sci. Eng. 2021, 1144, 012100. [Google Scholar] [CrossRef]
- Soomro, M.A.; Ng, C.W.W.; Liu, K.; Memon, N.A. Pile responses to side-by-side twin tunnelling in stiff clay: Effects of different tunnel depths relative to pile. Comput. Geotech. 2017, 84, 101–116. [Google Scholar] [CrossRef]
- Ng CW, W.; Lu, H. Effects of the construction sequence of twin tunnels at different depths on an existing pile. Can. Geotech. J. 2014, 51, 173–183. [Google Scholar]
- Wood, D.M. Soil Mechanics; Cambridge University Press: Cambridge, UK, 2009. [Google Scholar]


| Project | Modulus of Elasticity (MPa) | POISSON’S RATIO | Severe (KN/m3) | Cohesive Force (kPa) | Internal Friction Angle (°) |
|---|---|---|---|---|---|
| <1> Miscellaneous fill | 2.5 | 0.35 | 16.5 | 8 | 10 |
| <4-2B> Silty sand | 5 | 0.42 | 17 | 12.6 | 12.8 |
| <3-1> Silty-fine sand | 12 | 0.25 | 20.3 | 15 | 35 |
| <3-3> Gravelly sand | 40 | 0.30 | 19.6 | 10 | 30.5 |
| <9C-2> Slightly weathered limestone | 10,000 | 0.30 | 25 | 1500 | 55 |
| Segment | 34,500 × 0.7 | 0.2 | 25 | - | - |
| Equivalent layer | 13 | 0.3 | 22.5 | - | - |
| Piles and pile caps | 30,000 | 0.25 | 25 | - | - |
| β | p (kPa) | Driving Pressure (MPa) | Synchronous Grouting Pressure (MPa) |
|---|---|---|---|
| 0 | 0 | 0.183 | 0.122 + 0.2 = 0.322 |
| 0.2 | 0 | 0.182 | 0.153 + 0.2 = 0.353 |
| 0.5 | 0 | 0.180 | 0.153 + 0.2 = 0.353 |
| 100 | 0.182 | 0.193 + 0.2 = 0.393 | |
| 200 | 0.183 | 0.232 + 0.2 = 0.432 | |
| 400 | 0.186 | 0.312 + 0.2 = 0.512 | |
| 0.8 | 0 | 0.262 | 0.153 + 0.2 = 0.353 |
| 1.0 | 0 | 0.258 | 0.153 + 0.2 = 0.353 |
| Ground Settlement (mm) | Single-Pile Displacement (mm) | Stress Level of Single Pile (MPa) |
|---|---|---|
| −40~+10 mm | 2.5 mm in horizontal 10 mm in vertical | 1.89 MPa in tensile stress |
Publisher’s Note: MDPI stays neutral with regard to jurisdictional claims in published maps and institutional affiliations. |
© 2022 by the authors. Licensee MDPI, Basel, Switzerland. This article is an open access article distributed under the terms and conditions of the Creative Commons Attribution (CC BY) license (https://creativecommons.org/licenses/by/4.0/).
Share and Cite
Lv, J.; Lin, D.; Wu, W.; Huang, J.; Li, Z.; Fu, H.; Li, H. Mechanical Responses of Slurry Shield Underpassing Existing Bridge Piles in Upper-Soft and Lower-Hard Composite Strata. Buildings 2022, 12, 1000. https://doi.org/10.3390/buildings12071000
Lv J, Lin D, Wu W, Huang J, Li Z, Fu H, Li H. Mechanical Responses of Slurry Shield Underpassing Existing Bridge Piles in Upper-Soft and Lower-Hard Composite Strata. Buildings. 2022; 12(7):1000. https://doi.org/10.3390/buildings12071000
Chicago/Turabian StyleLv, Jianbing, Dijin Lin, Weijun Wu, Juan Huang, Zikun Li, Helin Fu, and Hongzhong Li. 2022. "Mechanical Responses of Slurry Shield Underpassing Existing Bridge Piles in Upper-Soft and Lower-Hard Composite Strata" Buildings 12, no. 7: 1000. https://doi.org/10.3390/buildings12071000