Article

Scientific Landscape of Embodied Experience in the Virtual Environment: A Bibliometric Analysis

1
Department of Architecture, Dongyang Mirae University, Seoul 08221, Korea
2
Department of Architecture, Sejong University, Seoul 05006, Korea
*
Author to whom correspondence should be addressed.
Buildings 2022, 12(6), 844; https://doi.org/10.3390/buildings12060844
Submission received: 20 May 2022 / Revised: 10 June 2022 / Accepted: 14 June 2022 / Published: 16 June 2022

Abstract

:
The realm of architecture has been influenced by the expansion in virtual environments (VEs), along with Industry 4.0 technologies transforming human–VE interactions. Despite increasing scholarly interest in embodied experience-integrated VE, there have been few comprehensive literature reviews undertaken on VEs from a holistic experience perspective. Therefore, this article reviews the literature on the embodied experiential dimension of VEs that has become necessary to adapt theories and methodologies in a way that enhances the user experience in a VE. This study employs a bibliometric analysis to review research performance and undertake a science mapping of the literature. The 969 pieces of data retrieved from Web of Science were subjected to a performance analysis, and VOSviewer was used to visualize the intellectual structure and research themes. The results of this study emphasize the strength and growing interest in VEs from the embodied experience perspective. Another significant finding is that VE experience studies are mostly based on embodied technologies. In this paper, the results of analyses are discussed in terms of productivity, collaboration, and research themes for future. This study contributes to the literature by providing a significant theoretical reference for the potential of the embodied experience in VE research, which will mostly attract the interest of architectural design researchers.

1. Introduction

The upsurge in Industry 4.0 technologies has led to relevant changes in architectural design practice and research beyond the realm of architecture [1,2]. Human–environment interactions have been transformed into human–computer interactions (HCI) by digital technology and the internet [3], generating collective knowledge and easy access to design platforms to create user content [4]. The digitally created virtual environment (VE) has given rise to new forms of participation in a networked society [5]. In this context, architecture based on understanding the interaction between humans and the environment has been influenced by expansion in VEs, causing change and transformation—in most cases influencing architects, researchers, and adaptation of new methodologies from other disciplines [6].
Adaptation of both theory and methodologies has become necessary in the constantly developing digital context—more specifically in terms of human–VE interactions, and how users experience, feel, and engage with VEs [7,8]. Given this context, action is urgently needed to integrate digital knowledge to enhance human–VE interactions.
Further, given collective knowledge about digital technology, and easy access to design platforms and creation methods, user-generated content including architecture provides an opportunity for a member of the general public to be a general architect in VEs, and this phenomenon makes architectural professions consider a new role in VEs [9]. As VEs cannot be sustained only with clusters of independent buildings, there is still space for architects to intervene as master planners to organize VEs to work from a holistic perspective, and to mediate in the relationship between humans and VEs.
Ultimately, an architect is required to play a role as a mediator in user–VE interactions based on an understanding of the user experience (UX) and the immersive virtual technology [10]. To this end, it is necessary for architects and architectural researchers to become master planners who understand human–VE interactions and connect with research in the fields of technology and science, based on their knowledge in the field of architecture.
In this sense, this paper seeks to understand VEs in relation to embodied cognition—the third paradigm of cognitive science—along with the integral relationship between the environment, body, brain, and mind [11]. The architectural research field has developed through a combination of theories and methodologies from cognitive science [12], environmental psychology [13], social science [14], neuroaesthetics [15], and neuroarchitecture [16,17,18], which converged to embodied cognition [11].
The paradigm of embodied cognition refers to the concept and methods of experience mechanisms based on human–environment interactions [11]. According to Lakoff and Johnson, embodied cognition is a precursor to the theory of abstract conception, and experience is based on the bodily experience of humans with the environment [19,20]. This perspective provides a novel experiential view of VEs [21]. In architecture, the term environment is a comprehensive and broad concept that has been defined in regard to the interrelationship of humans with the physical and nonphysical environments, including VEs [22]. Given that human experience is based on their previous experience in the real environment, it can be assumed that an experience in a VE is based on experience of the relationship between the body and the real environment [21]. In empirical studies, the embodied perspective represents the built environment through a form of virtual reality (VR) such as a stereo head-mounted display (HMD), head tracking, or computer graphic-generated images, [23] according to different experimental tools [22].
Therefore, VEs should be discussed with consideration of its integrated relationships with human experiences, derived from the interrelationships between the environment, body, brain, and experience. This is consistent with embodied cognition—the third paradigm of cognitive science, and one of the most representative multidisciplinary disciplines. Despite increasing scholarly attention to VEs, there are few comprehensive reviews in the field of VEs from a UX perspective, which may reveal the potential value and impact of VEs. Extending from a precedent review article, “Implications of Neuroarchitecture for the Experience of the Built Environment: A Scoping Review” [22]—which explores the concept and methodology through the relationships between environmental stimuli, body responses, and experiences from the embodied cognition perspective—this paper reports a quantitative study of the relationships between the VE and the UX based on their previous experiences in real environments, from the perspective of embodied cognition.
The motivation for this analysis is to detect trends in scientific activity related to VEs from an embodied experience perspective. The embodied experience—as the framework of how people experience the environment—highlights the importance of the acquisition of scientific knowledge by architectural designers and researchers, to improve the treatment of available information. The incorporation of embodied experience in a VE requires competence and skills according to the needs of the experiential dimension in the VE.
This paper does not limit the VE research scope to the architecture realm, but also includes multidisciplinary studies. This study examines the scientific landscape of research in regard to the experiential dimension of VEs, focusing on research trends in this research domain across disciplines. Further, this paper examines scientific productivity and the intellectual network of publications and researchers in the field of VEs. Specifically, this paper focuses on key concepts of VEs and presents a bibliometric analysis of research trends in embodied experience-integrated VEs. For this purpose, an extensive literature review of embodied experience perspectives connected to VEs was performed to examine the definition, development of research flow and themes, and implications of embodied experience in VEs.
This research is structured as follows. Section 2 illustrates the methodology employed. Section 3 presents the findings and Section 4 discusses them. Section 5 offers conclusions.

2. Materials and Methods

This study adopts a bibliometric methodology encapsulating quantitative techniques applied to bibliometric data. Easy access to scientific databases through Web of Science (WoS) to acquire large volumes of bibliometric data on specific topics, and the use of bibliometric software such as VOSviewer, enabled the researchers to undertake a bibliometric analysis in a wide range of disciplines [24] including cultural studies [22,25], business [26], and urban planning [27], to explore intellectual structure and research performance in relation to the research topics [28]. Therefore, this method was used to gain an understanding of the research trends in embodied VE across disciplines. To achieve this, this bibliometric study was conducted following a methodological flow chart [28], including the PRISMA-ScR (Preferred Reporting Items for Systematic Review for Scoping Review) [29], as illustrated in Table 1.

2.1. Define the Aim and Scope of the Study

Despite previous bibliometric analysis studies about VR and embodied experience technologies to build up empathy [30], and its application in other disciplines such as management [31] and hospitality and tourism [32,33], there is a gap in the embodied experiential dimension of VEs considering a holistic experiential perspective. In this study, the aim is to contribute to future research directions in the human–VE interaction domain by presenting and reviewing developing research trends in embodied experience technologies within VEs.
Second, this bibliometric study aims to provide a theoretical and methodological reference for embodied experience in VEs. This may help researchers understand the gap between various disciplines, and develop novel ideas for the creation of successful VEs. Therefore, this study aims to inform the development of future research to facilitate application of the embodied experiential perspective to the ‘virtual environment’ to enhance human–VE interactions.
This paper reports a literature review conducted to explore research trends, productivity, and collaborations, and thus identify progress and insights of the domain. These objectives can be achieved by answering the following questions using a bibliometric analysis:
RQ1. How is scientific productivity progressing in the virtual embodied experience?
RQ2. How is the research collaboration network formed in this domain?
RQ3. What is the research trend that has enhanced the embodied experience in the virtual environment?

2.2. Bibliometric Analysis with Bibliometric Software, VOSviewer, and Scientific Databases via Web of Science

This study employed a quantitative bibliometric analysis of review article alternatives, largely categorized as qualitative or quantitative methodologies. In contrast to the traditional literature review such as systematic review focused on a narrow scope of study for domain-, method-, and theory-based reviews with qualitative techniques [28,34,35], bibliometric analysis is a popular and rigorous method of exploring and analyzing large volumes of scientific data to uncover emerging trends and examine the intellectual structure of a specific domain in the literature [28].
This study employed a performance analysis and science mapping technique—the two main techniques addressed in [28]. First, performance analysis was used to summarize the performance of prolific research indicators such as authors, institutions, countries, and journals based on total publications and total citations. Second, science mapping was used to explore the intellectual structure of the relationships between research components using five analysis techniques: citation analysis, co-citation analysis, bibliographic coupling, co-occurrence analysis, and co-authorship analysis [28]:
  • Citation analysis identified the relationships among the most influential publications in the VE research field.
  • Co-citation analysis revealed foundational thematic clusters and seminal publications through the relationships among cited publications based on references.
  • Bibliographic coupling revealed the current development of themes through the relationships among citing publications.
  • Co-occurrence analysis explored the existing and future relationships among topics in the VE research field.
  • Co-authorship analysis examined the intellectual collaboration among authors and their affiliations, and consequent impacts on the development of the research field.

2.3. Collecting Data

Search Terms/The Literature Screening Process

The data collection process is the most important aspect of obtaining meaningful research results. Bibliometric data were retrieved from the WoS Core Collection, one of the world’s largest bibliometric databases of peer-reviewed research literature, which also provides performance analysis results and is interchangeability linked with VOSviewer, a visualization tool enabling close reading [28].
The applied method was used to conduct a search of the WoS Core Collection using keywords to generate a representative body of documents for exploration. Search terms were derived from a preliminary literature review and divided into three categories: (1) VE-related terms: (“virtual environment” or “virtual environments”); (2) embodied technology-related terms (“embodied” or “embodiment” or “immersion” or “presence” or “immersive”); and (3) experience-related terms (“experience” or “emotion” or “mind” or “behavior” or “feeling”).
Following the PRISMA-ScR flow chart, in phase 1 (identification), WoS found 2517 results in all fields: all types of documents with the search terms exposed. In phase 2 (screening), to exclude terms exposed only in journal titles, keywords were searched in the topic field: Searches title, abstract, author keywords, and Keywords Plus, which identified 2190 articles. As this study focused on peer-reviewed articles, 977 grey literature were removed. English was selected as the language, resulting in 969 final records. In phase 3 (eligibility), the titles and abstracts of articles were manually assessed for eligibility to exclude non-relevant articles. Finally, the 969 records published from 1993 to 2022 were selected for bibliometric analysis. The appropriate sample size for bibliometric analysis has been suggested as approximately 1000 papers [36].

3. Results

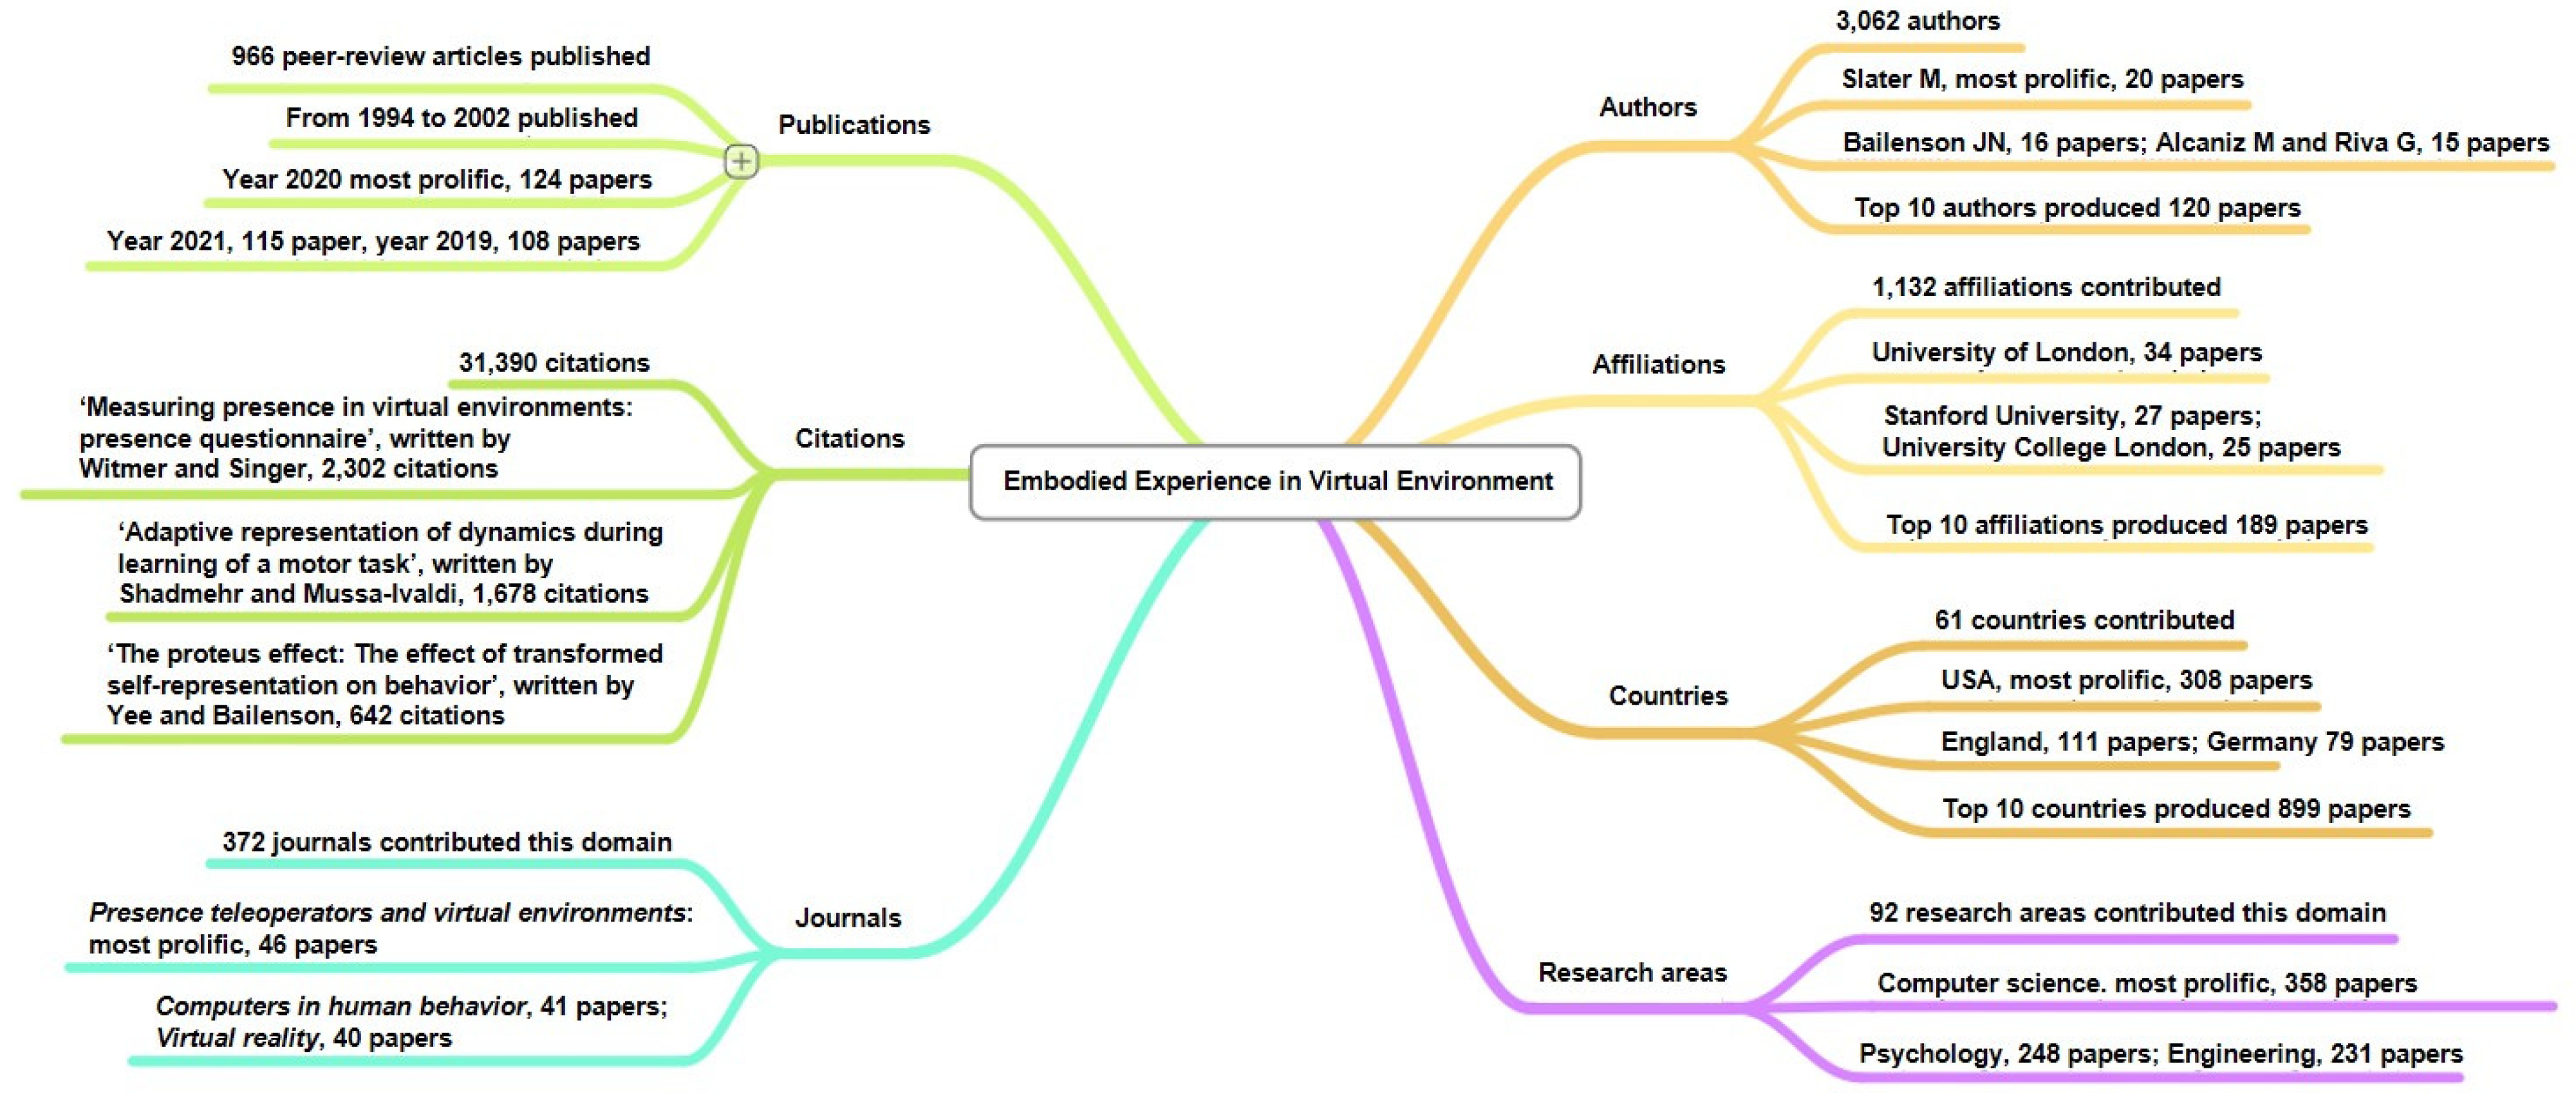
3.1. Performance Analysis

The analysis returned 969 records from the WoS. The detailed analysis that follows is of articles related to the ‘virtual environment’, and where terms related to ‘embodiment’ or ‘experience’ appear as the publication topic.
Performance analysis of selected papers is based on the number of publications and citations per year, and analysis of publications by journal, research area, author, affiliation, and country.

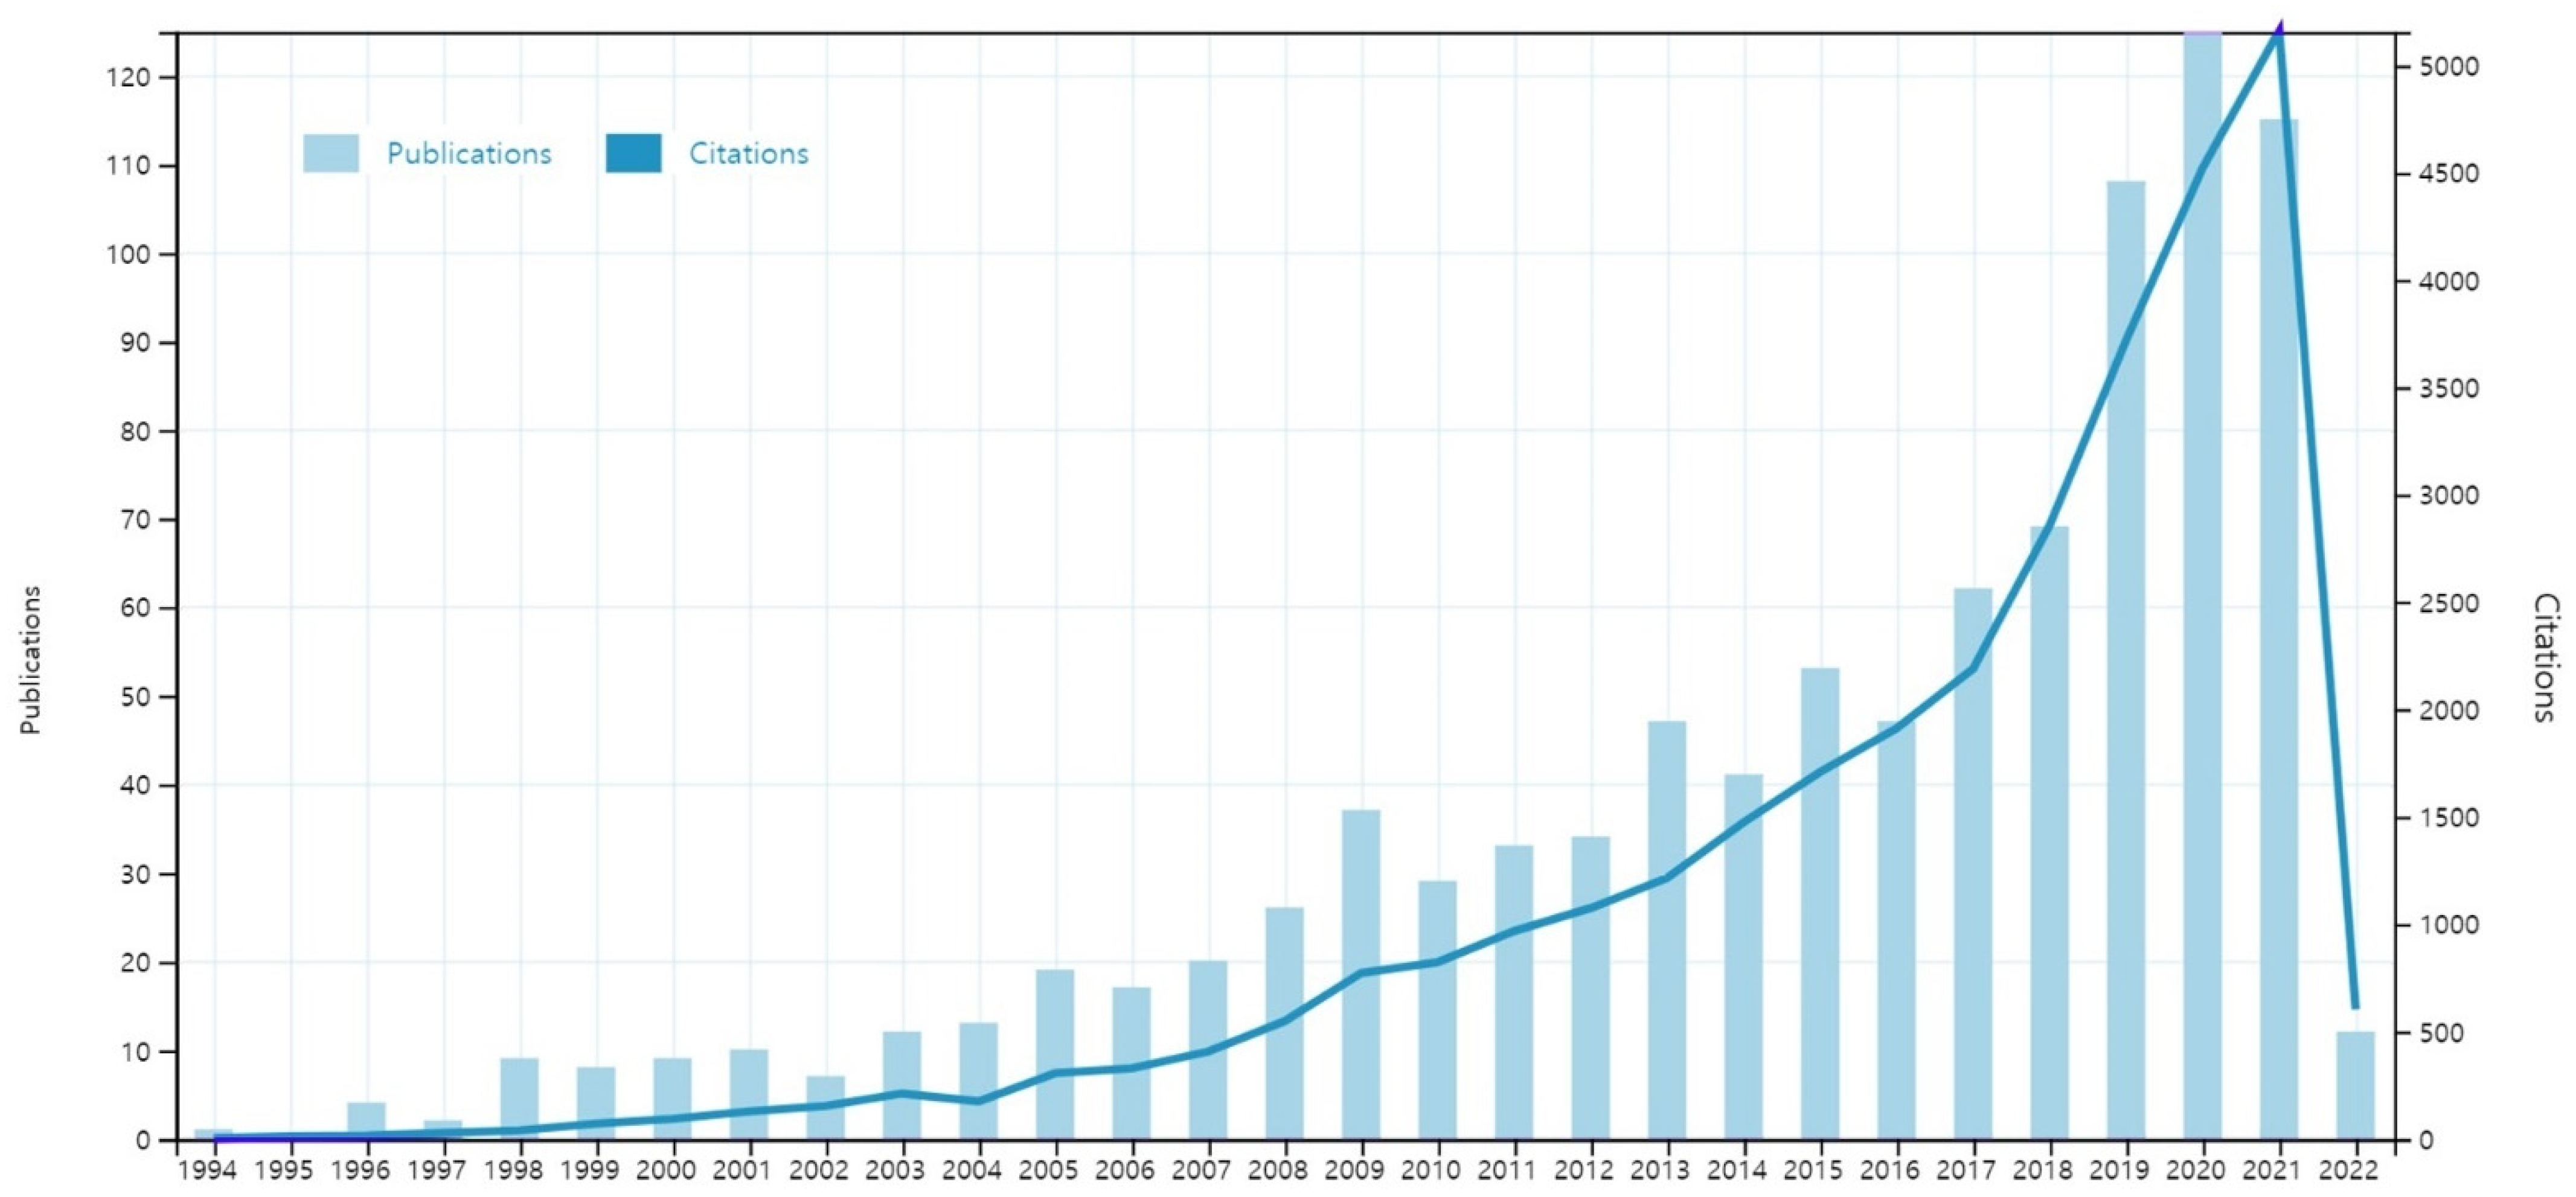
3.1.1. Publications and Citations throughout the Years

It is clear in the data that the concept of integrating embodied experience with VE is gaining momentum as it creates innovative human–VE interaction processes. Figure 1 shows the number of publications and citations by year, demonstrating growth in this field since 1994. Over the past three decades (1994–2022), the number of publications and citations related to embodied experience-integrated VE has increased more than 120 times. Although between 1998 and 2016 the number of publications shows a moderate increase, remarkable growth is observed subsequently.
In particular, the data indicate that from 2013 to 2021, the number of publications and citations increases considerably. Of particular interest is that seminal papers—in terms of number of citations—were published in 1994, 1998, 2001, 2007, 2009, and 2012, corresponding to the inflection points of publications in the ‘embodied experience in virtual environment’ literature.
The rapid decrease in publications between 2021 and 2022 is due to incomplete bibliographic data records. The increasing trend in research in this area will probably continue in the future. Hence, this bibliometric analysis is expected to gain more insights into research directions in this domain.

3.1.2. Most Influential Publications

Table 2 lists the top 10 most-cited articles on embodied experience-integrated VE in WoS over the period 1994–2020. This result shows the papers that are the most influential on the topic of this study. It is noted that the studies with the largest numbers of citations are mostly from 1994 to 2012. The most cited article has 2302 citations: “Measuring Presence in Virtual Environments: A Presence Questionnaire” written by Witmer and Singer [37]. In second place is “Adaptive Representation of Dynamics during Learning of a Motor Task” written by Shadmehr and Mussa-Ivaldi [38], cited 1678 times. In third place is “The Proteus Effect: The Effect of Transformed Self-representation on Behavior” written by Yee and Bailenson [39], with 642 citations.
The difference between second and third place is the largest observed, at more than 2.5 times more citations, and the paper in first place is cited 40% more than that in second place. The difference between first and third place is more than 3.5 times. From the third- to the tenth-ranked paper, citations only moderately decrease. Therefore, the first and second most cited articles published in the early years in this domain of research are still considered seminal publications in this research area.
In the next step, the main research areas of studies in this domain are identified, together with journals, research areas, authors, affiliations, and countries making the most prolific contributions to the literature.

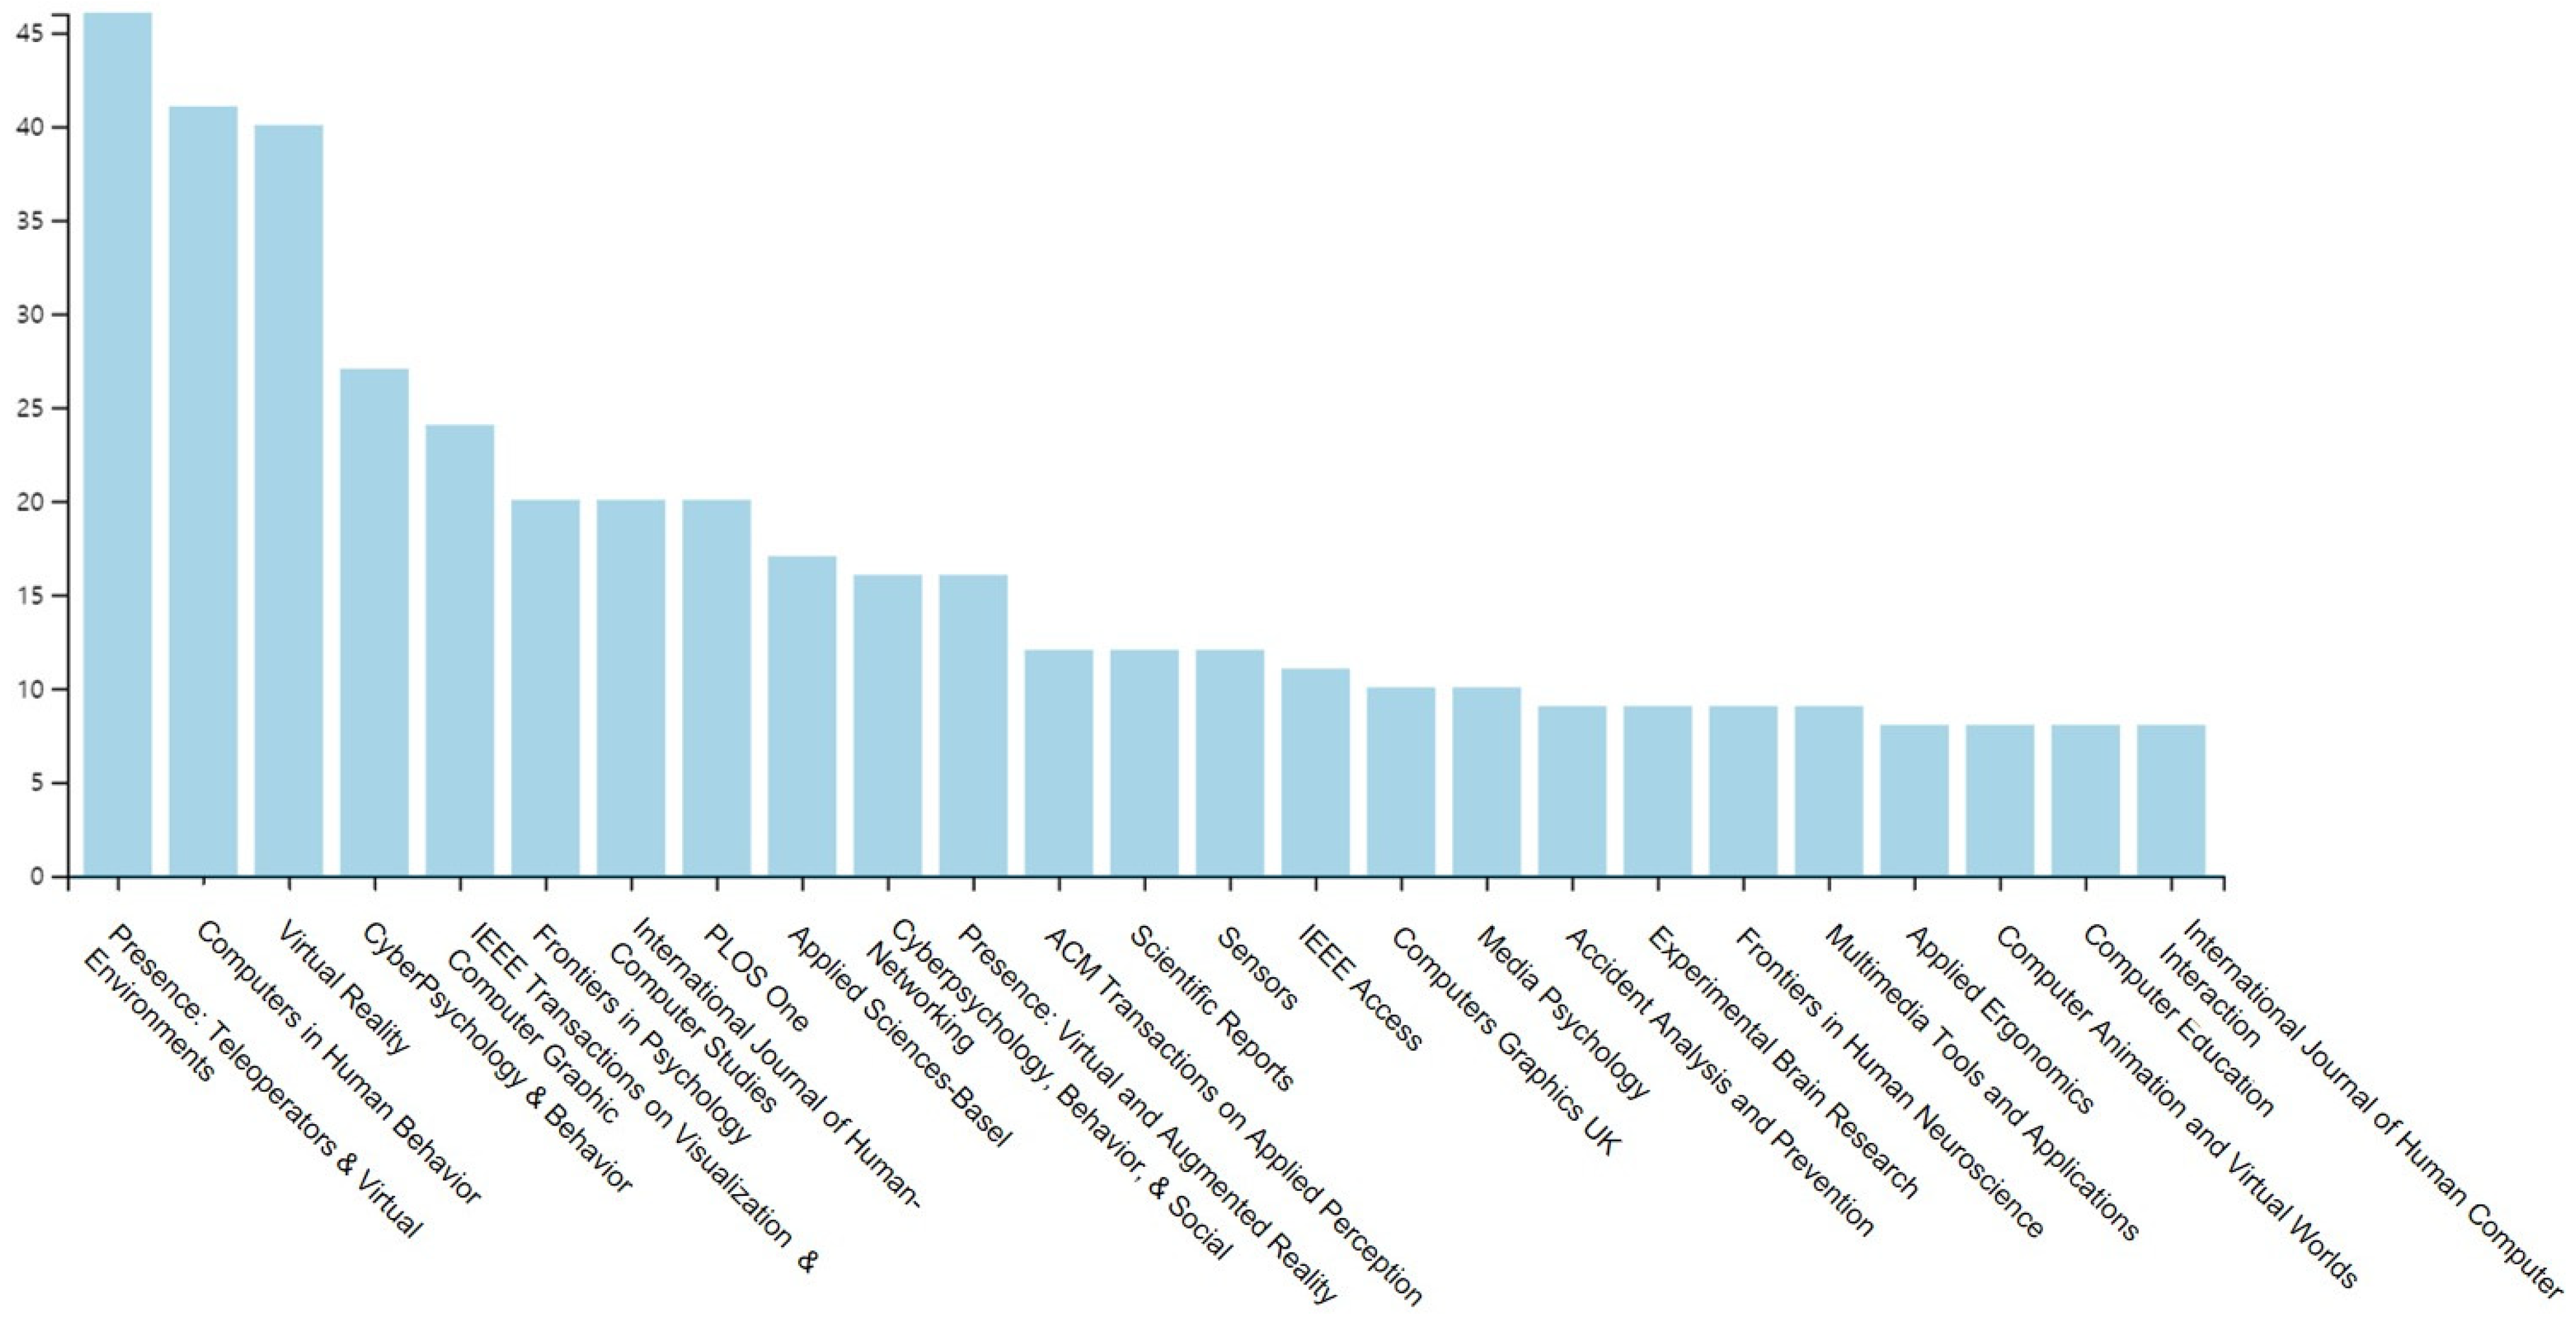
3.1.3. Most Prolific Journals

A total of 372 journals from the WoS search contribute to the embodied experience in VEs. As shown in Figure 2 and Table 3, almost 15% of the 969 selected papers come from the top three journals: Presence: Teleoperators and Virtual Environments (4.75%), Computers in Human Behavior (4.23%), and Virtual Reality (4.13%). Presence: Teleoperators and Virtual Environments is the first academic journal to be devoted to research into teleoperation and VEs; it was renamed PRESENCE: Virtual and Augmented Reality in 2017 (https://direct.mit.edu/pvar (accessed on 8 April 2022)). The 16 articles from the newly named journal can thus be added to the tally for Presence: Teleoperators and Virtual Environments, raising its contribution to 62 (6.39%).

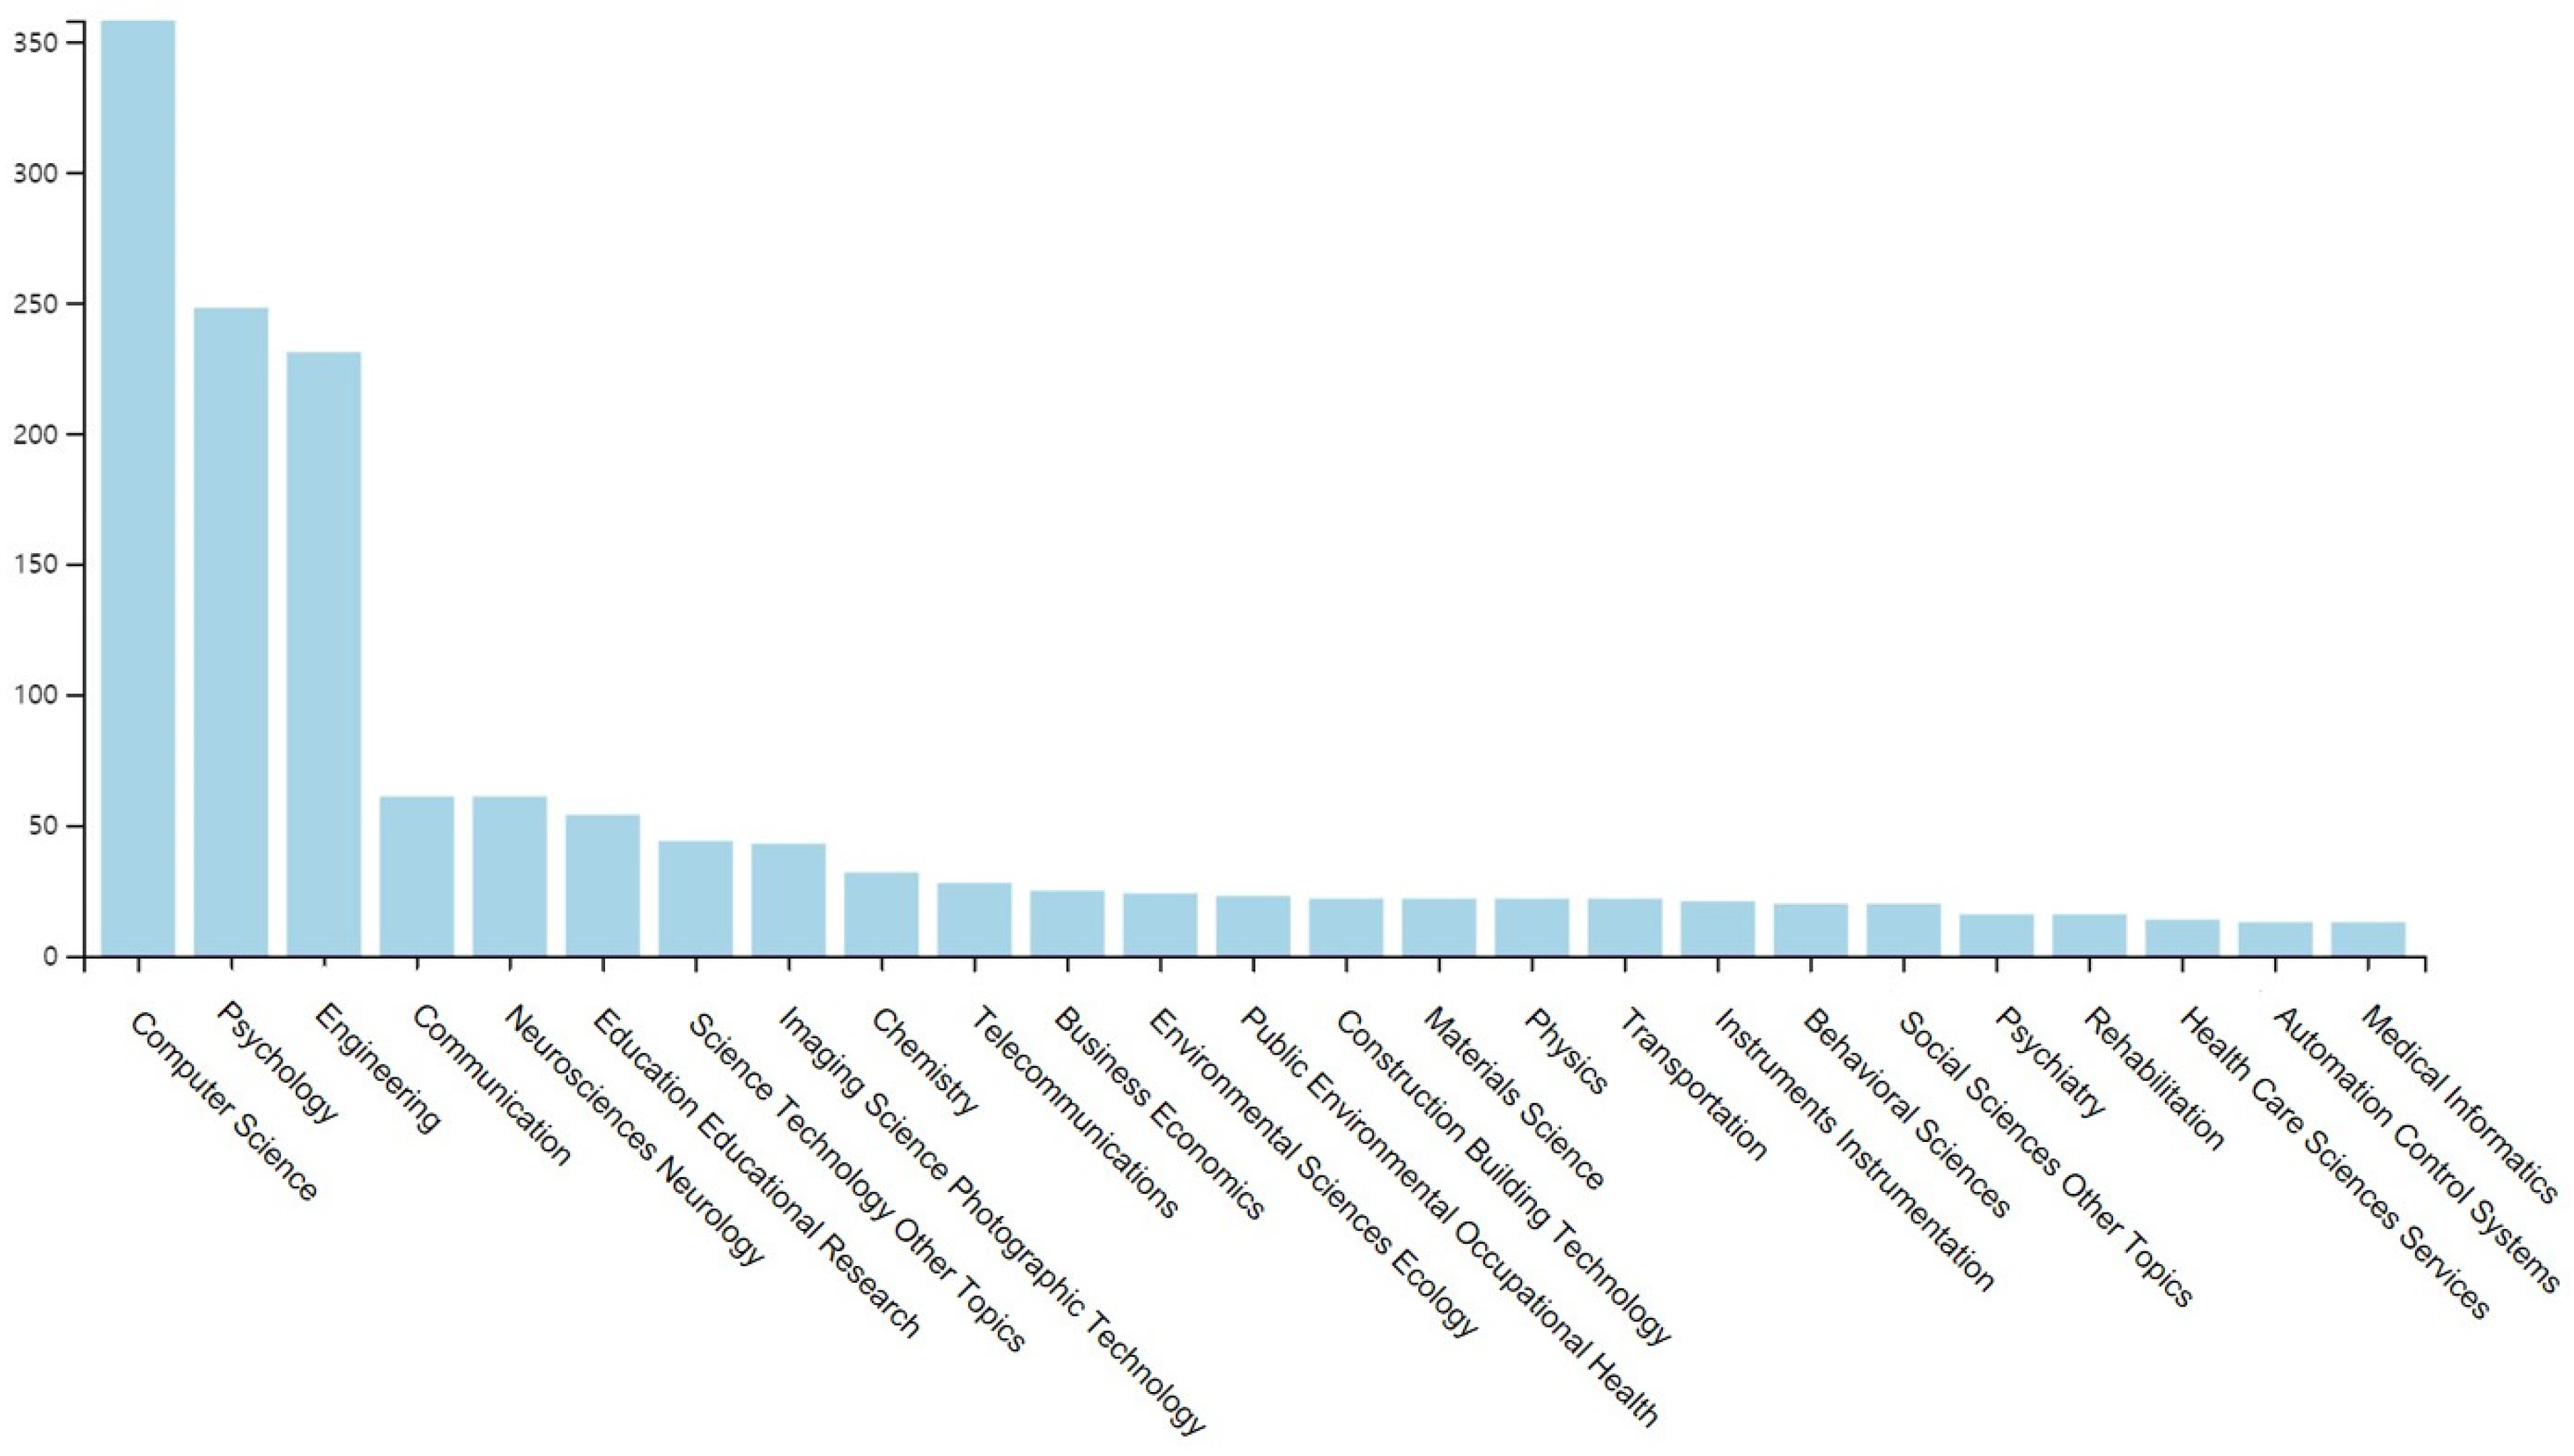
3.1.4. Most Prolific Research Areas

The selected papers on the embodied experience in VEs represent 92 diverse research areas in the WoS database. As shown in Figure 3 and Table 4, over 86% of the selected papers come from the top three research areas, namely computer science (36.94%), psychology (25.59%), and engineering (23.83%). The three research areas are classified in different categories but all focus on the virtual embodied experience.

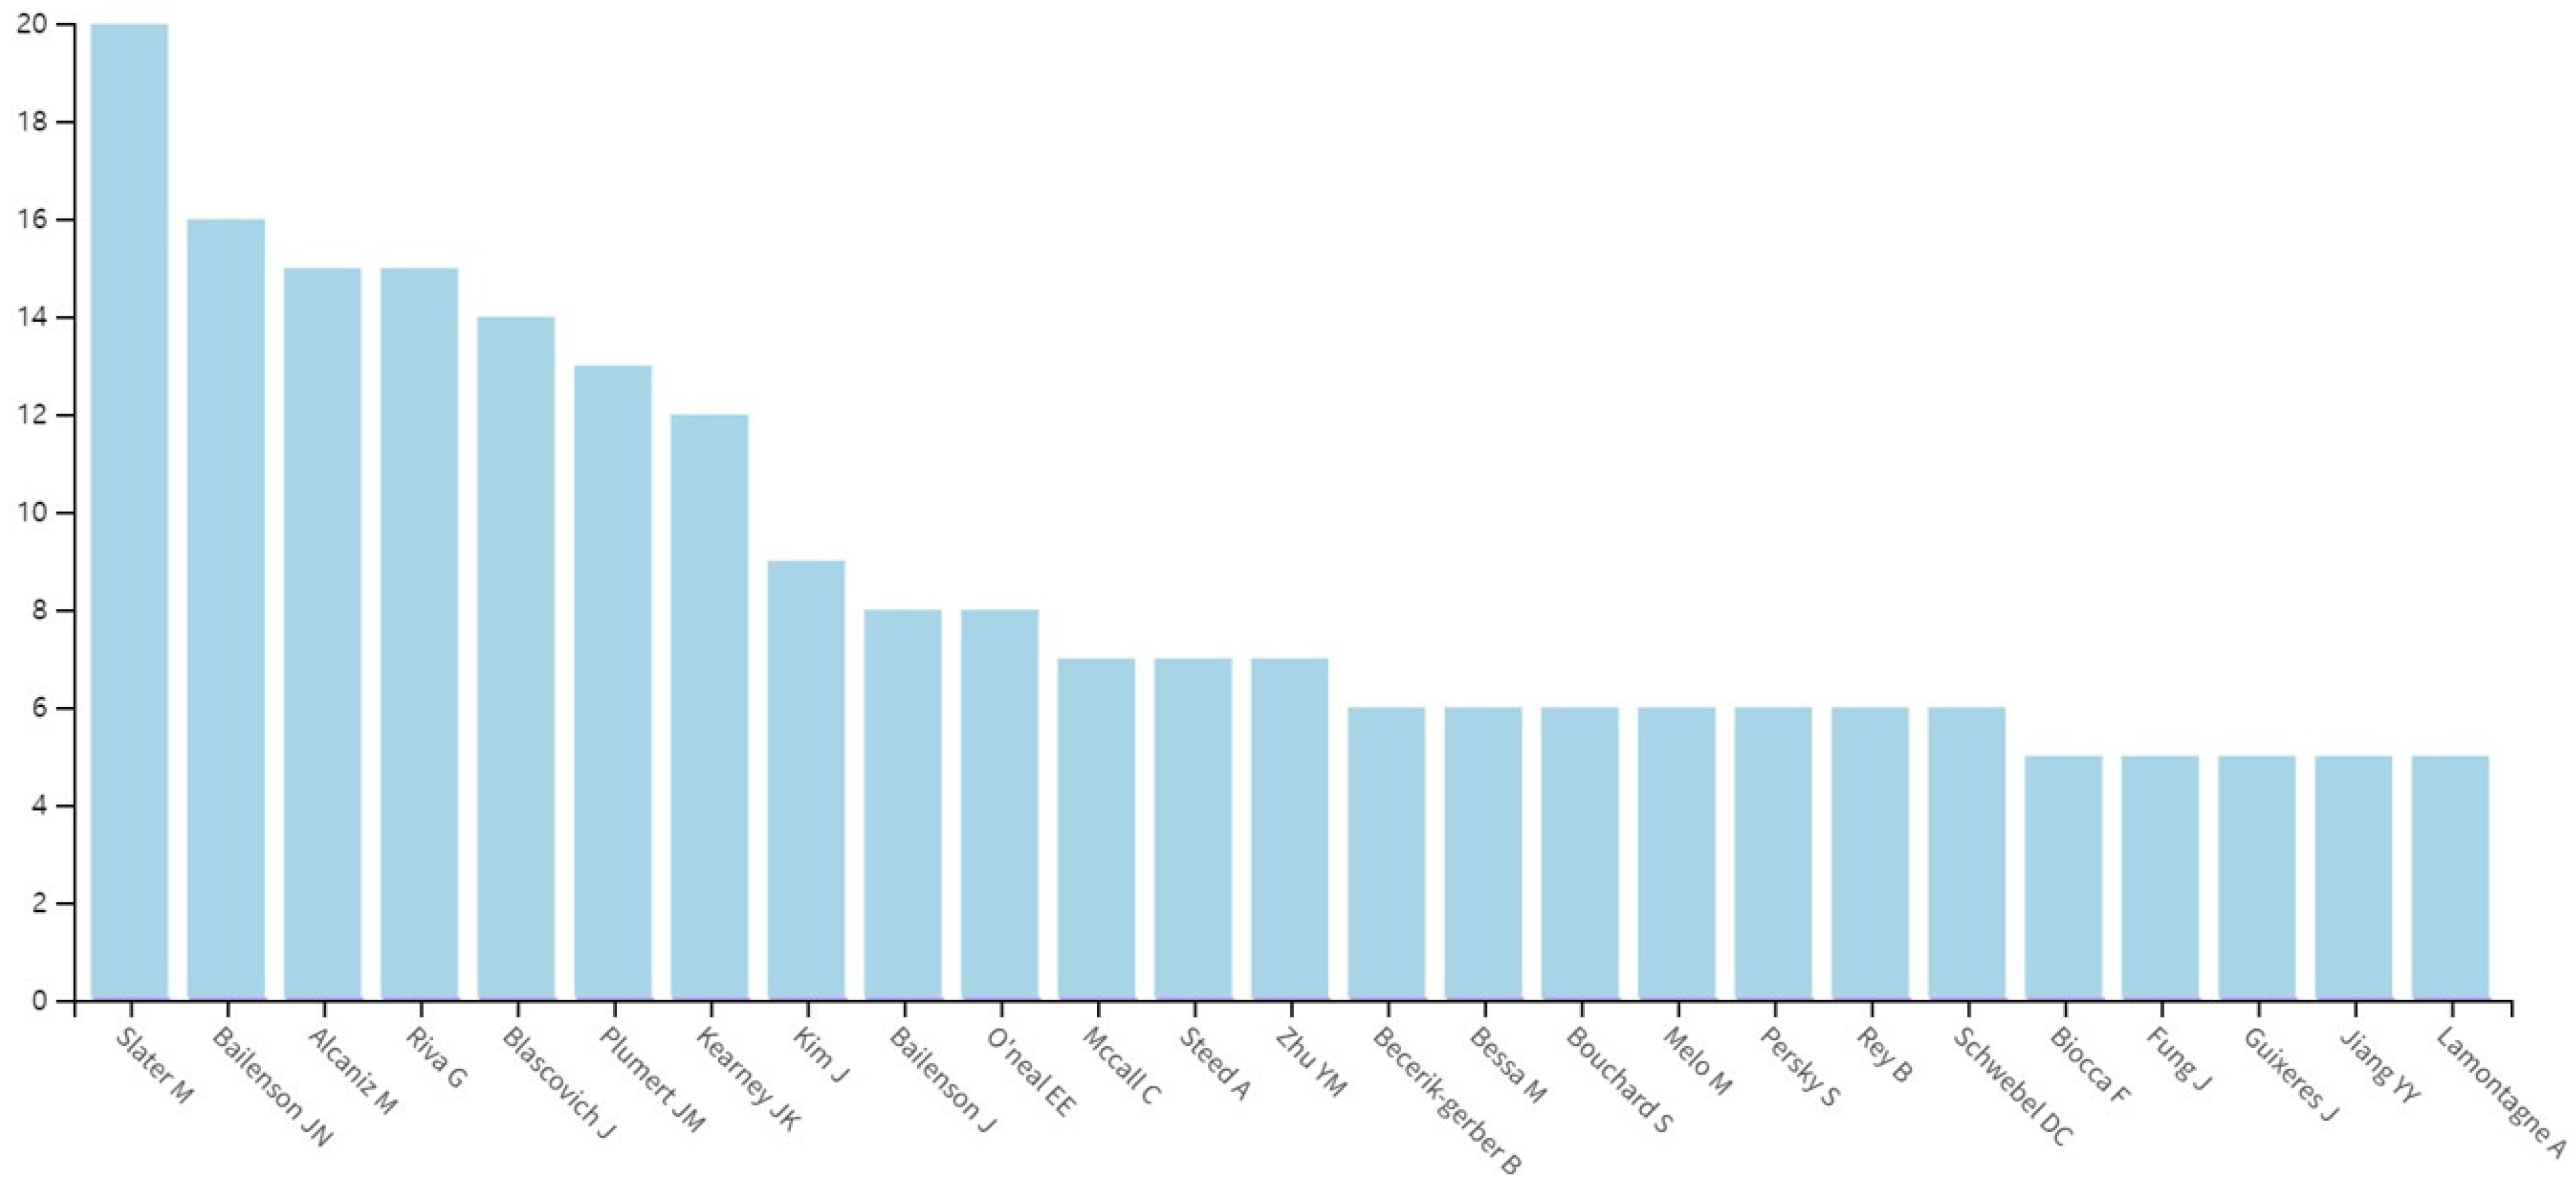
3.1.5. Most Prolific Authors

The top three most prolific authors with the most frequent contributions to the literature on the embodied experience in VEs among the 3062 authors—with 966 publications—are Mel Slater with 20 publications; JN Bailenson (16 publications), M Alcaniz (15 publications), and G Riva (15 publications). There is a 25% difference between the first-placed Slater and the second-placed Bailenson; others show only one publication difference (see Figure 4 and Table 5).
The top 10 authors’ departments range from psychology, communication, biomedical engineering, brain science, and computer science, to computer engineering. The affiliations and regions of the top 10 authors also vary, and include University of Barcelona and Polytechnic University of Valencia in Spain; Stanford University, University of California Santa Barbara, and University of Iowa in the United States of America (USA); Catholic University of Sacred heart in Italy; and Hansung University in South Korea. Among the top 10 authors, most are affiliated with the University of Iowa and their region is the USA. Researchers from the University of Iowa appear three times with 32 publications; and those from Stanford University, twice with 25 publications. The productivity of authors on the overall selected studies is shown in Table 5.

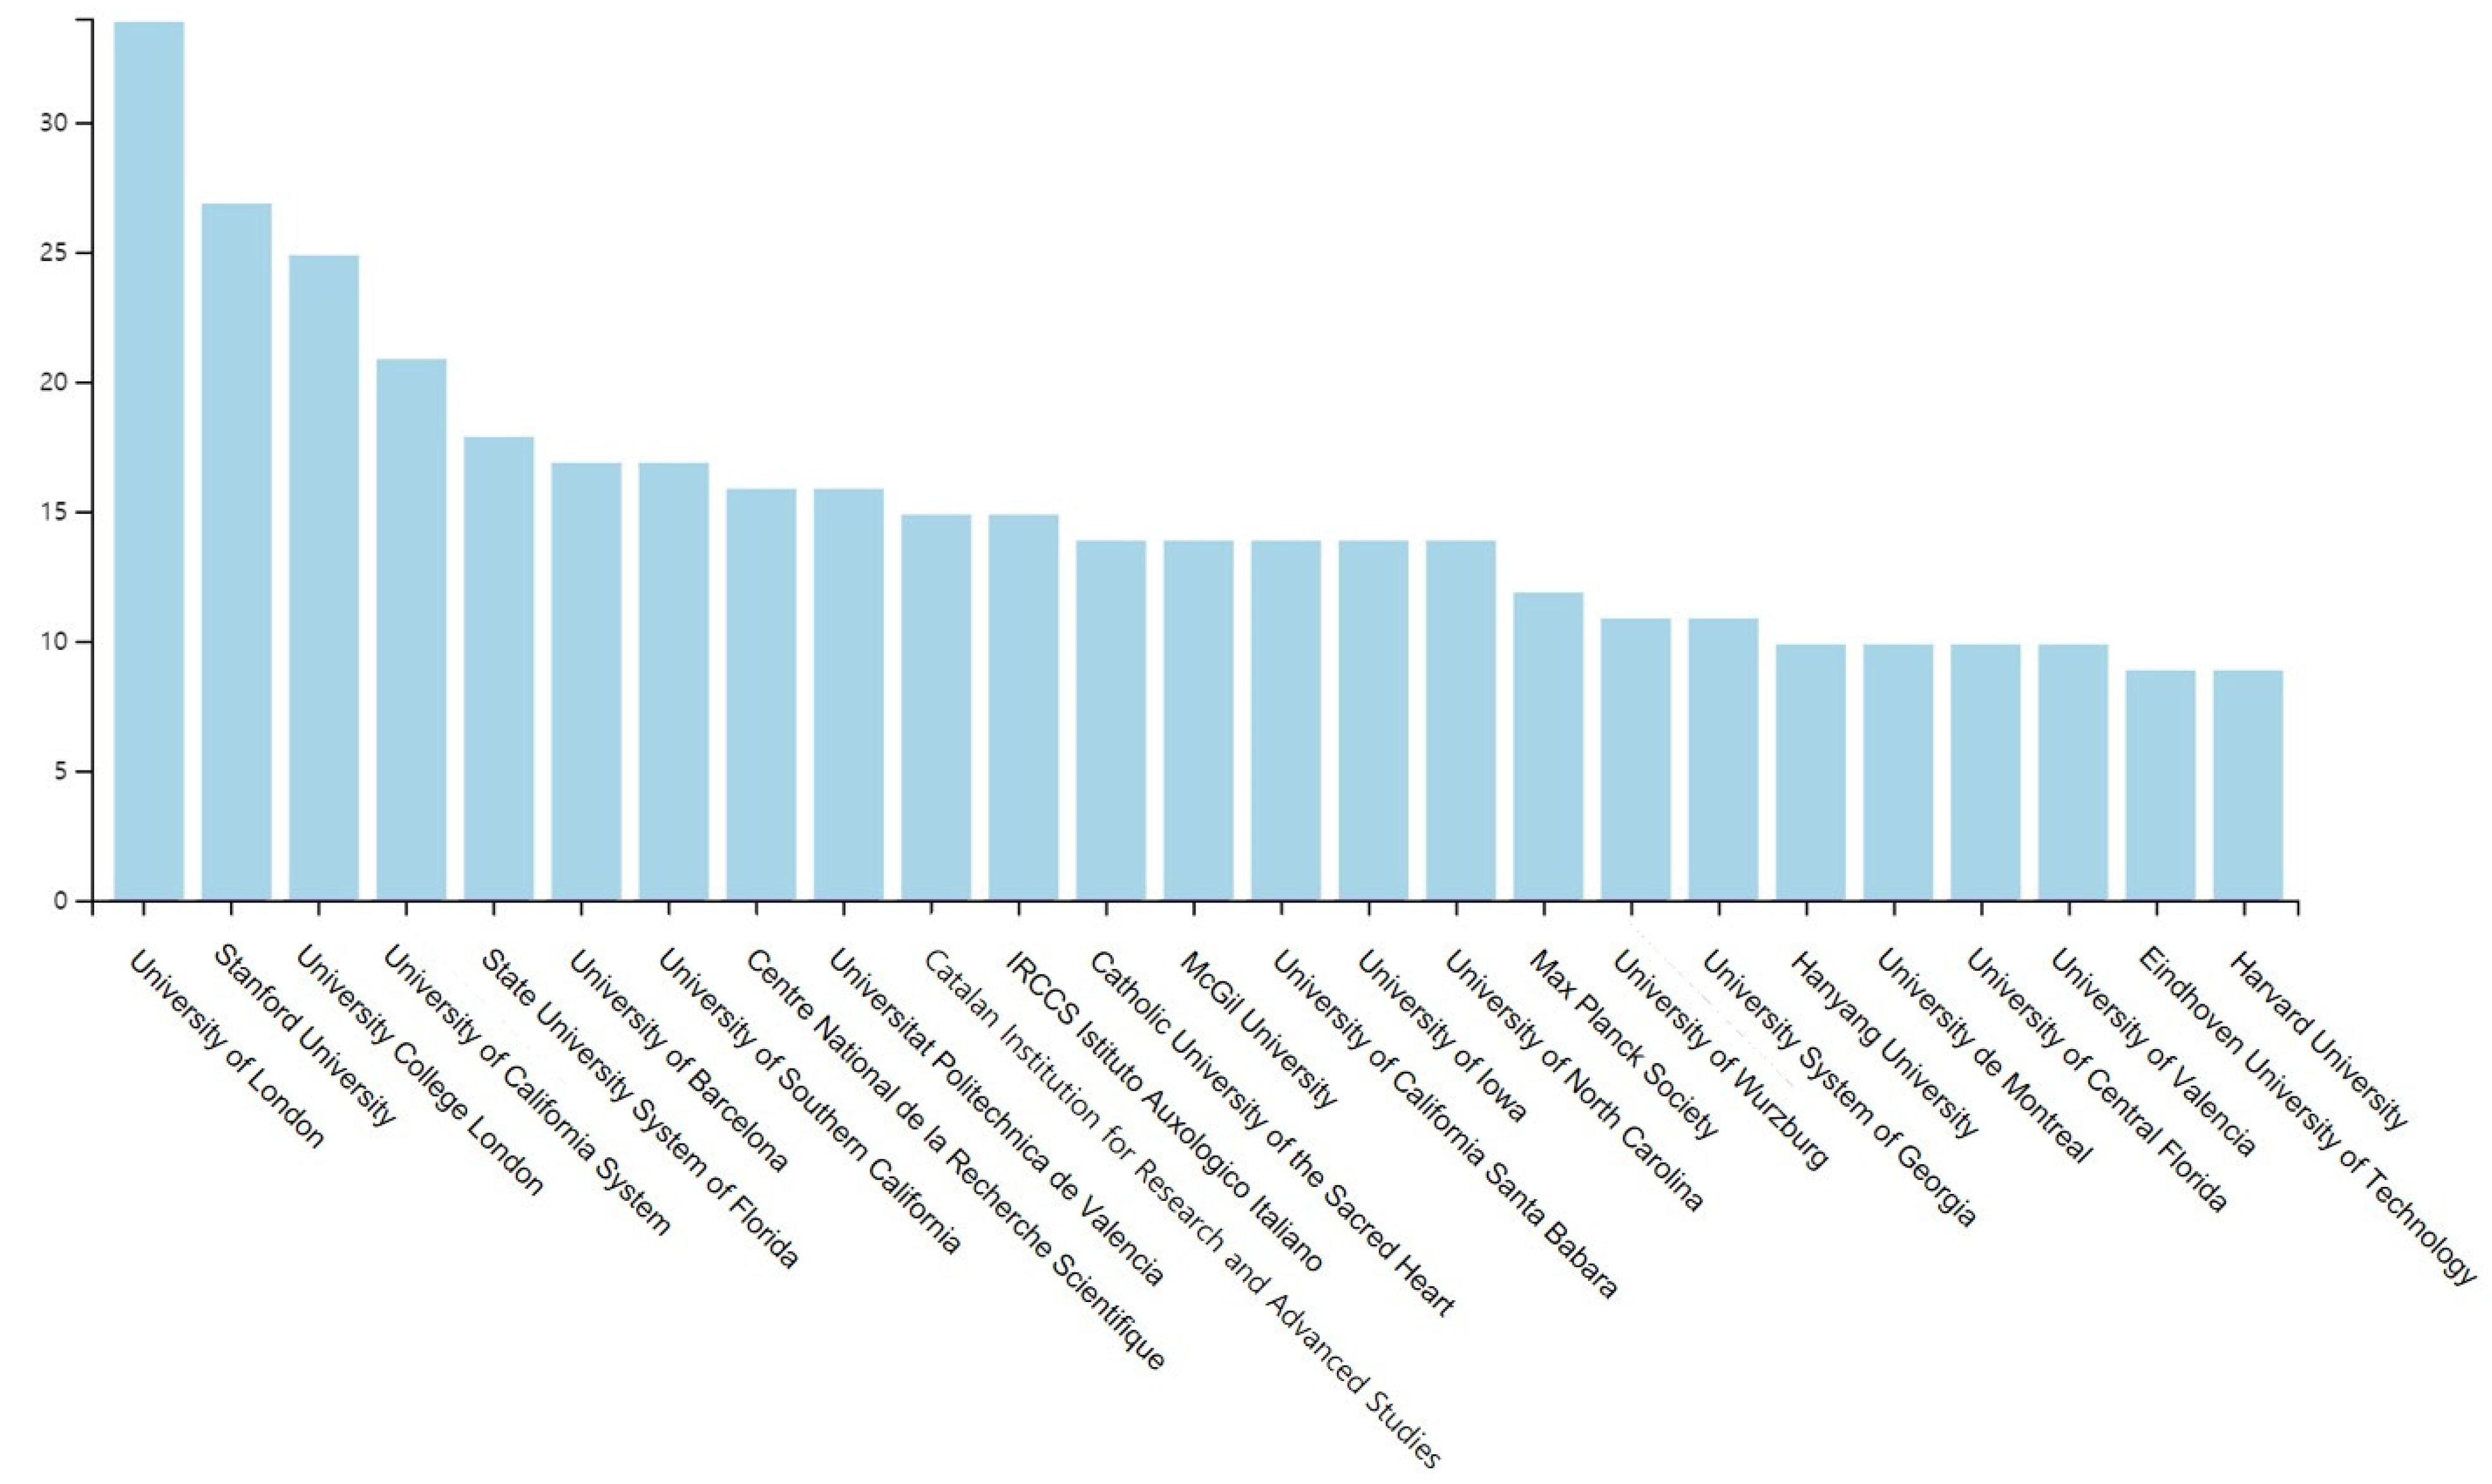
3.1.6. Most Prolific Affiliations

Overall, the selected papers are published by authors from 1132 affiliations across the world. University of London in the United Kingdom (UK) is ranked first among the most prolific affiliations on the embodied experience in VEs (see Figure 5). The top three most prolific affiliations with the most frequent contributions in the WoS are University of London, UK with 34 publications; Stanford University, USA with 27 publications; and University College London, UK with 25 publications, as listed in Table 6.

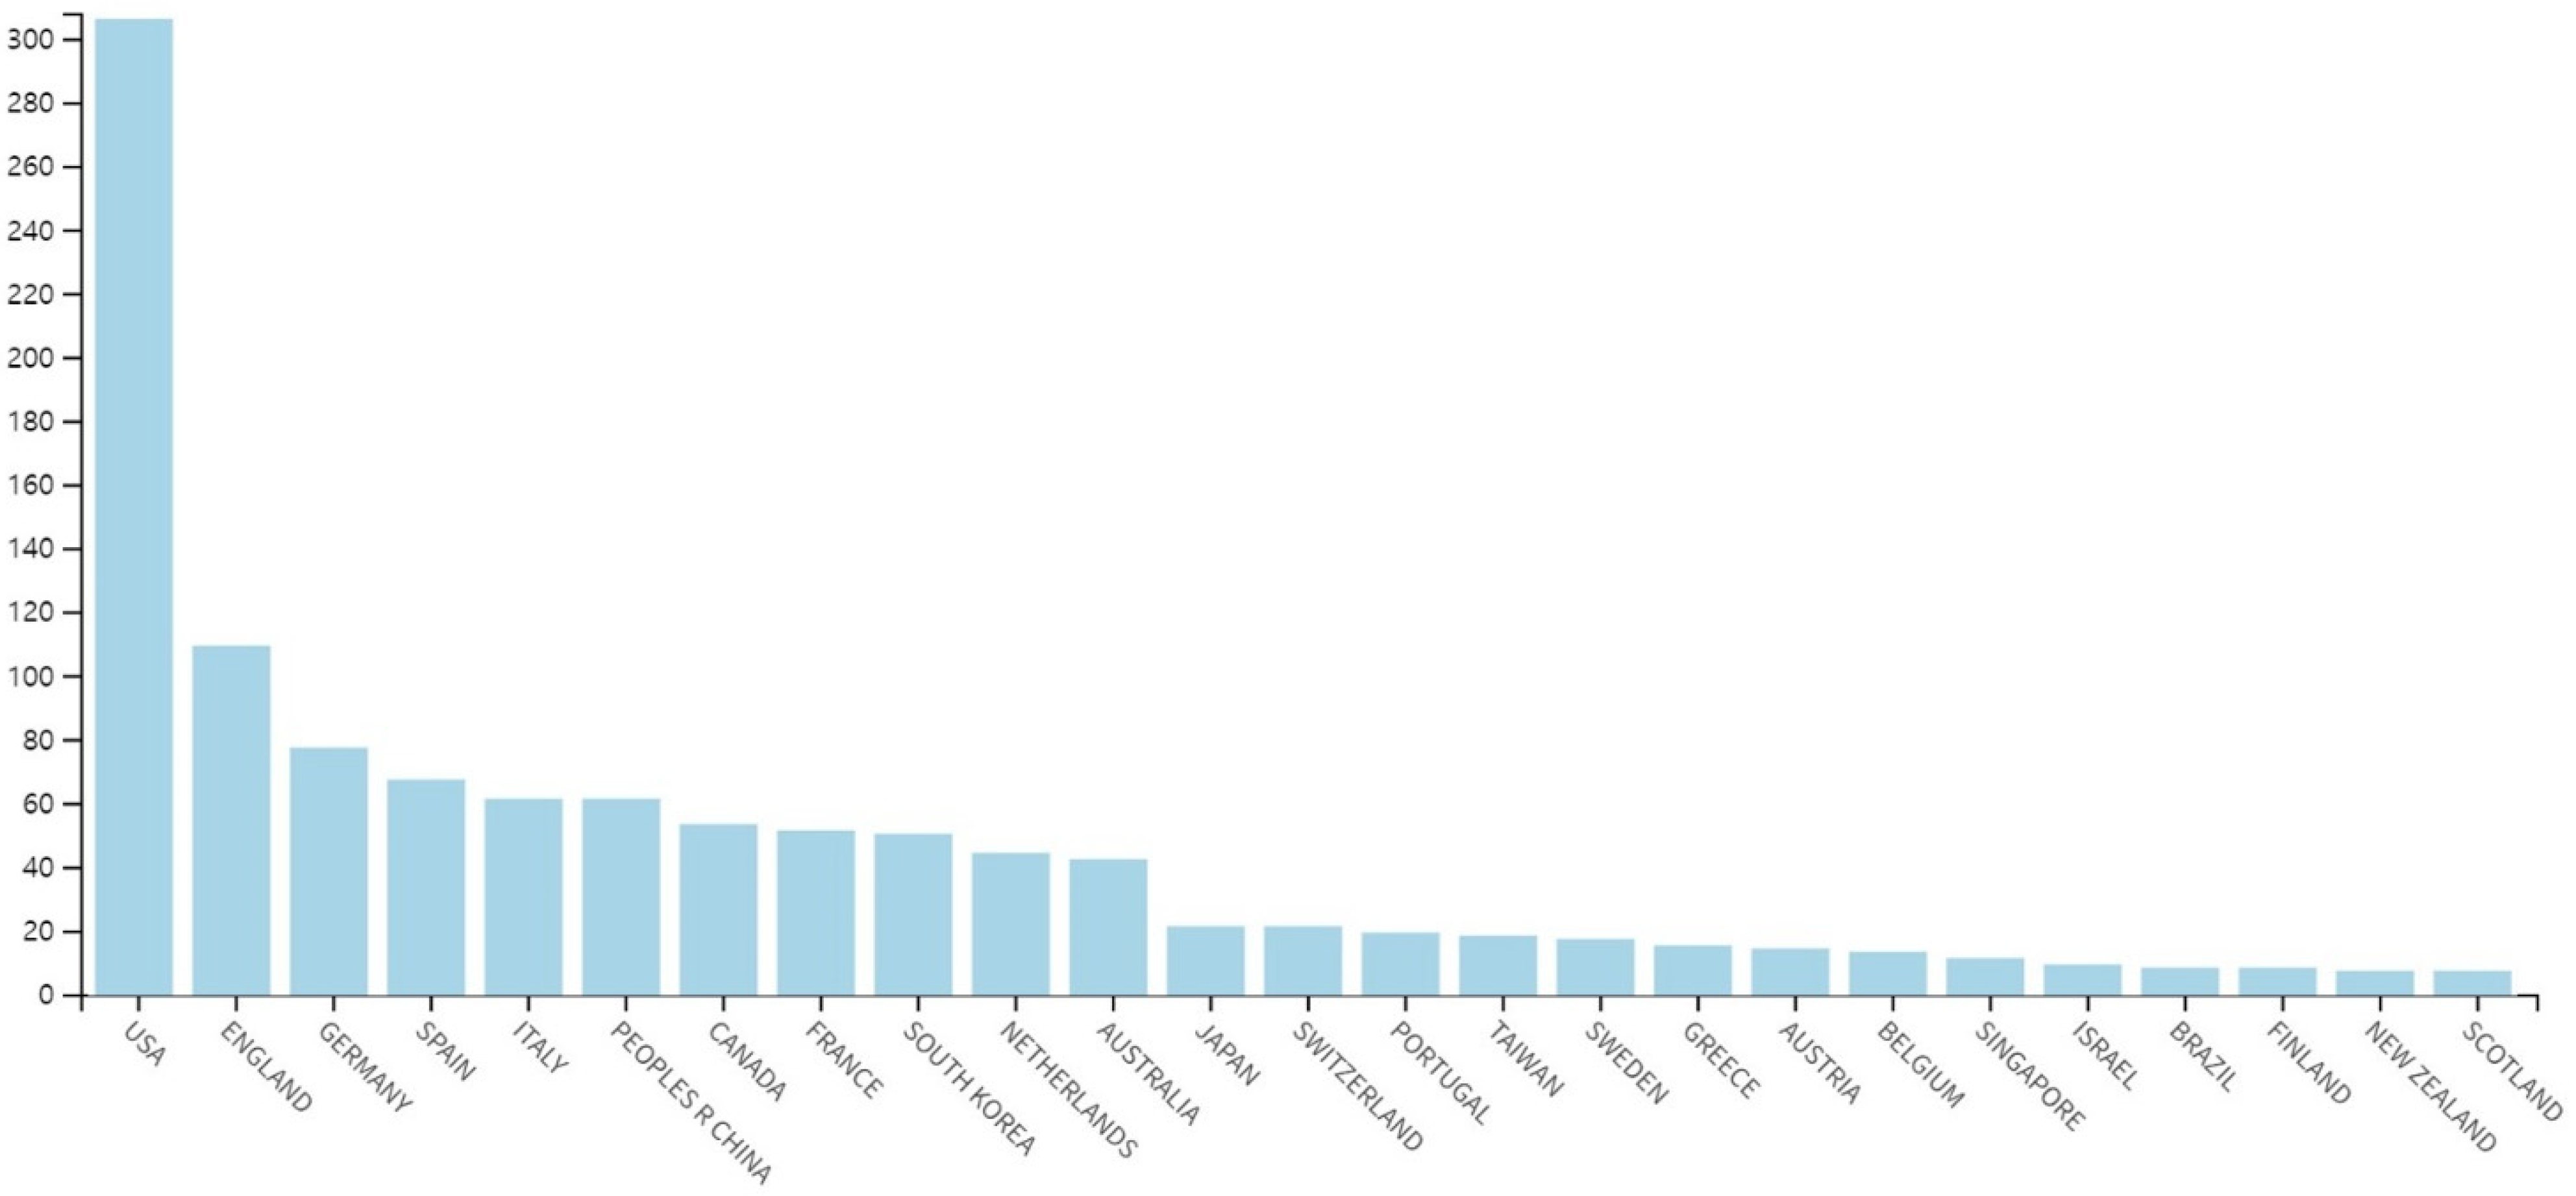
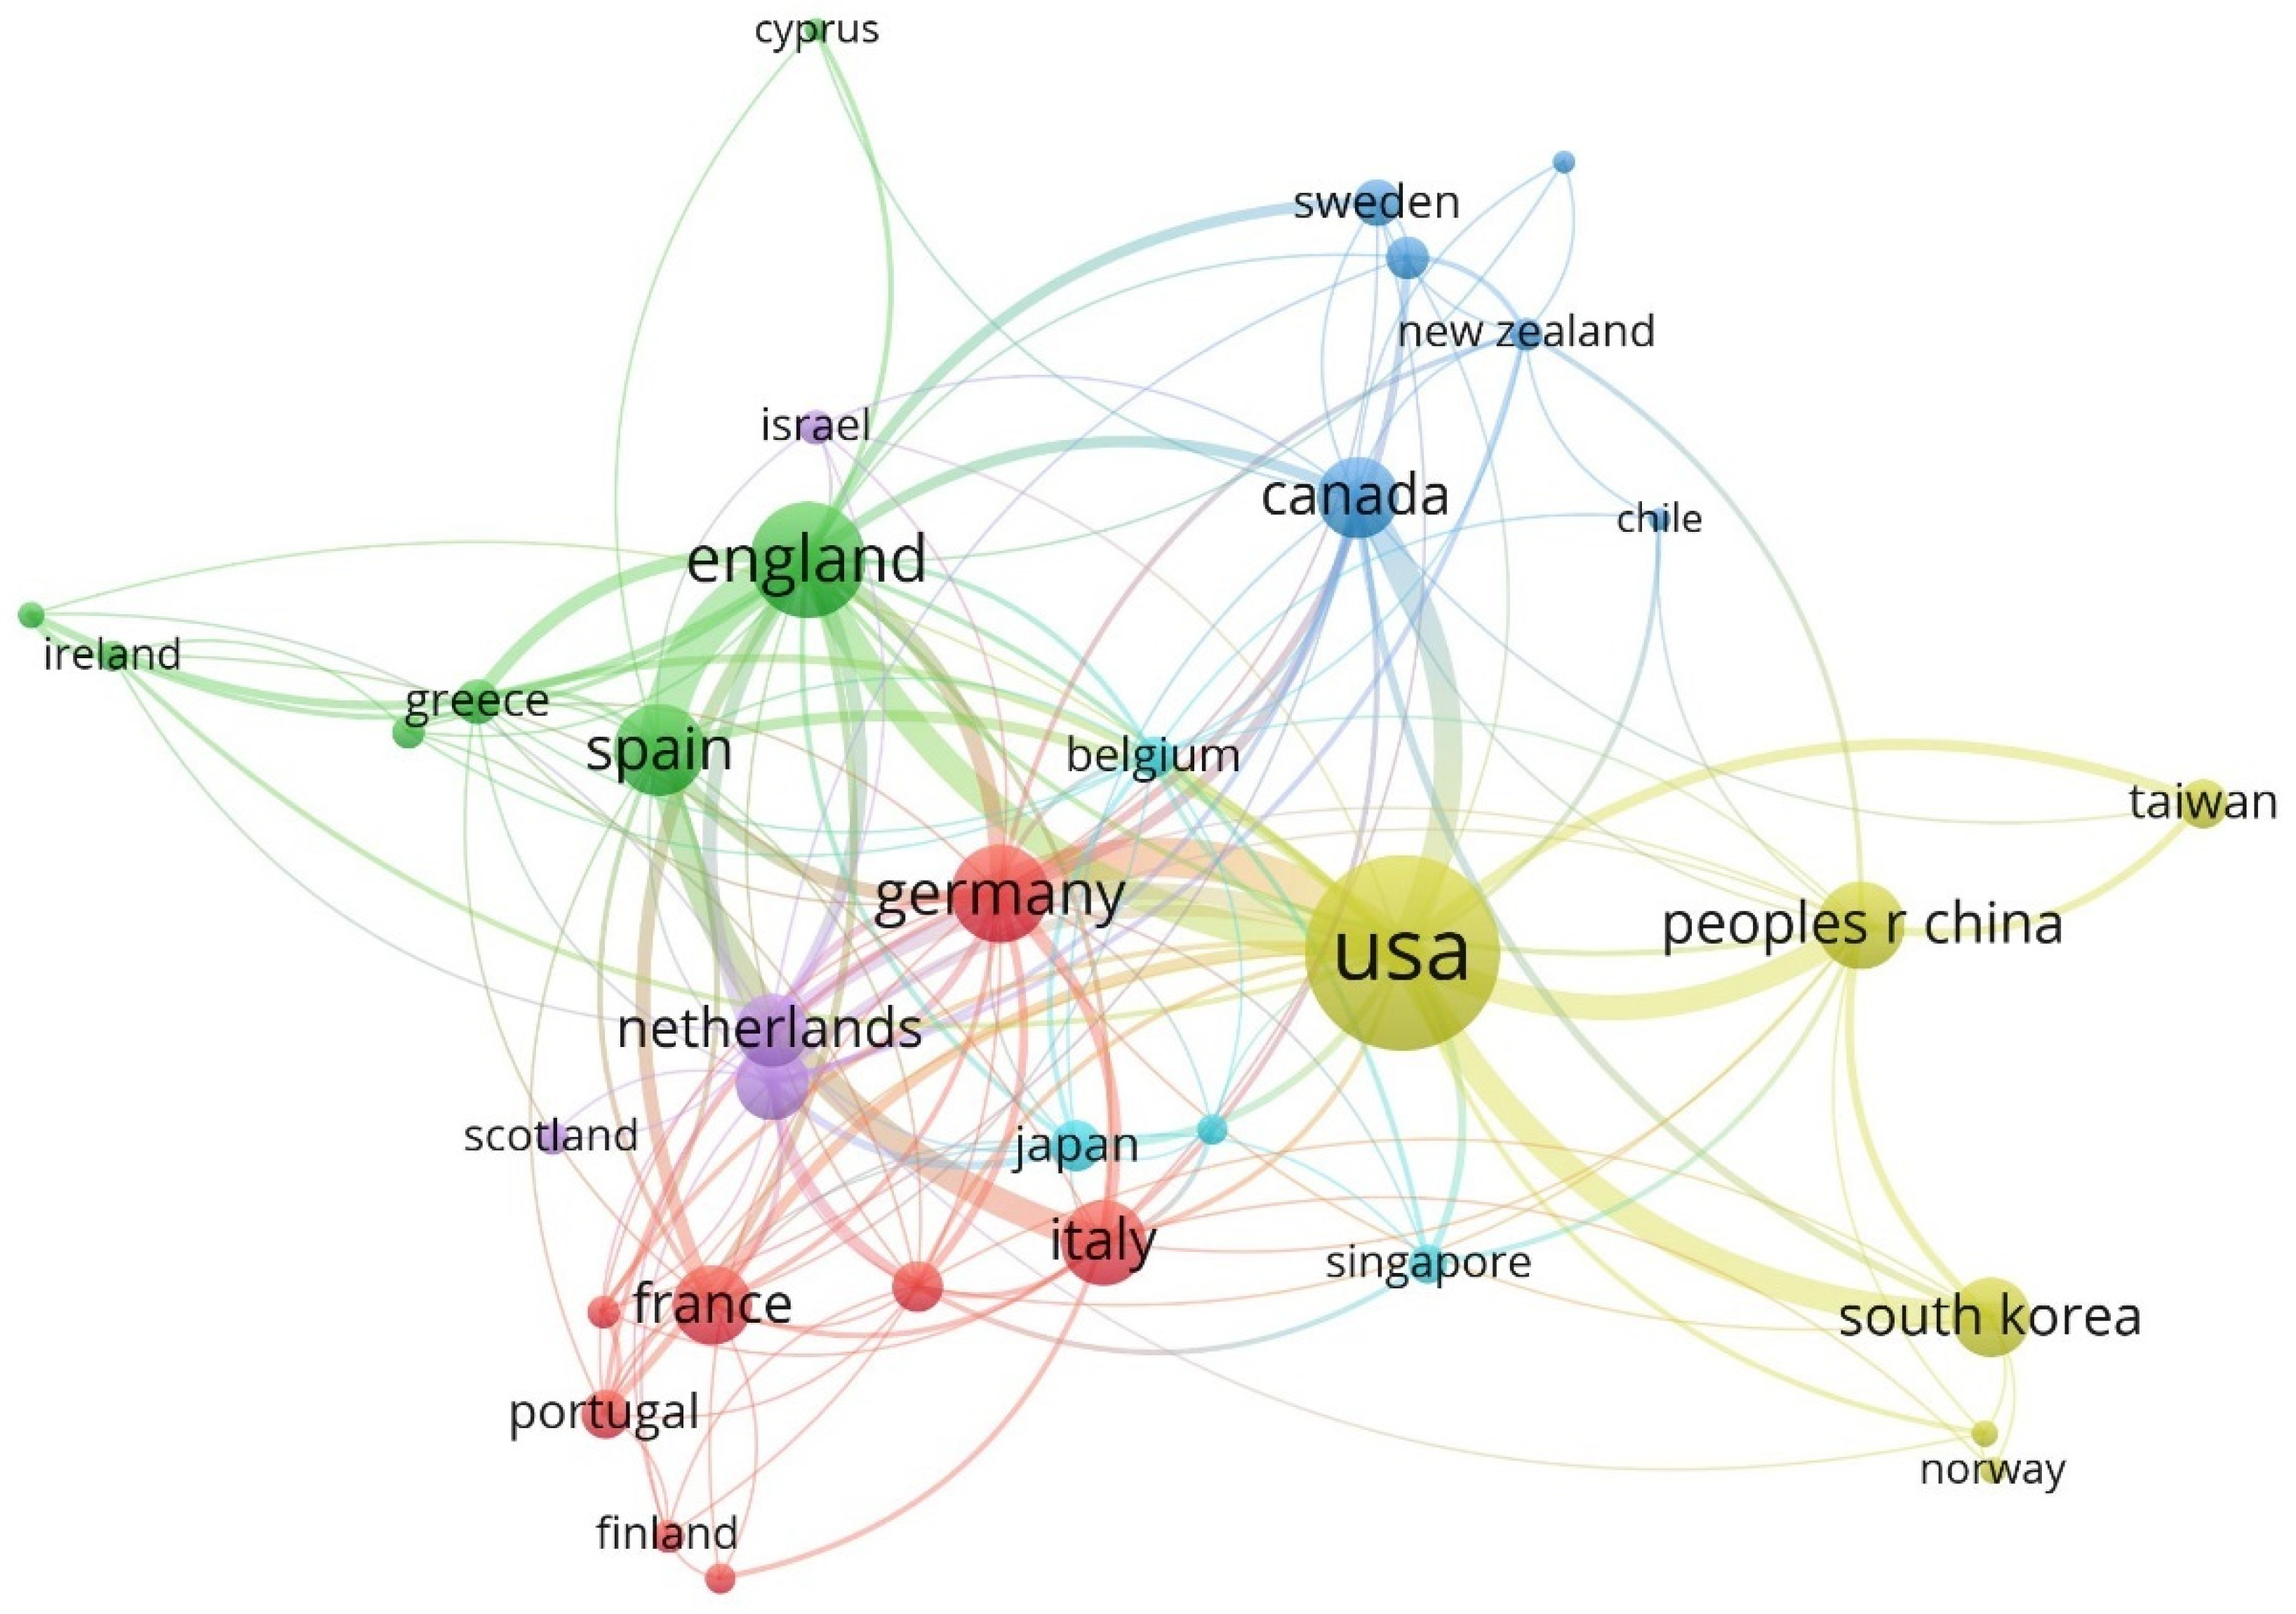
3.1.7. Prolific Countries

Overall, the selected papers are published by authors from 61 countries, 49 of which have at least two papers each. The countries with nine or more relevant publications are shown in Figure 6. The top 10 most prolific countries are listed in Table 7.
The most productive countries in the domain are the USA (31.78%), England (11.45%), and Germany (8.15%).

3.2. Science Mapping

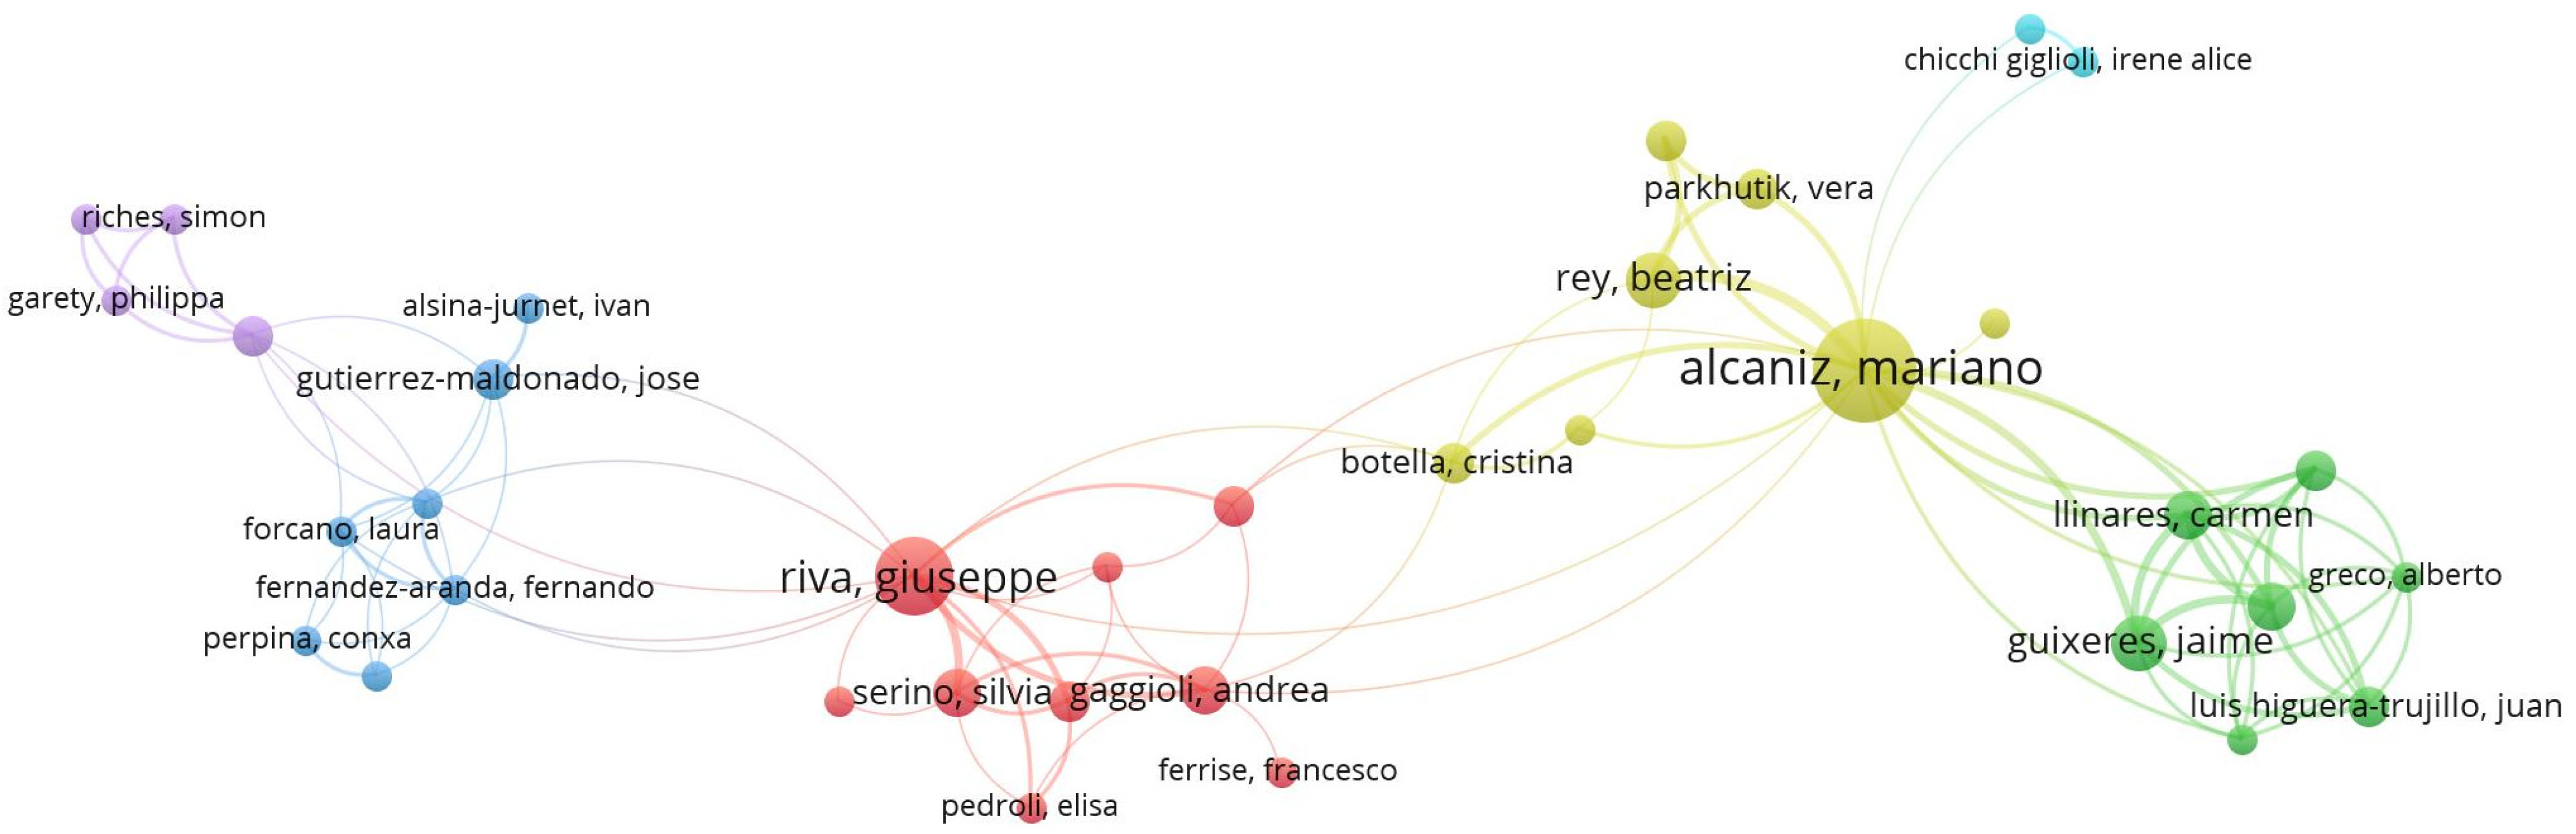
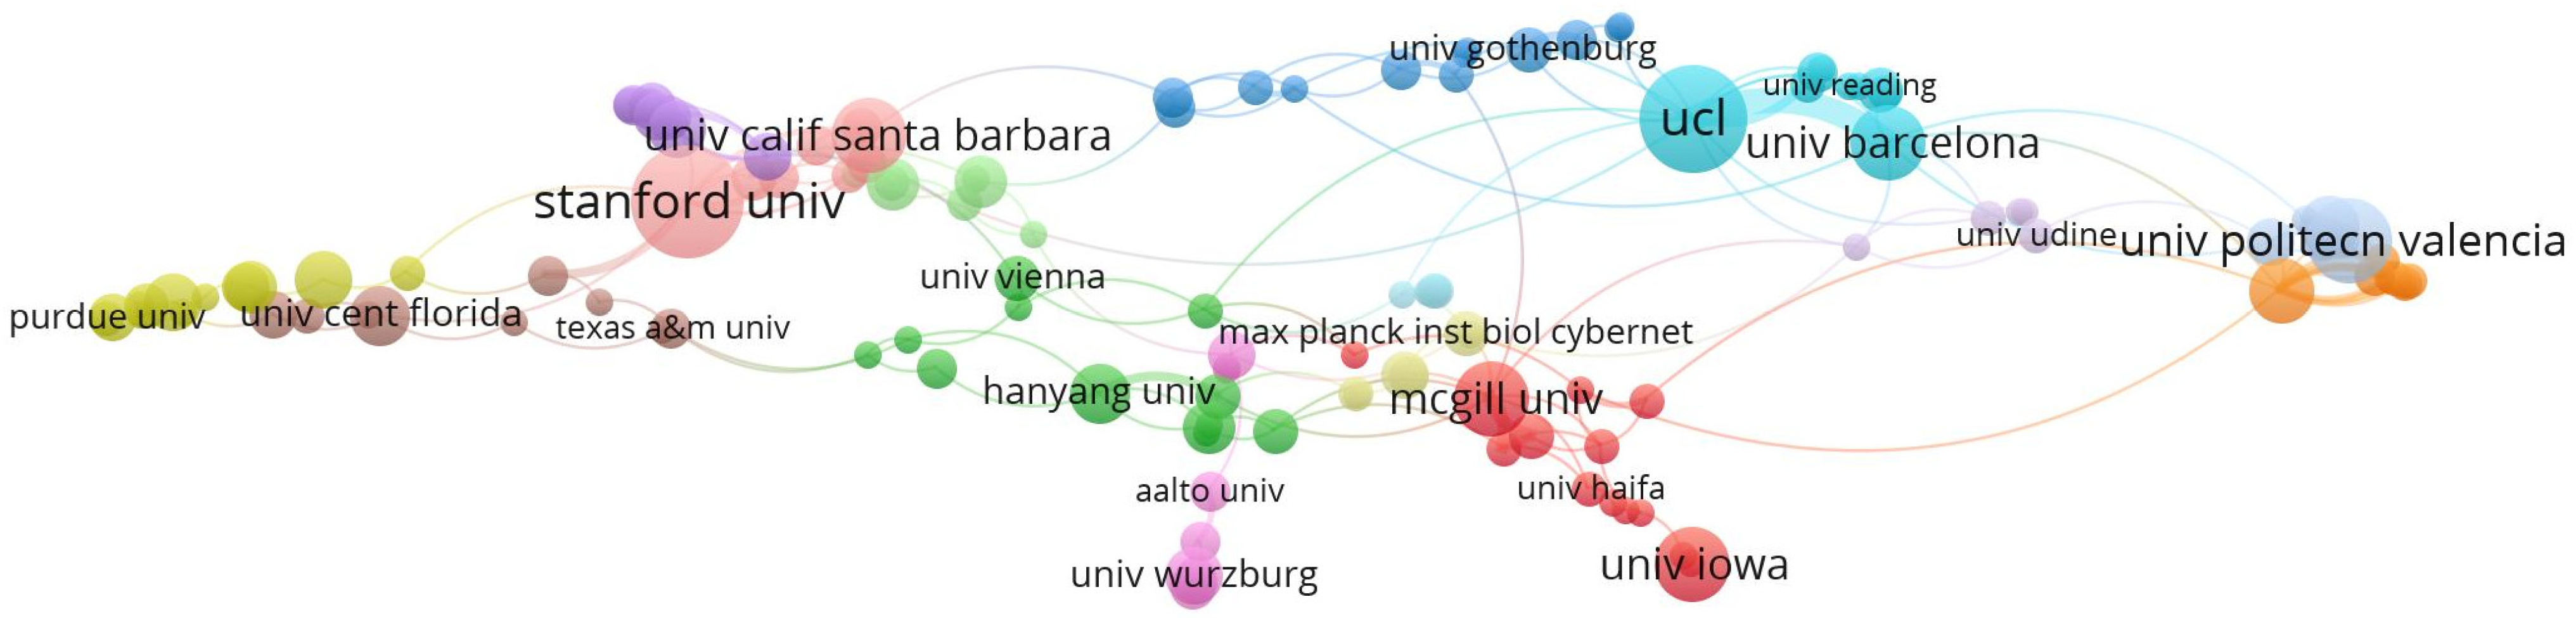
3.2.1. Intellectual Collaboration Networks among Authors, Affiliations, and Countries

Co-authorship analysis is employed to identify the intellectual collaboration structure of authors, affiliations, and countries. These relationships are presented in a network map, where nodes represent actors, and links connecting the nodes represent relationships. The size of a node represents the number of citations. The collaboration strength is demonstrated by the thickness of the lines linking the nodes. Different color circles are assigned to individual collaboration groups.
(1)
Author
The threshold in the bibliometric data is set as a minimum of two documents per author. Of the 3213 authors, 332 are selected on this basis; however, only 36 of these meet this threshold to create the collaboration network map shown in Figure 7. 6 in which clusters of 36 authors are identified.
The network map shows that authors among the most prolific, such as M Alcaniz, G Riva, and JM Plumert have well-established collaboration networks.
(2)
Affiliation
The threshold in the bibliometric data is set as a minimum of three papers for an author. Among the 1116 organizations, 169 are selected; however, only 135 meet the threshold to create the co-authorship analysis map shown in Figure 8. Fifteen clusters are identified involving these 135 organizations.
Similar to the result for prolific affiliations, University College London, University Cattolica Sacro Cuore, McGill University, University of Barcelona, and Stanford University appear to have relatively extensive and strong relationships with other universities. The strongest relationship stands out as that between University College London and University of Barcelona.
(3)
Countries
The threshold of the bibliometric data is set as a minimum of five documents for a country. Of the 61 countries, 35 are selected (see Figure 9). Similar to the prolific country and affiliation collaboration networks, USA, England, Germany, and Spain are shown to have well-established collaboration networks. For example, USA occupies the central position with its strongest relationships with China and South Korea in the same color cluster. England has a strong relationship with Spain in its network.
The collaboration network map shows that global collaboration on the research topic has become more popular, and researchers tend to join cross-country collaborations despite differences in culture, language, and geographical location.

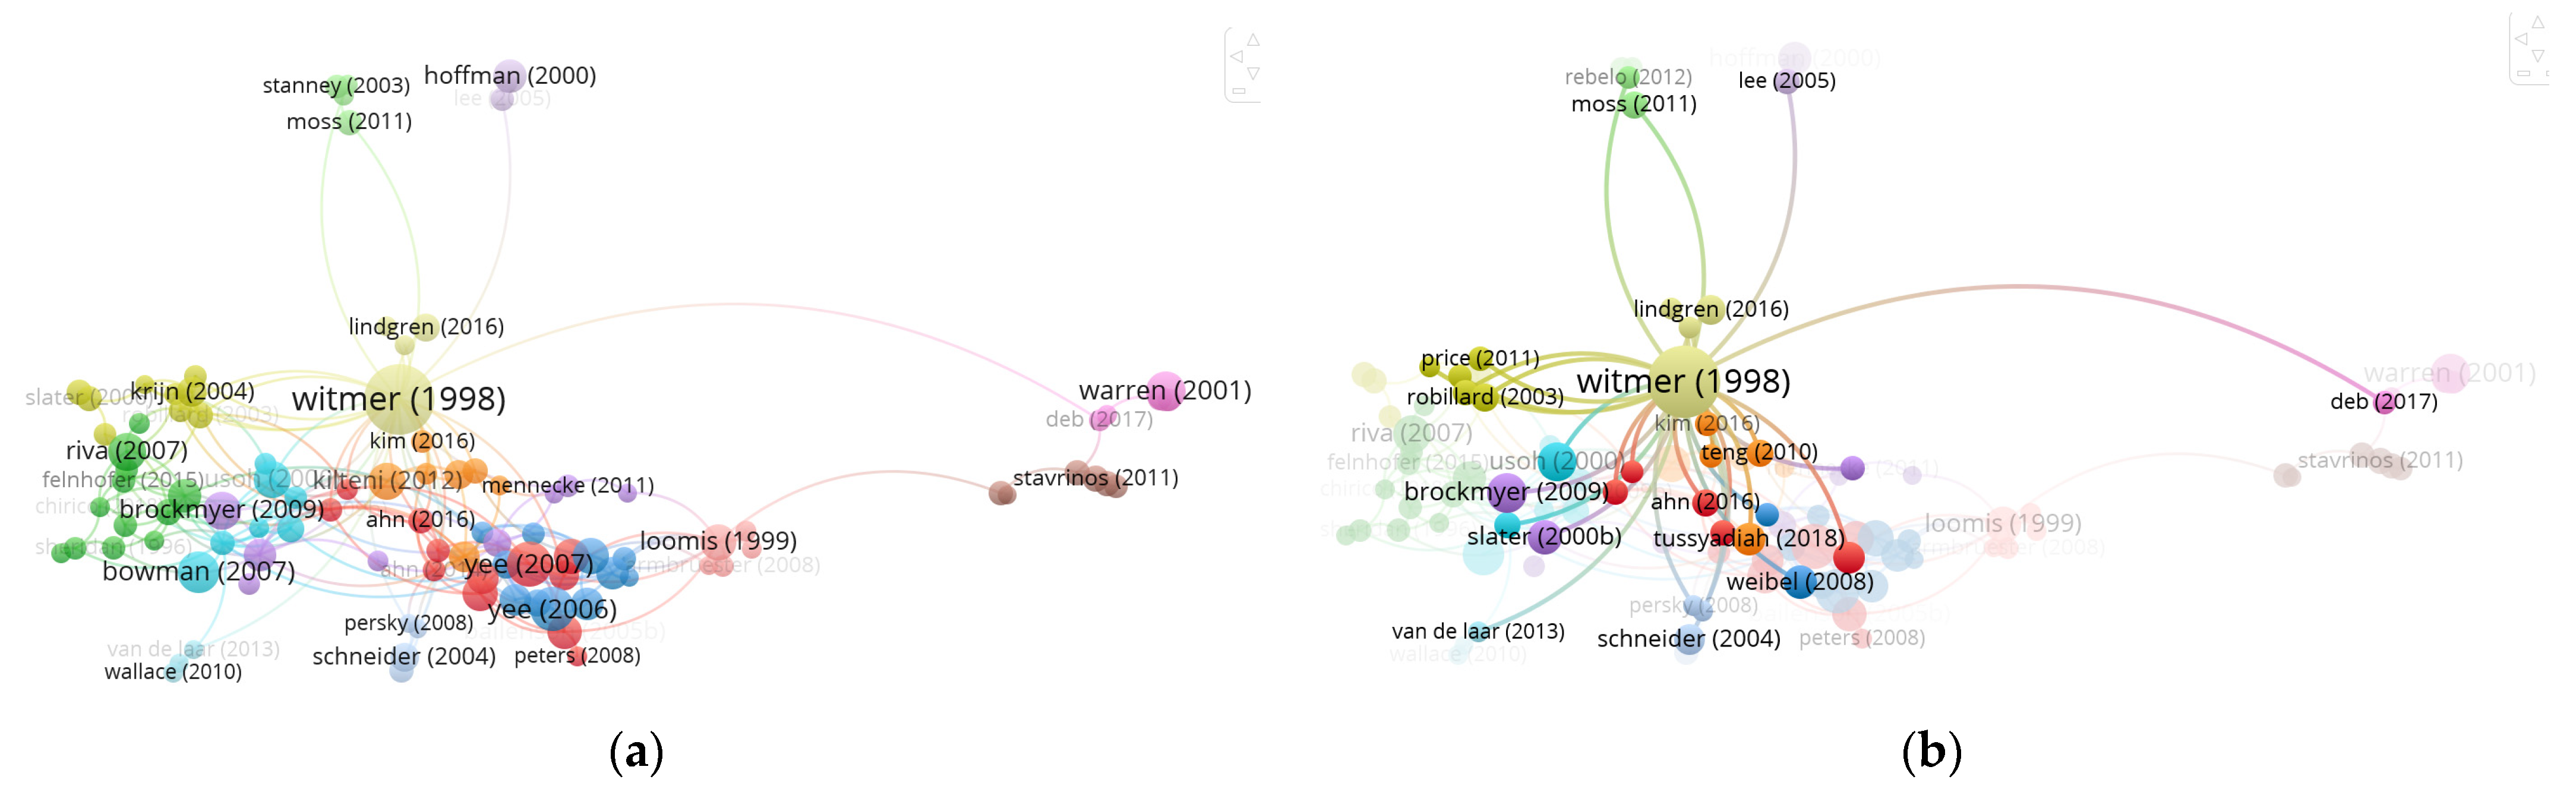
3.2.2. The Relationships among the Most Influential Publications

A citation analysis is employed to identify relationships among the most influential publications in the literature. The threshold for the bibliometric data is set as a minimum of 50 citations for a paper. Among the 969 papers, 134 are selected; however, only 100 papers meet the threshold to create the citation analysis map shown in Figure 10a. Fifteen clusters are identified among these 100 documents.
The network map from the citation analysis reveals that Witmer and Singer (1998) [37], the most cited document, still works as the most seminal publication, occupying the central position with the strongest relationships with other relatively recently published articles in the network map; and closely connected to Kim (2017) in the same cluster, and to 13 others clusters that include Kim (2016), Hartman et al. (2016), Usoh et al. (2000), Ahn et al. (2016), Robillard (2003), Slater and Steed (2000) [47], Gillath et al. (2018), Menneke et al. (2011), Persky and Bloscovich (2008), Moss and Muth (2011), Lee et al. (2005), Van de Laar et al. (2013), and Deb et al. (2017) (see Figure 10b).
The second most cited document of Shadmehr and Mussaivaldi (1994) is not connected to others in this citation analysis map. Instead, “A Survey of Presence and Related Concepts” written by Skarbez, Brooks and Whitton (2018) [48] appears to have the second strongest relationship, with the second largest number of links. The third strongest relationship with the third largest number of links is “A Virtual Presence Counter” written by Slater and Steed (2000) [47] (see Table 8).

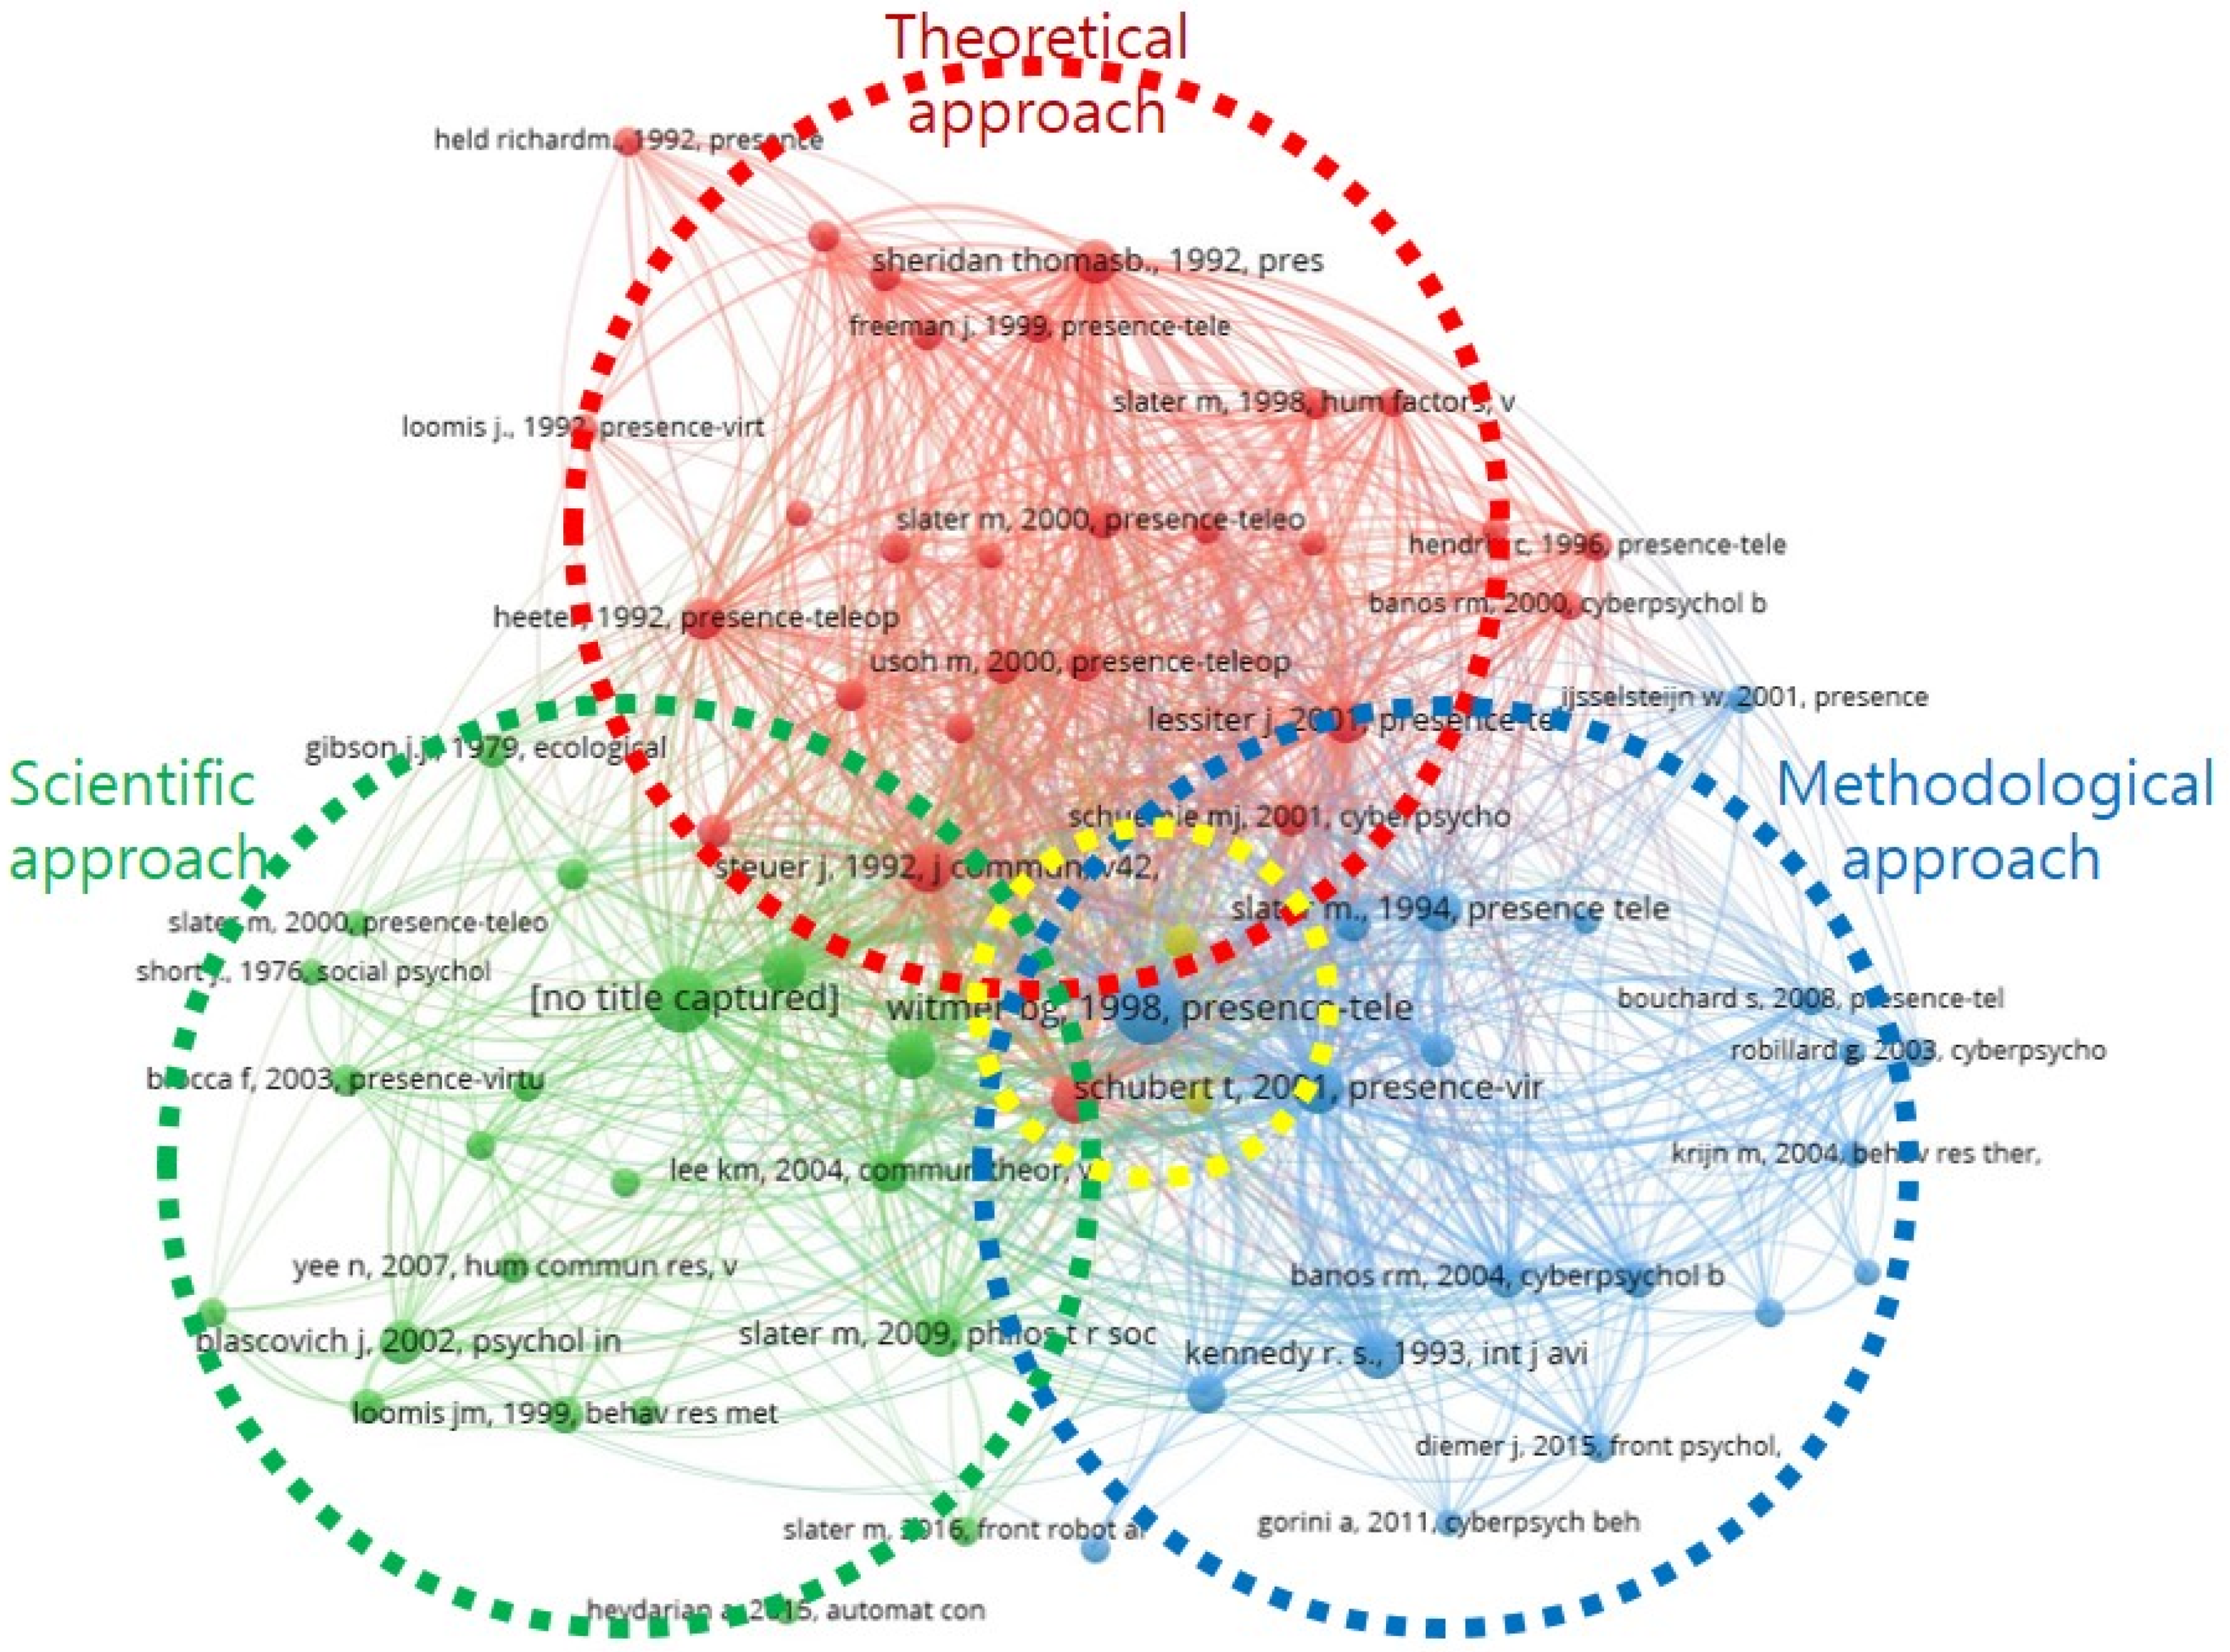
3.2.3. Foundational Themes and Seminal Publications

A co-citation analysis is employed to identify foundational themes and seminal publications through the relationships among cited publications. The threshold for the bibliometric data is set as a minimum of 20 citations for a cited reference. Of the 34,905 cited references, 71 are selected to create the co-citation map divided into four clusters.
However, with the limitation of the co-citation analysis through VOSviewer showing the publications in a reference format, a complementary solution to look into each publication of the thematic clusters manually according to the total link strength to identify the foundational themes. In this sense, content analysis is performed by assessing the titles, keywords, and abstracts of articles to identify the characteristics of thematic clusters. Four clusters are identified among the 71 cited articles that can be divided into three broad types of perspective in the research domain: (1) a methodological perspective—methodology of presence assessment in blue cluster 1; (2) a theoretical perspective—theory of definition and concepts of measurable variables for presence, in red cluster 2; (3) a scientific perspective—systematic review/neuroscientific approach to the concept of presence, in green cluster 3; and (4) intermediate methodological and theoretical perspectives, in yellow cluster 4 (see Figure 11 and Table 9). The publication years of the 12 seminal publications in clusters range from 1992 to 2007.

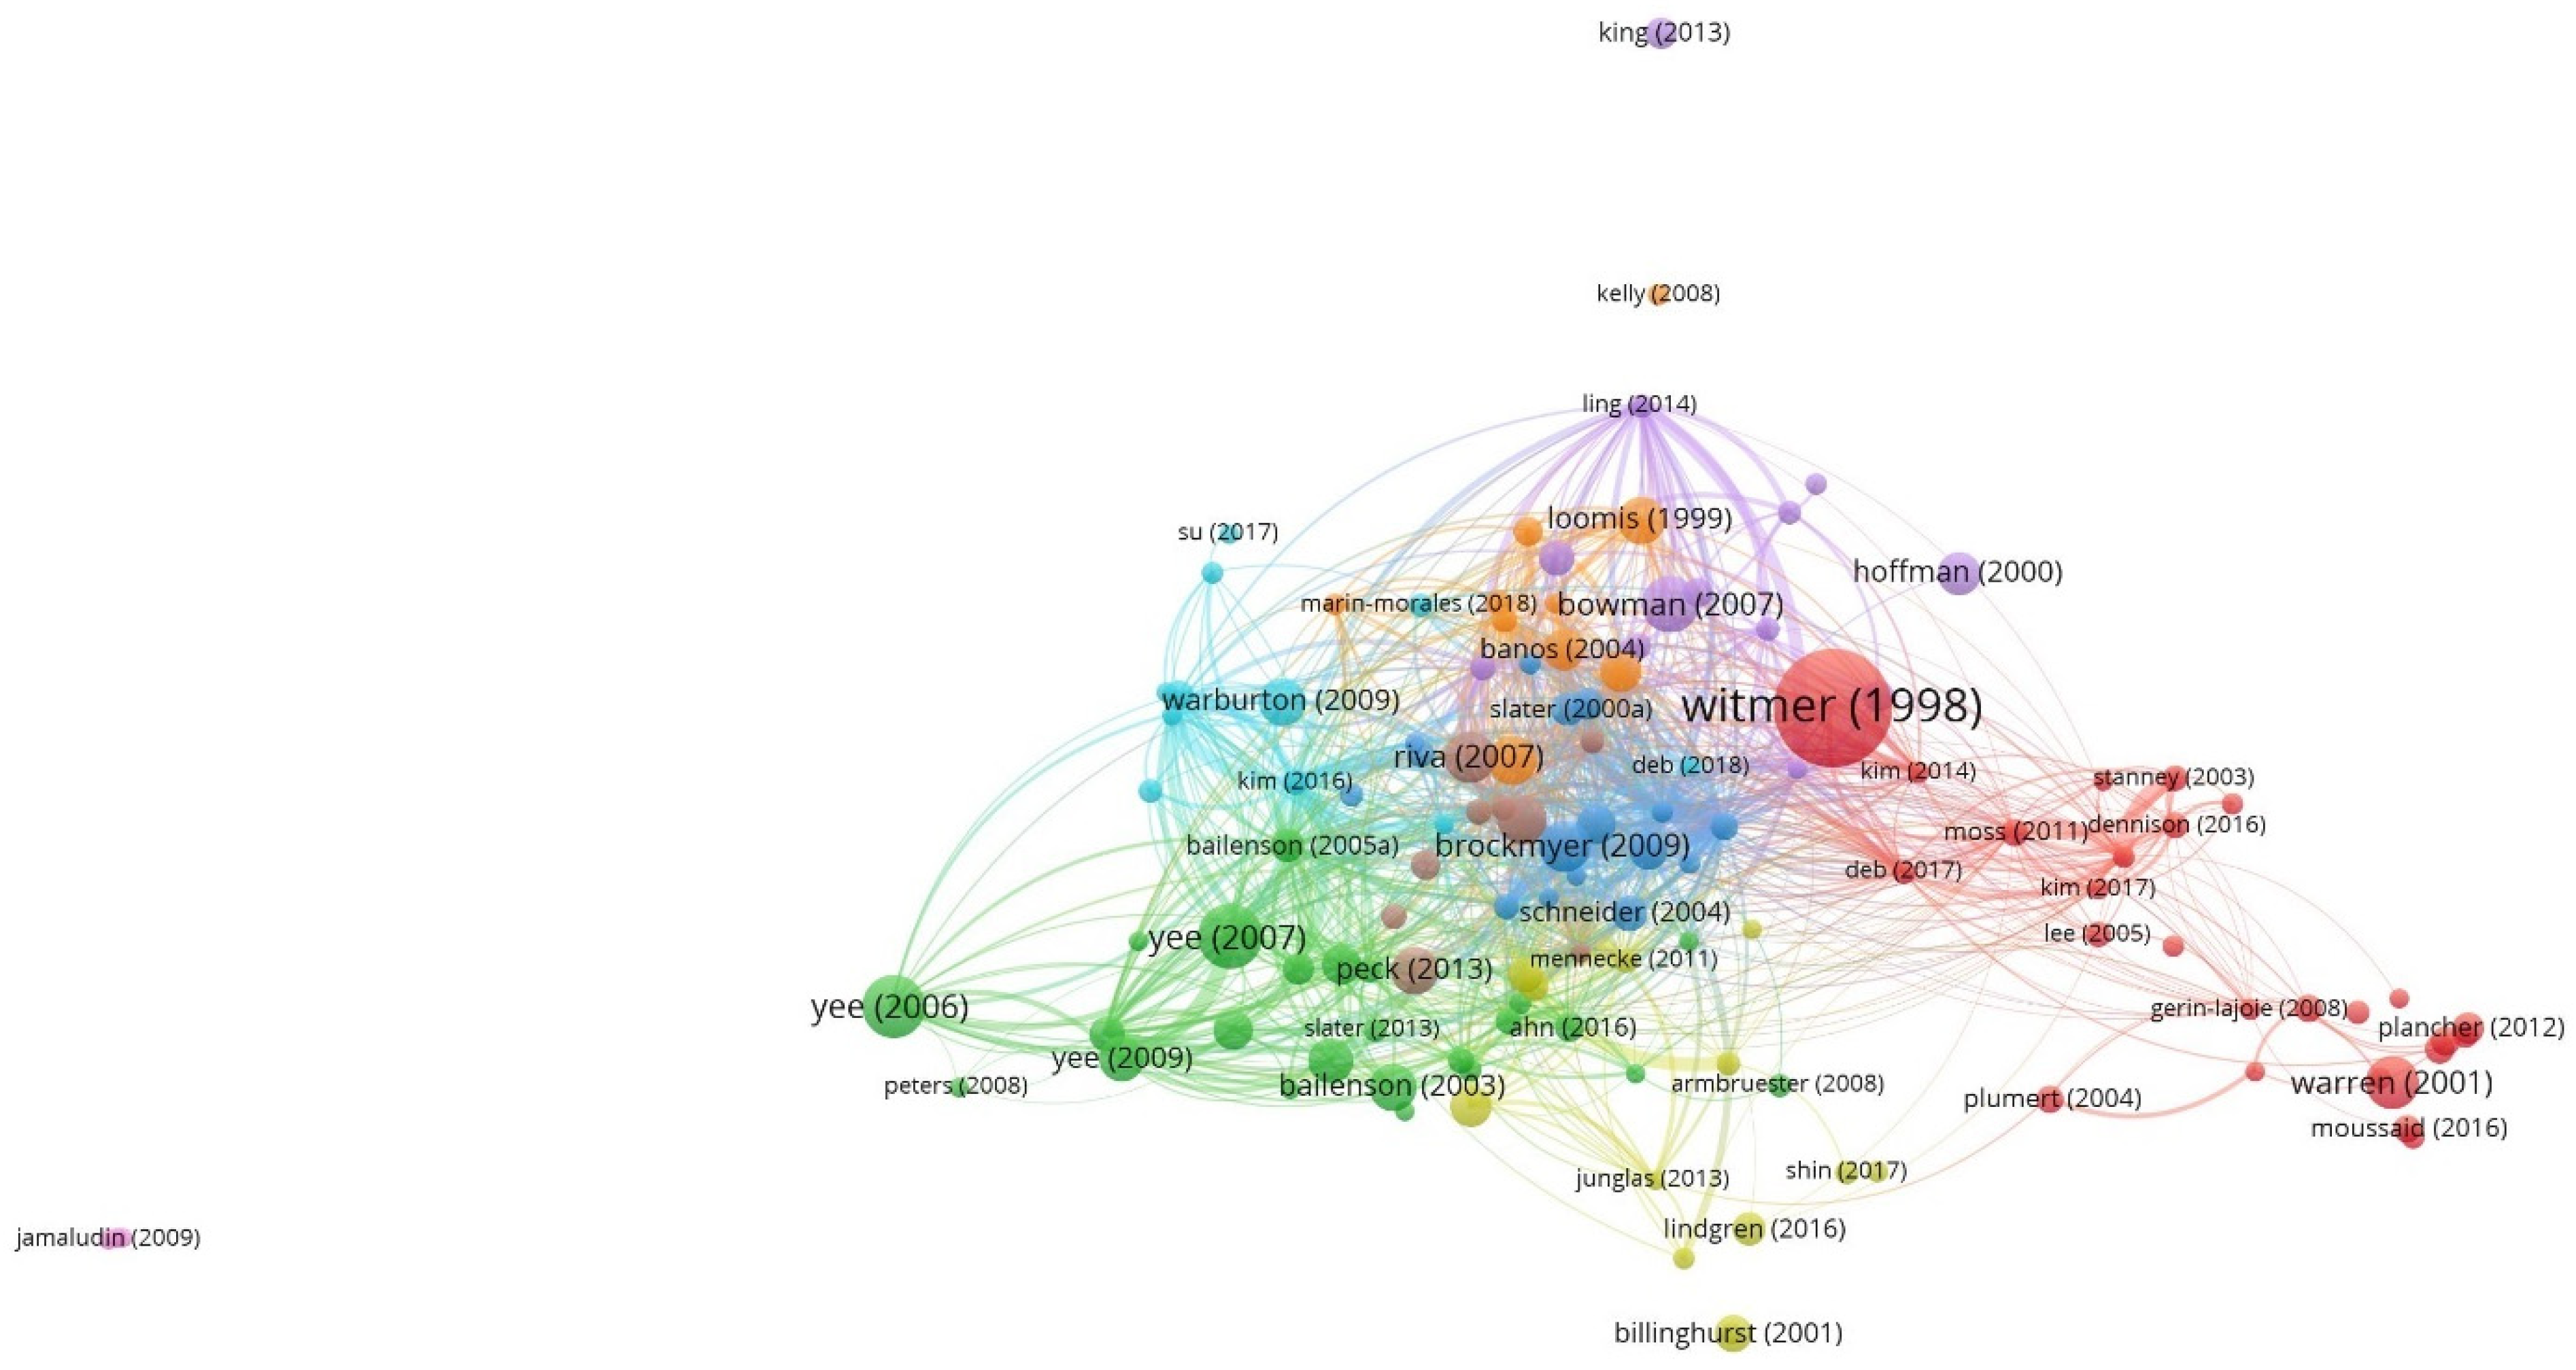
3.2.4. Bibliographic Coupling Analysis—The Development of Themes in the Literature

A bibliographic coupling analysis is employed to reveal the development of themes in the literature through the relationships among citing publications [28]. The threshold for the bibliometric data is set as a minimum of 50 citations for a paper. Of the 969 papers, 134 are selected; however, only 126 of these meet the threshold to create the bibliographic coupling analysis map shown in Figure 12. Nine clusters are identified among the 126 documents. Unlike the co-citation analysis map, the years of publication for articles in the bibliographic coupling analysis are relatively recent (see Table 10).
The characteristics of nine thematic clusters are identified from the three or four papers selected from the strongest total link for each cluster by assessing keywords, abstracts, and titles of the listed papers as follows: Cluster 1 (blue)—diverse application of presence in media, tourism, online games, etc.; Cluster 2 (cyan)—social presence in media such as social network services; Cluster 3 (brown)—presence from a cognitive science perspective, such as that of psychophysics; Cluster 4 (purple)—presence and exposure therapy for anxiety; Cluster 5 (green)—behavior and embodiment of co-/social presence; Cluster 6 (yellow)—embodied social presence, that is, empathy; Cluster 7 (orange)—presence measures such as questionnaires; Cluster 8 (red)—effectiveness of VR for pedestrian safety, emotions, and UX; and Cluster 9 (violet)—VEs in education.

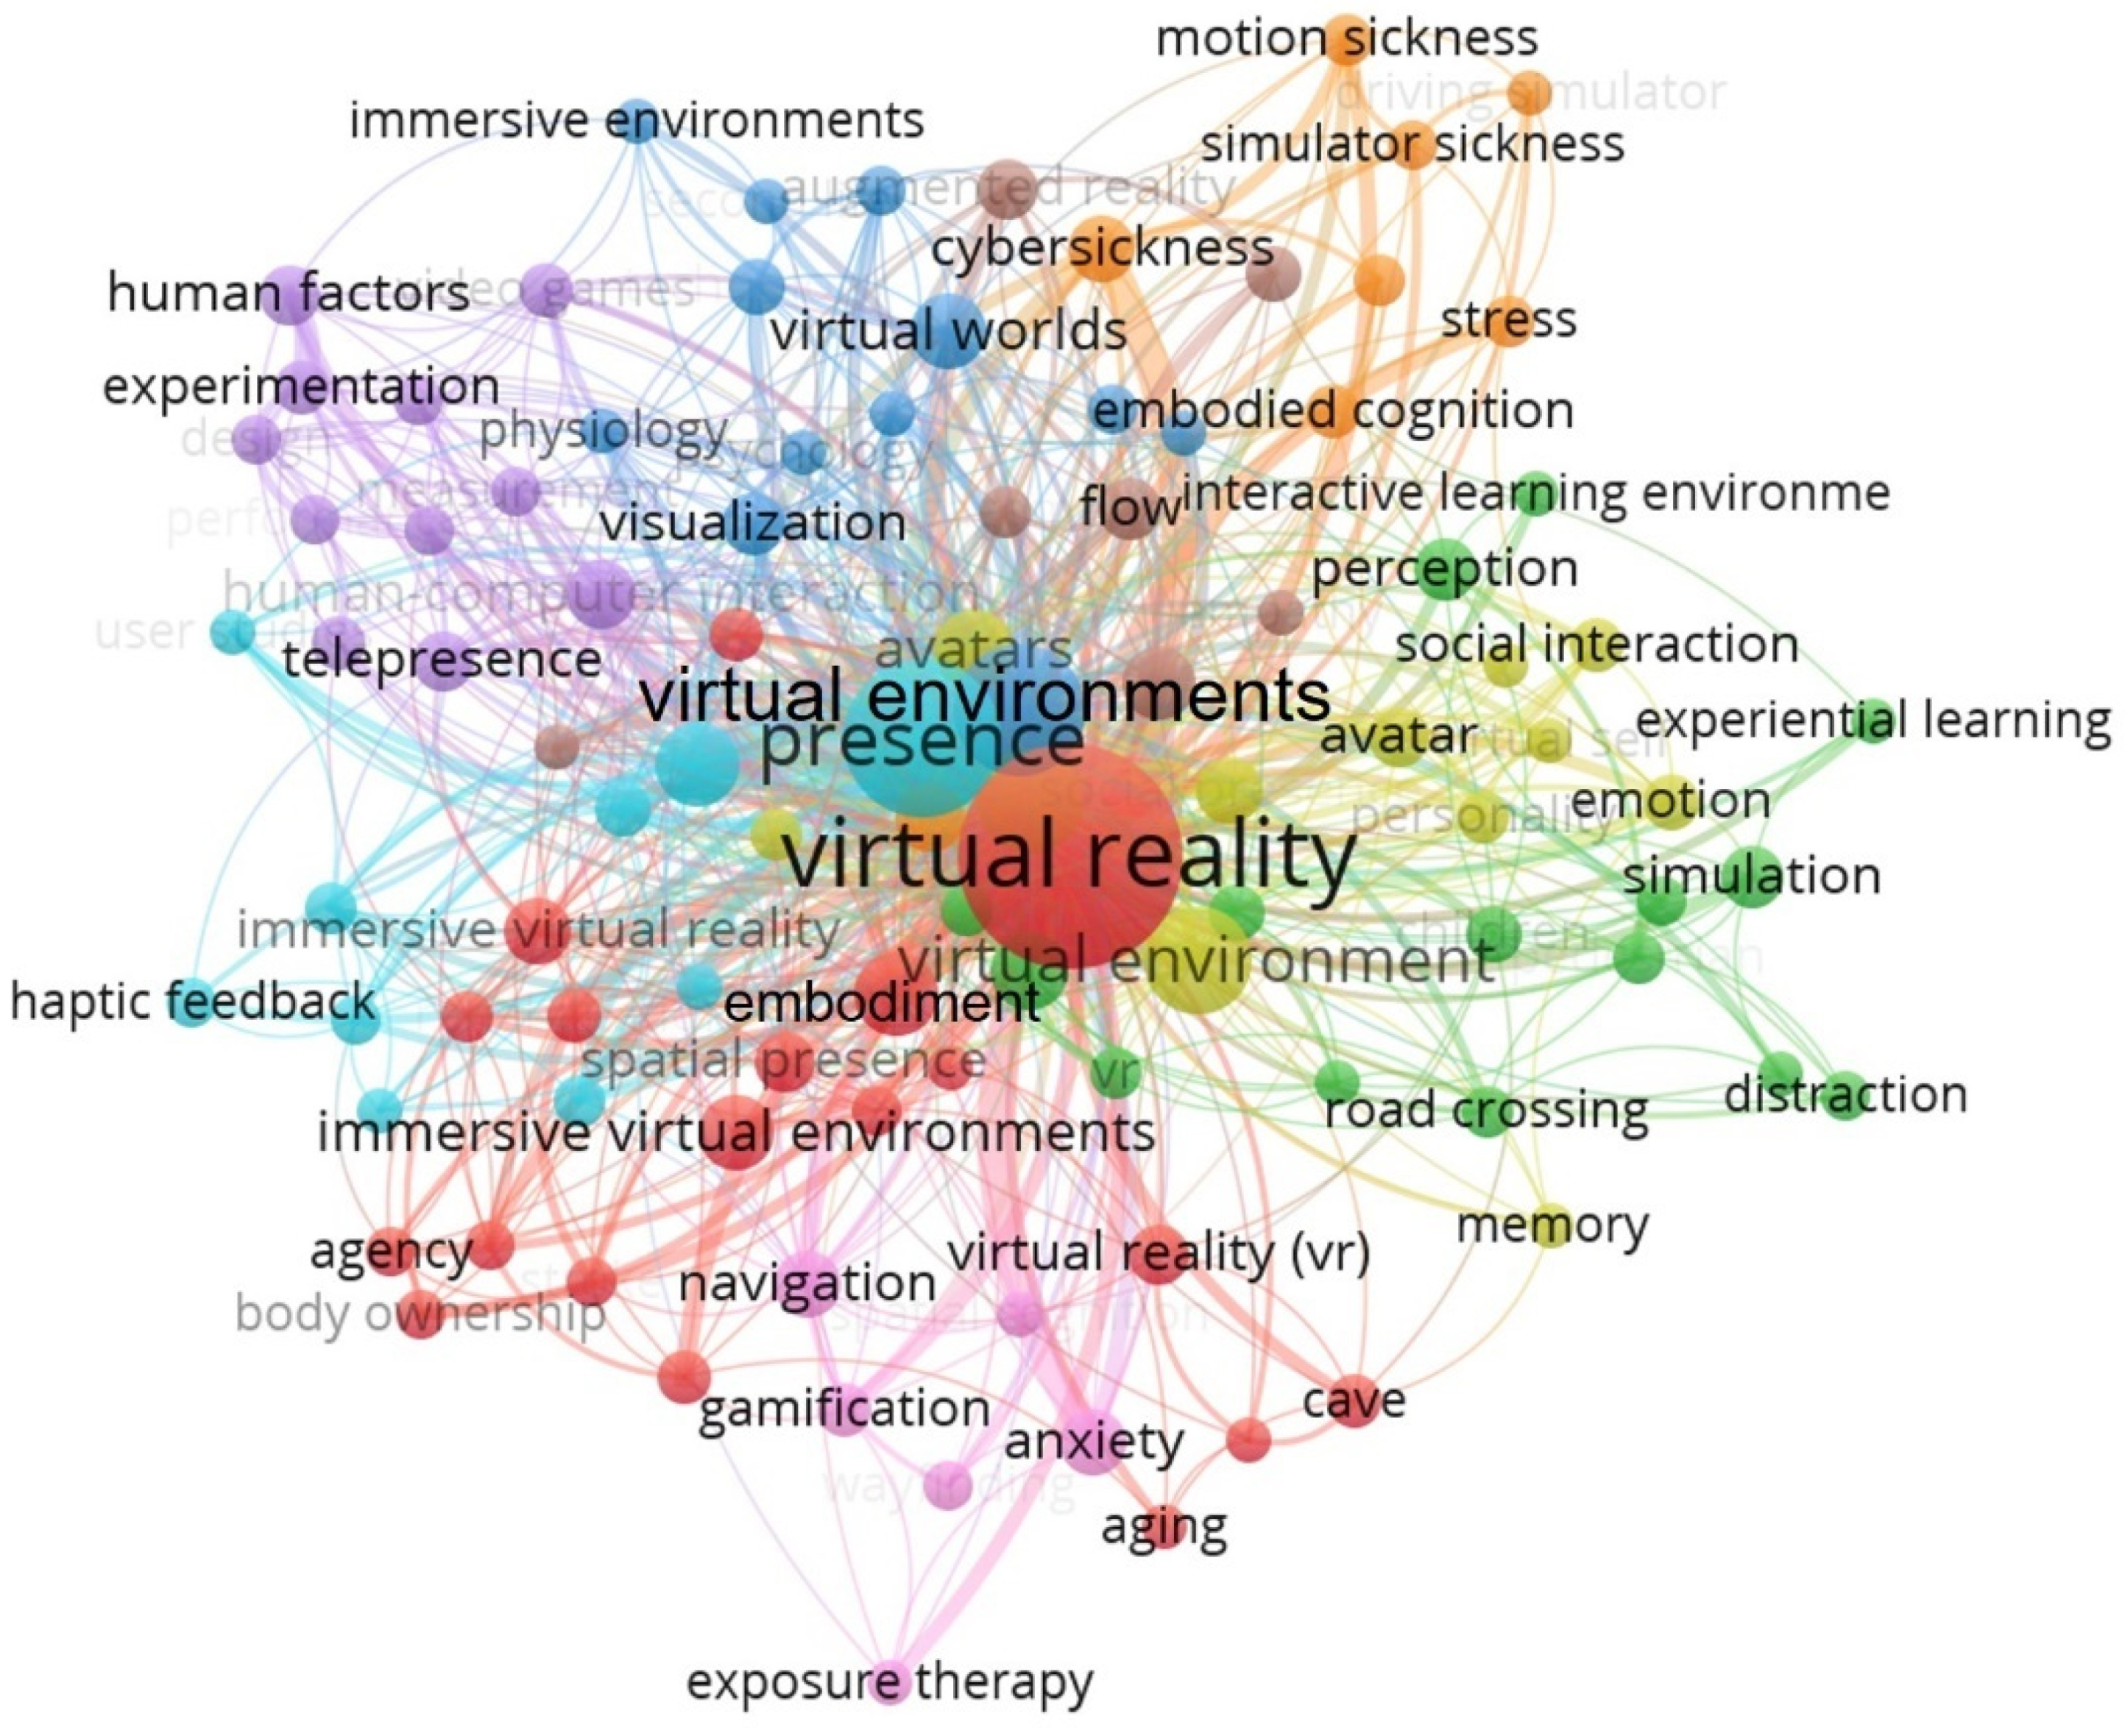
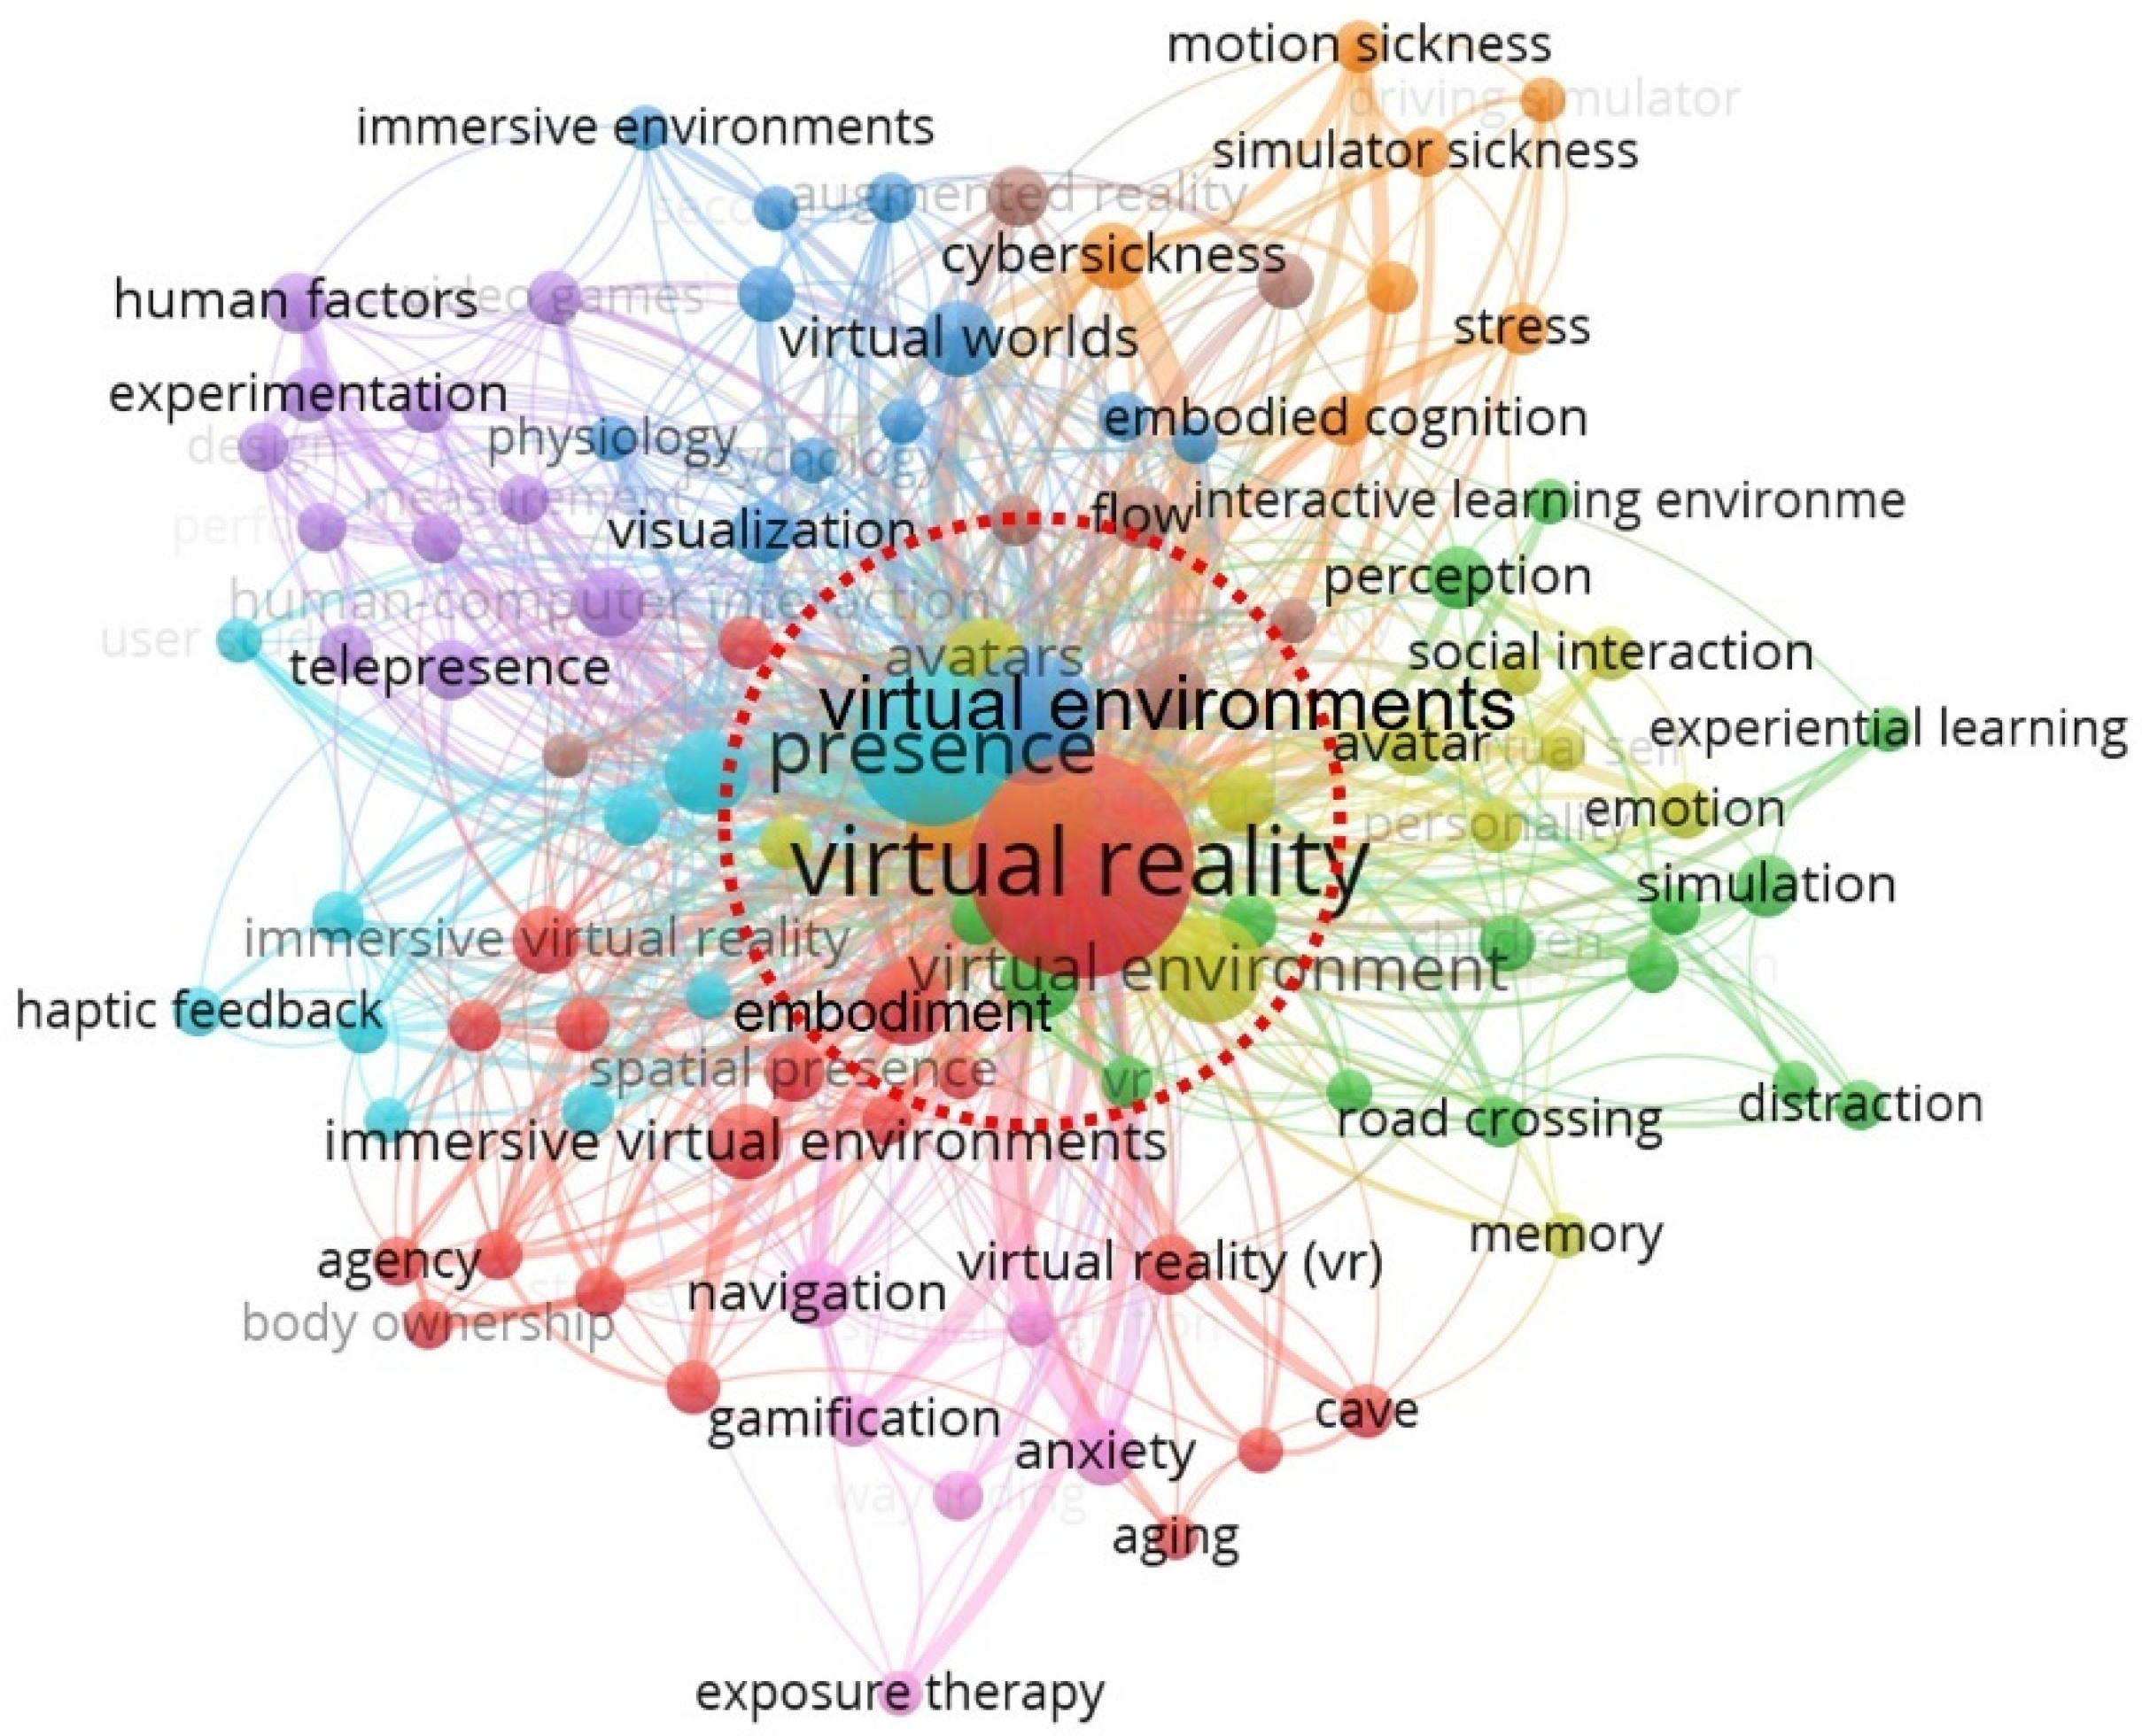
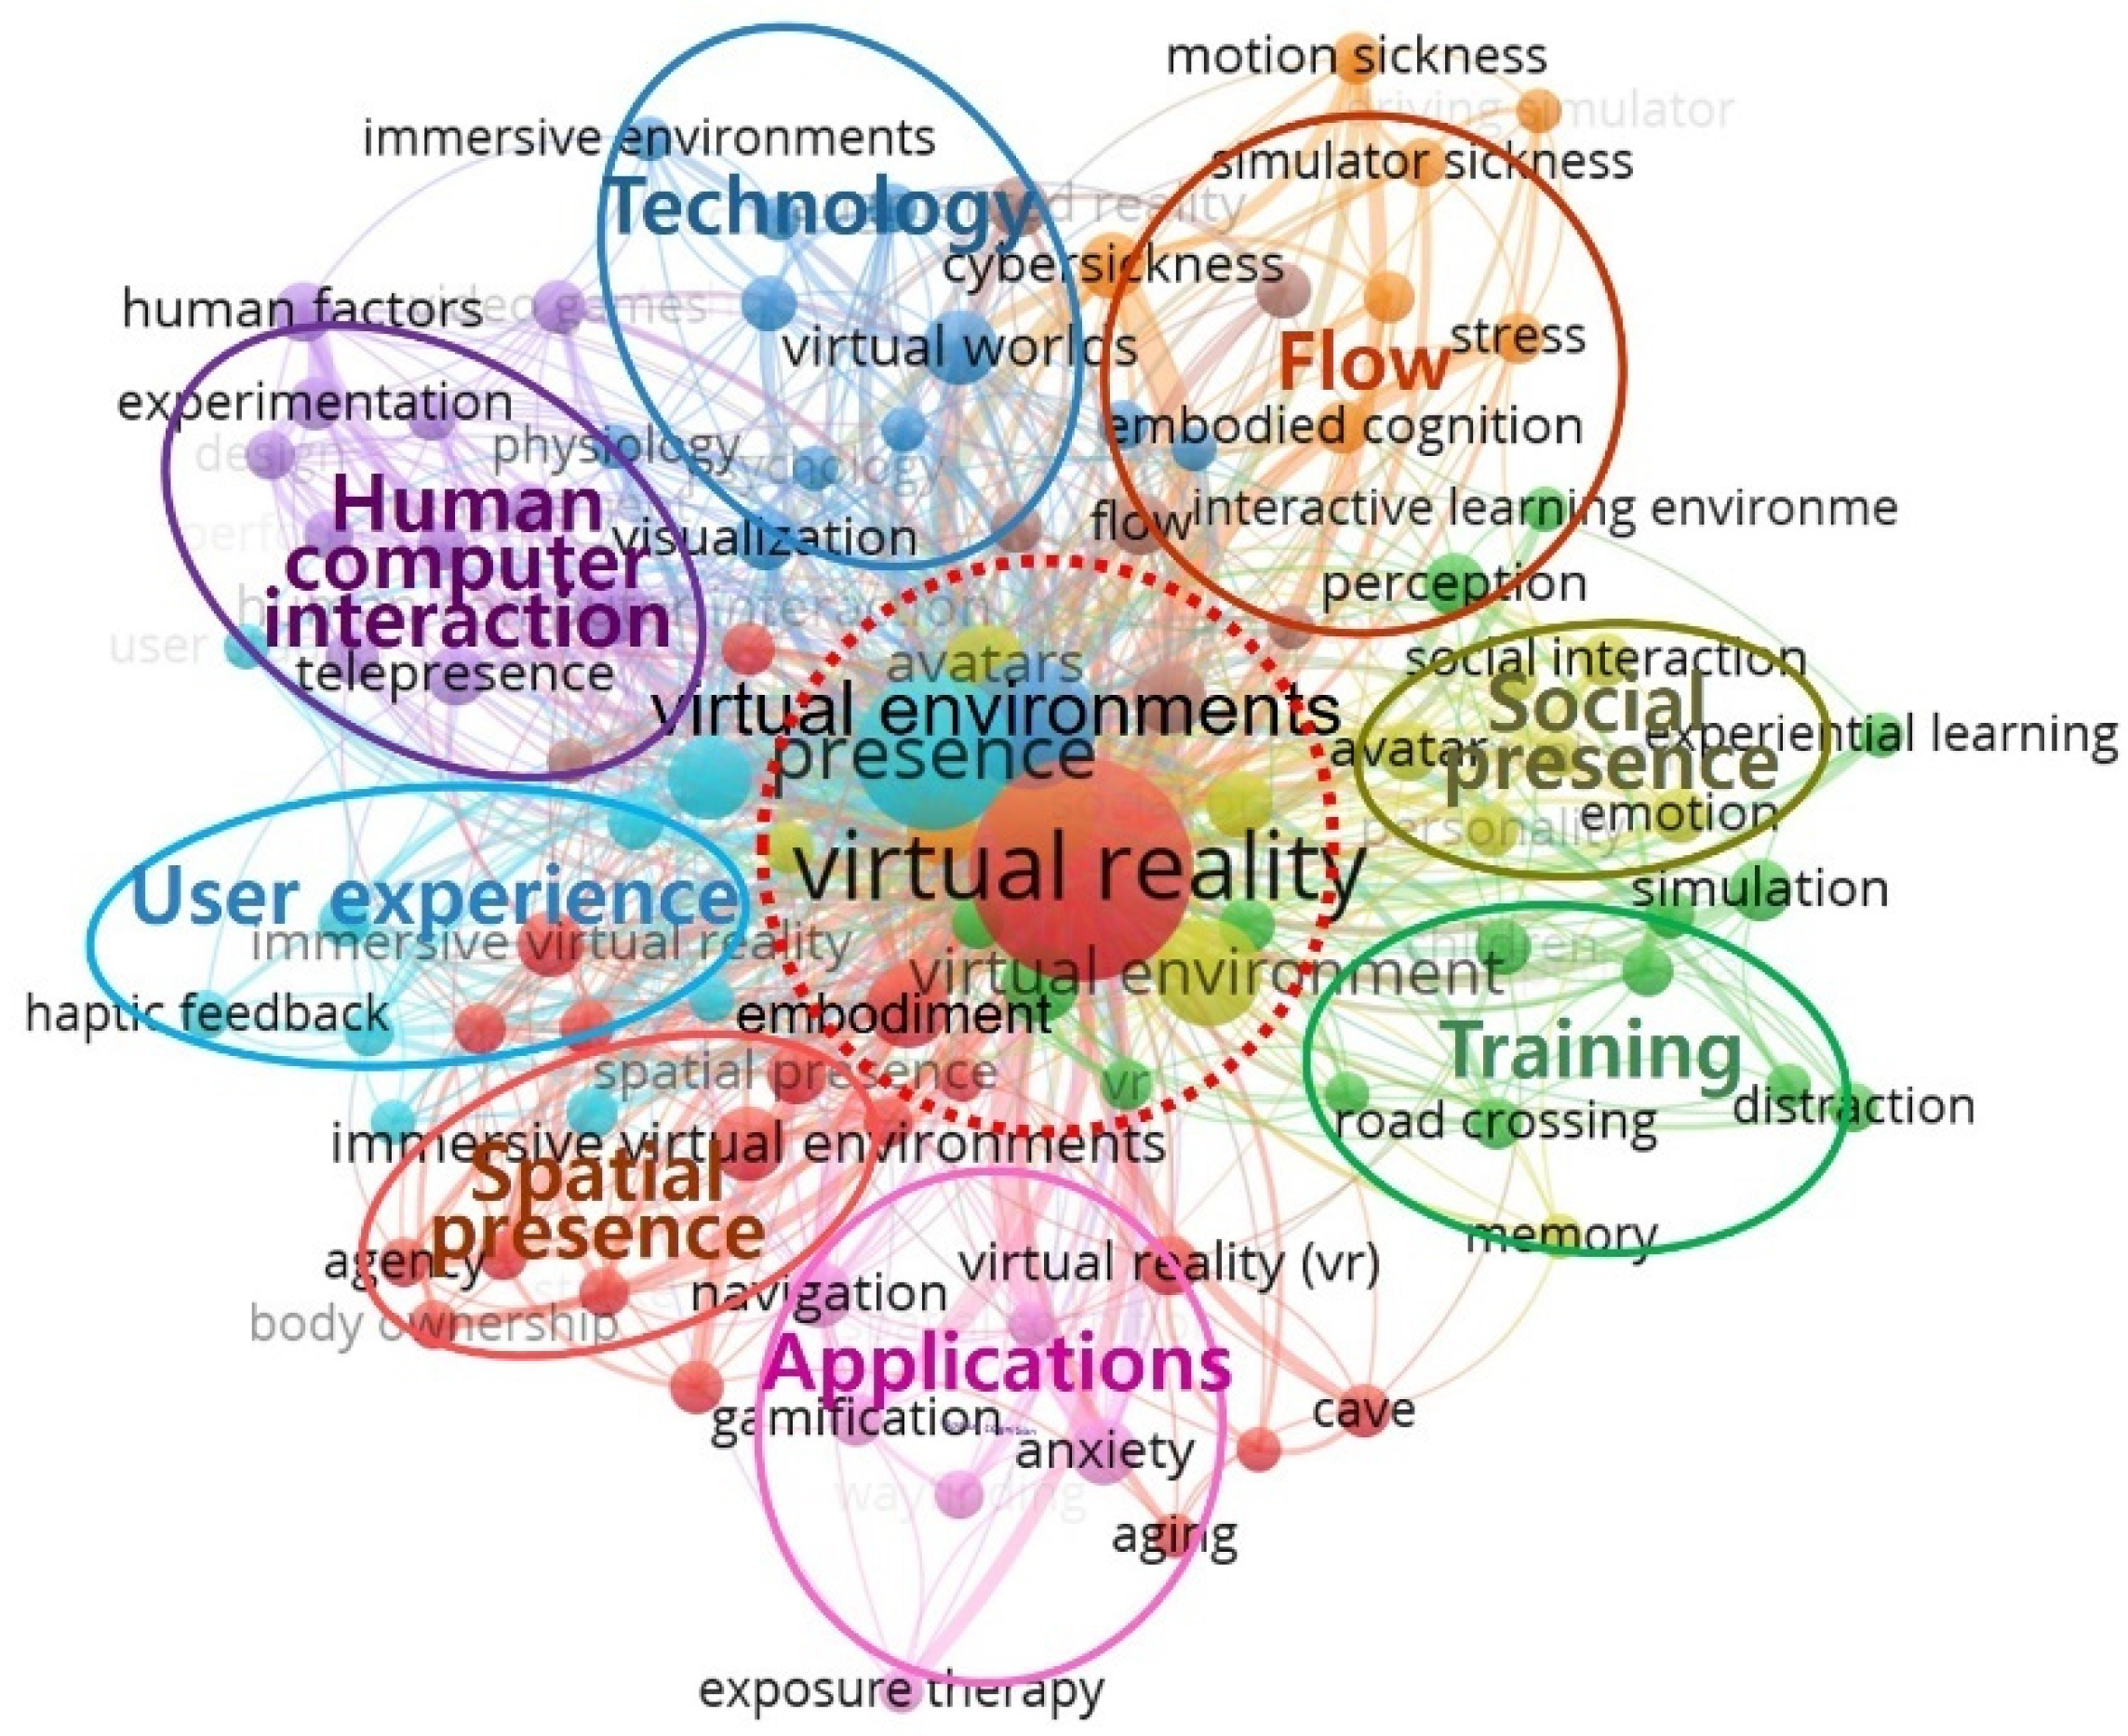
3.2.5. Present and Future Themes and Topics of the Research Domain

A co-occurrence analysis is employed to explore existing and future relationships among topics in the research field of embodied experience in VEs. The threshold for the bibliometric data is set as a minimum of five co-occurrences of author keywords. Of the 2514 keywords from the 969 papers, 100 are selected and divided into nine clusters (see Figure 13). Critical terms such as virtual reality, presence, virtual environments, immersion, user experience, virtual environment, and embodiment have strong and intersecting clusters related to theoretical, methodological, and technological approaches (see Table 11). VR incorporates VE-related terms including virtual environment, virtual environments, augmented reality, and mixed reality.

4. Discussion

4.1. Implications of Findings for Co-Occurring Term—Defining Terms and Their Relationships with the Virtual Environment from an Embodied Experience Perspective

4.1.1. Virtual Reality—Embodiment–Presence Continuum

The three major terms related to the VE (virtual reality, virtual environments, and virtual environment), and the three related to experience integrating embodiment (presence, immersion, and user experience), and embodiment appear in close proximity in a central position in the co-occurrence network map (see Figure 14). These terms, each consisting of different color clusters, are central in the co-occurrence map and have the largest nodes. As in Ulrike Schultze’s work [81], embodiment and presence have a strong relationship with VR.

4.1.2. Virtual Environment-Related Terms

Interestingly, the most strongly co-occurring keyword is virtual reality, which occupies the center of the network map; related terms such as virtual environments and virtual environment are seen as subsets of virtual reality (see Table 12). Virtual reality also has a close relationship with embodiment (in the same color cluster) and immersion (in a different color cluster). Embodiment is most closely positioned with virtual reality among the three VE-related terms.
The second most prominent keyword is presence, which has the closest relationship with the third most co-occurring term, virtual environments. Virtual environments are closely positioned with presence in a similar color cluster, and with avatars in a different color cluster. Virtual environment is also seen as a subset of virtual reality.
Co-occurrence analysis using author keywords reveals confusion in current definitions and use of terms related to VEs from an embodied experience perspective. Girvan (2018) points out the problem that different terms are currently used for VE across the literature and disciplines, but often without clear definition [82].
We use the term VE in relation to human–environment interactions for this study; however, the term VR occurs most often in the co-occurrence analysis. Sherman and Craig (2003) explain that the VE appeared before VR and is often used as a synonym for both VR and virtual world [83], whereas, virtual world tends to be used in education, according to Duncan et al. (2012) [84]. Conversely, Nazir et al. (2012) define a VE as provoking emotions and feelings felt in reality to take advantage of the same emotions and feelings in reality; for example, during real accidental events [85]. Therefore, VEs focused on component cognitive and attention processes developed only rather recently and have been validated for spatial abilities, learning, memory, and executive functions, whereas the ability of VEs to create dynamic, immersive, 3D settings—where the behavioral response can be recorded—offers a number of assessment and rehabilitation options that are not available with traditional assessment methods [86]. Both VE and VEs are based on immersive technologies; however, VE corresponds to feelings and emotions, while VEs correspond to behavioral responses for embodied technological assessment.
Finally, Farshid (2018) provides a taxonomy of VEs as follows [87]: (1) VR as a “complete digital representation of the actual world” and “enabling perceived presence and full immersion;” (2) augmented reality (AR) as “AR Information and data overlaid on top of the actual world,” where utilities for physical co-presence range from wearables and smart glasses, to smartphones; and (3) mixed reality (MR) introducing “possible elements into an actual world with adaptation of actual scenarios,” for example Pokémon Go. A form of VR is recognized as stereo HMD, head tracking, and computer graphic-generated images [23].
The key difference between VR and AR/MR is that VR uses computer-generated images that are not combined with real-life objects, thus providing a feeling of being transported somewhere else with no sense of the real world [88]. Thus, the findings of this study suggest that the term virtual reality incorporates presence, immersion, and embodiment, as VR features three distinct focal areas of interaction, imagination, and immersion [89]: (1) interaction in VR refers to the natural interchange of action and reaction between the user and the virtual scene; (2) imagination refers to the use of multidimensional perception information provided by VR scenes to foster other feelings such as adoration, boredom, and aesthetic appreciation, as well as the same feelings in the real world; and (3) immersion refers to the user’s feeling that they are part of the virtual world, as discussed further in the following subsection [90].
However, it is noteworthy that extended reality (XR) is an emerging umbrella term for all immersive technologies, covering AR, VR, and MR [91], and encompassing other supporting technologies such as artificial intelligence), 5G, and Internet of Things to create engaging and interactive applications [92].

4.1.3. Embodiment Integrated Experience-Related Terms

The three keywords related to embodied experience—presence, immersion, and user experience—are compared with one another in Table 13. Presence, immersion, and user experience co-occur with HCI, and appear closely positioned in their relationships. Presence occurs most often alongside experience-related terms, occupying a central position with the greatest link strength. Compared with immersion, presence has its own relationship with heart rate and haptic feedback. Conversely, immersion is positioned between presence and virtual reality and is seen as a subset of presence, yet shows its own relationships with eye tracking, distraction, gamification, and education. User experience is related to user study, 3D displays, and HMD, and is far from avatars and social area.
The distinction between the terms ‘immersion’ and ‘presence’ is discussed in the literature [53,93,94]. Findings by different researchers have implications for various aspects of immersion and presence, as follows.
(1)
Presence
Four distinct theories of presence are based on the established taxonomy [95]. A sense of presence (a feeling of being in a shared space) or a sense of co-presence (being in a shared space with others with whom the user can interact) is often referred to in the literature [96].
Presence was first measured in 1993 using a subjective assessment in the form of a questionnaire [37], the ITC–Sense of Presence Inventory (ITC-SOPI) [54], and then by a mixed method including behavioral observation [97]. Behavior measures have employed a physiological approach, such as ECG recordings and electrodermal activity, since 2000 [98]. The breaks in presence measure that appeared in 2000 are related to the traditional questionnaire method and can be used in combination with the physiological method. Slater is a representative researcher who has developed presence measurement methods over a decade. Recently, Souza et al. (2021) found presence in most subjective measures, and identified 29 main factors that evoke presence in a VE, which are grouped into four categories: engagement, personal characteristics, interaction fidelity, and display fidelity [99].
(2)
Immersion
Slater (2009) defines immersion as a subset of presence [100]. ‘Immersion’ refers to the objective level of sensory fidelity that a VR system provides, while ‘presence’ refers to a user’s subjective psychological response to a VR system [41]. In other words, immersion is the technical direction of VE, and presence is a user’s individual experience. Nilsson et al. (2016) addresses existing definitions of immersion by dividing them into three categories: (1) immersion as a property of a system; (2) a subjective response to narrative contents; and (3) a subjective response to challenges within the VE, based on four distinct theories of presence [95]. Levels of immersive technology can be clustered into three general categories: fully immersive (HMD and Cave Automatic Virtual Environment); semi-immersive (panoramic screens and cinema screens); and non-immersive (TV and monitors) [101].
(3)
User experience
As the co-occurrence map focusing on UX in Table 12 shows, UX is correlated with usability and 3D displays in VR. Rebelo et al., (2012) suggests that UX might be evaluated and benefit from VR [102], and many studies conduct UX evaluations of various applications in VR [103]: for example, use of visual display terminals and HMD in walking and driving contexts to compare UX, as well as the achievement of presence, workload, usability, and flow [103]. In this sense, presence and UX factors are partly correlated [104].

4.2. Future Research Agenda

We urge scholars to consider new methods and techniques for data collection and analysis. More broadly, we expect the readiness of new big data sources to inspire innovative strategies for obtaining embodied experience data in the VE.
Based on the recent embodied cognition approach to the VE and UX, this paper conducted a comprehensive review and bibliometric analysis to explore the embodied experience in the VE by examining research performance reflected in incremental increases in publication citations over time; publication rates according to journal, research area, author, affiliation, and country (see Figure 15), and scholarly networks focused on authors, affiliations, and countries; and capture the research trends based on co-citation analysis, bibliographic coupling, and co-occurrence analysis (see Figure 16), to suggest future research directions.
Key terms such as virtual environment, embodied cognition, and experience are defined and used differently in the literature. This study was based on three types of VE that use digital technology: VR, AR, and MR. As user experience-related terms, immersion and presence were included in connection to VR technology and extended to psychological responses such as emotion and behavior. Both subjective and objective assessments were included.
The co-occurrence analysis identified nine thematic clusters: theory of presence such as (1) social presence and (2) spatial presence; (3) application using gamification for wayfinding; (4) training of pedestrians including children for road crossing; (5) HCI based on human factors; (6) user experience for usability using HMD, haptic feedback, and task analysis; (7) technology using solid modeling and visualization, that is, second life; (8) flow as the optimal experience resulting from presence [105]; and (9) the VR continuum of embodied experience from presence, as shown in Figure 16.
This paper analyzed studies on the embodied experience in the VE to present a comprehensive overview and future research directions for architects, engineers, and scientists, and to guide future studies.

5. Conclusions

This study explored an extensive scientific landscape of publications in the field of embodied experience in VEs over time using a bibliometric approach. Using data obtained from the WoS database, 969 studies were analyzed using a bibliometric analysis to provide a comprehensive overview of scientific productivity and networks, and research themes in the field of embodied experience in VEs. The study investigated the scientific flow of publications and citations over time; and identified prominent publications and prolific journals, research areas, authors, affiliation, and countries, and scholarly networks across publications, authors, affiliations, and countries. The bibliometric techniques of performance analysis and science mapping were employed to investigate scholarly production and collaboration, and research themes and topics.
This study makes numerous contributions to the literature in this domain. First, the results from the performance analysis revealed that the first paper in this domain was written by Shadmehr and Mussa-Ivaldi and published in 1994: “Adaptive Representation of Dynamics during Learning of a Motor Task” [38]. This paper signifies the emergence of the field of embodied experience in VEs and remains the second most influential publication in the field. Further, this study identified that the most influential paper is that by Witmer and Singer (1998) [37]. The most productive journal is Presence: Teleoperators and Virtual Environments, established in 1992, and despite its renaming in 2017 as PRESENCE: Virtual and Augmented Reality, it still ranks in the top 10. Regarding prolific contributions of affiliations and countries, University of London in England tops the list; however, USA took the first place with three times more productivity than the second place of England. In terms of prolific authors, M Slater from Spain has produced the largest number of publications. Further, the results revealed that virtual reality, virtual environments, virtual environment, immersion, presence, user experience, and embodiment are among the most studied concepts in VR research.
Regardless of the inherent ability of a bibliometric review to provide an overview of research trends in a study subject, this study also performed an in-depth investigation to identify the themes and topics of the selected studies. The results of this study found that the foundational research theme has been focused on ‘presence’ theoretically, methodologically, and scientifically. This study also identified its developing research trends that ‘presence’ has developed with integration of ‘immersion’ and ‘user experience’ to enhance embodied experience in VE.
Therefore, this study contributes to the literature by exploring the characteristics of publications in the area of embodied VEs and understanding developing research trends in this domain. This study creates a firm foundation and contributes to the architecture-related fields to assist designers and researchers in gaining a comprehensive view of embodied experience in VE, and identifying knowledge gaps and deriving novel ideas for future VE design and research. We provided examples of research in the areas of immersion, presence, and user experience, but surely many other areas including architecture will benefit as well from this embodied VE technology.

Author Contributions

Conceptualization, S.L. and E.J.P.; methodology, S.L. and E.J.P.; validation, S.L. and E.J.P.; formal analysis, S.L. and E.J.P.; investigation, S.L. and E.J.P.; writing—original draft preparation, S.L.; writing—review and editing, S.L. and E.J.P. All authors have read and agreed to the published version of the manuscript.

Funding

This work was supported by the National Research Foundation of Korea (NRF) grant funded by the Korea Government (MSIT) (No. 2022R1G1A1003663).

Institutional Review Board Statement

Not applicable.

Informed Consent Statement

Not applicable.

Data Availability Statement

Not applicable.

Conflicts of Interest

The authors declare no conflict of interest.

References

  1. Sepasgozar, S.M.; Ghobadi, M.; Shirowzhan, S.; Edwards, D.J.; Delzendeh, E. Metrics development and modelling the mixed reality and digital twin adoption in the context of Industry 4.0. Eng. Constr. Archit. Manag. 2021, 28, 1355–1376. [Google Scholar] [CrossRef]
  2. Ullah, F. A beginner’s guide to developing review-based conceptual frameworks in the built environment. Architecture 2021, 1, 3. [Google Scholar] [CrossRef]
  3. Katona, J. A review of human–computer interaction and virtual reality research fields in cognitive InfoCommunications. Appl. Sci. 2021, 11, 2646. [Google Scholar] [CrossRef]
  4. Moens, M.-F.; Li, J.; Chua, T.-S. Mining User Generated Content; CRC Press: Boca Raton, FL, USA, 2014. [Google Scholar]
  5. Evans-Cowley, J.; Hollander, J. The new generation of public participation: Internet-based participation tools. Plan. Pract. Res. 2010, 25, 397–408. [Google Scholar] [CrossRef]
  6. Olshannikova, E.; Ometov, A.; Koucheryavy, Y.; Olsson, T. Visualizing Big Data with augmented and virtual reality: Challenges and research agenda. J. Big Data 2015, 2, 22. [Google Scholar] [CrossRef]
  7. Spain, R.; Goldberg, B.; Khooshabeh, P.; Krum, D.; Biro, J.; Linder, C.; Stanley, L.; Tredinnick, R.; Ponto, K.; Gisick, L. Applications of virtual environments in human factors research and practice. In Proceedings of the Human Factors and Ergonomics Society Annual Meeting; SAGE Publications: Los Angeles, CA, USA, 2019; pp. 2308–2312. [Google Scholar]
  8. Compierchio, A.; Tretten, P. Human Factors Evaluation of Shared Real and Virtual Environments. In International Conference on Human Interaction and Emerging Technologies; Springer: Cham, Switzerland, 2021; pp. 745–751. [Google Scholar]
  9. Sunesson, K.; Allwood, C.M.; Paulin, D.; Heldal, I.; Roupé, M.; Johansson, M.; Westerdahl, B. Virtual reality as a new tool in the city planning process. Tsinghua Sci. Technol. 2008, 13, 255–260. [Google Scholar] [CrossRef]
  10. Moneta, A. Architecture, heritage and metaverse: New approaches and methods for the digital built environment. Tradit. Dwell. Settl. Rev. 2020, 32, 1–19. [Google Scholar]
  11. Varela, F.J.; Thompson, E.; Rosch, E. The Embodied Mind: Cognitive Science and Human Experience; MIT Press: Cambridge, MA, USA, 2016. [Google Scholar]
  12. Lynch, K. The image of the environment. Image City 1960, 11, 1–13. [Google Scholar]
  13. Ulrich, R.S. View through a window may influence recovery from surgery. Science 1984, 224, 420–421. [Google Scholar] [CrossRef] [Green Version]
  14. Hillier, B.; Hanson, J. The Social Logic of Space; Cambridge University Press: Cambridge, UK, 1989. [Google Scholar]
  15. Zeki, S. Inner vision: An exploration of art and the brain. J. Aesthet. Art Crit. 2002, 60, 365–366. [Google Scholar]
  16. Eberhard, J.P. Brain Landscape the Coexistence of Neuroscience and Architecture; Oxford University Press: Oxford, UK, 2009. [Google Scholar]
  17. Eberhard, J.P. Applying neuroscience to architecture. Neuron 2009, 62, 753–756. [Google Scholar] [CrossRef] [Green Version]
  18. Zeizel, J. Inquiry by Design: Environment/Behavior/Neuroscience in Architecture, Interiors, Landscape and Planning; Jonh Zeizel foreword by John P. Eberhard; Norton & Company: New York, NY, USA, 2006. [Google Scholar]
  19. Lakoff, G.; Johnson, M. Metaphors We Live by; University of Chicago Press: Chicago, IL, USA, 2008. [Google Scholar]
  20. Lakoff, G.; Johnson, M. Philosophy in the Flesh: The Embodied Mind and Its Challenge to Western Thought; Basic Books New York: New York, NY, USA, 1999. [Google Scholar]
  21. Lee, S. Sustainable embodied experience in the built environment: Reinterpreting architectural history through embodied cognition. Archnet-IJAR Int. J. Archit. Res. 2022. ahead-of-print. [Google Scholar] [CrossRef]
  22. Lee, S.; Shin, W.; Park, E.J. Implications of neuroarchitecture for the experience of the built environment: A scoping review. Archnet-IJAR Int. J. Archit. Res. 2022, 16, 225–244. [Google Scholar] [CrossRef]
  23. Slater, M.; Sanchez-Vives, M.V. Enhancing our lives with immersive virtual reality. Front. Robot. AI 2016, 3, 74. [Google Scholar] [CrossRef] [Green Version]
  24. Moral-Muñoz, J.A.; Herrera-Viedma, E.; Santisteban-Espejo, A.; Cobo, M.J. Software tools for conducting bibliometric analysis in science: An up-to-date review. Prof. De La Inf. 2020, 29, e290103. [Google Scholar] [CrossRef] [Green Version]
  25. Basaraba, N. The emergence of creative and digital place-making: A scoping review across disciplines. New Media Soc. 2021. Epub ahead of print. [Google Scholar] [CrossRef]
  26. Linnenluecke, M.K.; Chen, X.; Ling, X.; Smith, T.; Zhu, Y. Research in finance: A review of influential publications and a research agenda. Pac.-Basin Financ. J. 2017, 43, 188–199. [Google Scholar] [CrossRef] [Green Version]
  27. Janik, A.; Ryszko, A.; Szafraniec, M. Scientific landscape of smart and sustainable cities literature: A bibliometric analysis. Sustainability 2020, 12, 779. [Google Scholar] [CrossRef] [Green Version]
  28. Donthu, N.; Kumar, S.; Mukherjee, D.; Pandey, N.; Lim, W.M. How to conduct a bibliometric analysis: An overview and guidelines. J. Bus. Res. 2021, 133, 285–296. [Google Scholar] [CrossRef]
  29. Tricco, A.C.; Lillie, E.; Zarin, W.; O’Brien, K.K.; Colquhoun, H.; Levac, D.; Moher, D.; Peters, M.D.; Horsley, T.; Weeks, L. PRISMA extension for scoping reviews (PRISMA-ScR): Checklist and explanation. Ann. Intern. Med. 2018, 169, 467–473. [Google Scholar] [CrossRef] [PubMed] [Green Version]
  30. Liu, Y. The application of virtual reality in empathy establishment: Foresee the future. In Proceedings of the 2020 5th International Conference on Computational Intelligence and Applications (ICCIA), Beijing, China, 19–21 June 2022; pp. 188–193. [Google Scholar]
  31. Zha, D.; Melewar, T.; Foroudi, P.; Jin, Z. An assessment of brand experience knowledge literature: Using bibliometric data to identify future research direction. Int. J. Manag. Rev. 2020, 22, 287–317. [Google Scholar] [CrossRef]
  32. Kim, H.; So, K.K.F. Two decades of customer experience research in hospitality and tourism: A bibliometric analysis and thematic content analysis. Int. J. Hosp. Manag. 2022, 100, 103082. [Google Scholar] [CrossRef]
  33. Agapito, D. The senses in tourism design: A bibliometric review. Ann. Tour. Res. 2020, 83, 102934. [Google Scholar] [CrossRef]
  34. Palmatier, R.W.; Houston, M.B.; Hulland, J. Review articles: Purpose, process, and structure. J. Acad. Mark. Sci. 2018, 46, 1–5. [Google Scholar] [CrossRef] [Green Version]
  35. Tranfield, D.; Denyer, D.; Smart, P. Towards a methodology for developing evidence-informed management knowledge by means of systematic review. Br. J. Manag. 2003, 14, 207–222. [Google Scholar] [CrossRef]
  36. Rogers, G.; Szomszor, M.; Adams, J. Sample size in bibliometric analysis. Scientometrics 2020, 125, 777–794. [Google Scholar] [CrossRef]
  37. Witmer, B.G.; Singer, M.J. Measuring presence in virtual environments: A presence questionnaire. Presence 1998, 7, 225–240. [Google Scholar] [CrossRef]
  38. Shadmehr, R.; Mussa-Ivaldi, F.A. Adaptive representation of dynamics during learning of a motor task. J. Neurosci. 1994, 14, 3208–3224. [Google Scholar] [CrossRef]
  39. Yee, N.; Bailenson, J. The Proteus effect: The effect of transformed self-representation on behavior. Hum. Commun. Res. 2007, 33, 271–290. [Google Scholar] [CrossRef] [Green Version]
  40. Yee, N. The demographics, motivations, and derived experiences of users of massively multi-user online graphical environments. Presence Teleoper. Virtual Environ. 2006, 15, 309–329. [Google Scholar] [CrossRef]
  41. Bowman, D.A.; McMahan, R.P. Virtual reality: How much immersion is enough? Computer 2007, 40, 36–43. [Google Scholar] [CrossRef]
  42. Warren, W.H.; Kay, B.A.; Zosh, W.D.; Duchon, A.P.; Sahuc, S. Optic flow is used to control human walking. Nat. Neurosci. 2001, 4, 213–216. [Google Scholar] [CrossRef] [PubMed]
  43. Riva, G.; Mantovani, F.; Capideville, C.S.; Preziosa, A.; Morganti, F.; Villani, D.; Gaggioli, A.; Botella, C.; Alcañiz, M. Affective interactions using virtual reality: The link between presence and emotions. Cyberpsychol. Behav. 2007, 10, 45–56. [Google Scholar] [CrossRef] [PubMed]
  44. Brockmyer, J.H.; Fox, C.M.; Curtiss, K.A.; McBroom, E.; Burkhart, K.M.; Pidruzny, J.N. The development of the Game Engagement Questionnaire: A measure of engagement in video game-playing. J. Exp. Soc. Psychol. 2009, 45, 624–634. [Google Scholar] [CrossRef]
  45. Kilteni, K.; Groten, R.; Slater, M. The sense of embodiment in virtual reality. Presence Teleoper. Virtual Environ. 2012, 21, 373–387. [Google Scholar] [CrossRef] [Green Version]
  46. Usoh, M.; Catena, E.; Arman, S.; Slater, M. Using presence questionnaires in reality. Presence 2000, 9, 497–503. [Google Scholar] [CrossRef]
  47. Slater, M.; Steed, A. A virtual presence counter. Presence 2000, 9, 413–434. [Google Scholar] [CrossRef] [Green Version]
  48. Skarbez, R.; Brooks, J.; Frederick, P.; Whitton, M.C. A survey of presence and related concepts. ACM Comput. Surv. 2017, 50, 1–39. [Google Scholar] [CrossRef]
  49. Schubert, T.; Friedmann, F.; Regenbrecht, H. The experience of presence: Factor analytic insights. Presence Teleoper. Virtual Environ. 2001, 10, 266–281. [Google Scholar] [CrossRef]
  50. Slater, M.; Usoh, M.; Steed, A. Depth of presence in virtual environments. Presence Teleoper. Virtual Environ. 1994, 3, 130–144. [Google Scholar] [CrossRef]
  51. Steuer, J. Defining virtual reality: Dimensions determining telepresence. J. Commun. 1992, 42, 73–93. [Google Scholar] [CrossRef]
  52. Sheridan, T.B. Musings on telepresence and virtual presence. Presence Teleoper. Virtual Environ. 1992, 1, 120–125. [Google Scholar] [CrossRef]
  53. Slater, M.; Wilbur, S. A framework for immersive virtual environments (FIVE): Speculations on the role of presence in virtual environments. Presence Teleoper. Virtual Environ. 1997, 6, 603–616. [Google Scholar] [CrossRef]
  54. Lessiter, J.; Freeman, J.; Keogh, E.; Davidoff, J. A cross-media presence questionnaire: The ITC-Sense of Presence Inventory. Presence Teleoper. Virtual Environ. 2001, 10, 282–297. [Google Scholar] [CrossRef] [Green Version]
  55. Lombard, M.; Ditton, T. At the heart of it all: The concept of presence. J. Comput.-Mediat. Commun. 1997, 3, JCMC321. [Google Scholar] [CrossRef]
  56. Sanchez-Vives, M.V.; Slater, M. From presence to consciousness through virtual reality. Nat. Rev. Neurosci. 2005, 6, 332–339. [Google Scholar] [CrossRef]
  57. Witmer, B.G.; Jerome, C.J.; Singer, M.J. The factor structure of the presence questionnaire. Presence Teleoper. Virtual Environ. 2005, 14, 298–312. [Google Scholar] [CrossRef]
  58. Hartmann, T.; Wirth, W.; Schramm, H.; Klimmt, C.; Vorderer, P.; Gysbers, A.; Böcking, S.; Ravaja, N.; Laarni, J.; Saari, T. The spatial presence experience scale (SPES). J. Media Psychol. 2015, 28, 1–15. [Google Scholar] [CrossRef]
  59. Tussyadiah, I.P.; Wang, D.; Jung, T.H.; Tom Dieck, M.C. Virtual reality, presence, and attitude change: Empirical evidence from tourism. Tour. Manag. 2018, 66, 140–154. [Google Scholar] [CrossRef]
  60. Weibel, D.; Wissmath, B.; Habegger, S.; Steiner, Y.; Groner, R. Playing online games against computer-vs. human-controlled opponents: Effects on presence, flow, and enjoyment. Comput. Hum. Behav. 2008, 24, 2274–2291. [Google Scholar] [CrossRef]
  61. Kim, J.; Song, H. Celebrity’s self-disclosure on Twitter and parasocial relationships: A mediating role of social presence. Comput. Hum. Behav. 2016, 62, 570–577. [Google Scholar] [CrossRef]
  62. Sallnäs, E.-L. Effects of communication mode on social presence, virtual presence, and performance in collaborative virtual environments. Presence Teleoper. Virtual Environ. 2005, 14, 434–449. [Google Scholar] [CrossRef]
  63. Gordon, E.; Schirra, S.; Hollander, J. Immersive planning: A conceptual model for designing public participation with new technologies. Environ. Plan. B Plan. Des. 2011, 38, 505–519. [Google Scholar] [CrossRef]
  64. Riva, G.; Waterworth, J.A.; Waterworth, E.L.; Mantovani, F. From intention to action: The role of presence. New Ideas Psychol. 2011, 29, 24–37. [Google Scholar] [CrossRef]
  65. Slater, M.; Spanlang, B.; Corominas, D. Simulating virtual environments within virtual environments as the basis for a psychophysics of presence. ACM Trans. Graph. 2010, 29, 1–9. [Google Scholar] [CrossRef]
  66. Riva, G. Is presence a technology issue? Some insights from cognitive sciences. Virtual Real. 2009, 13, 159–169. [Google Scholar] [CrossRef]
  67. Ling, Y.; Nefs, H.T.; Morina, N.; Heynderickx, I.; Brinkman, W.-P. A meta-analysis on the relationship between self-reported presence and anxiety in virtual reality exposure therapy for anxiety disorders. PLoS ONE 2014, 9, e96144. [Google Scholar] [CrossRef]
  68. Ling, Y.; Nefs, H.T.; Brinkman, W.-P.; Qu, C.; Heynderickx, I. The relationship between individual characteristics and experienced presence. Comput. Hum. Behav. 2013, 29, 1519–1530. [Google Scholar] [CrossRef]
  69. Price, M.; Anderson, P. The role of presence in virtual reality exposure therapy. J. Anxiety Disord. 2007, 21, 742–751. [Google Scholar] [CrossRef] [PubMed] [Green Version]
  70. Bailenson, J.N.; Swinth, K.; Hoyt, C.; Persky, S.; Dimov, A.; Blascovich, J. The independent and interactive effects of embodied-agent appearance and behavior on self-report, cognitive, and behavioral markers of copresence in immersive virtual environments. Presence 2005, 14, 379–393. [Google Scholar] [CrossRef]
  71. Bailenson, J.N.; Yee, N.; Blascovich, J.; Beall, A.C.; Lundblad, N.; Jin, M. The use of immersive virtual reality in the learning sciences: Digital transformations of teachers, students, and social context. J. Learn. Sci. 2008, 17, 102–141. [Google Scholar] [CrossRef] [Green Version]
  72. Gillath, O.; McCall, C.; Shaver, P.R.; Blascovich, J. What can virtual reality teach us about prosocial tendencies in real and virtual environments? Media Psychol. 2008, 11, 259–282. [Google Scholar] [CrossRef]
  73. Mennecke, B.E.; Triplett, J.L.; Hassall, L.M.; Conde, Z.J.; Heer, R. An examination of a theory of embodied social presence in virtual worlds. Decis. Sci. 2011, 42, 413–450. [Google Scholar] [CrossRef]
  74. Teng, C.-I. Customization, immersion satisfaction, and online gamer loyalty. Comput. Hum. Behav. 2010, 26, 1547–1554. [Google Scholar] [CrossRef]
  75. Shin, D. Empathy and embodied experience in virtual environment: To what extent can virtual reality stimulate empathy and embodied experience? Comput. Hum. Behav. 2018, 78, 64–73. [Google Scholar] [CrossRef]
  76. Baños, R.M.; Botella, C.; Rubió, I.; Quero, S.; García-Palacios, A.; Alcañiz, M. Presence and emotions in virtual environments: The influence of stereoscopy. CyberPsychol. Behav. 2008, 11, 1–8. [Google Scholar] [CrossRef] [PubMed]
  77. Deb, S.; Carruth, D.W.; Sween, R.; Strawderman, L.; Garrison, T.M. Efficacy of virtual reality in pedestrian safety research. Appl. Ergon. 2017, 65, 449–460. [Google Scholar] [CrossRef]
  78. Kim, K.; Rosenthal, M.Z.; Zielinski, D.J.; Brady, R. Effects of virtual environment platforms on emotional responses. Comput. Methods Programs Biomed. 2014, 113, 882–893. [Google Scholar] [CrossRef] [PubMed]
  79. Rogers, L. Developing simulations in multi-user virtual environments to enhance healthcare education. Br. J. Educ. Technol. 2011, 42, 608–615. [Google Scholar] [CrossRef]
  80. Omale, N.; Hung, W.C.; Luetkehans, L.; Cooke-Plagwitz, J. Learning in 3-D multiuser virtual environments: Exploring the use of unique 3-D attributes for online problem-based learning. Br. J. Educ. Technol. 2009, 40, 480–495. [Google Scholar] [CrossRef]
  81. Schultze, U. Embodiment and presence in virtual worlds: A review. J. Inf. Technol. 2010, 25, 434–449. [Google Scholar] [CrossRef]
  82. Girvan, C. What is a virtual world? Definition and classification. Educ. Technol. Res. Dev. 2018, 66, 1087–1100. [Google Scholar] [CrossRef] [Green Version]
  83. Sherman, W.R.; Craig, A.B. Introduction to virtual reality. In Understanding Virtual Reality Interface, Application and Design; Springer: Berlin/Heidelberg, Germany, 2003; pp. 6–13. [Google Scholar]
  84. Duncan, I.; Miller, A.; Jiang, S. A taxonomy of virtual worlds usage in education. Br. J. Educ. Technol. 2012, 43, 949–964. [Google Scholar] [CrossRef] [Green Version]
  85. Nazir, S.; Totaro, R.; Brambilla, S.; Colombo, S.; Manca, D. Virtual reality and augmented-virtual reality as tools to train industrial operators. In Computer Aided Chemical Engineering; Elsevier: Amsterdam, The Netherlands, 2012; Volume 30, pp. 1397–1401. [Google Scholar]
  86. Rizzolatti, G.; Sinigaglia, C. Mirrors in the Brain: How Our Minds Share Actions and Emotions; Oxford University Press: Oxford, UK, 2008. [Google Scholar]
  87. Farshid, M.; Paschen, J.; Eriksson, T.; Kietzmann, J. Go boldly!: Explore augmented reality (AR), virtual reality (VR), and mixed reality (MR) for business. Bus. Horiz. 2018, 61, 657–663. [Google Scholar] [CrossRef]
  88. McMillan, K.; Flood, K.; Glaeser, R. Virtual reality, augmented reality, mixed reality, and the marine conservation movement. Aquat. Conserv. Mar. Freshw. Ecosyst. 2017, 27, 162–168. [Google Scholar] [CrossRef] [Green Version]
  89. Mostafavi, A. Architecture, biometrics, and virtual environments triangulation: A research review. Archit. Sci. Rev. 2021, 1–18. [Google Scholar] [CrossRef]
  90. Cowen, A.S.; Keltner, D. Self-report captures 27 distinct categories of emotion bridged by continuous gradients. Proc. Natl. Acad. Sci. USA 2017, 114, E7900–E7909. [Google Scholar] [CrossRef] [Green Version]
  91. Rao, M.; Dawarwadikar, M. Immersive Visualizations Using Augmented Reality and Virtual Reality. In Encyclopedia of Computer Graphics and Games; Lee, N., Ed.; Springer International Publishing: Cham, Switzerland, 2020; pp. 1–8. [Google Scholar]
  92. Pangilinan, E.; Lukas, S.; Mohan, V. Creating Augmented and Virtual Realities: Theory and Practice for Next-Generation Spatial Computing; O’Reilly Media, Inc.: Newton, MA, USA, 2019. [Google Scholar]
  93. Draper, J.V.; Kaber, D.B.; Usher, J.M. Telepresence. Hum. Factors 1998, 40, 354–375. [Google Scholar] [CrossRef]
  94. Slater, M. Measuring presence: A response to the Witmer and Singer presence questionnaire. Presence Teleoper. Virtual Environ. 1999, 8, 560–565. [Google Scholar] [CrossRef]
  95. Nilsson, N.C.; Nordahl, R.; Serafin, S. Immersion revisited: A review of existing definitions of immersion and their relation to different theories of presence. Hum. Technol. 2016, 12, 108–134. [Google Scholar] [CrossRef] [Green Version]
  96. Boughzala, I.; de Vreede, G.-J.; Limayem, M. Team collaboration in virtual worlds: Editorial to the special issue. J. Assoc. Inf. Syst. 2012, 13, 6. [Google Scholar] [CrossRef] [Green Version]
  97. Held, R.M.; Durlach, N.I. Telepresence. Presence Teleoper. Virtual Environ. 1992, 1, 109–112. [Google Scholar] [CrossRef]
  98. Bandara, D.; Song, S.; Hirshfield, L.; Velipasalar, S. A more complete picture of emotion using electrocardiogram and electrodermal activity to complement cognitive data. In Proceedings of the International Conference on Augmented Cognition, Toronto, ON, Canada, 17 July 2016; pp. 287–298. [Google Scholar]
  99. Souza, V.; Maciel, A.; Nedel, L.; Kopper, R. Measuring Presence in Virtual Environments: A Survey. ACM Comput. Surv. 2021, 54, 1–37. [Google Scholar] [CrossRef]
  100. Slater, M.; Lotto, B.; Arnold, M.M.; Sánchez-Vives, M.V. How we experience immersive virtual environments: The concept of presence and its measurement. Anu. De Psicol. 2009, 40, 193–210. [Google Scholar]
  101. Baños, R.M.; Botella, C.; Alcañiz, M.; Liaño, V.; Guerrero, B.; Rey, B. Immersion and emotion: Their impact on the sense of presence. Cyberpsychol. Behav. 2004, 7, 734–741. [Google Scholar] [CrossRef]
  102. Rebelo, F.; Noriega, P.; Duarte, E.; Soares, M. Using virtual reality to assess user experience. Hum. Factors 2012, 54, 964–982. [Google Scholar] [CrossRef]
  103. Rhiu, I.; Kim, Y.M.; Kim, W.; Yun, M.H. The evaluation of user experience of a human walking and a driving simulation in the virtual reality. Int. J. Ind. Ergon. 2020, 79, 103002. [Google Scholar] [CrossRef]
  104. Brade, J.; Lorenz, M.; Busch, M.; Hammer, N.; Tscheligi, M.; Klimant, P. Being there again–Presence in real and virtual environments and its relation to usability and user experience using a mobile navigation task. Int. J. Hum.-Comput. Stud. 2017, 101, 76–87. [Google Scholar] [CrossRef]
  105. Jin, S.-A.A. “I feel present. Therefore, I experience flow:” A structural equation modeling approach to flow and presence in video games. J. Broadcasting Electron. Media 2011, 55, 114–136. [Google Scholar] [CrossRef]
Figure 1. Number of publications and citations per year via WoS.
Buildings 12 00844 g001
Figure 2. Most prolific journals via WoS.
Buildings 12 00844 g002
Figure 3. Most prolific research areas.
Buildings 12 00844 g003
Figure 4. Most prolific authors.
Buildings 12 00844 g004
Figure 5. Most prolific affiliations.
Buildings 12 00844 g005
Figure 6. Most prolific countries.
Buildings 12 00844 g006
Figure 7. Map of author collaboration networks.
Buildings 12 00844 g007
Figure 8. Map of affiliation collaboration networks.
Buildings 12 00844 g008
Figure 9. Map of country collaboration networks.
Buildings 12 00844 g009
Figure 10. (a) The citation analysis map of influential publications; and (b) relationships involving the most influential publication, Witmer and Singer (1998) in the citation analysis map.
Buildings 12 00844 g010
Figure 11. Co-citation analysis map showing foundational themes and seminal publications of clusters (source: Authors).
Buildings 12 00844 g011
Figure 12. Bibliographic coupling analysis map showing development of literature themes and seminal publications in clusters.
Buildings 12 00844 g012
Figure 13. Co-occurrence analysis map of author keywords.
Buildings 12 00844 g013
Figure 14. Virtual reality—embodiment–presence continuum.
Buildings 12 00844 g014
Figure 15. The mind map of embodied experience in VEs drawn from the findings of performance analysis (Source: Authors).
Buildings 12 00844 g015
Figure 16. Classification of keywords into topics (Source: Authors).
Buildings 12 00844 g016
Table 1. The bibliometric analysis procedure.
Step 1. Defining the aims and scope of the bibliometric study
Comprehensive overview of research trends, productivity, and collaborations, to identify progress and insights in the virtual embodied experience domain.
RQ1. How is scientific productivity progressing in the virtual embodied experience?
RQ2. How is the research collaboration network formed in this domain?
RQ3. What is the research trend that has enhanced the embodied experience in the virtual environment?
Step 2. Choosing the techniques for bibliometric analysis
Scientific databases, WoS and bibliometric mapping software, VOSviewer
Step 3. Collecting the data for bibliometric analysis
Search termsEnvironment related(“virtual environment” or “virtual environments”) and
Embodied
related
(“embodied” or “embodiment” or “embodied cognition” or “immersion” or “presence” or “immersive”) and
Experience related(“experience” or “emotion” or “mind” or “behavior” or “feeling”)
PRISMA-ScR flow diagram
Identification2517 records identified in all fields through database searching
Screening2190 records identified on the topic327 records excluded
977 records selected by peer-review articles1213 records excluded
969 records selected by language (English)
EligibilityTitles and abstracts of articles manually assessed for eligibility to exclude non-relevant articles
Included969 included in quantitative analysis
Step 4. Running the bibliometric analysis
Performance analysisScience mapping
Summarizing the performance of prolific research indicators such as numbers of publications and citations; and rate of publication according to journal, research area, author, affiliation, and countryVisualizing the intellectual structure using citation and co-authorship analyses, and research themes and topics using co-citation analysis, bibliographic coupling, and co-occurrence analysis
Step 5. Delivering findings and their implications for future research
Step 6. Conclusions
Table 2. The top 10 most-cited papers in WoS search results for embodied experience in VEs.
Author(s)Year
Published
Paper TitleJournalCitation Count
1Witmer and Singer [37]1998Measuring presence in virtual environments: A presence questionnairePresence: Teleoperators & Virtual Environments2302
2Shadmehr and Mussa-Ivaldi [38]1994Adaptive representation of dynamics during learning of a motor taskJournal of Neuroscience1678
3Yee and Bailenson [39]2007The Proteus Effect: The effect of transformed self-representation on behaviorHuman Communication Research642
4Yee [40]2006The demographics, motivations, and derived experiences of users of massively multi-user online graphical environmentsPRESENCE: Virtual & Augmented Reality602
5Bowman and McMahan [41]2007Virtual reality: How much immersion is enough?Computer485
6Warren, et al. [42]2001Optic flow is used to control human walkingNature Neuroscience440
7Riva, et al. [43]2007Affective interactions using virtual reality: The link between presence and emotionsCyberpsychology & Behavior392
8Brockmyer, et al. [44]2009The development of the Game Engagement Questionnaire: A measure of engagement in video game-playingJournal of Experimental Social Psychology387
9Kilteni, et al. [45]2012The sense of embodiment in virtual realityPresence: Teleoperators & Virtual Environments354
10Usoh, et al. [46]2000Using presence questionnaires in realityPresence: Teleoperators & Virtual Environments349
Table 3. The top 10 most prolific journals.
No.Journal TitleNumber of Papers% of 969
1Presence: Teleoperators & Virtual Environments464.747
2Computers in Human Behavior414.231
3Virtual Reality404.128
4CyberPsychology & Behavior272.786
5IEEE Transactions on Visualization & Computer Graphic242.477
6Frontiers in Psychology202.064
7International Journal of Human–Computer Studies202.064
8PLOS One202.064
9Applied Sciences–Basel171.754
10Cyberpsychology, Behavior, & Social Networking161.651
PRESENCE: Virtual and Augmented Reality161.651
Table 4. The top 10 most prolific research areas.
No.Research AreaNumber of Papers% of 969
1Computer Science35836.945
2Psychology24825.593
3Engineering23123.839
4Communication616.295
5Neurosciences Neurology616.295
6Education Educational Research545.573
7Science Technology Other Topics444.541
8Imaging Science Photographic Technology434.438
9Chemistry323.302
10Telecommunications282.890
Table 5. The top 10 most prolific authors.
AuthorAffiliationCountryDocuments% of 969
1Slater, M.University of Barcelona
Department of Clinical Psychology & Psychobiology
Spain202.064
2Bailenson, J.N.Stanford University
Department of Communication
USA161.651
3Alcaniz, M.Polytechnic University of Valencia
Department of Biomedical Engineering
Spain151.548
4Riva, G.Catholic University of Sacred heart
Department of Psycology
Italy151.548
5Blascovich, J.University of California Santa Barbara
Department of Psychology & Brain Science
USA141.445
6Plumert, J.M.University of Iowa
Department of Psychology & Brain Science
USA131.342
7Kearney, J.K.University of Iowa
Department of. Computer Science
USA121.238
8Kim, J.Hansung University
Division of Computer Engineering
South Korea90.929
9Bailenson, J.Stanford University
Department of Communication
USA80.826
O’Neal, E.E.University of Iowa
Department of Psychology & Brain Science
USA80.826
Table 6. The top 10 most prolific affiliations.
AffiliationRecord Count
1University of London34
2Stanford University27
3University College London25
4University of California System21
5State University System of Florida18
6University of Barcelona17
7University of Southern California17
8Centre National de la Recherche Scientifique 16
9Universitat Politecnica de Valencia16
10Catalan Institution for Research and Advanced Studies15
IRCCS Istituto Auxologico Italiano15
Table 7. The top 10 most prolific countries.
CountryRecord Count% of 969
1USA30831.78
2England11111.45
3Germany798.15
4Spain697.12
5Italy636.50
6China636.50
7Canada555.67
8France535.47
9South Korea525.36
10Netherlands464.74
Table 8. Top three most influential publications with the strongest relationship resulting from citation analysis.
Author(s)Year PublishedPaper TitleCitation CountLinks
1Witmer and Singer [37]1998Measuring presence in virtual environments: A presence questionnaire230232
2Skarbez, Brooks and Whitton [48]2018A survey of presence and related concepts10716
3Slater and Steed [47]2000bA virtual presence counter25213
Table 9. Top 12 most co-cited publications identified through co-citation analysis of cited references showing thematic clusters and seminal publications ranked by link strength.
Foundational ThemeSeminal PublicationTopic/KeywordCitationsTotal Link Strength
Cluster 1 (blue)
of 20 documents:
Methodological perspective—methodology of presence assessment
Witmer and Singer, 1998 [37]Virtual environments (VEs)
Presence as a normal awareness phenomenon
Presence Questionnaire (PQ)
Immersive Tendencies Questionnaire (ITQ)
2221303
Schubert et al., 2001 [49]Virtual environment (VE)
Embodied cognition framework
Presence in a VE using a spatial–functional mental model: presence (the representation of bodily actions,), immersion/involvement (the suppression of incompatible sensory input), and realness
105767
Slater et al., 1994 [50]Level of presence in immersive virtual environments; “stacking depth”65522
Cluster 2 (red)
of 28 documents:
Theoretical
perspective—theory of definition and concepts of presence and its measurable variables
Steuer J, 1992 [51]Defining virtual reality94691
Sheridan, 1992 [52]Three measurable physical variables of telepresence and virtual presence assessment72638
Slater and Wilbur, 1997 [53]Concepts of immersion and presence in virtual environments (VEs): Immersion accessed by technology, presence as a state of consciousness with immersion83621
Lessiter, 2001 [54]ITC—Sense of Presence Inventory (ITC-SOPI): Sense of physical space, engagement, ecological validity, and negative effects discussed in the literature68616
Cluster 3 (green)
of 21 documents:
Scientific
perspective—neuroscientific perspective of the concept of presence
Lombard and Ditton, 1997 [55]The concept of presence: Physiological and psychological effects of presence84581
No title captured-196545
Sanchez-Vives and Slater, 2005 [56]Presence from a neuroscientific perspective67467
Cluster 4 (yellow)
of 2 documents:
Intermediate methodological and theoretical perspective
Witmer et al., 2005 [57]4 factors of Presence Questionnaire (PQ): Involvement, adaptation/immersion, sensory fidelity, and interface quality38314
Bowman and McMahan, 2007 [41]The goal of immersive virtual environments (VEs) through a sense of presence25171
Table 10. Top 12 seminal publications and thematic clusters through bibliographic coupling analysis of citing references.
ThemeSeminal PublicationTitle of PublicationCitationsTotal Link Strength
Cluster 1 (blue)
of 16 documents:
Diverse application of presence
Skarbez et al., 2018 [48]A survey of presence and related concepts107363
Hartmann et al., 2016 [58]The Spatial Presence Experience Scale (SPES): A short self-report measure for diverse media settings66262
Tussyadiah et al., 2018 [59]Virtual reality, presence, and attitude change: Empirical evidence from tourism215202
Weibel et al., 2008 [60]Playing online games against computer- vs. human-controlled opponents: Effects on presence, flow, and enjoyment224146
Cluster 2 (cyan)
of 11 douments:
Social presence
in media
Kim and Song, 2016 [61]Celebrity’s self-disclosure on Twitter and parasocial relationships: A mediating role of social presence90248
Sallnäs, 2005 [62]Effects of communication mode on social presence, virtual presence, and performance in collaborative virtual environments60126
Gordon et al., 2011 [63]Immersive planning: A conceptual model for designing public participation with new technologies54105
Cluster 3 (brown)
of nine documents:
Presence from a
cognitive sciences perspective
Riva et al., 2011 [64]From intention to action: The role of presence83232
Slater et al., 2010 [65]Simulating virtual environments within virtual environments as the basis for a psychophysics of presence81134
Riva, 2009 [66]Is presence a technology issue? Some insights from cognitive sciences58103
Cluster 4 (purple)
of 13 documents:
Presence and exposure therapy
Ling et al., 2014 [67]A meta-analysis on the relationship between self-reported presence and anxiety in virtual reality exposure therapy for anxiety disorders78181
Ling et al., 2013 [68]The relationship between individual characteristics and experienced presence53145
Price and Anderson, 2007 [69]The role of presence in virtual reality exposure therapy100139
Cluster 5 (green)
of 25 documents:
Behavior and
embodiment
Bailenson et al., 2005 a [70]The independent and interactive effects of embodied-agent appearance and behavior on self-report, cognitive, and behavioral markers of co-presence in immersive virtual environments162175
Bailenson et al., 2008 [71]The use of immersive virtual reality in the learning sciences: Digital transformations of teachers, students, and social context191162
Gillath et al., 2008 [72]What can virtual reality teach us about prosocial tendencies in real and virtual environments?73128
Yee, (2007) [39]The Proteus Effect: The effect of transformed self-representation on behavior642142
Cluster 6 (yellow)
of 13 documents:
Embodied presence
Mennecke et al., 2011 [73]An examination of a theory of embodied social presence in virtual worlds84171
Teng, 2010 [74]Customization, immersion satisfaction, and online gamer loyalty12194
Shin, 2018 a [75]Empathy and embodied experience in virtual environment: To what extent can virtual reality stimulate empathy and embodied experience?17472
Cluster 7 (orange)
of 10 documents:
Presence measures
Slater and Steed, 2000b [47]A virtual presence counter252158
Usoh et al. 2000 [46]Using Presence Questionnaires in reality349144
Baños et al., 2008 [76]Presence and emotions in virtual environments: The Influence of Stereoscopy96124
Cluster 8 (red)
of 26 documents:
Effectiveness of VR
Deb et al., 2017 [77]Efficacy of virtual reality in pedestrian safety research75129
Kim et al., 2014 [78]Effects of virtual environment platforms on emotional responses71113
Using virtual reality to assess user experience68101
Cluster 9 (violet)
of three documents:
VEs in education
Rogers (2011) [79]Developing simulations in multi-user virtual environments to enhance healthcare education503
Omale et al., (2009) [80]Learning in 3D multiuser virtual environments: Exploring the use of unique 3D attributes for online problem-based learning522
Table 11. Top 10 most co-occurring keywords colored by clusters and their relationships (Source: Authors).
KeywordOccurrencesTotal Link Strength
1virtual reality315443
2presence124255
3virtual environments80164
4immersion45136
5user experience2564
6virtual environment4656
7embodiment2452
8head-mounted display1550
9avatars2248
10task analysis941
Table 12. VE-related terms.
Virtual Reality (Red Cluster)Virtual Environments (Blue Cluster)Virtual Environment (Yellow Cluster)
Buildings 12 00844 i001 Buildings 12 00844 i002 Buildings 12 00844 i003
Table 13. Embodiment integrated experience in VEs.
PresenceImmersionUser Experience
Buildings 12 00844 i004 Buildings 12 00844 i005 Buildings 12 00844 i006
Publisher’s Note: MDPI stays neutral with regard to jurisdictional claims in published maps and institutional affiliations.

