Review

Application of Nondestructive Testing Technology in Quality Evaluation of Plain Concrete and RC Structures in Bridge Engineering: A Review

1
School of Water Conservancy Engineering, Zhengzhou University, Zhengzhou 450001, China
2
Sinosteel Zhengzhou Research Institute of Steel Wire Products Co., Ltd., Zhengzhou 450001, China
*
Author to whom correspondence should be addressed.
Buildings 2022, 12(6), 843; https://doi.org/10.3390/buildings12060843
Submission received: 7 May 2022 / Revised: 10 June 2022 / Accepted: 11 June 2022 / Published: 16 June 2022
(This article belongs to the Special Issue Advances in NDT: Theories, Techniques, and Engineering Applications)

Abstract

:
The development and application of nondestructive testing technology for prestressed reinforced concrete structures in the field of infrastructure construction were summarized in this study via the analysis of relevant literature worldwide. The detection methods, detection principles, and detection instruments in quality evaluation of prestressed reinforced concrete structures were analyzed and compared, based on which, acoustic emission detection technology, impact echo detection technology, ultrasonic detection technology, infrared thermography detection technology, ground-penetrating radar detection technology, piezoelectric transducer detection technology, and X-ray detection technology were summarized. Additionally, the advantages, disadvantages, and application scope of each detection method were focused upon and analyzed comparatively. It is indicated that further improvement in the detection visualization, accuracy, and efficiency for most nondestructive testing technologies is available by optimizing the algorithm and combining artificial intelligence technology with neural network deep learning, precise positioning, and imaging analysis of the quality defects in prestressed reinforced concrete structures. The results of this study can provide technical reference for the further application and research of nondestructive testing technologies in the quality inspection of prestressed reinforced concrete structures.

1. Introduction

Recently, with the continuous expansion of infrastructure construction throughout the world, the scale of bridge construction has increased significantly. It is reported that more than 800,000 road bridges have been built in China. The total length of high-speed railway bridges exceeds 10,000 km. The high-speed railway is 22,000 km, accounting for more than 50 percent of the total length of the line. By 2030, 45,000 km of high-speed rail will be completed, forming a high-speed rail network with 8 vertical and 8 horizontal lines. As a result, bridges have become a calling card for profitable and efficient infrastructure construction in China.
The quality of bridge construction is very important for the safety of people and properties as well as the national economy [1]. In recent years, there have been reports of bridge fracture and collapse accidents continuing to occur worldwide [2,3,4], which has been a cause of concern for engineering and technical researchers. Regular quality inspection technology of engineering structures in service must be improved, and the quality monitoring of buildings in the process of construction should be strengthened. NDT of civil engineering can be used to evaluate the stability, integrity, and quality monitoring of old and new buildings and to monitor their quality status. NDT can serve the role of supervision, diagnosis, and measurement in an environmentally friendly and economical manner [5]. In the construction of bridge structures, the number of prestressed concrete bridges accounts for more than 95% of the total. The compactness of prestressed duct grouting is the key factor that affects the service life of prestressed concrete structures [6]. The scientific and accurate detection of the grouting quality of prestressed ducts of prestressed concrete structures has gradually become a research hotspot for most scientific and technological workers and quality inspection departments. Compared with traditional damage detection methods, NDT has been particularly favored by the majority of scientific researchers because of its non-destructive, mutual compatibility, dynamic, and other advantages [7,8,9,10,11,12,13,14,15].
Rehman et al. [16] and Lin et al. [17] summarized the research methods, advantages, and disadvantages, and the latest research progress on NDT methods (such as IE, UT, GPR, and IRT) for concrete bridges. Consequently, the applicability of different methods was determined. He et al. [18] summarized the development status of bridge structure detection and evaluation technology. A complete set of prestress detection technology was emphasized that could achieve quantitative testing of the four key parameters of prestress, including prestress reinforcement tension, steel corrosion, pipe grouting compaction, and prestress pipeline positioning.
Scott et al. [19] evaluated the bridge deck structure based on the GPR, chain drag, and IE and consequently verified the accuracy of the detection results by using bridge deck coring. Further, considering the characteristics of the dynamic response of defective concrete under impact load, Mori et al. [20] conducted tests and numerical simulations on artificial defective concrete specimens of different sizes using non-contact equipment to generate impact. Experimental results showed that this method is effective for defect detection in the shallow range. Wu et al. [9] and Sack et al. [21] found that the IE was suitable for the location and thickness determination of structure. The surface wave spectrum analysis method is suitable for defect location in tunnels, pavement, floor slab, shaft lining, and some large concrete structures.
In terms of grouting compactness detection of prestressed concrete bridges, scholars have done a lot of research work. Li et al. [22,23] used a pre-capacitance sensor to evaluate the quality of a post-tensioned prestressed conduit and proposed a measurement method of the quality factor based on the central frequency to detect the boundary between air and cement or air and water. Terzioglu et al. [7] artificially arranged the common grouting quality defects in the internal pipeline of post-tensioned box girders and conducted an experimental study on the performance of slurry defects with GPR, IE, and UT. Guo et al. [24] used the multi-sensor mechatronics impedance method to monitor the grouting compactness of tendon ducts. The resonance frequency coupled each piezoelectric ceramic with the physical characteristics of the local structure, which was able to capture the multi-peak impedance of multiple PZT in series. Li et al. [25] introduced the IE method based on the HHT method to detect the grouting quality of plastic pipes in PC structures. Firstly, the concrete thickness frequency was measured. Then, the irrelevant frequency components were filtered out with a band-pass filter. Finally, the Hilbert marginal cumulative spectrum was established. The results showed that the thickness frequency gradually decreases with a decrease in the grouting compactness.
In addition, certain scholars have studied the properties of grouting materials. Kamalakannan et al. [8] studied the grouting materials in the post-tensioning system and adopted a two-stage test scheme to evaluate the hardening characteristics of seven commercial grouts. To ensure the reliability of the results, batch grouting tests were conducted on each grouting material. Liu et al. [26] improved the ultrasonic longitudinal guided wave detection of PC strands by exploiting the magneto-strictive effect. Combined with experiments and finite element analysis, it was found that three axisymmetric permanent magnets can significantly improve the performance of magneto-strictive transducers to generate and receive axisymmetric longitudinal guided waves. Yong-Sik et al. [27] studied the grouting characteristics of two types of grouting and the corrosion mode of pouring conditions. The results indicated that the corrosion resistance of the improved grouting is significantly improved. Guo et al. [28] studied the influence of grouting fullness defect and local grouting length on the grouting effect and the bonding performance of prestressed steel strands. The bond strength formula was obtained by fitting the test data.
In addition, optical methods such as 3D laser vibration measurement (3D LDV) [29,30,31] and digital Image correlation (DIC) [32,33,34,35] were used to evaluate concrete structures and bridges. Huiheng et al. [36] applied Scanning Electron Microscopy (SEM) technology to conduct a meso-analysis of the stress mechanism of basalt fiber nano-CaCO3 concrete (BFNCC); combined with the results of Digital Image Correlation (DIC) technology, the fracture mechanical properties and the stress mechanism of BFNCC were revealed. Azzeddine et al. presented a new post-processing methodology for DIC, which allowed assessing the evolution of the local fracture energy and the length of the fracture process zone (FPZ) during the wedge splitting test [37]. Light absorption-induced thermoelastic and photoacoustic excitation, combined with laser Doppler vibrometry, was utilized to analyze the dynamic mechanical behavior of a microcantilever [38]. It was found that 3D-DIC exhibits compelling capacity in dynamic testing, especially for nondestructive damage detection [39].
Recently, the research on nondestructive testing to evaluate the quality of building structures has been focused on using elastic wave and electromagnetic wave propagation methods. Among them, ultrasonic echo, IE, and GPR are recognized as characterization and analysis tools that are extensively used in the NDT of PC structures [40]. The key factor for the success of the nondestructive testing program was the correct selection of testing methods. Each testing method possesses advantages and limitations, and thus a variety of testing methods should be used to improve the confidence in nondestructive testing [41]. In the field of civil engineering, NDT technology primarily includes the following common methods: acoustic emission (AE), impact echo (IE), ultrasonic testing (UT), infrared thermography (IRT), ground-penetrating radar (GPR), piezoelectric transducer (PZT), and X-ray. This study summarizes the above detection methods and presents their disadvantages, advantages, and scope of application, which can serve as a technical reference for the application of NDT technology in the quality evaluation of reinforced concrete structures in the future and provide a theoretical basis for the further development of NDT technology.

2. Development History of Nondestructive Testing Technology

Nondestructive testing has experienced three development stages: nondestructive inspection, testing, and evaluation. There is no absolute point in time dividing these three stages, and there is mutual inheritance and development. Their primary characteristics are as follows.

2.1. Nondestructive Inspection

Nondestructive testing technology refers to the nondestructive testing of specific objects without damaging the internal and external structures and organization of the tested object. It aims to master the internal conditions of the structure, provide a basic reference, and serve as a means for considering corresponding reinforcement and other technical treatment measures. This technology was primarily used in the 1950s and 1960s worldwide. As the primary stage of nondestructive testing, it is characterized by simple technology. In terms of technical means, it is relatively singular, primarily employing ultrasonic, ray, and other technologies. Primarily, NDI involves finding whether the test piece has defects or abnormalities. The basic task is to determine defects in parts or components without damaging the product. The detection conclusions are divided into two categories, defective and non-defective. Relevant national departments have considered the application and development of NDT technology crucial and thus implemented a series of important policies and regulations in terms of unified standards, policy formulation, and environmental optimization. Moreover, the practical advantages of nondestructive testing technology are primarily reflected in high testing efficiency, fewer external influencing factors, high precision, and low cost [42].

2.2. Nondestructive Testing

With the continuous progress of science and technology, particularly the increasing demand for nondestructive testing technology in production, it is evident that simply detecting defects cannot satisfy the actual needs of the people. The development stage of nondestructive testing includes identifying whether the test piece contains defects but also mastering more information through testing regarding the test piece, such as the structure, nature, and location of defects [5]. For developed industrial countries, this stage began in the late 1970s or early 1980s. Non-destructive testing not only uses the characteristics of sound, light, electricity, and magnetism to detect defects in the inspected structure without damaging the service performance of the inspected structure but also provides information such as the nature, size, quantity, and location of the defects to determine the technical state of the inspected object [43]. In the field of engineering, NDT technology plays an irreplaceable role in the condition evaluation of existing structures, quality control of new buildings, and quality assurance of maintenance engineering [16]. Nondestructive testing and evaluation technology is an applied engineering technology developed based on materials science, fracture mechanics, physics, mechanical engineering, computer technology, electronics, information technology, and artificial intelligence.

2.3. Nondestructive Testing Evaluation

NDT technology could meet the needs of most industrial production in the second stage. The continuous improvement of quality requirements for materials and components designed for the safety and economy of in-service equipment led to the third phase of NDT technology. A landmark event was the 14th World Congress on Nondestructive Testing, held in New Delhi in 1996. At this conference, an important view of transforming NDT into nondestructive evaluation was proposed and soon accepted by the nondestructive testing community. At this stage, information such as the presence, location, attribute, and size of defects must be mastered, and the impact of these characteristics of defects on the comprehensive performance indexes of the tested components must be evaluated and analyzed. Finally, relevant conclusions on the comprehensive indexes need to be presented. At present, industrially developed countries are already at this stage of development. Certain other countries are still focused on second-stage technology, while others are already in the development transition from the second to the third stage.

3. Application of Nondestructive Testing Technology in Reinforced Concrete Structure

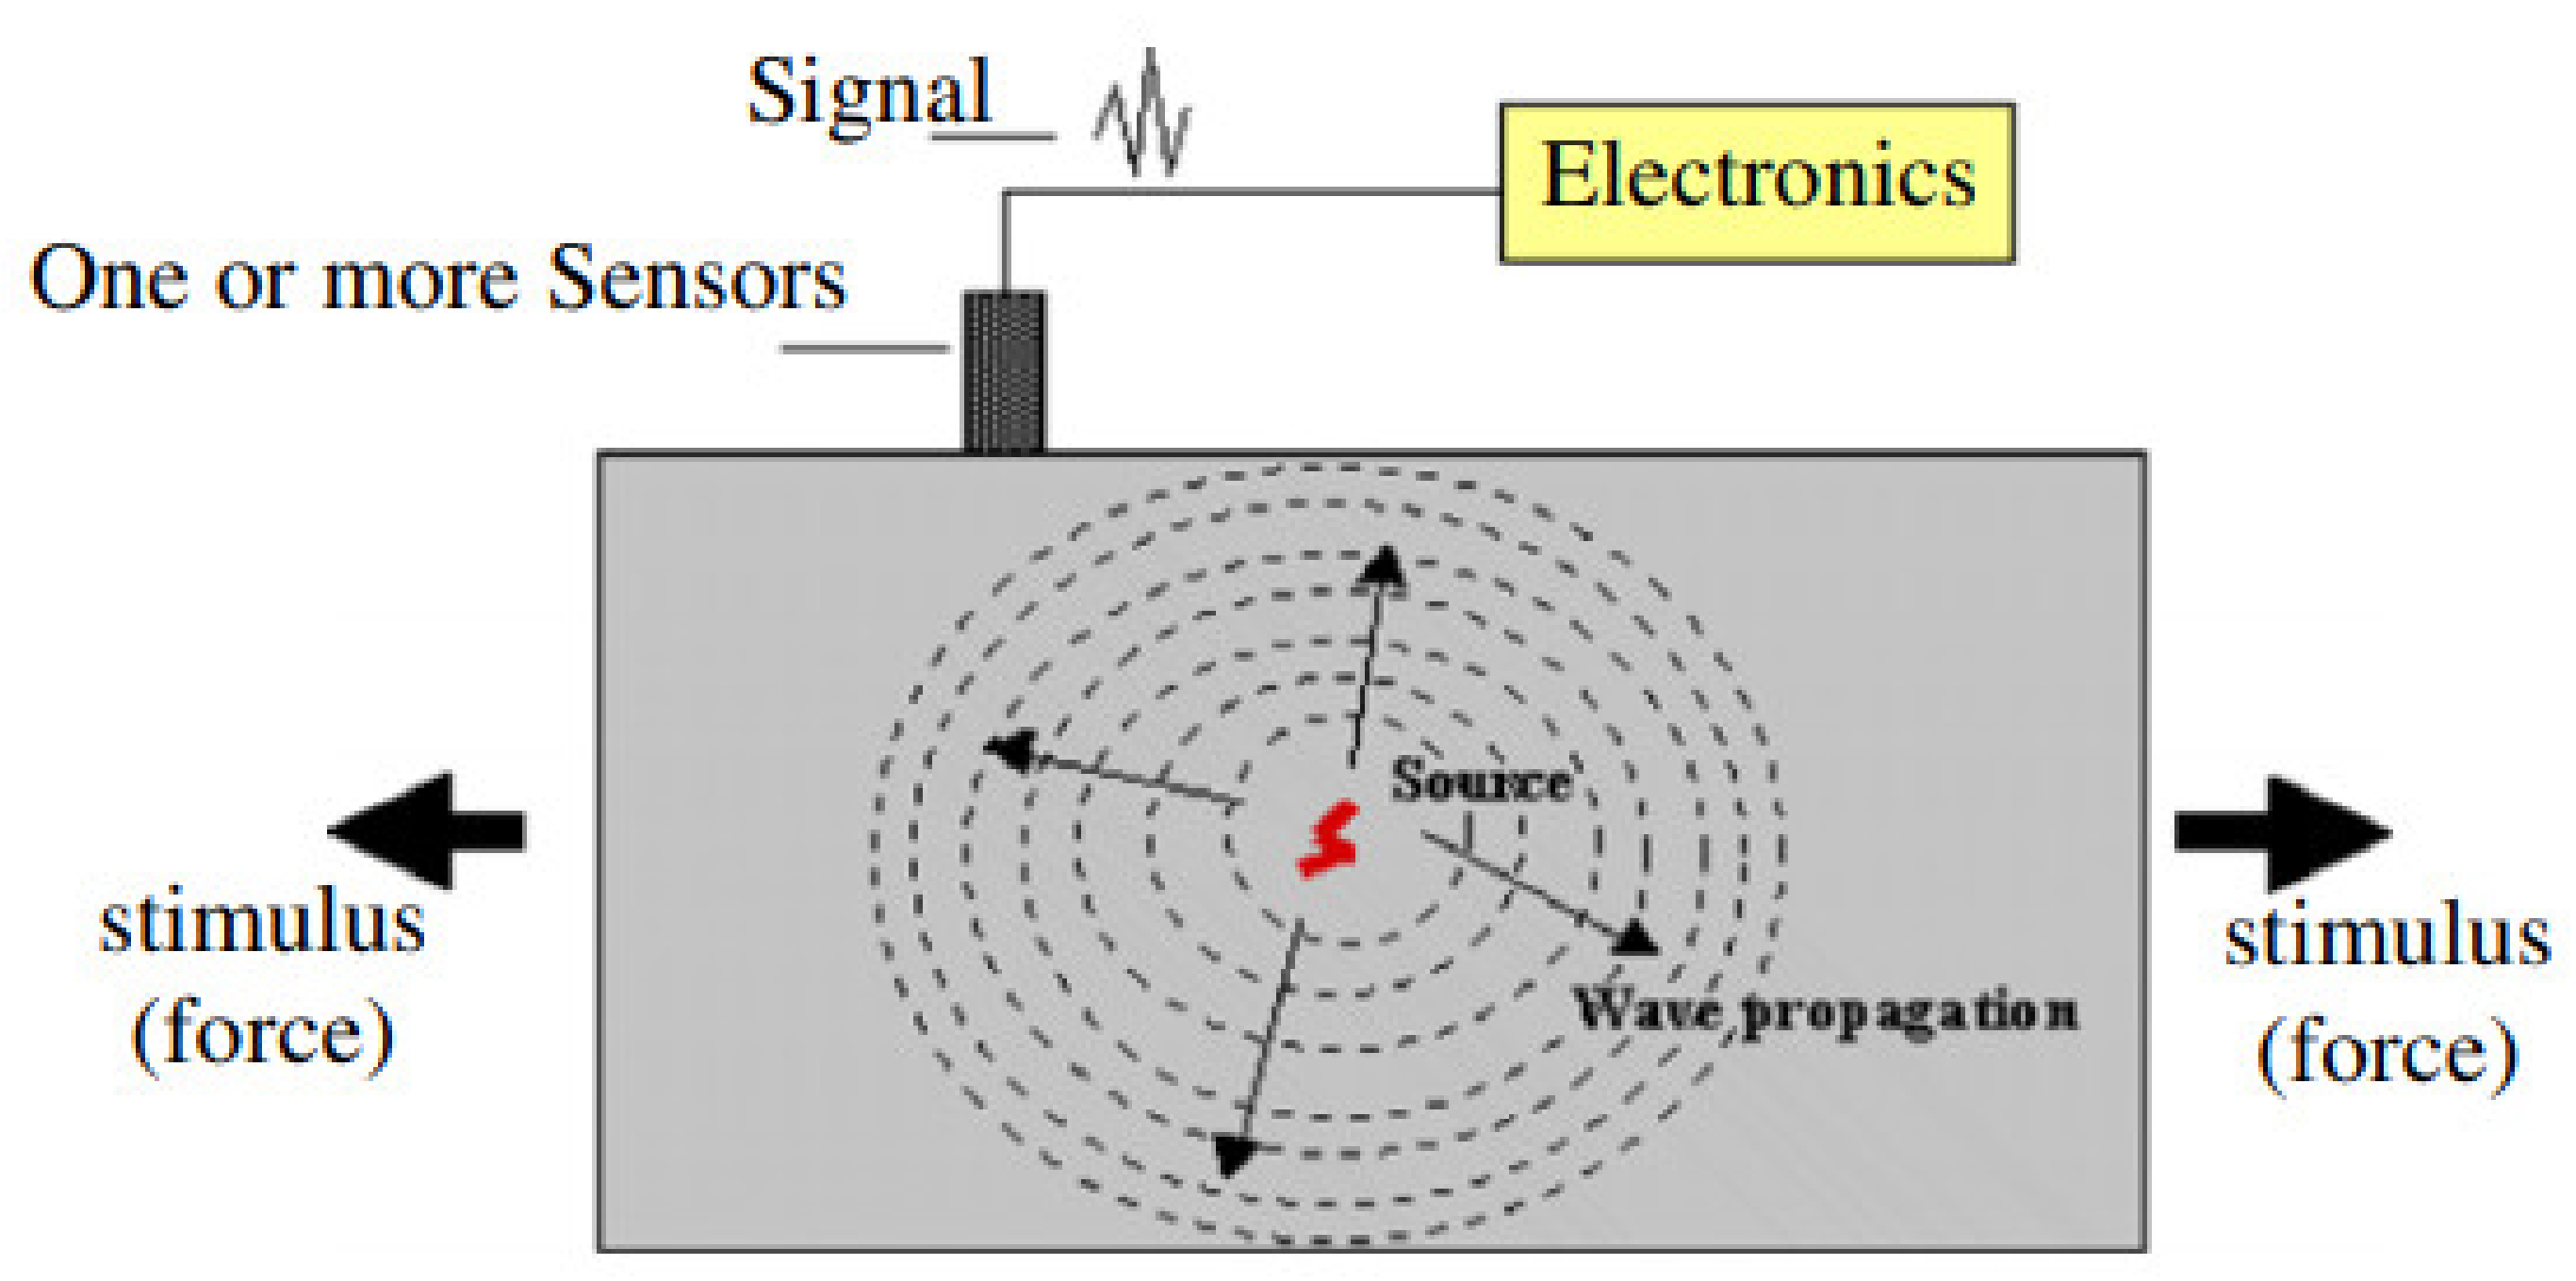
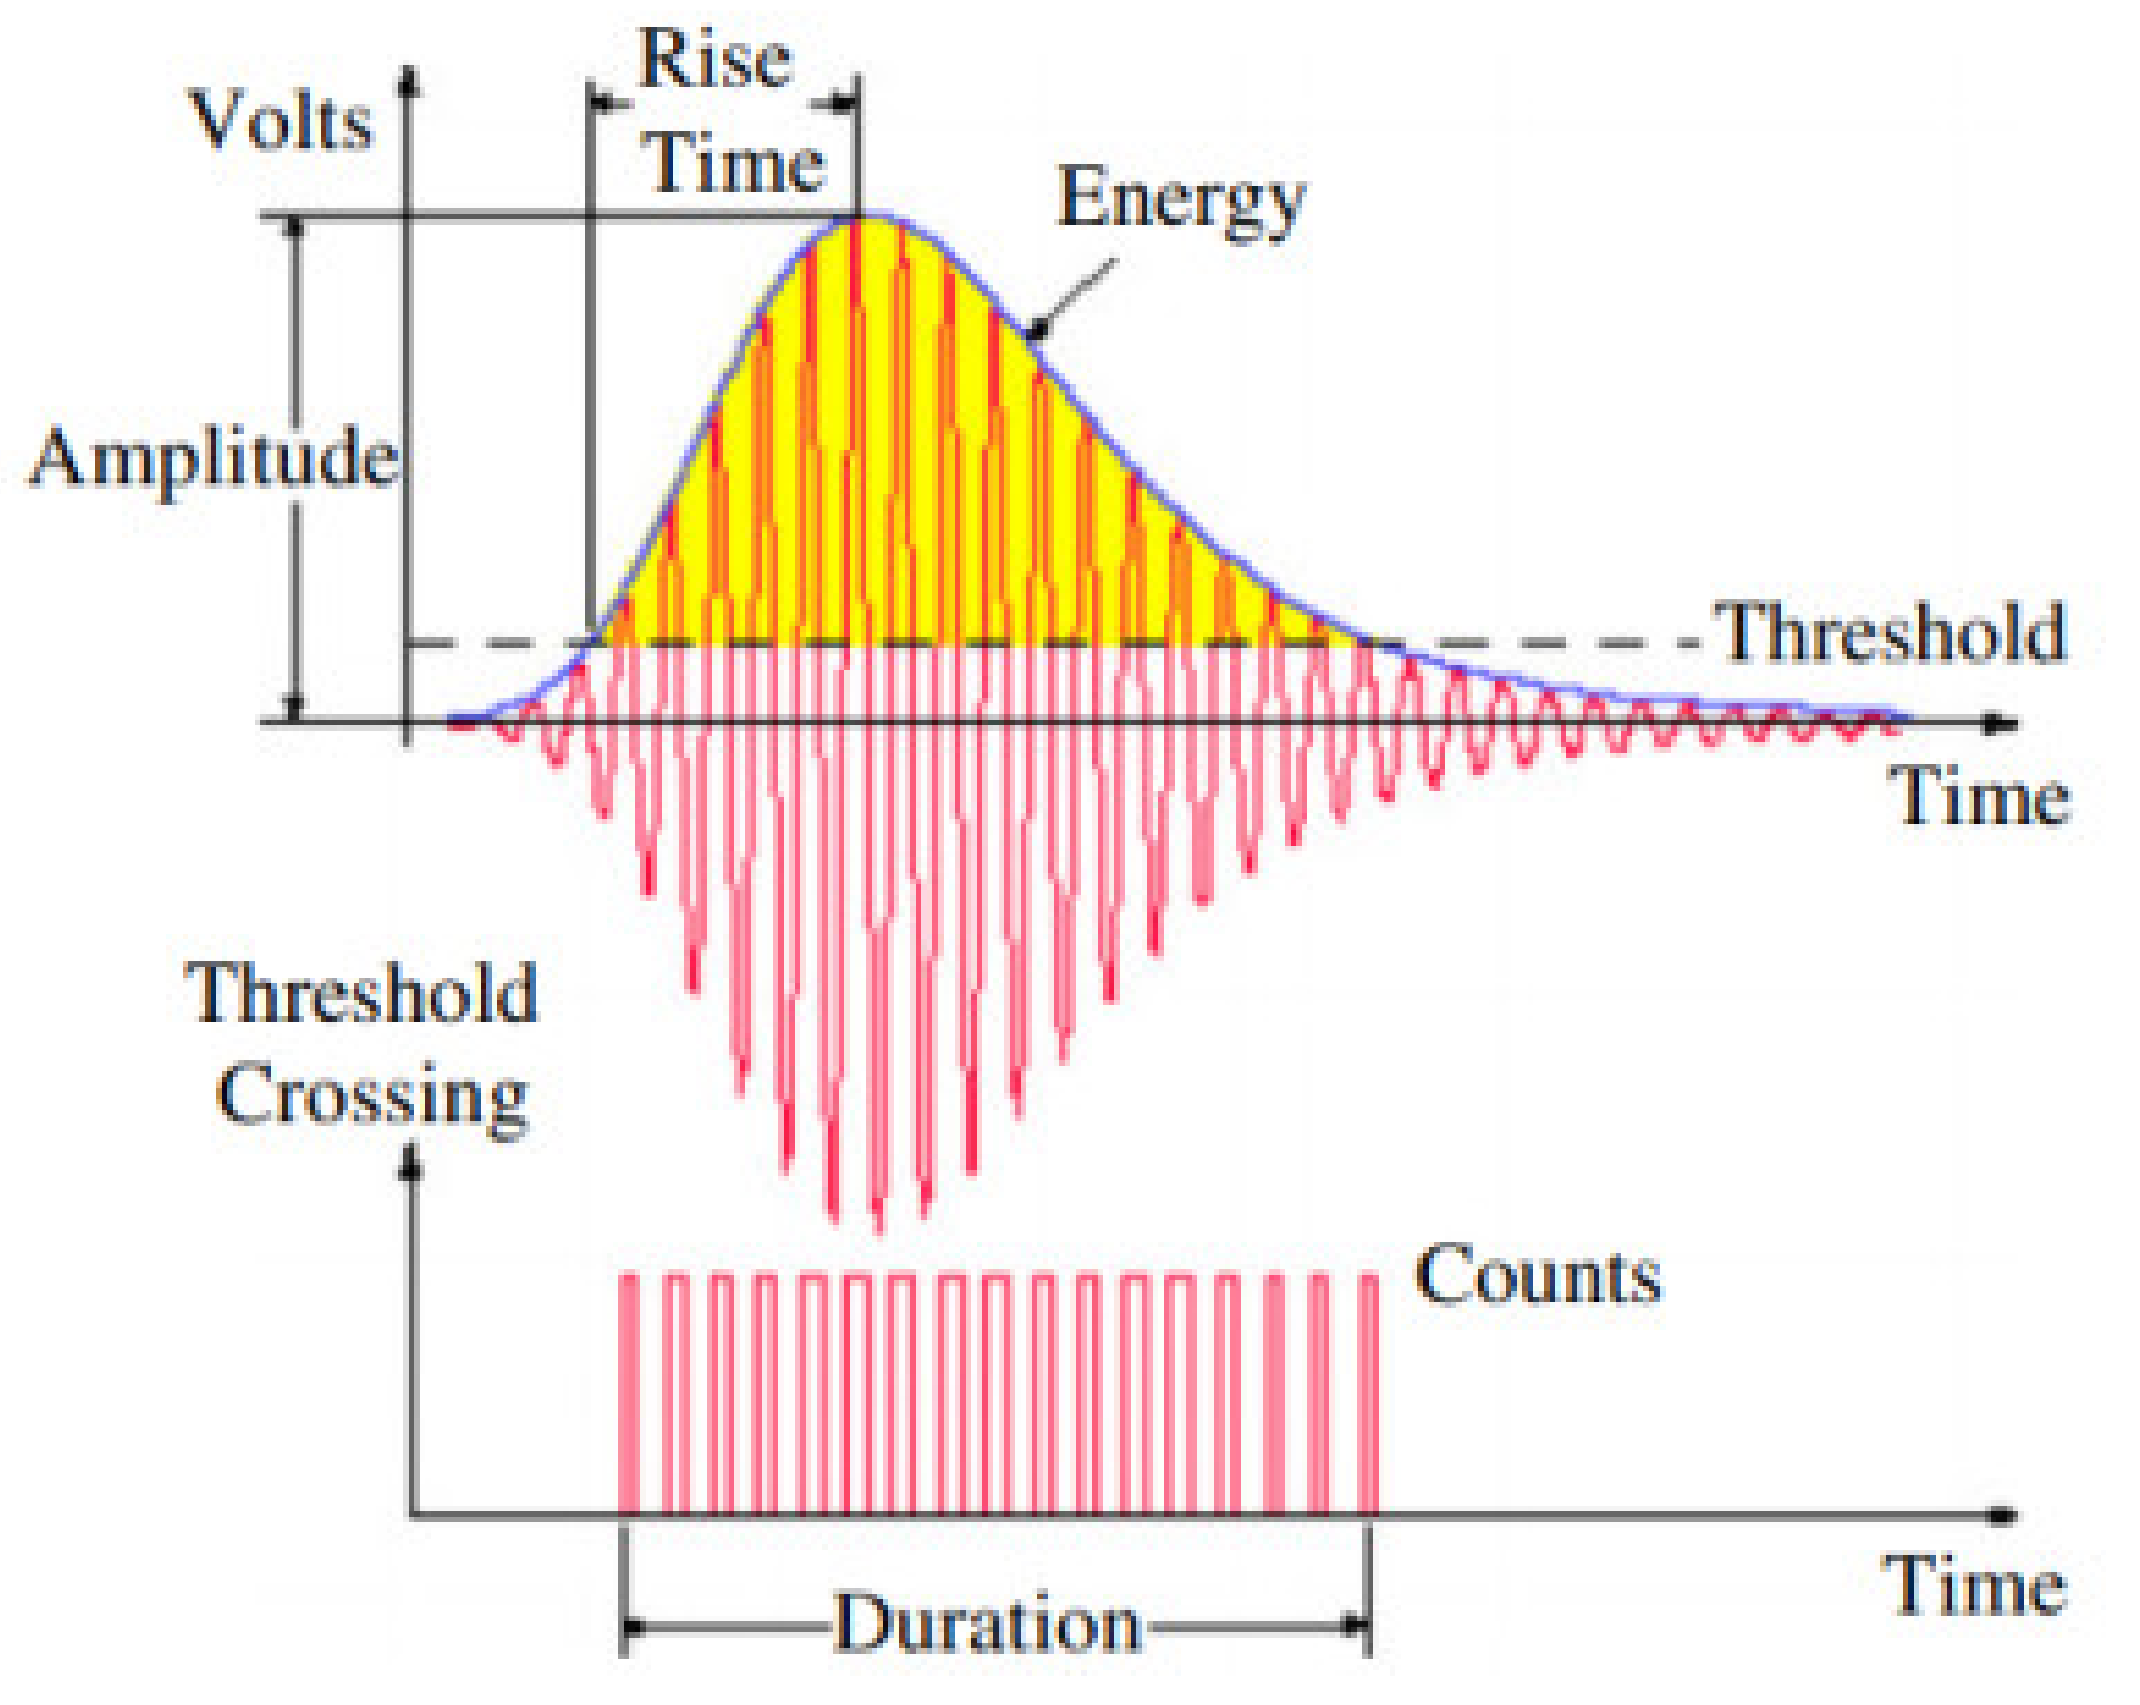
3.1. Acoustic Emission

AE is a type of transient elastic wave generated by the rapid release of energy from local sources. The acoustic monitoring system is composed of material deformation as the excitation source and sensors as the receiving source to receive the generated stress wave. The schematic shown in Figure 1 is the general working principle of an acoustic monitoring system [44]. A generalized theory of AE based on elasticity was proposed in the last century [45]. It has been reported that the applicability of this theory is closely related to the characteristic length of the material [46]. In the frequency range of less than 50 kHz, the wavelength of elastic waves in concrete is typically larger than the size of the aggregate. Therefore, concrete could reasonably be understood as employing uniform elastodynamics, which is used to handle stress waves caused by external forces or impacts and AE waves caused by cracking [47]. The governing equations of elastodynamics are referred to as Navier–Stokes equations [46].
u k x , t = s G k i x , y , t t i y , t T k i ( x , y , y u i y , t d S
where G k i is the Green’s function; T k i is the derived traction force; t i is the traction force, and u i is the displacement on the surface. Equation (1) is called the basic equation of the boundary element method (BEM) for numerical analysis [48],
In AE generalized theory [45], Separate (1) to obtain (2) and (3)
u k x , t = G k i x , y , t f i
u k x , t = s T k i x , y , t b i y , t d S
where * denotes convolution integral.
In the field of AE research, Equation (2) can be applied to Lamb’s problem. The capacitive sensor of NIST was used to record the Green’s function of the Lamb solution owing to the surface pulse for the first time. Subsequently, the calibration technology of the AE sensor is established, and the transducer is replaced by a conical transducer [49,50,51]. The AE detection parameters include time parameters, detection threshold, wave velocity, sampling length, sampling rate, and amplifier gain forward touch time [52]. Amplitude is an important characteristic of the AE signal of precast concrete [53,54,55]. Ji et al. [56] studied the correlation between the concrete strength index and AE signal frequency characteristics. The AE signals of concrete with different strength grades are mostly low-frequency signals. However, at higher stress levels, the dominant frequency of the AE signal gradually increases with the increase in intensity level. Considering the damage mechanics and AE rate process theory [57], scholars established the equation of the relationship between AE characteristic parameters and damage evolution of concrete under uniaxial compression. According to the basic theory of damage mechanics, the damage to materials is expressed by scalar parameter D:
D = 1 E / E
where E is the elastic modulus of the material without damage; E is the elastic modulus of the material under damage conditions.
According to (4), the relationship between damage ( D 0 ) and corresponding elastic modulus ( E 0 ) at the initial time of concrete material under uniaxial compression and the relationship between damage ( D P ) and elastic modulus ( E P ) under ultimate stress state can be expressed as:
D 0 = 1 E 0 E
D P = 1 E P E
D P D 0 = E 0 E P E
N = c V a e x p b V
where parameters a, band c in (8) can be fitted by measuring the number of AE events n of concrete specimens at different stress levels V %, which are collectively referred to as AE test parameters or characteristic parameters. a is the AE rate parameter, and its value reflects the number of cracks in the material [58]. Because the total amount of crack propagation is directly proportional to the damage change of concrete and the size of AE events, according to (8), the damage change can be expressed as:
D P D 0 = f a , b , c
There is a strong correlation between the damage change of concrete material and the AE characteristic parameter a, while the influence of parameters b and c is minimal [59]. Assuming that the damage change of the concrete material is linear with parameter a, the following can be obtained:
E 0 E P = E D P D 0 = X a + Y
where X and Y are constants; E 0 is the tangent modulus of concrete material at the initial time of uniaxial compression; E P is the secant modulus under the limit stress state.
In general, AE could be divided into two emissions. The first emission is generated from the interior of the material, while the second emission is from an external source. Acoustic radiation detection is closely related to the characteristics of stress wave attenuation, wave pattern, multipath effect, and source location algorithm criterion, among others [60]. Generally, AE monitoring schemes include global and local methods. Local monitoring is primarily aimed at damage in specific areas, and global monitoring is conducive to evaluating the integrity of the entire structure [61]. Most traditional AE sensors employ piezoelectric elements to convert the measured transient elastic mechanical waves into AE electrical signals [44]. Further, in the process of bridge monitoring, unidirectional sensors and sensors that are sensitive to internal wave modes are helpful in distinguishing the AE sources in various components of the bridge. Generally, the collected signal can be represented by characteristic parameters, such as duration and amplitude, as shown in Figure 2.
Ma employed an AE system (as shown in Figure 3) to detect the compactness of the sleeve grouting connection and analyze the AE signal characteristics under different concrete strengths, compactness, and hollow sleeve positions [62]. The results showed that the amplitude of C30 concrete is higher than that of C40 concrete, while the amplitude of the dense grouting sleeve is higher than that of the hollow sleeve. Li et al. [63] used AE technology to detect cracks in concrete hollow slab bridges. By studying the relationship between crack propagation and AE signals, it is concluded that low-amplitude signals are generated due to the propagation of microcracks and the mutual friction of old crack fracture surfaces. The high amplitude signals are generated by the further propagation of macro cracks. Carpinteri et al. [64] described the fracture experiments of rocks and cementitious materials of different sizes and examined the extended application of similar schemes in the actual size structure in the multi-scale method. In addition, other scholars applied AE detection technology to study the corrosion and cracking of reinforced concrete and verified the reliability of this method [65,66,67].
Above all, AE technology has been widely used in the field of engineering testing [68]. At the same time, some defects in the detection process are also exposed. The characteristics of acoustic emission are sensitive to materials and susceptible to interference from electromechanical noise [69,70,71]. Acoustic emission detection generally requires proper loading program, and accurate control of loading process is very important [72]. In addition, due to the irreversibility of acoustic emission, the acoustic emission signal in the experimental process cannot be obtained repeatedly through multiple loading. Therefore, the acquisition of signals during each detection process is very valuable, and precious data should not be lost due to human negligence. The acoustic emission characteristics of various materials vary greatly under different experimental conditions. In order to establish the relationship between the received acoustic emission signal and the sound source, more research is needed on the acoustic emission characteristics of various materials.

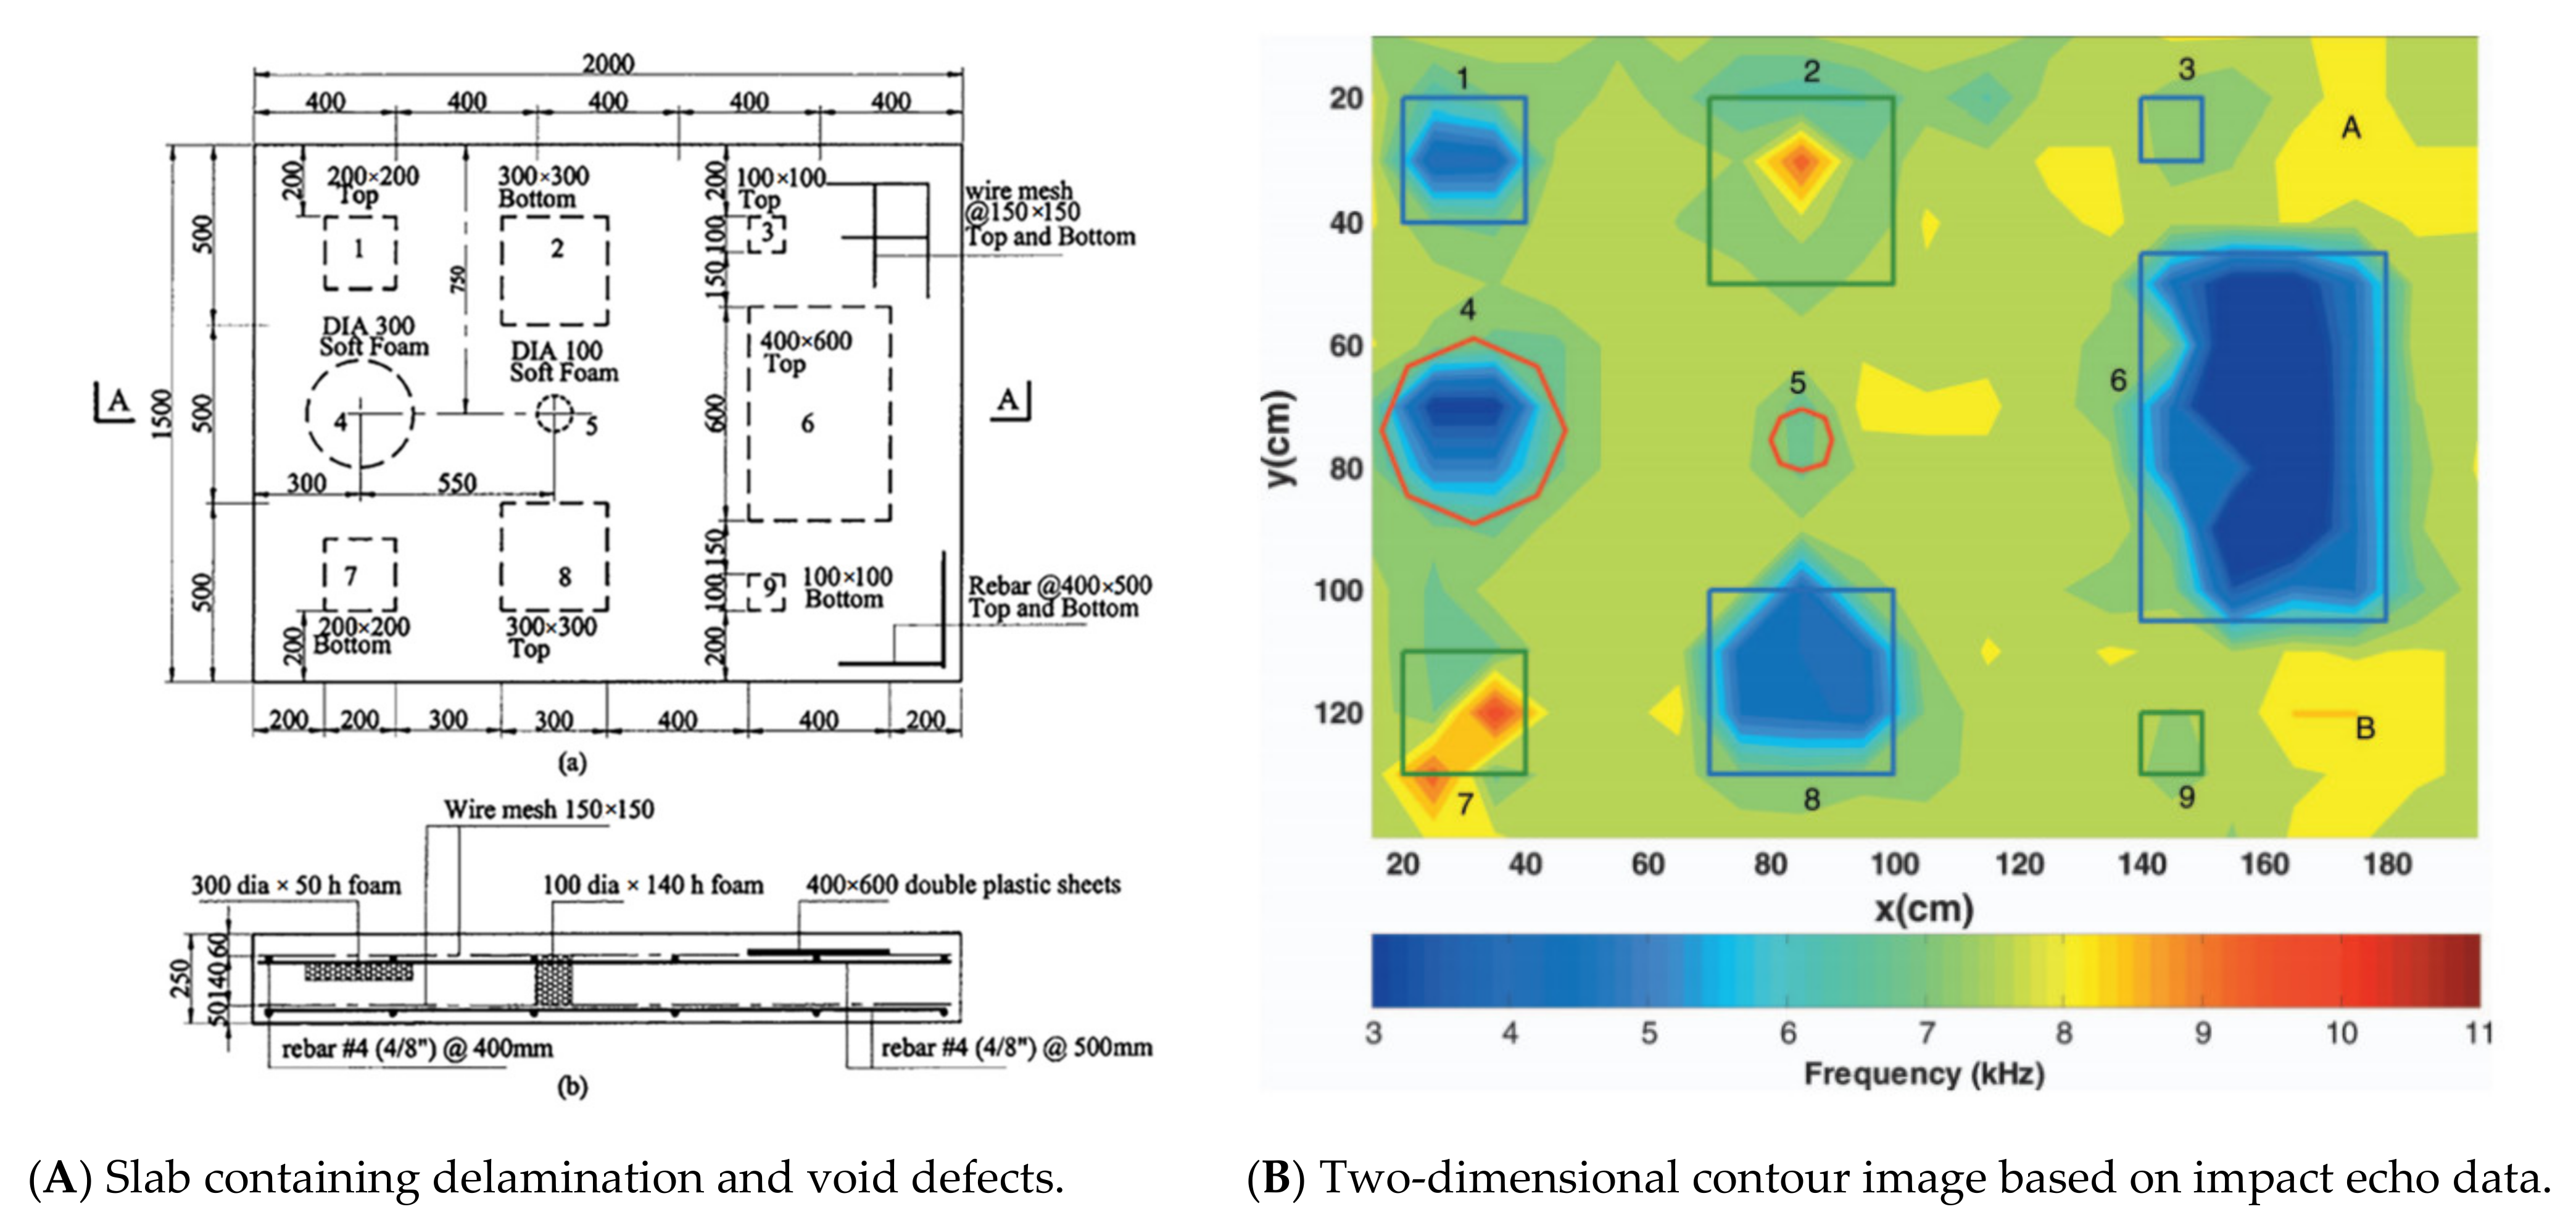
3.2. Impact Echo Detection Technology

The IE method (as shown in Figure 4) is a stress wave method that aids in flaw detection and the determination of the thickness of structural components such as building materials, bridge decks, and slabs [16,73,74,75,76]. The basic principle of this method involves hitting the surface of the measured structure with an impactor to generate and propagate high-frequency stress waves [77] and subsequently measuring the response using a nearby signal receiver. The recorded time-domain signal is converted into a frequency-domain function via a fast Fourier transform. The reflected frequency is referred to as the thickness frequency, and the plate thickness h can be determined using the measured compression wave velocity and thickness frequency f as follows:
h = V p 2 f
From the early 1970s to the 1980s, the IE method was used to evaluate pile foundation and concrete components, such as material bonding quality and crack depth [78,79,80,81]. Equation (11) was obtained assuming that the wave velocity across the thickness of the plate is the same as that of the compression wave. Other scholars have demonstrated that the apparent wave velocity is approximately 96% of the compression wave velocity. Therefore, by modifying Equation (11) and multiplying it with the coefficient (0.96), it can be obtained as follows [82]:
h = β V p 2 f
Zou, C. et al. [83] used the IE method to evaluate the grouting quality of prestressed pipelines of post-tensioned structures and used the main frequency formed in the frequency domain after the transformation of the original time-domain signal as the primary evaluation index. Zhu et al. [75] applied the air-coupled IE technology to the nondestructive evaluation of concrete. The researchers created a concrete slab with artificial delamination and void defects and scanned the entire slab area with an air-coupled IE to generate a two-dimensional contour image (as shown in Figure 5). Moreover, when using IE to test concrete structures [84], a transient stress pulse was introduced into the concrete surface by mechanical shock. The stress pulse propagated into the object along the spherical wavefront in the form of longitudinal (P), shear (S), and Rayleigh (R) waves. P-waves are the primary research focus owing to their low frequency, large wavelength, and strong penetration ability. Scholars first studied the feasibility of using deep learning models to classify bridge deck IE data to locate underground defects [76] and performed IE detection on laboratory concrete specimens with artificial defects. The results showed the feasibility and potential of this method for detecting underground defects.
Zhou et al. [85] established an ATC estimation model and estimated the size of the hole based on the IE method. A schematic of the empty hole and the T and R sensors is shown in Figure 6, where V is the wave velocity of the impact echo; t 1 is the measured value of the first wave of the reflected wave; t 2 t is the theoretical value of the diffracted wave; R t is the theoretical value of the cavity radius; D T R is the distance between the signal transmitter and the receiver, and L is the thickness of the measured concrete member.
L T H = t 1 × v 2 ;   L T I = D T R 2 ;   L I O = L 2 ;
are the known condition; the critical distance and angle could be obtained by the following steps:
L I H = L T H 2 L I T 2 = v 2 t 1 2 4 D T R 2 4
L T O = L T I 2 + L I O 2
T O I = a r c c o s L H O 2 + L T O 2 L T H 2 2 × L H O × L T O
a r c c o s T B O = L T B 2 + L B O 2 L T O 2 2 × L T B × L B O
From the triangular function relationship L C D 2 + L O C 2 = L O D 2 , it can be obtained as follows:
L C D = v t 1 2 4 D T R 2 4 + R t 2 R t 2
From the formula a r c c o s C O D = L O C 2 + L O D 2 L C D 2 2 × L O C × L O D , it can be obtained as follows:
C O D = a r c c o s   R t v t 1 2 4 D T R 2 4 + R t
T O B = a r c c o s R t v t 1 2 4 + 2 R t v t 1 2 4 D T R 2 4 + R t 2
t 2 t = L T B + B M ^ + M C ^ + L C D v
Based on the shock echo theory, a cavity estimation model is established. According to the reflected wave sound, the hole diameter can be estimated by the theoretical value R of the hole radius of the diffracted wave and the first wave sound t 2 t .
Schoefs et al. [86] applied a new type of laser interferometer non-contact robot and released the IE to detect the pipe cavity in a reinforced concrete wall, which confirmed that upon performing the detection near the cavity defect, the peak frequency of IE decreases with the effective reduction of penetration thickness and section stiffness. To overcome the difficulty of identifying the peak frequency in the traditional methods [87], Masa proposed the spectral amplitude superposition imaging method based on IE. The experiment confirmed that the use of an aluminum bomb as an impactor in the detection process could provide a good frequency response of up to approximately 40 kHz, which can distinguish the grouted pipe from the non-grouted pipe of a prestressed concrete beam. Ninel et al. improved the spectral amplitude superposition imaging method by exploiting IE [88]. The results demonstrated that the improved elliptic integral mode of the Sibie program could enhance the visualization of IE results. Yao et al. [89] realized signal transformation by a wavelet using the IE method via short-time Fourier transform and consequently determined the defects of the grouting layer. Li et al. [25] used the IE method to detect the grouting quality of plastic pipes of prestressed concrete structures based on HHT and extracted the main vibration modes related to grouting. Tang proposed a quantitative cavity detection method based on acoustic spectrum analysis to estimate the internal state of the tunnel lining [90]. Through numerical simulation and experimental tests, a parameter spectral density ratio based on frequency domain analysis was extracted to estimate the lining quality.
IE is especially suitable for the thickness detection of single-sided structures, such as pavement, airport runways, bottom slope protection, retaining walls, tunnel lining, dams, and other concrete structures [91,92]. It has the characteristics of large excitation energy, simple operation, low-frequency energy penetrating steel bars, small interference, repeatable testing, and so on. Nonetheless, IE has poor applicability for structure detection with thickness larger than 100 cm [93]. The test results of shallow surface defects and small deep defects are not ideal [94]. At present, the detection efficiency of a single-point impact echo instrument is low, and it is not suitable for large-scale continuous detection. Although the scanning impact echo instrument realizes continuous detection by using a rolling contact sensor and improves the test efficiency, because the sensor and the test surface are in rolling contact, the coupling state between them is relatively worse, which reduces the range and accuracy of the test naturally. In addition, the more complex the internal structure, the more chaotic the signal response will be.

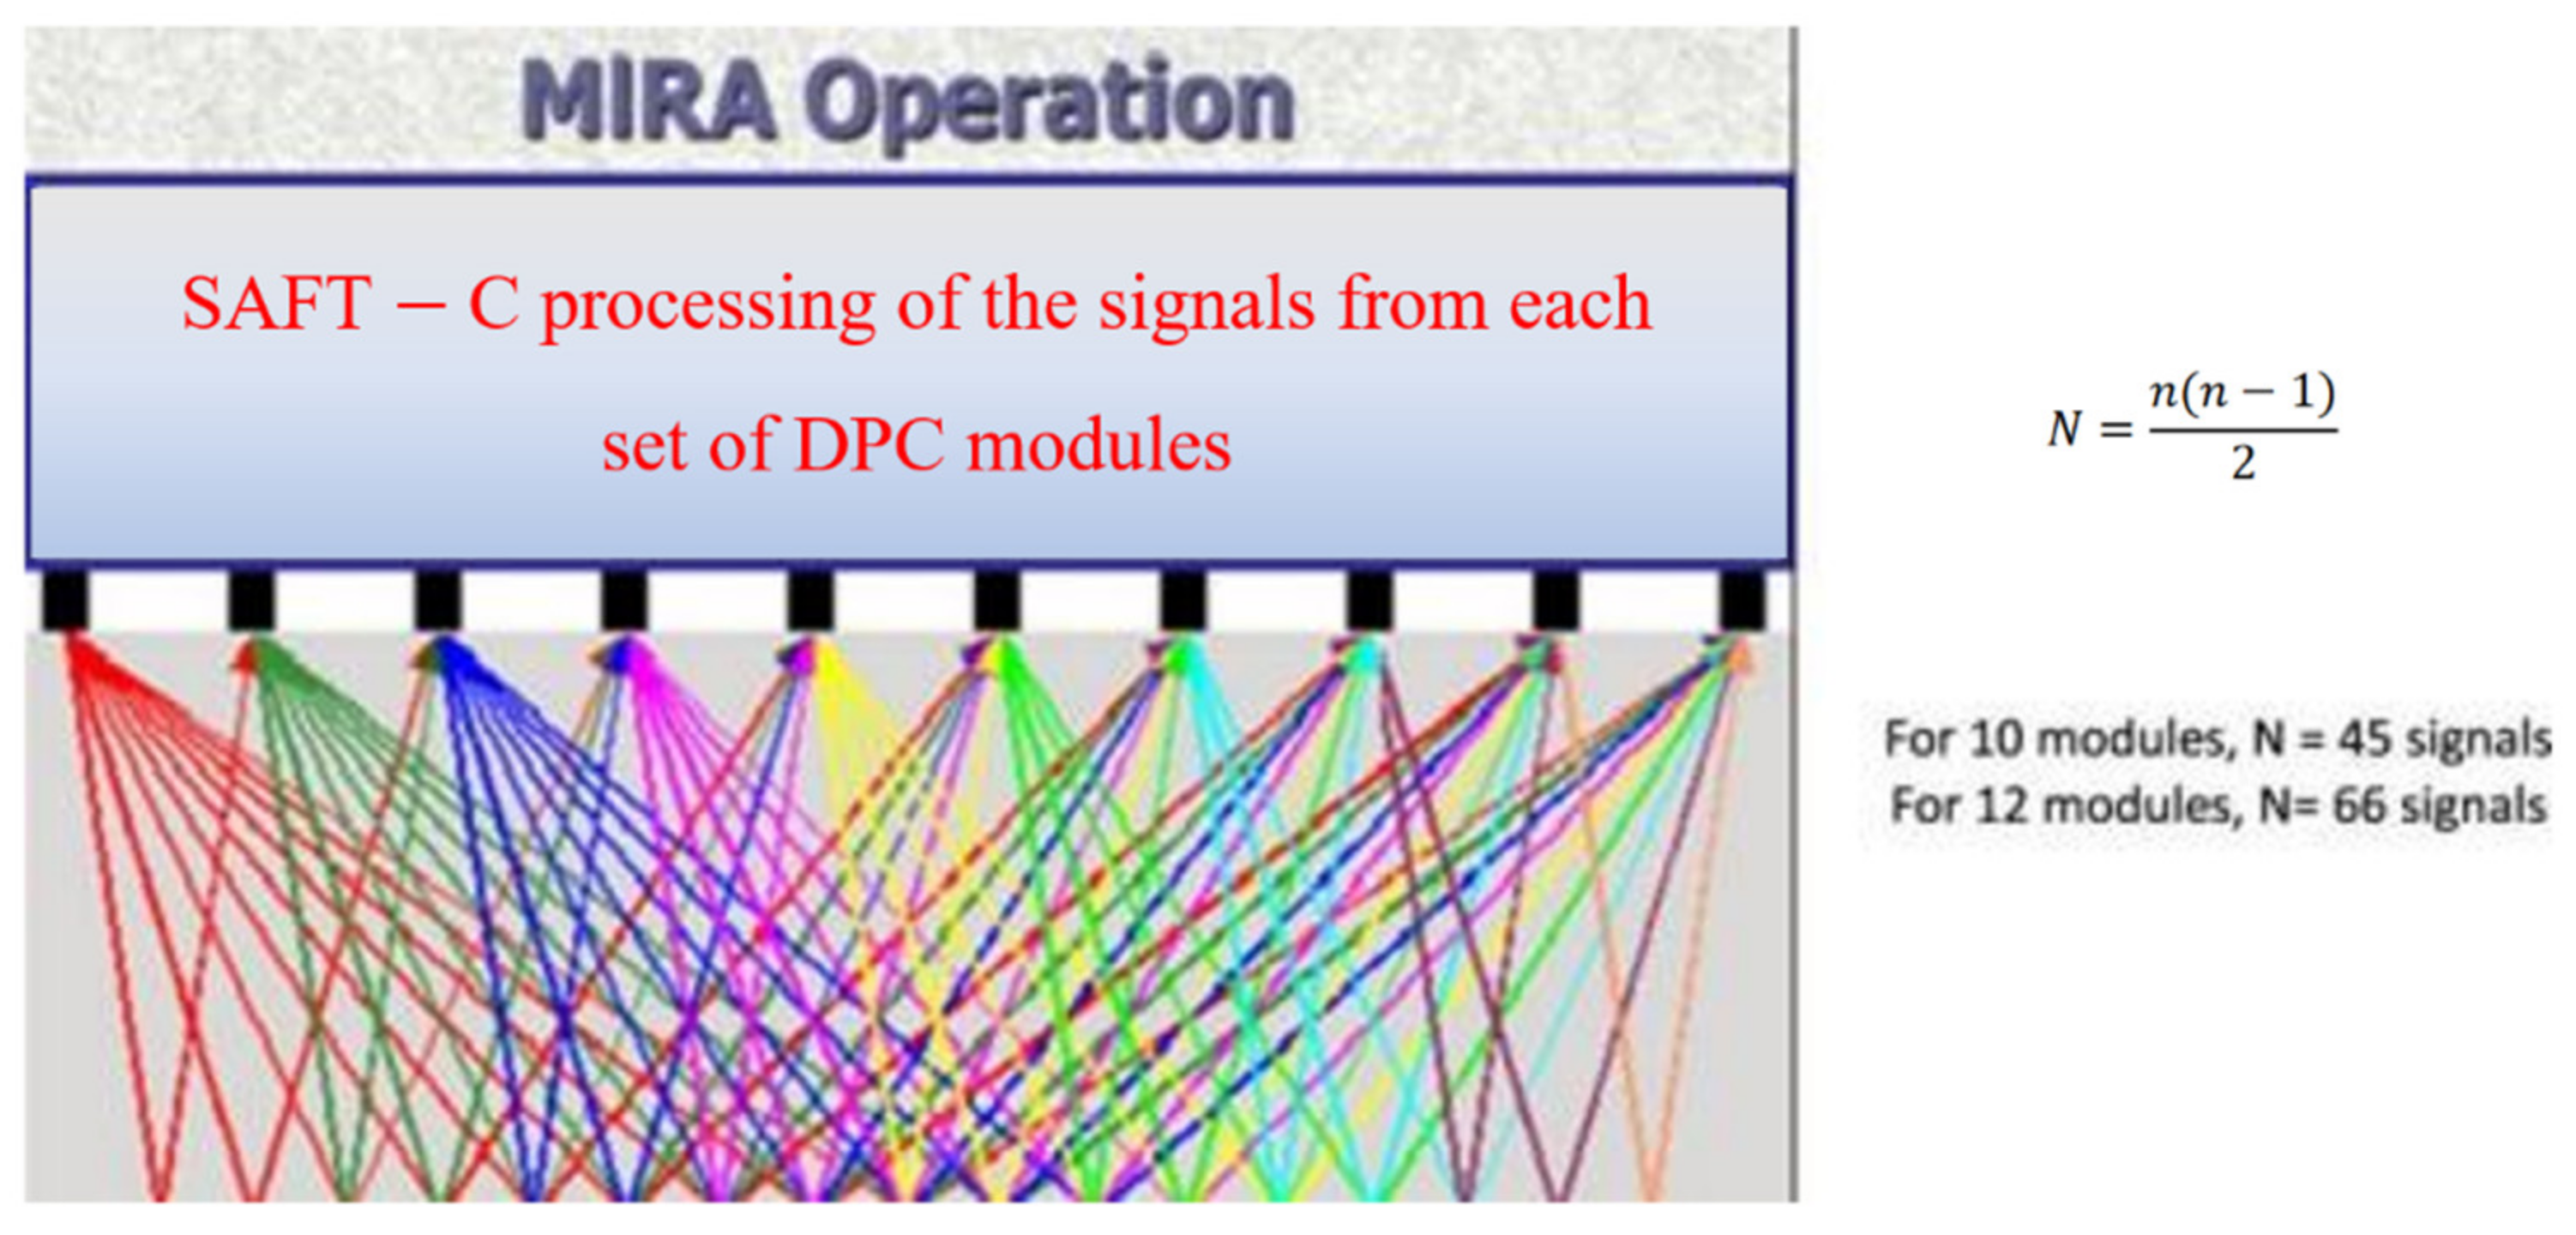
3.3. Ultrasonic Detection Technology

Concrete is a composite material with dimensions ranging from microns to centimeters. Coda interferometry is extensively used in concrete ultrasonic testing because it is sensitive to weak changes in the medium [95]. Monika proposed a new theoretical model to determine the propagation paths of refraction, transmission, reflection elastic, and creep waves along the surface [96], which is used to estimate the bonding quality between concrete and steel. Ultrasonic surface waves (USW) are used to evaluate the material properties in the near-surface region of the medium. It is limited to the high-frequency range, where the penetration depth of the surface wave is less than the thickness of the measured object [97]. Moreover, the average surface wave velocity will decrease when the concrete slab has defects such as delamination and voids [77]. The propagation velocity ( V R ) of the surface wave is obtained by dividing the distance Δ x between two receivers by the difference Δ t of arrival time. Given the surface wave velocity, the modulus of the material can be determined by V R ,   ρ ,   v :
E = 2 1 + v ρ V R 2 1.13 0.16 v 2
Lu et al. [98] used ultrasonic tomography technology to evaluate relevant parameters affecting grouting quality and analyzed the effects of these parameters by employing a theoretical model (as shown in Figure 7). It is assumed that the propagation path of ultrasonic wave around the pipeline is SABR, ∠AOS = θ 1 , ∠BOR = θ 2 , and the diffraction radius is r.
Then the minimum propagation time t 1 from S to R along the SABR path is as follows:
t 1 = m i n ( r c o s θ 1 + π / 2 2 + r s i n θ 1 + π / 2 0.1 2 v 1 + r π θ 1 θ 2 v 5 + r c o s 3 π / 2 θ 2 2 + r s i n 3 π / 2 θ 2 + 0.1 2 v 1 )
When propagating directly along the SR path, the minimum propagation time t 2 can be obtained as:
t 2 = ( 0.11 2 h ) / v 1 + ( 0.09 M d 1 ) / v 2 + M d 1 / v 3 + 2 h / v 6 ( M 15 ) S t r a n d ( 0.11 2 h / v 1 + ( 0.09 N d 2 ) / v 2 + N d 1 / v 3 + 2 h / v 6 ( N 2 ) S t e e l   b a r
where v 1 is the wave velocity in the material around the pipe; v 2 is the wave velocity in the slurry inside the pipeline; v 3 is the wave velocity in the prestressed reinforcement; v 4 is the wave velocity in plastic; v 5 is the wave velocity along the pipeline boundary; v 6 is the wave velocity through the corrugated pipe wall; M is the number of steel strands; d 1 is the diameter of steel strands, N is the number of steel bars; and d 2 is the diameter of steel bars.
By comparing the sizes of and, the minimum propagation time path of ultrasonic waves can be determined, which is the minimum propagation time of ultrasonic waves from S to R in a slurry-containing pipeline. Consequently, by analyzing the influence of each parameter on the ratio of (( t 1 min t 1 , t 2 ) and min t 1 , t 2 , the influence of each parameter on the detection effect of ultrasonic tomography can be determined.
De La Haza et al. [99] introduced the basic characteristics of two ultrasonic testing equipment (Figure 8) developed at the beginning of this century. The dry point contact (DPC) shear wave transducer array was applied to generate 2D and 3D tomographic images of reflected waves. Shear wave, DPC sensor, image reconstruction method, synthetic aperture focusing technology (SAET), and schematic representation of digital focusing array signal capture scheme were also introduced (Figure 9). Shokouhi, P. et al. [100] evaluated the accuracy and precision of low-frequency ultrasonic detection of concrete bridge deck delamination using a multi-probe ultrasonic detection system. The results indicated that delamination defects as small as 30 mm could be reliably detected by using a multi-probe ultrasonic array. Shah, A.A. et al. [101] studied the ultrasonic nondestructive evaluation of defects or damages at micro and macro scales in concrete under initial and peak horizontal loads. It was found that the damage attenuation amplitude of the high-pressure pulse is greater than that of the low-pressure pulse. The pulse velocity was sensitive when the damage degree exceeded 60% of the ultimate strength of concrete.
To test the effectiveness of the grouting process and the adhesion of grouting to masonry materials, Jorne et al. [84] performed ultrasonic tomography and mechanical tests. It was confirmed that the bonding performance of the interface is important to the mechanical results, and the characteristics of porous media after grouting correspond to the information displayed by tomography. To detect the damage in reinforced concrete beams, the propagation characteristics of ultrasonic waves in reinforced concrete beams were studied [85]. Two types of piezoelectric elements were applied to the surface of the concrete beam before and after the four-point bending test. The experimental results showed that the piezoelectric ceramic disk could detect the influence of cracks on the material properties.
Haach et al. [102] used ultrasonic tomography to qualitatively evaluate concrete and conducted experimental research on holes, concrete composition, transducer arrangement, and transducer frequency on concrete prisms. The results indicated that the image quality is dependent on the size and arrangement of sensors and the distribution of measuring points. Karabutov et al. [11] proposed an ultrasonic spectroscopy method based on high-sensitivity piezoelectric detection of broadband acoustic pulses to evaluate the effects of micro dispersed holes and expanded interlayer in CFRP. Bogas et al. [10] used the nondestructive ultrasonic pulse velocity method to evaluate the compressive strength of lightweight aggregate concrete with various structures. Based on the correlation between the ultrasonic pulse velocity, concrete density, and elasticity, a simulated doubling expression was proposed to estimate the compressive strength of concrete.
At present, UT is widely used in the detection of concrete-filled steel tubes [103], but it is difficult to inspect structures with complex shapes. In addition, the surface to be inspected is required to have a certain degree of finish. A coupling agent is required to fill the void between the probe and the inspected surface to ensure adequate acoustic coupling [104]. For some coarse-grained castings and welds, it is difficult to apply because of the disorderly reflection wave. UT can penetrate over long distances, but this penetration test requires two opposite test surfaces [105]. A judgment can be made only by testing multiple points and processing the data with statistical probability through comparative comparison. In addition, ultrasonic inspection is not intuitive to the display of defects, as it is easily affected by subjective and objective factors. Ultrasonic testing also requires experienced inspectors to perform operations and judge test results.

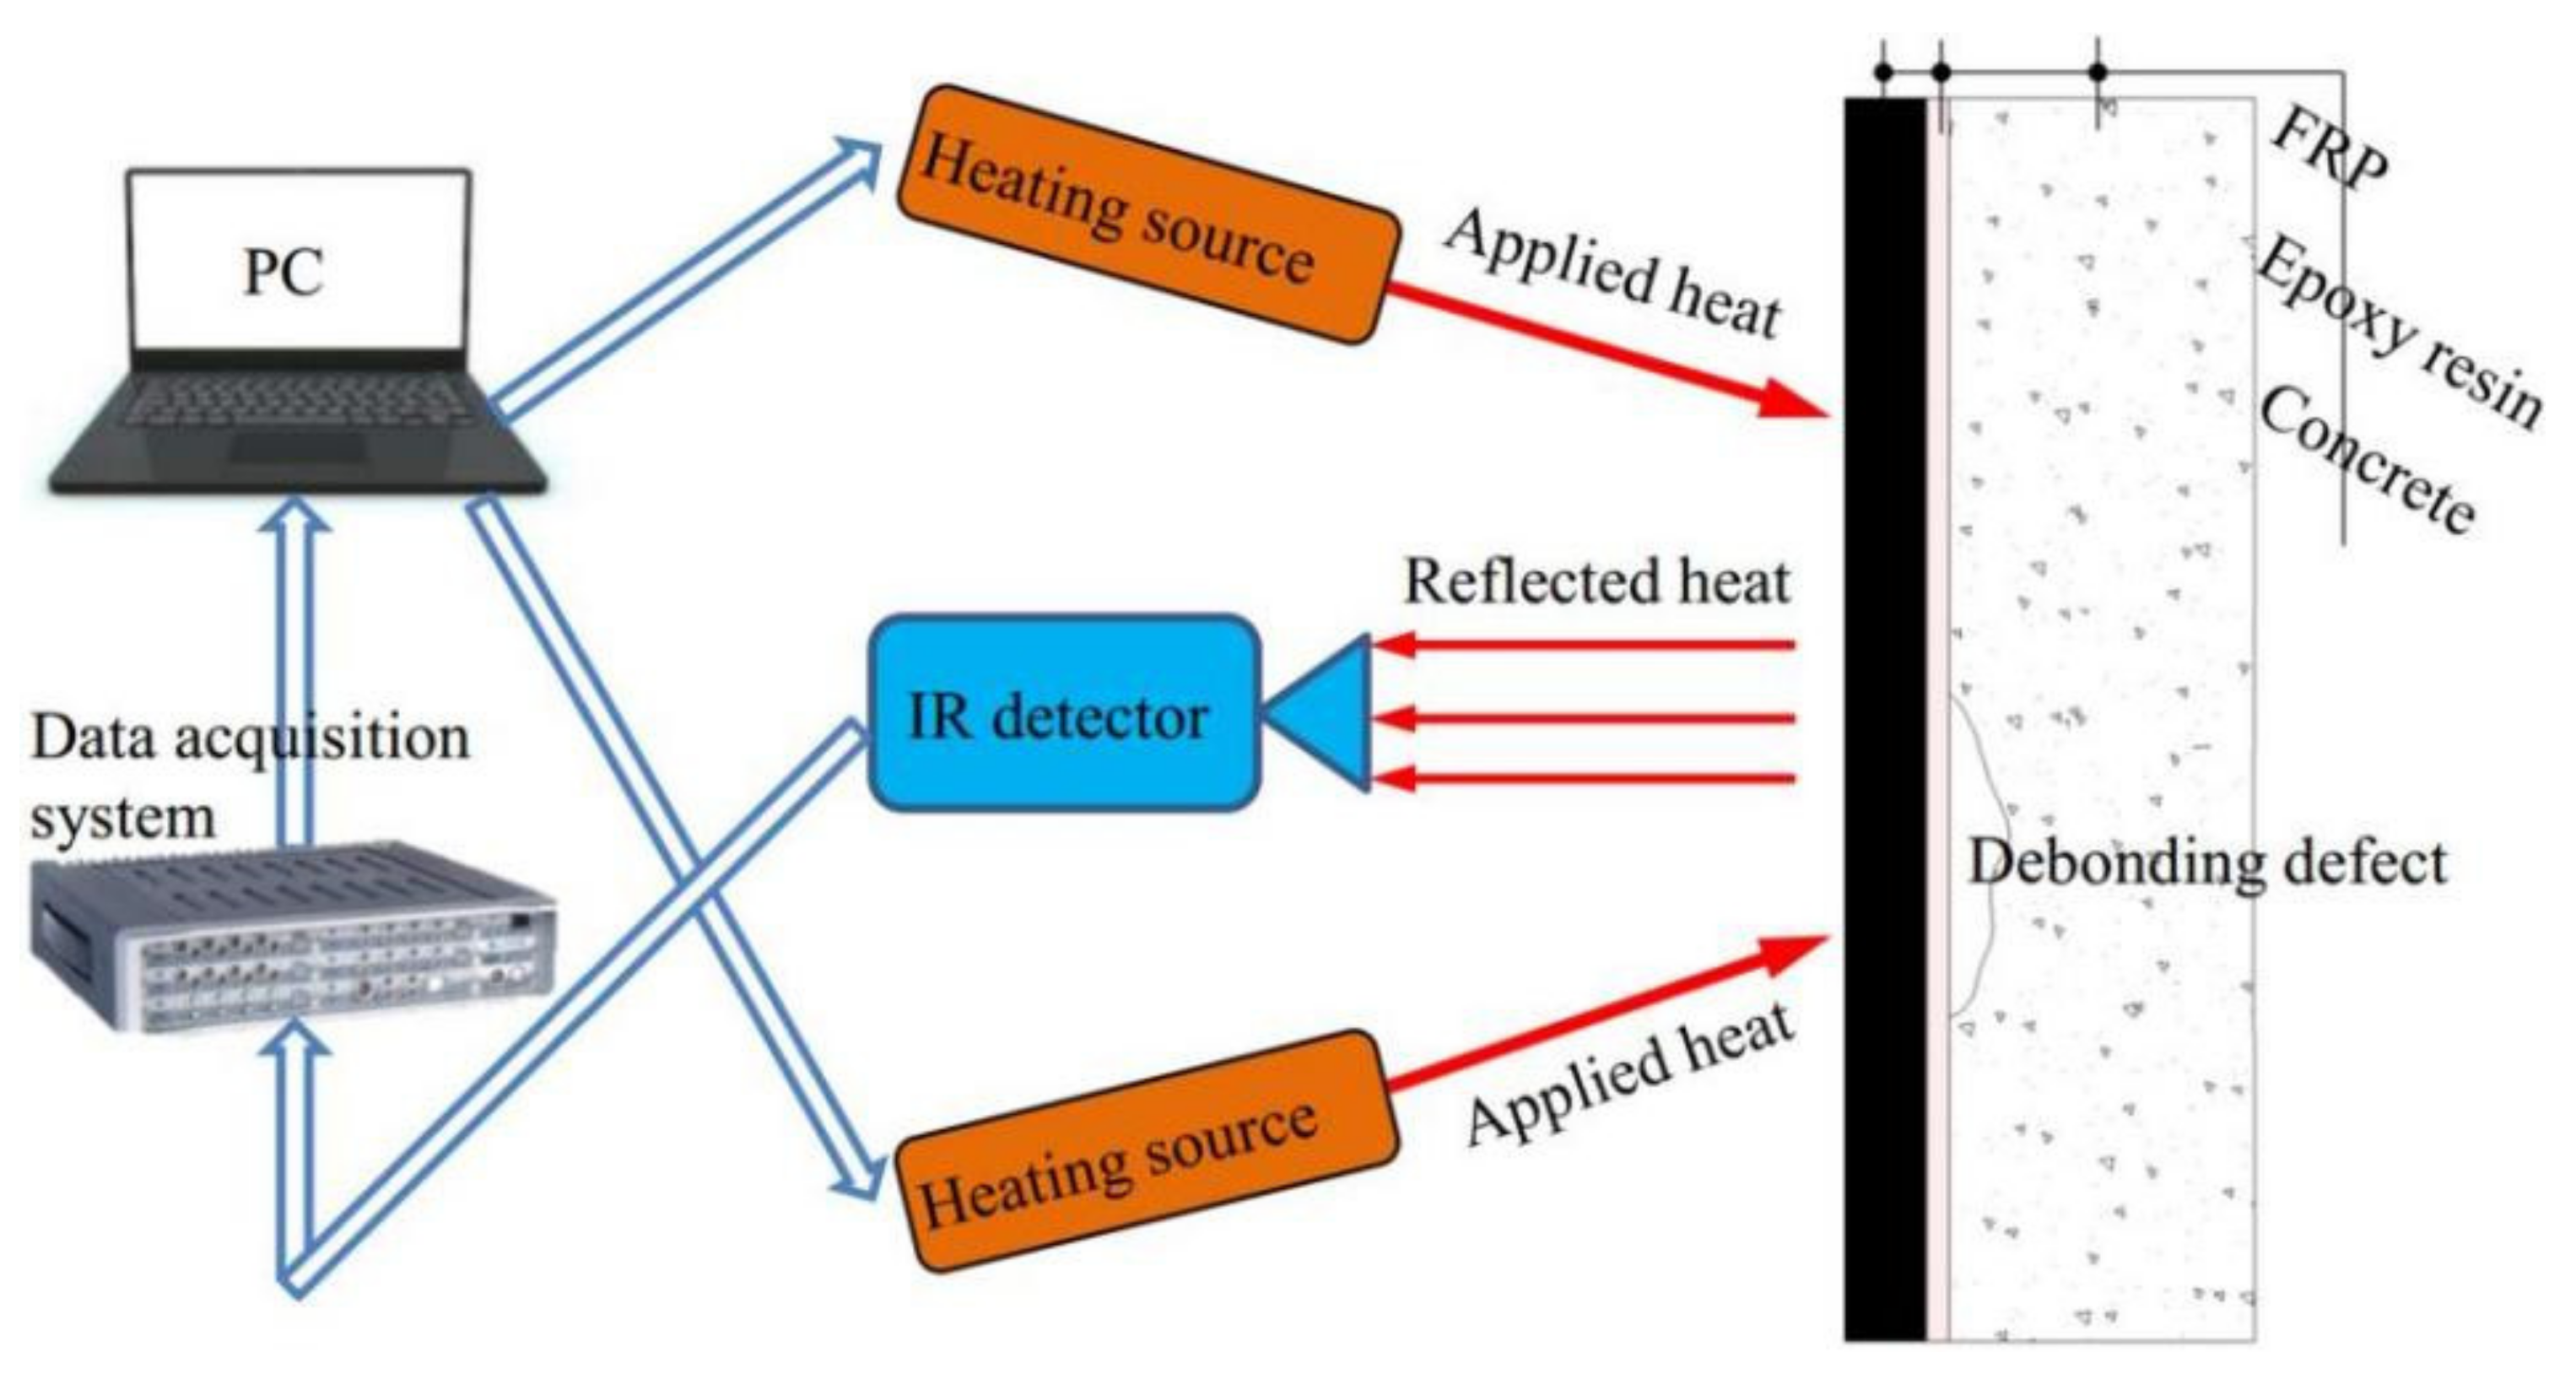
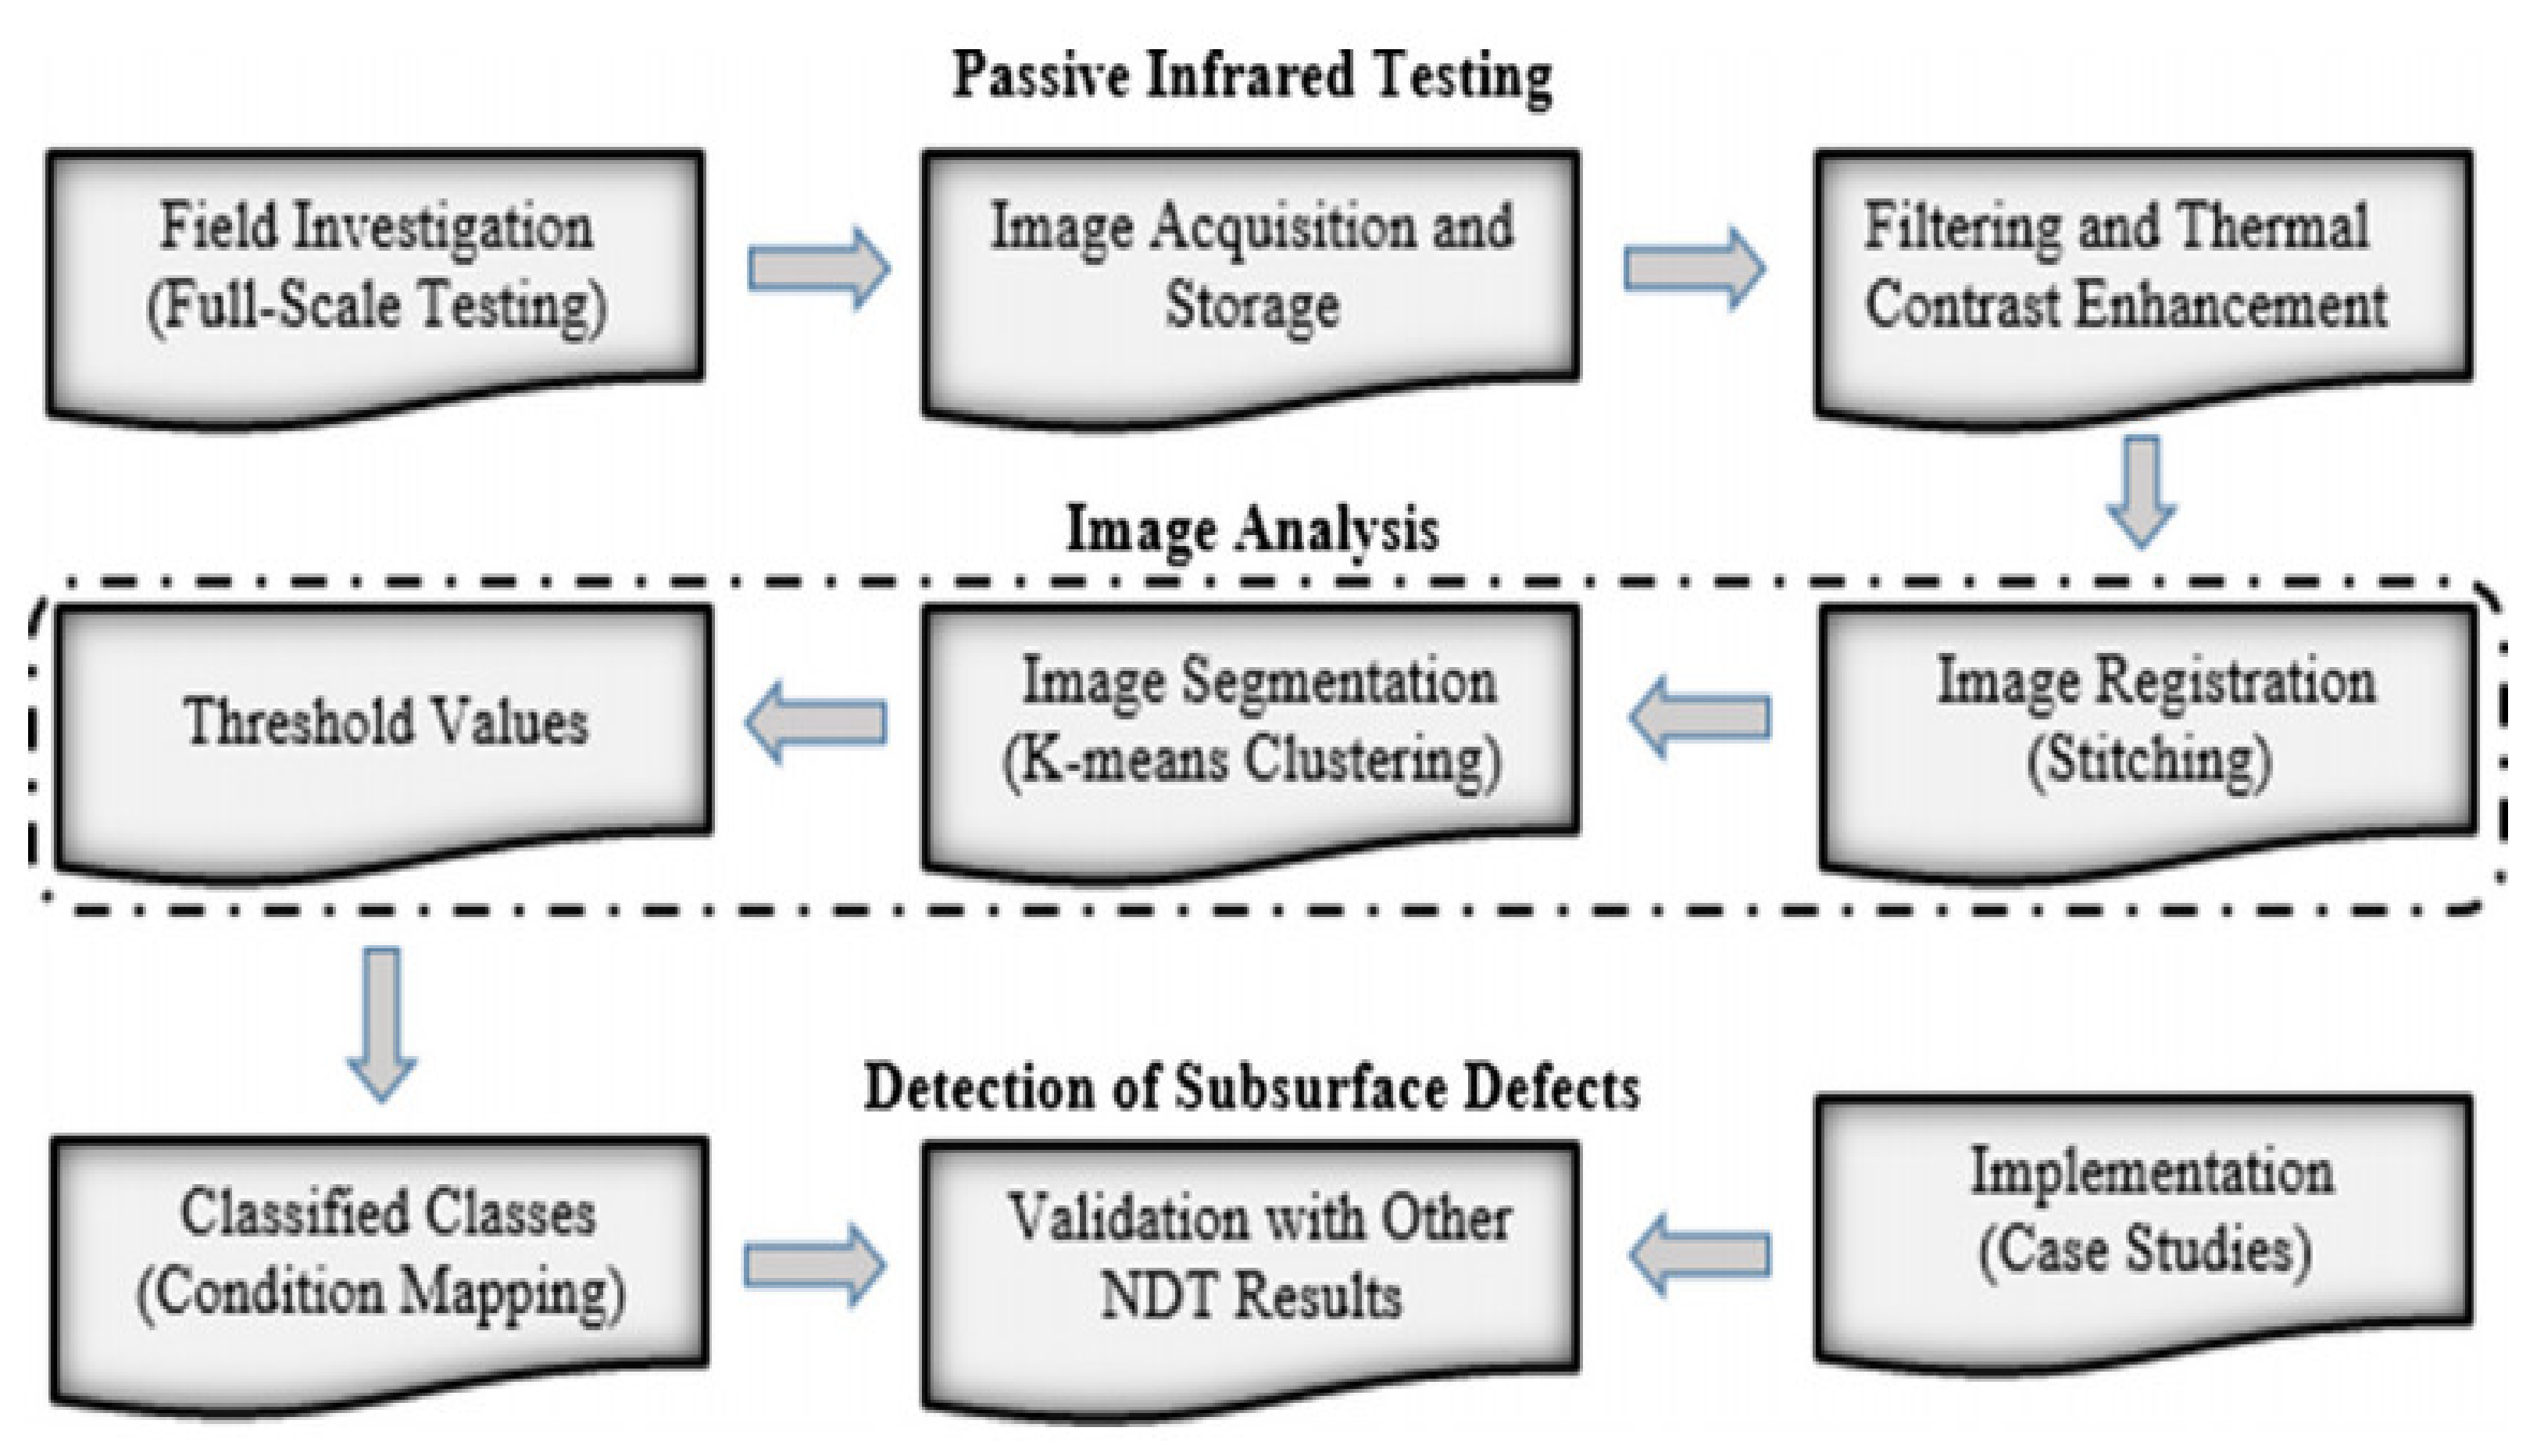
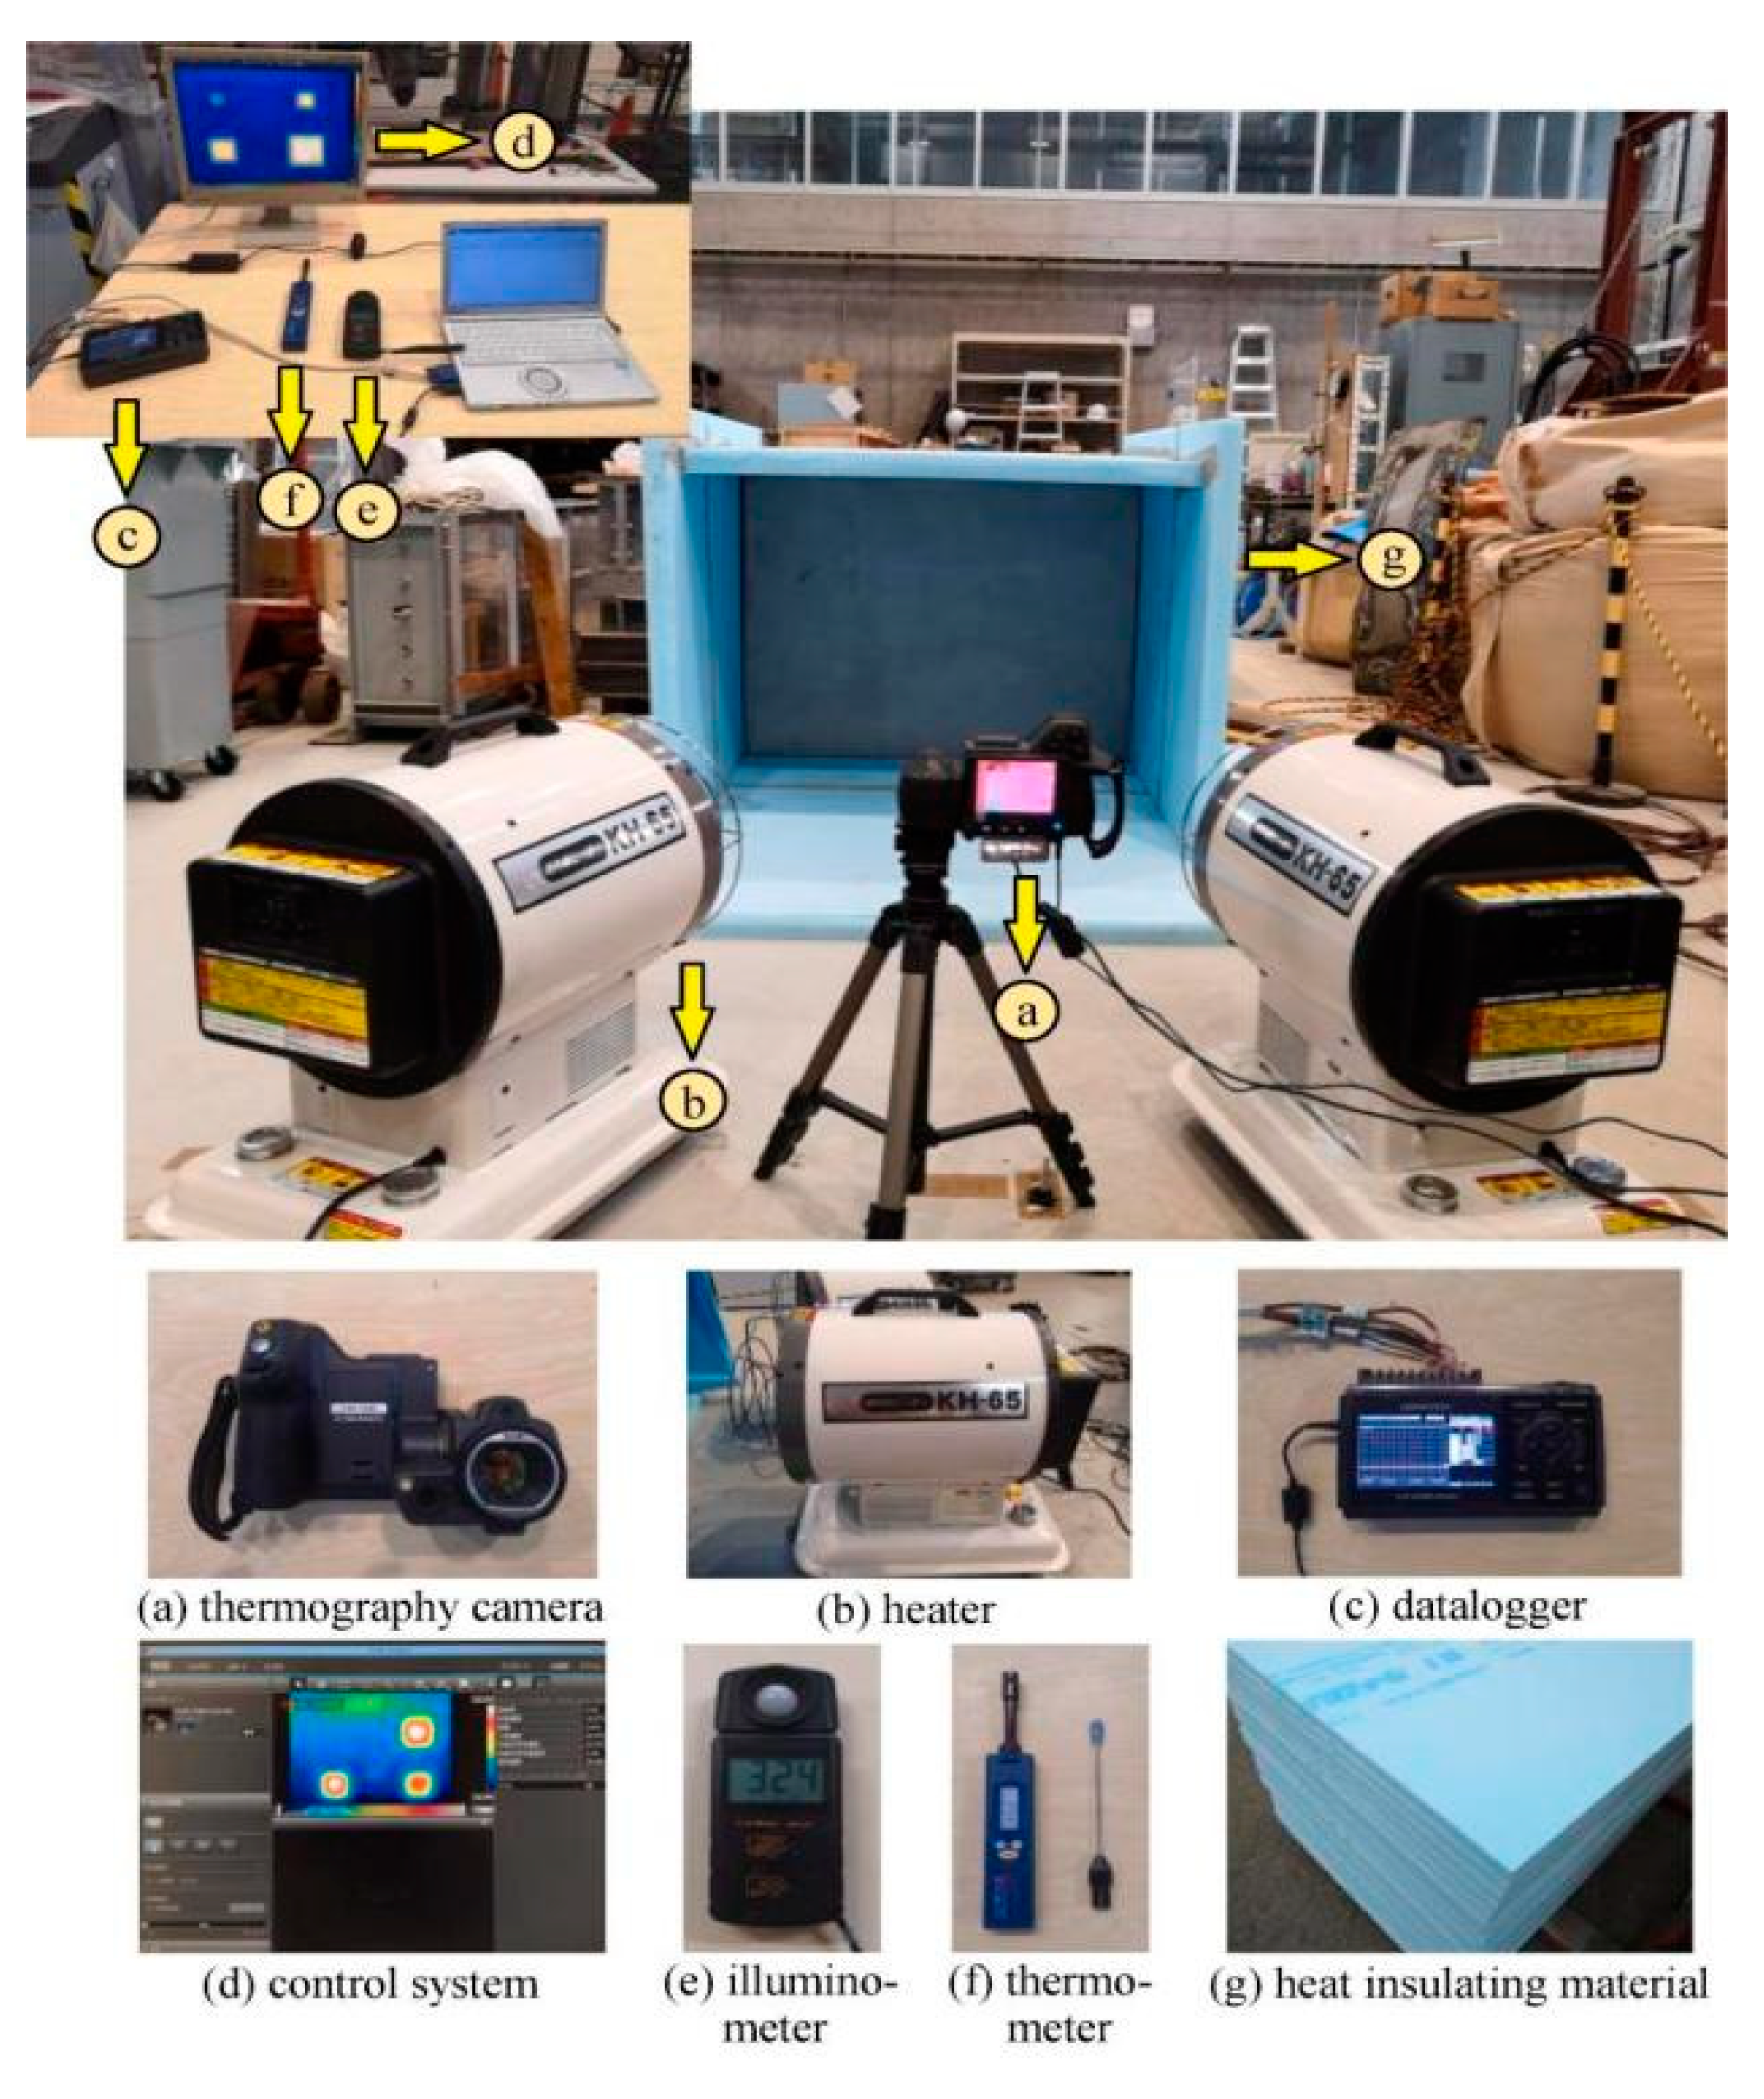
3.4. Infrared Thermography

In recent years, IRT has been applied to civil engineering structures to detect defects and anomalies. A part of the structure of the object being researched is heated by using internal or external heat sources, and the instantaneous heat flow is observed by recording the change in surface temperature with time [106,107]. IRT is suitable for the detection of voids and honeycombs in concrete. Reflected infrared observations were used to detect prestressed concrete structures (as shown in Figure 10). Concrete covering, concrete cracks, and prestressed reinforcement pipe cavities below 10 cm can also be evaluated [108,109,110,111]. Sham, J.F.C. et al. [12] used infrared continuous surface temperature monitoring technology (CSTM) to measure the heat released by different building fabrics. It was found that the cooling methods of building fabrics of different sizes are the same, and the measurement results are significantly affected by the differences between materials. Sensible heat is the heat transferred from the surface to the surrounding air when a temperature difference exists [112,113]. When the heat transfer volume of the object is constant and the temperature of the entire object is uniform, the magnitude of the internal energy is the product of the object mass m, the specific heat capacity c, and the temperature change Δ T , as shown in (24):
Δ I E = Δ S H = m c p Δ T = ρ V C P Δ T
where m is the mass of the object k g ;   C P is the specific heat capacity J / k g ° C ;   Δ T is the surface temperature change ° C ; ρ is the density k g / m 3 ; and V is the volume m 3 . If the thermal characteristics and temperature difference of the material are known, the energy released by the object during cooling can be calculated. According to the first energy conservation law of thermodynamics, the change of thermodynamic energy is equal to the gain or loss of total heat [114]. The total sensible heat release ( Δ S H ) per unit area J / m 2 of an object is equal to the radiant heat flow and total convective heat flow from the object to the surrounding environment in a certain period of time. The total heat flux q w can be obtained by a combination of convective and radiative transfer [115]; the functional relationship can be expressed as follows:
q w = h u T S t T t + h r T S t T r a d t d t W / m 2
where W / m 2 is the heat flux density of the surface; T S ° C is the surface temperature of the object measured by the infrared camera; T ° C is the air temperature measured by the thermometer, and T r a d ° C is the radiant surface temperature of the surrounding environment; h r J / s   m 2 and h u J / s   m 2 are radiative and convective heat transfer coefficients, respectively.
The thermal camera can measure the infrared radiation emitted by an object and then convert this radiation into an electrical signal. Infrared radiation is part of the electromagnetic spectrum and can be transformed into temperature using the Stephen Boltzmann law [116]:
E = ε σ T 4
where E is the radiant energy emitted by the surface W / m 2 ; ε is the emissivity of the material; σ is Stephan–Boltzmann constant (usually taken as 5.67 × 10 8   W / m 2 / k 4 ); T is the absolute temperature.
The radiation Equation (27) describes the calculation of the temperature from the measured radiation intensity. The radiation recorded in the thermal imaging phase of the observed object is composed of the radiation emitted by the atmosphere between the object and the camera detector, the radiation emitted by the object, and the radiation reflected by the object to the environment [117]:
I = τ ε I o b j + 1 ε I r e f + 1 τ I a t m
By adjusting the equation, the radiation emitted by the object being measured can be calculated [118]:
I o b j = 1 ε τ I 1 ε ε I r e f 1 τ ε τ I a t m
where I o b j is the radiation emitted by the object W . m 2 . s r 1 ; I is the radiation detected by the thermal camera W . m 2 . s r 1 ;   I r e f is the environmental reflected radiation; I a t m is the atmospheric radiation W . m 2 . s r 1 ; and τ is the atmospheric transmission coefficient.
IRT has been used in experimental research on concrete delamination detection. Scholars have developed and analyzed the heat transfer model of concrete blocks with artificial stratification to explore the effective use of sensitive parameters of IRT. Consequently, it was confirmed that the stratification area has a greater impact on the detection ability of IRT than the thickness and volume [119]. Omar et al. [120] proposed an automatic program for detecting and classifying the delamination of concrete bridge decks. The flow of the method is shown in Figure 11. A specially written code was used to create the splicing thermal map of the entire bridge deck from a single image. Field detection showed that the program could effectively identify the layered area of the bridge deck.
Another study proposed a method to identify the delamination boundary and area. In the sample (Figure 12), 16 artificial delamination with different parameters were created. The specific experimental settings are shown in Figure 13. The test results showed that the presence of a surface-covering mortar and water reduces the accuracy of detection. The size and depth of stratification were positively correlated with the detection ability. In addition, the method could successfully identify layered areas with a size of at least 50 mm × 50 mm [121]. Francois, A. et al. [103] proposed a novel in situ characterization method for thermal bridges. The temperature and heat flux of the wall surface was measured using contact sensors in the sound area, and the wall’s thermal resistance was estimated by employing inverse technology. UAV infrared thermal imaging technology was applied to the detection of delamination in a concrete bridge deck [122]. This method does not need to interrupt traffic or contact the bridge deck, which greatly reduces the cost of detection. Vavilov et al. [123] summarized the fundamental principles of pulsed thermal nondestructive testing, including theoretical solutions, data processing algorithms, and practical applications. IRT can also be applied to the detection of reinforcement corrosion because it is affected by the thermal characteristics of corroded objects. Goffin [124] studied the effect of corrosion of epoxy-coated reinforcement and uncoated reinforcement on the thermal properties of reinforced concrete. The thermal measurement results showed that the thermal insulation of the uncoated reinforcement was corroded. The corrosion of the epoxy-coated reinforcement resulted in the cracking of the coating and reduced the thermal insulation performance of the reinforcement.
IRT has the advantages of high efficiency, convenience, non-contact, and safety. It is widely used in many fields such as fatigue load, underground pipeline, metal crack, and so on [125,126]. IRT can only measure heat on the surface of the instrument [127]. Although IRT detects the quality of the structure by measuring the heat difference, in most cases, the heat emitted from the back of the structure is not the same as the surface temperature [128]. If the integrity of the structure is determined simply by detecting the surface temperature of the structure, it will produce a large error. IRT requires high-tech equipment and is very expensive to build. In addition, due to the limitation of field test conditions, it is difficult to use acquisition equipment in engineering practice.
Gharawz et al. [129] developed a fully automated data processing pipeline by using the progress of adaptive signal and image processing, which can effectively detect defects at different depths in concrete. The results showed that defects with detection depths greater than 3 inches could be improved by analyzing the time-frequency response of the surface temperature. The ID signal with a series of scaled and shifted basis functions was convoluted by wavelet analysis to obtain the time-frequency representation. The sum of signals over time multiplied by the scaled and shifted version of the wavelet is called wavelet transform. The continuous wavelet transform function f (T) can be expressed as [130]:
W f S , T = + f t h S T t d t = R e + j I m
h S T t = 1 s h t T s   a n d   h t = e j w t e t 2 / 2
where W f is the wavelet transform; S is the scale factor; T is the translation factor; Re is the real part; Im is the imaginary part; h S T is the sub wavelet; h S T is defined by the parent wavelet h.

3.5. Ground Penetrating Radar

GPR is a well-known technology of earth science practitioners, which penetrates tens of meters into the earth at a frequency of approximately 1–3 GHz [13]. The acquisition system records and analyzes the energy change caused by changes in material characteristics [131]. GPR measurement is employed in the nondestructive diagnosis of roads and bridges, specifically to measure the thickness of the pavement and determine its position and orientation. It can display the internal image of the slab, the damage and change of structure, the condition of reinforcement, and estimate the water content in different areas [132,133,134,135]. Lai et al. [136] studied the dispersion of the GPR wave phase velocity in plywood and concrete with different moisture contents under different broadband frequencies. The results indicated that the velocity of low-frequency waves is much slower than that of high-frequency waves, and the velocity of the ground wave has a large dispersion in the low-frequency region. In addition, the age of concrete was found to have no effect on the ability of GPR to detect defects, and defects with radius depth ratio (R/d) as small as 0.15 were also detected [137].
Maierhofer’s research on concrete inspection showed that the maximum penetration at a high frequency (2.5 GHz) was 500 mm and the inspection resolution was 20 mm [138]. Hugenschmidt and Mastrangelo [131] proved that when detecting the thickness of concrete covering embedded reinforcement at 1.2 GHz, the detection resolution error in the depth direction is approximately 10 mm. Other scholars have verified that the delamination of multi-layer GFRP composite bridge decks can be detected 50–100 mm below the upper surface [139]. However, when using a frequency of 900 MHz [140], delamination can be detected in concrete decks up to 355 mm in thickness. Further, for the thickness of a concrete slab greater than 200 mm, the 2600 MHz antenna cannot accurately identify the layout of the bottom reinforcement layer [141]. When the ratio of the signal wavelength to the delamination thickness in concrete was less than 50, the delamination in unreinforced concrete could be detected. The depth of delamination relative to adjacent reinforcement affected the visibility in GPR images [142].
Zhang et al. applied GPR signals to provide a recognition model for the rapid diagnosis of water damage in asphalt pavements [122]. A ground-coupled 2.3 GHz GPR antenna was used to detect the asphalt pavement on the bridge deck. The water damage area was detected and visually recognized by the processed GPR B-scan image. Finally, the neural network model was used to evaluate the data, and the evaluation results were found to be consistent with the B-scan characteristics of GPR. Tong et al. [123] summarized the application of the deep learning method and GPR method in civil engineering detection, and the data types were classified. Figure 14 provides a general pipeline for processing a set of GPR data. Through a comparative study, it was confirmed that A-scan data are slightly better than B-scan and C-scan data.
GPR is among the most effective sensors for detecting dielectric cylindrical objects in concrete. Chang et al. provided the physical and theoretical models along with test results of embedded reinforcement. The results showed that this method could estimate the radius within 7% of the actual size [144]. Orlando applied a high-frequency multi-component 2 GHz GPR antenna to evaluate the deformation of a hollow pier caused by mechanical stress; the data interpretation is supported by the theoretical model of pier GPR [145]. Diamanti et al. [146] established the GPR numerical model, studied the properties of the reflected signals of various objects in the bridge structure, and conducted a GPR numerical analysis by using the finite difference time domain (FDTD) method [14]. Jazayeri et al. [147] established the geometric structure (Figure 15) and analyzed the propagation time of steel bar diffraction electromagnetic pulse:
d = x x T δ x 2 2 + y + r 2 r
ϕ = a r c t a n x x T + δ x 2 y + r
h = y + r 1 c o s ϕ
x 0 = x r s i n ϕ
d T = x 0 x T 2 + h 2
d R = x 0 x T δ x 2 2 + h 2
t T O R = d T + d R C / ϵ + t 0
where d T is the distance between the transmitting (T) antenna and the beam incident point on the reinforcement circumference ( O ); d R is the distance between the receiving (R) antenna and the beam incident point on the reinforcement circumference ( O ); x T is the position of the transmitting antenna on the ground; x R is the position of the receiving antenna on the ground, δ x is the antenna offset; r is the steel bar radius; the steel bar is located at the horizontal position x, which top is located at the depth y below the surface; c is the propagation speed of light; ϵ is the relative dielectric constant; and t T O R is the bidirectional propagation time of steel bar diffraction electromagnetic pulse.
Barnes et al. used the threshold established by amplitude time correction to significantly improve the spatial and quantitative prediction ability of GPR to describe corrosion damage [128]. Liu et al. [129] identified and analyzed the GPR signal characteristics of different prestressed pipeline defects. It was observed that when the pore was filled with water, the reflection interface became weaker. When grouting was qualified, the reflection interface was the weakest. A mobile GPR system is an effective tool for obtaining information such as reinforcement depth, concrete damage under pavement, and asphalt pavement thickness [130].
GPR is widely used in tunnel lining and road void detection [148]. However, the detection results are not ideal for smaller uncompacted defects, the internal defects of metal pipes, and steel arches with large buried depth [149]. The conflict between depth and resolution is insurmountable. The interference of multiple waves and other clutter is serious. It is difficult to obtain the necessary velocity data due to the inhomogeneity of the medium [150]. Single send and single receive data collection methods could provide limited information for post-processing and interpretation. The defect detection rate is related to defect size, spacing, and distribution of measurement lines. In order to improve the detection rate of defects, the number of radar detection lines should be appropriately increased in actual work. In addition, the influence of target burial depth on radar detection results is much greater than that of target size. Increasing the transmitting power of radar or decreasing the center frequency of the antenna could help to detect the target with a larger buried depth.

3.6. Piezoelectric Transducers

In recent years, scholars worldwide have applied sensors in the field of structural health monitoring to solve the reliability problem of concrete infrastructure in different stages of its service life [151,152,153,154,155]. The latest research results in the field of health monitoring sensors for concrete infrastructure have been reviewed, including sensors developed to monitor parameters such as pH value, temperature, corrosion rate, humidity, and stress/strain, as well as sensors based on optical fiber, Bragg grating, piezoelectric, electrochemical, wireless, and self-sensing technologies. Figure 16 shows an illustration of each sensor technology [156]. PZT offers the advantages of a wide frequency response range, including easy processing, low cost, simple preparation process, and fast response speed, which is a common material for bridge SHM [151].
In terms of structural corrosion detection, relevant detection research using sensors has been conducted. Ahmadi et al. [157] applied the electromechanical impedance method (EMI) to structural health monitoring and corrosion nondestructive diagnosis (Figure 17). Based on the change of impedance curve during corrosion, a method for detecting corrosion rate, corrosion direction, and corrosion initiation time was proposed. The sensitivity of PZT to the compressive strength of concrete was studied by experiments. Li et al. [152] combined the new domestic electromagnetic monitoring sensor with accelerated corrosion AE analyzer to monitor the whole corrosion process of reinforced concrete beams. The results showed that stirrups suffer chloride-induced corrosion earlier than longitudinal reinforcement, and the corrosion-resistant steel is confirmed to have higher chloride corrosion resistance than carbon steel. Zheng et al. [158] used AE sensors to study the corrosion process and cracking behavior of large reinforced concrete (RC) piles in simulated marine environments, where the tide has a significant impact on the AE signal. In addition, the joint analysis of the AE signal and fractal dimension of overburden cracks during the whole corrosion period could detect the pile damage caused by local corrosion globally. Ramani et al. [139] proposed a method to monitor the damage to concrete structures caused by reinforcement corrosion using a lens plastic optical fiber (LPOF) strain sensor. The test results could estimate the damage degree in the process of reinforcement corrosion, predict the remaining service life of the structure, and monitor the bending damage of the concrete structure.
Researchers have also conducted extensive research on the grouting compactness of prestressed bridges using sensors. Jiang et al. [159,160,161] proposed a new method for detecting the longitudinal grouting quality of prestressed curved reinforcement ducts based on active sensing. Then, they established a two-dimensional finite element model for monitoring the grouting compactness of prestressed reinforcement pipes with PZT (Figure 18). The grouting level of the prestressed curved reinforcement duct was estimated under the grouting state by comparing the voltage signal, power spectral density (PSD) energy, and wavelet packet energy of the piezoelectric sensor under different voltages. In a similar manner, scholars have proposed an active detection method for grouting defects of the grouted joint casing (GSS) based on direct stress wave measurement [162,163]. Tian et al. [164] applied the lead zirconate titanate (PZT) time-reversal method to monitor the grouting quality, which can quantitatively indicate the existence of grouting and evaluate the grouting quality by analyzing the peak change of time-reversal focus signal. Similarly, scholars have proposed an active sensing time inversion method based on stress waves to monitor the loosening state of a wedge anchorage system [165]. Zhou et al. applied an intelligent aggregate sensor and combined it with the time-reversal method to improve the signal-to-noise ratio [147] to obtain the amplitude of the overall regional focus signal, and a grouting state evaluation method considering wavelet packet transform and Bayesian classifier was proposed (as shown in Figure 19). The experimental results showed that a Bayesian classifier with an input energy vector could accurately identify different grouting conditions [148].
Scholars have also conducted extensive research on the detection of other aspects of concrete structures. Lin et al. conducted long-term experimental research on the performance of intelligent sensor labels based on sensor coding to detect concrete crack leakage. The experimental results indicated that this method can accurately reflect the water seepage in concrete cracks and is more effective than frequency [167]. Wang et al. [168] used three types of capacitance tomography array capacitive sensors that were developed to monitor the moisture content in cement-based materials. Under similar excitation conditions, the capacitive sensor with an internal electrode showed higher sensitivity to changes in moisture content. In addition, with the increase in relative humidity, the capacitance signal of cement mortar was observed to increase exponentially. Park et al. [169] applied advanced deep learning technology and structured light technology composed of vision and two laser sensors to the detection and quantification of surface cracks of concrete structures. They performed real-time detection of cracks and lasers with accuracies of 94 and 98%, respectively. Su et al. [170] verified the reliability of monitoring the strength gain process of cementitious materials by the first peak of phase angle resonant frequency (PARF) directly extracted from the phase angle spectrum. Barriaset et al. [171] and Ye et al. [172] studied the fatigue performance of reinforced concrete members using distributed optical fiber sensor (DOFS), which verified the long-term monitoring ability and good performance of (DOFS) on bridge structures. Cheng et al. [173] verified the effectiveness of the new capacitive sensor in accurately measuring the size and position of concrete-covered reinforcement through numerical simulation and experiments. Other scholars have applied sensors to study the resistivity of concrete structures [153,174,175].
Accurate safety inspection and diagnostic evaluation are the basis for ensuring structural safety and long service life [176,177]. PZT plays an important role in the whole-life health monitoring of structures [178,179]. However, the sensor’s effective response to damage is within a certain range. When the distance between the damage position and the piezoelectric sensor exceeds a certain range, the sensor will not be able to detect the damage. There are many related factors affecting the damage response range, such as the form of the main structure, the physical parameters of the sensor, and the frequency sweep range. In addition, it is difficult to provide specific damage information for structures with complex damage forms with PZT. However, most civil engineering structures are bulky and complex. It is inconvenient to obtain specific information about structural damage with a single sensor or a few sensors. Therefore, more penetrators should be arranged in the structure according to certain rules. Finally, an optimized algorithm is used for post-processing the obtained data, which is expected to realize the real intelligent detection and monitoring of structural health.

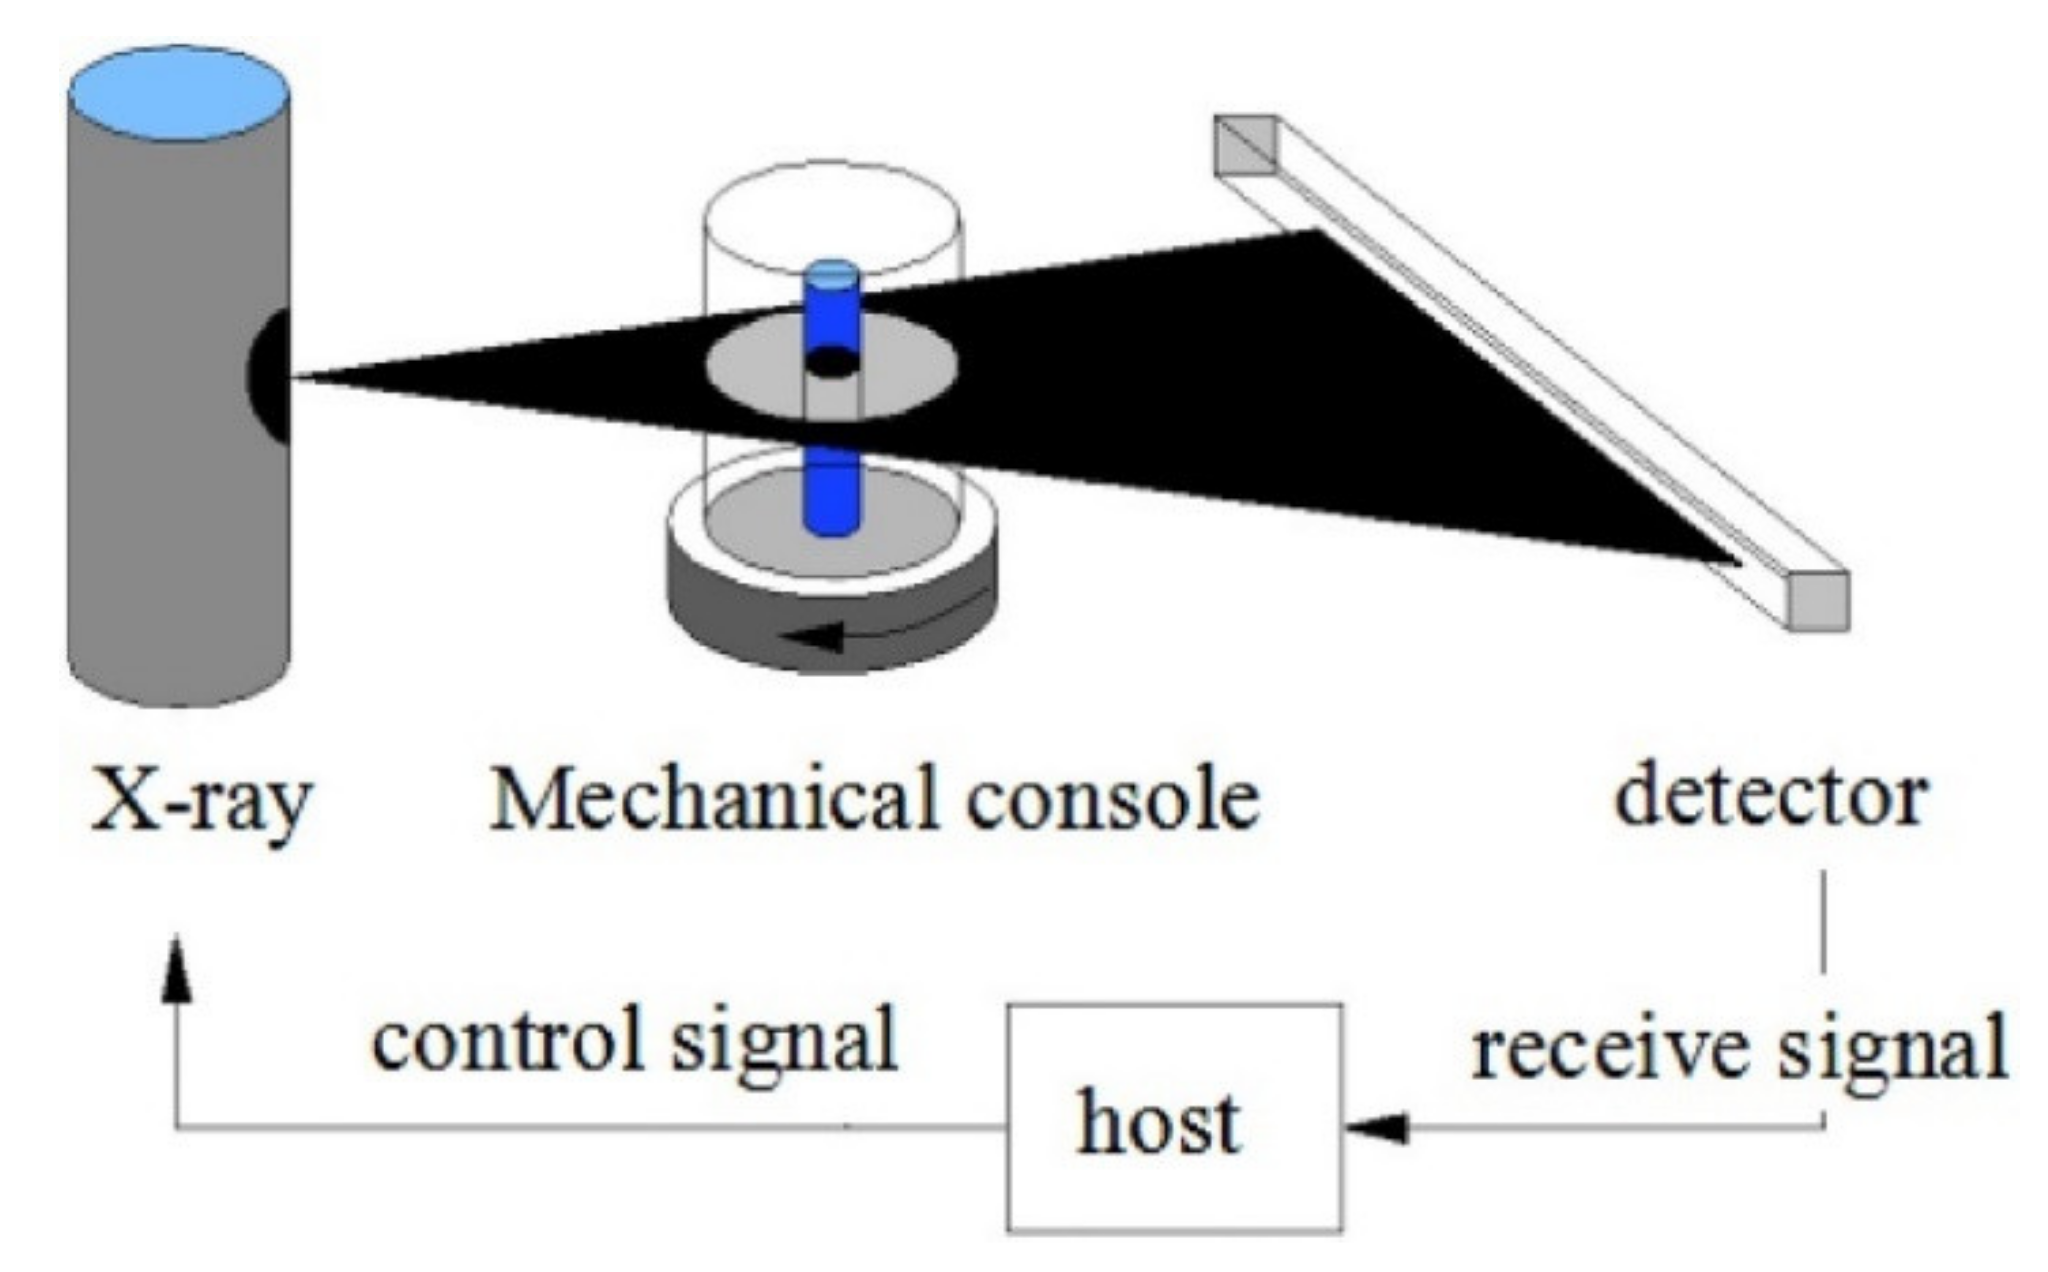
3.7. X-ray Computed Tomography Technique

At present, X-ray methods are also extensively used in the field of nondestructive testing. The principle of X-ray computed tomography involves reconstructing the [176] attenuation profile from a series of projection images [180]. Scholars have conducted a lot of research on concrete structures using the X-ray method [181]. Suzuki et al. quantitatively evaluated the damage of freeze–thaw concrete by AE and X-ray computed tomography [66,67,182]. The durability index was related to the statistical characteristics of CT numbers. With the increase in damage, the variance of the CT number appeared to increase, while the durability index correspondingly decreased. X-ray tomography could determine the evaluation of crack healing and the characteristics of pores directly, which is the most effective method for nondestructive testing of concrete self-healing [183]. Further, through the coupling of X-ray CT test and digital image analysis technology (Figure 20), Zhu et al. conducted a comparative study on the mesoscale damage evolution of concrete specimens [184]. The results indicated that the micro-defects of heterogeneous concrete specimens could be identified based on the relative gray value of CT images. The micro-defects can be characterized by quantitative indexes such as aggregate fraction, mortar fraction, voids, CT number mean, and variance.
In terms of corrosion detection of reinforced concrete, scholars have also conducted relevant research. Michel et al. [185] tested reinforced mortar samples under accelerated corrosion conditions by using the X-ray attenuation method. The applicability of this method in monitoring corrosion products and crack formation and propagation of cementing materials was verified. The development of corrosion products with time and the propagation of corrosion cracks could be tracked by X-ray attenuation measurement. Zhou et al. [180] used X-ray microcomputer tomography (μCT) (Figure 21) to study the corrosion of steel fiber-reinforced polymer composite reinforcement (SFCBs) and quantitatively analyzed the number of corrosion products. The results showed that fiber type, the microporous structure of fiber coating, and the manufacturing process are the main factors affecting the corrosion resistance of SFCBs. Van et al. [65] applied micro-focused X-ray computed tomography to verify the feasibility of locating and characterizing corrosion damage of reinforced concrete by AE. The gamma-ray detection method can be used to evaluate steel wire rope coated or covered with materials [186]. Skarzynski et al. [165] conducted experimental and numerical studies on the shear fracture of rectangular concrete beams with longitudinal and basalt reinforcements under quasi-static three-point bending. The experimental and numerical results were consistent with the failure mechanism, bearing capacity, and cracking mode. In addition, ray imaging technology was also observed to have a good effect on the nondestructive testing of low-carbon steel welded joints [166]. Freij et al. [187] used gamma-ray tomography (GRT) to verify test tendons with strands and grout voids, un-hydrated grout, and excess water. The results showed that GRT could detect complete voids, external voids, and un-hydrated grouting, but it is difficult to detect small internal voids.
Nondestructive evaluation of composite materials has been studied for several decades and is widely used in aerospace, marine, construction and transportation, petrochemical, and energy fields [188]. Gao et al. [15] studied the application of high-speed synchronous X-ray phase-contrast imaging (PCI) in the real-time damage characterization of glass fiber reinforced composites (GFRCs) under dynamic loading. It was found that high-speed X-ray PCI has sufficient phase contrast. The crack initiation could be characterized in 920ns with a spatial resolution of 20 μm.
Besides medical applications, X-ray is currently used in industrial flaw detection because of its strong penetration [189,190]. However, radiation is harmful to health. It is difficult to recover the developing fixer solution, and direct discharge causes environmental pollution [191]. X-ray films and other equipment are expensive and slow to examine [192]. It is only appropriate to detect porosity, shrinkage, and other volumetric defects. X-ray is not suitable for hollow structures. It is difficult to find cracks with small gaps and internal delamination defects of tubular profiles. Considering economy, safety, and applicability, it will take a long time for X-rays to be widely used in the field of engineering structures.

4. Selection of Nondestructive Testing Technology

The basic working principle, technical application, and respective advantages and disadvantages of seven NDT methods for reinforced concrete structures (see Table 1) are important in the selection of testing technology. In addition to ensuring the testing quality and accuracy, the economy and environmental protection of testing methods should also be considered. In this study, the characteristics of various NDT methods were compared and analyzed, which provides a technical reference for the rapid selection of follow-up researchers.
NDT is a comprehensive application technology to detect the material mechanical properties, defects, damage, durability, and microstructure degradation of structures without damage, which can evaluate the properties and quality of structures and components qualitatively and quantitatively. Based on the summary of existing research results, this study provides several common defects and applicable NDT methods (see Table 2). There are many nondestructive testing methods, and the basic principles of various methods involve many disciplines such as physics, materials science, chemistry, microelectronics, computer technology, and communication technology. Therefore, the development of nondestructive testing technology is closely related to the development of these disciplines. If researchers desire a deeper understanding of the application of detection technology, the subject knowledge involved in the basic principles must be learned.
Appropriate testing methods must be correctly adapted to achieve satisfactory testing results. In addition to understanding the application scope and limitations of the selected NDT methods, researchers should familiarize themselves with construction technology, structural performance, and damage mechanisms. Knowledge of relevant construction technology aids in determining the exact location of possible abnormalities in concrete. Therefore, it is suggested that relevant knowledge should be preliminarily learned before selecting NDT methods [16]. Because NDT is affected by many factors, to obtain satisfactory testing results, different methods can be used for testing and comprehensive comparison to improve the reliability of testing results [193].
When selecting the detection method, the appropriate one should be determined only after the type and nature of structural defects are fully estimated according to the site, conditions, materials, and construction technology. The evaluation of the test results should integrate as much information as possible. At present, there are many kinds of NDT equipment. Selecting advanced equipment with high precision is of great help in improving detection accuracy. However, the quality of testers will also have a certain impact on the test results, which requires testers to reduce their dependence on experience and strictly follow the test standards. At the same time, the testing instruments must be regularly maintained and measured, and the equipment must be tested and cleaned on time.
With the rapid development of infrastructure construction, new structures, materials, and construction technologies are constantly being proposed in the field of civil engineering, which also poses new challenges to the application of nondestructive testing technology. Future testing technologies and equipment should satisfy the following requirements:
(1)
The development of the NDT theory should meet the actual needs;
(2)
Nondestructive testing technology should conform to the concept of green, economic, environmental protection, and energy savings;
(3)
Digitization, portability, and intelligence of testing instruments;
(4)
Automation of data processing;
(5)
Visualization of test results.

5. Conclusions

This paper summarizes seven nondestructive testing methods for reinforced concrete structures. The testing principles, application scope, advantages, limitations, and research status of various testing methods were introduced. The research results are expected to provide a technical reference for engineering application selection and future research direction of NDT technology. The main conclusions of this study are as follows:
(1)
The theoretical research and engineering applications of acoustic emission (AE), such as the detection of structural delamination, cracks, and steel corrosion, have achieved remarkable achievements. In field detection, noise interference and long propagation distance will lead to signal attenuation. The quantitative study of AE damage is not mature enough, and the parameters for quantitative description of structural damage degree are not uniform.
(2)
IE has strong penetration and a long wavelength. IE is effective in detecting concrete structure thickness, surface crack depth, and internal defects in concrete. In the quantitative detection of grouting compactness of prestressed pipeline, the accuracy is better than UT, GPR, and X-ray.
(3)
UT is widely used in the detection of micro and macro defects of reinforced concrete, compressive strength of concrete, and grouting quality of prestressed air ducts, especially in the evaluation of concrete slab layering and holes. The location detection of defects is not accurate enough. In addition, UT is greatly affected by the reinforcement mesh in the structure. IRT can quantitatively evaluate defects and damage in the near-surface area of various structures. IRT is widely used in the detection of bridge deck delamination, but the existence of a bridge deck covering, mortar, and water reduces the accuracy.
(4)
GPR has a good visualization effect, showing the internal image of the structure, damage, and change of the structure. It is suitable for the quality assessment of roads and bridges and has a good effect on the empty-out and positioning detection of concrete structures. However, the electromagnetic wave is susceptible to being interfered with by the dense metal layer inside the measured structure, which will increase the difficulty of analysis and reduce the test accuracy.
(5)
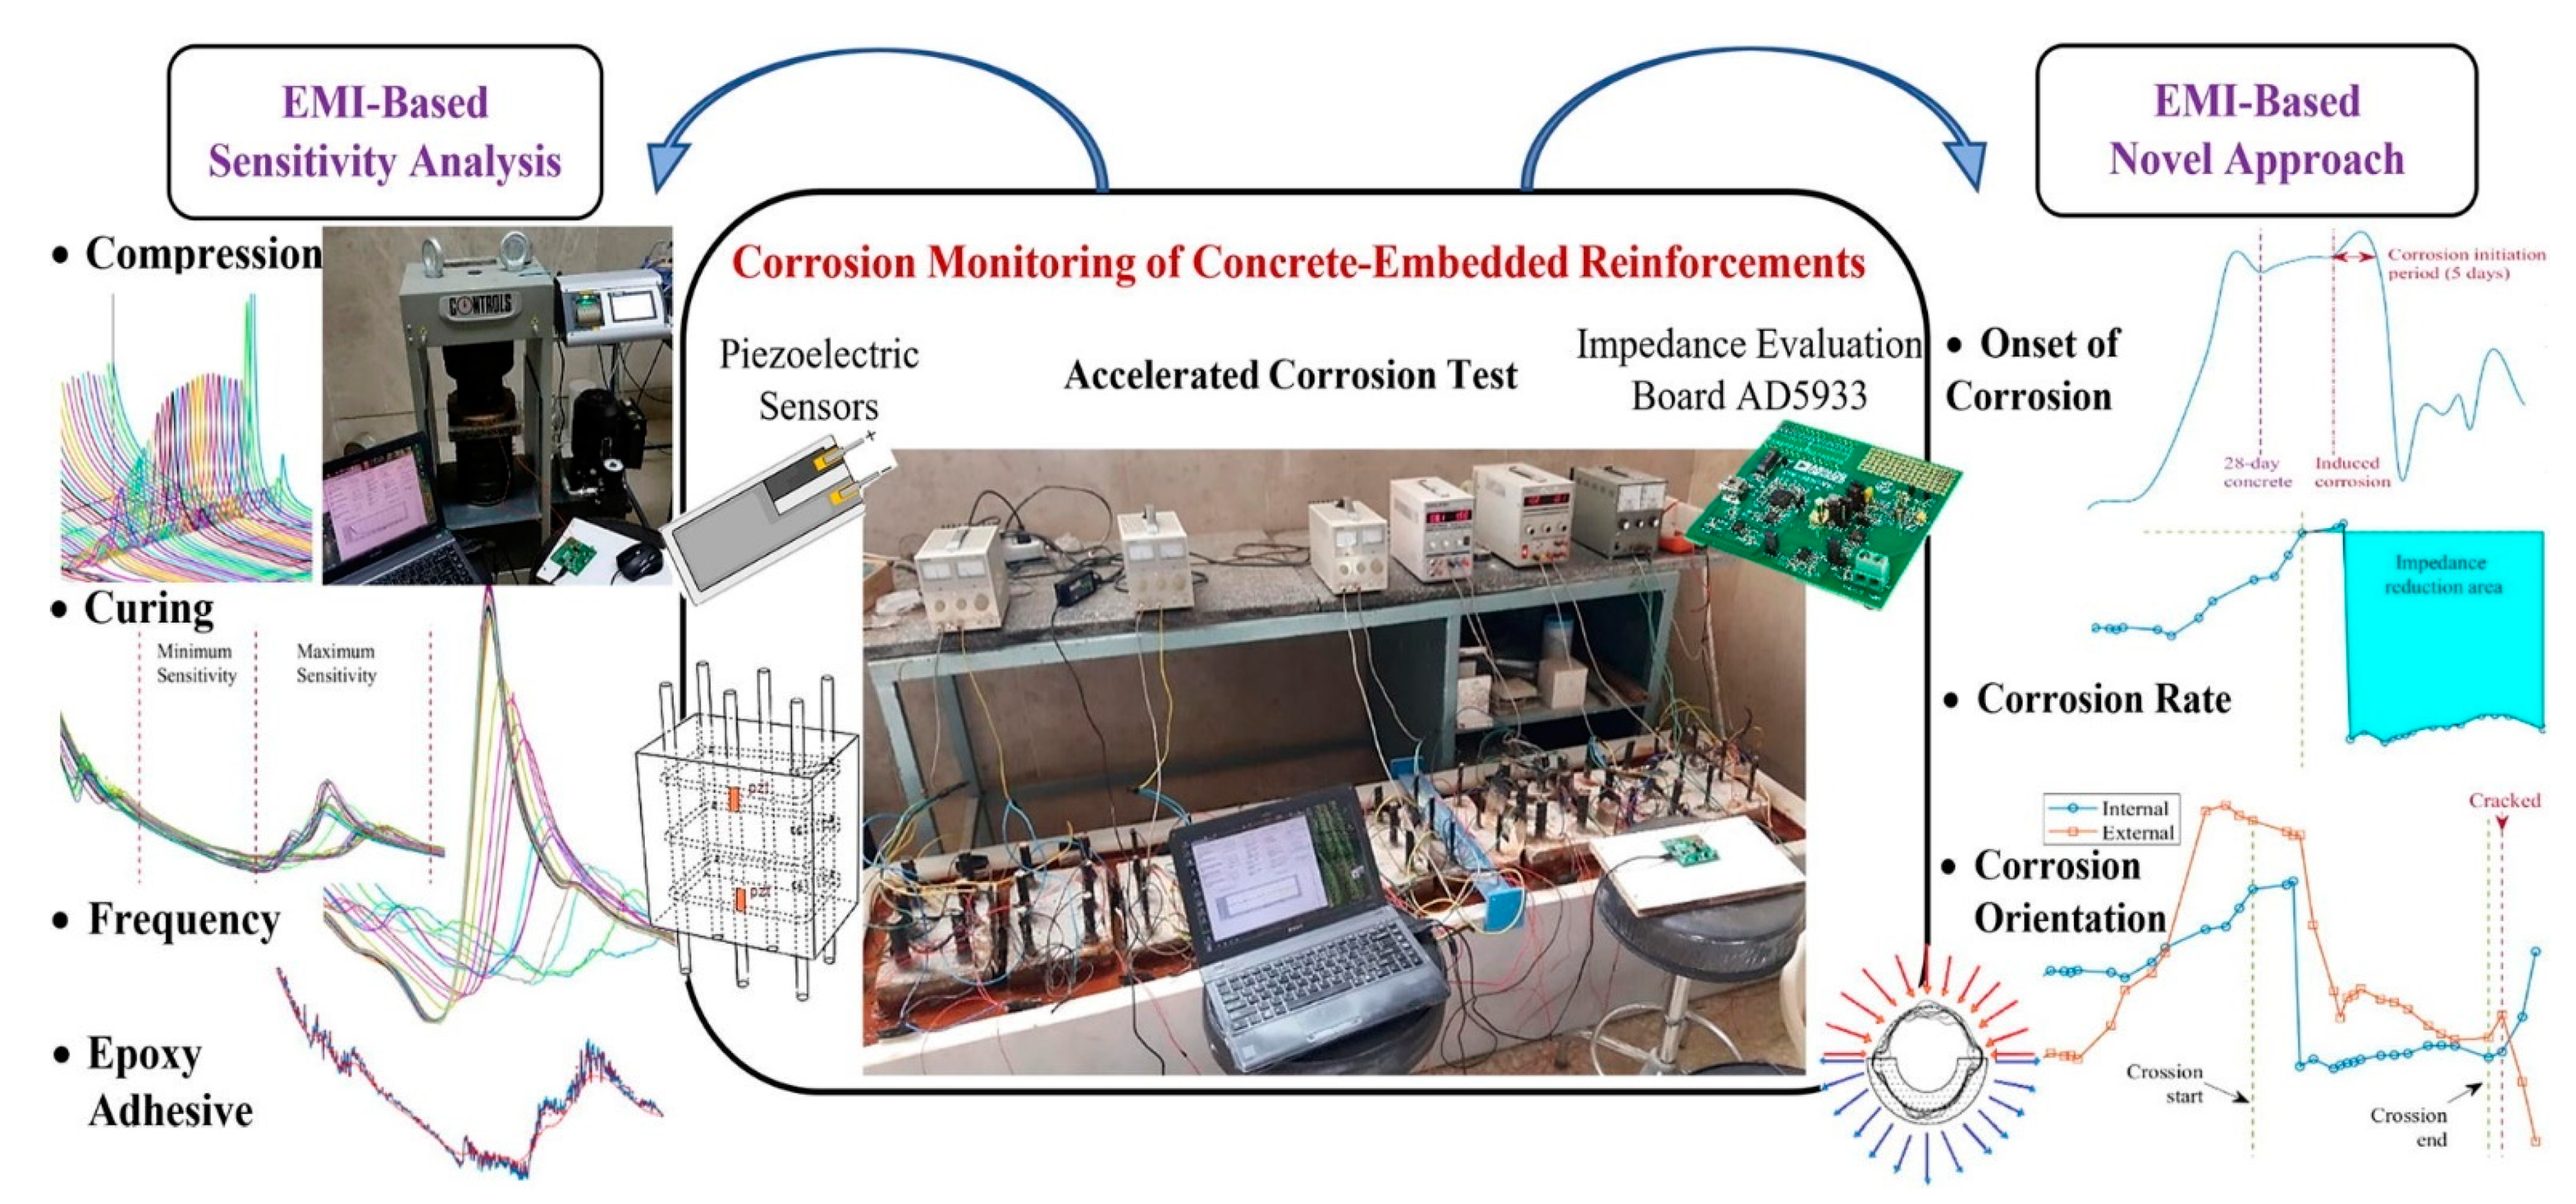
In the field of structural health monitoring, PZT could solve the reliability problem of concrete infrastructure in different life stages. In addition, PZT has achieved remarkable results in the detection of concrete strength, reinforced concrete corrosion, and compactness of prestressed grouting pipe.
(6)
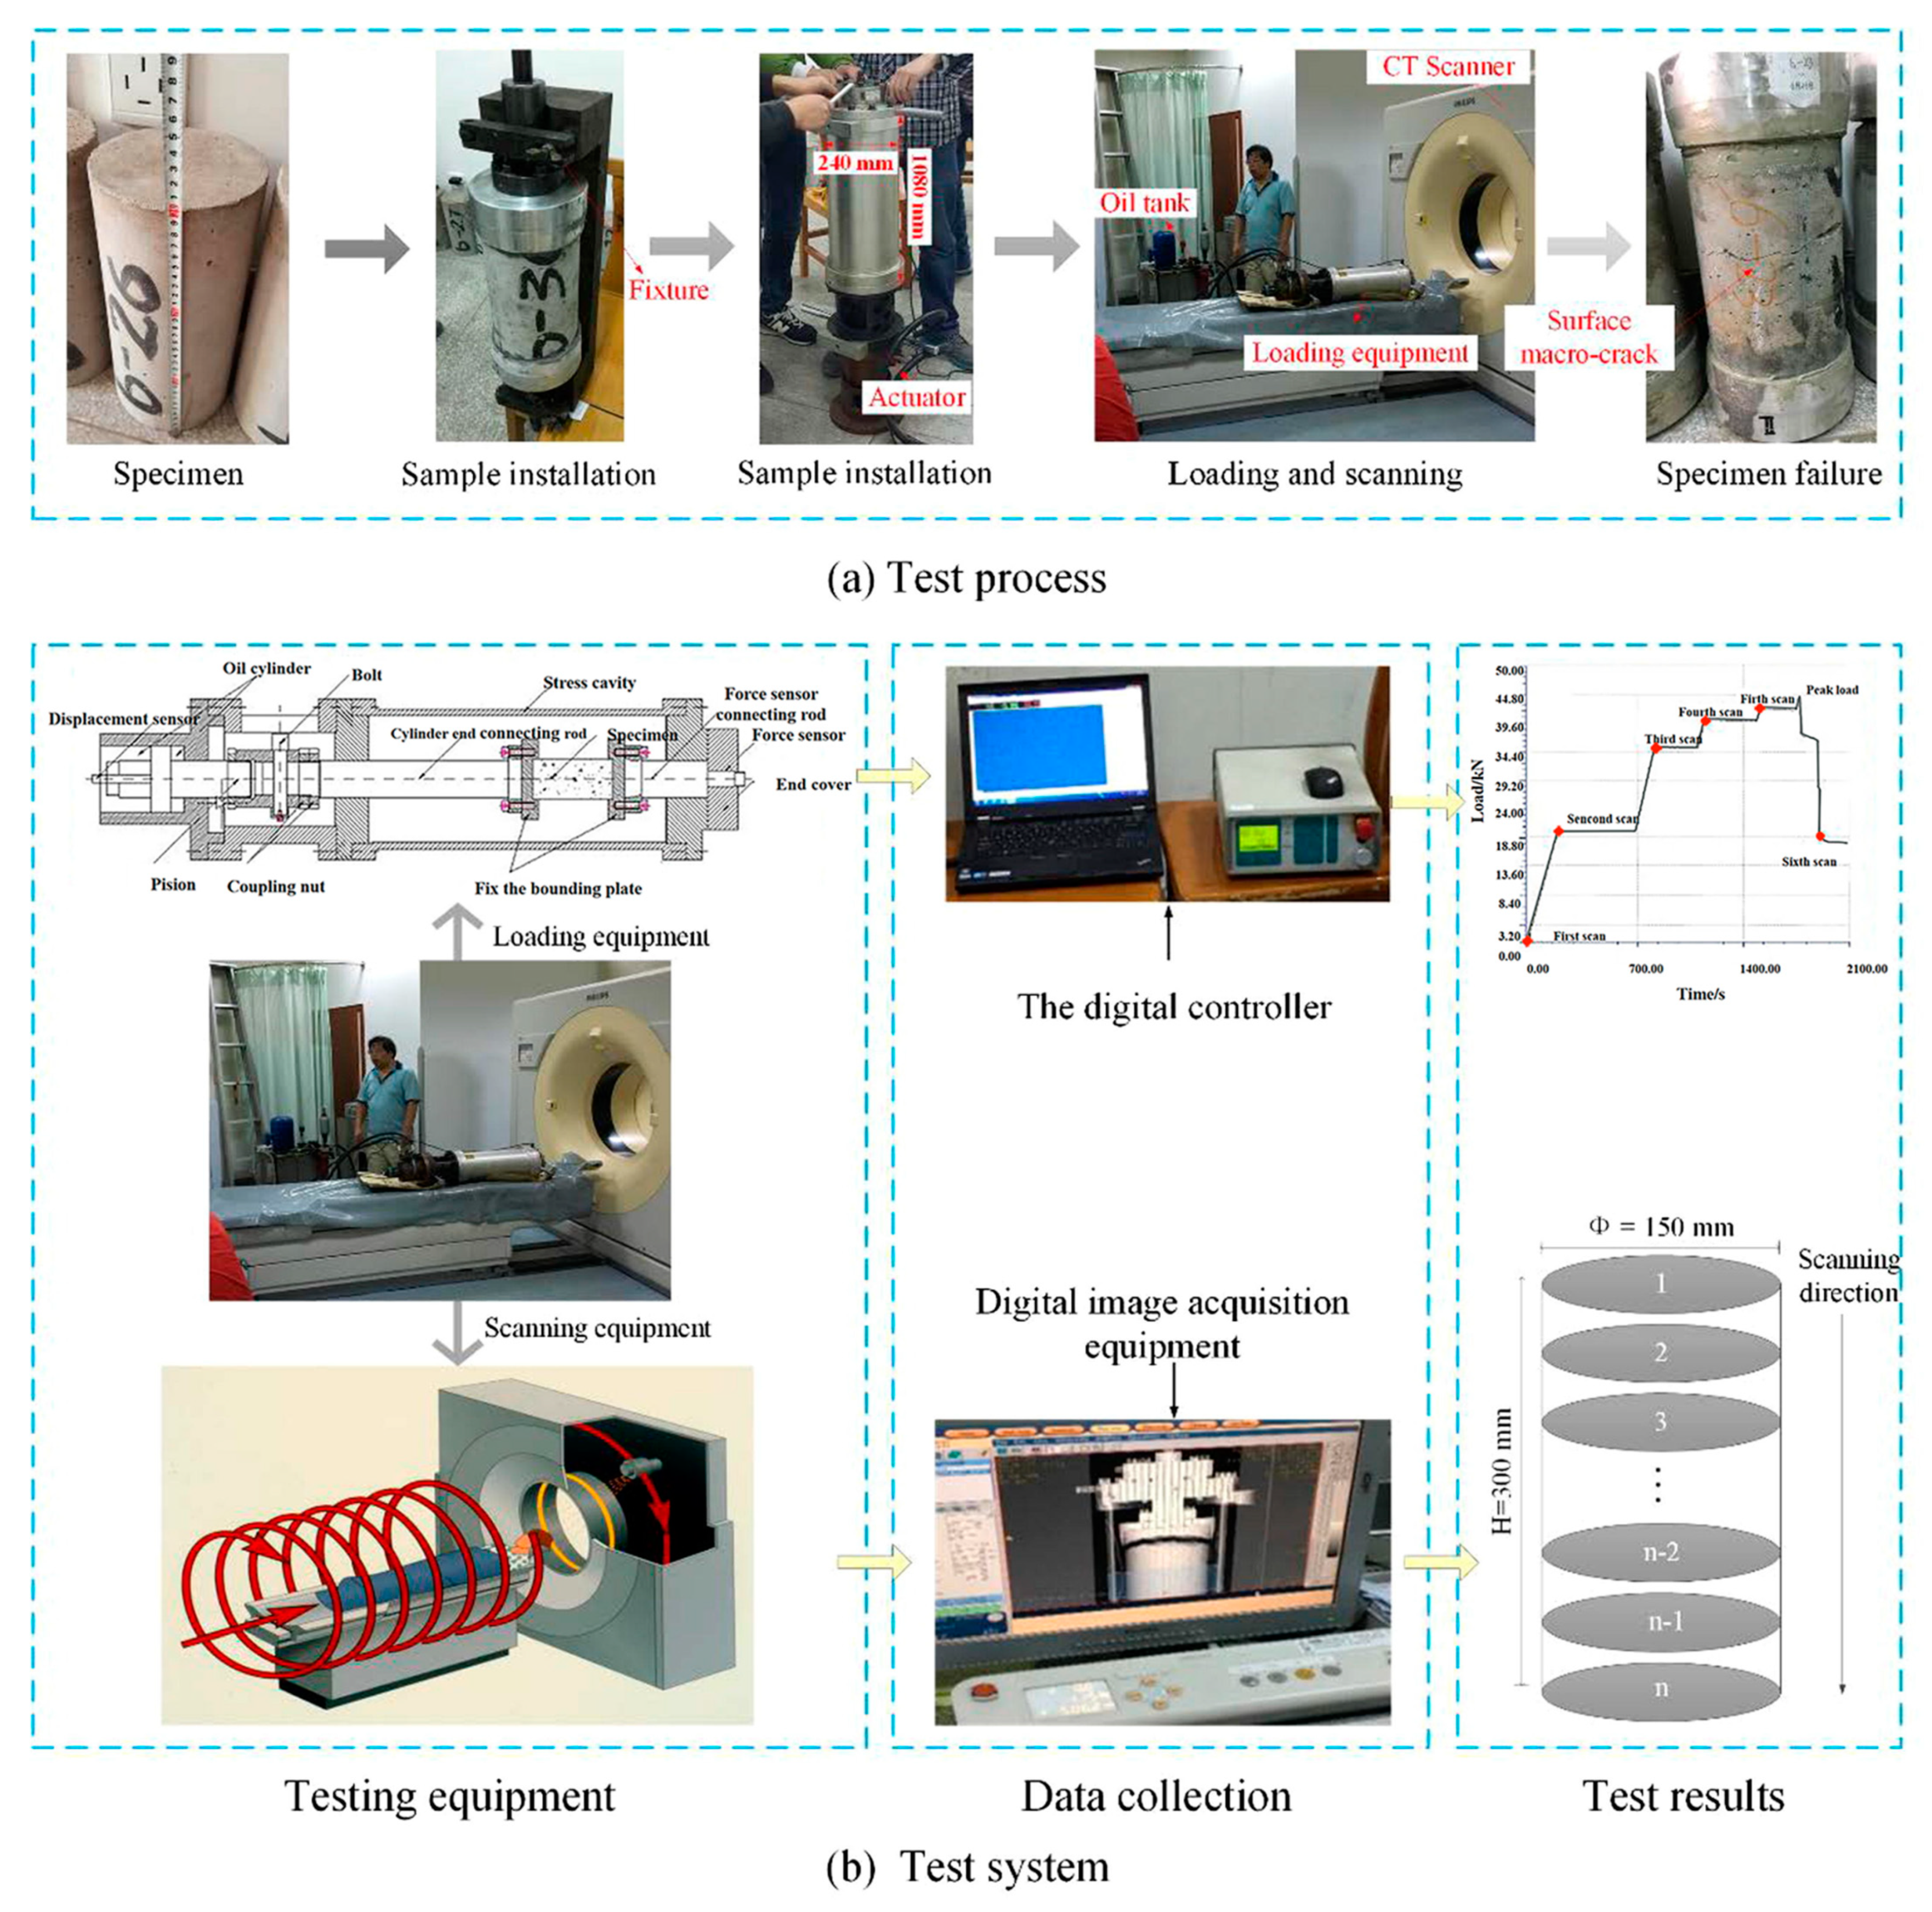
The gradual application of X-rays in the field of nondestructive engineering testing is good proof of the continuous progress of science and technology. X-ray tomography technology is mainly used in the nondestructive evaluation of reinforced concrete corrosion, concrete cracks, gaps, and composite materials. The method is efficient, flexible, and highly visualized. Given the harm of radiation, protective measures are necessary for the detection process.

6. Recommendations for Future Research

Although researchers have done a lot of research on NDT methods, in order to further promote their safety, accuracy, and efficiency, some new subjects and learning methods need further study:
(1)
Study on unmanned aerial vehicle (UAV) detection technology
(a) UAV visual inspection. (b) UAV infrared thermal image detection. (c) UAV digital radiographic detection. (d) UAV with ultrasonic detection technology or impact echo detection technology. The application of drones in the engineering field could greatly reduce manpower and financial resources and could greatly reduce the potential risks in the detection process.
(2)
Study on wireless remote sensing technology and wireless sensor technology
(a) At present, the development of modern sensing technology and wireless remote sensing technology has provided new ideas for the development of nondestructive testing technology in our country. Wireless remote sensing technology can record information and transmit data; at the same time, it can combine wireless sensing technology to transmit the collected data to a designated location.
(b) In order for the intelligent bridge nondestructive testing technology to be incorporated into the modern bridge management system and make the bridge management system more complete, researchers need to do more research on these two technologies.
(3)
Study on machine learning
Machine learning is a multi-field interdisciplinary subject involving probability theory, statistics, approximation theory, convex analysis, algorithm complexity theory, and other subjects. The following algorithms can be studied in detail: (a) Decision Tree Algorithm (DT), (b) Naive Bayes Algorithm (NB) and Support Vector Machine Algorithm (SVM), (c) Random Forest Algorithm (RA), (d) Boosting and Bagging Algorithm, (e) Association Rule Algorithm (AR), (f) Expectation Maximization (EM) Algorithm.
(4)
Study on deep learning
Deep learning enables machines to imitate human activities such as audio-visual and thinking and solves many complex pattern recognition problems and has made great progress in artificial intelligence-related technologies. It mainly involves three types of methods. (a) Neural network system based on convolution operation (CNN). (b) The self-encoding neural network based on multi-layer neurons includes two types: Auto encoder and Sparse Coding. (c) Pre-training is carried out in the way of a multi-layer self-encoding neural network and then combined with the identification information to further optimize the deep belief network (DBN) of the neural network weight.
In conclusion, various NDT methods have their respective advantages in the engineering field. Given the differences in testing methods and analytical methods, there is still room for improvement in each method. The sensitivity of AE to material characteristics and noise should be reduced. In addition, the testing efficiency of IE needs to be improved. The applicability of UT to complex structures and the coupling effect of structural surfaces should be studied extensively. Reducing the electromagnetic interference of metal objects to GPR is an engineering problem to be solved, and there is still a lot of work to be done for the applicability and economy of IRT and X-ray for field detection. With the progress of science and technology, NDT will be more widely used and make greater contributions to the engineering field.

Author Contributions

Conceptualization, Y.Z., S.W., P.Z., T.X. and J.Z.; methodology, Y.Z., S.W., T.X. and J.Z.; validation, S.W., P.Z., T.X. and J.Z.; formal analysis, Y.Z., S.W., P.Z. and J.Z.; resources, S.W.; writing—original draft, S.W.; writing—review and editing, Y.Z. and P.Z.; supervision, P.Z.; project administration, Y.Z.; funding acquisition, Y.Z. and T.X. All authors have read and agreed to the published version of the manuscript.

Funding

This research was funded by the National Natural Science Foundation of China (Grant No. 51878623, U2040224), Natural Science Foundation of Henan (Grant No. 212300410018), Sinosteel Zhengzhou Research Institute of Steel Wire Products Co., Ltd. (Grant No. 20200256A), and Program for Innovative Research Team (in Science and Technology) in University of Henan Province of China (Grant No. 20IRTSTHN009).

Data Availability Statement

Not applicable.

Conflicts of Interest

The authors declare no conflict of interest. The funders had no role in the design of the study; in the collection, analyses, or interpretation of data; in the writing of the manuscript, or in the decision to publish the result.

References

  1. Hugenschmidt, J. Concrete bridge inspection with a mobile GPR system. Constr. Build. Mater. 2002, 16, 147–154. [Google Scholar] [CrossRef]
  2. Anania, L.; Badala, A.; D’Agata, G. Damage and collapse mode of existing post tensioned precast concrete bridge: The case of Petrulla viaduct. Eng. Struct. 2018, 162, 226–244. [Google Scholar] [CrossRef]
  3. Forde, M.C. Bridge research in Europe. Constr. Build. Mater. 1998, 12, 85–91. [Google Scholar] [CrossRef]
  4. Xin, G.; Wang, Z.; Liu, J. Study on testing technology of grouting compactness of prestressed duct of box girder. J. Highw. Transp. Technol. 2010, 27, 114–117. [Google Scholar]
  5. Shen, J.; Li, Z.; Zhang, Z. Nondestructive Testing Technology and Its Application in Civil Engineering. Nondestruct. Test. 2000, 22, 499–504. [Google Scholar]
  6. Mi, S.; Zhu, Z.; Peng, L.; Li, G. Experimental study of detecting grouting density of pre-stressed tendon ducts through ultrasonic. J. Cent. South Univ. Sci. Technol. 2013, 44, 2378–2384. [Google Scholar]
  7. Terzioglu, T.; Karthik, M.M.; Hurlebaus, S. Nondestructive evaluation of grout defects in internal tendons of post-tensioned girders. NDT E Int. 2018, 99, 23–35. [Google Scholar] [CrossRef]
  8. Kamalakannan, S.; Thirunavukkarasu, R.; Pillai, R.G. Factors affecting the performance characteristics of cementitious grouts for post-tensioning applications. Constr. Build. Mater. 2018, 180, 681–691. [Google Scholar] [CrossRef]
  9. Wu, Y.; Hao, Y.; Tao, J. Non-destructive testing on anchorage quality of hollow grouted rock bolt for application in tunneling lessons learned from their uses in coal mines. Tunn. Undergr. Space Technol. 2019, 93, 103094. [Google Scholar] [CrossRef]
  10. Bogas, J.A.; Gomes, M.G.; Gomes, A. Compressive strength evaluation of structural lightweight concrete by non-destructive ultrasonic pulse velocity method. Ultrasonics 2013, 53, 962–972. [Google Scholar] [CrossRef]
  11. Karabutov, A.A.; Podymova, N.B. Quantitative analysis of the influence of voids and delaminations on acoustic attenuation inCFRP composites by the laser-ultrasonic spectroscopy method. Compos. Part. B Eng. 2014, 56, 238–244. [Google Scholar] [CrossRef]
  12. Sham, J.F.C.; Lo, T.Y.; Memon, S.A. Verification and application of continuous surface temperature monitoring technique forinvestigation of nocturnal sensible heat release characteristics by building fabrics. Energy Build. 2012, 53, 108–116. [Google Scholar] [CrossRef]
  13. Dorafshan, S.; Azari, H. SIBIE application to detecting void at post-installed adhesive anchor in concrete. Constr. Build. Mater. 2021, 272, 121916. [Google Scholar]
  14. Solla, M.; Lorenzo, H.; Novo, A. Structural analysis of the Roman Bibei bridge (Spain) based on GPR data and numerical modelling. Automat. Constr. 2012, 22, 334–339. [Google Scholar] [CrossRef]
  15. Gao, J.; Kedir, N.; Kirk, C.D. Real-time damage characterization for GFRCs using high-speed synchrotron X-ray phase contrastimaging. Compos. Part. B Eng. 2021, 207, 108565. [Google Scholar] [CrossRef]
  16. Rehman, S.K.; Ibrahim, Z.; Memon, S.A. Nondestructive test methods for concrete bridges: A review. Constr. Build. Mater. 2016, 107, 58–86. [Google Scholar] [CrossRef] [Green Version]
  17. Lin, S.; Meng, D.; Choi, H. Laboratory assessment of nine methods for nondestructive evaluation of concrete bridge decks with overlays. Constr. Build. Mater. 2018, 188, 966–982. [Google Scholar] [CrossRef]
  18. He, S.; Zhao, X.; Ma, J. Overview of highway bridge detection and evaluation technology. Chin. J. Highw. 2017, 30, 63–80. [Google Scholar]
  19. Scott, M.; Rezaizadeh, A.; Delahaza, A. A comparison of nondestructive evaluation methods for bridge deck assessment. NDT E Int. 2003, 36, 245–255. [Google Scholar] [CrossRef]
  20. Mori, K.; Spagnoli, A.; Murakami, Y. A new non-contacting non-destructive testing method for defect detection in concrete. NDT E Int. 2002, 35, 399–406. [Google Scholar] [CrossRef]
  21. Sack, D.A.; Olson, L.D. Advanced NDT methods for evaluating concrete bridges and other structures. NDT E Int. 1995, 28, 349–357. [Google Scholar] [CrossRef]
  22. Li, N.; Cao, M.; Liu, K. A boundary detecting method for post-tensioned pre-stressed ducts based on Q-factor analysis. Sensors Actuators A Phys. 2016, 248, 88–93. [Google Scholar] [CrossRef]
  23. Li, N.; Cao, M.; Liu, K. Portable inspection system design for grouting quality evaluation of post-tensioned prestressed ducts. In Proceedings of the 12th IEEE International Conference on Electronic Measurement & Instruments (ICEMI), Qingdao, China, 16–18 July 2015; pp. 178–183. [Google Scholar]
  24. Guo, B.; Chen, D.; Huo, L. Monitoring of Grouting Compactness in Tendon Duct Using Multi-Sensing Electro-MechanicalImpedance Method. Appl. Sci. 2020, 10, 2018. [Google Scholar] [CrossRef] [Green Version]
  25. Li, T.; Long, S. Grout assessment of plastic ducts in prestressed structures with an HHT-based method. Constr. Build. Mater. 2018, 180, 35–43. [Google Scholar] [CrossRef]
  26. Liu, Z.; Zhao, J.; Wu, B. Configuration optimization of magnetostrictive transducers for longitudinal guided wave inspection in seven-wire steel strands. NDT E Int. 2010, 43, 484–492. [Google Scholar] [CrossRef]
  27. Yong-Sik, Y.; Hwa-Sung, R.; Hee-Seob, L. Effect of grout conditions and tendon location on corrosion pattern in PS tendon ingrout. Constr. Build. Mater. 2018, 186, 1005–1015. [Google Scholar] [CrossRef]
  28. Guo, R.; Zhen, Z.; Zhao, S. Effects of Grouting Defects in a Duct on the Bonding of Prestressing Strands. KSCE J. Civ. Eng. 2020, 24, 1268–1275. [Google Scholar] [CrossRef]
  29. Daria, D.; Vladimir, V.; Stefano, S. Ultrasonic spectroscopic analysis of impact damage in composites by using laser vibrometry. Compos. Struct. 2019, 211, 221–228. [Google Scholar]
  30. Pawel, K.; Tomasz, W.; Pawel, M. Application of scanning laser Doppler vibrometry for delamination detection in composite structures. Opt. Lasers Eng. 2017, 99, 46–57. [Google Scholar]
  31. Guinchard, M. Non-Invasive Measurements of Ultra-Lightweight Composite Materials Using Laser Doppler Vibrometry System. In Proceedings of the 26th International Congress on Sound and Vibration (ICSV), Montreal, QC, Canada, 7–11 July 2019. [Google Scholar]
  32. Pour, A.F.; Verma, R.K.; Nguyen, G.D.; Bui, H.H. Analysis of transition from diffuse to localized failure in sandstone and concrete using Digital Image correlation. Eng. Fract. Mech. 2022, 267, 108465. [Google Scholar] [CrossRef]
  33. Mohammad, H.Z.; Mohammad, H.R.; Torabi, K. Optimal design of a novel graded auxetic honeycomb core for sandwich beams under bending using digital image correlation (DIC). Compos. Struct. 2022, 286, 115310. [Google Scholar]
  34. Jordan, C.; Matteo, C.; Francois, H. An algorithm for structural health monitoring by digital image correlation: Proof of concept and case study. Opt. Lasers Eng. 2022, 151, 106842. [Google Scholar]
  35. Jintao, H.; Dong, L. Mechanical properties measurement and micro-damage characterization of ITZ in concrete by SEM-DIC method. Opt. Lasers Eng. 2022, 155, 107064. [Google Scholar]
  36. Huiheng, L.; Xinjian, S.; Zhenpeng, Y. Research on the fracture mechanical basalt fiber nano-CaCO3 concrete based on DIC technology. Constr. Build. Mater. 2022, 329, 127193. [Google Scholar]
  37. Azzeddine, B.; Mahdi, B.F.; Chéruel, A. Combination of acoustic emission and digital image correlation monitoring for wedge splitting tests on large concrete specimens. Constr. Build. Mater. 2022, 322, 126496. [Google Scholar]
  38. Yang, L.; Tommaso, S.; Junyan, L. All-optical dynamic analysis of the photothermal and photoacoustic response of a microcantilever by laser Doppler vibrometry. Photoacoustics 2021, 24, 100299. [Google Scholar]
  39. Guangyong, S.; Yuansong, W.; Quantian, L. Vibration-based damage identification in composite plates using 3D-DIC and wavelet analysis. Mech. Syst. Signal. Processing 2022, 173, 108890. [Google Scholar]
  40. Cassidy, N.J.; Eddies, R.; Dods, S. Void detection beneath reinforced concrete sections: The practical application of ground-penetrating radar and ultrasonic techniques. J. Appl. Geophys. 2011, 74, 263–276. [Google Scholar] [CrossRef]
  41. Lim, K.; Cao, H. Combining multiple NDT methods to improve testing effectiveness. Constr. Build. Mater. 2013, 38, 1310–1315. [Google Scholar] [CrossRef]
  42. Wang, J. Application of nondestructive testing technology in steel structure testing. Chem. Des. Commun. 2020, 46, 138–139. [Google Scholar]
  43. Chong, K.P.; Scalzi, J.B.; Carino, N.J. Nondestructive Testing Methods for Civil Infrastructure. Nondestruct. Eval. Aging Struct. Dams 1995, 2457, 34–44. [Google Scholar]
  44. Nair, A.; Cai, C.S. Acoustic emission monitoring of bridges: Review and case studies. Eng. Struct. 2010, 32, 1704–1714. [Google Scholar] [CrossRef]
  45. Ohtsu, M.; Ono, K. A generalized theory of AE and Green’s functions in a half space. J. AE 1984, 3, 124–133. [Google Scholar]
  46. Grosse, U.C.; Ohtsu, M. Acoustic Emission Testing; Springer: Berlin/Heidelberg, Germany, 2008. [Google Scholar]
  47. Ohtsu, M. Elastic wave methods for NDE in concrete based on generalized theory of acoustic emission. Constr. Build. Mater. 2016, 122, 845–854. [Google Scholar] [CrossRef]
  48. Brebbia, C.A. The Boundary Element Method for Engineers; Pentech Press: Xi’an, China, 1978. [Google Scholar]
  49. Breckenridge, F.R.; Tschiegg, C.E.; Greenspan, M. Acoustic emission: Some applications of lamb’s problem. J. Acoust. Soc. Am. 1975, 57, 626–631. [Google Scholar] [CrossRef]
  50. Breckenridge, F.R.; Greenspan, M. Surface-wave displacement: Absolute measurements using a capacitive transducer. J. Acoust. Soc. Am. 1981, 69, 1177–1185. [Google Scholar] [CrossRef]
  51. Proctor, T.M. Some details on the NBS conical transducer. J. AE 1982, 1, 173–178. [Google Scholar]
  52. Chen, X.; Wang, Z. Discussion on acoustic emission field detection method of bridge structure. Introd. Sci. Innov. 2009, 32, 244–245. [Google Scholar]
  53. Mouzakis, D.E.; Dimogianopoulos, D.G. Acoustic emission detection of damage induced by simulated environmental condition in carbon fiber reinforced composites. Eng. Fract. Mech. 2018, 210, 422–428. [Google Scholar] [CrossRef]
  54. Lin, K. Experimental study of a novel multi-hazard resistant prefabricated concrete frame structure. Soil Dyn. Earthq. Eng. 2018, 119, 390–407. [Google Scholar] [CrossRef]
  55. Baran, I. Acoustic emission from microcrack initiation in polymer matrix composites in short beam shear test. J. Nondestr. Eval. 2018, 37, 7. [Google Scholar] [CrossRef] [Green Version]
  56. Ji, H.; Hou, Z.; Zhang, L. Experimental study on frequency characteristics of acoustic emission signals of concrete materials and their correlation with strength parameters. Appl. Acoust. 2011, 30, 112–117. [Google Scholar]
  57. Zhu, H.; Xu, W.; Chen, X. Quantitative evaluation of concrete damage using acoustic emission signal and rate process theory. Eng. Mech. 2008, 25, 186–191. [Google Scholar]
  58. Ji, H.; Zhang, T.; Cai, M. Experimental study on acoustic emission dynamic detection of concrete material damage. J. Rock Mech. Eng. 2000, 2, 165–168. [Google Scholar]
  59. Colombo, S.; Forde, M.C.; Main, I.G.; Halliday, J.; Bontekoning, Y.; Macharis, C.; Trip, J. AE monitoring of concrete bridge beams in situ. Struct. Eng. 2003, 8, 41–46. [Google Scholar]
  60. Holford, K.L. Inspection and monitoring techniques for bridges and structures. In Acoustic Emission Testing of Bridges; Woodhead Publishing Ltd.: Cambridge, UK, 2005; pp. 183–215. [Google Scholar]
  61. Carter, H.K. Strategic consideration for AE monitoring of bridges: A discussion and Case study. J. Br. Inst. NDT 1998, 40, 6–112. [Google Scholar]
  62. Ma, Y.; Li, S.; Wu, Y. Acoustic emission testing method for the sleeve grouting compactness of fabricated structure. Constr. Build. Mater. 2019, 221, 800–810. [Google Scholar] [CrossRef]
  63. Li, S.; Shi, H.; Wu, G. Application of acoustic emission technology in crack Detection of concrete Hollow slab Bridge. Bridge Constr. 2017, 47, 83–88. [Google Scholar]
  64. Carpinteri, A.; Lacidogna, G.; Accornero, F. Influence of damage in the acoustic emission parameters. Cem. Concr. Comp. 2013, 44, 9–16. [Google Scholar] [CrossRef]
  65. Van, S.C.; Pahlavan, L.; Wevers, M. Localization and characterization of corrosion damage in reinforced concrete by means ofacoustic emission and X-ray computed tomography. Constr. Build. Mater. 2019, 197, 21–29. [Google Scholar]
  66. Suzuki, T.; Shiotani, T.; Ohtsu, M. Evaluation of cracking damage in freeze-thawed concrete using acoustic emission and X-ray CT image. Constr. Build. Mater. 2017, 136, 619–626. [Google Scholar] [CrossRef]
  67. Suzuki, T.; Nishimura, S.; Shimamoto, Y. Damage estimation of concrete canal due to freeze and thawed effects by acoustic emission and X-ray CT methods. Constr. Build. Mater. 2020, 245, 118343. [Google Scholar] [CrossRef]
  68. Lan, D.; Chun-Sheng, W.; Mu-Sai, Z. Monitoring and evaluation of fatigue damage for orthotropic steel deck using acoustic. J. Traffic Transp. Eng. 2020, 20, 60–73. [Google Scholar]
  69. Sheng-Jun, C.; Cheng, W.; Tian-Shu, Z. Review of acoustic emission technology applied in bridge health monitoring. Eng. Constr. 2021, 35, 1216–1219. [Google Scholar]
  70. Hongguang, J.; Tiansen, Z.; Meifeng, Z. Experimental study on acoustic emission dynamic detection of concrete material damage. Chin. J. Rock Mech. Eng. 2000, 19, 165–168. [Google Scholar]
  71. Xiuli, X.; Yong, Z.; Xuehong, L. Study on damage identification method of reinforced concrete beam based on acoustic emission and deep belief nets. J. Build. Struct. 2018, 39, 400–407. [Google Scholar]
  72. Lu, J. Influence of Structural Factors on Acoustic Emission Characteristics of Roller Compacted Concrete. Water Conserv. Sci. Technol. Econ. 2022, 28, 160–164. [Google Scholar]
  73. Carino, N.J.; Sansalone, M.; Hsu, N.N. Flaw detection in concrete by frequency spectrum analysis of impact-echo waveforms. In International Advances in Nondestructive Testing; Gordon & Breach Science Pub: Philadelphia, PA, USA, 1986; Volume 12, pp. 117–146. [Google Scholar]
  74. Sansalone, M.; Carino, N.J. Detecting delamination in concrete slabs with and without overlays using the impact-echo method. ACI Mater. J. 1989, 86, 175–184. [Google Scholar]
  75. Zhu, J.; Popovics, P.E. Imaging Concrete Structures Using Air-Coupled Impact-Echo. J. Eng. Mech. 2007, 133, 628–640. [Google Scholar] [CrossRef]
  76. Dorafshan, S.; Azari, H. Deep learning models for bridge deck evaluation using impact echo. Constr. Build. Mater. 2020, 263, 120109. [Google Scholar] [CrossRef]
  77. Azari, H.; Nazarian, S.; Yuan, D. Assessing sensitivity of impact echo and ultrasonic surface waves methods for nondestructive evaluation of concrete structures. Constr. Build. Mater. 2014, 71, 384–391. [Google Scholar] [CrossRef]
  78. Lin, J.M.; Sansalone, M. Impact-echo studies of interfacial bond quality in concrete: Part I-Effects of unbonded fraction of area. ACI Mater. J. 1996, 93, 223–232. [Google Scholar]
  79. Lin, Y.; Sansalone, M. Detecting flaws in concrete beams and columns using the impact-echo method. ACI Mater. J. 1992, 89, 394–405. [Google Scholar]
  80. Sansalone, M.; Streett, W.B. Impact-Echo Nondestructive Evaluation of Concrete and Masonry; Bullbrier Press: New York, NY, USA, 1997. [Google Scholar]
  81. Steinbach, J.; Vey, E. Caisson evaluation by stress wave propagation method. J. Geotech. Eng. Div. 1975, 101, 361–378. [Google Scholar] [CrossRef]
  82. Jm, L.; Sansalone, M. A Procedure for Determining P-Wave Speed in Concrete for Use in Impact-Echo Testing Using a Rayleigh Wave Speed Measurement Technique; American Concrete Institute: Farmington Hills, MI, USA, 1997; pp. 137–165. [Google Scholar]
  83. Zou, C.; Chen, Z.; Dong, P. Experimental and Numerical Studies on Nondestructive Evaluation of Grout Quality in TendonDucts Using Impact-Echo Method. J. Bridge Eng. 2016, 21, 04015040. [Google Scholar] [CrossRef]
  84. Muldoon, R.; Chalker, A.; Forde, M.C. Identifying voids in plastic ducts in post-tensioning prestressed concrete members byresonant frequency of impact–echo, SIBIE and tomography. Constr. Build. Mater. 2007, 27, 527–537. [Google Scholar] [CrossRef]
  85. Zhou, X.; Cao, Y.; Xu, X. Research of Grouting Quality in Prestressed Duct Through Impact-echo Method. In Proceedings of the 3rd International Conference on Engineering Technology and Application (ICETA 2016), Beijing, China, 20 June 2016; pp. 1070–1075. [Google Scholar]
  86. Schoefs, F.; Abraham, O.; Popovics, J.S. Quantitative evaluation of contactless impact echo for non-destructive assessment ofvoid detection within tendon ducts. Constr. Build. Mater. 2012, 37, 885–892. [Google Scholar] [CrossRef] [Green Version]
  87. Ohtsu, M.; Watanabe, T. Stack imaging of spectral amplitudes based on impact-echo for flaw detetion. NDT E Int. 2002, 35, 189–196. [Google Scholar] [CrossRef]
  88. Alver, N.; Wiggenhauser, H. Modified SIBIE procedure for ungrouted tendon ducts applied to scanning impact echo. Constr. Build. Mater. 2010, 24, 2388–2392. [Google Scholar] [CrossRef]
  89. Yao, F.; Chen, G.; Abula, A. Research on signal processing of segment-grout defect in tunnel based on impact-echo method. Constr. Build. Mater. 2018, 187, 280–289. [Google Scholar] [CrossRef]
  90. Tang, H.X.; Long, S.G.; Li, T. Quantitative evaluation of tunnel lining voids by acoustic spectrum analysis. Constr. Build. Mater. 2019, 228, 116762. [Google Scholar] [CrossRef]
  91. Xingyu, L.; Wenhao, C.; Yaxun, Y. Analysis on Influential Factors of Grouting Quality in Concrete Pipe Based on Impact-echo Method. Railw. Eng. 2020, 60, 53–57. [Google Scholar]
  92. Guoqiang, X.; Chen, H.; Fagang, W. Structural model test of concrete quality by impact echo method. Chin. J. Rock Mech. Eng. 2001, S1, 1790–1792. [Google Scholar]
  93. Jing-Kui, Z.; De-Mi, C. Experimental Study on Detecting Thickness and Defects of Concrete Structure by lmpact-Echo Method. J. Yangtze River Sci. Res. Inst. 2018, 35, 125–128. [Google Scholar]
  94. Zhengzhou, C.; Ping, D.; Zhu, X. Influencing factors on impact-echo characteristic frequency in a box beam. J. Vib. Shock 2010, 29, 126–131. [Google Scholar]
  95. Planès, T.; Larose, E. A review of ultrasonic Coda Wave Interferometry in concrete. Cem. Concr. Res. 2013, 53, 248–255. [Google Scholar] [CrossRef]
  96. Zielińska, M.; Rucka, M. Detection of debonding in reinforced concrete beams using ultrasonic transmission tomography andhybrid ray tracing technique. Constr. Build. Mater. 2020, 262, 120104. [Google Scholar] [CrossRef]
  97. Nazarian, S.; Baker, M.R.; Crain, K. Development and Testing of a Seismic Pavement Analyzer; Report SHRP-H-375; Strategic Highway Research Program, National Research Council: Washington, DC, USA, 1993. [Google Scholar]
  98. Lu, J.; Tang, S.; Dai, X. Investigation into the Effectiveness of Ultrasonic Tomography for Grouting Quality Evaluation. KSCE J. Civ. Eng. 2018, 22, 5094–5101. [Google Scholar] [CrossRef]
  99. De La Haza, A.O.; Samokrutov, A.A.; Samokrutov, P.A. Assessment of concrete structures using the Mira and Eyecon ultrasonic shear wave devices and the SAFT-C image reconstruction technique. Constr. Build. Mater. 2013, 38, 1276–1291. [Google Scholar] [CrossRef]
  100. Shokouhi, P.; Wolf, J.; Wiggenhauser, H. Detection of Delamination in Concrete Bridge Decks by Joint Amplitude and PhaseAnalysis of Ultrasonic Array Measurements. J. Bridge Eng. 2014, 19, 04013005. [Google Scholar] [CrossRef]
  101. Shah, A.A.; Ribakov, Y.; Zhang, C. Efficiency and sensitivity of linear and non-linear ultrasonics to identifying micro and macro-scale defects in concrete. Mater. Eng. 2013, 50, 905–916. [Google Scholar] [CrossRef]
  102. Haach, V.G.; Ramirez, F.C. Qualitative assessment of concrete by ultrasound tomography. Constr. Build. Mater. 2016, 119, 61–70. [Google Scholar] [CrossRef]
  103. Jin, C.; Xiaodong, C.; Hui, Z. Experimental research and application of non-destructive detecting techniques for concrete-filled steel tubes based on infrared thermal imaging and ultrasonic method. J. Build. Struct. 2021, 42, 444–453. [Google Scholar]
  104. Penghui, Z.; Yang, Z.; Peng, L. Research Progress in Ultrasonic Imaging Detection Technology. Laser Optoelectron. Prog. 2022, 59, 1–15. [Google Scholar]
  105. Zhao, G.; Zhang, D.; Zhang, L. Detection of Defects in Reinforced Concrete Structures Using Ultrasonic Nondestructive Evaluation with Piezoceramic Transducers and the Time Reversal Method. Sensors 2018, 18, 4176. [Google Scholar] [CrossRef] [Green Version]
  106. Li, D.; Zhou, J.; Ou, J. Damage, nondestructive evaluation and rehabilitation of FRP composite-RC structure: A review. Constr. Build. Mater. 2021, 271, 121551. [Google Scholar] [CrossRef]
  107. Lu, Y.; Li, J.; Ye, L. Guided waves for damage detection in rebar reinforced concrete beams. Constr. Build. Mater. 2013, 47, 370–378. [Google Scholar] [CrossRef]
  108. Maierhofer, C.; Arndt, R.; Röllig, M. Application of impulse-thermography for non-destructive assessment of concrete structures. Cem. Concr. Comp. 2006, 28, 393–401. [Google Scholar] [CrossRef]
  109. Ghosh, K.K.; Karbhari, V.M. Use of infrared thermography for quantitative non-destructive evaluation in FRP strengthenedbridge systems. Mater. Struct. 2011, 44, 169–185. [Google Scholar] [CrossRef]
  110. Tashan, J.; Al-Mahaidi, R. Investigation of the parameters that influence the accuracy of bond defect detection in CFRP bondedspecimens using IR thermography. Compos. Struct. 2012, 94, 519–531. [Google Scholar] [CrossRef]
  111. Tashan, J.; Al-Mahaidi, R. Detection of cracks in concrete strengthened with CFRP systems using infrared thermography. Compos. B Eng. 2014, 64, 116–125. [Google Scholar] [CrossRef]
  112. Bejan, A.; Kraus, A.D. Heat Transfer Handbook; John Wiley: New York, NY, USA, 2003. [Google Scholar]
  113. Ritter, M.E. The Physical Environment: An Introduction to Physical Geography. 2010. Available online: https://www.thephysicalenvironment.com/ (accessed on 6 May 2022).
  114. Atkins, P.W.; De Paula, J. Atkins’ Physical Chemistry, 8th ed.; Oxford University Press: Oxford, NY, USA, 2006. [Google Scholar]
  115. Ozisik, N.M. Heat Transfer a Basic Approach; McGraw-Hill: New York, NY, USA, 1985. [Google Scholar]
  116. Janků, M.; Cikrle, P.; Grošek, J. Comparison of infrared thermography, ground-penetrating radar and ultrasonic pulse echo for detecting delamination in concrete bridges. Constr. Build. Mater. 2019, 225, 1098–1111. [Google Scholar] [CrossRef]
  117. Breysse, D. (Ed.) Nondestructive Assessment of Concrete Structures: Reliability and Limits of Single and Combined Techniques; Springer: Dordrecht, The Netherlands, 2012. [Google Scholar]
  118. Fokaides, P.A.; Kalogirou, S.A. Application of infrared thermography for the determination of the overall heat transfer coefficient (U-Value) in building envelopes. Appl. Energy 2011, 88, 4358–4365. [Google Scholar] [CrossRef]
  119. Hiasa, S.; Birgul, R.; Catbas, F.N. Investigation of effective utilization of infrared thermography (IRT) through advanced finite element modeling. Constr. Build. Mater. 2017, 150, 295–309. [Google Scholar] [CrossRef]
  120. Omar, T.; Nehdi, M.; Zayed, T. Infrared thermography model for automated detection of delamination in RC bridge decks. Constr. Build. Mater. 2018, 168, 313–327. [Google Scholar] [CrossRef]
  121. Gu, J.; Unjoh, S.; Naito, H. Detectability of delamination regions using infrared thermography in concrete members strengthened by CFRP jacketing. Compos. Struct. 2020, 245, 112328. [Google Scholar] [CrossRef]
  122. Omar, T.; Nehdi, M.L. Remote sensing of concrete bridge decks using unmanned aerial vehicle infrared thermography. Automat. Constr. 2017, 83, 360–371. [Google Scholar] [CrossRef]
  123. Vavilov, V.P.; Burleigh, D.D. Review of pulsed thermal NDT: Physical principles, theory and data processing. NDT E Int. 2015, 73, 28–52. [Google Scholar] [CrossRef]
  124. Goffin, B.; Banthia, N.; Yonemitsu, N. Use of infrared thermal imaging to detect corrosion of epoxy coated and uncoated rebar in concrete. Constr. Build. Mater. 2020, 263, 120162. [Google Scholar] [CrossRef]
  125. Guangheng, L.; Jianwen, P.; Jinting, W. Infrared thermal imaging technique-based method for detecting defect of insulation layer of concrete dam. Water Resour. Hydropower Eng. 2020, 51, 71–77. [Google Scholar]
  126. Yuekun, M.; Zaiwei, L.; Yanxu, Z. Infrared thermal imaging detection method for surface cracks of ballastless track slab. J. Railw. Sci. Eng. 2022, 19, 579–587. [Google Scholar]
  127. Ying, X.; Qingyuan, W.; Congcong, L. Nondestructive debonding detection of fiber reinforced plastics strengthened concrete structure based on infrared thermal imaging with laser thermal excitation. Acta Mater. Compos. Sin. 2020, 37, 472–481. [Google Scholar]
  128. Nichen, W.; Ruizhen, Y.; Yunze, H. Detection of interface bonding defects in carbon fiber sheet reinforced concrete using multi-mode infrared thermography. Chin. J. Sci. Instrum. 2018, 39, 37–44. [Google Scholar]
  129. Gharawz, M.A.; Adu-Gyamfi, Y.; Washer, G. A framework for automated time-lapse thermography data processing. Constr. Build. Mater. 2019, 227, 116507. [Google Scholar] [CrossRef]
  130. Ibarra-Castanedo, C.; González, D.A.; Galmiche, F.; Bendada, A.; Maldague, X.P. On signal transforms applied to pulsed thermography. Recent Res. Dev. Appl. Phys. 2006, 9, 101–127. [Google Scholar]
  131. Hugenschmidt, J.; Mastrangelo, R. GPR inspection of concrete bridges. Cem. Concr. Comp. 2006, 28, 384–392. [Google Scholar] [CrossRef]
  132. Pérez-Gracia, V.; García, F.; Rodriguez Abad, I. GPR evaluation of the damage found in the reinforced concrete base of a block of flats: A case study. NDT E Int. 2008, 41, 341–353. [Google Scholar] [CrossRef]
  133. Stryk, J.; Matula, R.; Pospíšil, K. Comparative measurements of ground penetrating radars used for road and bridge diagnostics in the Czech Republic and France. Constr. Build. Mater. 2017, 154, 1199–1206. [Google Scholar] [CrossRef]
  134. Alani, A.M.; Aboutalebi, M.; Kilic, G. Applications of ground penetrating radar (GPR) in bridge deck monitoring and assessment. J. Appl. Geophys. 2013, 97, 45–54. [Google Scholar] [CrossRef]
  135. Lachowicz, J.; Rucka, M. A novel heterogeneous model of concrete for numerical modelling of ground penetrating radar. Constr. Build. Mater. 2019, 227, 116703. [Google Scholar] [CrossRef]
  136. Lai, W.W.; Chang, R.; Völker, C. GPR wave dispersion for material characterization. Constr. Build. Mater. 2021, 282, 122597. [Google Scholar] [CrossRef]
  137. Yehia, S.; Qaddoumi, N.; Farrag, S. Investigation of concrete mix variations and environmental conditions on defect detection ability using GPR. NDT E Int. 2014, 65, 35–46. [Google Scholar] [CrossRef]
  138. Maierhofer, C. Nondestructive evaluation of concrete infrastructure with ground penetrating radar. J. Mater. Civ. Eng. 2003, 15, 287–297. [Google Scholar] [CrossRef]
  139. Clc, H.; Ub, H. Nondestructive testing of GFRP bridge decks using ground penetrating radar and infrared thermography. J. Bridge Eng. 2010, 15, 391–398. [Google Scholar]
  140. Gg, C. Nondestructive inspection of overlaid bridge decks with ground-penetrating radar. Transp. Res. Rec. 1983, 899, 21–32. [Google Scholar]
  141. Rathod, H.; Gupta, R. Sub-surface simulated damage detection using Non-Destructive Testing Techniques in reinforced-concrete slabs. Constr. Build. Mater. 2019, 215, 754–764. [Google Scholar] [CrossRef]
  142. Dinh, K.; Gucunski, N. Factors affecting the detectability of concrete delamination in GPR images. Constr. Build. Mater. 2021, 274, 121837. [Google Scholar] [CrossRef]
  143. Tong, Z.; Gao, J.; Yuan, D. Advances of deep learning applications in ground-penetrating radar: A survey. Constr. Build. Mater. 2020, 258, 120371. [Google Scholar] [CrossRef]
  144. Chang, C.; Lin, C.; Lien, H.S. Measurement radius of reinforcing steel bar in concrete using digital image GPR. Constr. Build. Mater. 2009, 23, 1057–1063. [Google Scholar] [CrossRef]
  145. Orlando, L.; Pezone, A.; Colucci, A. Modeling and testing of high frequency GPR data for evaluation of structural deformation. NDT E Int. 2016, 43, 216–230. [Google Scholar] [CrossRef]
  146. Diamanti, N.; Giannopoulos, A.; Forde, M.C. Numerical modelling and experimental verification of GPR to investigate ringseparation in brick masonry arch bridges. NDT E Int. 2008, 41, 354–363. [Google Scholar] [CrossRef]
  147. Jazayeri, S.; Kruse, S.; Hasan, I. Reinforced concrete mapping using full-waveform inversion of GPR data. Constr. Build. Mater. 2019, 229, 117102. [Google Scholar] [CrossRef]
  148. Jie, L.; Qianli, Z.; Du, C. Model Test of Ground Penetrating Radar Detection for High Speed Railway Tunnel Lining with Defects. China Railw. Sci. 2021, 42, 103–111. [Google Scholar]
  149. Qinlin, L. A review of the application of ground penetrating radar. Sci. Technol. Innov. 2021, 4, 73–74. [Google Scholar]
  150. Shi-Lei, W.; Yan, G.; Fa-Lin, Q. Review on inspection technology of railway operation tunnels. J. Traffic Transp. Eng. 2020, 20, 41–57. [Google Scholar]
  151. Chen, Y.; Xue, X. Advances in the Structural Health Monitoring of Bridges Using Piezoelectric Transducers. Sensors 2018, 18, 4312. [Google Scholar] [CrossRef] [Green Version]
  152. Li, Z.; Jin, Z.; Xu, X. Combined application of novel electromagnetic sensors and acoustic emission apparatus to monitorcorrosion process of reinforced bars in concrete. Constr. Build. Mater. 2020, 245, 118472. [Google Scholar] [CrossRef]
  153. Pan, H.; Guan, J. Stress and strain behavior monitoring of concrete through electromechanical impedance using piezoelectric cement sensor and PZT sensor. Constr. Build. Mater. 2022, 324, 126685. [Google Scholar] [CrossRef]
  154. Negi, P.; Chhabra, R.; Kaur, N.; Bhalla, S. Health monitoring of reinforced concrete structures under impact using multiple piezo-based configurations. Constr. Build. Mater. 2019, 222, 371–389. [Google Scholar] [CrossRef]
  155. Das, S.; Saha, P. A review of some advanced sensors used for health diagnosis of civil engineering structures. Measurement 2018, 129, 68–90. [Google Scholar] [CrossRef]
  156. Taheri, S. A review on five key sensors for monitoring of concrete structures. Constr. Build. Mater. 2019, 204, 492–509. [Google Scholar] [CrossRef]
  157. Ahmadi, J.; Feirahi, M.H.; Farahmand-Tabar, S. A novel approach for non-destructive EMI-based corrosion monitoring of concrete-embedded reinforcements using multi-orientation piezoelectric sensors. Constr. Build. Mater. 2021, 273, 121689. [Google Scholar] [CrossRef]
  158. Zheng, Y.; Zhou, Y.; Zhou, Y. Localized corrosion induced damage monitoring of large-scale RC piles using acoustic emissiontechnique in the marine environment. Constr. Build. Mater. 2020, 243, 118270. [Google Scholar] [CrossRef]
  159. Jiang, T.; He, B.; Zhang, Y. Detecting of the Longitudinal Grouting Quality in Prestressed Curved Tendon Duct UsingPiezoceramic Transducers. Sensors 2020, 20, 1212. [Google Scholar] [CrossRef] [Green Version]
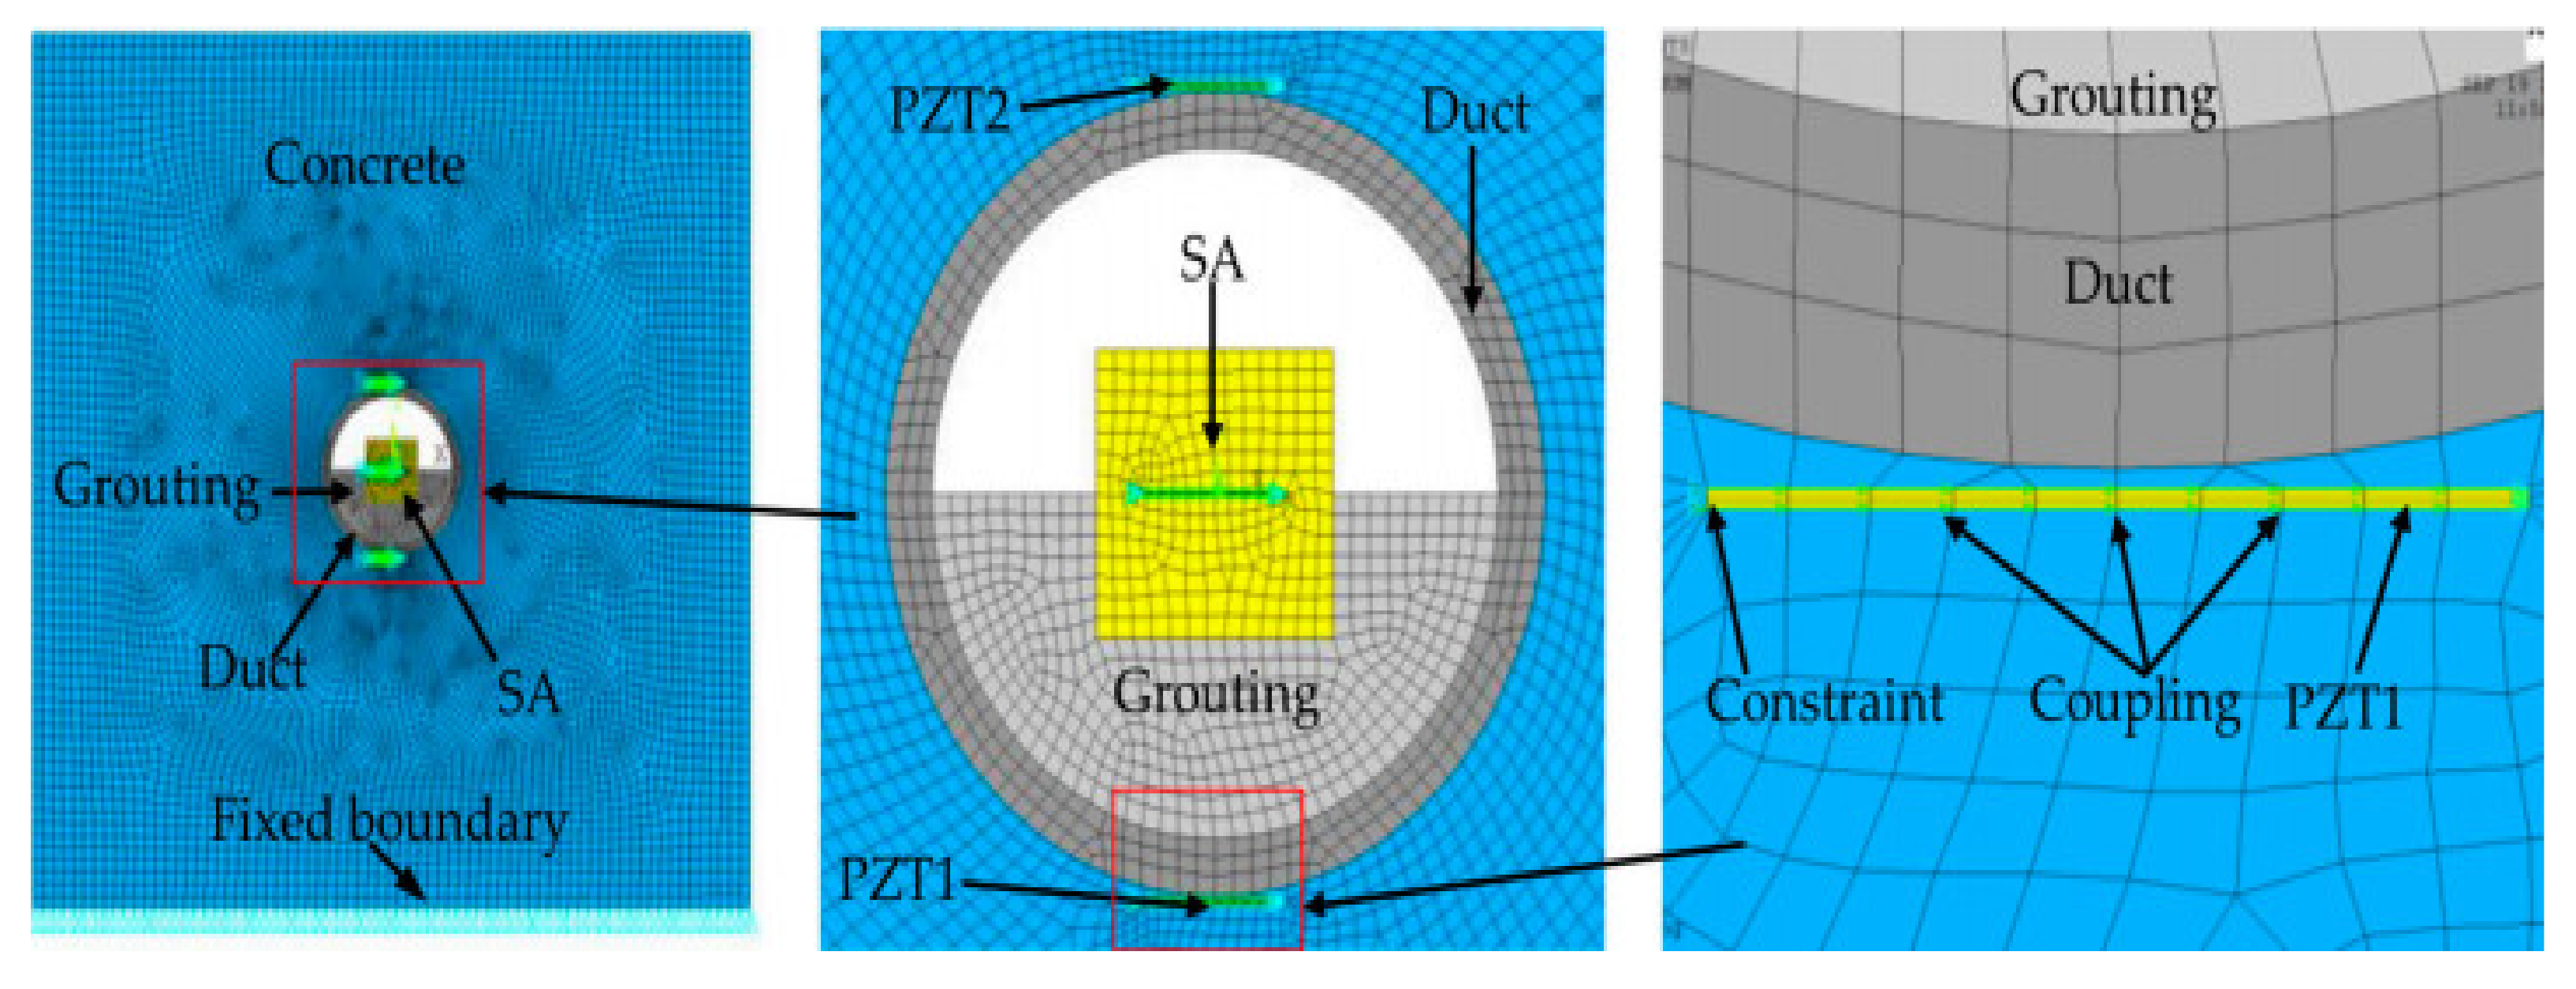
  160. Jiang, T.; Zheng, J.; Huo, L. Finite Element Analysis of Grouting Compactness Monitoring in a Post-Tensioning Tendon Duct Using Piezoceramic Transducers. Sensors 2017, 17, 2239. [Google Scholar] [CrossRef] [Green Version]
  161. Jiang, T.; Kong, Q.; Wang, W. Monitoring of Grouting Compactness in a Post-Tensioning Tendon Duct Using Piezoceramic Transducers. Sensors 2016, 16, 1343. [Google Scholar] [CrossRef] [Green Version]
  162. Xu, B.; Fan, X.; Wang, H. Experimental study on grout defects detection for grouted splice sleeve connectors using stress wavemeasurement. Constr. Build. Mater. 2021, 274, 121755. [Google Scholar] [CrossRef]
  163. Wu, C.; Yang, C.; Ma, S.; Xu, X. Feasibility Study on Grouting Compactness Detection in Sleeves Using Piezoelectric Transducers. Appl. Sci. 2019, 10, 149. [Google Scholar] [CrossRef] [Green Version]
  164. Tian, Z.; Huo, L.; Gao, W. Grouting monitoring of post-tensioning tendon duct using PZT enabled time-reversal method. Measurement 2018, 122, 513–521. [Google Scholar] [CrossRef]
  165. Zhang, X.; Zhang, L.; Liu, L. Prestress Monitoring of a Steel Strand in an Anchorage Connection Using Piezoceramic Transducers and Time Reversal Method. Sensors 2018, 18, 4018. [Google Scholar] [CrossRef] [Green Version]
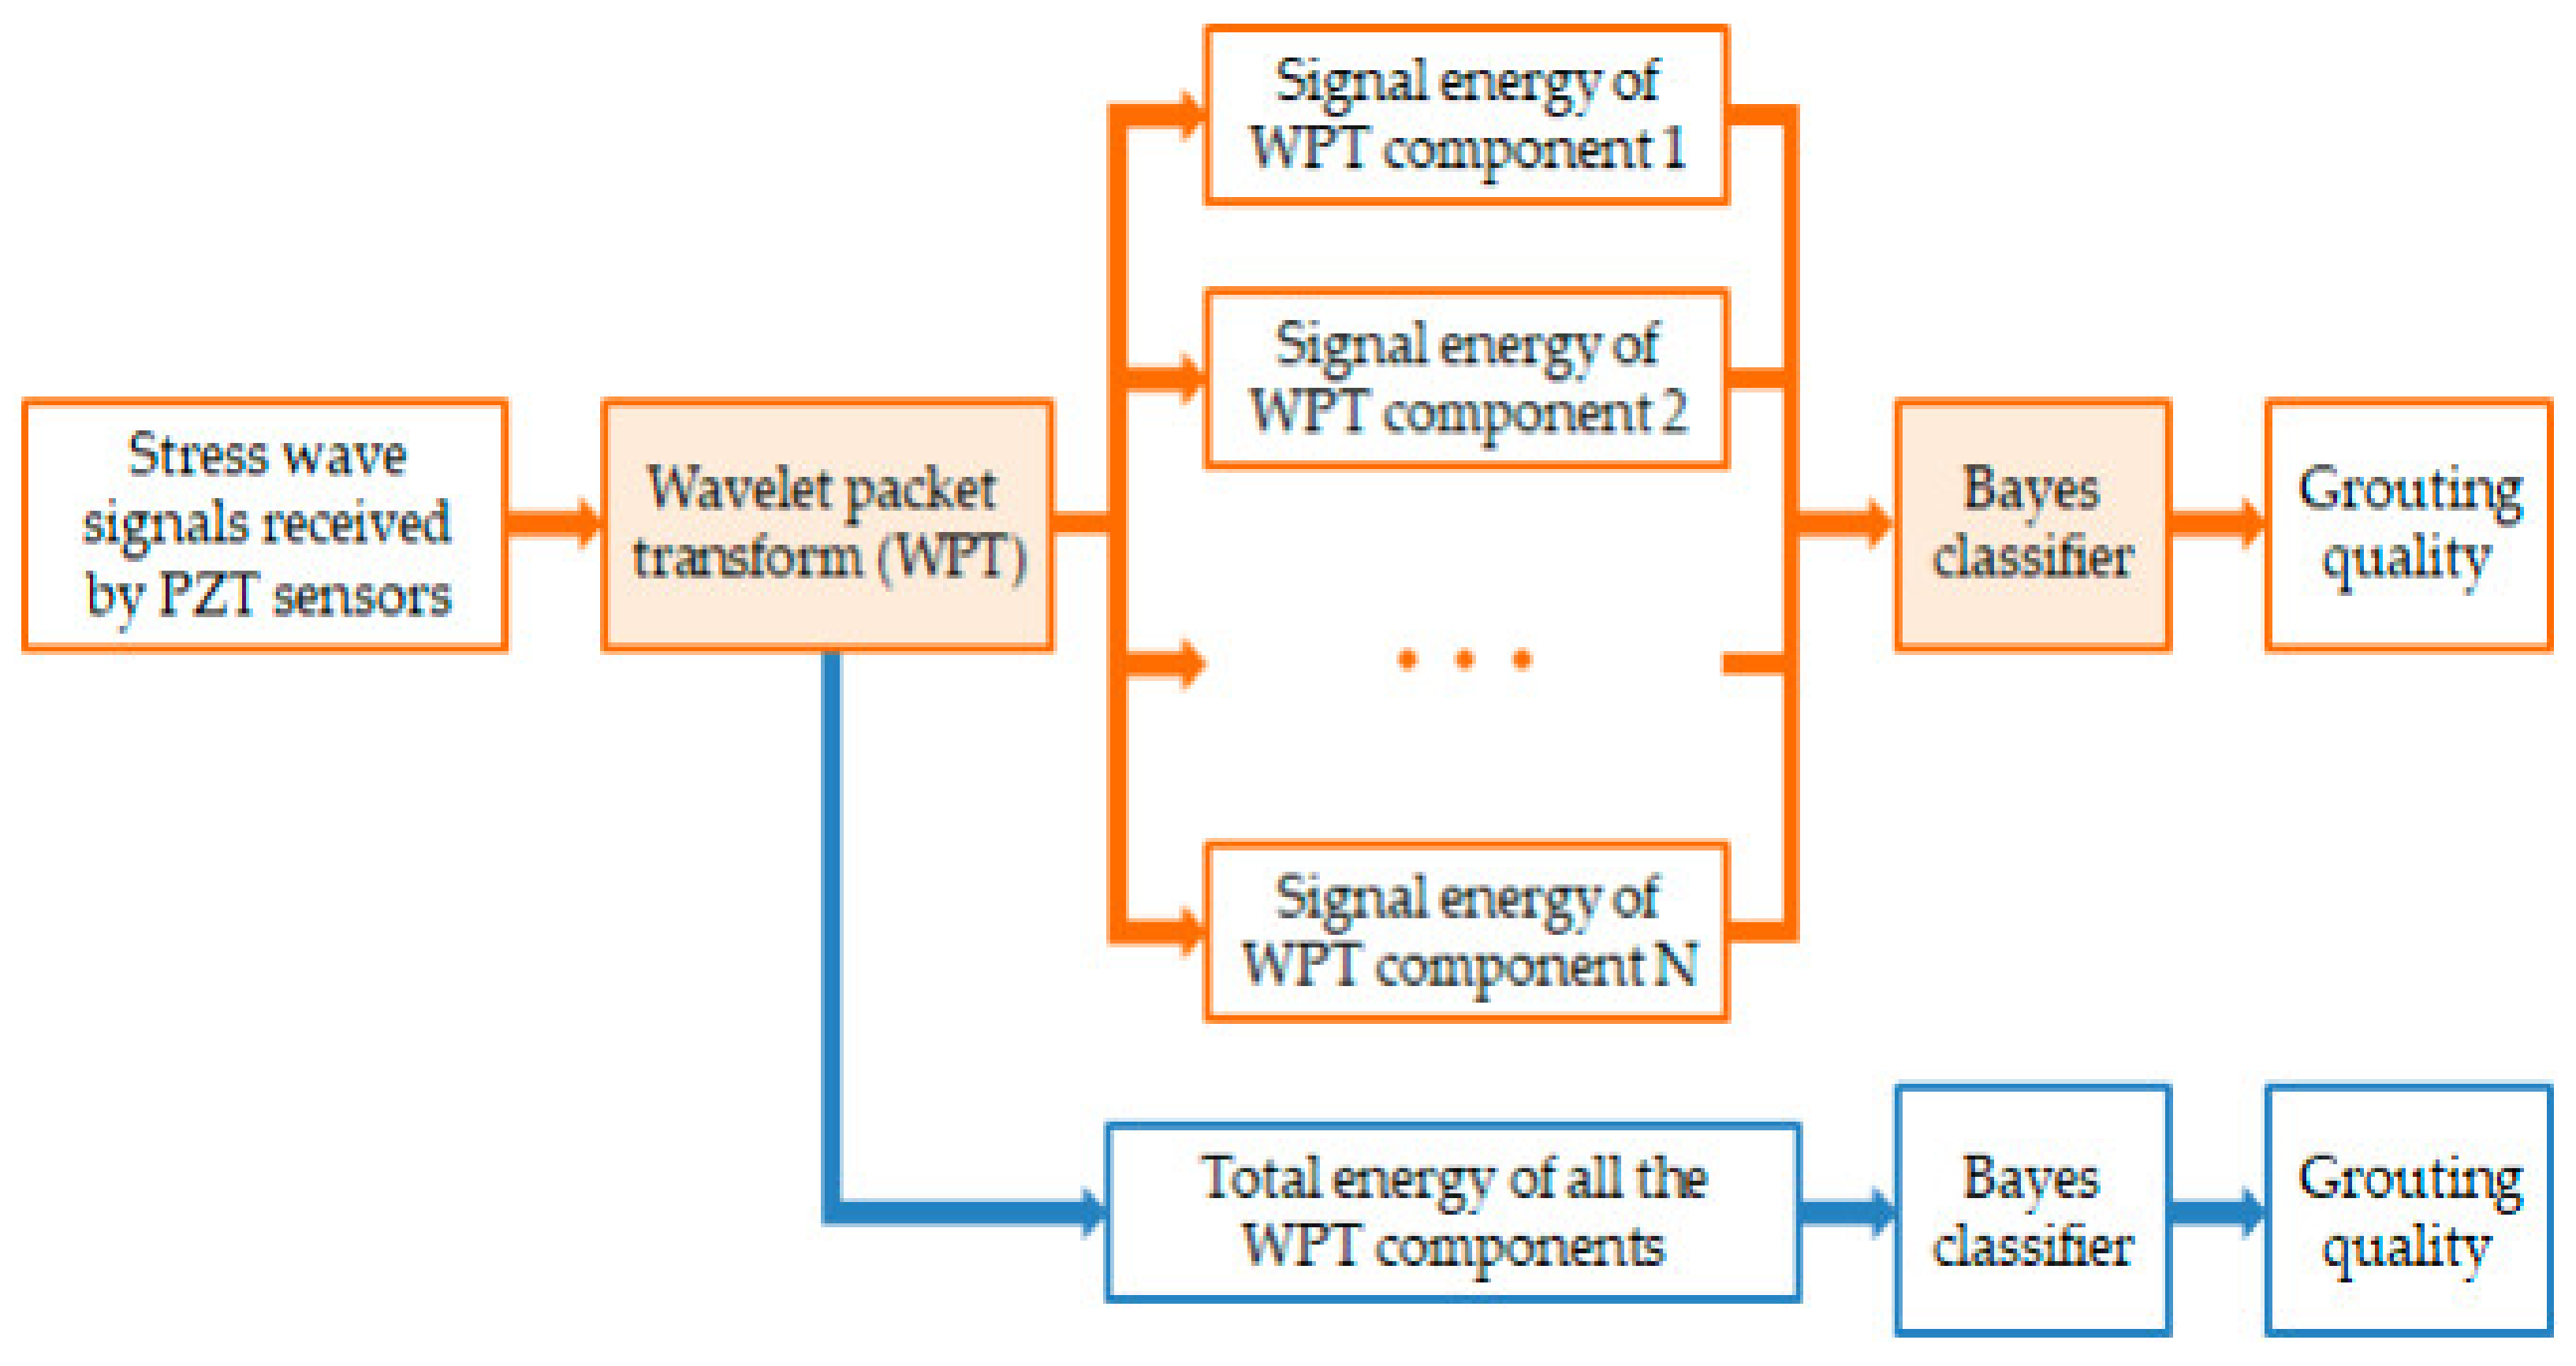
  166. Sun, X.; Li, D.; He, W. Grouting Quality Evaluation in Post-Tensioning Tendon Ducts Using Wavelet Packet Transform and Bayes Classifier. Sensors 2019, 19, 5372. [Google Scholar] [CrossRef] [Green Version]
  167. Lin, T.; Putranto, A.; Wang, Y. Smart sensor tags for seepage sensing protected by 3D-printed case for embedding in concrete structures. Constr. Build. Mater. 2021, 284, 122784. [Google Scholar] [CrossRef]
  168. Wang, W.; Zhao, K.; Zhang, P. Application of three self-developed ECT sensors for monitoring the moisture content in sand and mortar. Constr. Build. Mater. 2021, 267, 121008. [Google Scholar] [CrossRef]
  169. Park, S.E.; Eem, S.; Jeon, H. Concrete crack detection and quantification using deep learning and structured light. Constr. Build. Mater. 2020, 252, 119096. [Google Scholar] [CrossRef]
  170. Su, Y.; Han, G.; Nantung, T. Novel methodology on direct extraction of the strength information from cementitious materialsusing piezo-sensor based electromechanical impedance (EMI) method. Constr. Build. Mater. 2020, 259, 119848. [Google Scholar] [CrossRef]
  171. Barriaset, A.; Casas, J.R.; Villalba, S. Fatigue performance of distributed optical fiber sensors in reinforced concrete elements. Constr. Build. Mater. 2019, 218, 214–223. [Google Scholar] [CrossRef]
  172. Ye, C.; Butler, L.J.; Elshafie, M.Z. Evaluating prestress losses in a prestressed concrete girder railway bridge using distributed and discrete fibre optic sensors. Constr. Build. Mater. 2020, 247, 118518. [Google Scholar] [CrossRef]
  173. Cheng, Y.; Diao, S.; Hanif, A. Development and application of a novel low-cost capacitive sensor for accurate rebar position detection. Constr. Build. Mater. 2020, 257, 119506. [Google Scholar] [CrossRef]
  174. Ding, S.; Ruan, Y.; Yu, X. Self-monitoring of smart concrete column incorporating CNT/NCB composite fillers modified cementitious sensors. Constr. Build. Mater. 2019, 201, 127–137. [Google Scholar] [CrossRef]
  175. Priou, J.; Lecieux, Y.; Chevreuil, M. In situ DC electrical resistivity mapping performed in a reinforced concrete wharf using embedded sensors. Constr. Build. Mater. 2019, 211, 244–260. [Google Scholar] [CrossRef]
  176. Hongping, Z.; Shun, W.; Dansheng, W. Precise structural health diagnosis of large-scale complex structures. J. Build. Struct. 2019, 40, 215–226. [Google Scholar]
  177. Yang, L.; Xin, F. A study on the monitoring method of uniform corrosion of a stainless steel plate based on electromechanical impedance technique. J. Vib. Shock 2020, 39, 9–16. [Google Scholar]
  178. Wu, C.; Fan, S.W.; Ma, S. Working mechanism of tubular PZT sensor and its application in damage monitoring of SRC column with unsymmetrical crossshaped steel section. J. Build. Struct. 2021, 0501. [Google Scholar] [CrossRef]
  179. Liu, Y.; Wang, Y.J. Flexible Piezoelectric Materials and Device Application. J. Chin. Ceram. Soc. 2022, 50, 625–641. [Google Scholar]
  180. Zhou, Y.; Zheng, Y.; Pan, J. Experimental investigations on corrosion resistance of innovative steel-FRP composite bars using X-ray microcomputed tomography. Compos. Part. B Eng. 2019, 161, 272–284. [Google Scholar] [CrossRef]
  181. Chen, J.; Wu, Y.; Yang, C. Damage assessment of concrete using a non-contact nonlinear wave modulation technique. NDT E Int. 2019, 106, 1–9. [Google Scholar] [CrossRef]
  182. Suzuki, T.; Ogata, H.; Takada, R. Use of acoustic emission and X-ray computed tomography for damage evaluation of freeze-thawed concrete. Constr. Build. Mater. 2010, 24, 2347–2352. [Google Scholar] [CrossRef]
  183. Sidiq, A.; Gravina, R.J.; Setunge, S. High-efficiency techniques and micro-structural parameters to evaluate concrete self-healing using X-ray tomography and Mercury Intrusion Porosimetry: A review. Constr. Build. Mater. 2020, 252, 119030. [Google Scholar] [CrossRef]
  184. Zhu, L.; Dang, F.; Xue, Y. Comparative study on the meso-scale damage evolution of concrete under static and dynamic tensileloading using X-ray computed tomography and digital image analysis. Constr. Build. Mater. 2020, 250, 118848. [Google Scholar] [CrossRef]
  185. Michel, A.; Pease, B.J.; Geiker, M.R. Monitoring reinforcement corrosion and corrosion-induced cracking using non-destructive X-ray attenuation measurements. Cem. Concr. Res. 2011, 41, 1085–1094. [Google Scholar] [CrossRef]
  186. Peng, P.; Wang, C. Use of gamma rays in the inspection of steel wire ropes in suspension bridges. NDT E Int. 2015, 75, 80–86. [Google Scholar] [CrossRef]
  187. Freij, H.; Dukeman, D.; Alexander, C.L. Comparison of novel imaging sensor and gamma ray tomography imaging of grout deficiencies in external post-tensioned structural tendons. NDT E Int. 2021, 117, 102368. [Google Scholar] [CrossRef]
  188. Ibrahim, M.E. Nondestructive evaluation of thick-section composites and sandwich structures: A review. Compos. Part A Appl. Sci. Manuf. 2014, 64, 36–48. [Google Scholar] [CrossRef]
  189. Ye, L.; Zhisheng, W.; Yanfeng, L. Review of Defects Extraction and Recognition Methods for Welding Joints Based on X-ray lmage. Hot Work. Technol. 2018, 47, 6–10. [Google Scholar]
  190. DU, D.; Runshi, H.; Zhiling, G. Automatic inspection of weld defects using X-ray image sequences. J. Tsinghua Univ. Sci. Technol. 2007, 8, 1278–1281. [Google Scholar]
  191. Huan, S.; Xiaoli, L.; Enzhi, W. X-ray Radiography for Visualization of Fissure Fluid Flows during Rock Failures. J. Tsinghua Univ. Sci. Technol. 2021, 61, 778–791. [Google Scholar]
  192. Feng, H.; Yang, W.; Junxiong, F. A review of nondestructive testing techniques based on radiation. China Met. Bull. 2021, 7, 201–202. [Google Scholar]
  193. Mikulić, D.; Pauše, Ž.; Ukrainčik, V. Determination of concrete quality in a structure by combination of destructive and non-destructive methods. Mater. Struct. 1992, 25, 65–69. [Google Scholar] [CrossRef]
Figure 1. Principle of acoustic emission [44].
Buildings 12 00843 g001
Figure 2. A typical AE signal [44].
Buildings 12 00843 g002
Figure 3. Acoustic emission system [62].
Buildings 12 00843 g003
Figure 4. Diagrammatic sketch of IE method [25]. (The interior of A is empty pipe, the interior of B is half-empty and half-grouting, the interior of C is full grouting and the interior of D is dense concrete slab).
Buildings 12 00843 g004
Figure 5. (A) Slab containing delamination and void defects. (a) Plan view; (b) Cross Section A-A; (B) Two-dimensional contour images of Slab built up using air-coupled impact-echo data. The solid lines indicate the location of defects [75].
Buildings 12 00843 g005
Figure 6. Empty estimation model.
Buildings 12 00843 g006
Figure 7. Theoretical Model.
Buildings 12 00843 g007
Figure 8. (a) View of prototypes for the Mira equipment (2nd generation), (b) View of the Eyecon system [99].
Buildings 12 00843 g008
Figure 9. Schematic representation of the digitally-focused array signal capturing scheme [99].
Buildings 12 00843 g009
Figure 10. Reflection observation of the active IR in the EB technique [106].
Buildings 12 00843 g010
Figure 11. Proposed IRT methodology [120].
Buildings 12 00843 g011
Figure 12. Methods to manufacture artificial delamination [121].
Buildings 12 00843 g012
Figure 13. Setup of the experiment [121].
Buildings 12 00843 g013
Figure 14. Generic pipeline for processing a group of GPR data [143].
Buildings 12 00843 g014
Figure 15. Geometry for cylinder detection using ground-coupled common-offset GPR antennas. The cylinder size is exaggerated for clarity [147].
Buildings 12 00843 g015
Figure 16. Illustration of a sample (a) optical fiber sensor, (b) fiber Bragg grating sensor, (c) piezoelectric sensor, (d) electrochemical sensor, (e) wireless sensor system, and (f) self-sensing concrete [156].
Buildings 12 00843 g016
Figure 17. The electromechanical impedance method (EMI) is applied to structural health monitoring and corrosion nondestructive diagnosis [157].
Buildings 12 00843 g017
Figure 18. The mesh details of the finite element model. The blue is concrete, the light gray is grouting, the gray is duct, the yellow is PZT and SA, the green is coupling, and the sky blue is constraint [160].
Buildings 12 00843 g018
Figure 19. Overview of the proposed grouting quality evaluation method [166].
Buildings 12 00843 g019
Figure 20. Concrete CT test: (a) Test process; (b) Test system [184].
Buildings 12 00843 g020
Figure 21. Schematic of X-ray μCT [180].
Buildings 12 00843 g021
Table 1. Advantages and limitations of various NDT methods.
NDT MethodsDetection PrincipleTechnology ApplicationAdvantagesLimitations
Acoustic Emission (AE)The material performance or structural integrity is evaluated by receiving and analyzing the acoustic emission signal of the material.
(1)
Delamination [57]
(2)
Void [57]
(3)
Concrete crack [57,63,70]
(4)
Corrosion of reinforced concrete [65,66,67]
(5)
Density of sleeve grouting connection of prefabricated structure [62]
(6)
Real-time damage detection [61]
(7)
Global monitoring [61]
(1)
Simple operation
(2)
High sensitivity
(3)
Real-time dynamic detection
(4)
Well-adapted
(5)
Integral evaluation
(1)
Vulnerable to electromechanical noise
(2)
Sensitive to materials
(3)
Appropriate loader
(4)
Irreversibility
Impact echo (IE) A short-time mechanical impact is used to propagate the generated stress wave to the interior of the structure.
(1)
Structural thickness detection [73,76]
(2)
Stripping of structural cladding [78,79]
(3)
Defect location [76]
(4)
Grouting compactness test [83,89]
(5)
Detection of concrete defects [76]
(6)
Cavity detection [90]
(7)
Compressive strength of concrete
(1)
Single test surface
(2)
Less signal attenuation
(3)
Less clutter
(4)
Convenient operation
(5)
Uncoupling requirement
(1)
Low detection efficiency
(2)
Slow judgment
(3)
Low precision
Ultrasonic Testing (UT) Ultrasonic wave will be reflected at the interface of two media with different acoustic impedance.
(1)
Bond quality between steel and concrete [96]
(2)
Delamination of concrete slab [77,100]
(3)
Void inclusion [11]
(4)
Structural thickness [97]
(5)
Grouting quality [98]
(6)
Micro and macro-scale defects or damages to concrete [101]
(7)
Compressive strength of concrete [10]
(1)
Large propagation energy
(2)
Good directivity
(3)
Easy to locate defects
(4)
Suitable for large thickness
(5)
High detection sensitivity
(6)
Short cycle and low cost
(1)
Susceptible to the size of defect
(2)
Poor adaptability
(3)
Strict requirements for structure surface
Infrared Thermography (IRT) IRT uses photoelectric technology to detect the infrared-specific band signal of object thermal radiation and convert the signal into images and graphics that can be distinguished by vision.
(1)
Concrete cover [114]
(2)
Concrete crack [111]
(3)
Void [121]
(4)
Concrete deck layering [120,122]
(5)
Corrosion of reinforcement [124]
(6)
Internal defects of carbon fiber reinforced steel structure [84]
(1)
Result visualization
(2)
Easy to judge
(3)
Test different materials
(1)
Limited measurement depth
(2)
Strict requirements for testing time and process
(3)
Time-consuming
Ground Penetrating Radar (GPR)The transmitting antenna transmits electromagnetic waves to the structure, and the receiving antenna processes and analyzes the radar echo signal to obtain the characteristics of the target.
(1)
Thickness of structural layer [141]
(2)
Deck layering [139]
(3)
Void [133]
(4)
Estimating concrete properties [131]
(5)
Corrosion of reinforced concrete bridge deck [118]
(6)
Buried depth of reinforcement [107]
(7)
Identify buried objects [166]
(1)
Fast measurement speed
(2)
Continuous detection process
(3)
High resolution
(4)
Easy Operation
(5)
Low detection cost
(1)
Susceptible to metals
(2)
Incomplete target feature extraction
(3)
False alarm or missing alarm
Piezoelectric Transducers (PZT) Based on the piezoelectric effect of dielectric, the charge is generated on the surface of dielectric under the action of external force so as to realize non-electric measurement.
(1)
Corrosion of reinforced concrete beams [157,158]
(2)
Compactness of pipeline grouting [159,161]
(3)
Concrete crack leakage [167]
(4)
Strength of cementitious material [170]
(5)
Fatigue behavior of reinforced concrete members [171]
(6)
Prestress loss of prestressed bridge [172]
(1)
Easy to process
(2)
Low cost
(3)
Wide frequency response range
(4)
Fast response
(5)
Simple preparation process
(1)
Moisture-proof treatment is required
(2)
Small output DC response
X-rayDue to the different absorption coefficients of materials with different densities to rays, the intensity of rays irradiated to all parts of the film will also be different.
(1)
Crack [183]
(2)
Grouting void [187]
(3)
Damage to freeze–thaw concrete [66,182]
(4)
Concrete self-healing [183]
(5)
Corrosion of reinforced concrete [185]
(6)
Real-time damage of composites [15]
(1)
High flaw detection sensitivity
(2)
Short cycle and low cost
(3)
Flexible, convenient, and efficient
(4)
Wide use area
(5)
Intuitive result
(1)
High cost
(2)
Harmful to health
(3)
Slow detection speed
Table 2. Common testing methods for different defects.
Defect TypesDetection Methods
DelaminationAE, UT, GPR
VoidIE, UT, GPR
CrackAE, PZT, IRT, X-ray
Corrosion of reinforced concreteAE, IRT, GPR, P ZT, X-ray
Density of sleeve groutingAE
Real-time damage detectionAE
Structural layer thicknessIE, UT, GPR
Grouting compactness of prestressed ductIE, PZT, AE, UT, IRT
Buried depth of reinforcementGPR
Compressive strength of concreteIE, UT, PZT
Bond quality between reinforcement and concreteUT
Fatigue behavior of reinforced concrete membersPZT
Prestress lossPZT
Publisher’s Note: MDPI stays neutral with regard to jurisdictional claims in published maps and institutional affiliations.

