Article

Sustainability Assessment through Urban Accessibility Indicators and GIS in a Middle-Sized World Heritage City: The Case of Cáceres, Spain

by
Montaña Jiménez-Espada
1,*,
Aurora Cuartero
2 and
Maguelone Le Breton
3
1
Department of Construction, School of Technology, Research Institute for Sustainable Territorial Development (INTERRA), Universidad de Extremadura, Avda de la Universidad s/n, 10003 Cáceres, Spain
2
Department of Graphic Expression, School of Technology, Universidad de Extremadura, 10003 Cáceres, Spain
3
Université de Tours, 1 bis Avenue du Général Leclerc, 30000 Nîmes, France
*
Author to whom correspondence should be addressed.
Buildings 2022, 12(6), 813; https://doi.org/10.3390/buildings12060813
Submission received: 1 May 2022 / Accepted: 8 June 2022 / Published: 13 June 2022
(This article belongs to the Collection Cities and Infrastructure)

Abstract

:
The main objective of the research consists of quantifying the degree of sustainability of the city of Cáceres in terms of the inhabitant’s accessibility to public services through the use of GIS tools and urban indicators, taking into account two areas of study: The Historic Centre (PCH) and the city as a whole. The methodology applied is based on the criteria proposed by the Spanish Government derived from the Spanish Strategy for Urban and Local Sustainability (EESUL), which suggests suitable indicators for analysing urban environments. The degree of sustainability of the study areas, applied to the field of mobility and accessibility to public services, is evaluated through numerical calculations complementing the study with accessibility maps obtained using Geographic Information Systems (GIS) tools. The results show that the city of Cáceres is sustainable in terms of accessibility to bus stops, organic waste containers, household waste recycling centre, schools and education, health centres, and public administration. However, bike parking coverage and lanes, clothes and oil collection, and sports centres need to be further enhanced. In conclusion, there is little disparity in the results between the PCH and the city as a whole, not influenced by the fact that one of the areas is a consolidated historic area. This research has allowed some gaps in the topic to be addressed. However, the main limitation of this methodology consists in the need to have a considerable amount of initial starting data to be able to carry out the research. Finally, the sustainability analysis using urban indicators is considered a valuable source of information for the local manager, becoming a real planning tool in medium-sized cities.

1. Introduction

Achieving urban sustainability is the ultimate destination of urban development. Since the Brundtland Report in 1987 [1], the importance of cities achieving sustainability has been recognised. First studies on ‘urban sustainability assessment’ were published in the early 1990s. Since then, the field has grown rapidly, with over 300 papers published annually in recent years. A bibliometric analysis of all 3877 articles covering about thirty years of research on urban sustainability assessment was presented by Sharifi [2]. The Sustainable Development Goals (SGDs) of the United Nations’ 2030 Agenda for Sustainable Development, which entails, among other things, making cities more inclusive, safe, resilient, and sustainable [3], as is confirmed by the European Commission [4] and the publication of the New Urban Agenda [5]. There are many studies on sustainability in large cities, such as Shen [6], where the purposes, goals, and boundaries in the sustainable urban development plans in these nine cases are defined: Melbourne, Hong Kong, Iskandar, Barcelona, Mexico City, Taipei, Singapore, and Pune. This study not only reveals how different indicators were selected but also suggests the need for consistent processes of choosing indicators based on the benchmarks obtained from best practices. Bell [7] shows a lot of literature and their opinion on sustainability, but this is now tempered with experience and reflection. ‘This document makes a good contribution to the theory and practice of using indicators for sustainability and presents ideas for systems, tools, and techniques that have the potential to broaden and deepen complex situations.
An example of sustainability around urban mobility in medium-sized cities is shown by Diaz et al. [8]. This work shows the design of a system of indicators created to evaluate daily mobility patterns and the transport system in cities in terms of sustainability. The system derives from what was considered the attributes of a sustainable mobility model and is structured around three components: observed mobility, public transport, and urban planning. The indicators were designed at an intra-urban scale and applied to spatial units for the medium-sized city of Alcalá de Henares, near Madrid. In Dall’o [9], a methodology is developed to evaluate intelligence through indicators that apply to small and medium-sized cities. The choice of indicators is consistent with the ISO 37120 standard and is inspired by the environmental indicators used in the EU Sustainable Energy Action Plan. The methodology is applied to 3 municipalities in northern Italy (Carugate, Melzo, and Pioltello), whose results are analysed and commented on.
Regardless of the size of the cities, sustainability must also be analysed in cities with high historical value, which are considered World Heritage Sites. In 1998, ICOMOS promoted a study to define a system of indicators to assess the state of conservation of World Heritage Cities (WHC). The conclusions of this study, collected in the Act of Colonia de Sacramento [10] under the sponsorship of UNESCO, propose a list of factors that influence the conservation of historic centres and recommend to all WHC member states to identify suitable indicators for evaluation. The Act of Colonia de Sacramento proposal focuses on environments declared World Heritage Sites and is oriented towards monitoring their state of conservation according to the parameters of the WHC.
In Hugony [11], a system of specific indicators is proposed to evaluate the historic city in Spain, based on a critical analysis of the Colonia de Sacramento for UNESCO. A system of indicators for the evaluation of historic centres can be a very useful tool to guarantee the transparency of information in the definition of urban objectives and the monitoring of the execution of plans and projects. A framework of indicators proposed by Leus [12] allows measuring the classic dimensions of sustainable development in combination with the sustainability of heritage values and the political dimension. This framework, a multimodal system mapping holistic sustainability, can be used to further argue for the broader social relevance of heritage care.
Cultural heritage turned out to be a key aspect when considering urban sustainability. It must be considered in developing evaluation tools, particularly indicators. This is one of the main conclusions obtained in Del Espino [13], where an evaluation based on indicators is presented in seven medium-sized cities of inland Andalusia. Increasing momentum in sustainability and urbanisation challenges, smart cities with data-driven urbanism approaches are adopting more advanced forms of TIC to enhance sustainable development and urban growth demands. A large literature review on the sustainability of smarter and smarter cities in the age of big data is developed in Bibri [14].
Geographic Information System (GIS) can be an important tool to help people make plans to achieve successful management strategies that are sustainable both at the local and global levels. From a rigorous point of view, a GIS is a computer tool capable of manipulating, joining, storing and visualizing information that is geographically referenced [15]. A GIS allows organizing information from different data sources with the aim of mapping and analyzing changes on Earth [16]. A good GIS approach can process geographic data from various sources and integrate it into a map project [17]. Recent research implements GIS-based approaches to analyse the characteristics of urban green spaces in sustainable urban planning ([18,19]). For example, Cardone [20] focuses on the relationship problem by analysing the characteristics of urban green areas using a GIS framework based on fuzzy rules to partition an urban system based on the characteristics of urban vegetation concerning the urban context. Accessibility is also an indicator of equity to measure the ease with which a specific location achieves the desired results traditionally analysed with econometric and engineering techniques. Visual quality indicators are addressed and reported in this study because they may represent additional indicators for sustainable planning [21,22,23]. In Martínez [24], spatial accessibility location and network efficiency indicators were calculated using network analysis in GIS. Increasing momentum in sustainability and urbanisation challenges, smart cities with data-driven urbanism approaches are adopting more advanced forms of TIC to enhance sustainable development and urban growth demands.
When a city has enough data sources to be analysed (Spatial Data Infrastructure, Open data, big data, etc.), GIS will allow, in addition to its storage and visualisation, to develop sustainability studies that allow for improving urban development with more quality. Therefore, we believe that a smart city is closely related to being sustainable and vice versa.
Present work aims to carry out a sustainability analysis in a world heritage city such as the city of Cáceres, in Spain, through urban indicators and Geographic Information Systems (GIS). In this work, a methodology is proposed that combines the calculation of indicators and GIS techniques that also generate the Indicator Maps of sustainability. On the other hand, in the present study, the sustainability analysis has been carried out comparing two areas of the same city: the historic centre and the entire city. In this way, the variability of the indicators in both parts can be assessed to establish a comparison between historical (consolidated) and new urban structures. It is considered that it would be of great interest to extrapolate these results to other historical cities that present similar characteristics. In summary, it can be indicated that the main objective of the research is to analyse the degree of sustainability of the city of Cáceres in terms of accessibility to public services by the population through the use of GIS tools and urban indicators.
In Section 2, we present the case study as well as the material used and in Section 3 provides a detailed description of the processes carried out and the sustainability indicators calculated. In Section 4, the results obtained are shown. Final considerations are presented in Section 5.

2. Study Area and Materials
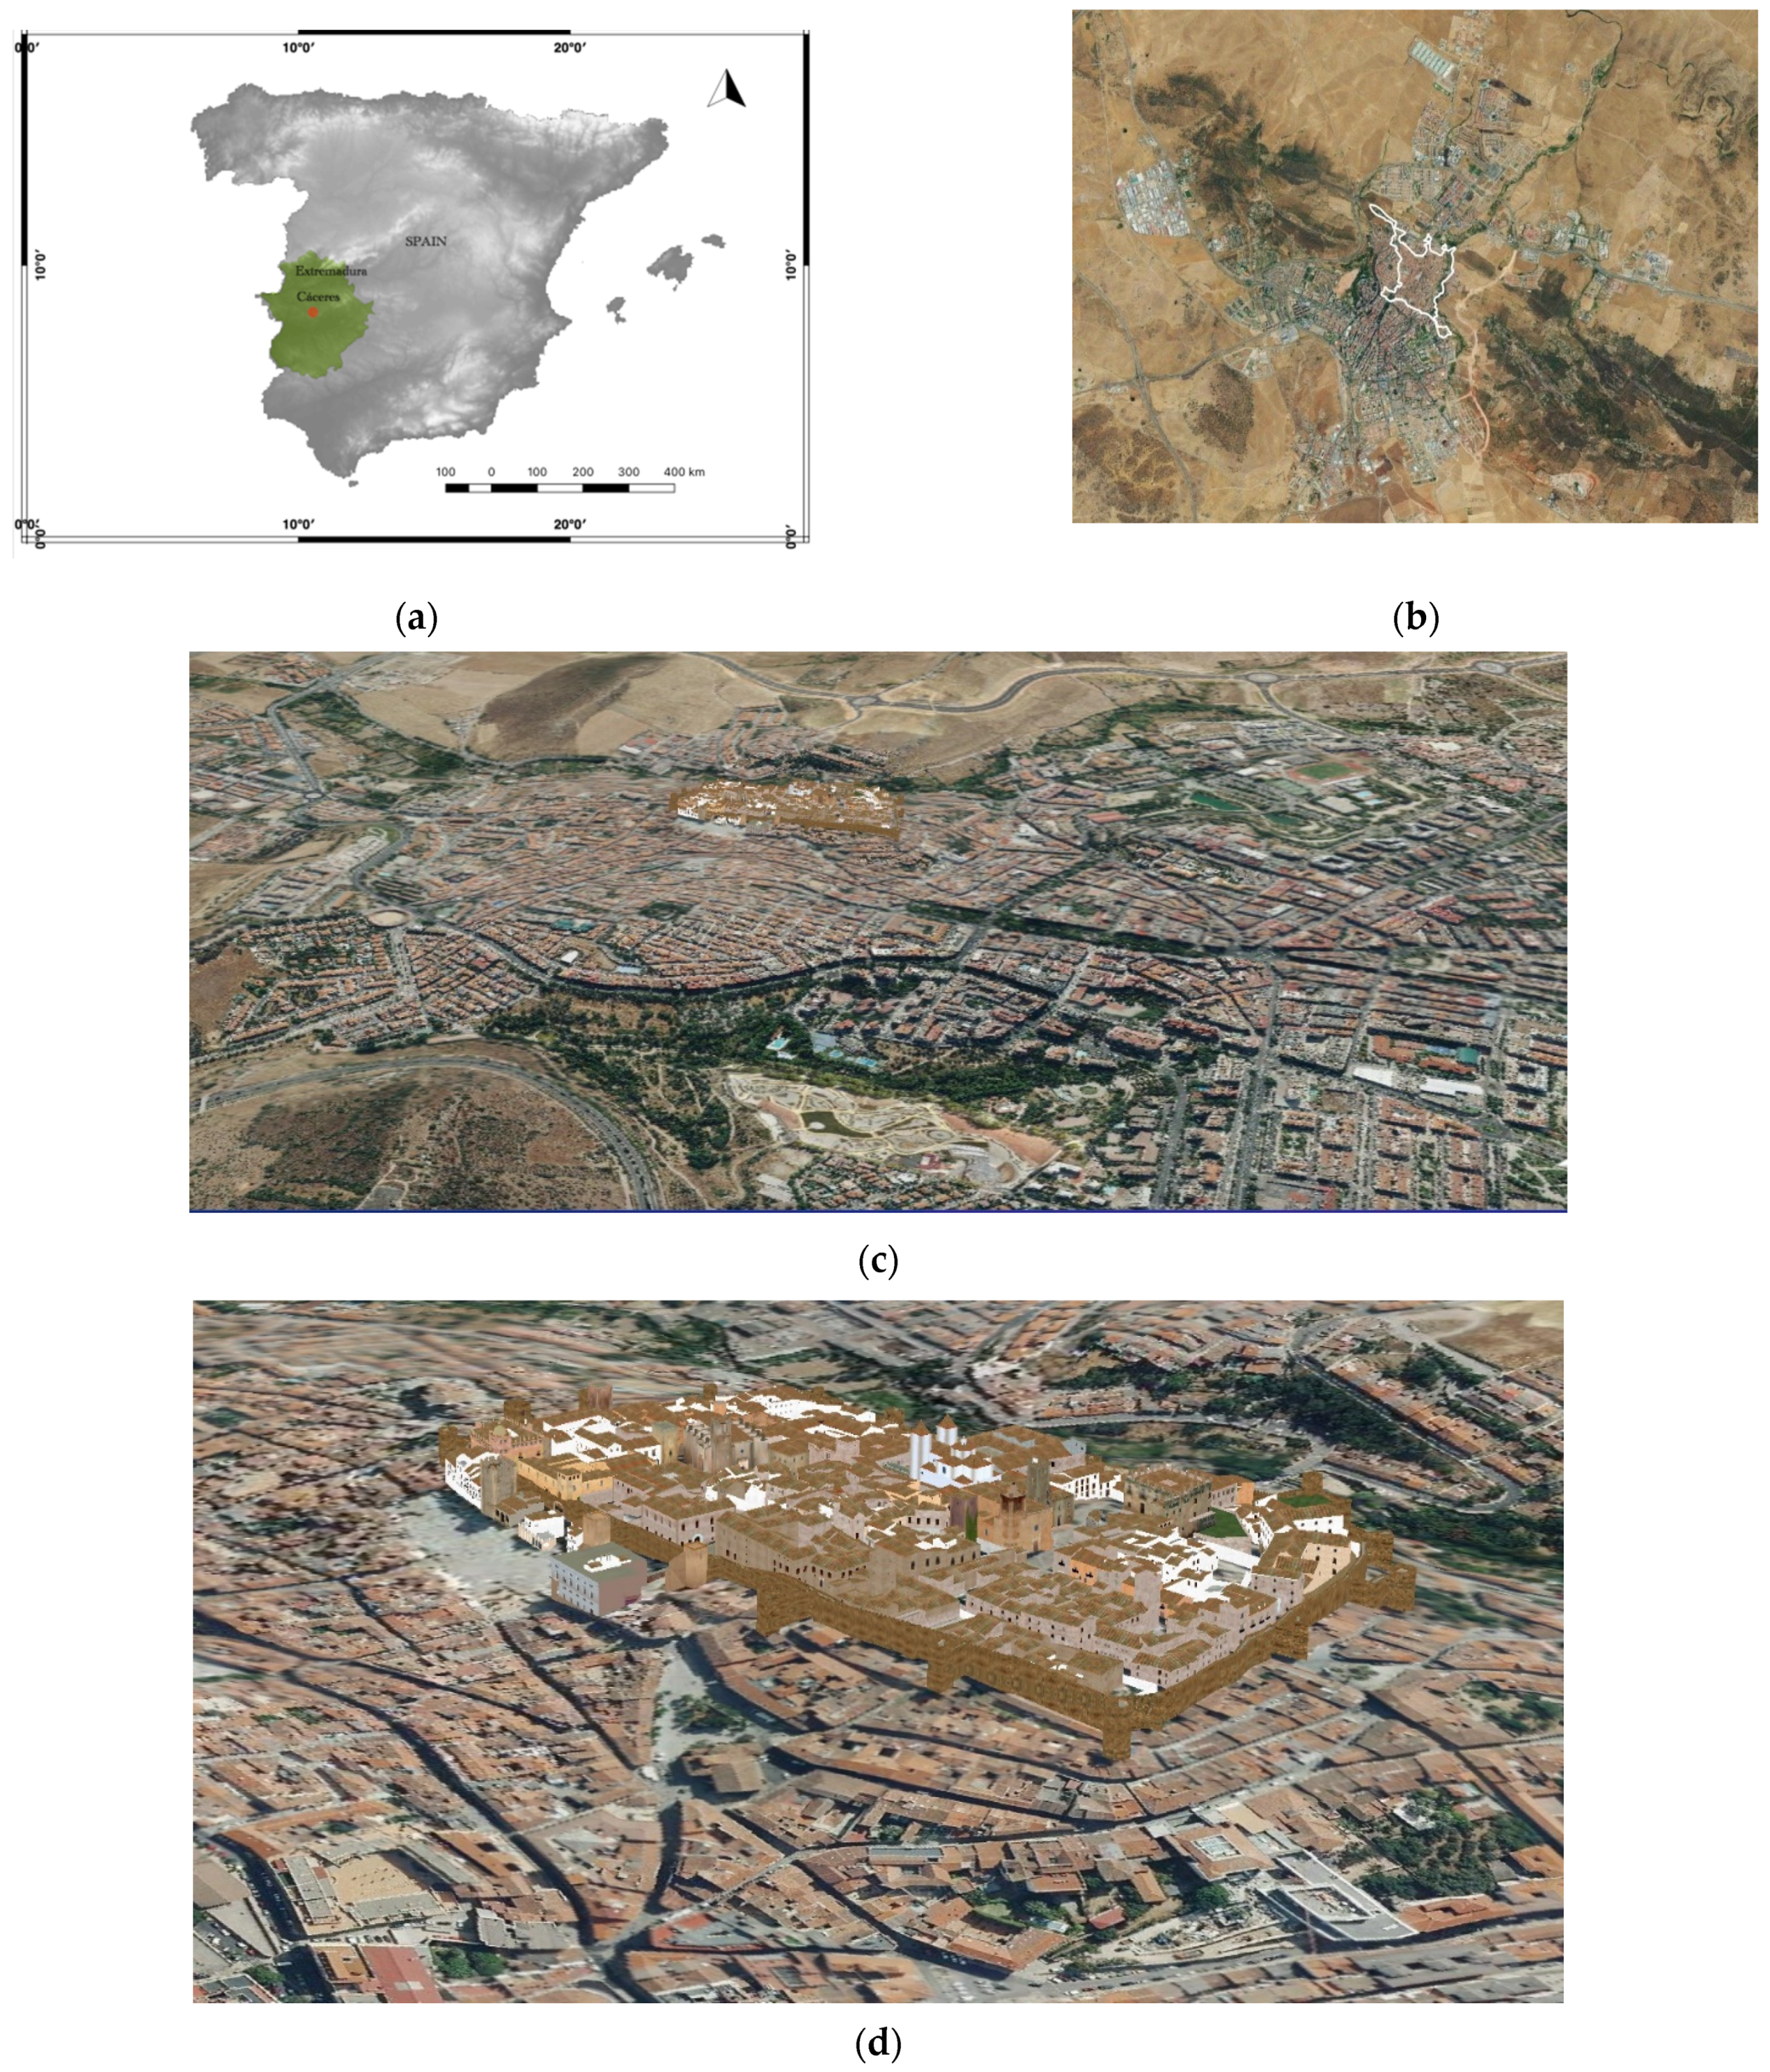
2.1. Study Area

In this work, the study area is the municipality of Cáceres (Spain), a medium-sized city located in the centre of the autonomous community of Extremadura. Figure 1a,b depicts the general geographic location and specifically the area that covers the historic centre of Cáceres. This study will analyse two areas: (1) the entire city of Cáceres and (2) the old part corresponding to “Plan Cáceres Histórica” (PCH), marked with a white line in Figure 1b. Figure 1c shows a 3D view of the historic centre of the studied city.
The Monumental City of Cáceres preserves a unique historical-artistic complex, and for this reason, in 1986, it was recognised by UNESCO as a World Heritage City. Currently, its population is more than 94,000 inhabitants. Cáceres is the city in the study area because it meets two requirements: (1) It is a heritage city, and (2) it has a sufficient database to address the object of analysis. Also, we note that Cáceres holds the best preserved monumental site in Spain and the third one in Europe. The Old Town of Cáceres is an urban ensemble of 9 ha surrounded by a wall of 1174 m, exceptional testimony to the fortifications built in Spain by the Almohades. The urban morphology inside the wall has shaped its current appearance over the centuries, being a clear example of a medieval city. [26]. This Extremaduran heritage jewel turns out to be unique due to its historical features, which present traces of multiple and contradictory influences. The historic complex is characterized by the presence of fortress-houses, palace-houses and towers that currently surprise tourists for their high level of conservation and material integrity.As a field of study, it has been considered of particular interest to compare the area included in the PCH and the whole urban built environment, as shown in Figure 1b.

2.2. Material

The spatial data used in this work has been an orthoimage made available by the Aerial Orthography National Plan of Spain (PNOA). The orthoimages of PNOA are georeferenced images with different resolutions, but those used in this study have a resolution of 25 cm and a planimetric accuracy of ±50 cm. PNOA orthoimages can be downloaded from the National Centre for Geographic Information (CNIG) of the National Geographic Institute (IGN) of Spain. To develop the sustainability analysis, in addition to the basic cartographic information, the orthoimages and other parameters have been used, such as the number of inhabitants, bus stops, pedestrian streets network, shared-lane streets network, bus stops, bike lanes, etc.
All this information has been obtained from the two main databases available in the city: IDE Cáceres and Open Data Cáceres. Technical information for these sources is summarised in Table 1.
The information needed to develop the study was obtained from the updated data made available on the websites of the official agencies concerned. In addition, all the city’s green spaces have been digitalised, given that this information was not available and was necessary to analyse the indicators of accessibility to green areas.

3. Methods

To conduct this research, we have adopted the criteria planned by the Spanish Government, which are clearly defined on the website of the Ministry of Transport, Mobility and Urban Agenda (MITMA) and reflected in the document entitled “System of Indicators and Conditions for large and middle-sized cities” [27]. In this document, a system of urban sustainability indicators is defined and divided into seven groups or areas of work: 1. Land occupation, 2. Public space and habitability, 3. Mobility and Services, 4. Urban complexity, 5. Green areas and Biodiversity, 6. Urban metabolism, 7. Social cohesion.
A sustainability indicator is an index that makes it possible to assess the degree of sustainable performance of a city. It is a tool that enables and supports local governments and the population’s knowledge of their city. The analysis through urban indicators examines the design and allows for the evaluation of public policies aimed at facilitating decision-making in multiple areas related to territorial progress and development to achieve a greater degree of territorial, economic and social cohesion and environmental protection [28]. In Macedo [29], was considered the sustainable dimensions based on a literature review, including specific indicators for urban mobility with a new proposal of an indicators system for urban sustainability assessment. Moreover, Stylianidis [30] analyzed the feasibility of using GIS tools in the calculation of urban sustainability indicators applied to territorial planning from a broad perspective, covering transversal aspects such as social and economic policies, health and education, transport, trade, etc.
This article analyses different indicators that provide an overview of the level of sustainability of the city of Cáceres, focusing specifically on aspects related to mobility and public services using GIS tools. The variables selected for the research belong to different fields of work, as shown in Table 2.
Following this, we define the six indexes under study, including for each the (a) motivation and significance of the indicator, (b) numerical formula calculation, (c) range of values (minimum and ideal) for the sustainability analysis of each indicator analysed, and finally (d) the methodology for generating the maps using GIS tools.
Table 3 summarises and presents some references according to a type of indicator, and more specifically, those that have been analysed in this work.
In addition to the reviewed references, we can also find literature that focuses on using GIS for sustainability assessments in several contexts, as in the following articles related to resilience in historic urban areas [59], spatial accessibility [60], walkability indicators [61] and sustainable urban growth [62].
Next, a synthetic flowchart is shown in Figure 2 that aims to simply explain the methodological process carried out.
As shown in Figure 2, each of the steps followed to address the research developed in the article is provided.

3.1. Urban Accessibility towards Non-Car-Based Mobility Systems

The population’s access to public transport systems is a key element in promoting efficient, sustainable, and equitable mobility. These systems become a true means of transport if they have their interconnected network throughout the territory and are also segregated from other modes of surface mobility. In terms of public health, it is clear that using private vehicles for everyday journeys seriously damages air quality, generating pollutant gas emissions that are harmful to citizens. It is therefore important that cities develop strategies to reduce car use over short distances.
The indicator, Pnetworks, which is shown in Equation (1), makes it possible to identify urban morphology from a spatial point of view to analyse the presence and proximity of alternative modes of travel to the private vehicle to encourage their use in the daily journeys made by users.
Taking into account the consideration of urban bus stops, the cycling mobility network, and pedestrian streets as alternative modes of transport to the car, the following formula will be used to develop the calculation procedure:
Pnetworks (%) = [Population with simultaneous coverage to two alternative transport networks/total population]
As indicated in Equation (1) above, to estimate the indicator, the percentage of the population in the study area with access to at least two of the three alternative modes of transport considered is assessed. On this basis, the analysis procedure is as follows: for each mode of transport, an area of influence of 300 m is established, and the population covered by at least two of the modes of transport previously considered is analysed, i.e., urban bus stops, cycling mobility network and pedestrian streets.
The minimum value of the evaluation parameter is considered to be 80% of the resident population in the study area with at least two non-car-based modes, and 100% as ideal. To draw up the accessibility map for this indicator using QGIS, the number of inhabitants who would have access to each alternative mode considered for each study area analysed the PCH and the entire city. For this purpose, the QGIS “count points in polygons” tool was used.

3.2. Bike Parking Distance Coverage

The absence of an appropriate cycling network, as well as the possible lack of secure bicycle parking facilities, become determining factors that can limit the use of this means of transport in cities. In this sense, it is of vital importance to provide the bicycle network with a minimum number of parking spaces in the city in different locations where population concentration is expected and along different routes, paying special attention to the points of attraction and trip generation, the type of parking (short or long-term parking), and the origin of the trip (e.g., place of residence). The location of such parking facilities should encourage intermodality, allowing the combination of cycling with other means of transport.
With the focus on sustainability, it will be of great interest to promote an adequate bicycle parking infrastructure and, at the same time, guarantee accessibility criteria for the use of this transport alternative regularly, both for internal journeys at the neighbourhood level and for journeys between sectors and the rest of the city.
To determine the accessibility of the different bicycle parking areas in the city of Cáceres, the Pbike indicator was used, shown in Equation (2), which allows for estimating the percentage of the population that has access to this service at a distance of less than 100 m (less than 1-min walking distance).
Pbike (%) = [Population covered by bicycle parking/total population]
For this indicator, with the premise of being able to specify the number of inhabitants who would have access to the indicated service, the minimum value of the evaluation parameter is considered to be 80% of the population that has access to bicycle parking at a distance of less than 100 m, and 100% is considered desirable. To generate the accessibility map for the Pbike indicator, a procedure similar to that explained in Section 3.1 has been used, using the QGIS tool to establish an area of influence of 100 m and analyse the population with access to bicycle parking within the two areas analysed.

3.3. Accessibility to Green Areas

In the concept of a sustainable city, green areas play a fundamental role: they contribute to human health and social cohesion and become a refuge for bio-diversity. The importance of trees in cities is widely known, but it is necessary to highlight that they are determinants of the quality of life in a city. Among the environmental benefits they generate are: improving the habitability of public spaces, mitigating noise, dampening the temperature and increasing humidity, reducing the consequences of the greenhouse effect, and reducing air pollution levels. In this way, having green spaces in a municipality becomes an essential asset for people’s health and turns public space into an attractive and visually pleasing place. Moreover, the interconnection between parks, gardens, and interstitial spaces form an integral green mosaic, a real green network that increases biological biodiversity and improves the quality of public space.
The purpose of this indicator is to assess the proximity of the population to green spaces, defined as living spaces with a minimum surface area of 1000 m2 and with more than 50% of the permeable area (public parks, gardens, open spaces for pedestrian use only, and squares). Green areas linked to traffic (traffic islands) are not considered. The objective is that every citizen should have simultaneous access to different types of green spaces of different sizes and functionalities: from green spaces of 1000 m2 to spaces larger than 10 ha, at a distance that can be covered on foot or by a short journey by public transport (4 km). To analyse this indicator, the spaces and access distance considered are as follows:
Green space larger than 1000 m2 at a distance of less than 200 metres (it is assumed that this could be done on foot daily). These spaces correspond to landscaped areas, such as squares or sitting areas that provide a function of daily contact of the citizen with the urban green infrastructure.
Green space larger than 5000 m2 at a distance of less than 750 metres (a walking distance that could be made daily). These spaces perform the most basic functions of outdoor recreation and leisure for the resident population.
Green space over 1 ha at a distance of less than 2 km (cycling). These spaces would be urban parks that guarantee different recreational possibilities and present a certain singularity in relation to their historical character.
Green space larger than 10 ha at a distance of less than 4 km (on public transport). These spaces correspond mostly to open areas that can be integrated into the natural environment, to which a restorative and landscaping purpose is assigned.
The dimensions of the assessed green spaces, as well as the access distances considered in each case, are summarised in Table 4.
To estimate the proximity of the population to green spaces, the Pgreen indicator is used, defined in Equation (3), which considers accessibility to three of the four previously defined green spaces as a minimum value for the entire population residing in the study area, as well as simultaneous access to the four types of green space as a desirable value:
Pgreen (%) = [Population with simultaneous coverage to 3 of the 4 types of green spaces/total population]
A similar calculation methodology is proposed by the World Health Organisation WHO in [63], where indicators of green space accessibility consider the distribution of the population (individuals, households, or communities) in terms of their proximity to green space. The European Union also suggests in its Annex 3 in [64] the European common indicators. Therefore, it can be seen that there are several mentions of indicators that can be used to establish standards of accessibility to green spaces.
To draw up the inventory of green spaces to formulate the research, it was necessary to identify each green space present in the city because the data available in the public repositories were not complete; as mentioned in Section 3.1 and Section 3.2, the QGIS tool was used to generate the accessibility map, establishing different areas of influence depending on the type of green space under analysis, identifying the accessibility of the city’s residents to these spaces.

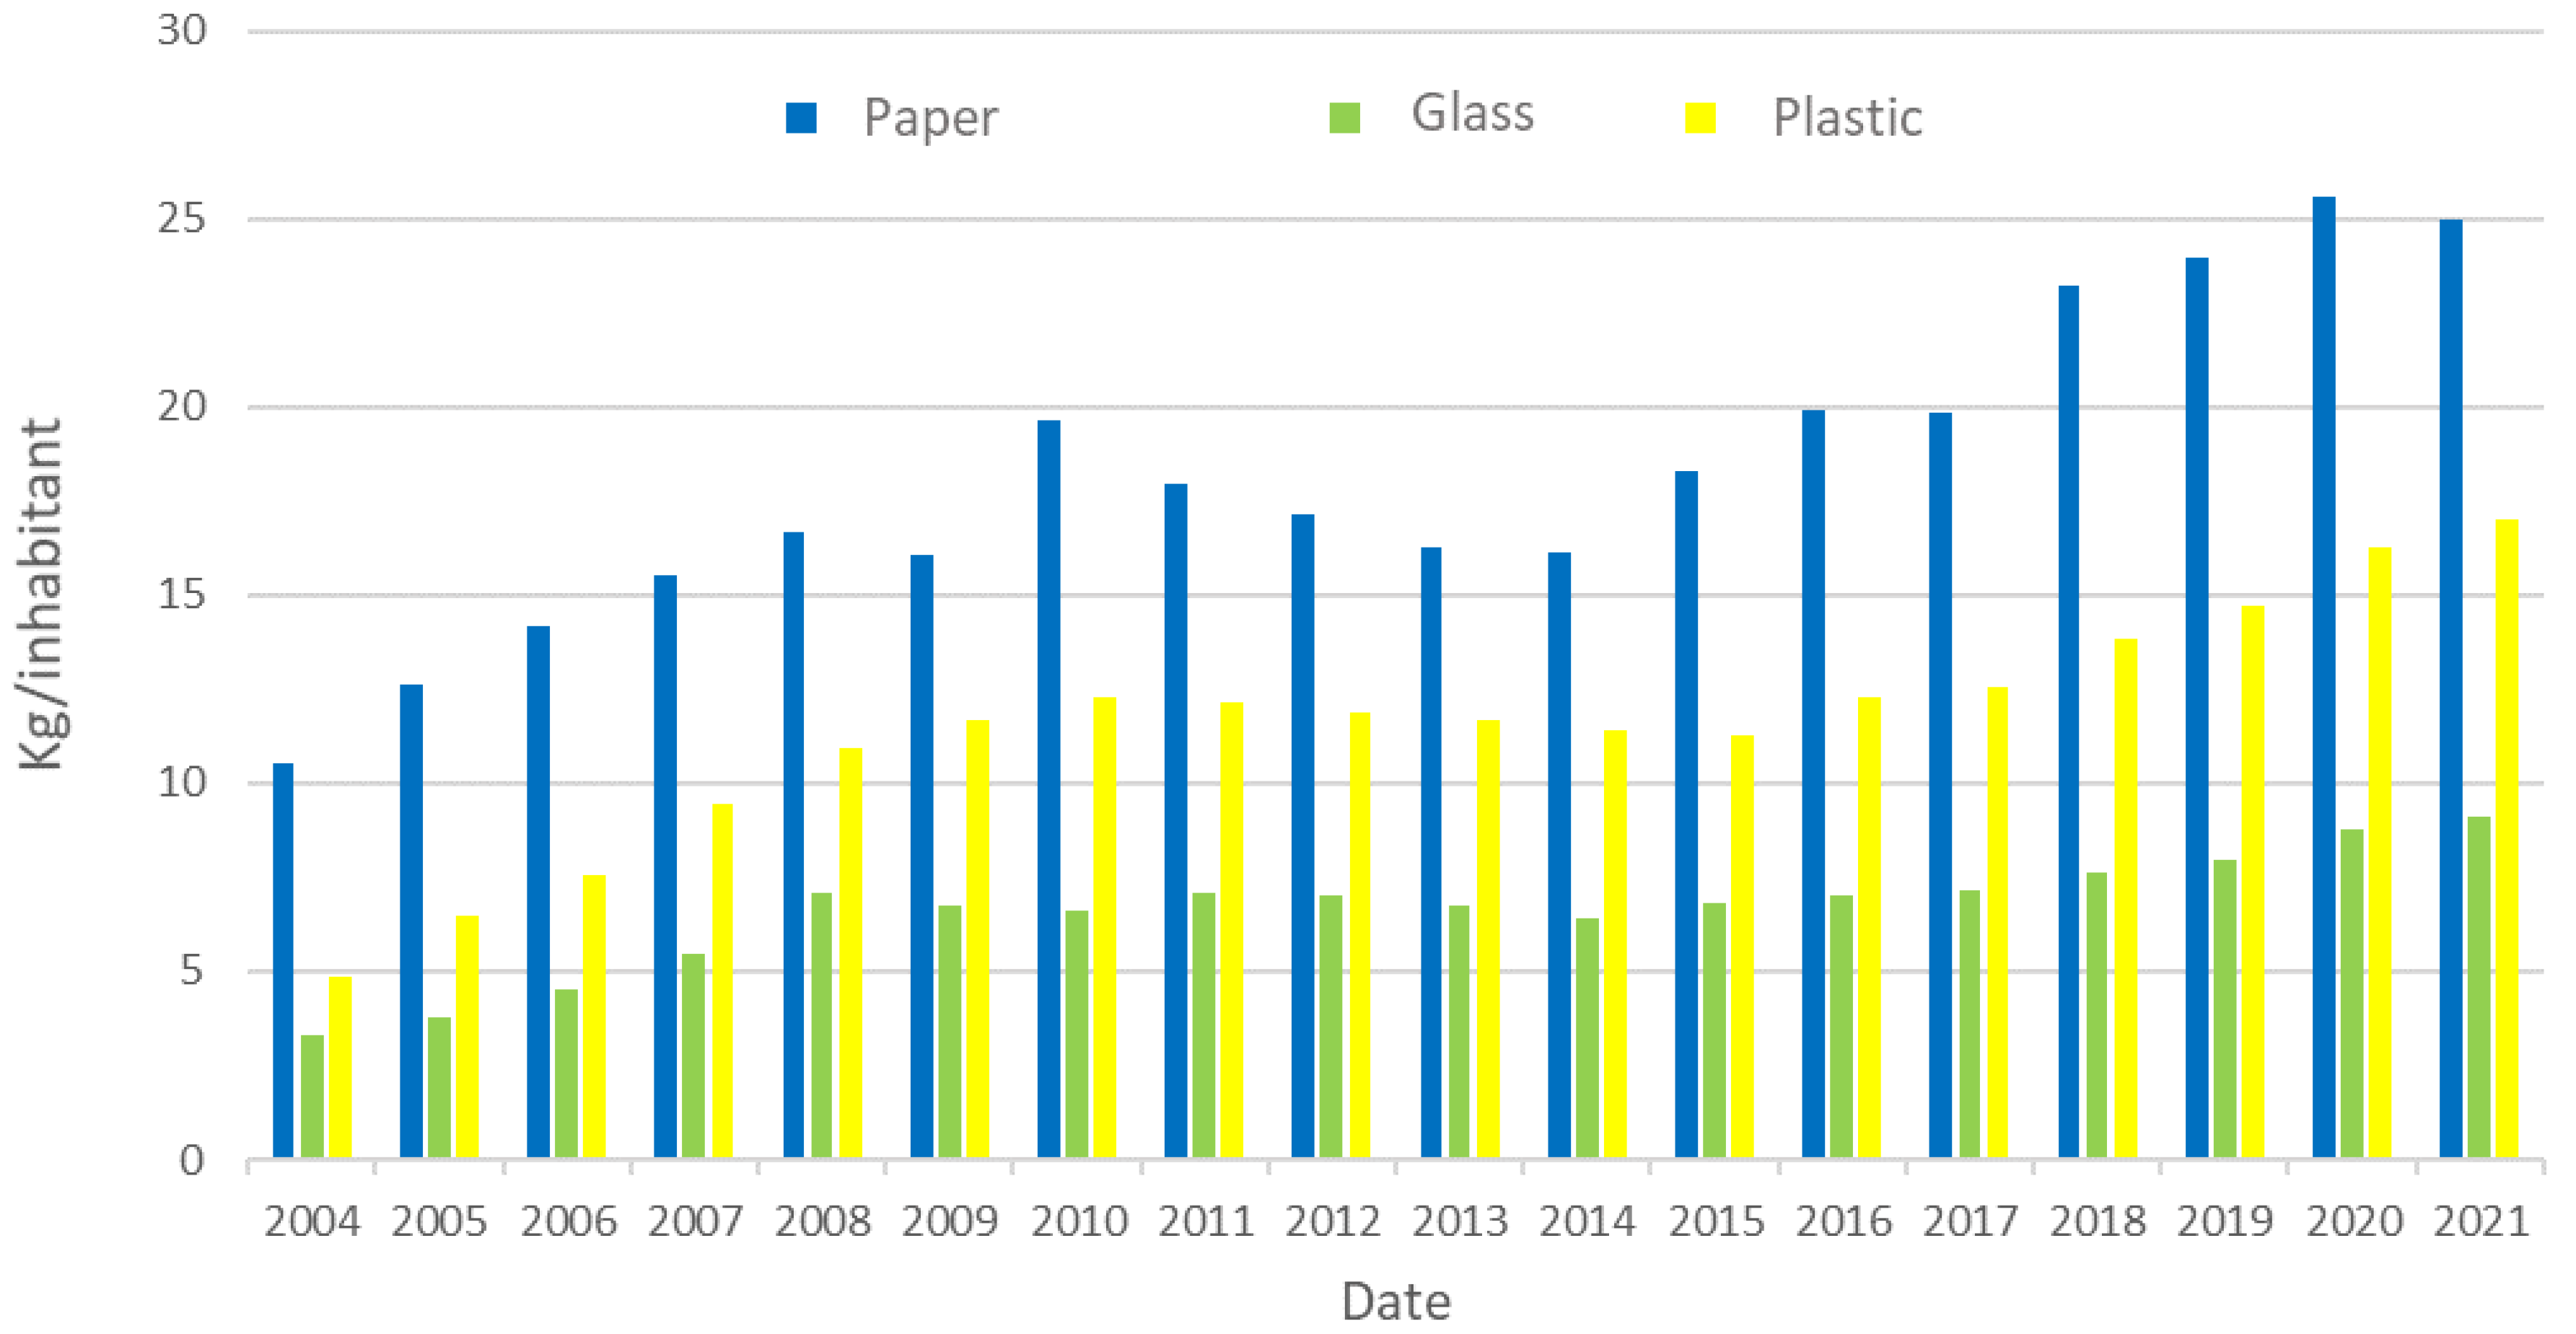
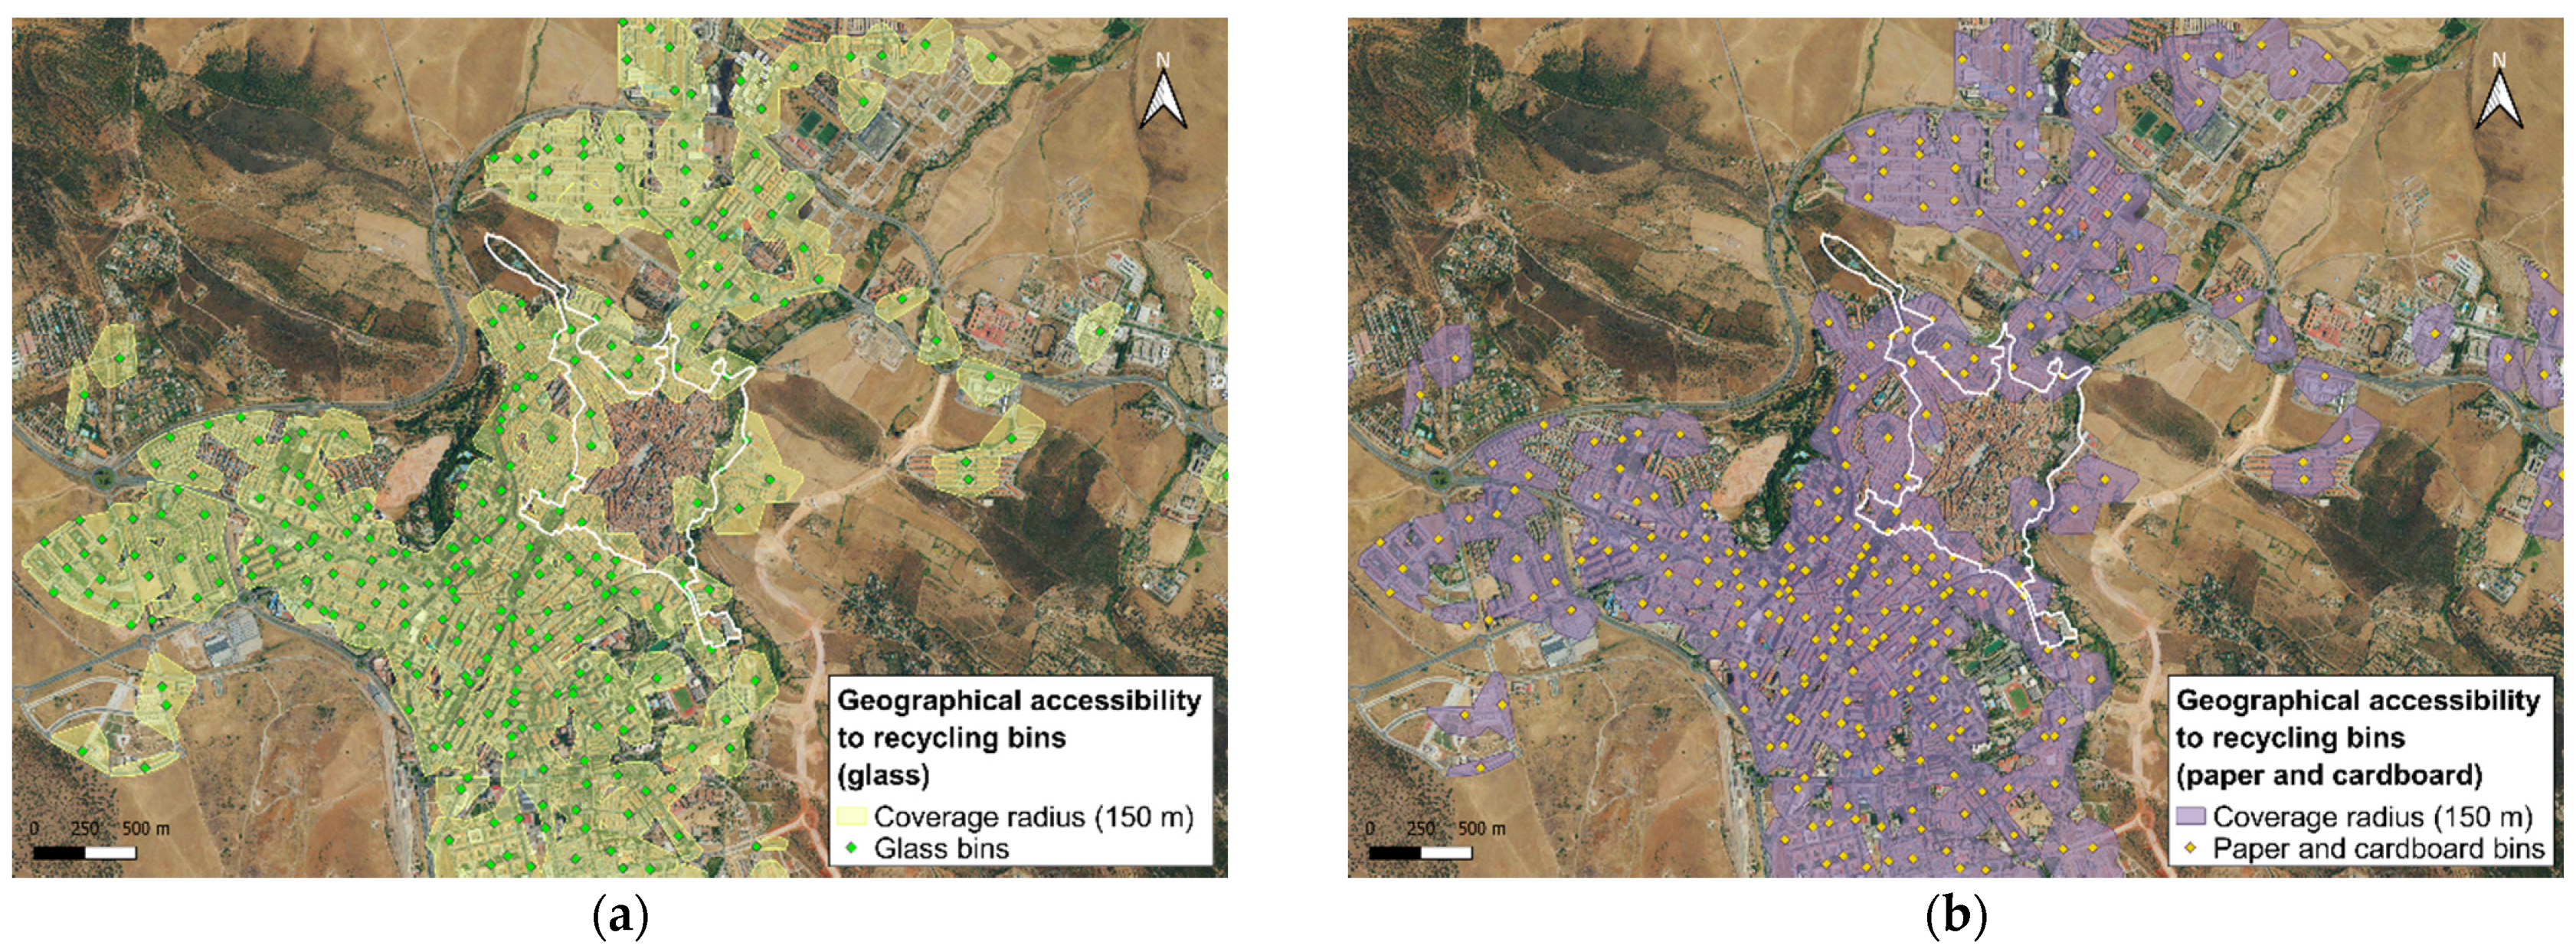
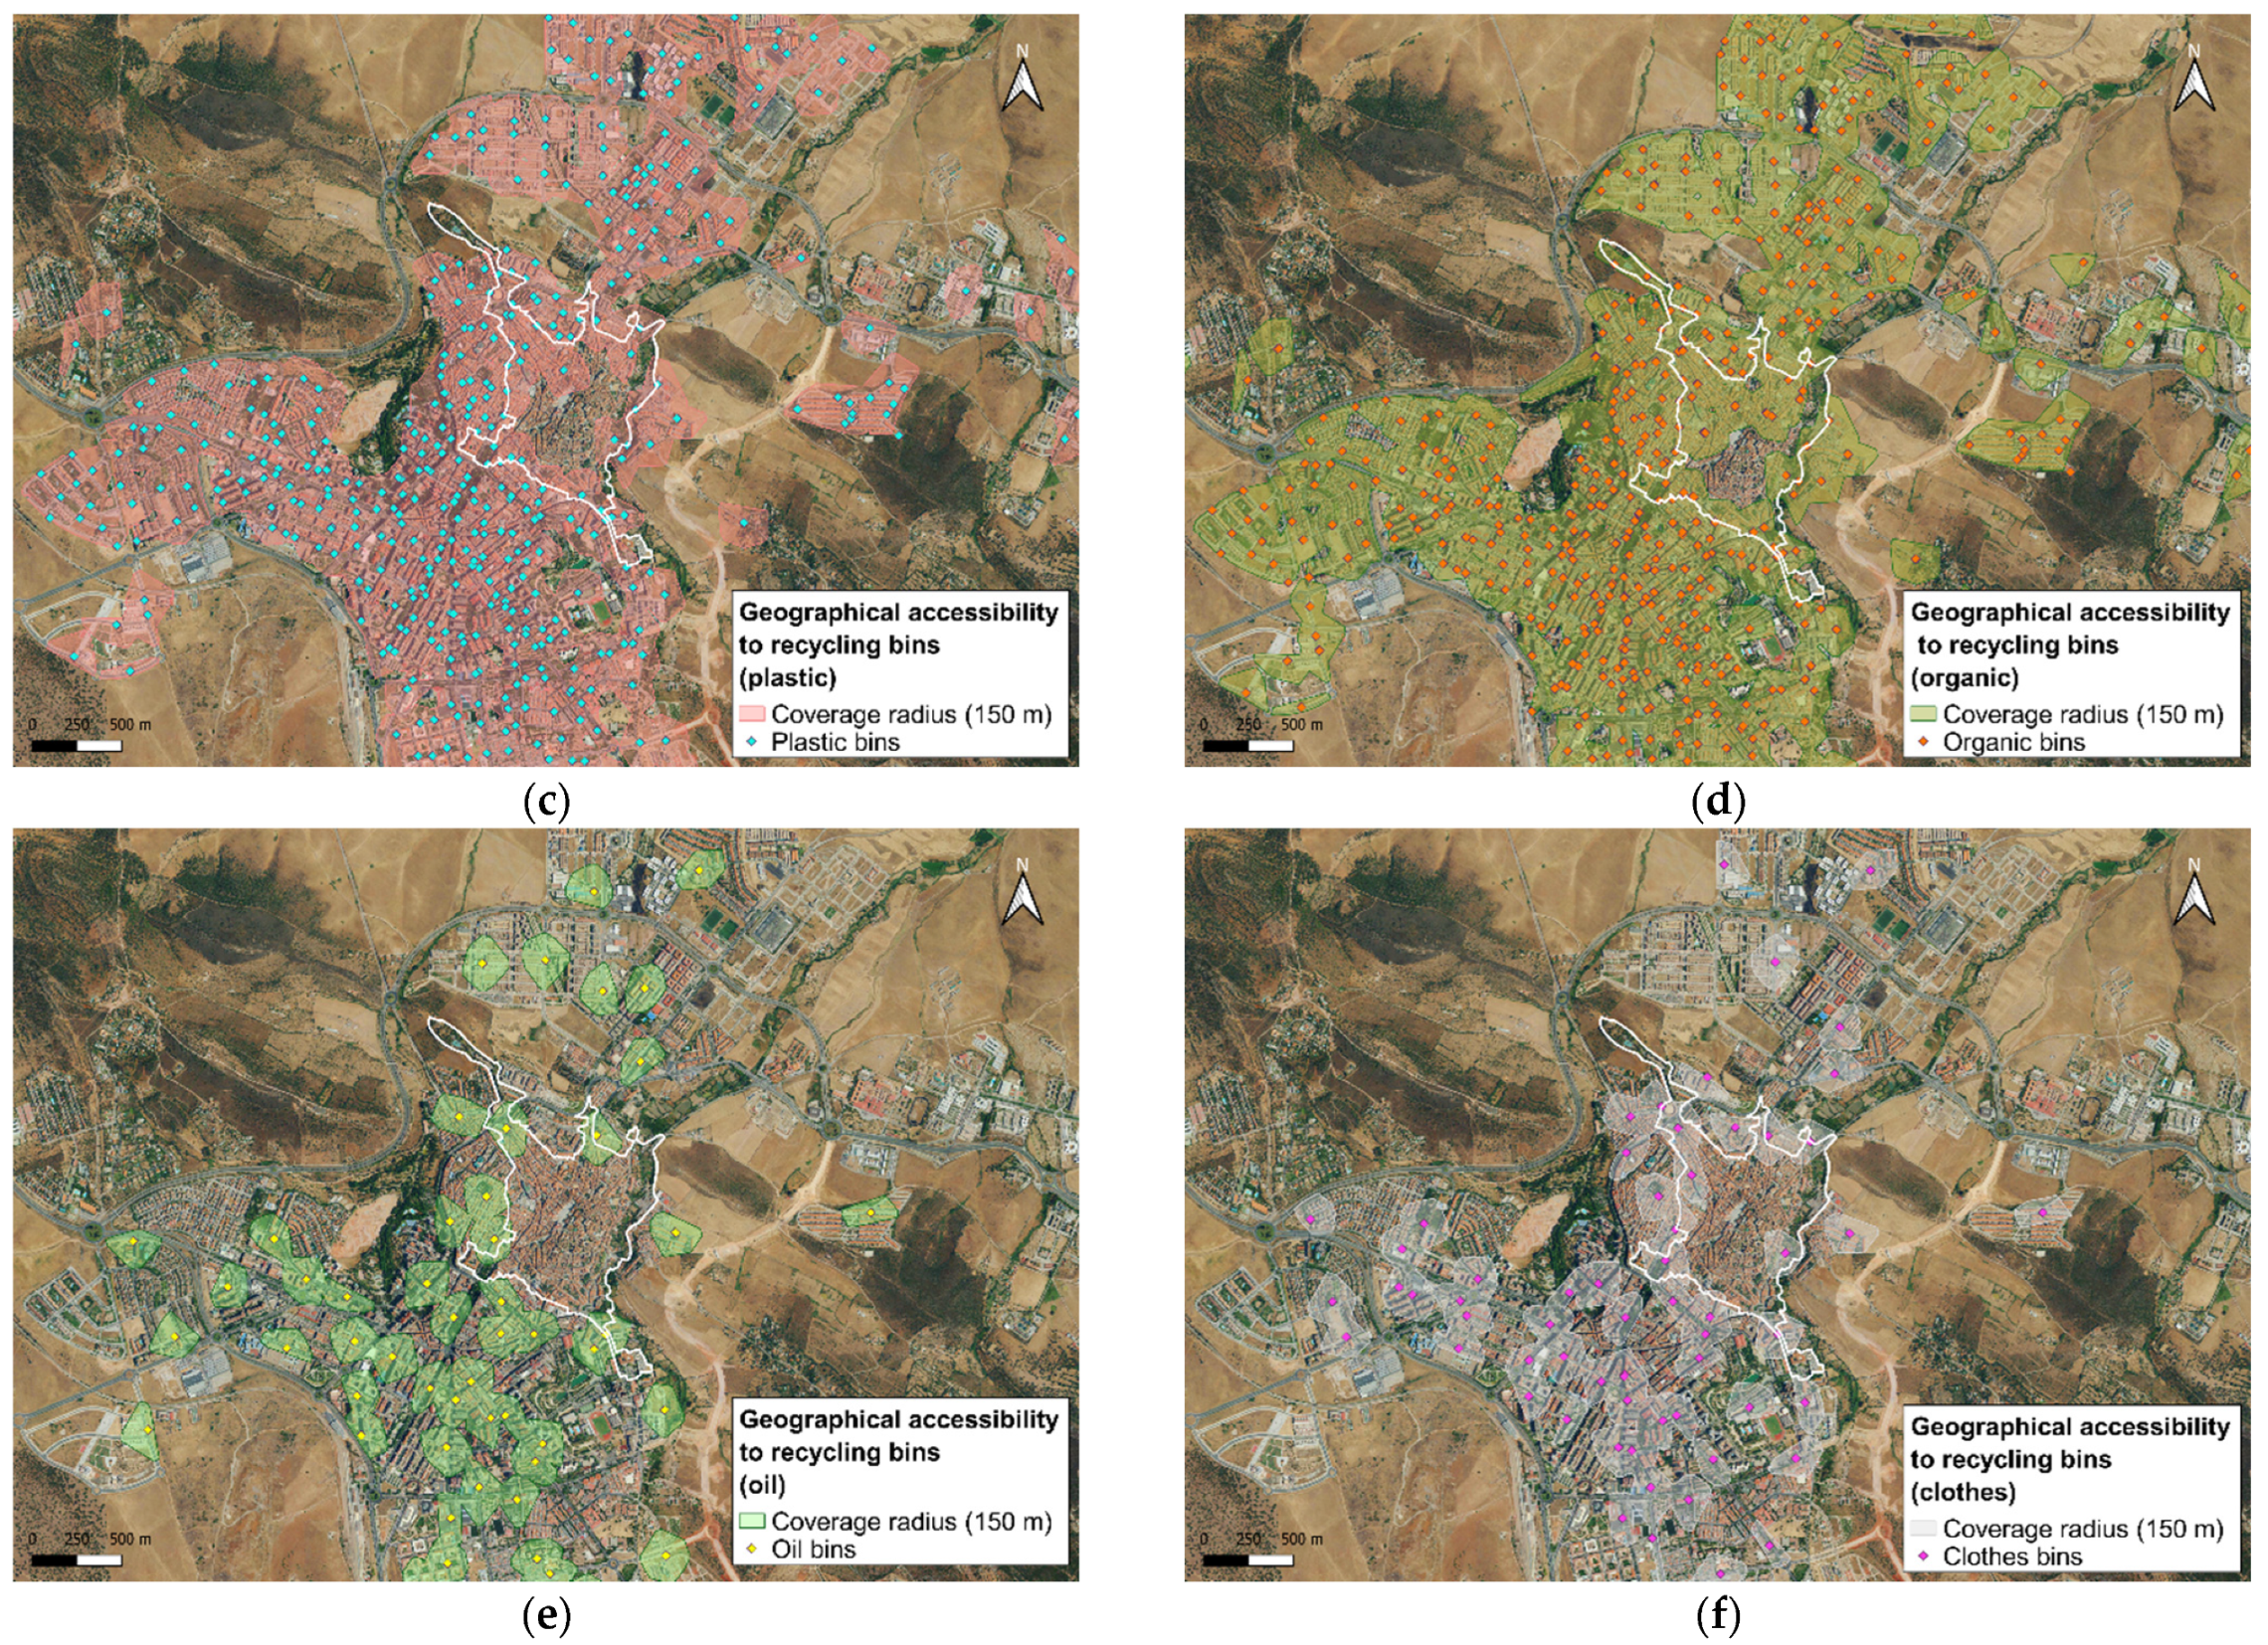
3.4. Distance to Different Waste Separate Collection Rubbish Bins

The recycling of solid urban waste is an environmental challenge that can be quantified and controlled, producing an effective improvement in the quality of life in cities. The management of household waste will be efficient if the separation at source is correct (it requires citizen collaboration), which means that the recovery of recyclable materials is significant. For this reason, it is crucial to know the correct way to separate urban waste, i.e., how to classify the waste generated. To this end, each city council adopts its own selective collection system. The city of Cáceres has a service based on the separation of waste into six categories: glass, paper and cardboard, plastic, metal and carton packaging, clothes, oil, and organic waste. Those types of waste that are not included in the six categories above and which can be considered special (light bulbs, batteries, paints, solvents, etc.) must be treated appropriately and are collected through fixed and mobile collection points (clean points) (which will be dealt with in Section 3.5).
The key factor for the correct functioning of a city’s recycling system is the proximity of citizens to the collection points for the different types of waste. The fact that citizens have a collection area close to their homes, making it unnecessary to make long journeys, favours a greater contribution to the selective collection of waste. In addition, the proximity of the collection points for the “residual” fraction means that waste is not abandoned on the public highway.
The Pfraction indicator (Equation (4)) provides a precise parameter for assessing the quality of the waste collection service since it is based on the distance between the source (citizen) and the nearest collection point (destination), determining which areas have the least easy access to the collection points for the different fractions.
Pfraction (%) = [Population with access to separate collection points for the different fractions/total population]
Proximity to collection points indicates the distance a person has to travel from their front door to the nearest waste collection point. In this way, it is possible to determine what percentage of the population meets the correct distance and what percentage has to make long journeys to the collection point. The analysis is carried out based on minimum paths, i.e., the distances are calculated based on a network of street sections and not by areas of influence.
Thus, the minimum value of the indicator is considered to be 80% of the population within 150 m of the selective collection points for the different fractions (as close as possible to the citizens). The desired value is 100%, which would be considered practically a door-to-door collection service, which would make it possible to reduce distances (e.g., collection in the building itself), free up public space of containers, and achieve better selective collection results.
To elaborate on the accessibility map for this indicator, it is necessary to use the QGIS add-on “ORS Tools”, which allows the determination of the minimum paths, i.e., the minimum distances from a network of street sections, from each selected point. Due to the excessive volume of working data, it was very difficult to use this add-on, which was not adapted to an excessive number of variables. To solve this problem, it was decided to separate the points layer into 2 or 3 different layers and thus be able to run the tool.

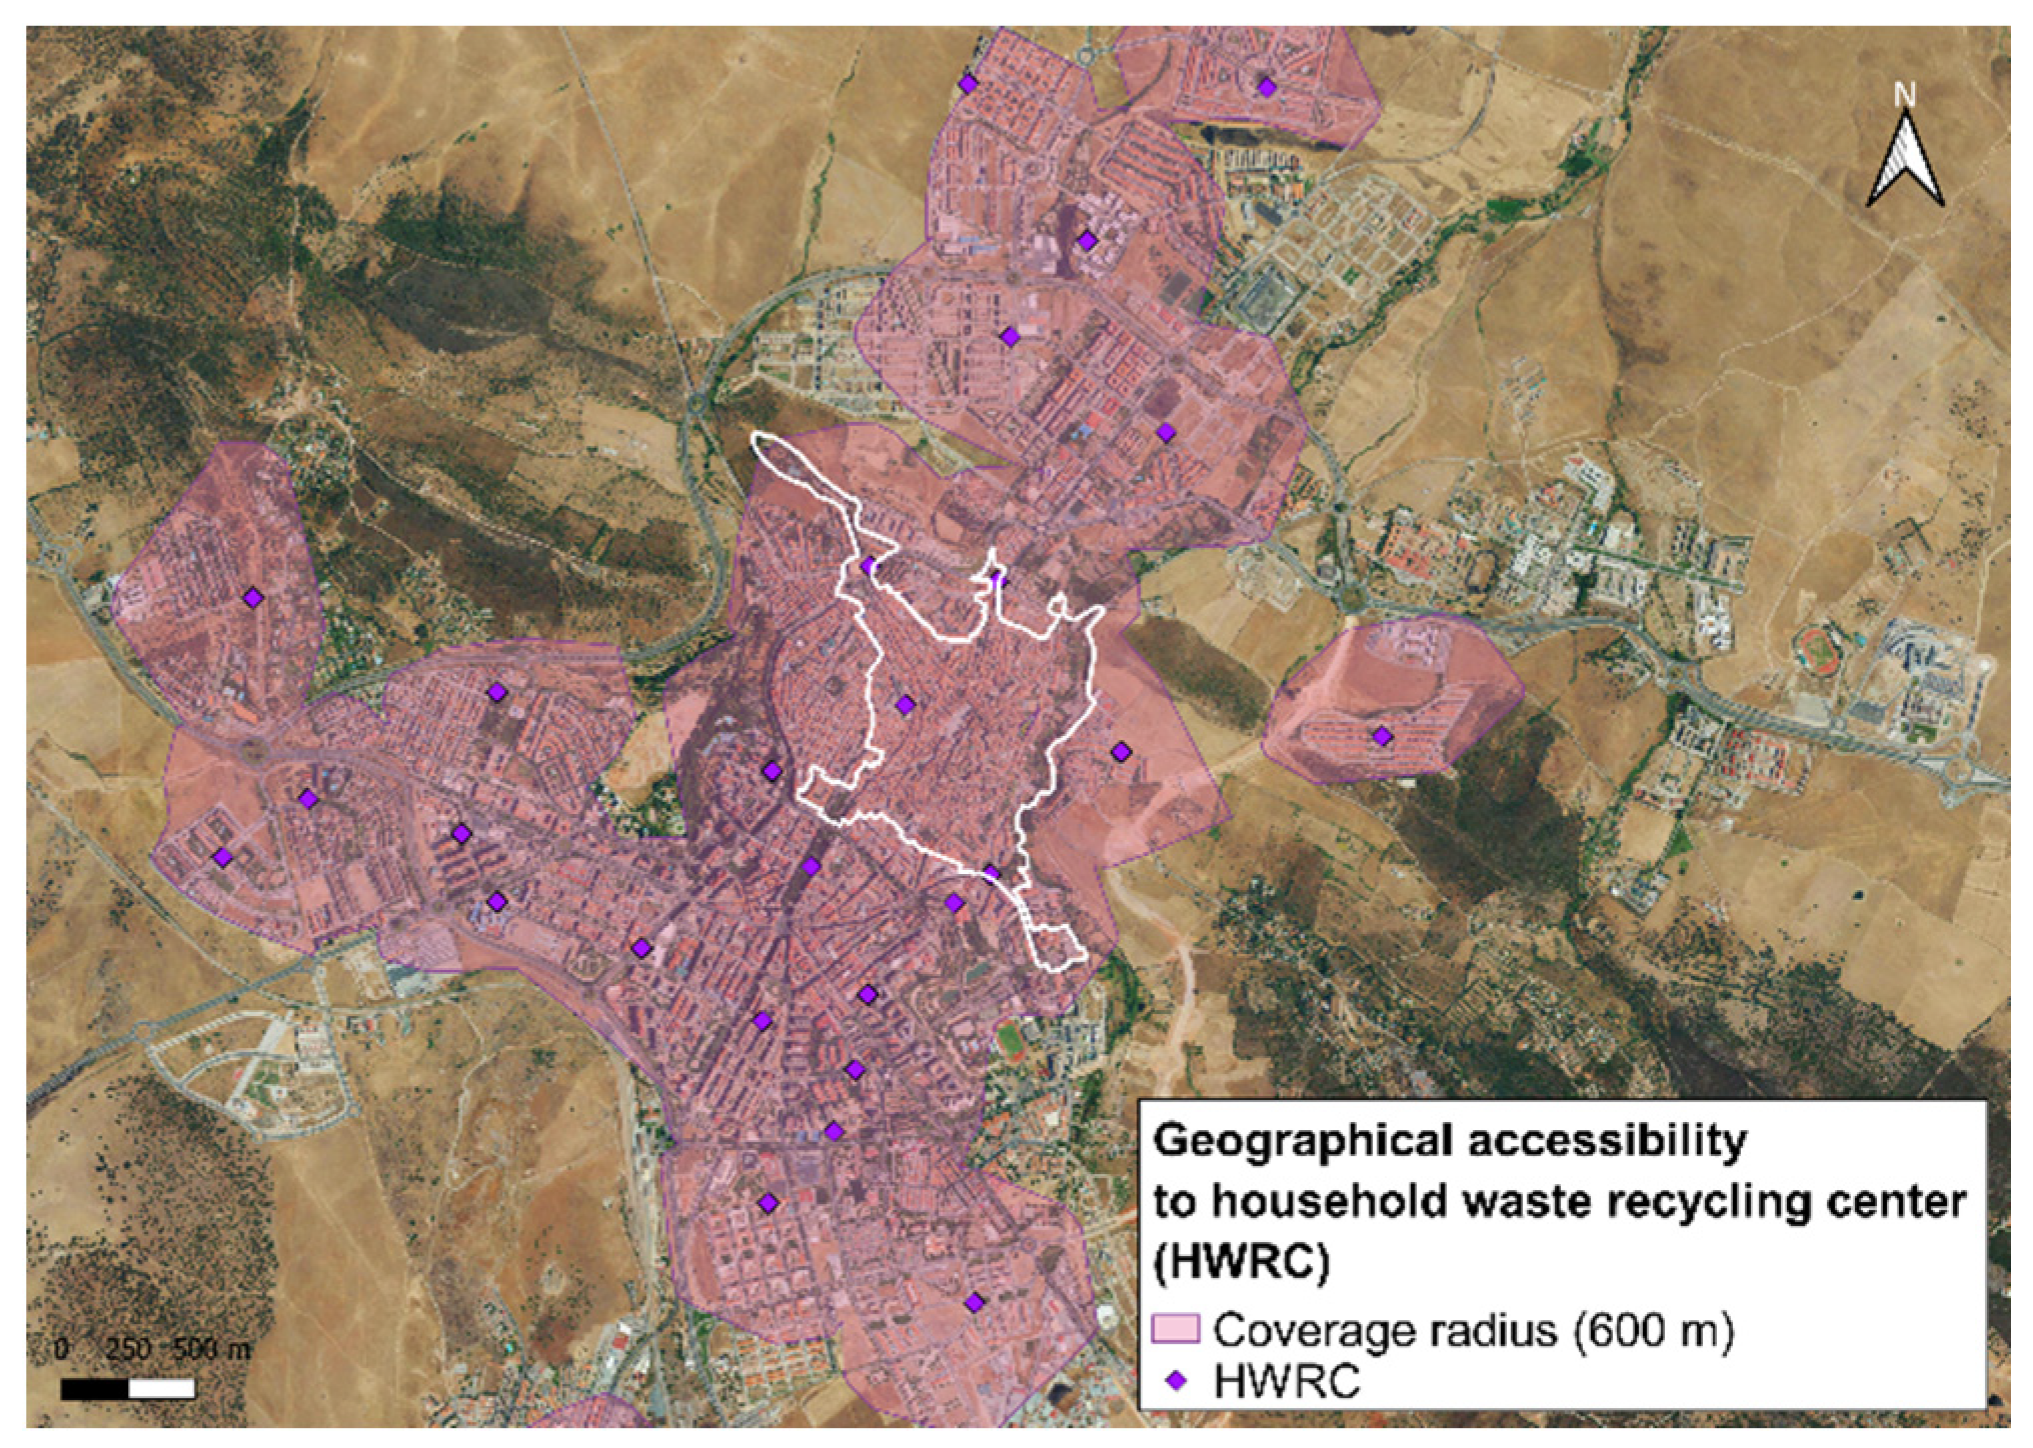
3.5. Geographical Accessibility to Household Waste Recy-Cling Center (HWRC)

Household Waste Recycling Centres are a key part of selective collection and favour the re-use of materials, helping to reduce landfills as a management formula. The aim of a network of HWRCs is to provide users with a convenient and nearby infrastructure where they can deposit different fractions of urban waste, which, due to their nature, volume and type, cannot be deposited in conventional containers. HWRCs are equipped with large-capacity bins to select the materials deposited, which are subsequently transferred by recovery companies to their respective centres for recovery and re-use.
The objective of this indicator is to encourage and facilitate the selective collection of those fractions that do not have specific containers on the public highway and to promote the collection of special waste and materials that can be recycled and/or re-used or that, due to their hazardous nature, must be specially treated. For this purpose, the distance of citizens to fixed and mobile collection centres is determined by calculating the accessibility of the population to the waste collection points (which must be close to the citizen and offer timetable availability).
The collection centres must be located in areas close to the citizens, no more than a 10-min walk away (approximately 600 metres), and must have access that allows vehicles and pedestrians to enter (location in blocks bordering basic traffic routes).
The indicator is calculated by obtaining the distance from the population to the nearest HWRC (using minimum paths) using Equation (5):
Precyclingcenter (%) = [Population with access to a HWRC/total population]
The minimum value of the evaluation parameter is considered to be that 80% of the population is within 600 m (which is the established walking distance to a HWRC), with 100% of citizens being the desirable value. As described in Section 3.4, the QGIS “ORS Tools” add-on has been used to calculate this indicator to create the accessibility maps to the HWRCs.

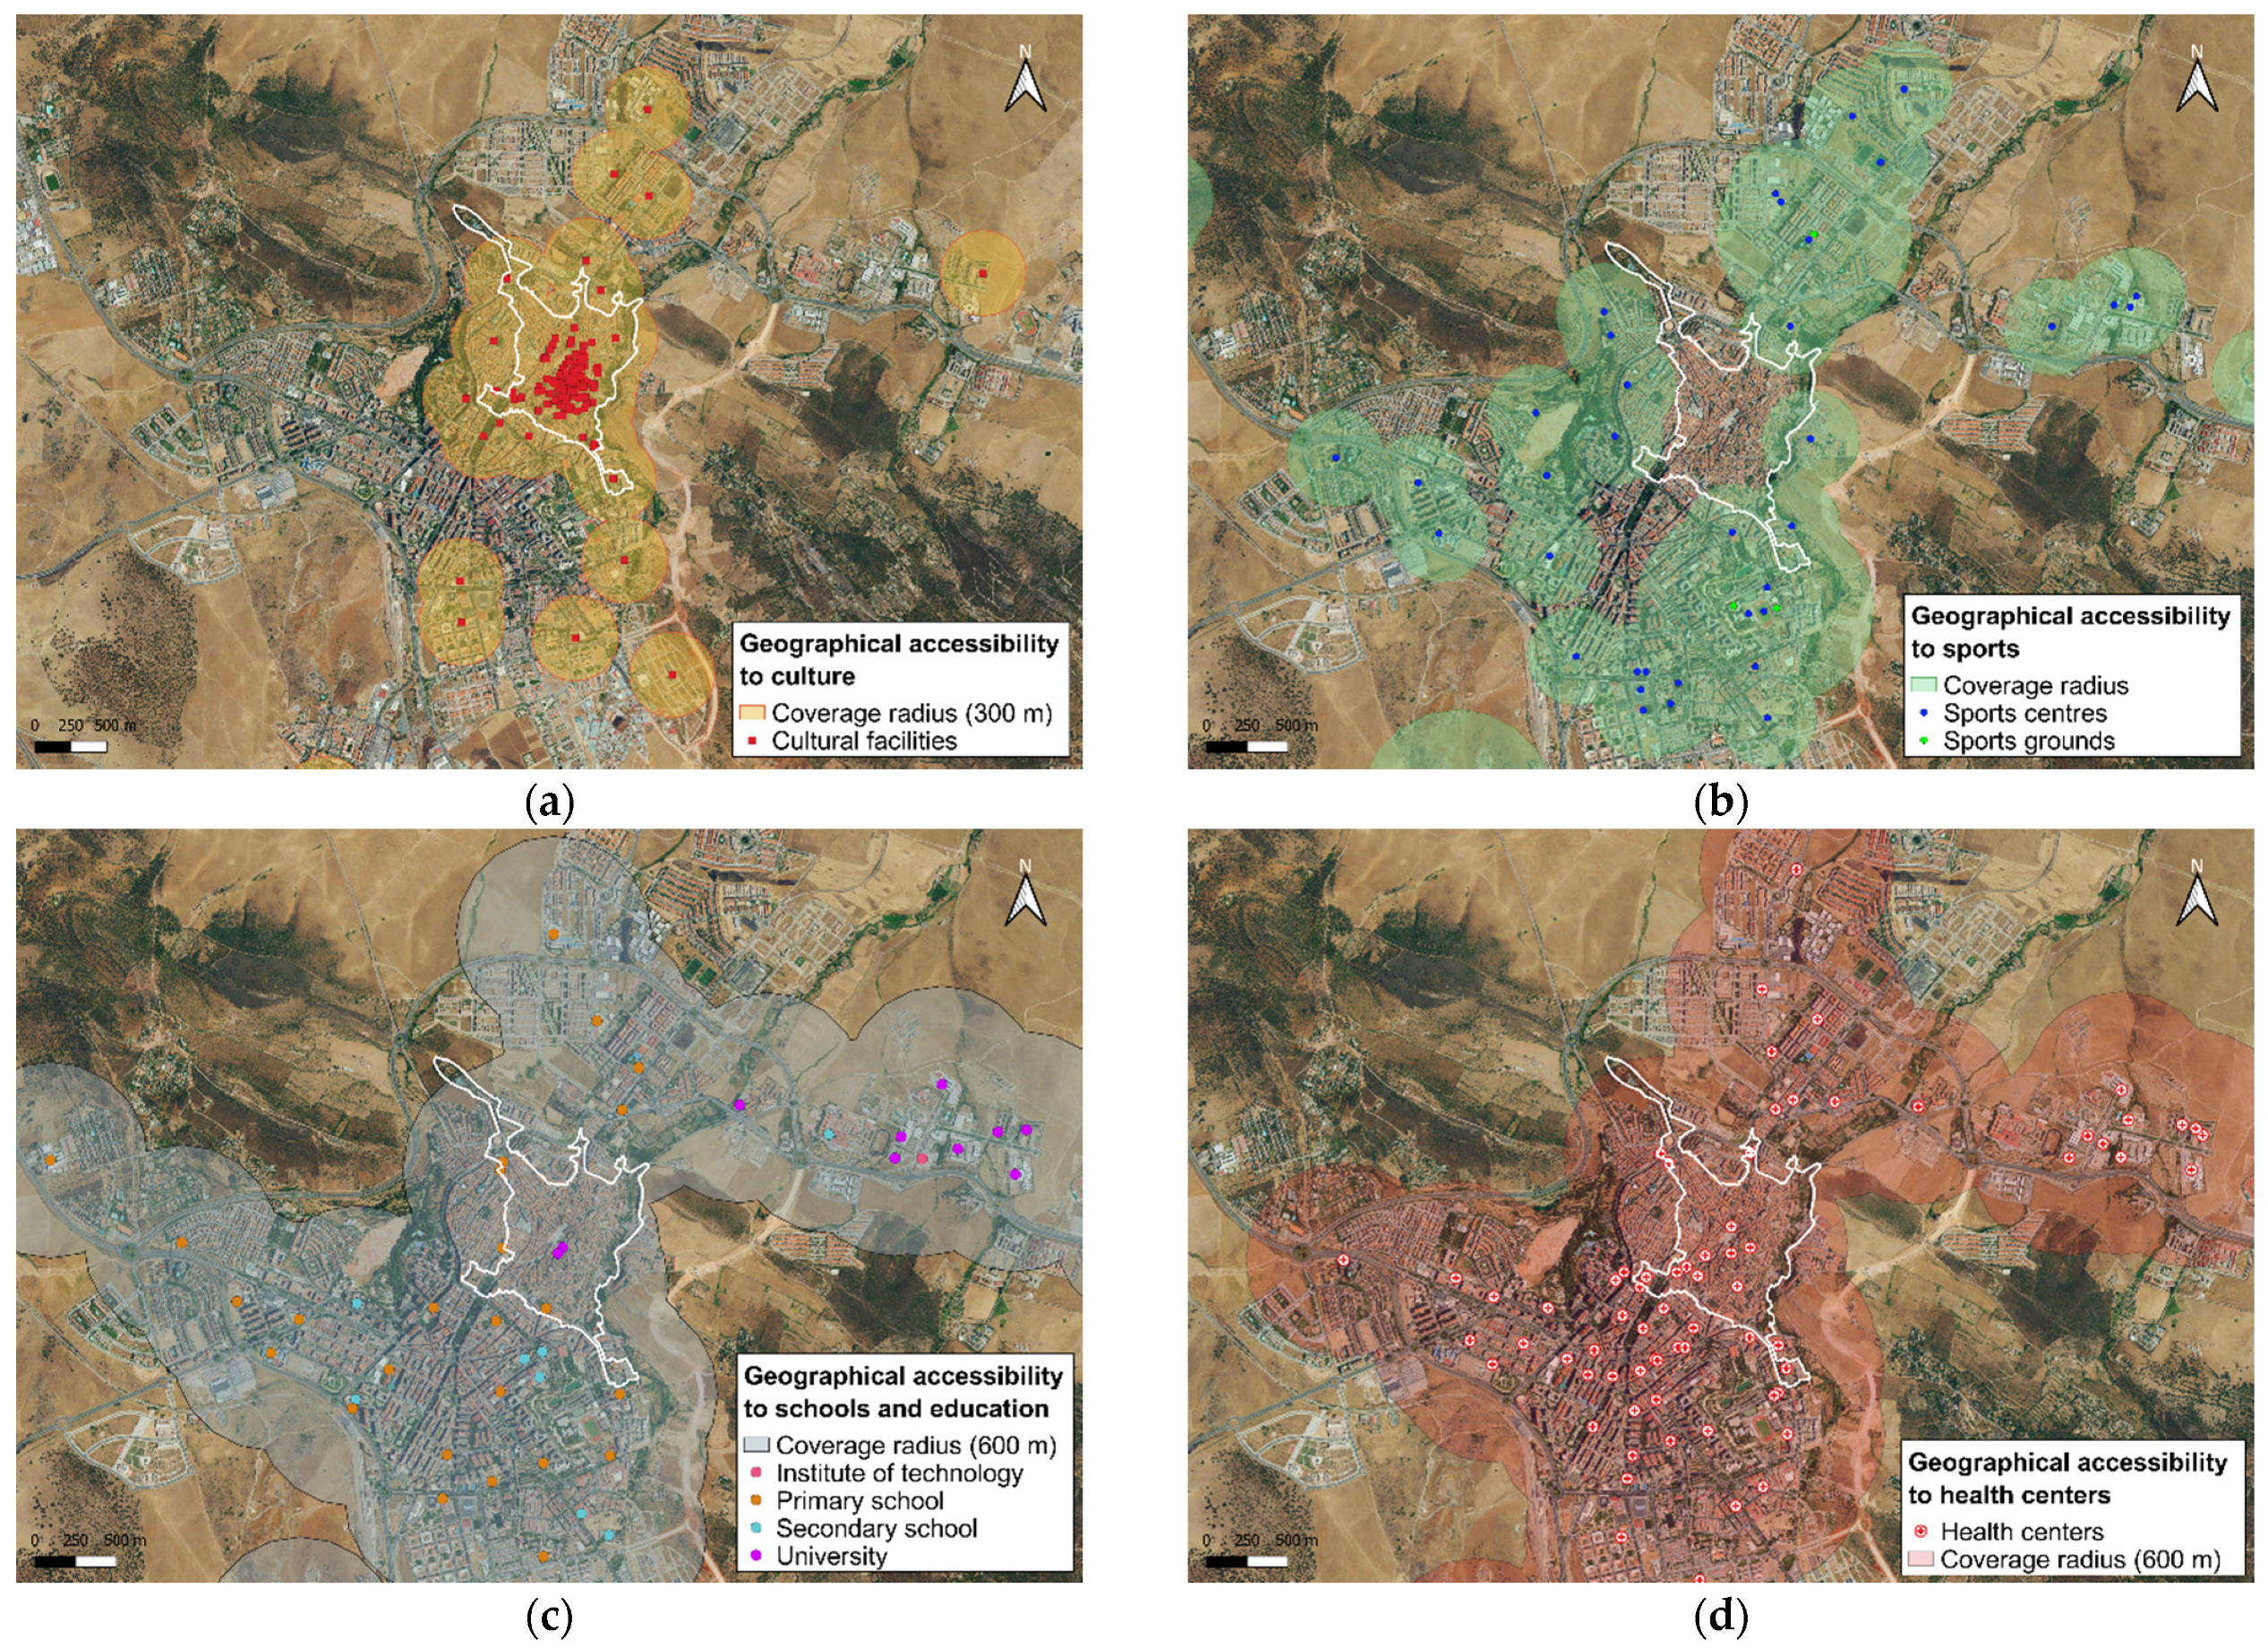
3.6. Accessibility to Public Services

Public services are traditionally linked to the welfare state and guarantee the coverage of aspects that are extremely important for citizens [65] such as health, education, public transport, infrastructures, green spaces, etc. From a social point of view, the organisation of the urban fabric based on the concepts of proximity and closeness promotes the possibility of dedicating more time to social relations, as well as greater habitability of public space. Therefore, a balanced and accessible distribution of basic services allows the population to identify with their closest urban space, increasing social cohesion and the interrelation between the city and its inhabitants. For all these reasons, the correct planning of the different services and facilities at the urban level is a strategic line of great importance for the present and future development of municipalities since local sustainability is also clearly influenced by a fundamental factor, accessibility to basic facilities and services.
Equitable distribution of facilities in the territory reduces motorised mobility and encourages the distribution of public services. Concerning sustainability, it is particularly important to guarantee access to basic facilities and services within a sufficiently close radius, as this has a positive influence on energy savings, fossil fuel consumption, and travel times. In addition, proximity to facilities is a basic condition for promoting accessibility for people with reduced mobility.
Basic or proximity facilities are those that cover the most everyday needs of the population and constitute the first level of service provision, with a sphere of influence limited to the neighbourhood where they are located. These are facilities with little power of attraction for the population outside the neighbourhood but carry out irreplaceable tasks for city facilities, which have a different sphere of influence and cover other types of needs.
The objective of the calculation of the Pequipment indicator (Equation (6)) is to ensure that the population has, within a given radius of proximity, the greatest number of different facilities so that it can cover different cultural, educational, and health needs on foot, without the need to resort to other means of transport.
The analysis carried out in this article considers the facilities of proximity and considers the city facilities (essential for the daily development of activities in medium-sized cities), such as hospitals, the university campus, pavilions for holding major sporting events, etc.
Pequipment (%) = [Population covered by a type of equipment/total population]
Six different types of facilities have been used for the calculation, as follows: (a) Cultural (monuments, museums, cinema and theatres, libraries, buildings of interest, and exhibition centres), (b) Sports (sports courts and sports complexes and facilities), (c) Educational (schools, high schools, technology centres, universities, and children’s centres), (d) Health (health centres, pharmacies, hospitals, and surgeries), (e) Social welfare (neighbourhood associations, retirement homes, and social centres) and (f) Administration (public buildings).
Since public facilities are of vital importance in the daily functioning of a city, the access distances considered in the analysis methodology for each type of facility are summarised in Table 5.
Likewise, for this indicator, the minimum value of the evaluation parameter is considered to be 75% of the population having simultaneous proximity to the six types of facilities mentioned above, with 100% being considered desirable.
To draw up the accessibility maps and to quantify the population with access to the six different types of facilities, the calculation methodology developed in Section 3.1 and Section 3.2 was used, considering a radius of coverage of 300 m or 600 m, depending on the case under analysis.

4. Results and Discussion

The results obtained in the research are presented below in two complementary ways: (a) spatial representation using accessibility maps and (b) numerical data in the form of percentages.
On the one hand, the maps allow complete visualisation of the indicators of the two study areas. On the other hand, the numerical results provide an overall evaluation of the analysis of each indicator and these areas. Based on these results, the degree of adaptation to the desirable sustainability objectives set out in the article’s methodology for each indicator is evaluated. In addition, the results are discussed to put the values obtained into context and seek possible improvement solutions.

4.1. The Results of Accessibility Maps

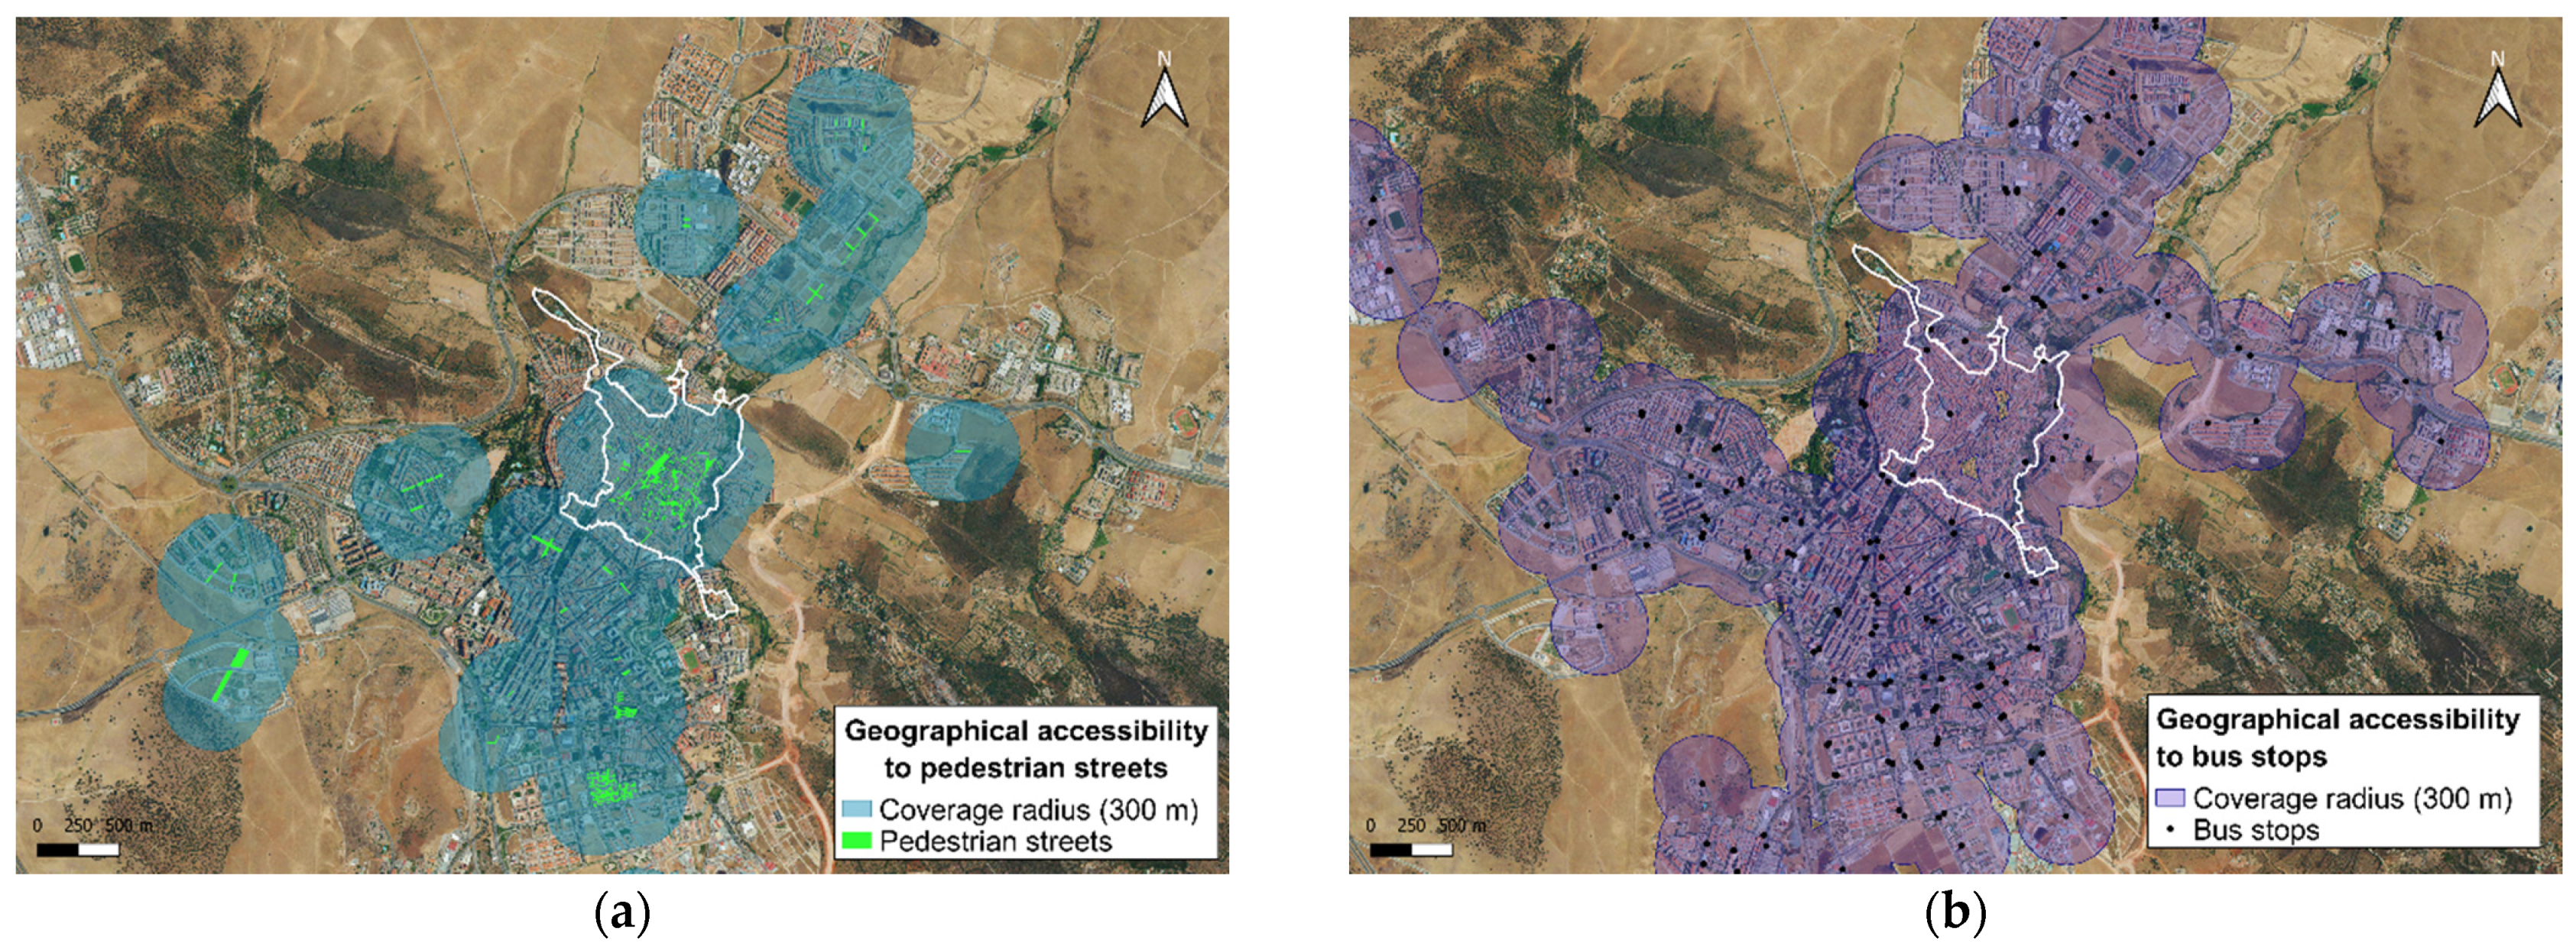
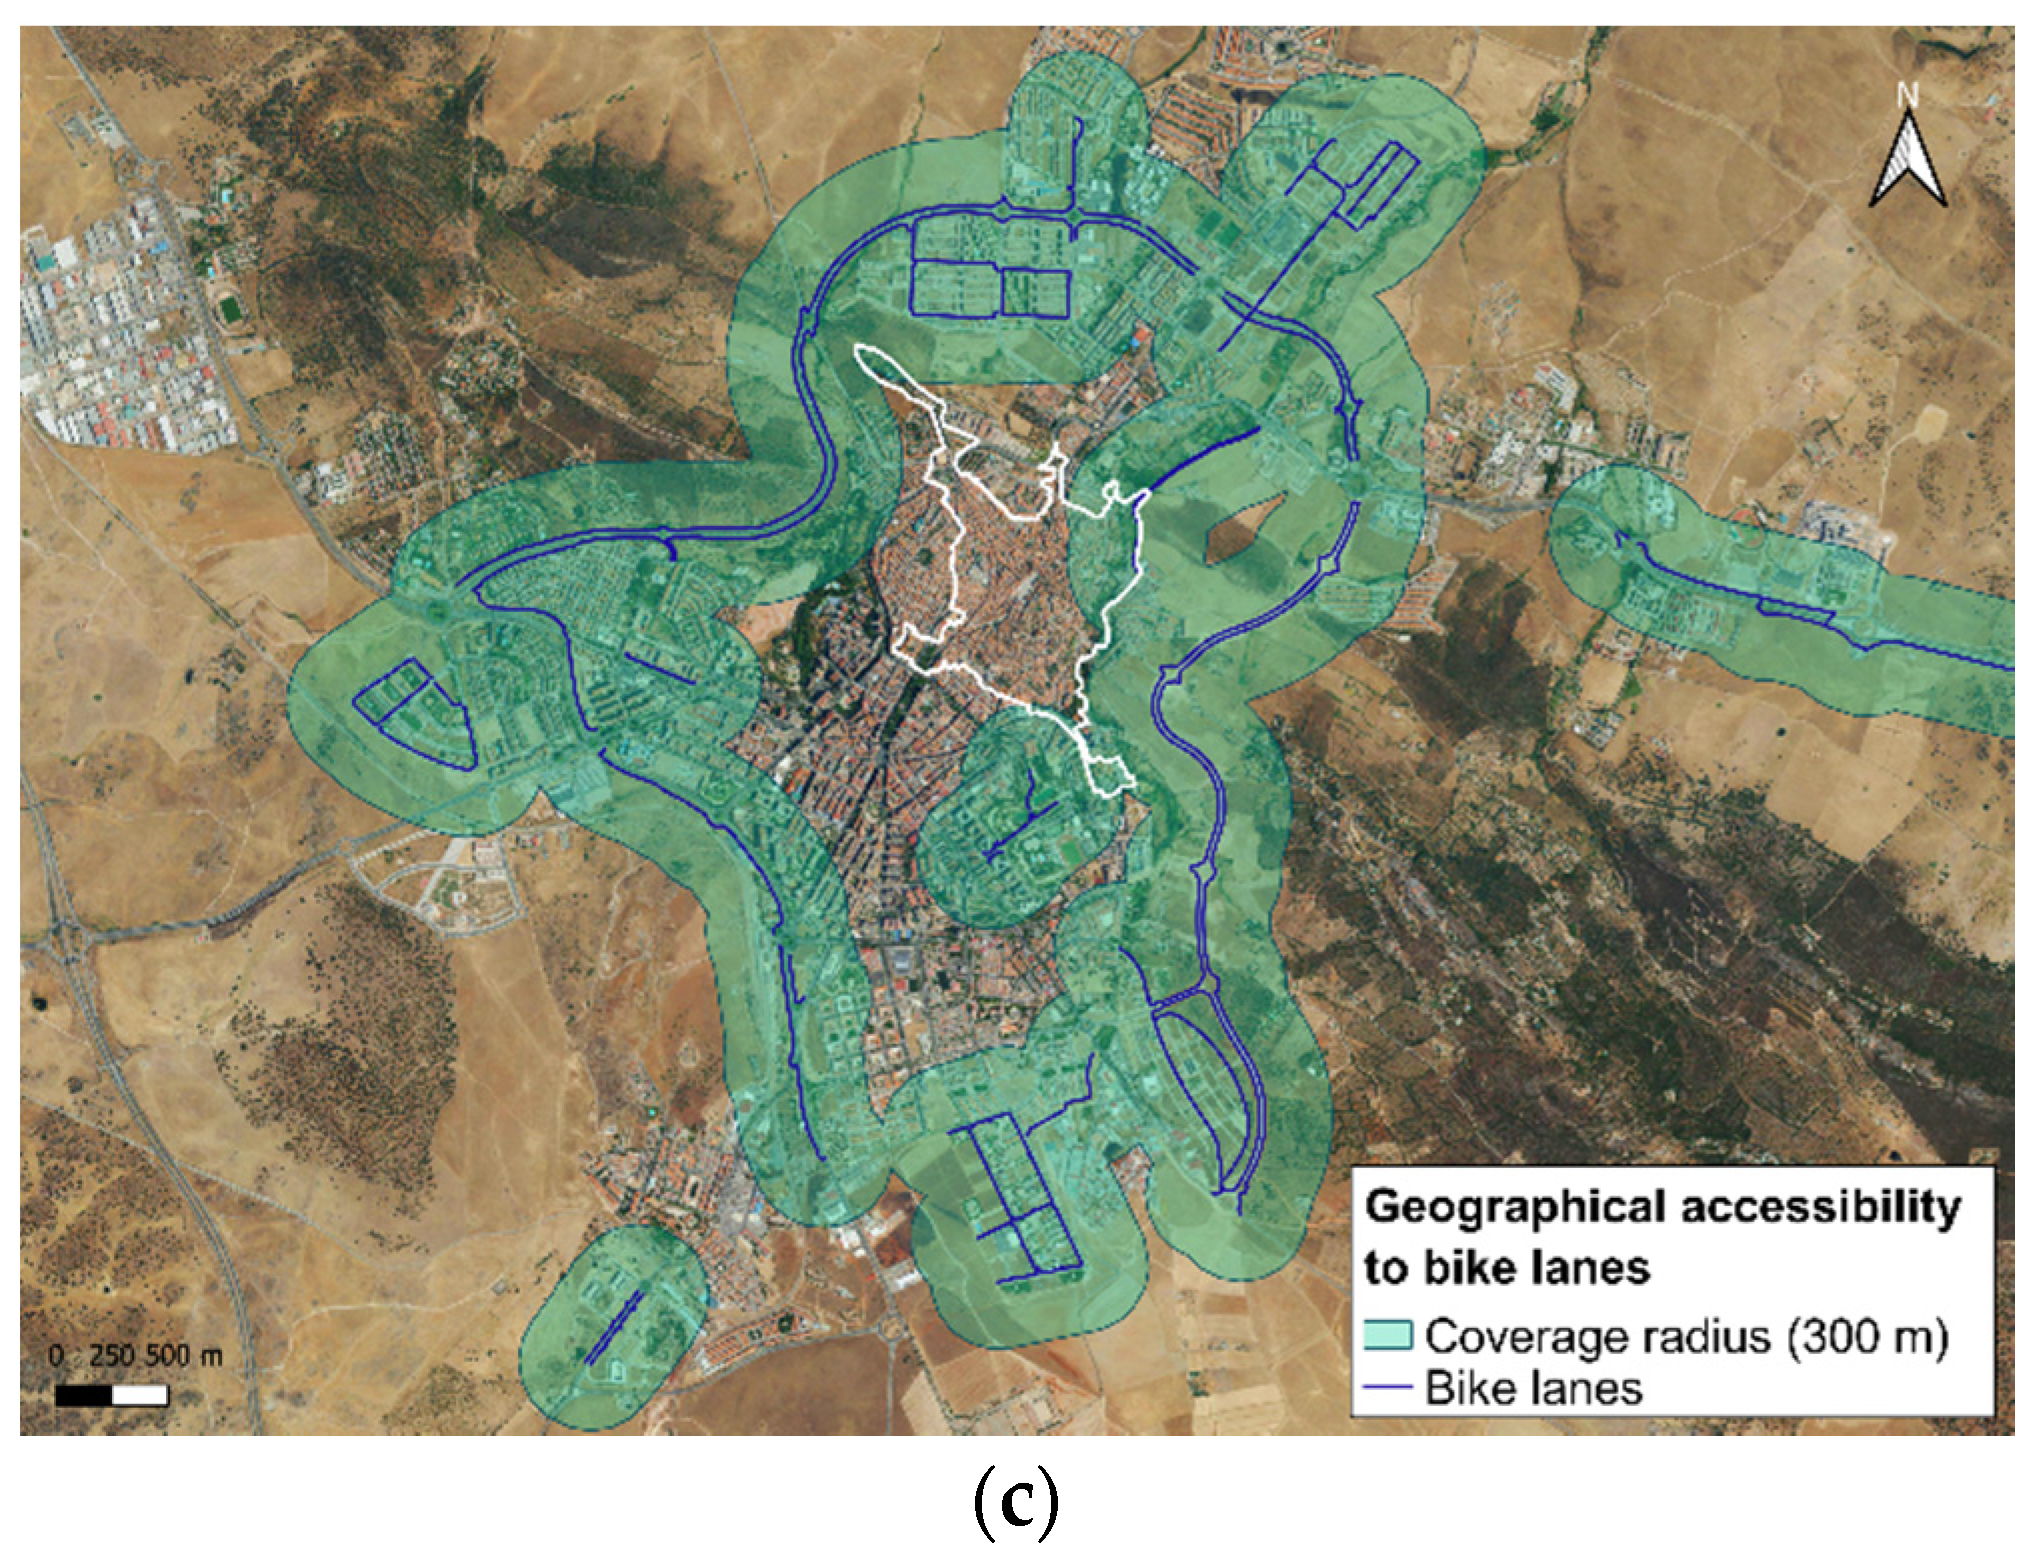
4.1.1. Urban Accessibility towards Non-Car-Based Mobility Systems

As shown in Figure 3a,b, it is clear that in the inner area of the PCH, the requirement concerning pedestrian streets and bus stops, the requirement that more than 80% of the population has access to these means of transport is comfortably met.
This is not the case in practice for the cycling network, which is mainly located on the city’s periphery and represents a very low percentage. The city of Cáceres has 51 km of cycle lanes. The problem is that their design has focused on creating a perimeter ring that is practically finished and is passable both by bicycle and light personal mobility vehicles, but no new infrastructure for cyclists has been created in the interior of the city. It is true that traffic calming measures have been adopted, such as the so-called “30 km lanes”, but these are not very well accepted by society for obvious reasons of road safety, as cyclists have to share the road with other vehicles.
Figure 3 shows that more sustainable transport options are available at the whole city level than in the area within the PCH, and that access to these modes is more balanced in the built-up urban boundary. However, the requirements established for the evaluation parameters would not be met.

4.1.2. Bike Parking Distance Coverage

There are currently 67 parking areas in the city of Cáceres, with a total of 320 parking spaces for bicycles, which allow for the orderly storage of these personal mobility vehicles and optimises urban pedestrian traffic space. This provision of infrastructure for cyclists is relatively recent in the fabric of the city [66], although it is considered insufficient to meet the sustainability criteria formulated by this indicator.
In Figure 4, it can be seen that both in the area under study (PCH) and on the edge of the built environment of the municipality, the accessibility of bicycle parking facilities for citizens is far from the targets set as minimum or desirable evaluation parameters.
In this sense, it is suggested it would be highly recommendable to improve the cycling infrastructure by, on the one hand, including more km of cycle lanes in the city centre and, on the other hand, increasing the number of bicycle parking spaces through an orderly and practical spatial distribution for the citizen.

4.1.3. Accessibility to Green Areas

The city of Cáceres has almost two million m2 of green areas, which has placed it among the five best Spanish cities in environmental matters according to data obtained from the Sustainability Observatory in its 2018 report [67]. The Extremadura municipality has a wide range of green areas per inhabitant: 2 parks with a surface area of more than 10 ha (Prince’s Park/Parque del Príncipe and Olivar de los Frailes), in addition to 38 green spaces of more than 1000 m2, which means a considerable diversity of fauna and flora. In addition, it enjoys a proportion of green areas per inhabitant of around 20 m2, double the healthy minimum (10 m2) and above the ratio of 10 to 15 m2 of urban green area per inhabitant considered for decades as an accepted parameter following the publication of WHO technical report No. 297 [68].
However, despite having an excellent ratio of tree mass per inhabitant, when the methodology for calculating the indicator is used, it can be seen that in terms of accessibility to green areas, the results do not show that there is adequate proximity to such a formidable natural heritage (Figure 5).
Figure 5a shows the value obtained from the calculation of the accessibility of the population to four different types of green spaces depending on the size and the travel distance considered for each one. It can be seen that it is extremely difficult for citizens to have simultaneous access to all types of green spaces analysed simultaneously. Therefore, the minimum value of the parameter shown in Figure 5b is adopted as a representative value for this indicator (accessibility to three of the four defined green spaces is analysed for the entire population residing in the study area). Thanks to the generation of the maps, the results obtained are better in the PCH than in the city as a whole.

4.1.4. Distance to Different Waste Separate Collection Rubbish Bins

From the data provided by the City Council of Cáceres, it can be seen that in the last fifteen years, the selective collection figures in the city have increased favourably so that the values provided for the most common fractions have increased as follows (measured in kg/inhabitant): paper and cardboard (14.48), glass (5.79), plastic, metal, and cartons (12.17), which has meant almost doubling and tripling the initial reference values, as can be seen in Figure 6.
These contribution figures are very high, reflecting the good participation of Cáceres citizens in selective collection. It also shows an effective improvement in the city’s environment with policies to care for the environment and promote awareness of a circular economy.
As shown in Figure 7, the separate collection of municipal waste at the city-wide level occurs adequately. Therefore, the system chosen by the municipality functions with solvency since it is observed that the percentage of the proximity of the population to the separate collection points mostly exceeds the minimum 80% required in the range of the system, except for the collection of oil and used clothes (Figure 7e,f).
However, the PCH area does not have very high coverage concerning selective collection points. This can be explained by the fact that in the old town of Cáceres, there is a service known as “quita y pon”/“place and pick”, in which the inhabitants deposit their waste in front of their houses at 8 p.m. and the municipal concessionaire removes it from the streets at 10 a.m. This service is not included in the initial cartographic information used in the study. This service is not included in the initial cartographic information used in the study.

4.1.5. Geographical Accessibility to Household Waste Recy-Cling Center (HWRC)

The city of Cáceres has proceeded to locate various HWRCs available to residents (both mobile and fixed) to facilitate the recycling of a series of waste that is not usually collected or treated adequately and previously ended up in a landfill without any type of use, generating the consequent environmental pollution. This type of waste includes, among others, the following: lamps, mattresses, packaging, bulky items, wood, metals and scrap metal, large household appliances, electrical and electronic equipment, vegetable oil (maximum 10 L), light bulbs, crockery, and fluorescent tubes. These HWRCs only accept waste generated by private individuals and not of industrial origin.
Applying the work methodology described in 3.5 using GIS tools, the results shown in Figure 8 are obtained:
Figure 8 shows that in the scope of the HCP, almost 100% of the population has access to HWRCs at a distance of less than 600 m. In the case study of the entire city, this figure is slightly lower, although the coverage figures are reasonable.

4.1.6. Accessibility to Public Services

Figure 9 shows that access to public facilities is unbalanced in the city of Cáceres. In fact, in the PCH area, the desired value of coverage in facilities such as health, culture, or administration is reached, given that there is a concentration of museums, monuments, and other public facilities in the historic centre of the city.
On the contrary, it can be observed that outside the area of the PCH, the percentages of coverage of cultural facilities are not as excellent, which would suggest that it would be advisable to improve access at the level of the municipality as a whole. In addition, it can be seen that there are adequate sports facilities on the edge of the built environment, but not in the inner area of the PCH, where the percentages are low. This can be explained by the fact that in the city centre, there are gyms and private sports activities not included in our baseline data. In any case, health and educational facilities have appropriate spatial coverage.

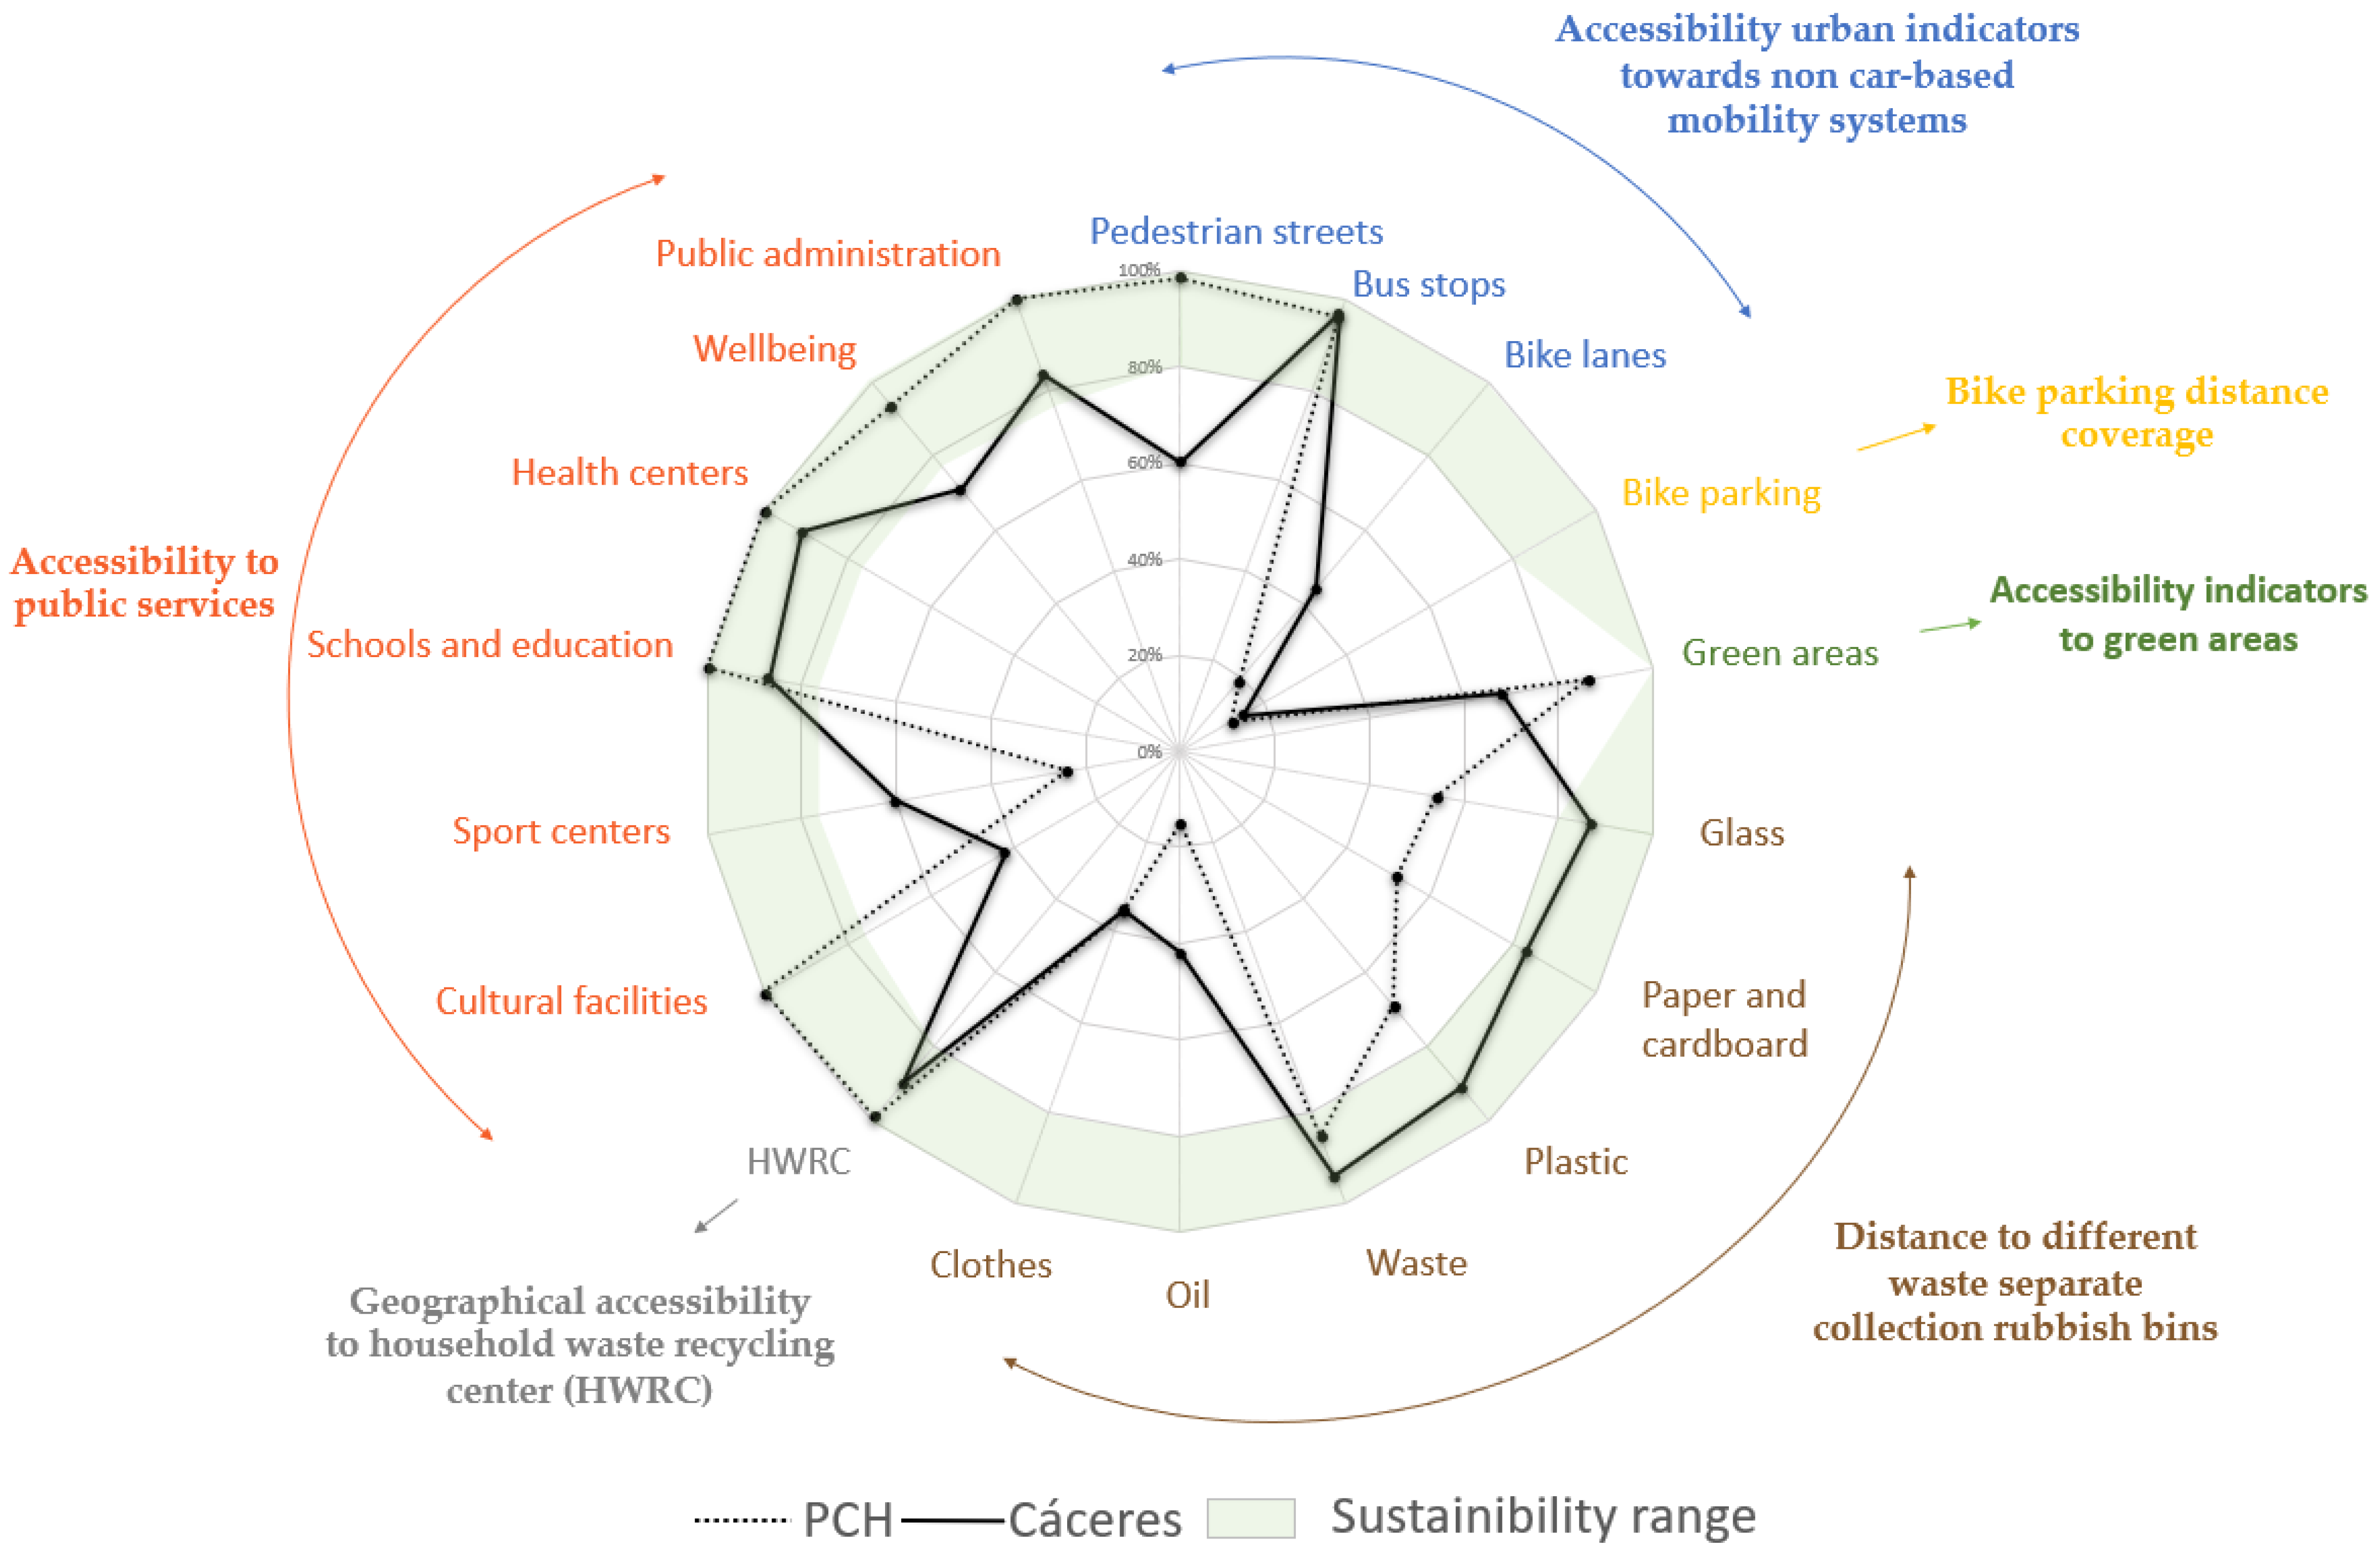
4.2. Global Numerical Results

The results of the indicators calculated using Equations (1)–(6) presented in Section 3 and the GIS tools are shown below. Table 6 summarises all the indicators analysed, as well as the parameters used in the numerical calculation of each one of them. It also shows the minimum and ideal range of values for each indicator to be considered sustainable. Finally, the results are presented for the two study areas analysed: PCH and the entire city of Cáceres.
From the analysis of results presented in Table 6, it can be seen that the Pnetworks indicator within the area that makes up the PCH would be the minimum premise of 80% of the population having simultaneous access to two means of transport, in this case pedestrian streets and bus stops, with access to cycle lanes being merely testimonial, with a very low percentage (19%). On the other hand, in the whole city, although the spatial coverage of bus stops is optimal and access to cycle lanes is significantly increased, the population that has access to pedestrian streets and is relatively close to them is considerably reduced, which means that the minimum value established for this indicator is not reached. From the sustainability point of view, a substantial improvement in this parameter would be based on focusing attention on increasing the number of areas dedicated to bicycle traffic, improving the network at a city-wide level, and encouraging the use of shared paths between pedestrians and cyclists in the historic centre wherever universal accessibility conditions allow [69]. On the other hand, although it has been shown that the spatial coverage in terms of bus stops is optimal, it would be appropriate to consider an aspect not considered in this analysis but which is essential for citizens with reduced mobility problems, namely improving accessibility to public transport in the city, the study of which has been described in [70].
If we consider the values obtained in the Pbike indicator and in line with the results of the Pnetworks indicator, we can see that there is a noticeable deficit of infrastructure for bicycle parking, specifically one space for every 300 registered inhabitants in the city of Cáceres. A proposal to consolidate this sustainable means of transport would be based on the creation and provision of new bicycle parking areas, analysing the areas of the city with the worst coverage and focusing on implementation at key points such as the PCH, busy workplaces (public administrations), as well as cultural, educational, health or leisure facilities, supermarkets, and green areas near the cycle lanes.
In the case of the Pgreen indicator, Table 6 shows that in Cáceres, only 68% of the resident population has simultaneous access to 3 types of green spaces. However, in the area under study (PCH), the results are more encouraging, increasing to 86%. As formulated in the Pgreen indicator, for a city to be considered sustainable, a minimum of 100% of the population needs to have simultaneous access to 3 types of green spaces, an aspect that is not met but whose parameters are closer in the PCH than at the level of the whole city. The figures given in Table 6 refer to the calculation exclusively considering the minimum range. It can be seen that the minimum is not satisfied; this would automatically mean that the desired value would no longer be reached. A possible solution for improvement would be the creation/extension of green areas in the eastern part of the city, which would allow for greater spatial coverage and an improvement in the spatial planning of green spaces.
The calculation of the Pfraction indicator shows a diverse range of results. What is considered conclusive is that, at the city-wide level, there is adequate spatial coverage for the population in the case of the glass, paper, packaging, and organic fractions. However, new collection points for waste oil and used clothes should be provided in certain city areas. The analysis of the PCH shows that except for the organic waste fraction, which fulfils the minimum value of the indicator (80% of the population is within 150 m of the selective collection point of the fraction), the rest of the values obtained are proportionally low. However, this fact is conditioned by the “place and pick” collection system developed within the historic centre of the city and has not been considered in the spatial analysis. Its inclusion would automatically lead to an improvement in the results obtained. In addition, recent public information indicates that the local administration intends to implement in the short term the “door-to-door” service of selective waste collection in the area of the Monumental City. This aspect would make it possible to reduce distances (collection in the building itself), free the public space of waste collectors and achieve better selective collection results.
In the case of the analysis of the accessibility to HWRCs, parameter Precyclingcentre the area covered by the PCH is close to the optimum value (99%). The entire city is also at very high levels (90%). Therefore, in this case, both results exceed the established minimum value of spatial coverage. The city is considered to have very satisfactory values from the point of view of urban sustainability.
Corresponding to the analysis of accessibility to public services Pfacilities, in the case of the PCH, it is observed that the inhabitants have almost complete spatial coverage to all services. The data show that 100% of the population has access to cultural, educational, health, and public administration facilities and 93.8% to social welfare services. An exception is seen in the analysis of the accessibility of sports centres, which presents very low values and whose existence is logically complicated in the case of a consolidated historic centre. From the results obtained at the level of the entire city, it can be pointed out that educational, health, and public administration facilities are between the minimum and ideal range of values. However, a low figure is observed concerning cultural facilities (42%), given that they are mostly located in the PCH. Considering the facilities used for social welfare, we see that the minimum value designated for this indicator is almost reached, but it would not be fulfilled by a low percentage (only 4%). A case apart is the sports facilities which, although their results have improved with respect to the PCH, still do not reach the minimum value established. As clear proposals to raise the value of this indicator, the provision of a greater number of sports facilities is proposed, as well as facilitating the location of cultural facilities outside the area of the PCH.
Finally, once all the indicators studied have been discussed, a graph (Figure 10) is provided in addition to Table 6, which shows the parameters under study, the elements analysed, and visually defines the results achieved both within the PCH (shown in red) and at the level of the entire city (shown in black).
As can be seen, the analysis of the six sustainability indicators of the research carried out in the article is finally represented using a spiderweb diagram that allows the differences between the two study areas analysed for each parameter evaluated to be easily detected. The Urban accessibility toward non-car-based mobility systems is shown in blue. The results are presented for each transport alternative analysed: pedestrian streets, urban bus stops, and cycling mobility network. The Bike parking coverage (yellow) and Accessibility to green areas (green) are also illustrated. In the case of the calculation of the Distance to different waste separate collection rubbish bins (brown colour), each of the analysed fractions is defined: glass, paper and cardboard, plastic, waste, oil, and clothes. If the Geographical accessibility to household waste recycling centres (HWRC) is considered, it appears in Figure 9 in grey. Finally, Accessibility to public services is mentioned (in orange), which describes the results obtained concerning cultural facilities, sports centres, schools and education, health centres, wellbeing, and public administration.
Examining Figure 10 from a global point of view, it could be stated that concerning mobility and accessibility to urban services in the municipality of Cáceres, within the area covered by the PCH, the level of sustainability achieved is within a range of ideal values, except for infrastructures for active mobility by bicycle, sports centres, and selective waste collection. On the other hand, at the whole city level, the results are slightly below the PCH, with some exceptions where higher figures can be seen, such as the different fractions of selective collection, bicycle parking, and sports centres. Given the above comments, it is clear which would be the weaknesses and strengths of the World Heritage City of Cáceres, and which aspects should be addressed to achieve an appreciable improvement in the sustainability parameters analysed in terms of mobility and accessibility to the main urban services provided.
In [71], the Spanish Strategy for Urban Sustainability (EESUL) states that public administrations should promote R + D + I in the field of urban planning and urban policies by allocating sufficient resources and means to this end, placing special emphasis on the development of reference frameworks, instruments, and indicators for the empirical evaluation of the quality of life and urban space at all scales and in all its dimensions, to continuously renew and feedback the criteria of urban policies on an objective basis. Likewise, in the General Regulations of the Law on Sustainable Land and Urban Planning of Extremadura [72], it is stated that sustainability indicators are tools to be used as planning instruments for the evaluation of urban models, considering minimum standards or objectives to be achieved, and defining aspects such as accessibility to basic services or public facilities and their spatial coverage, among others. Throughout the study presented in this article, the intrinsic relationship between territory and mobility is aptly analysed in [73]. Similarly, a study using GIS tools in spatial patterns of urban mobility based on the calculation of sustainability indicators is developed in [74].
Sustainability analysis is key to urban planning and sometimes focuses on applying methodologies that use useful indicator systems to develop qualitative and quantitative descriptors of urban environments [75]. Indicators have been the most influential measurement tool in urban sustainability, even though discrepancies between expert-led and citizen-led models have fuelled much debate in the literature [76]. European Commission in [77] refers to urban sustainability indicators as tools that enable urban planners, municipal technicians, and policymakers to measure the socio-economic and environmental impact of current urban designs, infrastructures, policies, waste disposal systems, pollution, and accessibility of services to citizens. They also offer the diagnosis of certain problems and the identification of areas that could benefit from actions funded by municipalities through good public governance in balance with scientific-technical criteria, making it feasible for cities to quantify the success and impact of sustainability interventions.
Measuring sustainability through urban indicators is an integral part of decision-making processes to promote sustainable development at the local level [78]. In this sense, at the international level, a normative approach was proposed based on using indicators to measure the performance management of city services and quality of life [79]. This led to some research, such as that developed in [80], which indicates that further research is needed to determine aspects of city comparability and methods for linking urban sustainability indicators (USIs) data to government decision making to achieve sustainability outcomes. The concept of sustainability is growing in importance for local urban governance, and indicator-based assessments represent a popular means for its implementation [81]. Indicators are a powerful tool to address urban sustainability issues and have gained increasing attention [82]. However, making them a universal ‘language’ to solve this global problem remains a challenge and a controversy.

5. Conclusions

This article develops an analysis of urban sustainability through indicators in the World Heritage city of Cáceres in terms of mobility and accessibility to public services, allowing us to detect the existing shortcomings at the level of the whole city and the monumental environment (PCH). The study shows that the city is in an appropriate range of sustainability values regarding most of the parameters, with some room for improvement in some of the indicators analysed. It can be concluded that the sustainability analysed in the city of Cáceres in the areas under study offers very good results in the following parameters: accessibility to bus stops, organic waste containers, HWRC, schools and education, health centres, and public administration. However, the following should be improved: bike parking coverage and lanes, clothes and oil fraction, and sports centres. It is striking that the study areas analysed present very similar values, not influenced by the fact that one of the areas is a consolidated historical site. It can be seen that the values are higher in the PCH zone in terms of accessibility to public services, except for sports facilities.
Concerning the methodologies used to carry out the sustainability analysis, this article, in addition to the indicators selected for the calculation, provides the generation of accessibility maps using GIS tools that allow a better analysis of the results.
This research has allowed to fill some gaps in the topic addressed. Mainly, it should be noted that the generation of maps using GIS tools enhances and complements the results obtained numerically for each of the sustainability indicators analysed. However, the main limitation of this methodology consists in the need to have a considerable amount of initial starting data to be able to carry out the research, based on access to digitalised basic cartography in different formats, as well as census data on the distribution of the population, the exact location of the different municipal services to be analysed in each indicator, etc. This work could be improved by following two different paths. One would evaluate the city from another point of view using indicators that contemplate the urban analysis related to land occupation, habitability, and public space. The other would bet on replicating similar investigations in other cities as long as the necessary starting data were available.
Finally, the analysis of sustainability through urban indicators is considered a valuable source of information for the local manager, becoming a real planning tool in medium-sized cities, which would allow the establishment of the appropriate guidelines for action in the case of obtaining inappropriate sustainability parameters.
The authors state with particular interest that this type of analysis could be carried out in medium-sized World Heritage Site cities, due to their high historical value, to make these city areas more dynamic and preserve them from the view of sustainability to avoid the gentrification and touristification processes.

Author Contributions

M.J.-E. and A.C. conceived and designed the research. M.L.B. performed the calculations with SIG. M.J.-E. and A.C. wrote and revised the paper. M.L.B. edited the Maps with QGIS. M.J.-E., A.C. and M.L.B. made formal analysis. M.J.-E. and A.C. supervised the paper. All authors have read and agreed to the published version of the manuscript.

Funding

The work of AC was partially funded by the Spanish Ministry of Science and Innovation under the Project Massive Geospatial Data Storage and Processing for Intelligent and Sustainable Urban Transportation PID2019-105221RB. This publication has been made possible thanks to funding granted by the Consejería de Economía, Ciencia y Agenda Digital de la Junta de Extremadura, and by the European Regional Development Fund of the European Union through the contribution to the COMPHAS and KRAKEN research group under reference GR21159 and GR21074.

Institutional Review Board Statement

Not applicable.

Informed Consent Statement

Not applicable.

Acknowledgments

We would like to formally express our gratitude to José Cáceres Merino for his altruistic collaboration and support in revising the language. We would also like to thank the technical staff of the City Council of Cáceres, especially Luis Álvarez Llorente and Faustino Cordero Montero (responsible for the GIS service), for their kind attention.

Conflicts of Interest

The authors declare no conflict of interest.

References

  1. Brundtland, G.H. Report of the World Commission on Environment and Development: Our Common FutureNo Title; United Nations: New York, NY, USA, 1987. [Google Scholar]
  2. Sharifi, A. Urban sustainability assessment: An overview and bibliometric analysis. Ecol. Indic. 2021, 121, 107102. [Google Scholar] [CrossRef]
  3. United Nations. Transforming Our World: The 2030 Agenda for Sustainable Development; United Nations: New York, NY, USA, 2015; Available online: https://sustainabledevelopment.un.org/post2015/transformingourworld (accessed on 30 April 2022).
  4. Europeam Commission. Cities of Tomorrow. Challenges, Visions, Ways Forward; Office of the Europeam Union: Brussels, Belgium, 2011; ISBN 9789279213076.
  5. United Nations (Habitat III). New Urban Agenda; United Nations: Quito, Ecuador, 2017; ISBN 9789211327311. [Google Scholar]
  6. Shen, L.Y.; Ochoa, J.J.; Shah, M.N.; Zhang, X. The application of urban sustainability indicators—A comparison between various practices. Habitat Int. 2011, 35, 17–29. [Google Scholar] [CrossRef]
  7. Bell, S.; Morse, S. Sustainability Indicators: Measuring the Immeasurable? 2nd ed.; Routledge: London, UK, 2012; ISBN 9781849772723. [Google Scholar]
  8. Muñoz, M.D.; Cantergiani, C.C.; García, M.S.; Quezada, C.R.; Martínez, S.G. Propuesta de un sistema de indicadores de sostenibilidad para la movilidad y el transporte urbanos. Aplicación mediante SIG a la ciudad de Alcalá de Henares. Cuad. Geogr. 2007, 8, 31–49. [Google Scholar]
  9. Dall’O, G.; Bruni, E.; Panza, A.; Sarto, L.; Khayatian, F. Evaluation of cities’ smartness by means of indicators for small and medium cities and communities: A methodology for Northern Italy. Sustain. Cities Soc. 2017, 34, 193–202. [Google Scholar] [CrossRef]
  10. ICOMOS. Criterios de Conservación del Patrimonio Arquitectónico del s.XX, Documento de Madrid; ICOMOS: Paris, France, 2011; pp. 98–104. [Google Scholar]
  11. Hugony, C.; Cladera, J.R. Indicadores para la evaluación de las ciudades históricas. ACE Arquit. City Environ. 2008, 8, 219–238. [Google Scholar] [CrossRef]
  12. Leus, M.; Verhelst, W. Sustainability assessment of urban heritage sites. Buildings 2018, 8, 107. [Google Scholar] [CrossRef] [Green Version]
  13. Del Espino Hidalgo, B. Assessing sustainability within territorial and urban heritage: An indicator-based evaluation in the case of medium-sized cities in inner Andalusia. J. Cult. Herit. Manag. Sustain. Dev. 2019, 9, 121–132. [Google Scholar] [CrossRef]
  14. Bibri, S.E. On the sustainability of smart and smarter cities in the era of big data: An interdisciplinary and transdisciplinary literature review. J. Big Data 2019, 6, 64. [Google Scholar] [CrossRef] [Green Version]
  15. USGS. What Is a Geographic Information System (GIS)? Available online: https://www.usgs.gov/faqs/what-geographic-information-system-gis (accessed on 5 April 2022).
  16. Geographic Information Systems (GIS). Available online: https://earthdata.nasa.gov/learn/gis (accessed on 5 April 2022).
  17. Băneş, A.; Orboi, M.-D.; Monea, A.; Monea, M. Sustainable Development By Gis. Res. J. Agric. Sci. 2010, 42, 2010. [Google Scholar]
  18. Abebe, M.T.; Megento, T.L. Urban green space development using GIS-based multi-criteria analysis in Addis Ababa metropolis. Appl. Geomat. 2017, 9, 247–261. [Google Scholar] [CrossRef]
  19. Lahoti, S.; Kefi, M.; Lahoti, A.; Saito, O. Mapping methodology of public urban green spaces using GIS: An example of Nagpur City, India. Sustainability 2019, 11, 2166. [Google Scholar] [CrossRef] [Green Version]
  20. Cardone, B.; Di Martino, F. A fuzzy rule-based gis framework to partition an urban system based on characteristics of urban greenery in relation to the urban context. Appl. Sci. 2020, 10, 8781. [Google Scholar] [CrossRef]
  21. Keleş, E.; Atik, D.; Bayrak, G. Visual Landscape Quality Assessment in Historical Cultural Landscape Areas. Eur. J. Sustain. Dev. 2018, 7, 287–300. [Google Scholar] [CrossRef] [Green Version]
  22. Statuto, D.; Cillis, G.; Picuno, P. Visual quality indicators for assessing landscape characteristics and managing its protection. In Proceedings of the Public Recreation and Landscape Protection, Online, 13–15 May 2019. [Google Scholar]
  23. Buendía, A.V.P.; Pérez-Albert, Y.; Giné, D.S. Mapping landscape perception: An assessment with public participation geographic information systems and spatial analysis techniques. Land 2021, 10, 632. [Google Scholar] [CrossRef]
  24. Martínez, M.; Rojas, C.; Condeço-Melhorado, A.; Carrasco, J.A. Accessibility Indicators for the Geographical Assessment of Transport Planning in a Latin American Metropolitan Area. Geographies 2021, 1, 124–142. [Google Scholar] [CrossRef]
  25. Cáceres 3D. Available online: https://ide.caceres.es/caceresview3d/ (accessed on 4 April 2022).
  26. Old Town of Cáceres—UNESCO World Heritage Centre. Available online: https://whc.unesco.org/en/list/384/ (accessed on 4 April 2022).
  27. Gobierno de España. Sistema de Indicadores y Condicionantes para Ciudades Grandes y Medianas; Gobierno de España: Madrid, Spain, 2010. [Google Scholar]
  28. Merino-Saum, A.; Halla, P.; Superti, V.; Boesch, A.; Binder, C.R. Indicators for urban sustainability: Key lessons from a systematic analysis of 67 measurement initiatives. Ecol. Indic. 2020, 119, 106879. [Google Scholar] [CrossRef]
  29. Macedo, J.; Rodrigues, F.; Tavares, F. Urban sustainability mobility assessment: Indicators proposal. Energy Procedia 2017, 134, 731–740. [Google Scholar] [CrossRef]
  30. Stylianidis, E.; Karanikolas, N.; Kaimaris, D. A GIS for urban sustainability indicators in spatial planning. Int. J. Sustain. Dev. Plan. 2012, 7, 1–13. [Google Scholar] [CrossRef]
  31. Lessa, D.A.; Lobo, C.; Cardoso, L. Accessibility and urban mobility by bus in Belo Horizonte/Minas Gerais—Brazil. J. Transp. Geogr. 2019, 77, 1–10. [Google Scholar] [CrossRef]
  32. Corazza, M.V.; Favaretto, N. A methodology to evaluate accessibility to bus stops as a contribution to improve sustainability in urban mobility. Sustainability 2019, 11, 803. [Google Scholar] [CrossRef] [Green Version]
  33. Da Martins, M.C.; da Silva, A.N.R.; Pinto, N. An indicator-based methodology for assessing resilience in urban mobility. Transp. Res. Part D Transp. Environ. 2019, 77, 352–363. [Google Scholar] [CrossRef]
  34. De Oliveira Souza, C.; Guimarães, G.V.; da Cruz Saldanha, L.E.; do Nascimento, F.A.C.; dos Santos, T.F.; da Silva, M.A.V. Analysis of job accessibility promoted by ride hailing services: A proposed method. J. Transp. Geogr. 2021, 93, 103048. [Google Scholar] [CrossRef]
  35. González, R.M.; Román, C.; Marrero, Á.S. Visitors’ attitudes towards bicycle use in the Teide National Park. Sustainability 2018, 10, 3283. [Google Scholar] [CrossRef] [Green Version]
  36. Diez, C.; Palanca, J.; Sanchez-Anguix, V.; Heras, S.; Giret, A.; Julián, V. Towards a persuasive recommender for bike sharing systems: A defeasible argumentation approach. Energies 2019, 12, 662. [Google Scholar] [CrossRef] [Green Version]
  37. Pröbstl-Haider, U.; Lund-Durlacher, D.; Antonschmidt, H.; Hödl, C. Mountain bike tourism in Austria and the Alpine region–towards a sustainable model for multi-stakeholder product development. J. Sustain. Tour. 2018, 26, 567–582. [Google Scholar] [CrossRef]
  38. Tao, J.; Zhou, Z. Evaluation of Potential Contribution of Dockless Bike-sharing Service to Sustainable and Efficient Urban Mobility in China. Sustain. Prod. Consum. 2021, 27, 921–932. [Google Scholar] [CrossRef]
  39. Priess, J.; Pinto, L.V.; Misiune, I.; Palliwoda, J. Ecosystem service use and the motivations for use in central parks in three European cities. Land 2021, 10, 154. [Google Scholar] [CrossRef]
  40. Du, M.; Zhang, X. Urban greening: A new paradox of economic or social sustainability? Land Use Policy 2020, 92, 104487. [Google Scholar] [CrossRef]
  41. Jiao, H.; Li, C.; Yu, Y.; Peng, Z. Urban public green space equity against the context of high-speed urbanization in Wuhan, central China. Sustainability 2020, 12, 9394. [Google Scholar] [CrossRef]
  42. Guo, R.; Song, X.; Li, P.; Wu, G.; Guo, Z. Large-Scale and Refined Green Space Identification-Based Sustainable Urban Renewal Mode Assessment. Math. Probl. Eng. 2020, 2020, 2043019. [Google Scholar] [CrossRef]
  43. Campagnaro, T.; Sitzia, T.; Cambria, V.E.; Semenzato, P. Indicators for the planning and management of urban green spaces: A focus on public areas in Padua, Italy. Sustainability 2019, 11, 7071. [Google Scholar] [CrossRef] [Green Version]
  44. Chen, N.; Wang, C.-H. Does green transportation promote accessibility for equity in medium-size U.S. cites? Transp. Res. Part D Transp. Environ. 2020, 84, 102365. [Google Scholar] [CrossRef]
  45. Giuliani, G.; Petri, E.; Interwies, E.; Vysna, V.; Guigoz, Y.; Ray, N.; Dickie, I. Modelling accessibility to urban green areas using open earth observations data: A novel approach to support the urban SDG in four european cities. Remote Sens. 2021, 13, 422. [Google Scholar] [CrossRef]
  46. Fogarty, E.; Clarke, B.; Ross, K.E. Investigating food waste recycling in local food service businesses: A case study from a local government area in Australia. Sustainability 2021, 13, 3846. [Google Scholar] [CrossRef]
  47. Laso, J.; García-Herrero, I.; Margallo, M.; Bala, A.; Fullana-I-Palmer, P.; Irabien, A.; Aldaco, R. LCA-Based Comparison of Two Organic Fraction Municipal Solid Waste Collection Systems in Historical Centres in Spain. Energies 2019, 12, 1407. [Google Scholar] [CrossRef] [Green Version]
  48. Pérez, J.; Lumbreras, J.; de la Paz, D.; Rodríguez, E. Methodology to evaluate the environmental impact of urban solid waste containerization system: A case study. J. Clean. Prod. 2017, 150, 197–213. [Google Scholar] [CrossRef]
  49. Pires, A.; Sargedas, J.; Miguel, M.; Pina, J.; Martinho, G. A case study of packaging waste collection systems in Portugal—Part II: Environmental and economic analysis. Waste Manag. 2017, 61, 108–116. [Google Scholar] [CrossRef]
  50. Mwanza, B.G.; Mbohwa, C.; Telukdarie, A.; Medoh, C. Road to sustainable manufacturing: Why households are not participating in recycling programs in Ndola, Zambia? Procedia Manuf. 2019, 33, 578–585. [Google Scholar] [CrossRef]
  51. Mwanza, B.G.; Mbohwa, C.; Telukdarie, A. Levers Influencing Sustainable Waste Recovery at Households Level: A Review. Procedia Manuf. 2018, 21, 615–622. [Google Scholar] [CrossRef]
  52. Shi, K.; Zhou, Y.; Zhang, Z. Mapping the research trends of household waste recycling: A bibliometric analysis. Sustainability 2021, 13, 6029. [Google Scholar] [CrossRef]
  53. Ng, K.S.; To, L.S. A systems thinking approach to stimulating and enhancing resource efficiency and circularity in households. J. Clean. Prod. 2020, 275, 123038. [Google Scholar] [CrossRef]
  54. Zhao, Y.; Zhang, G.; Lin, T.; Liu, X.; Liu, J.; Lin, M.; Ye, H.; Kong, L. Towards sustainable urban communities: A composite spatial accessibility assessment for residential suitability based on network big data. Sustainability 2018, 10, 4767. [Google Scholar] [CrossRef] [Green Version]
  55. Speizer, I.S.; Calhoun, L.M.; McGuire, C.; Lance, P.M.; Heller, C.; Guilkey, D.K. Assessing the sustainability of the Nigerian urban reproductive health initiative facility-level programming: Longitudinal analysis of service quality. BMC Health Serv. Res. 2019, 19, 559. [Google Scholar] [CrossRef] [PubMed]
  56. Yenisetty, P.T.; Bahadure, P. Measuring accessibility to various ASFs from public transit using spatial distance measures in indian cities. ISPRS Int. J. Geo-Inf. 2020, 9, 446. [Google Scholar] [CrossRef]
  57. Imran, M.; Sumra, K.; Abbas, N.; Majeed, I. Spatial distribution and opportunity mapping: Applicability of evidence-based policy implications in Punjab using remote sensing and global products. Sustain. Cities Soc. 2019, 50, 101652. [Google Scholar] [CrossRef]
  58. Loach, K.; Rowley, J. Cultural sustainability: A perspective from independent libraries in the United Kingdom and the United States. J. Librariansh. Inf. Sci. 2022, 54, 80–94. [Google Scholar] [CrossRef]
  59. Haghighi Fard, S.M.; Doratli, N. Evaluation of Resilience in Historic Urban Areas by Combining Multi-Criteria Decision-Making System and GIS, with Sustainability and Regeneration Approach: The Case Study of Tehran (IRAN). Sustainability 2022, 14, 2495. [Google Scholar] [CrossRef]
  60. Gutting, R.; Gerhold, M.; Rößler, S. Spatial accessibility in urban regeneration areas: A population-weighted method assessing the social amenity provision. Urban Plan. 2021, 6, 189–201. [Google Scholar] [CrossRef]
  61. Bartzokas-Tsiompras, A.; Photis, Y.N.; Tsagkis, P.; Panagiotopoulos, G. Microscale walkability indicators for fifty-nine European central urban areas: An open-access tabular dataset and a geospatial web-based platform. Data Brief 2021, 36, 107048. [Google Scholar] [CrossRef]
  62. Kara, C.; Doratlı, N. Predict and Simulate Sustainable Urban Growth by Using GIS and MCE Based CA. Case of Famagusta in Northern Cyprus. Sustainability 2021, 13, 4446. [Google Scholar] [CrossRef]
  63. World Health Organization. Urban Green Spaces and Health: A Review of Evidence. 2016. Available online: https://www.euro.who.int/__data/assets/pdf_file/0005/321971/Urban-green-spaces-and-health-review-evidence.pdf (accessed on 30 April 2022).
  64. European Environment Agency. Towards an Urban Atlas. Assessment of Spatial Data on 25 European Cities and Urban Areas; Environmental Issue Report; European Environment Agency: Copenhagen, Denmark, 2002; pp. 1–9.
  65. Agencia de Evaluación y calidad. La Importancia de Los Servicios Públicos en el Bienestar de Los Ciudadanos; El Ministerio de Hacienda y Administraciones Públicas de España: Madrid, Spain, 2013; pp. 1–114. [Google Scholar]
  66. Plasencia-Lozano, P. Evaluation of a new urban cycling infrastructure in caceres (Spain). Sustainability 2021, 13, 1910. [Google Scholar] [CrossRef]
  67. Observatorio de la Sostenibilidad. Available online: https://www.observatoriosostenibilidad.com/informes/ (accessed on 21 March 2022).
  68. World Health Organization. Informe Técnico No 297: Cuestiones de Higiene del Medio Relacionadas con la Ordenación Urbana y la Urbanización; World Health Organization: Geneva, Switzerland, 1965. [Google Scholar]
  69. Fernandez-Nicolas, J.A.; Jimenez-Espada, M. Restructuring of A Walled Enclosure Almohade to an Urban Universally Accessible Area: The Historical City of Cáceres. Available online: https://iopscience.iop.org/article/10.1088/1757-899X/471/9/092086/pdf (accessed on 30 April 2022).
  70. Jiménez-Espada, M.; González-Escobar, R. Research on the problem of universal accessibility in urban public transport. Case study: The city of Cáceres. Transp. Res. Procedia 2021, 58, 21–28. [Google Scholar] [CrossRef]
  71. Gobierno de España. Estrategia Española de Sostenibilidad Urbana y Local (Eesul); Gobierno de España: Madrid, Spain, 2011. [Google Scholar]
  72. Rural, D.; Extremadura, D. DECRETO 143/2021, de 21 de Diciembre, por el que se Aprueba el Reglamento General de la Ley de Ordenación Territorial y Urbanística Sostenible de Extremadura. Diario Oficial de Extremadura. 21 December 2021, pp. 61778–62041. Available online: https://vlex.es/vid/decreto-143-2021-21-879403465 (accessed on 22 March 2022).
  73. Ariza-Álvarez, A.; Soria-Lara, J.A.; Arce-Ruiz, R.M.; López-Lambas, M.E.; Jimenez-Espada, M. Experimenting with scenario-building narratives to integrate land use and transport. Transp. Policy 2021, 101, 57–70. [Google Scholar] [CrossRef]
  74. García-Ayllón, S.; Kyriakidis, P. Spatial Analysis of Environmental Impacts Linked to Changes in Urban Mobility Patterns during COVID-19: Lessons Learned from the Cartagena Case Study. Land 2022, 11, 81. [Google Scholar] [CrossRef]
  75. Garau, C.; Pavan, V.M. Evaluating urban quality: Indicators and assessment tools for smart sustainable cities. Sustainability 2018, 10, 575. [Google Scholar] [CrossRef] [Green Version]
  76. Turcu, C. Re-thinking sustainability indicators: Local perspectives of urban sustainability. J. Environ. Plan. Manag. 2013, 56, 695–719. [Google Scholar] [CrossRef] [Green Version]
  77. Indicators for Sustainable Cities Environment; Science for Environment Policy: Brussels, Belgium, 2015. [CrossRef]
  78. Jones, N.; Malesios, C.; Aloupi, M.; Proikaki, M.; Tsalis, T.; Hatziantoniou, M.; Dimitrakopoulos, P.G.; Skouloudis, A.; Holtvoeth, J.; Nikolaou, I.; et al. Exploring the role of local community perceptions in sustainability measurements. Int. J. Sustain. Dev. World Ecol. 2019, 26, 471–483. [Google Scholar] [CrossRef]
  79. ISO 37120:2018; Sustainable Cities and Communities—Indicators for City Services and Quality of Life. International Organization for Standardization: Geneva, Switzerland, 2018. Available online: https://www.iso.org/standard/68498.html (accessed on 7 March 2022).
  80. Deng, D.; Liu, S.; Wallis, L.; Duncan, E.; McManus, P. Urban Sustainability Indicators: How do Australian city decision makers perceive and use global reporting standards? Aust. Geogr. 2017, 48, 401–416. [Google Scholar] [CrossRef]
  81. Halla, P.; Merino-Saum, A.; Binder, C.R. How to link sustainability assessments with local governance?—Connecting indicators to institutions and controversies. Environ. Impact Assess. Rev. 2022, 93, 106741. [Google Scholar] [CrossRef]
  82. Ruan, F.L.; Yan, L. Challenges facing indicators to become a universal language for sustainable urban development. Sustain. Dev. 2022, 30, 41–57. [Google Scholar] [CrossRef]
Figure 1. Geographical location of the study area: (a) Location of Cáceres in the region of Extremadura (Spain). (b) Orthoimage of the city of Cáceres and boundaries of the historic centre of Cáceres according to “Plan Cáceres Histórica” (marked with a white line). (c) panoramic view. (d) 3D imageof historic centre of Cáceres [25].
Buildings 12 00813 g001
Figure 2. Methodology flowchart.
Buildings 12 00813 g002
Figure 3. Maps of Accessibility to urban indicators towards non-car-based mobility systems: (a) pedestrian streets; (b) bus stops; (c) bike lanes.
Buildings 12 00813 g003aBuildings 12 00813 g003b
Figure 4. Map of accessibility to bike parking distance coverage.
Buildings 12 00813 g004
Figure 5. Maps of accessibility indicators to green areas: (a) distance to 4 types of park according to their area; (b) area covered by at least 3 types of parks.
Buildings 12 00813 g005
Figure 6. Annual evolution of the selective collection of paper and cardboard, glass and plastic, metal and carbon fractions in the city of Cáceres (kg/inhabitant).
Buildings 12 00813 g006
Figure 7. Maps of distance to different waste separate collection rubbish bins: (a) glass; (b) paper and cardboard; (c) plastic; (d) organic; (e) oil; (f) clothes.
Buildings 12 00813 g007aBuildings 12 00813 g007b
Figure 8. Map of geographical accessibility to household waste recycling centre (HWRC).
Buildings 12 00813 g008
Figure 9. Maps of accessibility to state-funded public services: (a) cultural facilities; (b) sports centres; (c) schools and education; (d) health centres; (e) wellbeing; public administration.
Buildings 12 00813 g009aBuildings 12 00813 g009b
Figure 10. Spider web diagram summarising the numerical results of the sustainability analysis in the city of Cáceres.
Buildings 12 00813 g010
Table 1. Data sources used for analysing sustainability indicators.
Sources of Data Web Links
Aerial Orthography National Plan of Spain (PNOA)https://pnoa.ign.es
IDE Cáceres http://ide.caceres.es/
Open Data Cácereshttp://opendata.ayto-caceres.es
Table 2. Analysed indicators (source: System of Indicators and Conditions for large and middle-sized cities).
ScopeMobility and ServicesGreen Areas and BiodiversityUrban
Metabolism
Social
Cohesion
IndicatorsUrban accessibility toward non-car-based mobility systemsAccessibility
to green areas
Distance to different waste separate
collection rubbish bins
Accessibility to
public services
Bike parking distance
Coverage
Geographical accessibility to household waste recycling
centre (HWRC)
Table 3. Other references of the sustainability indicators analysed in this work.
Sustainability IndicatorsReferences
Urban Accessibility[31,32,33,34]
Bike parking[35,36,37,38]
Green areas Accessibility[39,40,41,42,43,44,45]
Accessibility to waste separate collection rubbish bins[46,47,48,49]
Household waste recycling centre accessibility[20,50,51,52,53]
Public services accessibility[54,55,56,57,58]
Table 4. Conditions and values set for the calculation of the Pgreen indicator.
Green Space SurfaceDistance from the Population
>1.000 m2<200 m
>5.000 m2<750 m
>1 ha<2 km
>10 ha<4 km
Table 5. Public equipment and distances.
Typology of Public FacilitiesDistance 1 (m)
Cultural Monuments, museums, cinemas and theatres, libraries, buildings of interest, and exhibition centres300
SportsSports grounds600
Sports centres and sports facilities300
Educational Schools and children’s centres300
High schools, technology centres, and colleges600
Health Surgeries, hospitals, and pharmacies 600
Social welfare Residents Associations, Social Centres
and retirement homes
300
Administration Public buildings
(Town Hall and Cáceres Provincial Hall and Autonomous Government of Extremadura, State buildings)
600
1 Distance from the population (m).
Table 6. Results overview.
IndicatorsParametersResultsRange
PCHCáceresMinimumIdeal
Urban accessibility toward non-car-based mobility systemsPedestrian streetsPnetworks = (population covered by non-car-based mobility systems/total population)98%60%>80% of the population covered by at least two indicators100% of the population covered by at least two indicators
Bus stops96%97%
Bike lanes19%44%
Bike parking coveragePbike = (population covered by bike parking/total population)12%15%>80% of the population covered100% of the population covered
Accessibility to green areasPgreen = (population covered by at least 3 types of parks/total population)86%68%>100% of the population covered by at least 3 types100% of the population covered by 4 types
Distance to different waste separate collection rubbish binsGlassPfraction = (population covered by separate collection rubbish bins and general waste/total population)54%87%>80% of the population covered100% of the population covered or
Paper and cardboard52%83%
Plastic69%91%
Waste85%94%
Oil15%42%
Clothes35%35%
Geographical accessibility to household waste recycling centre (HWRC).Precyclingcenter = (population with access to HWRC/total population)99%90%>80% of the population covered100% of the population covered
Accessibility to
public services
Cultural facilities Pfacilities = (population covered by the facilities
/total population)
100%42%>75% of the population covered by all the
services
100% of the population covered by all the
services
Sport centres 24%60%
Schools and education100%87%
Health centres100%91%
Wellbeing93,8%71%
Public
administration
100%83%
Publisher’s Note: MDPI stays neutral with regard to jurisdictional claims in published maps and institutional affiliations.

