1. Introduction
The construction industry, like its counterparts, involves complexity due to its dynamic nature and ever-changing processes [
1]. The construction supply chain (CSC) deals with managing materials, information, and financial flows in a multi-stakeholder system. The key stakeholders include general contractors, subcontractors, and suppliers [
2,
3]. Among the construction process flows, information plays an essential role in the benefit of enterprises and in enabling supply chain integration [
4]. Construction processes are information-centric; the associated information is managed by actors involved in the process that directly affects the performance of CSCs [
5]. The construction industry has a temporary supply chain that keeps changing from project to project. The large number of stakeholders involved requires information at each stage of the construction project [
2].
The involvement of numerous stakeholders and other participants in the CSC has made it more complex than general supply chains [
6]. The diversity and intensity of information in CSCs require careful management [
7]. There are different barriers to information management (IM) in supply chains. Some examples include failure of information systems functionality, lack of information exchange, communication issues, lack of an IM system, lack of information availability, lack of information quality, implementation cost, and lack of leadership skills [
8]. These barriers hinder the process by not allowing the information to be managed, processed, and communicated. Accordingly, these barriers induce information complexity throughout the supply chain [
2]. The situation is further exacerbated in developing countries due to less sophisticated systems and reliance on traditional management approaches [
2].
Chen and Kamara [
9] argued that the construction industry is information-intensive from initiation to execution. The efficiency of IM is an important competitive advantage to the construction industry because of its diverse and intense nature [
9]. With the use of information technology, IM can benefit CSCs. Further advances in information technology can enhance IM in the construction sector, specifically on construction project sites, by providing timely, relevant, and necessary information to the key stakeholders to make informed and improved decisions [
10].
Recent developments in technologies have enabled global construction organizations to avail information easily on their premises. These technologies help manage supply chain information to ensure a smoother process. In addition, the introduction of different collaborative tools within construction projects supports the flow of information between different project members [
10]. These working partners often work in different locations, where the two-way information flow is essential in supporting the ongoing construction tasks. However, access to such information is usually restricted, particularly in developing countries. This can be associated with multiple reasons, including lack of trust, poor data archiving, and traditional rigid management practices.
It can be argued that timely collection and dissemination of information to project teams would resolve the risks and reduce unexpected construction problems [
11]. Bertelsen [
12] has described the construction process as a complex system. The construction process is based on the assumption that it is an ordered, linear process that can be planned and managed using traditional approaches [
13,
14]. However, the frequent delays in the completion of construction projects lead to an argument that the process is not as predictable as it may appear or assumed [
10]. In fact, construction is a non-linear, complex, and dynamic process that requires the use of sophisticated systems to manage it [
10].
In order to address the CSCs’ complexity, an SD approach is adopted in this study. SD is a tool used to enhance the learning of complex systems and facilitate the understanding of complex dynamic systems [
15,
16]. The approach addresses complexity and involves interactive modeling tools to represent feedback structures in complex non-linear systems [
17]. The strength of the SD approach lies in breaking down complex systems into simpler and understandable sub-systems. The SD approach addresses complexity and process relationships based on non-linear feedback systems [
1]. It employs causal loop diagrams (CLDs) to reveal the underlying causal feedback mechanisms [
18,
19]. Adopting SD can lead to a greater understanding of complex issues in processes such as CSCs.
Therefore, the current study focuses on finding a solution using the SD approach to address the information complexity and IM issues in CSCs. The research focuses on addressing information complexity using collaborative technologies (CTs) to improve the performance of CSCs.
The rest of the study is organized as follows. First, the study identifies barriers to IM in CSCs in the literature review section. It is followed by identifying factors affecting the adoption of CTs for IM in CSCs. The relationship between barriers and factors is used to derive a solution by finding out the factors acting as barriers to IM in the method section using various scoring mechanisms. The important factors are identified to minimize barriers to IM and discussed in the results section. Finally, the study is concluded, and limitations and future directions are presented. Overall, fewer barriers lead to less information complexity, leading to better IM in CSCs.
3. Research Methodology
The methodology adopted in this research requires data from the literature and the field. A hybrid approach consisting of inductive and deductive methods was adopted in this study. It consisted of a combination of questionnaires and expert opinions for validation purposes. The literature data were acquired from different research articles, and field data was collected via questionnaire-based surveys. Overall, a four-stage research process was followed in this study, as shown in
Figure 1. The stages are subsequently explained.
3.1. Stage 1
In the first stage, the research problem was identified from the literature using the research gap, which led to the formulation of the problem statement and research objectives. It was identified from previous studies that there are several key factors for CT adoption. Further, multiple barriers hinder the IM flow through CSCs. Accordingly, an in-depth investigation of these factors and barriers is needed, which is targeted in the current study. Considering the trends and research gaps, the research objectives of the study were finalized in Stage 1.
Table 1 shows the barriers to IM, along with the relevant references and the literature score. This literature score is assigned based on the frequency of their occurrence in the literature and their significance, as explained in subsequent paragraphs.
Table 2 shows the key factors for adopting CTs in CSCs, along with the relevant references and the literature score.
3.2. Stage 2
In the second stage, a detailed literature review was performed. The literature was retrieved and reviewed using the process mentioned in
Section 2.2. The barriers to IM can cause information complexity in CSCs. This complexity needs to be managed for the holistic adoption and implementation of IM in CSCs. SD has been proven in the published literature to be efficient for handling such complexities [
1,
19,
29]. Therefore, the SD approach is adopted to address such complexity by using CTs in CSCs. The barriers to IM and factors affecting the adoption of CTs for IM were identified by critically examining the literature, as previously explained. As a result, 43 barriers and 60 factors were identified. The identified barriers and factors were then ranked through content analysis. The content analysis consisted of (i) literature analysis and (ii) preliminary survey analysis.
In the literature analysis, the identified barriers and factors were given a literature score based on the frequency of their occurrence in the literature and their significance. These were assessed by each respective author of this study on a three-point Likert scale (1 = Low, 3 = Medium, and 5 = High) [
56]. Hence, the literature score was calculated for each barrier and factor by finding the product of its frequency and impact score, respectively. Equation (1) was used to calculate the literature score, where
N is the total number of papers considered to identify the barriers or factors,
A is the maximum possible score, and frequency depicts the repetition of barriers or factors in the reviewed papers. The literature score was converted into a normalized score by dividing the individual literature score of each barrier and factor by the sum of the literature score. The normalized score was then arranged in descending order, and the cumulative score was calculated.
After the literature analysis, a preliminary survey was performed to include input from field professionals. A preliminary survey questionnaire was prepared and circulated among experts from developing countries to rank the identified barriers and factors according to their experience. Thirty (30) responses were collected from respondents from different developing countries. The field score was calculated based on the preliminary survey and normalized accordingly. The combined literature and field scores were used to determine the combined normalized scores.
One-way ANOVA analysis was performed to determine any statistically significant variation between the ranks of different factors when assessed through weighing ratios, i.e., 40/60, 50/50, 30/70, etc. A
p-value of 1 between the combinations of different ratios proposes an insignificant disparity. After ANOVA analysis, a 60/40 weighting distribution (60% Field, 40% Literature) was adopted. The 60/40 distribution was used to get a sizeable representation from the field professionals, i.e., 60%, to make the study more robust and strong while providing a reasonable emphasis on the literature, i.e., 40%. This is in line with the study of Jahan et al. [
24], who used the same ratio in their study to highlight key factors influencing profitability in construction projects. Eighteen (18) barriers out of forty-three (43) and twenty-one (21) factors out of sixty (60) were selected on the simple majority principle of having an above-50% cumulative impact [
56,
57].
Table 3 and
Table 4 show the details and combined normalized scores of barriers and factors, respectively.
3.3. Stage 3
In the third stage, the collection and analysis of data were performed. Based on the content analysis, the barriers and factors that were subsequently used in the final questionnaire were shortlisted. As the focus of the study was on developing countries, the questionnaire was only circulated to respondents from such countries.
An influence matrix questionnaire was developed using Google Docs [
18] to collect the survey data, comprising two sections. The first section inquired about personal information, including the respondent’s academic qualifications, years of professional experience, type of organization, and country of work. The second section asked the respondents to rate the influence of each barrier of IM on all factors affecting the adoption of CTs on a three-point Likert scale (1 = Low, 3 = Medium, and 5 = High). It was also used to identify the pertinent polarity. The questionnaire was placed on online platforms such as Facebook
®, LinkedIn
®, and official emails.
A total of 62 responses were gathered from 14 developing countries. As a generally accepted rule, the central limit theorem is satisfied with a sample size of 30 or above [
58]. Once the data were collected, they were arranged, and the responses were evaluated for reliability and consistency using basic statistical tools. Cronbach’s coefficient alpha method was used to measure the reliability and consistency of the collected data. The minimum acceptable value for Cronbach’s alpha is 0.7 [
59]. The collected data had a Cronbach’s alpha value of 0.78, which represents the reliability and consistency of the data. After evaluating the collected survey data, the Relative Importance Index (RII) method was adopted to rank important relations. The RII is a statistical method to determine the ranking of different factors [
18]. Equation (2) was used to calculate the RII in this study.
where
W = weight assigned to the Likert scale (ranging from 1 to 5),
A = maximum weight assigned to the scale (i.e., 5 in this study),
N = total number of respondents (i.e., 62 in this study), and
RII has minimum and maximum values of 0 and 1, respectively.
The greater the value of RII, the more important the factor or relation will be. According to Rooshdi et al. [
60], RII has been categorized into five levels. The RII scores range from 0 to 0.2 as ‘Low’, 0.2 to 0.4 as ‘Medium–Low’, 0.4 to 0.6 as ‘Medium’, 0.6 to 0.8 as ‘High-Medium’, and 0.8 to 1 as ‘High’. In order to reduce the data set, relationships with RII ≥ 0.8 were considered most important in this study. The collected survey data revealed 20 relations between barriers and factors as most important (i.e., RII ≥ 0.8).
Table 5 shows the final shortlisted relations of barriers and factors. The barriers were connected to the factors based on the influence matrix results. Further, the polarity was determined by the respondents and selected on the basis of a simple majority.
3.4. Stage 4
In the final stage, the shortlisted relations (as shown in
Table 5) were used to develop a CLD, indicating the significant loops. The CLD in this study was developed using Vensim
® software. Developing CLDs is a repetitive practice where connections among all variables are chronologically perceived and arranged using professional acumen. All eight barriers to IM, shortlisted in 20 relations, were used as top variables. All barriers were connected with other variables (factors) in the direction of impact. Each arrowhead carries a negative or positive polarity, indicating an inverse or direct relation with the next variable in the loop. The closed chains of causes and effects are called feedback loops [
61]. Each loop was identified as a reinforcing or balancing loop based on its overall polarity.
The development of the CLD paved the way for the formulation of the associated SD model. The SD model was simulated using Vensim
® software. The model consists of three stocks governed by flow rates (inflows and outflows) and the variables used in the CLD. Inflow and outflow equations were also developed for these three stocks from the data acquired through the survey. Stocks can be accumulated, and they depict the state of the system that generates the information upon which decisions and actions are based [
61].
After the development of the SD model, simulations were run to check the behavior over time for all stocks using graphs. The model was also validated using different structural validation tests [
62], such as boundary adequacy, structure, parameter, and extreme condition tests. Furthermore, for its validation, the SD model and its results were also presented to construction industry professionals for their expert opinion. Thus, experts from different construction organizations in developing countries validated the model. Finally, model results were analyzed, and conclusions were drawn based on the SD analysis and the research objectives.
3.5. Demographics of Survey Respondents
Different professionals from developing countries responded to the questionnaire survey. Most respondents belonged to the contractor (29%) and consultant (27%) organizations. Qualification-wise, 52% of responses were from M.Sc. degree holders and 19% were from Ph.D. degree holders. In addition, 31% had 6 to 10 years of professional experience, while 21% had 21 years or above of professional experience, as shown in
Table 6.
3.6. Geographical Distribution of Responses
The survey collected 62 responses, including 29% national (Pakistan) and 71% international responses. Responses were received from many countries, including Pakistan (29%), India (23%), UAE (18%), Bangladesh (5%), Malaysia (5%), Iran (5%), Brazil (3%), Jordan (3%), Saudi Arabia (2%), Morocco (2%), Kuwait (2%), Qatar (2%), Turkey (2%), and Oman (2%), as shown in
Figure 2. As the focus of the study was limited to developing countries, responses were requested only from respondents in developing countries.
4. Results and Discussions
This section shows the results and analysis of the proposed SD model and provides relevant discussions. First, the CLD developed, with all its reinforcing and balancing loops, is explained. This is followed by the discussion of the SD model, with all its components and simulation graphs.
4.1. Causal Loop Diagram (CLD)
The CLD developed in this study illustrates a total of eight significant reinforcing and balancing loops, as shown in
Figure 3. The reinforcing loops are marked with the alphabet ‘R’, while balancing loops are marked with ‘B’. The CLD consists of two types of variables: barriers to IM and factors affecting the adoption of CTs. All loops are identified and explained below.
4.1.1. Reinforcing Loop R1
The loop (R1) shows that ‘Failure of information systems functionality’ decreases technical feasibility, as evident from
Figure 4. A decrease in technical feasibility decreases top management support, thereby increasing complexity. Further, an increase in the complexity of the system increases the failure of information systems functionality.
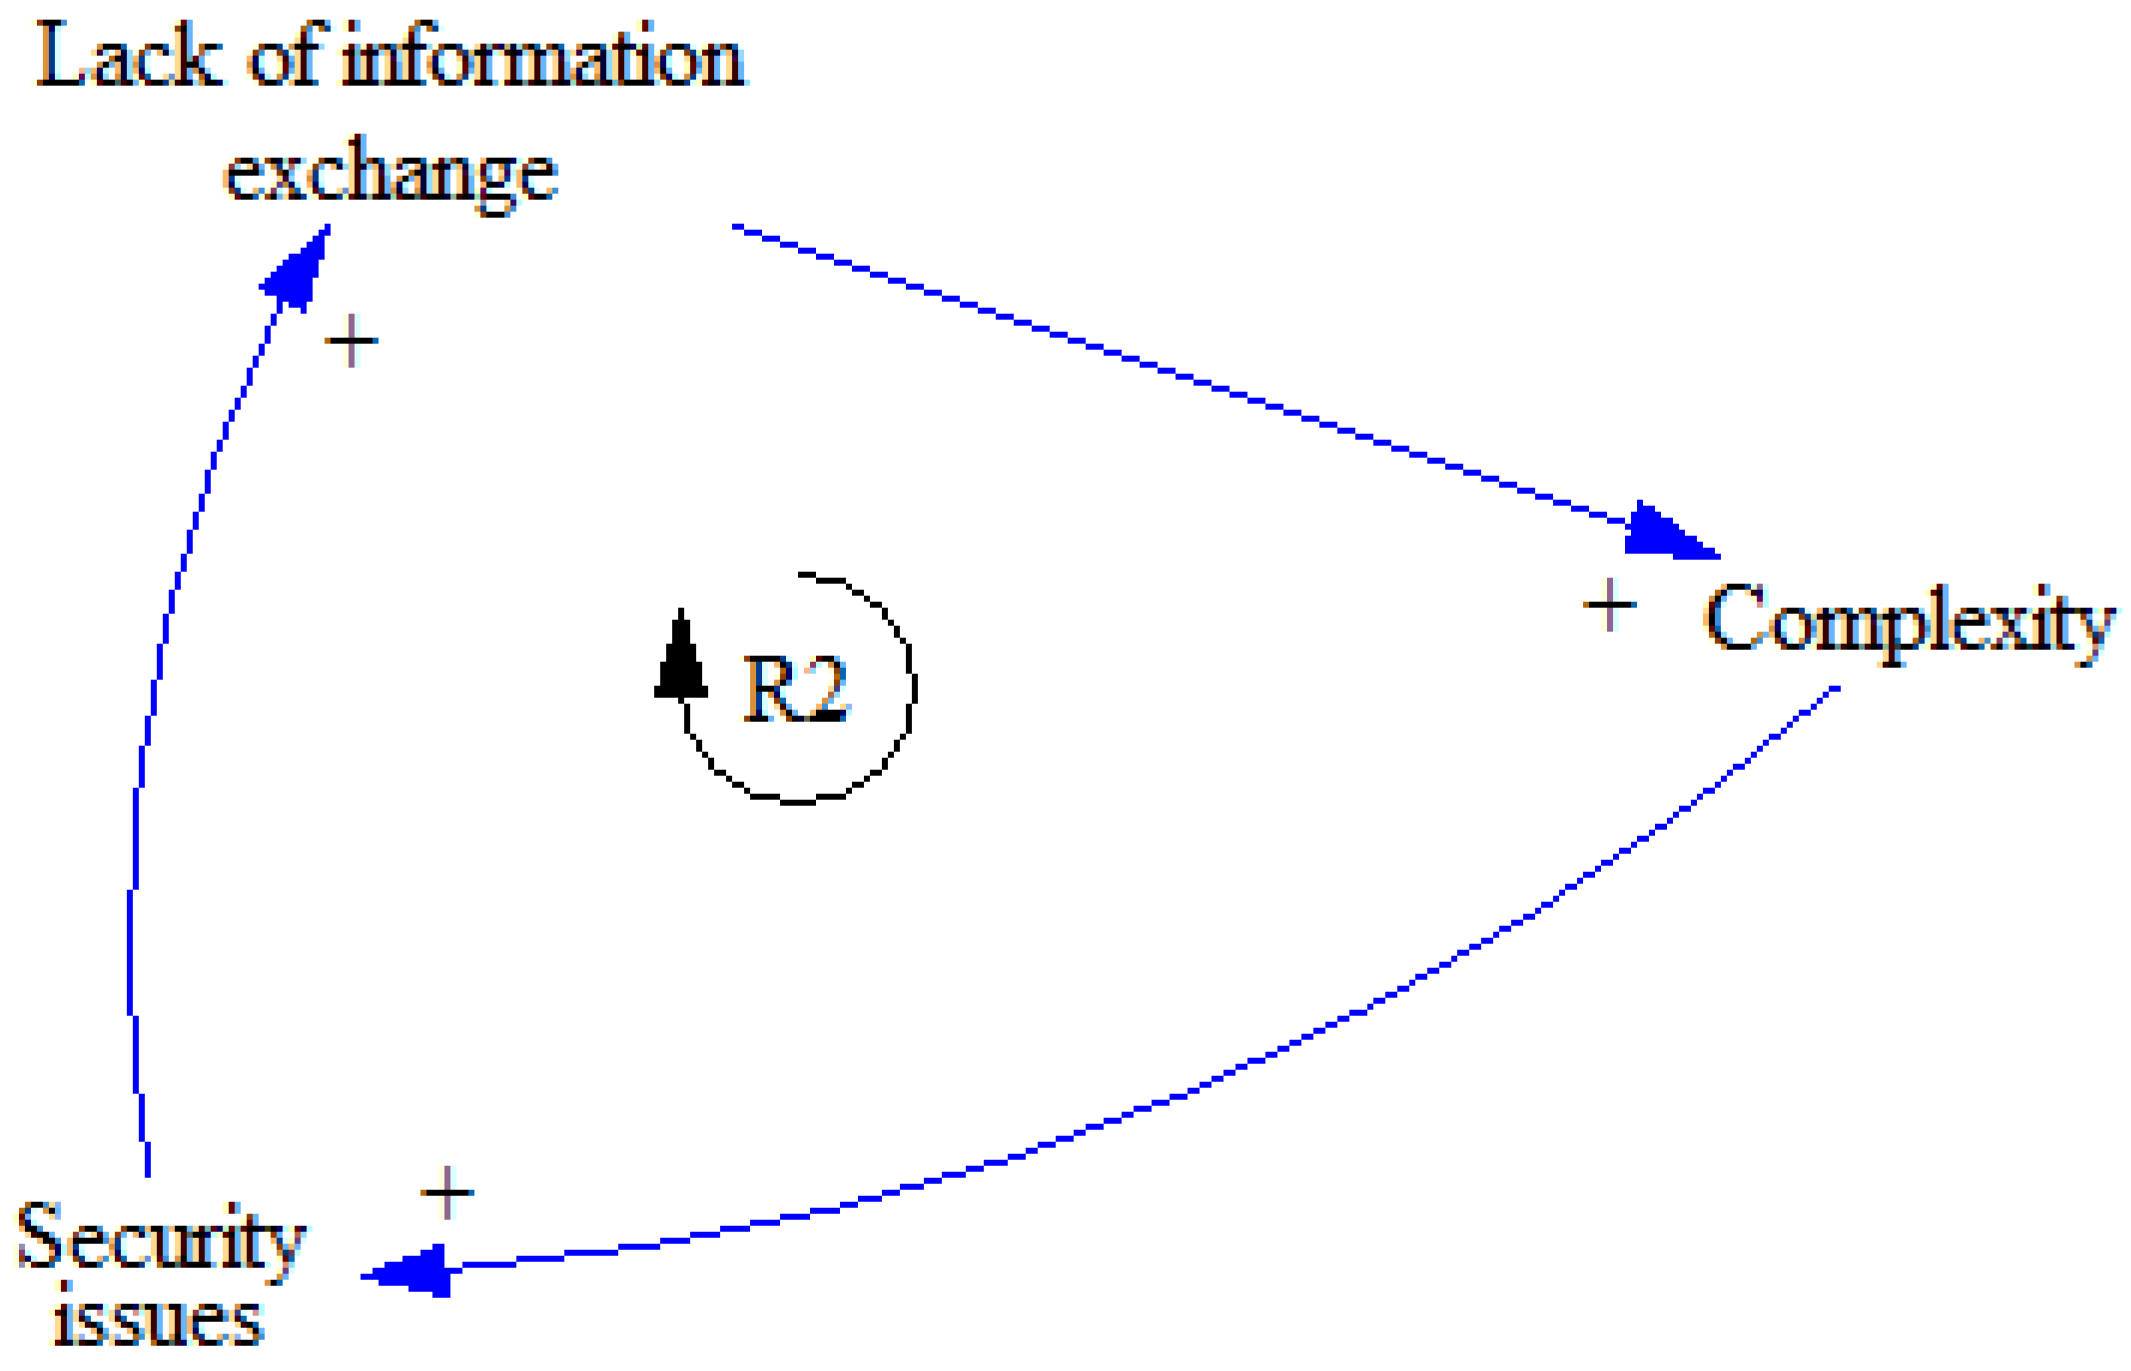
4.1.2. Reinforcing Loop R2
The loop (R2) shows that ‘Lack of information exchange’ increases complexity, leading to a corresponding increase in security issues, as evident from
Figure 5. Thus, an increase in security issues increases the lack of information exchange in CSCs.
4.1.3. Reinforcing Loop R3
The loop (R3), as evident from
Figure 6, shows that ‘Lack of an Information Management System (IMS)’ decreases technical feasibility, which decreases top management support in construction projects. Further, decreasing top management support increases the chances of not utilizing (or a lack of) an IM system. Hence, top management support is needed to adopt and implement an IMS in CSCs.
4.1.4. Reinforcing Loop R4
The loop (R4), as evident from
Figure 7, shows that ‘Lack of leadership skills’ decreases top management support and leads to a corresponding decrease in CEO knowledge of the project. This further leads to an increase in the lack of leadership skills.
4.1.5. Balancing Loop B1
The loop (B1), as evident from
Figure 8, indicates that ‘Communication issues’ lead to a corresponding decrease in trust and cooperation throughout CSCs. Further, a decrease in trust and cooperation leads to increased complexity in projects, which eventually leads to a corresponding increase in communication issues.
4.1.6. Balancing Loop B2
The loop (B2), as evident from
Figure 9, indicates that ‘Lack of information availability’ decreases trust and cooperation and increases complexity in projects. This leads to a corresponding increase in security issues and a lack of information availability. Hence, the availability of information is necessary to resolve all issues in CSCs.
4.1.7. Balancing Loop B3
The loop (B3), as evident from
Figure 10, indicates that ‘Lack of information quality’ decreases trust and cooperation, increasing the complexity of projects. There is a corresponding increase in the lack of information quality with increased complexity. Hence, information quality also plays a role in dictating the level of complexity in projects.
4.1.8. Balancing Loop B4
The loop (B4), as evident from
Figure 11, indicates that ‘Implementation cost’ can increase the overall cost of technology, decreasing perceived benefits and, eventually, decreasing top management support. In addition, it causes a decrease in regulatory support, which can increase the implementation cost. Therefore, to manage information in a CSC, it is important to manage the cost of technology.
4.2. System Dynamics Model
After the development of the CLD, the SD model was developed and simulated using Vensim
® software. The SD model consists of three main components (stocks): (a) Complexity, (b) Trust and Cooperation, and (c) Top Management Support, governed by inflows and outflows. The equations used in the SD model were developed using the data collected through surveys, as previously explained. The SD model is shown in
Figure 12.
4.3. Simulation Results and Discussion
The simulation conducted in this study represents the system’s behavior over a time period of 6 months, generally taken as the project duration for a small-scale CSC. Multiple equations were used to simulate the stocks and flows, as presented below.
Equation for the first stock (Complexity) = [(0.049 × Lack of information exchange) + (0.050 × Trust and Cooperation) + (0.050 × Top Management Support)]
Equation for the second stock (Trust and Cooperation) = [(0.051 × Lack of information quality) + (0.049 × Lack of information availability) + (0.051 × Communication issues)]
Equation for the third stock (Top Management Support) = [(0.053 × Lack of leadership skills) + (0.050 × Perceived benefits) + (0.050 × Technical feasibility)]
The analysis was performed using Vensim
® software. First, the model is drawn, and all variables are added to the model in the software. Then, the graph shown in
Figure 13 is obtained upon running the simulation, which depicts the results of the SD model.
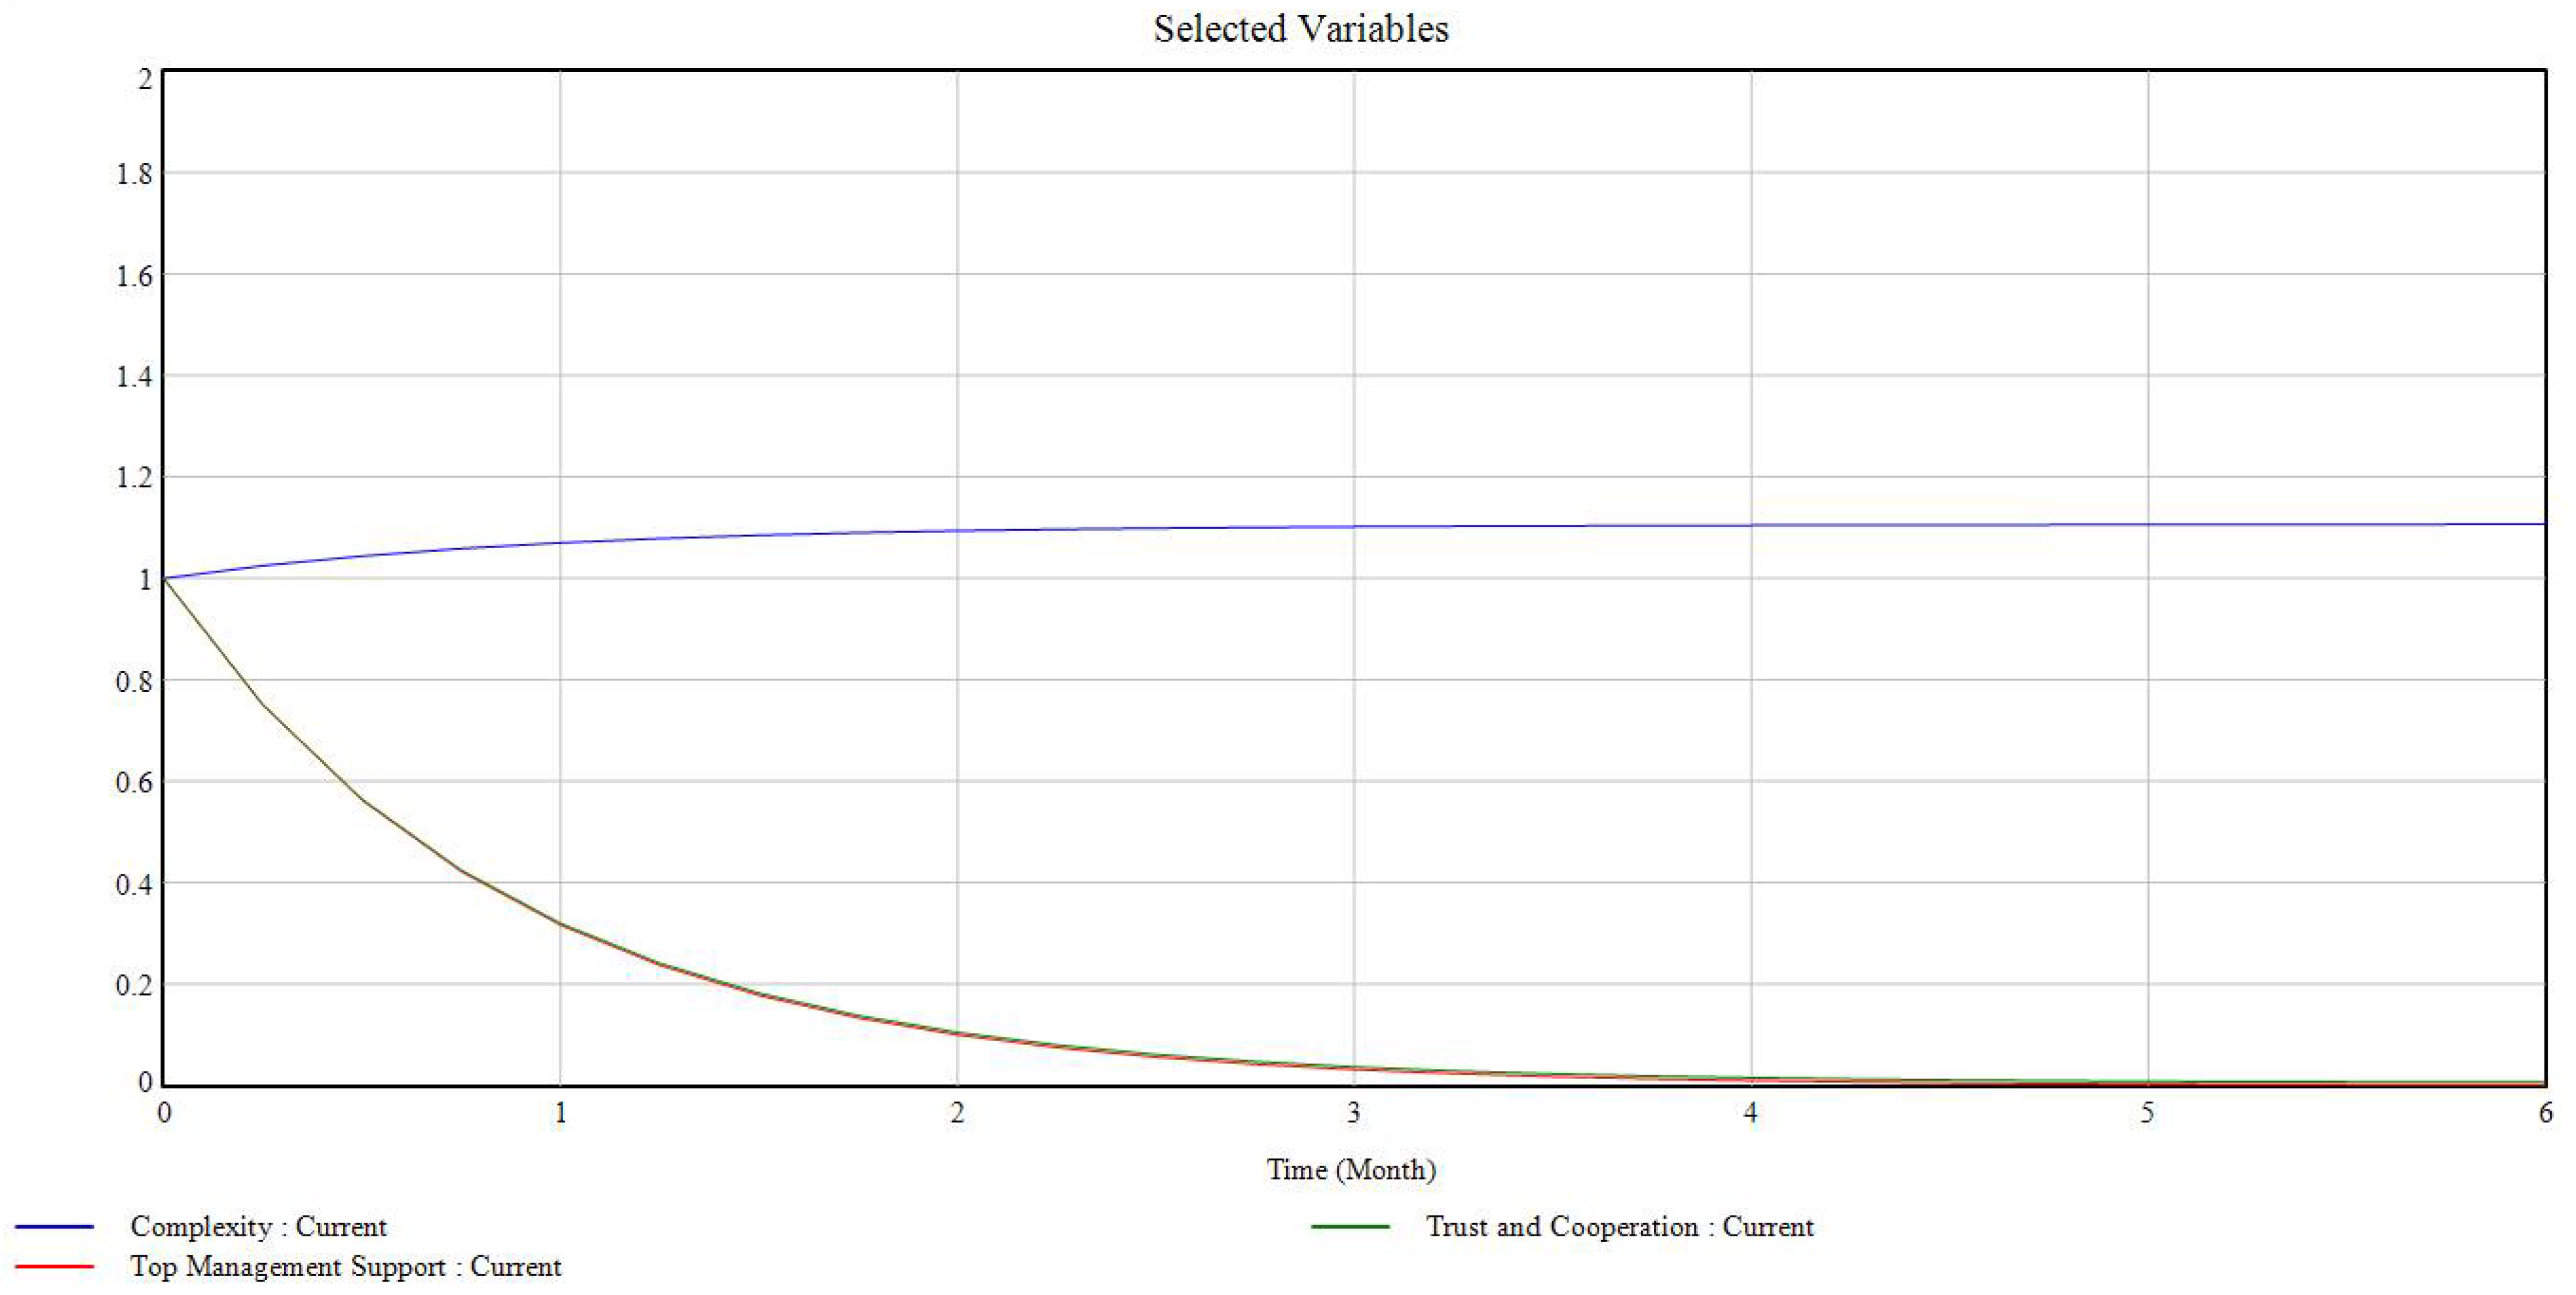
The decrease and increase in the curve of the simulation graphs are explained subsequently. The simulation presents a behavior-over-time graph.
Figure 13 shows a simulation graph of all three variables assessed in this study. There is an abrupt decrease in two variables, trust and cooperation and top management support, when these are simulated against project complexity. Therefore, it can be deduced that with increasing project complexity, the support from top management and the level of trust and cooperation among project stakeholders go down. Alternatively, by controlling project complexity, management support will increase trust and cooperation among project stakeholders.
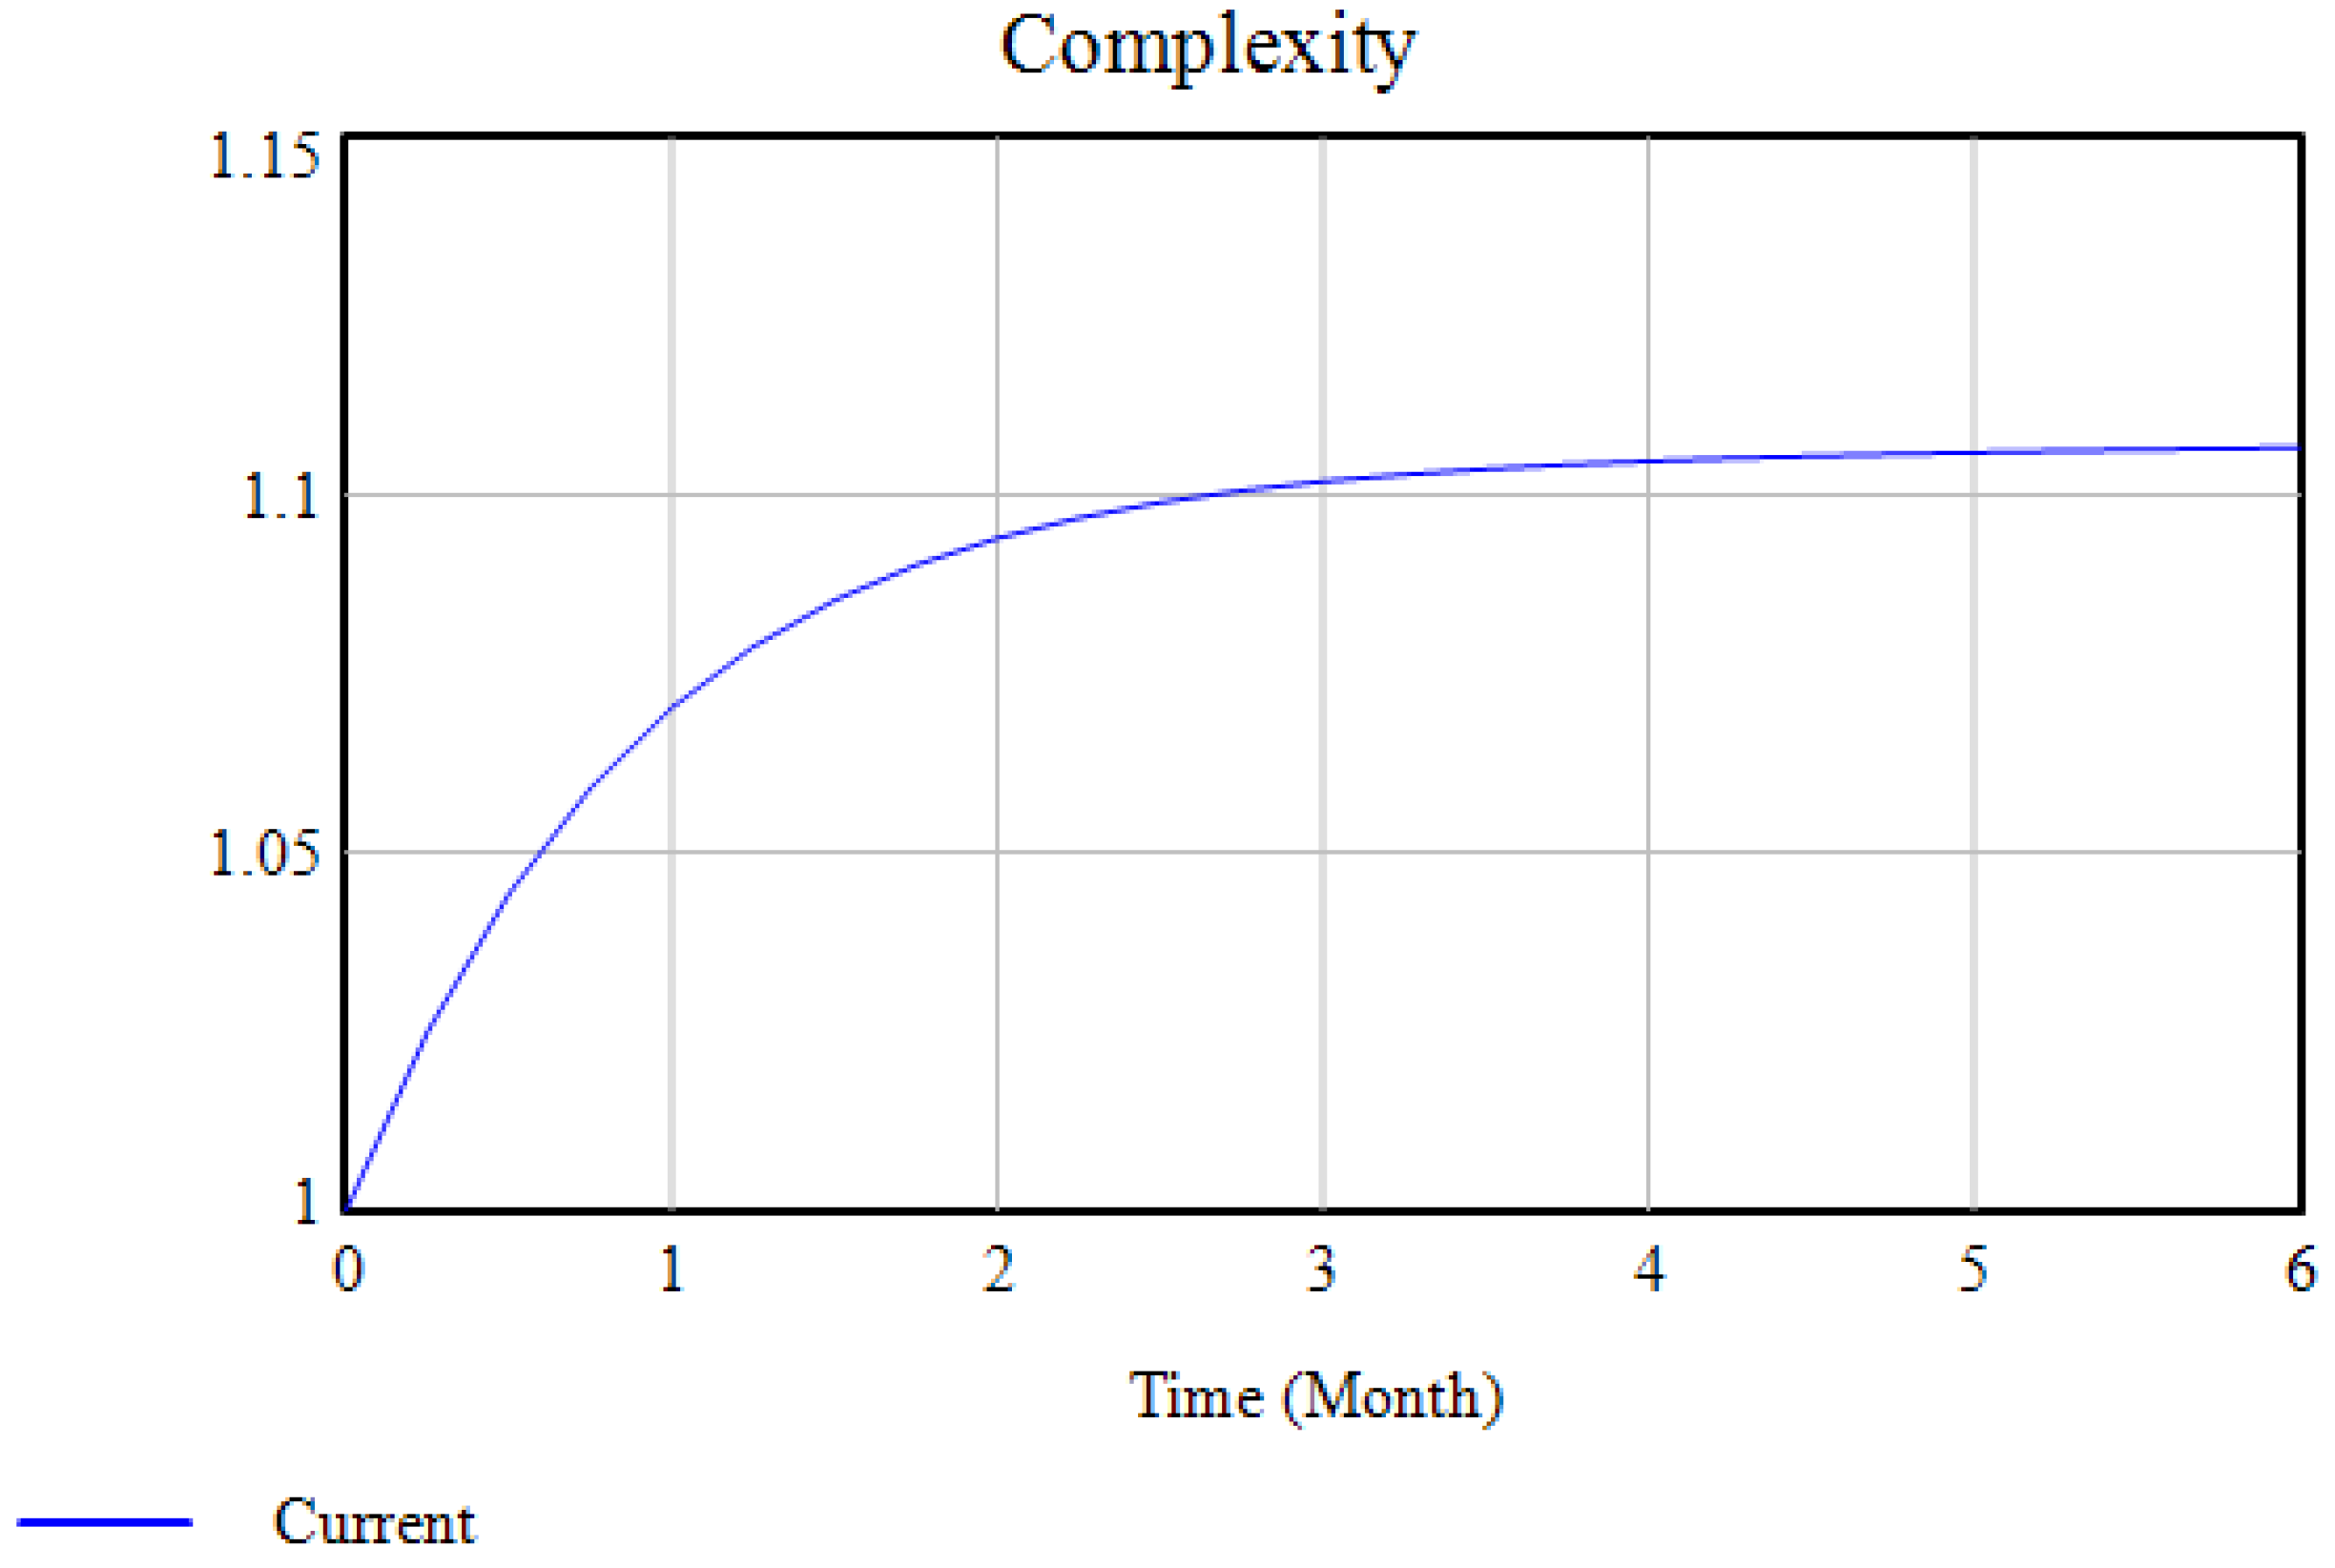
The graph of ‘Complexity’ shows a compounding trend that implies that factors in the loop play a positive role, as shown in
Figure 14. ‘Complexity’ is at a minimum at first, but with time, it increases. This increase is rapid in the initial days and then slowly eases with time till the end of the simulation period. The inflow of ‘Complexity’ consists of lack of information exchange, trust and cooperation, and top management support, which increases the complexity of the system. In order to reduce ‘Complexity,’ the impact of these variables needs to be addressed in CSCs.
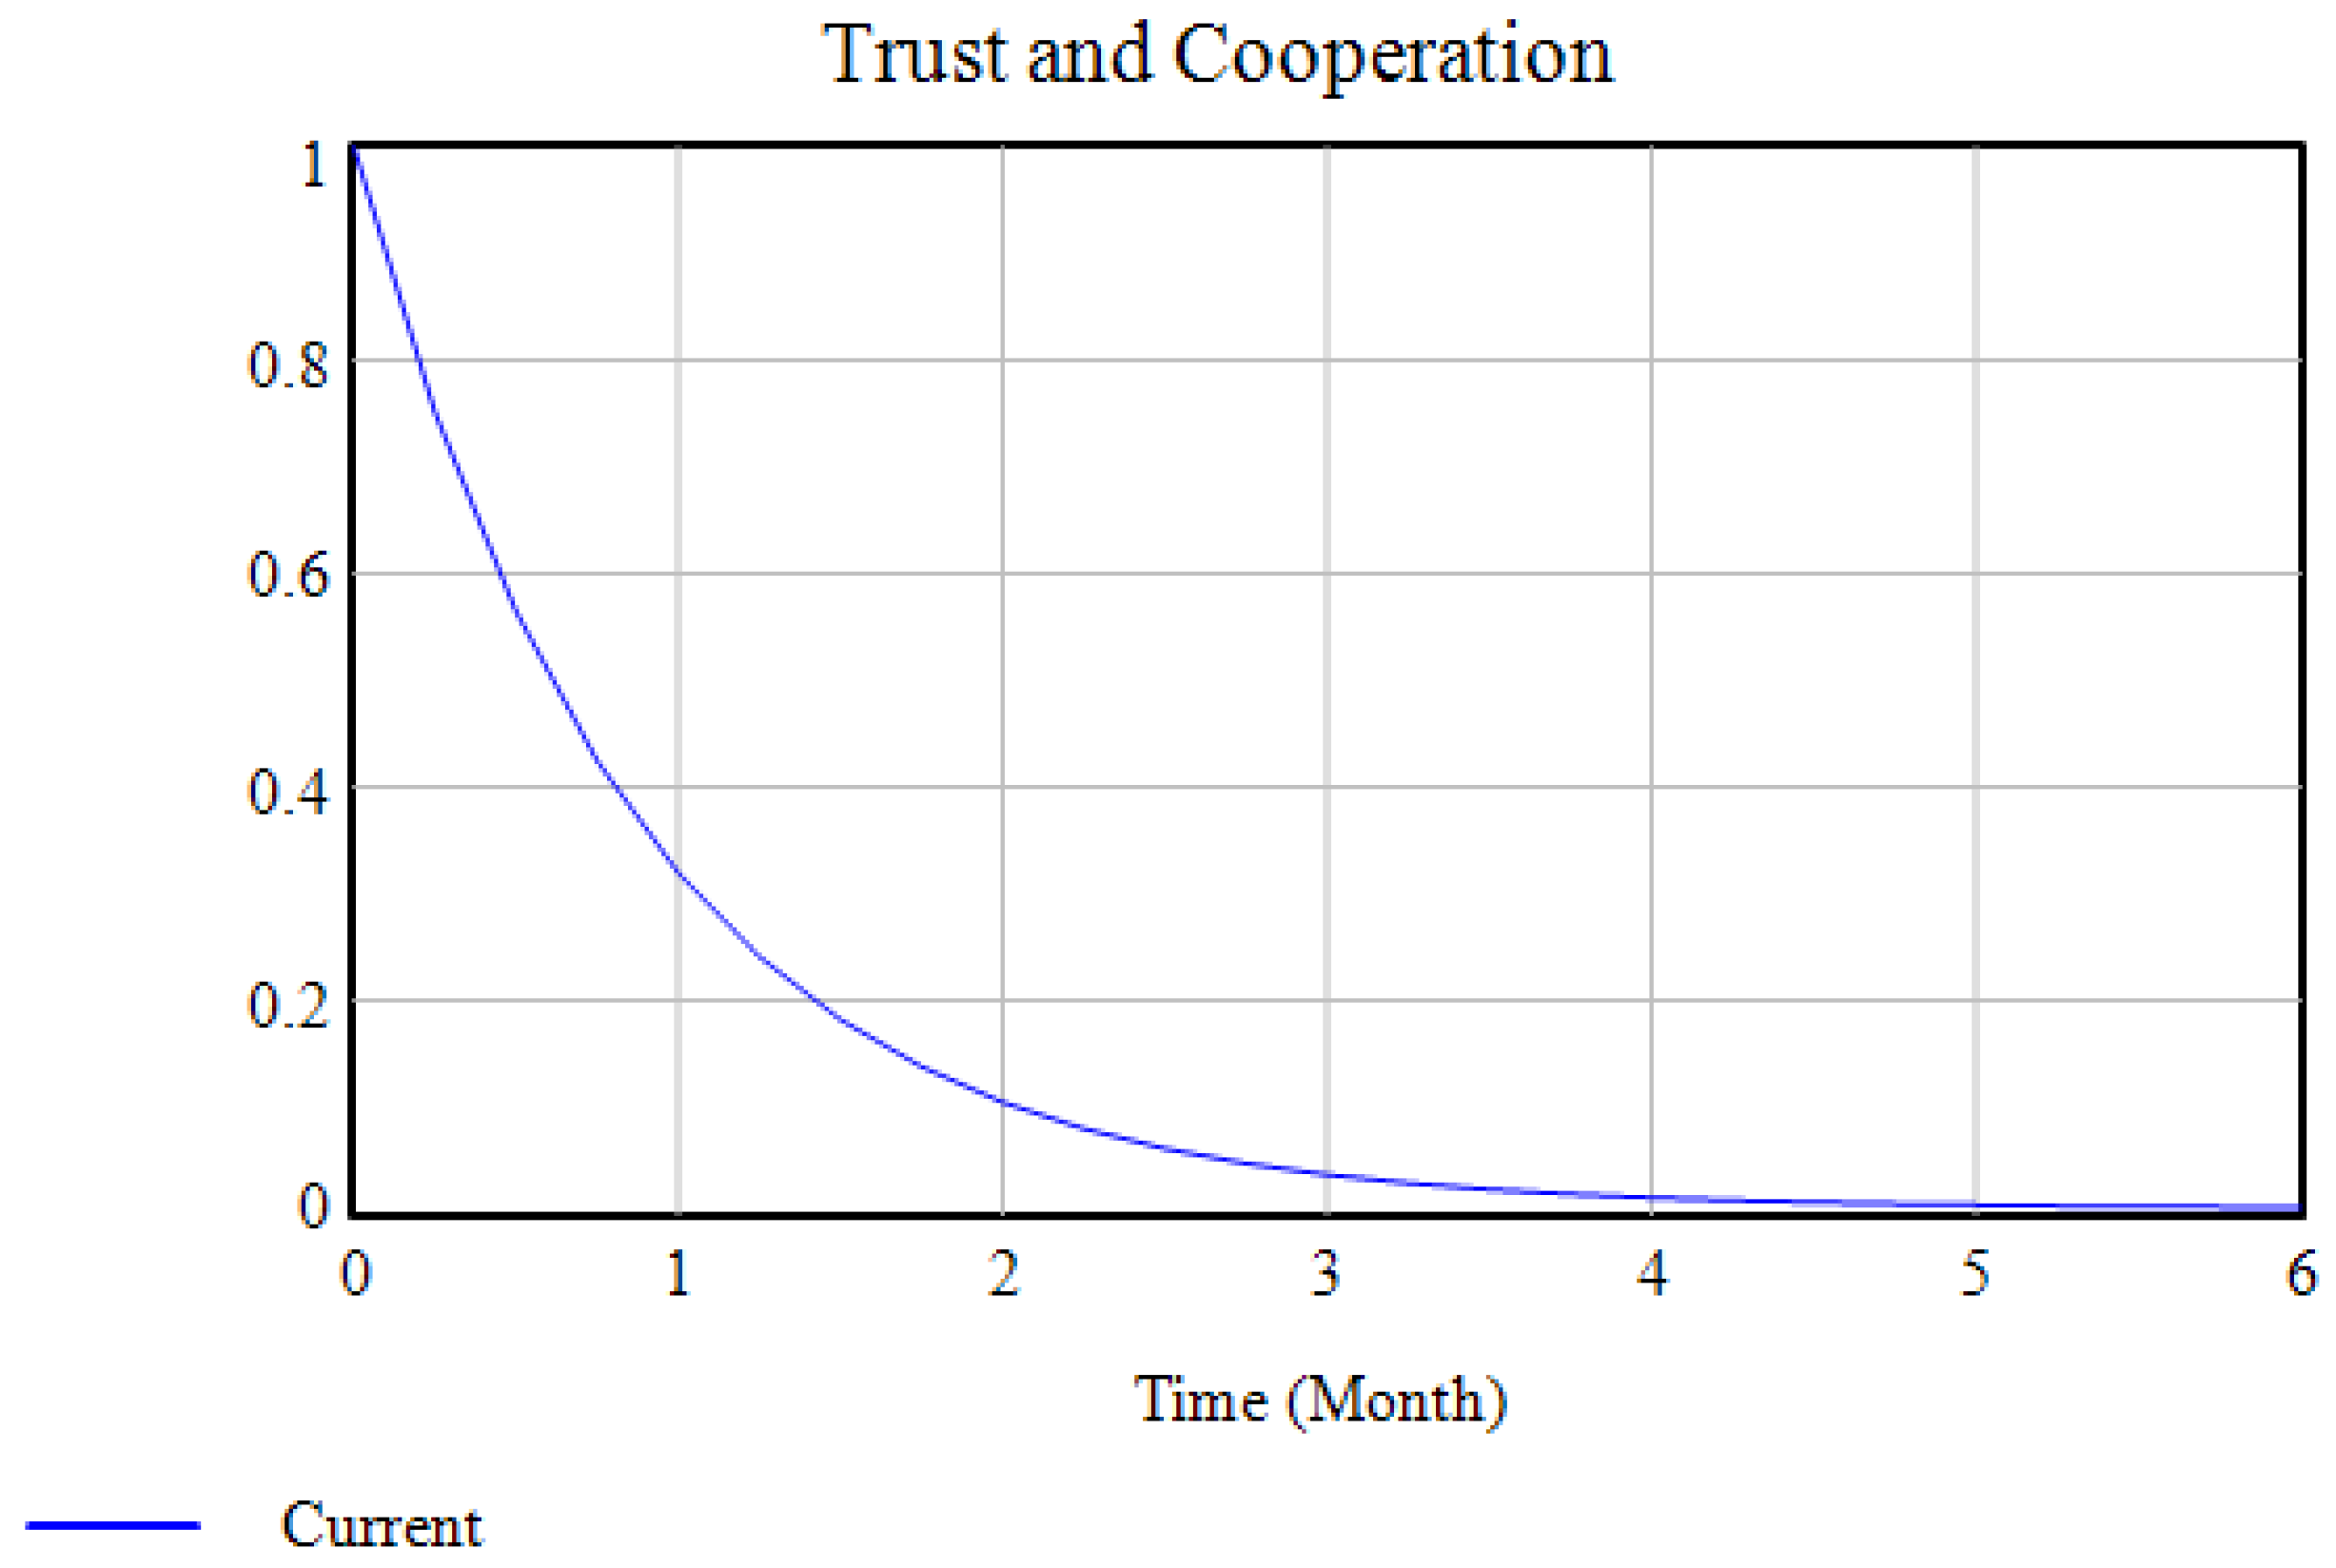
The ‘Trust and Cooperation’ graph shows a draining process that implies that factors in the loop play a negative role, as evident from
Figure 15. ‘Trust and Cooperation’ is at a maximum at first, but with time, it decreases rapidly. This decrease is rapid in the initial days and slows down with time. The inflow of ‘Trust and Cooperation’, consisting of lack of information quality, lack of information availability, and communication issues, decreases the trust and cooperation among project stakeholders in the CSC system. In order to increase ‘Trust and Cooperation’, the impact of these variables must be addressed in the CSC.
The graph of ‘Top Management Support’ also shows a draining process that implies that factors in the loop play a negative role, as evident from
Figure 16. It is at a maximum at first, but it decreases rapidly in the initial days and then slows down with time. The inflow of ‘Top Management Support’, consisting of lack of leadership skills, perceived benefits, and technical feasibility, decreases the support from top management in the CSC system. In order to increase ‘Top Management Support’, the impact of these variables must be accounted for and addressed in CSCs.
4.4. Model Validation
An SD model addresses the problem and provides a solution for complexity in various systems and processes. In order to put confidence in a simulation model so that it shows the right behavior for the right reasons, it must be validated using different validation tests [
62]. Model validation is a continuous and repetitive process. Therefore, the model must be validated from the beginning of its development until its completion. The same concept was followed in this study.
Furthermore, the model and its results were presented to different construction industry professionals to capture their expert opinion for its validation. The model was validated by fourteen (14) experts belonging to different organizations in the construction industry of developing countries. Five (5) experts were from contractor organizations, and three (3) each were from consultant, client, and academic organizations. The different validation tests performed on the SD model developed in this study are explained below:
The boundary adequacy test is used to verify whether the essential concepts and structures addressing the problem are endogenous to the model or not [
62]. The model must include all important variables that affect the system’s behavior. The exogenous variables in this study include complexity, top management support, and trust and cooperation. The endogenous variables include failure of information systems functionality, lack of information exchange, communication issues, lack of an IM system, lack of information availability, lack of information quality, implementation cost, and lack of leadership skills. After examining the SD model, it is found that all the variables are relevant and in line with the published literature.
The structure verification test is performed to check whether the model structure is consistent with the relevant descriptive knowledge of the system [
62]. The developed CLD and SD model depends on variables identified from the literature, coupled with the input of experienced industry professionals. Moreover, the influencing relationships used are also shortlisted with the help of input from experienced industry professionals. Therefore, the model structure is rational and logical and closely represents the actual CSC system.
The parameter verification test is used to verify whether the parameters used in the model are consistent with the descriptive and numerical knowledge of the system [
62]. The mathematical functions developed for linking variables in this study are based on responses from field experts, who have provided empirical and theoretical foundations for the mathematical functions. The values assigned to all parameters are sourced from existing knowledge and surveys, shown in
Table 5. Further, simulations show that the model exhibits results related to published studies. Thus, the parameters of the SD model used in this study are verified.
The extreme condition test is used to confirm the logical behavior of the model when extreme values are assigned to selected variables [
62]. Extreme values are assigned to selected variables (stocks/exogenous variables), and the model-generated behavior is compared to the reference behavior of the system. Simulation results show that the model shows meaningful results even if the values are increased by 50% in the current study. Therefore, the current SD model withstands the extreme conditions test and can be used in CSCs.
5. Conclusions
The SD model reflects complex interacting systems comprising different components that apprehend information complexity in CSCs. SD is used to manage information complexity using CTs in CSCs. To understand a complex problem, it is necessary to focus on the relationships and interconnectivity in the whole system instead of focusing on the constituent parts only. The SD model provides insight into important barriers to IM and its relation to factors affecting the adoption of CTs in CSCs. It supports CSCs in predicting and analyzing the system’s behavior and managing information complexity accordingly. In order to manage information complexity, the SD approach determines the factors affecting the adoption of CTs that should be addressed to improve the CSCs in developing countries. As these factors are addressed, barriers to IM in CSCs will be reduced, and this will result in managing information more efficiently and appropriately.
This study contributes to the body of knowledge by assisting industry professionals in developing countries in understanding the dynamics of information complexity in CSCs. The SD model highlights the main factors affecting the adoption of CTs. Addressing these factors will reduce information complexity and result in better IM in construction projects. The research has practical implications, including using the SD approach to help address information complexity and the adoption of CTs in CSCs. Such adoption will enable collaboration among construction project stakeholders, empowering CSC managers to increase their productivity and performance.
The developed mechanism has successfully achieved the research objectives. These include identifying the barriers to IM and the factors affecting the adoption of CTs, finding interrelation among the barriers and the factors, and identifying the critical components instigating information complexity in CSCs. However, it must be kept in mind that the developed SD model is limited to the factors and barriers identified in the current study. The model can only facilitate the decision-making process by allowing relationships and interdependencies to explain the behavior of a complex system based on the input variables. Thus, these models cannot provide any project-specific advice to professionals. For this purpose, it is necessary to use the model in collaboration with some case-based systems to experience real-time problems occurring in CSCs and provide a practical solution. Similarly, the degree of mutual influence of factors was not captured in this study. Instead, the polarity, factors’ RII, and direction of relations were decided following the respondents’ opinions. Such influence can be captured in a future study. Further, future studies can use the developed model in real-time for various case studies and obtain relevant results. A similar study, if repeated in a developed country, may provide useful results for holistic comparisons of CSCs in developed and developing countries.


 ,
, 


