Article

Organization Synchronization in Response to Complex Project Delays: Network-Based Analysis

1
School of Civil Engineering, Wuhan University, Wuhan 430072, China
2
School of Engineering and Technology, Central Queensland University, Sydney, NSW 2000, Australia
*
Author to whom correspondence should be addressed.
Buildings 2022, 12(5), 662; https://doi.org/10.3390/buildings12050662
Submission received: 4 April 2022 / Revised: 11 May 2022 / Accepted: 13 May 2022 / Published: 16 May 2022
(This article belongs to the Special Issue Tradition and Innovation in Construction Project Management)

Abstract

:
In response to frequent complex project delays, organization synchronization, a set of interactions, is a dynamic behavior that helps to restore the stability of complex projects after delays. However, few studies have figured out how organizations synchronize effectively in order to deal with delay issues. To solve this problem, this study first provides a preliminary list of CDFs and indices of organization interactions are also given. A total of 15 key CDFs and 10 interaction ways were refined according to a questionnaire survey. In addition, the complex network synchronization (CNS) theory was adopted to analyze the synchronizability and importance of nodes by comprehensively using multiple parameters. A complex metro project with 51 project organizations was used as a case study and we found that specific signal organizations synchronized through three effective interaction ways (meetings, discussion and study, and the Internet) to cope with six CDFs (safety accidents, prominent problems of land expropriation, unreasonable timelines by clients, improper construction designs, delayed payments, and high financial risks). This study contributes to defining organization synchronization, providing a feasible research framework for assessing network synchronizability and identifying signal organizations in complex projects, and guiding practitioners to effectively cope with delays by interactions between signal organizations.

1. Introduction

Complex projects are a focus of research in project management to meet social demands. For instance, infrastructure projects are being pursued at a breakneck pace in developing countries in water and sewage, electricity, and transportation and communications, while developed countries are improving infrastructure systems to solve outstanding problems [1]. Complex projects refer to construction projects that are large in scale and involve large investments, multiple stakeholders, complex interactions, and a dynamic environment. They thus feature a high level of uncertainty, unknown dependencies, and unpredictability [2]. Uncertainty in complex projects leads to unexpected events, such as incorrect on-site exploration and accidents, while organizations handling such projects need to be flexible because of the unknown dependencies [2]. Unexpected situations often lead to construction delays [3,4]. Therefore, project success is closely related to project complexity, such as the scale and technical difficulty [5,6].
Breaking down project complexity is useful to help practitioners identify complex projects more accurately. It is recognized that project complexity has organizational and technical types [7]. Given the long project life cycle and uncertain final project scope, the dynamic and growth-related traits of projects helped researchers define project complexity from the perspectives of time and space [8]. The composition of project complexity also includes information and targets [9], communication [10], interface management [11], cost performance [12], and a dynamic environment [13]. Hence, it is important to summarize existing interaction ways among complex project organizations [14].
Organizations dynamically interact with each other in complex projects and form the behavior of organization synchronization once an accident, such as a delay, occurs [15,16]. Organization interactions are generally made up of different types, such as written, oral, and technical interactions [17,18]. However, it remains unclear in which interaction ways organizations synchronize effectively and which organizations have strong synchronization capabilities. Therefore, this study aimed to resolve the organization synchronization issue by (1) finding the most key construction delay factors (CDFs); (2) establishing an index system of organization interactions; and (3) determining the synchronizability of important organizations and effective interaction ways. The complex network synchronization (CNS) theory was adopted to analyze the process of organization synchronization and a case study was used to validate the application of the CNS theory. Thus, this study contributes to the theory and practice of organizational synchronization and provides a comprehensive way to evaluate synchronizability and the importance of nodes.

2. Literature Review

2.1. Construction Delay Factors

Construction delays in complex projects refer to time extensions that result from multiple causes related to different stakeholders at different project phases. The causes of delays are mainly related to project partners, such as clients, contractors, designers, suppliers, investors, laborers, supervisors, and governments [19,20,21,22,23]. Other researchers indicated that some external factors have a large influence on project performance, such as dangerous environments and terrible weather [21,24], rising prices [20,25,26], and cultural influences [27]. As shown in Table 1, we summarized a total of 27 CDFs gleaned from the literature review and deconstructed the causes of delays from the perspective of stakeholders, including financial institutions, clients, contractors, designers, supervisors, governments, and external factors.
Previous studies indicated that the responsibility for delays should be attributed to contractors and their direct stakeholders, such as suppliers and clients [20,26]. For these organizations, the causes of delays include construction mistakes, site management, delayed payments and other problems with materials, personnel, and equipment [3,20,28]. The coordination of service providers related to project sites and project works was particularly weak [29], and poor communication or coordination problems may lead to rework [3,24,27,30,31]. Therefore, smooth coordination is required in order to successfully remain on schedule to prevent variations in critical activities [26]. However, few previous studies have explained how delay issues are solved by organization synchronization in the context of complex projects, which involve large numbers of organizations and complex organization interactions.
Table 1. Summary of construction delay factors.
SourcesFactors [3][20][21][22][23][24][25][26][27][31][31][32][33][34][35]
ClientsProminent problems of land expropriation
Slow decisions by clients
Design alterations by clients
Unreasonable timelines by clients
Delayed payments
Deferred transmission of the construction site
Supply problems from clients
Improper financing
ContractorsSafety accidents
Improper organizational construction design
Limited capability of project managers
Lack of labor or unqualified labor
Machinery breakdowns
Disharmony with neighbors
DesignersLack of communication between designers and contractors
Incorrect design basis
SupervisorsIncompetent supervision
Conflicts with designers
Financial institutionsHigh financial risk
GovernmentsUnreasonable government intervention
Variations in law and regulations
Lack of supervisory strength
External factorsDangerous environment and terrible weather
Excavation of relics
International transportation of materials, machines, and labor
Rising prices
Cultural influences

2.2. Organizational Synchronization in Complex Projects

Synchronization is a ubiquitous process emerging from many dynamically interacting units in many different areas, such as biological ecology, electronic circuits, social relationships, and economic management [36,37]. Examples include numerous fireflies suddenly flashing at the same time and clocks swinging at the same frequency after some imperceptible movements. Importantly, synchronization not only involves multiple interacting units but also the interaction of several signal units that transmit synchronization signals to the other units [38]. Once a complex system has been disturbed by an external or internal accident, the synchronization phenomenon first occurs in the local community that is formed by the signal units and then spreads to the whole system. When achieving a state of synchrony, all units show a high degree of coordination and the complex system reaches a high level of stability.
In other words, the synchronization process helps to rebalance and restore a disturbed complex system. In complex project systems, organizations are the actors who interact to positively solve delay issues and achieve a state of synchrony. Thus, analysis of organization synchronization can contribute to our understanding of delays in complex project management. Similar to the definition of synchronization, we assume that ‘organization synchronization’ means a dynamic process in which project organizations interact with each other to effectively respond to project accidents and restore the stability of complex project systems. After organizations have been synchronized, it is possible to achieve effective cooperation between organizations and faster information transmission in complex systems [39,40,41].
Moreover, to better understand organization synchronization, studies need to focus on organization interactions and the early interaction behaviors of signal organizations in complex projects. Generally, organization interactions can be generated in many ways, such as by tasks, documents (e.g., contracts), commitments or trust, information technologies, communications, information sharing, knowledge exchanges, and management procedures [42,43,44,45,46,47,48]. However, few studies have established an index system of interaction ways and evaluated the frequency of each interaction way in project organizations. As shown in Table 2, we summarized these interactions and classified them into written interactions, oral interactions, technical interactions, and meetings.
Organization interactions and related communication issues have been widely studied by using the Social Network Analysis (SNA) theory in the construction field [43,54,55,56,57]. For example, Li adopted SNA to study the influence of Building Information Modeling on project organizations and the communication patterns [58]. Admittedly, SNA is a useful method for solving organization interaction problems. However, further theoretical development would be needed if SNA is to be used to deal with synchronization issues.
In contrast, the complex network synchronization (CNS) theory, which was derived from the complex network theory, has specifically been developed to explore the synchronization process. Watts and Strogatz (1998) first introduced the network theory to analyze the synchronization of cricket chirps [59]. According to Li, previous studies on the CNS theory can be divided into four types: synchronization of a chaotic system, synchronization within a network, synchronization between different networks, and synchronization of a multi-layer network [60]. Organization synchronization studies belong to the second type, which refers to the synchronization behavior of internal network nodes. In addition, most of the research concentrates on cumbersome mathematical calculations and theoretical modeling in different areas. Few studies have applied the CNS theory to figure out the organization synchronization process, particularly in complex projects.
Network synchronizability is greatly affected by the structural properties [61,62], which rely on the characteristics of nodes and links in a complex network. In addition, the structural properties of a network are generally evaluated by diverse parameters, many of which have been found to have numeric relationships with network synchronizability. For instance, degree, average path length, heterogeneity in the degree distribution, and node betweenness centrality vary inversely with network synchronizability [63,64], and modularity, which measures the density between different communities, is positively proportional to network synchronizability [38]. However, these studies assessed network synchronizability based on one single parameter. It is important to provide a sound analysis by combining the relationships between network synchronizabilty and as many parameters as possible.
As mentioned above, organization synchronization emerges from a local synchronization initiated by several signal organizations. Some investigations have shown that flows of large amounts of information or intensive interactions between the signal organizations contribute to a faster synchronization process [38,65]. Hence, signal nodes in complex networks have two general traits: (1) a high degree of connection with the other nodes; and (2) initial nodes that perceive disturbance factors in complex networks and transmit synchronization signals. Correspondingly, in complex projects, the first organization to perceive delay factors and its closely related stakeholders may be signal nodes if they can be proved to be highly linked with the other organizations. To find signal organizations, it is critical to evaluate the importance of nodes from the network’s perspective. Node importance is generally assessed by two parameters: (1) node degree [66,67]; and (2) node centrality, including degree centrality, closeness centrality, betweenness centrality, and eigenvector centrality [68]. Nevertheless, conflicting results frequently occur because node importance usually ranks differently between the analysis of the five parameters. Hence, we ranked network nodes and found signal organizations by unifying the above-mentioned five node parameters.

3. Methodology

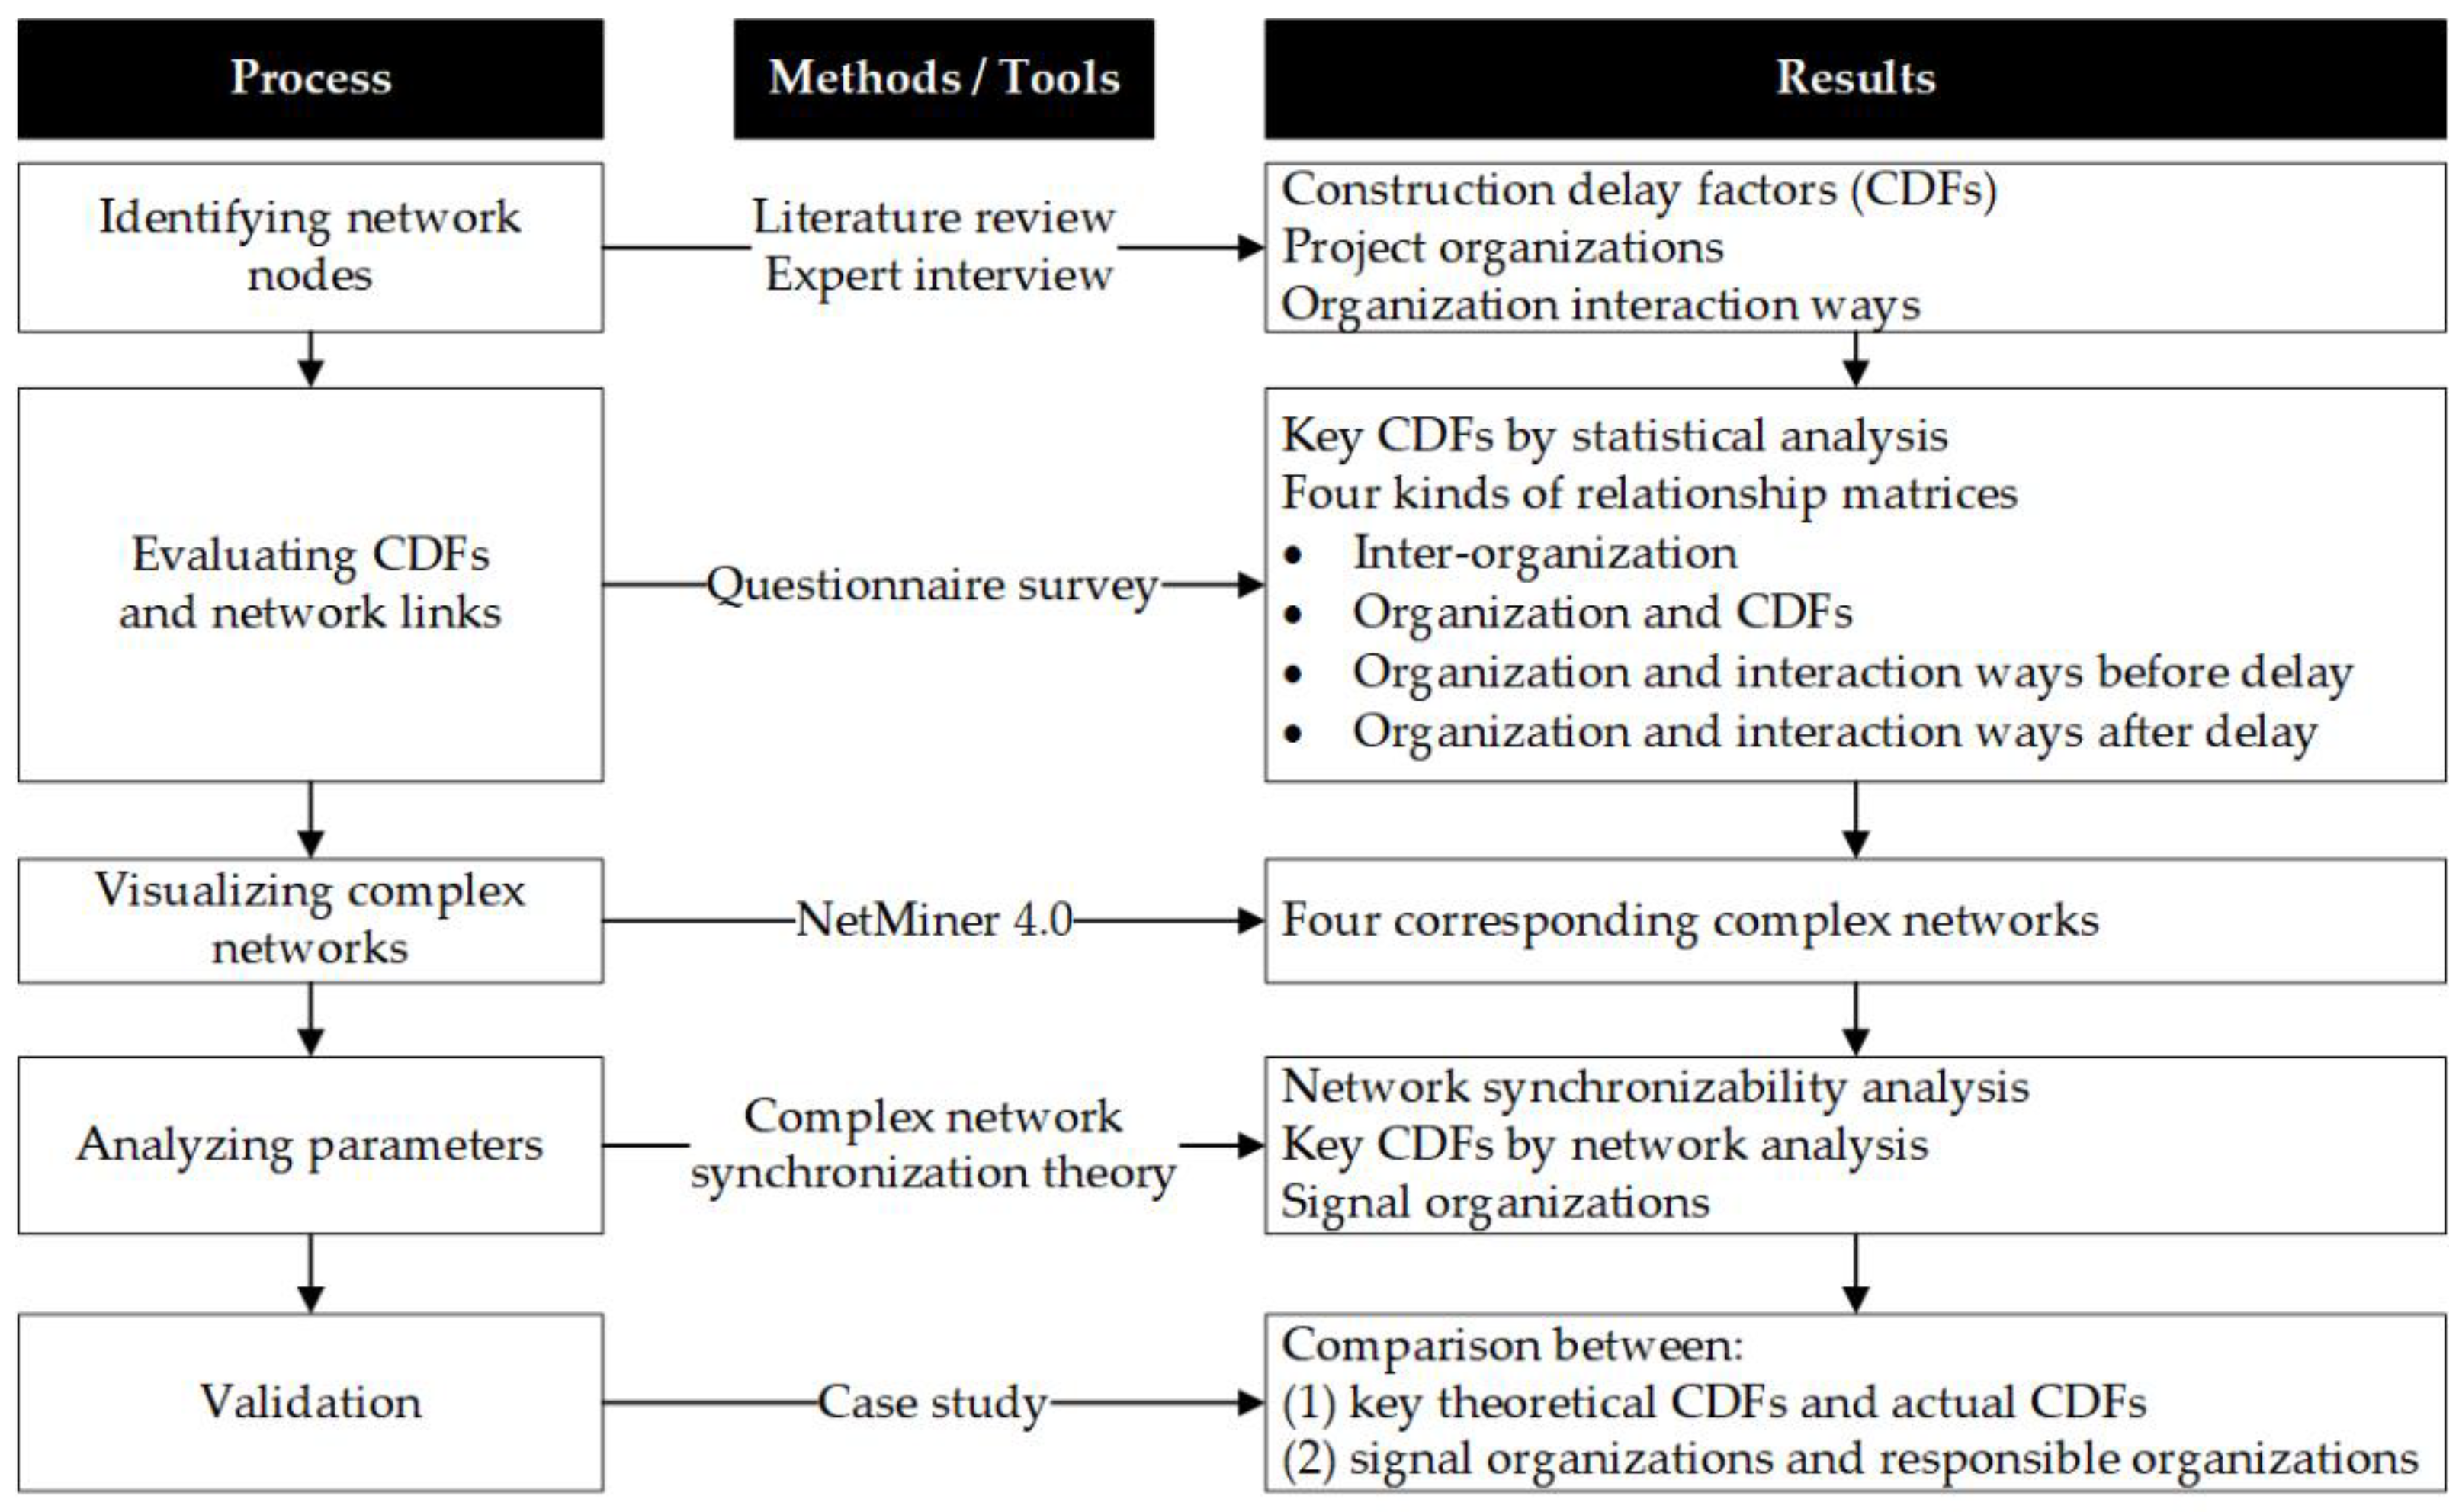
3.1. Research Framework

As shown in Figure 1, a research framework involving five steps was developed to explore organization synchronization in terms of complex networks. First, a literature review was conducted to identify 27 construction delay factors (Table 1) and four kinds of organization interaction ways (Table 2). Then, an expert interview was conducted to discuss the reasonableness of the 27 CDFs, determine the types of organizations, and determine the possible organization interactions in complex projects. Second, a questionnaire survey was used to assess the influence of the 27 CDFs on the project schedule and evaluate four kinds of relationships among different units (inter-organization (IO), organizations and CDFs (OCDFs), organizations and interaction ways (OIWs) before the delay, and organizations and interaction ways after the delay). Third, the software NetMiner 4.0 was utilized to visualize the four corresponding complex networks (the IO network, the OCDF network, the OIW network before the delay, and the OIW network after the delay). Subsequently, several parameters were analyzed to compare the network synchronizability, find the key CDFs, and determine the signal organizations in the early stage of local synchronization. During the above processes, statistical analysis (Step 2) and network analysis (Step 4) were used to refine the key CDFs.
Finally, to validate the effectiveness of the CNS theory’s application, a typical complex project in Hangzhou, China was adopted as a case project and studied by implementing the above steps. The complex metro project in the case study was assumed to be a project under construction and we also assumed that no delay had occurred. Thus, the key CDFs and the signal organizations could be generated from the theoretical research. If the theoretical results are highly commensurate with the actual reasons for the delay and the responsible organizations, then the feasibility of the CNS theory’s application can be proved.
Therefore, by applying the research framework, researchers can predict key causes of delays and the responsible parties in complex projects where project delays have not happened, determine the network synchronizability of the IO network, the OCDF network, and the OIW network before the delay, and adjust organization interactions to achieve better synchronizability in response to project delays.

3.2. Data Collection

The preliminary literature review yielded a list of CDFs and interaction ways. To improve data accuracy, a further expert interview was conducted with three experienced project managers from contractor and client organizations. All experts had either more than 15 years of experience in construction projects or participated in complex projects. They were required to assess the results of the literature review, summarize 10 types of common organizations in complex projects, and initially discuss general interaction ways between these organizations. According to the interview results, complex project organizations include financial institutions (F), governments (G), including government-funded representatives and departments approving and supervising construction projects, clients (B), contractors (C), supervisors (S), designers (D), operation units (O), the public (P), investors (I), and academic researchers. In addition, some interactions existing only between particular stakeholders and relevant contract relationships were removed according to the suggestions from the expert team. Thus, the 10 refined common interactions were oral task assignments, instructions, oral reports, inspections of work, discussions and studies, meetings, letters, networks, telephone communications, and telegraph communications.
Focusing on the 10 types of organizations, a questionnaire survey was designed to judge the effect of the 27 CDFs on the project period and the four types of relationships mentioned above. The questionnaire consisted of four main sections. The first section was used to obtain a profile of each respondent and collected information such as work experience, geological distribution, and organization types. The second section assessed the influence of the 27 CDFs on complex projects by a five-point Likert scale (1 = very low, 2 = low, 3 = medium, 4 = high, 5 = very high). The third section quantified the above-mentioned four kinds of relationships (inter-organization, organizations and CDFs, organizations and interaction ways before the delay, and organizations and interaction ways after the delay). The last section was used to obtain text solutions to construction delay problems from these experienced respondents.
The specific participants were first selected via the stratified sampling strategy [69]. Then, a total of 175 questionnaires were sent out via paper or electronic files and 173 questionnaires were returned. There were 169 valid questionnaires, meaning a valid response rate of 96.57%. The rate was relatively high compared with other studies and acceptable rates, including 20.13% in [28], 11.1% in [69], 13.02% in [70], and 70% in [71]. The sample size of 169 was adequate for the data analysis and well above the minimum requirement of 30 according to the central limit theorem [35]. Around 59.76% of the respondents had at least 5 years of experience in working with complex projects. A total of 38.46% of the respondents were academic staff from universities, and the other respondents had an even distribution in terms of organizations and geography.

3.3. Statistical Analysis

Cronbach’s alpha (α) is widely adopted to prove the inter-reliability of survey data and its value ranges from 0 to 1 [72,73]. As stated in many studies [74,75,76], an acceptable α score is generally larger than 0.70. As tested by SPSS 25.0, the α of 0.933 within the entire survey sample indicated that the questionnaire survey had a high degree of reliability and the fact that the α of each CDF was below 0.933 proved the strong inner consistency of all scales. As shown in Table 3, the mean scores of the CDFs range from 3.06 to 4.06. To select the critical CDFs, the normalized values of the mean scores were calculated, as recommended by Xu et al. and Zhao et al. [77,78]. A total of 15 CDFs with normalized values above 0.50 were regarded as critical factors.
Figure 2 shows the proportion of organization interaction ways before and after delays. Whether delays occur or not, the most frequent means of interaction was meetings. After project delays, the ratio of utilization of oral task assignments, networks, and instructions decreased by 41.38%, 33.14%, and 28.17%, respectively. This indicates that inefficiencies in organizational cooperation became evident in cases of accidents, leading to a further loss of control and poor outcomes. Attention needs to be paid to effective interaction ways, such as meetings and discussions, in order to enhance the efficiency of collaboration and information sharing.

3.4. Network Parameters

According to the literature review, network synchronizability is related to two types of parameters: (1) global network parameters, including average length path, modularity, and clustering coefficient; and (2) node parameters, including degree and betweenness centrality. The latter type is indirectly related to network synchrony by illustrating signal nodes. Hence, we explain network synchronizability in terms of global network parameters and explore signal organizations and key CDFs in light of node parameters. As shown in Table 4, all involved parameters are explained. Both key CDFs and signal organizations are explained by multiple parameters; thus, conflicting results are prone to occur. Therefore, we summed the rank value of the corresponding parameters to obtain a comprehensive rank.

4. Case Study

Phase I of the Hangzhou Metro Line 4 project was selected as a case study for the following reasons. First, it is a typical complex project considering the interacting project complexities due to the organizational structure, technologies, etc. Second, seven delays indeed occurred in the case project and led to a huge final cost of as much as 14.35 billion RMB. It was supposed to be operational on 29 December 2017, but the operational trial was postponed by six months to 6 June 2018. The actual causes of the delay reported by the news included a huge financial risk, prominent problems of land expropriation, an unreasonable timeline for clients, an improper organizational construction design, safety accidents, disharmony with neighbors, and the excavation of aerial bombs. Third, as a completed complex project, ample data could be collected to determine the project organizations. Three official websites (Zhejiang Provincial Development and Reform Commission, Hangzhou City Development and Reform Commission, and Hangzhou Metro) were the major sources of data on project organizations and publish project information such as progress and participants. By a full-text search and the use of Web crawlers on the websites in chronological order, a total of 357 texts were obtained and split into substantial quantities of words. By selecting words with the organization property, more than one hundred organizations were found to have participated in the completion of this project.

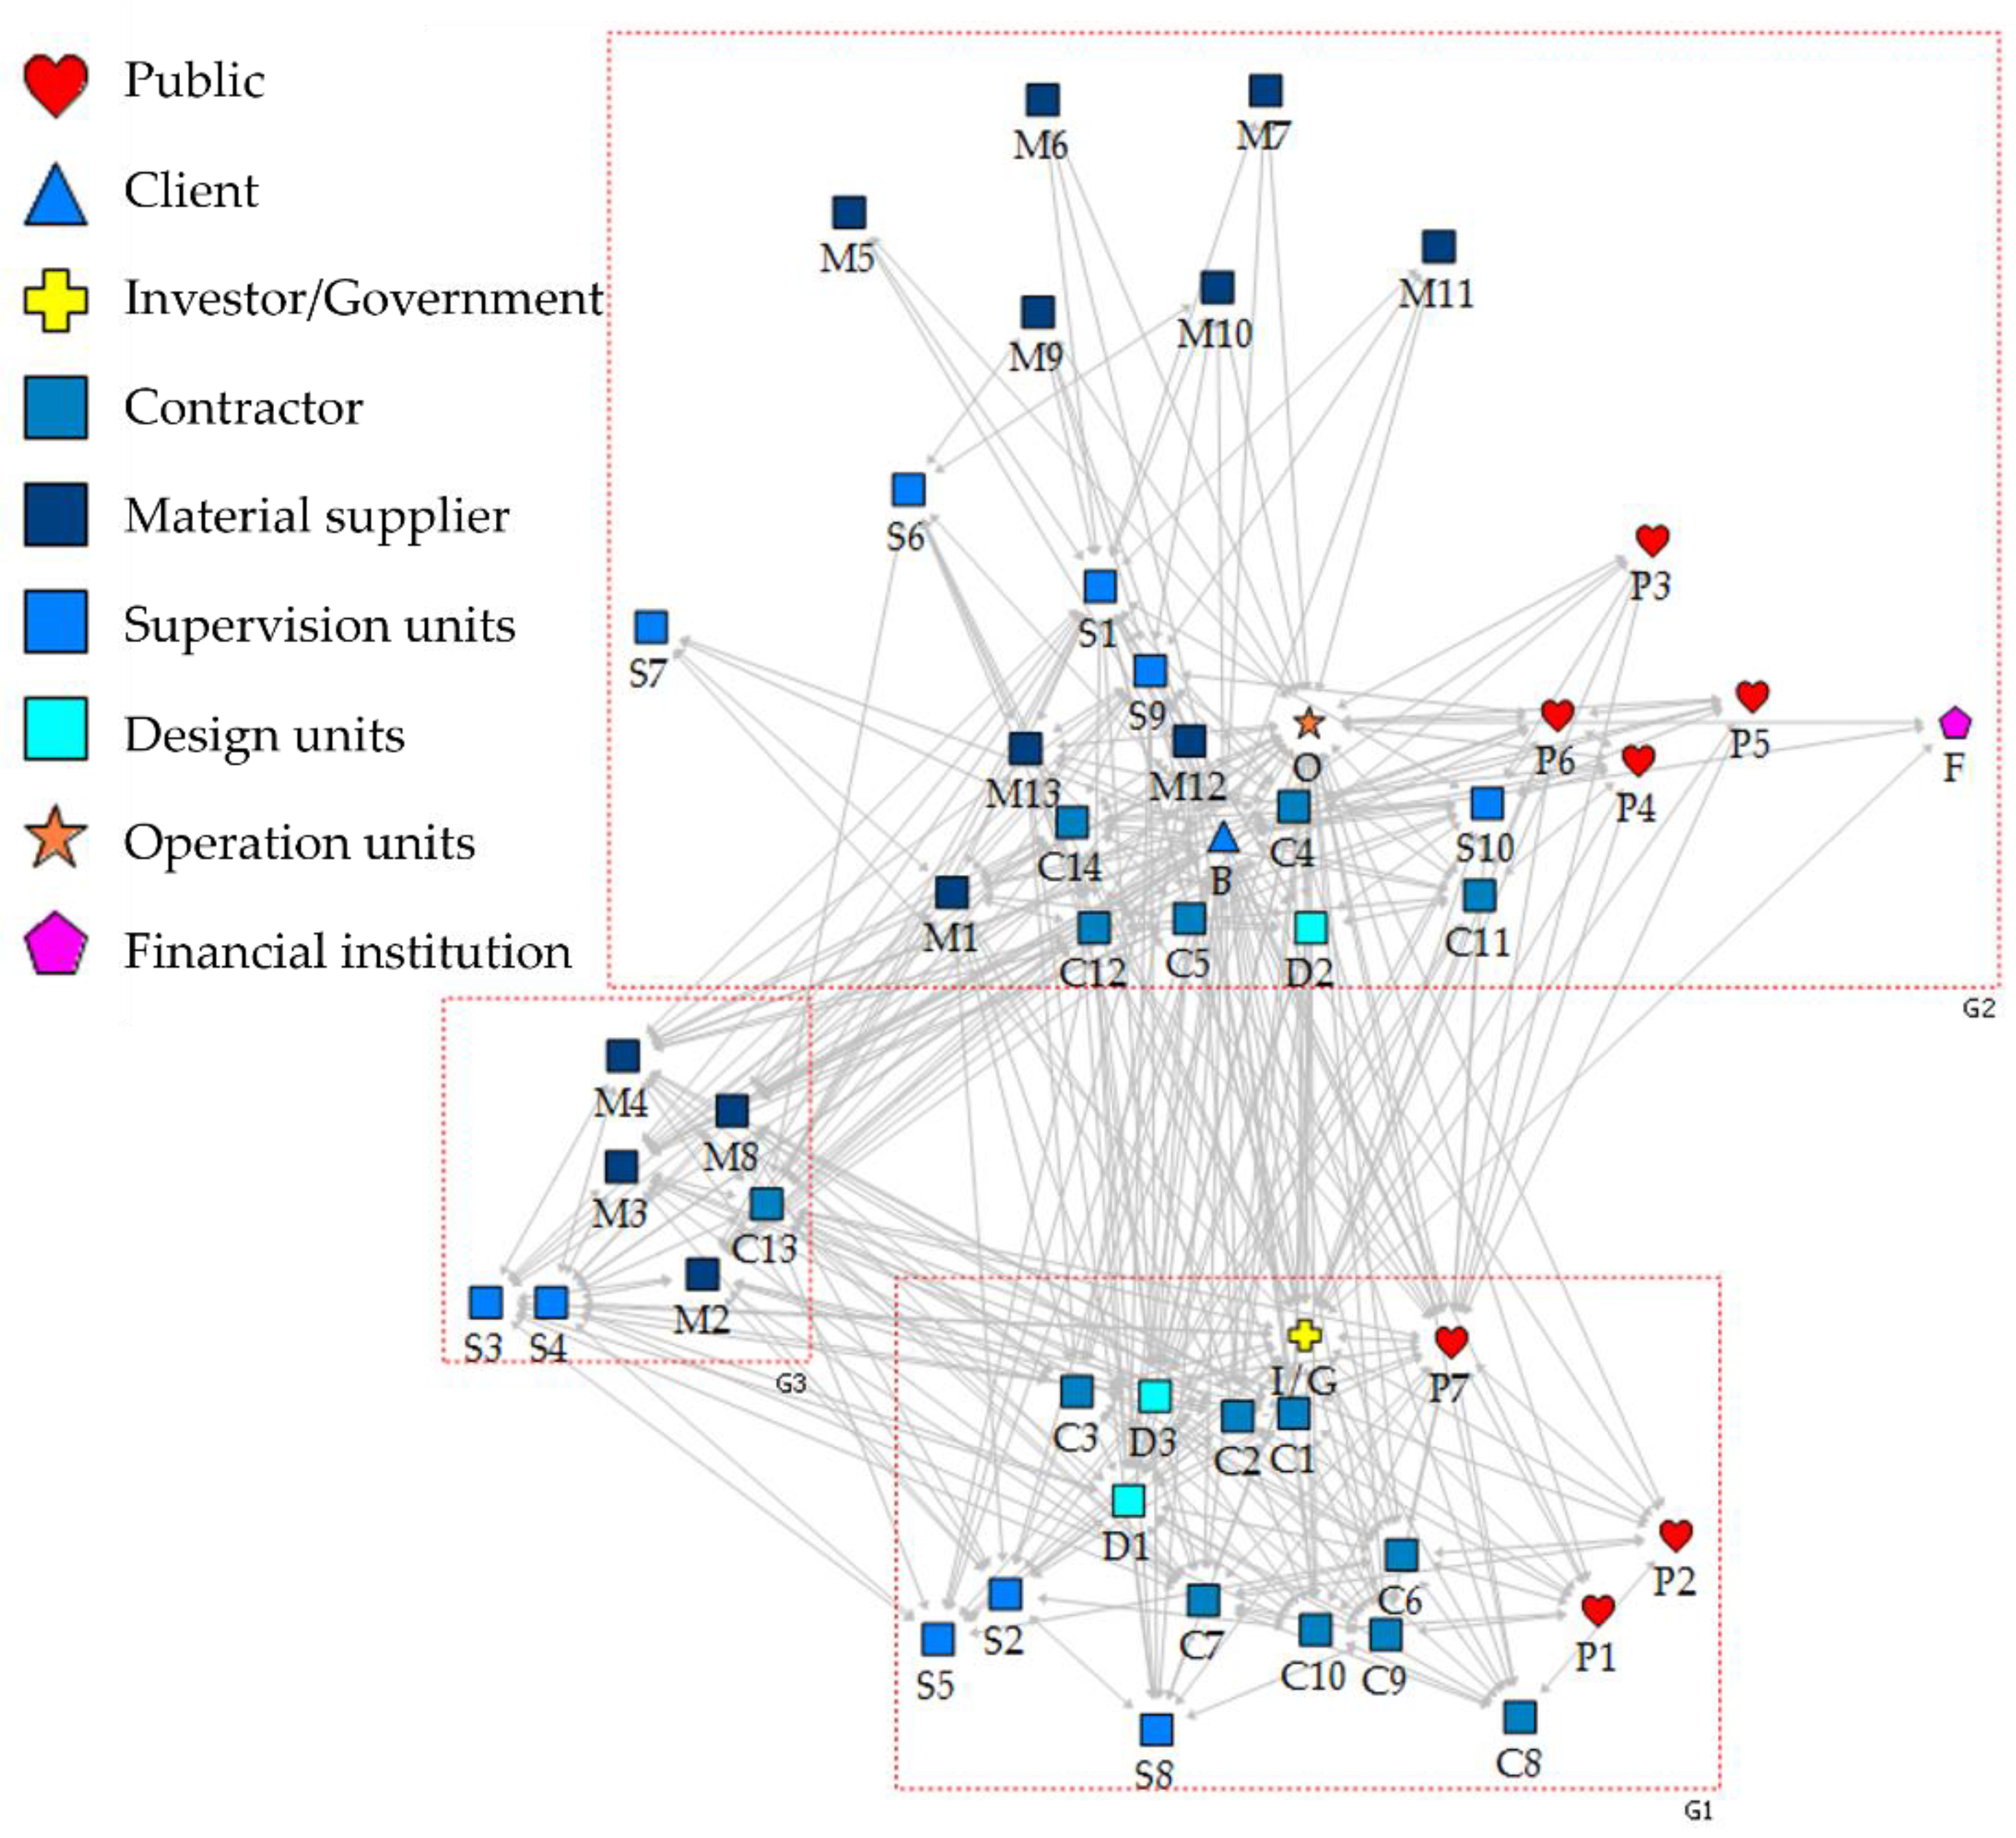
4.1. Network Nodes and Links

According to the research framework, there are three types of network nodes in a theoretical complex project system, including 15 CDFs (Table 3), 10 types of project organizations, and 10 common organization interaction ways. Before the evaluation of network links, a focus group was formed to discuss the suitability of the theoretical nodes in the case study. Seven experts participated in this project and came from various organizations, including the client, two construction units, two supervision units, one material supplier, and the investor. They consistently agreed that the initial selection of 15 CDFs and 10 interaction ways could be applied to the case study. Importantly, the expert team selected 51 major project organizations according to their experience in the case study. As shown in Table 5, the project organizations in the case study consisted of the financial institution, the client, 14 contractors, 10 supervision units, 3 design units, 13 material suppliers, the government, the investor, the operation unit, and 7 public units. The rule used when coding the nodes was that the first number represents the organizational type and the second number represents the numerical reference method.
Network links refer to the four kinds of relationships between the 15 CDFs, the 51 project organizations, and the 10 interaction ways. The weights of network links were assessed by a questionnaire survey similar to the one described in Section 3.2 (Data Collection), and four corresponding matrices were formed for network visualization. As shown in Table 6, a sample matrix consists of i row nodes ( N r 1 ~ N r i ) and j column nodes ( N c 1 ~ N c j ). The weight of the link between N r i and N c j is defined as w i j . Note that diagonal values such as w 11 are 0 in complex network analysis. For example, the 51 project organizations are both row and column nodes in the IO matrix, and 782 links were found and weighted by the questionnaire survey; in the OCDF matrix, the 51 project organizations are row nodes, the 15 CDFs are column nodes, and 66 links exist between these nodes.
The tools available for analyzing complex networks include GEPHI, MATLAB [67], NETWORKX, IGRAPH, Python, UCINET [81], NetMiner, and Pajek [82,83]. Among these tools, NetMiner is user-friendly and provides a sufficient parameter analysis. Therefore, the four matrices were input into NetMiner 4.0 and nodes were styled using different colors and types. For instance, Figure 3 shows the inter-organization network visualized by NetMiner 4.0, where nodes are styled as follows: public, red heart; investors/the government, yellow crisscross; operation units, orange star; financial institution, pink pentagon; the client, blue triangles; other construction organizations, rectangles in different degrees of blue. CDFs and interaction ways are styled in purple diamonds and green circles, respectively, in other networks.

4.2. Parameter Analysis

4.2.1. Network Synchronizability Analysis

Table 7 summarizes the global features of complex networks based on the four parameters. Network synchronizability is reflected from two perspectives: average path length and modularity. Apart from the IO network, the OCDF network and the OIW network before and after the delay have the same average path length of 1. Thus, the relative synchronizability of the three networks depends on their modularity values. The higher the modularity value is, the better synchronizability the complex network has. As can be seen in Table 6, OCDF ranks first in terms of modularity. Compared with the IO network, the OCDF network has a shorter average path length, showing greater synchronizability. In addition, the organizations interacted more frequently and effectively after the delay because the modularity increased by 47.9%.
The IO network has the highest density and clustering coefficient. However, the network performs the best when the values of both parameters are close to 1. This indicates that, in the case study project, organizational relationships were supposed to be enhanced for rapid information flow and effective cooperation.

4.2.2. Key Construction Delay Factors

Table 8 presents a comprehensive ranking of the 15 CDFs based on the analysis of the five parameters. Delay 2 (safety accidents) was recognized as the most influential factor in the case study project. This result is highly consistent with the case study because a total of seven safety accidents occurred from April 2014 to July 2016 and resulted in a project delay as well as four deaths and one injury. The second-ranked CDF is Delay 1 (Prominent problems of land expropriation). It also postponed the project because neighbors around the construction site (Lianzhuang Station) were afraid of damage to the environment. Another four key CDFs include Delay 5 (Unreasonable timelines by clients), Delay 6 (Improper construction design), Delay 7 (Delayed payments), and Delay 9 (High financial risk). After comparing the theoretical key CDFs and the actual reasons for delays, we found five ‘overlapping’ factors among the seven actual causes of delay, proving the applicability of the CNS theory to complex projects.

4.2.3. Signal Organizations in Synchronization

Signal organizations are closely connected to other units and are usually the first ones to identify delays. In this study, five parameters (degree, degree centrality, betweenness centrality, closeness centrality, and eigenvector centrality) were analyzed to find critical organizations in the IO network. Figure 4a, Figure 4b, and Figure 4c represent the degree, degree centrality, and betweenness centrality in the IO network, respectively. The other two-parameter analysis yielded consistent results and had similar graphs to those shown in Figure 4. As shown in Figure 4, the signal organizations consist of the client, investors/governments, the operation unit, two design units (D1 and D3), one public unit (P7), one supervision unit (S1), and one contractor (C12).
Figure 5 presents the visualization of the OCDF network, revealing the relationships between organizations and CDFs. One can easily observe that those signal organizations are close to the seven key CDFs. S1 and C12 are the supervisors and contractors, respectively, in the southern project section who were the parties responsible for safety accidents that occurred in this section. P7 represents the community protesting the construction of Lianzhuang Station; the construction design supplied by D1 and D3 had several mistakes and led to rework. In addition, the government and the client failed to solve the problems of land expropriation and proposed an unreasonable project period due to an underestimation of the construction project’s difficulty. The consistency of signal organizations and responsible units also proves the feasibility of the CNS theory’s application. Thus, it is possible to predict the specific organizations responsible for delays in complex projects.

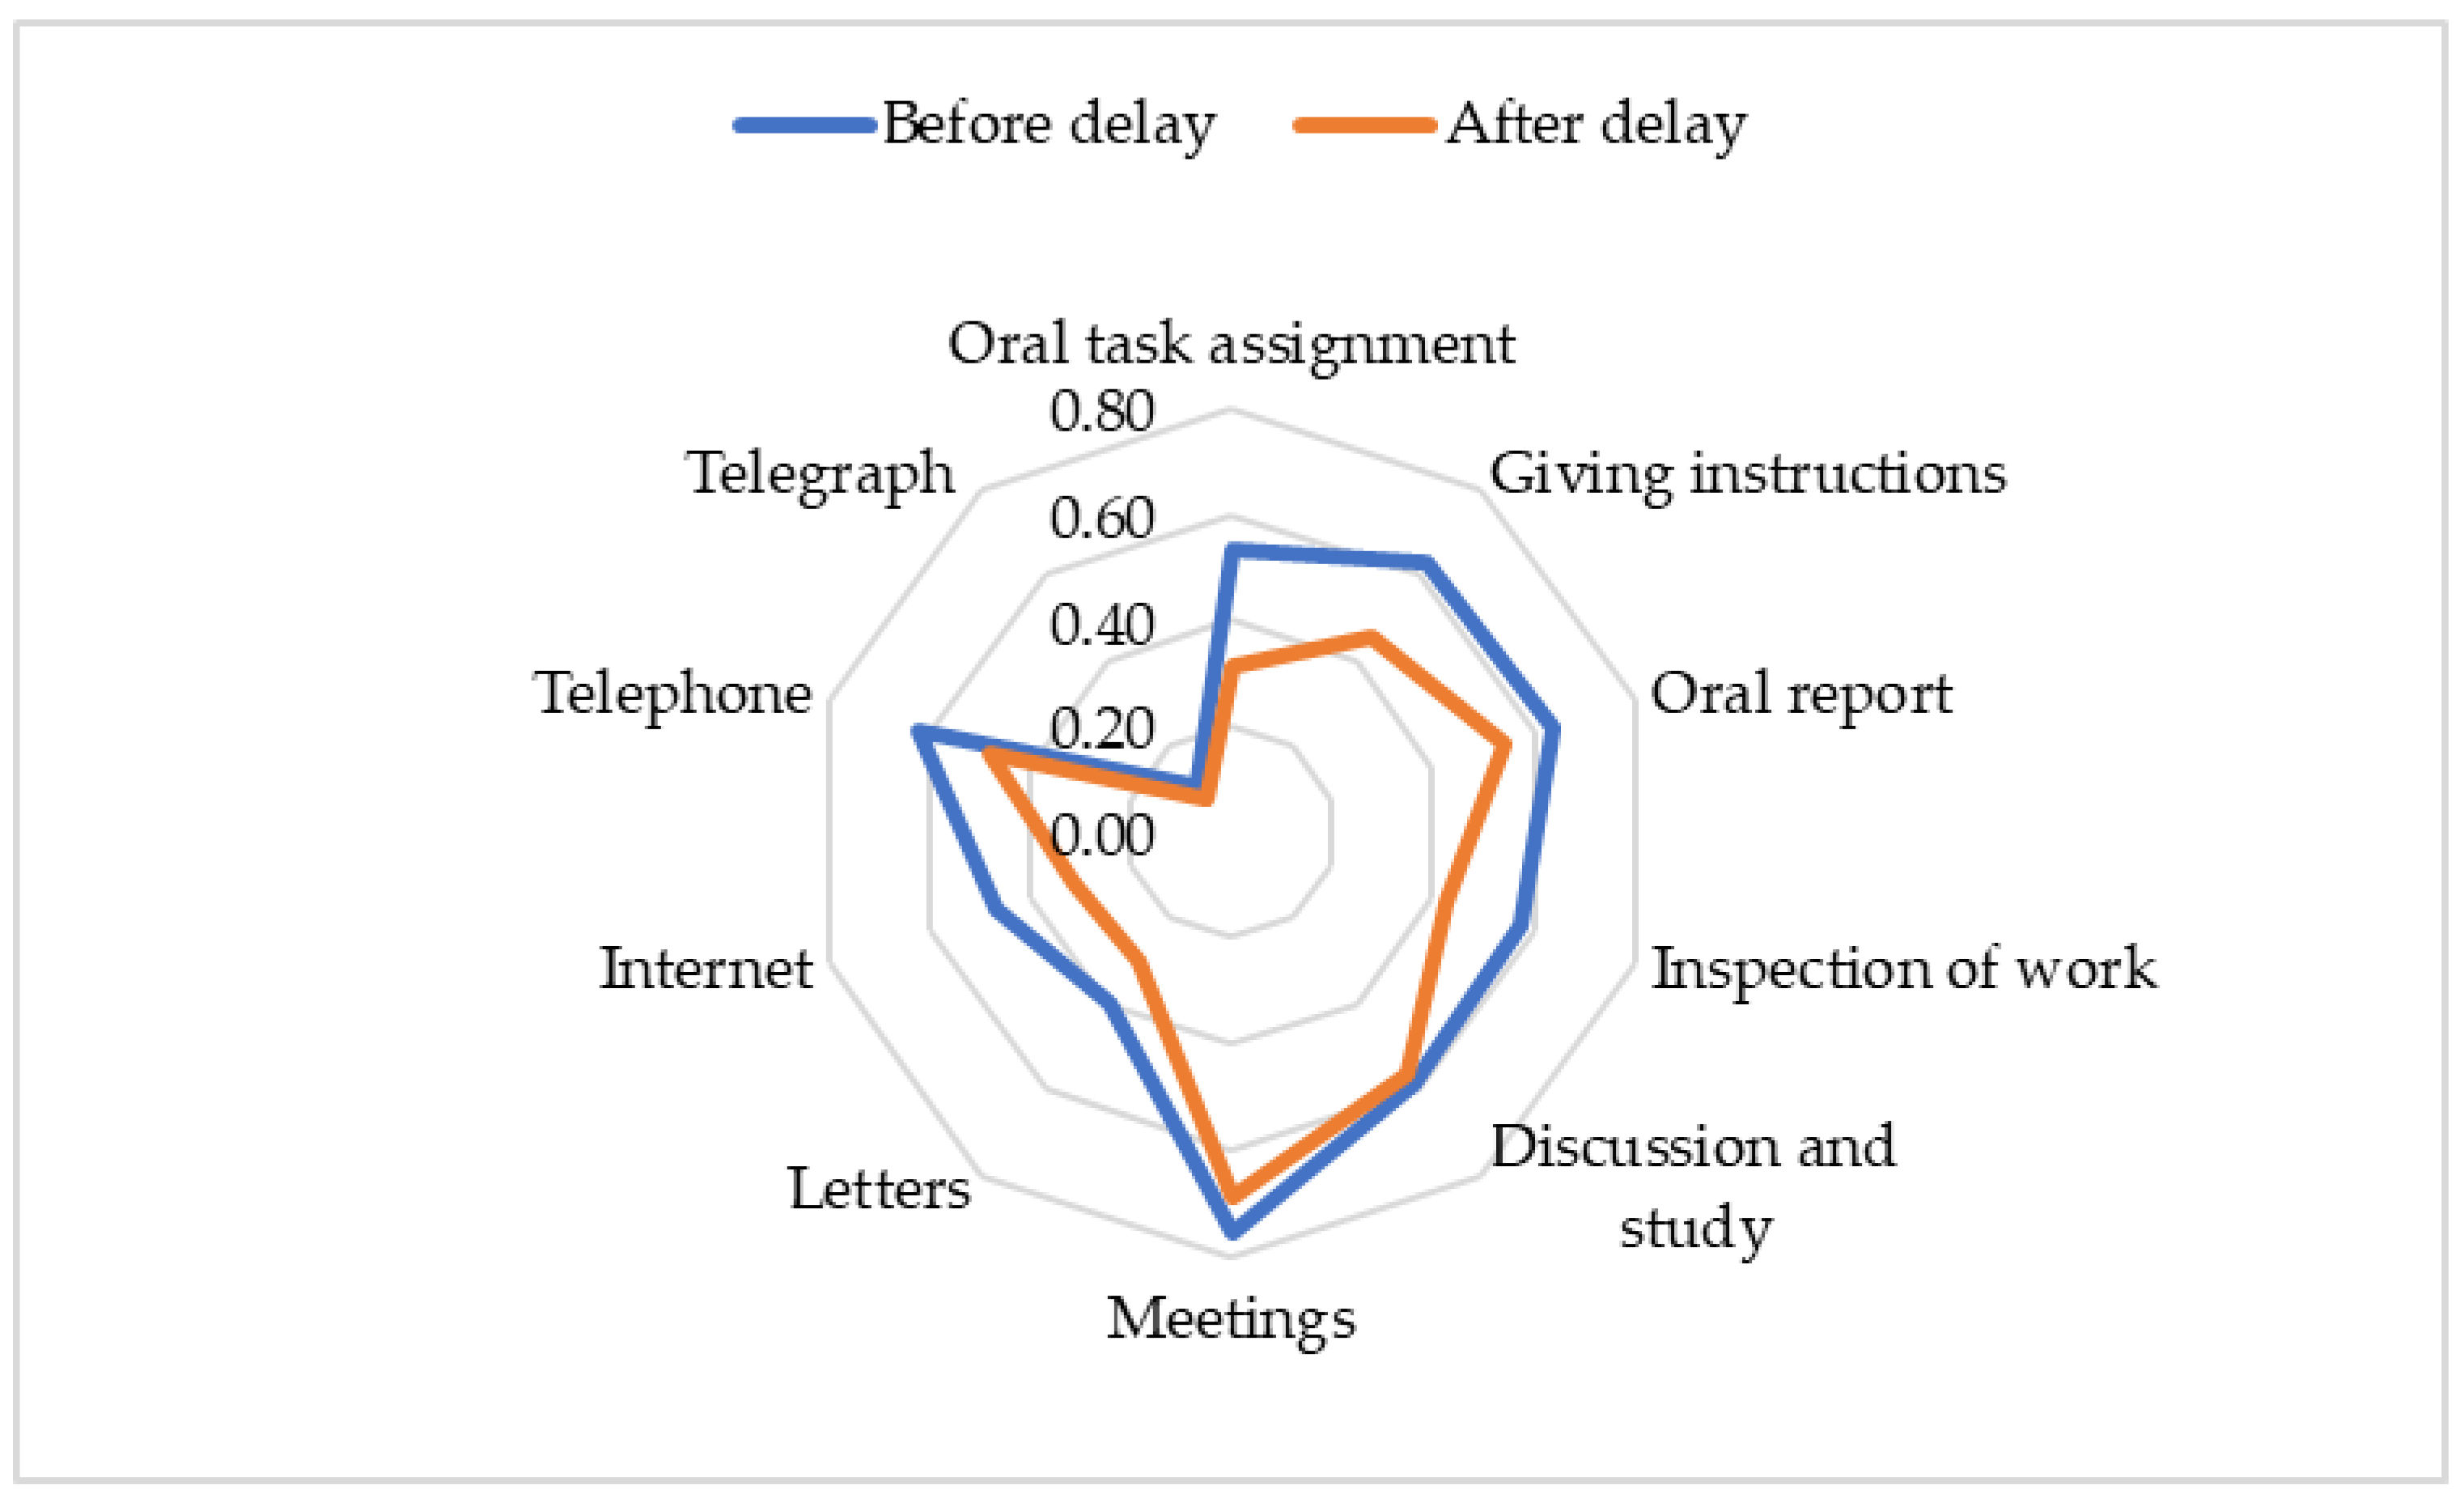
4.2.4. Effective Interactions in Organization Synchronization

The above-described research results show that the network synchronizability after the delay increased, and seven key CDFs and related signal organizations were accurately identified. In other words, when faced with the key CDFs, signal organizations interacted with each other to achieve better cooperation. Hence, we determined the variations in organization interaction ways. Figure 6 illustrates the degree distribution of the OIW network before and after the delay. As can be intuitively seen in Figure 6, the values for Inf 6 (Meetings), Inf 3 (Oral reports), Inf 5 (Discussions and studies), and Inf 2 (Giving instructions) are large; thus, they possibly play leading roles in organization synchronization.
Further comprehensive studies were conducted to determine the importance of interaction ways in organizations and make a comparison before and after the delay. Table 9 and Table 10 present the parameter values and rankings of the 10 interaction ways. We found that discussions and studies, meetings, and the Internet were used more frequently after the delay, indicating the effectiveness of these three interaction ways in organization synchronization.

5. Discussion

The application of the CNS theory lends credence to the study of organization synchronization in complex projects. To achieve our research objectives, this study involved network synchronizability analysis, six key CDFs, specific signal organizations, and effective interaction ways in the synchronization process.
Network synchronizability was tested in four kinds of networks by two global parameters (average path length and modularity). Results show that the network synchronizability was improved because the modularity increased by 47.9%, while the average path length remained the same after the project delay. However, it is not clear whether the synchronizability after the delay reached a level that is sufficient for complex projects since there is little similar research. Thus, to discuss the reasonableness of the results, a further review of the literature was used to check whether the case study project had met the boundary conditions. This study was based on a rule that states that network synchronizability is inversely proportional to average path length and positively proportional to modularity [38]. However, studies have proved that the rule related to average path length is useful when the number of all nodes and new nodes remains the same during the project period [84]. The case study involved a static network analysis focusing on the entire project life cycle, meaning that there was no variation in the number of nodes.
Six key CDFs were identified by statistical and network analysis (Delay 2 (Safety accidents), Delay 1 (Prominent problems of land expropriation), Delay 5 (Unreasonable timelines by clients), Delay 6 (Improper construction designs), Delay 7 (Delayed payments), and Delay 9 (High financial risk)). Previous studies also recognized the effect of these factors, and they generally pointed out that delays are most related to clients, contractors, and designers [20,25,32,85,86]. In green buildings, the delivery of materials by suppliers was found to play an important role in the construction process [35]. In contrast, we developed an OCDF network to identify the critical organizations that perceived delays the earliest and transmitted signals the fastest.
Specific signal organizations were found in the case study, including the client, investors/governments, the operation unit, two design units (D1 and D3), one public unit (P7), one supervision unit (S1), and one contractor (C12). Compared with previous studies, we achieved a relatively accurate identification of organizations who are responsible for coping with project delays. It is worth noting that supervisors could play a mediating role in complex projects and contribute to the safety of workers [87,88]. Regarding the frequent safety accidents in complex projects, both contractors and supervisors should be cared for, particularly in terms of psychological needs [89].
Researchers also suggest that organizations are supposed to enhance communication and cooperation, but few have proposed specific strategies. As reviewed above, organization interactions had a positive influence on project performance [90]. Therefore, in the case study, effective interactions, such as discussions and studies, meetings, and the Internet, were recognized as ways to enhance organization synchronization after a delay. In addition to the interaction ways presented in Table 2, invisible ways such as organizational culture and national culture affect decision-making performance and the quality of organization interactions [91,92]. Therefore, it is necessary to perfect the index system of interactions, advance methods for measuring the indices, and understand the mechanisms underlying organization interactions and organization synchronization.
Regarding future research, we recommend that further pilot studies be conducted on diverse complex projects, such as road and bridge construction projects and hydraulic projects. Cross-sectional analysis of these typical projects would contribute to perfecting the index system of interactions and determining the range of good synchronizability levels. In addition, the dimensions of interactions can be broadened to social effects such as communication skills and the degree of truth between two organizations. With a combination of information transmission and social effects, a more comprehensive understanding of organization synchronization can be obtained and implemented to cope with delays or other accidents in complex projects.

6. Conclusions

Organization synchronization is the dynamic process of recovering a complex project system from a disturbed state to an efficient state and can be used to deal with delays in complex projects. In this study, we adopted the CNS theory to break down the synchronization process by assessing network synchronizability, identifying key CDFs, and finding signal organizations and productive interactions after delays. To address these points, we established a research framework involving multiple methods and validated the feasibility of applying the CNS theory through a case study.
Our research results can be summarized as follows. First, the network synchronizability was enhanced after the delay in the case study. Second, the six key CDFs in complex projects are Delay 2 (Safety accidents), Delay 1 (Prominent problems of land expropriation), Delay 5 (Unreasonable timelines by clients), Delay 6 (Improper construction designs), Delay 7 (Delayed payments), and Delay 9 (High financial risk). The theoretical CDFs were also found to be commensurate with the actual causes of delay in the case study project. Third, a broad range of signal organizations were accurately identified in the complex project and effective interaction ways (meetings, discussions and studies, and the Internet) can contribute to organization synchronization.
Therefore, this study contributes to both the theory and practice of organization synchronization in complex projects. First, it provides an innovative application of the CNS theory to the field of complex project management. Second, this study offers a comprehensive way to assess network synchronziability and node importance by considering multiple parameters simultaneously. Third, the case study based on a complex project may help researchers implement the research framework and provide useful strategies and practical guidance.
This study has some limitations. There was only one case project in China that was suitable for use in the application of the CNS theory. This brought about the limitation on generalization, which is a common problem when a case study method is used. Nonetheless, Yin argues that the aim of multiple case studies is analytical generalization using the theoretical framework of a study to establish a logic that might apply to other situations rather than statistical generalization as in surveys [93].

Author Contributions

Conceptualization, L.Y. and X.Z.; methodology, L.Y. and X.H.; software, X.H.; validation, L.Y. and X.H.; formal analysis, X.H.; investigation, L.Y. and X.H.; resources, L.Y. and X.H.; data curation, L.Y. and X.H.; writing—original draft preparation, L.Y. and X.H.; writing—review and editing, L.Y., X.H. and X.Z.; visualization, L.Y. and X.H.; supervision, L.Y. and X.Z.; project administration, L.Y.; funding acquisition, L.Y. All authors have read and agreed to the published version of the manuscript.

Funding

This research was funded by the National Science Foundation of China, grant number 71702136.

Informed Consent Statement

Not applicable.

Data Availability Statement

All the data used in this study are presented in Section 3 and Section 4.

Conflicts of Interest

The authors declare no conflict of interest.

References

  1. Hu, Y.; Chan, A.P.C.; Le, Y.; Jin, R.-Z. From Construction Megaproject Management to Complex Project Management: Bibliographic Analysis. J. Manag. Eng. 2015, 31, 04014052. [Google Scholar] [CrossRef] [Green Version]
  2. Complex Project Management—What It Is, and What Success Looks Like-EXEPRON-CCPM Software. Available online: https://exepron.com/complex-project-management-what-it-is-and-what-success-looks-like/ (accessed on 11 April 2020).
  3. Hwang, B.-G.; Zhao, X.; Ng, S.Y. Identifying the critical factors affecting schedule performance of public housing projects. Habitat Int. 2013, 38, 214–221. [Google Scholar] [CrossRef]
  4. Zhao, X.; Hwang, B.-G.; Phng, W. Construction project risk management in Singapore: Resources, effectiveness, impact, and understanding. KSCE J. Civ. Eng. 2014, 18, 27–36. [Google Scholar] [CrossRef]
  5. Luo, L.; He, Q.; Xie, J.; Yang, D.; Wu, G. Investigating the Relationship between Project Complexity and Success in Complex Construction Projects. J. Manag. Eng. 2017, 33, 04016036. [Google Scholar] [CrossRef]
  6. Flyvbjerg, B. Survival of the unfittest: Why the worst infrastructure gets built—and what we can do about it. Oxf. Rev. Econ. Policy 2009, 25, 344–367. [Google Scholar] [CrossRef]
  7. Baccarini, D. The concept of project complexity—A review. Int. J. Proj. Manag. 1996, 14, 201–204. [Google Scholar] [CrossRef] [Green Version]
  8. Shane, J.; Strong, K.; Gransberg, D.; Strategic Highway Research Program; Strategic Highway Research Program Renewal Focus Area; Transportation Research Board; National Academies of Sciences, Engineering, and Medicine. Guide to Project Management Strategies for Complex Projects; Transportation Research Board: Washington, DC, USA, 2013. [Google Scholar]
  9. Hui, L. Research on the Structure of the Complexity of Complex Project System. Soft Sci. 2009, 23, 75–79. [Google Scholar]
  10. Senescu, R.R.; Aranda-Mena, G.; Haymaker, J.R. Relationships between Project Complexity and Communication. J. Manag. Eng. 2013, 29, 183–197. [Google Scholar] [CrossRef]
  11. Ahn, S.; Shokri, S.; Lee, S.; Haas, C.T.; Haas, R.C.G. Exploratory Study on the Effectiveness of Interface-Management Practices in Dealing with Project Complexity in Large-Scale Engineering and Construction Projects. J. Manag. Eng. 2017, 33, 04016039. [Google Scholar] [CrossRef]
  12. Safapour, E.; Kermanshachi, S.; Habibi, M.; Shane, J. Resource-Based Exploratory Analysis of Project Complexity Impact on Phase-Based Cost Performance Behavior. In Proceedings of the Construction Research Congress 2018, New Orleans, LA, USA, 2–4 April 2018; pp. 439–448. [Google Scholar]
  13. Trinh, M.T.; Feng, Y. Impact of Project Complexity on Construction Safety Performance: Moderating Role of Resilient Safety Culture. J. Constr. Eng. Manag. 2020, 146, 04019103. [Google Scholar] [CrossRef]
  14. Ahern, T.; Leavy, B.; Byrne, P.J. Complex project management as complex problem solving: A distributed knowledge management perspective. Int. J. Proj. Manag. 2014, 32, 1371–1381. [Google Scholar] [CrossRef] [Green Version]
  15. Bygballe, L.E.; Swärd, A.R.; Vaagaasar, A.L. Coordinating in construction projects and the emergence of synchronized readiness. Int. J. Proj. Manag. 2016, 34, 1479–1492. [Google Scholar] [CrossRef]
  16. Jacobsson, M. On the importance of liaisons for coordination of projects. Int. J. Manag. Proj. Bus. 2011, 4, 64–81. [Google Scholar] [CrossRef]
  17. Wu, G.; Zhao, X.; Zuo, J.; Zillante, G. Effects of contractual flexibility on conflict and project success in megaprojects. Int. J. Confl. Manag. 2018, 29, 253–278. [Google Scholar] [CrossRef]
  18. Wu, G.; Zhao, X.; Zuo, J.; Zillante, G. Effects of team diversity on project performance in construction projects. Eng. Constr. Arch. Manag. 2019, 26, 408–423. [Google Scholar] [CrossRef]
  19. Assaf, S.A.; Al-Hejji, S. Causes of delay in large construction projects. Int. J. Proj. Manag. 2006, 24, 349–357. [Google Scholar] [CrossRef]
  20. Gomarn, P.; Pongpeng, J. Causes of construction delay from contractors and suppliers in Thailand’s oil and gas platform projects. MATEC Web Conf. 2018, 192, 02008. [Google Scholar] [CrossRef]
  21. Zarei, B.; Sharifi, H.; Chaghouee, Y. Delay causes analysis in complex construction projects: A Semantic Network Analysis approach. Prod. Plan. Control 2017, 29, 29–40. [Google Scholar] [CrossRef]
  22. Abbasi, O.; Noorzai, E.; Jafari, K.G.; Golabchi, M. Exploring the Causes of Delays in Construction Industry Using a Cause-and-Effect Diagram: Case Study for Iran. J. Arch. Eng. 2020, 26, 05020008. [Google Scholar] [CrossRef]
  23. Chen, L.; Lu, Q.; Zhao, X. Rethinking the Construction Schedule Risk of Infrastructure Projects Based on Dialectical Systems and Network Theory. J. Manag. Eng. 2020, 36, 04020066. [Google Scholar] [CrossRef]
  24. Larsen, J.K.; Shen, G.Q.; Lindhard, S.M.; Brunoe, T.D. Factors Affecting Schedule Delay, Cost Overrun, and Quality Level in Public Construction Projects. J. Manag. Eng. 2016, 32, 04015032. [Google Scholar] [CrossRef] [Green Version]
  25. Gebrehiwet, T.; Luo, H. Analysis of Delay Impact on Construction Project Based on RII and Correlation Coefficient: Empirical Study. Procedia Eng. 2017, 196, 366–374. [Google Scholar] [CrossRef]
  26. Choong Kog, Y. Major Construction Delay Factors in Portugal, the UK, and the US. Pract. Period. Struct. Des. Constr. 2018, 23, 04018024. [Google Scholar] [CrossRef]
  27. Ruqaishi, M.; Bashir, H.A. Causes of Delay in Construction Projects in the Oil and Gas Industry in the Gulf Cooperation Council Countries: A Case Study. J. Manag. Eng. 2015, 31, 05014017. [Google Scholar] [CrossRef]
  28. Zhang, X.; Tariq, S. Failure Mechanisms in International Water PPP Projects: A Public Sector Perspective. J. Constr. Eng. Manag. 2020, 146, 04020055. [Google Scholar] [CrossRef]
  29. Alsuliman, J.A. Causes of delay in Saudi public construction projects. Alex. Eng. J. 2019, 58, 801–808. [Google Scholar] [CrossRef]
  30. Hwang, B.-G.; Zhao, X.; van Do, T.H. Influence of Trade-Level Coordination Problems on Project Productivity. Proj. Manag. J. 2014, 45, 5–14. [Google Scholar] [CrossRef]
  31. Tafazzoli, M.; Shrestha, P. Factor Analysis of Construction Delays in the U.S. Construction Industry. In Proceedings of the International Conference on Sustainable Infrastructure 2017, New York, NY, USA, 26–28 October 2017; pp. 111–122. [Google Scholar]
  32. Gamil, Y.; Rahman, I.A. Assessment of critical factors contributing to construction failure in Yemen. Int. J. Constr. Manag. 2018, 20, 429–436. [Google Scholar] [CrossRef]
  33. Bashir, H.; Ojiako, U.; Mota, C. Modeling and Analyzing Factors Affecting Project Delays Using an Integrated Social Network-Fuzzy MICMAC Approach. Eng. Manag. J. 2019, 32, 26–36. [Google Scholar] [CrossRef]
  34. Hwang, B.G.; Leong, L.P. Comparison of schedule delay and causal factors between traditional and green construction projects. Technol. Econ. Dev. Econ. 2013, 19, 310–330. [Google Scholar] [CrossRef] [Green Version]
  35. Hwang, B.-G.; Zhao, X.; Tan, L.L.G. Green building projects: Schedule performance, influential factors and solutions. Eng. Constr. Archit. Manag. 2015, 22, 327–346. [Google Scholar] [CrossRef]
  36. Lehnert, J. (Ed.) Synchronization in Complex Networks. In Controlling Synchronization Patterns in Complex Networks; Springer International Publishing: Cham, Switzerland, 2016; pp. 33–41. [Google Scholar]
  37. Li, C.; Chen, G. Synchronization in general complex dynamical networks with coupling delays. Phys. A Stat. Mech. Its Appl. 2004, 343, 263–278. [Google Scholar] [CrossRef]
  38. Arenas, A.; Diaz-Guilera, A.; Kurths, J.; Moreno, Y.; Zhou, C. Synchronization in complex networks. Phys. Rep. 2008, 469, 93–153. [Google Scholar] [CrossRef] [Green Version]
  39. Mogan, R.; Fischer, R.; Bulbulia, J.A. To be in synchrony or not? A meta-analysis of synchrony’s effects on behavior, perception, cognition and affect. J. Exp. Soc. Psychol. 2017, 72, 13–20. [Google Scholar] [CrossRef]
  40. Macpherson, M.C.; Fay, N.; Miles, L.K. Seeing synchrony: A replication of the effects of task-irrelevant social information on perceptions of interpersonal coordination. Acta Psychol. 2020, 209, 103140. [Google Scholar] [CrossRef]
  41. Li, L.; Xiao, J.; Peng, H.; Yang, Y.; Chen, Y. Improving synchronous ability between complex networks. Nonlinear Dyn. 2012, 69, 1105–1110. [Google Scholar] [CrossRef]
  42. Lu, P.; Yuan, S.; Wu, J. The interaction effect between intra-organizational and inter-organizational control on the project performance of new product development in open innovation. Int. J. Proj. Manag. 2017, 35, 1627–1638. [Google Scholar] [CrossRef]
  43. Herrera, R.F.; Mourgues, C.; Alarcón, L.F.; Pellicer, E. Understanding Interactions between Design Team Members of Construction Projects Using Social Network Analysis. J. Constr. Eng. Manag. 2020, 146, 04020053. [Google Scholar] [CrossRef]
  44. Melander, L.; Lakemond, N. Governance of supplier collaboration in technologically uncertain NPD projects. Ind. Mark. Manag. 2015, 49, 116–127. [Google Scholar] [CrossRef] [Green Version]
  45. Chinowsky, P.; Taylor, J.E.; Di Marco, M. Project Network Interdependency Alignment: New Approach to Assessing Project Effectiveness. J. Manag. Eng. 2011, 27, 170–178. [Google Scholar] [CrossRef]
  46. Khouja, A.; Lehoux, N.; Cimon, Y.; Cloutier, C. Collaborative Interorganizational Relationships in a Project-Based Industry. Buildings 2021, 11, 502. [Google Scholar] [CrossRef]
  47. Solis, F.; Sinfield, J.V.; Abraham, D.M. Hybrid Approach to the Study of Inter-Organization High Performance Teams. J. Constr. Eng. Manag. 2013, 139, 379–392. [Google Scholar] [CrossRef]
  48. Sun, J.; Lei, K.; Cao, L.; Zhong, B.; Wei, Y.; Li, J.; Yang, Z. Text visualization for construction document information management. Autom. Constr. 2019, 111, 103048. [Google Scholar] [CrossRef]
  49. Choi, Y.-K. Principles of Applied Civil Engineering Design: Producing Drawings, Specifications, and Cost Estimates for Heavy Civil Projects, 2nd ed.; American Society of Civil Engineers: Reston, VA, USA, 2017. [Google Scholar]
  50. Shohet, I.M.; Frydman, S. Communication Patterns in Construction at Construction Manager Level. J. Constr. Eng. Manag. 2003, 129, 570–577. [Google Scholar] [CrossRef]
  51. Ellis, R.; Li, S.; Zhu, Y. The effects of pre-task explicit instruction on the performance of a focused task. System 2019, 80, 38–47. [Google Scholar] [CrossRef]
  52. Forcada, N.; Serrat, C.; Rodríguez, S.; Bortolini, R. Communication Key Performance Indicators for Selecting Construction Project Bidders. J. Manag. Eng. 2017, 33, 04017033. [Google Scholar] [CrossRef] [Green Version]
  53. Loosemore, M. Crisis Management in Construction Projects; American Society of Civil Engineers: Reston, VA, USA, 2000. [Google Scholar]
  54. Castillo, T.; Alarcón, L.F.; Pellicer, E. Influence of Organizational Characteristics on Construction Project Performance Using Corporate Social Networks. J. Manag. Eng. 2018, 34, 04018013. [Google Scholar] [CrossRef] [Green Version]
  55. Lee, C.Y.; Chong, H.-Y.; Liao, P.-C.; Wang, X. Critical Review of Social Network Analysis Applications in Complex Project Management. J. Manag. Eng. 2018, 34, 04017061. [Google Scholar] [CrossRef] [Green Version]
  56. Yang, M.; Chen, H.; Xu, Y. Stakeholder-Associated Risks and Their Interactions in PPP Projects: Social Network Analysis of a Water Purification and Sewage Treatment Project in China. Adv. Civ. Eng. 2020, 2020, 8897196. [Google Scholar] [CrossRef]
  57. Malisiovas, A.; Song, X. Social Network Analysis (SNA) for Construction Projects’ Team Communication Structure Opti-mization. In Proceedings of the Construction Research Congress 2014, Atlanta, GA, USA, 19–24 May 2014; pp. 2032–2042. [Google Scholar]
  58. Lu, W.; Xu, J.; Söderlund, J. Exploring the Effects of Building Information Modeling on Projects: Longitudinal Social Network Analysis. J. Constr. Eng. Manag. 2020, 146, 04020037. [Google Scholar] [CrossRef]
  59. Watts, D.J.; Strogatz, S.H. Collective dynamics of ‘small-world’ networks. Nature 1998, 393, 440–442. [Google Scholar] [CrossRef] [PubMed]
  60. Kuan, L.; Qixin, S. Research progress of complex network synchronization control. In Proceedings of the 2020 International Conference on Intelligent Design (ICID), Xi’an, China, 11–13 December 2020; pp. 23–28. [Google Scholar]
  61. Lu, J. Synchronization of complex networks: Theories, approaches, applications and prospects. Adv. Appl. Mech. 2008, 38, 713–722. [Google Scholar]
  62. Xing, W.; Shi, P.; Agarwal, R.K.; Zhao, Y. A survey on global pinning synchronization of complex networks. J. Frankl. Inst. 2019, 356, 3590–3611. [Google Scholar] [CrossRef]
  63. Hong, H.; Kim, B.J.; Choi, M.; Park, H. Factors that predict better synchronizability on complex networks. Phys. Rev. E 2004, 69, 067105. [Google Scholar] [CrossRef] [Green Version]
  64. Zhou, C.; Kurths, J. Dynamical Weights and Enhanced Synchronization in Adaptive Complex Networks. Phys. Rev. Lett. 2006, 96, 164102. [Google Scholar] [CrossRef] [Green Version]
  65. Berec, V. Complexity and dynamics of topological and community structure in complex networks. Eur. Phys. J. Spec. Top. 2017, 226, 2205–2218. [Google Scholar] [CrossRef]
  66. Zhao, M.; Qu, H.; Li, G. Vulnerable Stations Identification of Urban Rail Transit Network: A Case Study of the Shenzhen Metro. In Proceedings of the ICTE 2019, Chengdu, China, 20–22 September 2019; pp. 549–559. [Google Scholar]
  67. Jia, H.-F.; Han, J.-Q.; Li, Y.-X. Reliability Analysis of a Typical Road Network Based on the Complex Network Theory. In Proceedings of the CICTP 2016, Shanghai, China, 6–9 July 2016; pp. 2187–2200. [Google Scholar]
  68. Yang, L.; Lou, J.; Zhao, X. Risk Response of Complex Projects: Risk Association Network Method. J. Manag. Eng. 2021, 37, 05021004. [Google Scholar] [CrossRef]
  69. Pan, M.; Pan, W. Stakeholder Perceptions of the Future Application of Construction Robots for Buildings in a Dialectical System Framework. J. Manag. Eng. 2020, 36, 04020080. [Google Scholar] [CrossRef]
  70. Yuan, J.; Wang, C.; Skibniewski, M.J.; Li, Q. Developing Key Performance Indicators for Public-Private Partnership Projects: Questionnaire Survey and Analysis. J. Manag. Eng. 2012, 28, 252–264. [Google Scholar] [CrossRef]
  71. Shen, J.; Yang, G. Integrated Empirical Analysis of the Effect of Variable Message Sign on Driver Route Choice Behavior. J. Transp. Eng. Part A Syst. 2020, 146, 04019063. [Google Scholar] [CrossRef]
  72. Collins, L.M. Research Design and Methods. In Encyclopedia of Gerontology, 2nd ed.; Birren, J.E., Ed.; Elsevier: New York, NY, USA, 2007; pp. 433–442. [Google Scholar]
  73. DeVellis, R.F. Inter-Rater Reliability. In Encyclopedia of Social Measurement; Kempf-Leonard, K., Ed.; Elsevier: New York, NY, USA, 2005; pp. 317–322. [Google Scholar]
  74. Smith-Colin, J.; Amekudzi-Kennedy, A.; Kingsley, G. Role of Inputs, Processes, and Relations in Transportation System Performance Management: Case Study of Regional Transportation Collaborations. J. Manag. Eng. 2021, 37, 04020093. [Google Scholar] [CrossRef]
  75. Ahmed, H.; Edwards, D.J.; Lai, J.H.K.; Roberts, C.; Debrah, C.; Owusu-Manu, D.-G.; Thwala, W.D. Post Occupancy Evaluation of School Refurbishment Projects: Multiple Case Study in the UK. Buildings 2021, 11, 169. [Google Scholar] [CrossRef]
  76. Debrah, C.; Owusu-Manu, D.-G.; Kissi, E.; Oduro-Ofori, E.; Edwards, D.J. Barriers to green cities development in developing countries: Evidence from Ghana. Smart Sustain. Built Environ. 2020. [Google Scholar] [CrossRef]
  77. Xu, Y.; Chan, A.P.C.; Yeung, J.F.Y. Developing a Fuzzy Risk Allocation Model for PPP Projects in China. J. Constr. Eng. Manag. 2010, 136, 894–903. [Google Scholar] [CrossRef]
  78. Zhao, X.; Hwang, B.-G.; Low, S.P.; Wu, P. Reducing Hindrances to Enterprise Risk Management Implementation in Construction Firms. J. Constr. Eng. Manag. 2015, 141, 04014083. [Google Scholar] [CrossRef]
  79. Hansen, D.L.; Shneiderman, B.; Smith, M.A.; Himelboim, I. (Eds.) Chapter 3-Social network analysis: Measuring, mapping, and modeling collections of connections. In Analyzing Social Media Networks with NodeXL, 2nd ed.; Morgan Kaufmann: Boston, MA, USA, 2020; pp. 31–51. [Google Scholar]
  80. Golbeck, J. (Ed.) Chapter 3-Network Structure and Measures. In Analyzing the Social Web; Morgan Kaufmann: Boston, MA, USA, 2013; pp. 25–44. [Google Scholar]
  81. Li, C.; Wang, Z. Analysis of Urban Slow-Moving Traffic Network Structure Characteristics Based on Complex Network Theory. In Proceedings of the ICCTP 2011, Nanjing, China, 14–17 August 2011; pp. 497–505. [Google Scholar]
  82. Gong, Y.; Tang, L.; Yi, H. Selection of Introduction Schemes for Guanzhong Intercity Railway Network Based on Complex Network. In Proceedings of the ICTE 2019, Chengdu, China, 20–22 September 2020; pp. 130–140. [Google Scholar]
  83. Feng, L.; Hu, X. Construction Rules of Urban Rail Transit Network Based on Complex Network Eigenvalue. In Proceedings of the ICTE 2019, Chengdu, China, 20–22 September 2020; pp. 540–548. [Google Scholar]
  84. Wang, L.; Yan, B.; Li, G.; Ma, Y.; Yang, L. Synchronization in collaboration network. Expert Syst. Appl. 2021, 170, 114550. [Google Scholar] [CrossRef]
  85. Zhang, D.; Zhang, H.; Cheng, T. Causes of Delay in the Construction Projects of Subway Tunnel. Adv. Civ. Eng. 2020, 2020, 8883683. [Google Scholar] [CrossRef]
  86. Barqawi, M.; Chong, H.-Y.; Jonescu, E. A Review of Employer-Caused Delay Factors in Traditional and Building Information Modeling (BIM)-Enabled Projects: Research Framework. Adv. Civ. Eng. 2021, 2021, 6696203. [Google Scholar] [CrossRef]
  87. Zhang, P.; Li, N.; Fang, D.; Wu, H. Supervisor-Focused Behavior-Based Safety Method for the Construction Industry: Case Study in Hong Kong. J. Constr. Eng. Manag. 2017, 143, 05017009. [Google Scholar] [CrossRef]
  88. Zhang, R.P.; Lingard, H.; Oswald, D. Impact of Supervisory Safety Communication on Safety Climate and Behavior in Construction Workgroups. J. Constr. Eng. Manag. 2020, 146, 04020089. [Google Scholar] [CrossRef]
  89. Newaz, M.T.; Davis, P.; Jefferies, M.; Pillay, M. Examining the Psychological Contract as Mediator between the Safety Behavior of Supervisors and Workers on Construction Sites. J. Constr. Eng. Manag. 2020, 146, 04019094. [Google Scholar] [CrossRef]
  90. Stewart, R.A. IT enhanced project information management in construction: Pathways to improved performance and strategic competitiveness. Autom. Constr. 2007, 16, 511–517. [Google Scholar] [CrossRef] [Green Version]
  91. Arditi, D.; Nayak, S.; Damci, A. Effect of organizational culture on delay in construction. Int. J. Proj. Manag. 2017, 35, 136–147. [Google Scholar] [CrossRef]
  92. Naoum, S.G.; Alyousif, A.-R.T.; Atkinson, A.R. Impact of National Culture on the Management Practices of Construction Projects in the United Arab Emirates. J. Manag. Eng. 2015, 31, 04014057. [Google Scholar] [CrossRef]
  93. Yin, R.K. Case Study Research: Design and Methods, 4th ed.; Sage: Thousand Oaks, CA, USA, 2009. [Google Scholar]
Figure 1. Research framework for studying organization synchronization.
Buildings 12 00662 g001
Figure 2. Comparison between organization interaction ways before and after delays.
Buildings 12 00662 g002
Figure 3. Inter-organization network.
Buildings 12 00662 g003
Figure 4. IO network: (a) degree; (b) degree centrality; (c) betweenness centrality.
Buildings 12 00662 g004
Figure 5. OCDF network.
Buildings 12 00662 g005
Figure 6. Degree distribution: (a) OIW network before the delay; (b) OIW network after the delay.
Buildings 12 00662 g006
Table 2. Organization interactions in complex projects.
InteractionsContent
Written interactionsInvestigation data, survey data, design drawings and instructions, engineering calculations, contracts, rules and regulations, organizational construction designs, situation reports, original records, statistics charts, reports, and letters [49].
Oral interactionsOral task assignments, instructions, oral reports, inspections of work, introductions, negotiations, suggestions, criticism, discussions, and studies [50,51].
Technical interactionsInternet, telephone, telegraph, computer, TV, video recording, sound recording, and radio [52].
MeetingsSite meetings, supervision meetings, and expert meetings [53].
Table 3. Ranking of CDFs.
CDFsRankMeanNV 1CDFsRankMeanNV
Prominent problems of land expropriation14.061.00Incorrect design basis153.560.50
Safety accidents23.930.87Lack of labor or unqualified labor163.530.47
Slow decisions by clients33.920.86Bad weather173.50.44
Design alterations by clients43.890.83Excavation of relics183.470.41
Unreasonable timelines by clients53.850.79Variations in laws and regulations193.460.40
Improper organizational construction design63.770.71Incompetent supervision203.420.36
Delayed payments73.750.69International transportation of materials, machines, and labor213.40.34
Unreasonable government intervention83.750.69Rising prices223.350.29
High financial risk93.710.65Machinery breakdowns233.340.28
Deferred transmission of the construction site103.70.64Conflicts with designers243.250.19
Limited capability of project managers113.690.63Disharmony with neighbors253.190.13
Supply problems from clients123.660.60Lack of supervisory strength263.170.11
Lack of communication between designers and contractors133.60.54Cultural influences273.060.00
Improper financing143.580.52
1 Normalized value (NV) = (mean − minimum mean)/(maximum mean − minimum mean).
Table 4. Parameters of complex networks.
Parameters of Complex NetworkExplanation
Network overviewDensityMeasures the network’s cohesiveness.
Average path lengthThe average distance between all node pairs.
Clustering coefficientGauges the aggregation of networks. The larger it is, the more connected the network is.
Modularity Measures the density between communities.
Node parametersEigenvector centrality Regards nodes around nodes with a high degree of eigenvector centrality as key nodes.
Betweenness centralityMeasures the extent to which a vertex plays a bridging role [79].
Closeness centralityMeasures each node’s position in the network and means the inverse of the average distance to others in some cases [79].
Degree centrality Counts the total number of connections linked to a node [79].
Degree The weighted sum of edges for a node [80].
Table 5. Node coding.
OrganizationsCodingCDFsCodingInteractionsCoding
Financial institutionsFProminent problems of land expropriationDelay 1Oral task assignmentInf1
ClientsBSafety accidentsDelay 2Giving instructionsInf2
ContractorsC (1~14)Slow decisions by clientsDelay 3Oral reportsInf3
DesignersD (1~3)Design alterations by clientsDelay 4Inspections of workInf4
SupervisorsS (1~10)Unreasonable timelines by clientsDelay 5Discussions and studiesInf5
Material suppliersM (1~13)Improper construction organizational designsDelay 6MeetingsInf6
GovernmentsGDelayed paymentsDelay 7LettersInf7
Operation unitsOUnreasonable government interventionDelay 8The InternetInf8
InvestorsI(G)Huge financial riskDelay 9TelephoneInf9
PublicP (1~7)Deferred transmission of the construction siteDelay 10TelegraphInf10
Limited capability of project managersDelay 11
Supply problems from clientsDelay 12
Lack of communication between designers and contractorsDelay 13
Improper financingDelay 14
Incorrect design basisDelay 15
Table 6. Sample matrix of complex networks.
Nodes N c 1 N c 2 N c j
N r 1 w 11 w 1 j
N r 2 w 21 w 22 w 2 j
N r i w i 1 w i 2 w i j
Table 7. Global features of complex networks.
Network ModelClustering CoefficientDensityAverage Path LengthModularity
IO network0.5660.3071.6930.164
OCDF network00.04510.284
OIW network before the delay00.12810.071
OIW network after the delay00.12310.105
Table 8. Node parameters of construction delay factors.
CDFsRankBetweenness CentralityCloseness CentralityDegree CentralityEigenvector CentralityDegree
Delay210.1750.7140.510.46426
Delay120.0820.6040.3730.36519
Delay530.0360.5670.3530.39918
Delay640.0760.5790.3330.32113
Delay750.0750.5340.2940.30917
Delay960.0350.5560.2940.3094
Delay1260.0150.5140.2550.32113
Delay1380.0150.5140.2550.30913
Delay1190.00500.0780.32115
Delay141000.4260.2940.30315
Delay10110.0030.4260.0780.0444
Delay31200000
Delay41200000
Delay81200000
Delay151200000
Table 9. Ranking of interaction ways before the delay.
NodesRankDegreeBetweenness CentralityCloseness CentralityDegree CentralityEigenvector Centrality
Inf1432.120.086110.332
Inf25300.086110.322
Inf3136.410.086110.392
Inf4829.340.0440.7260.7450.336
Inf5628.810.086110.309
Inf6334.750.086110.358
Inf7723.920.086110.271
Inf8928.760.0820.9720.9800.294
Inf9235.410.086110.367
Inf10103.260.0170.5700.4900.035
Table 10. Ranking of interaction ways after the delay.
NodesRankDegreeEigenvector CentralityBetweenness CentralityDegree
Centrality
Closeness
Centrality
Inf1717.150.2110.0490.7840.758
Inf2426.970.3340.11.01.0
Inf3236.170.4470.11.01.0
Inf4913.890.1670.0490.7840.758
Inf5332.360.4020.11.01.0
Inf6144.210.5490.11.01.0
Inf7815.190.1870.0490.7840.758
Inf8618.390.2260.0960.9800.972
Inf9520.990.2550.11.01.0
Inf10103.730.0460.0160.4710.561
Publisher’s Note: MDPI stays neutral with regard to jurisdictional claims in published maps and institutional affiliations.

