Article

Safety Risk Assessment Using a BP Neural Network of High Cutting Slope Construction in High-Speed Railway

1
Department of Engineering Management, School of Civil Engineering, Central South University, Changsha 410083, China
2
Organization Department of the CPC Loudi Municipal, Loudi 417000, China
*
Author to whom correspondence should be addressed.
Buildings 2022, 12(5), 598; https://doi.org/10.3390/buildings12050598
Submission received: 18 March 2022 / Revised: 29 April 2022 / Accepted: 1 May 2022 / Published: 5 May 2022
(This article belongs to the Special Issue Tradition and Innovation in Construction Project Management)

Abstract

:
High-speed railway construction is extending to mountainous areas, and the harsh environment and complex climate pose various risks to the slope construction. This seriously threatens human lives and causes huge economic losses. The existing research results on the construction safety risks of high cutting slope construction in HSRs are limited, and a complete set of safety risk assessment processes and methods has not yet been formed. Therefore, in this study, we aimed to develop a safety risk assessment model, including factor identification and classification and assessment data processing, to help project managers evaluate safety risks in high cutting slope construction. In this study, comprehensive identification of high cutting slope construction safety risks was carried out from three dimensions, risk technical specification, literature analysis, and case statistical analysis, and a list of risk-influencing factors was formed. Based on the historical data, a high side slope risk evaluation model was established using a BP neural network algorithm. The model was applied to the risk evaluation of HF high cutting slopes. The results show that the risk evaluation level is II; the main risks are earthwork excavation method, scaffolding equipment, slope height, slope rate, groundwater, personnel safety awareness, and construction safety risk management system. Finally, a case study was used to verify the proposed model, and control measures for safety risks were proposed. Our findings will help conduct effective safety management, add to the knowledge of construction safety risk management in terms of implementation, and offer lessons and references for future construction safety management of HSR.

1. Introduction

The high-speed railway (HSR) has become a common solution to relieve the pressure on transportation systems worldwide, especially in China. HSR provides a fast and robust travel option that enhances the movement of people as a critical national infrastructure system. In China, the construction of HSR is extending to the mountainous areas; the poor construction environment and the complex and diverse climate make the construction personnel face various risks, some of which even threaten the safety of life [1]. When the HSR line passes through adverse geological sections, manual excavation and reinforcement are required [2]. Accidents such as slope instability, slump, gushing water, mechanical injury, electric shock, and falls are prone to occur during slope construction [3]. Especially in recent years, more and more slope disasters have caused extensive losses worldwide of human life and property [4]. Therefore, it is vital to develop a safety risk assessment system to avoid or mitigate those slope disasters.
The high cutting slope refers to a soil slope with a height greater than 20 m and less than 100 m or a rocky slope with a height greater than 30 m and less than 100 m [5]. The study of high cutting slope construction originated from the study of slope stability, which is important for the safety of slope construction. Slope stability is generally influenced by soil, hydrology, vegetation, earthquakes, climate, geological conditions, groundwater, slope height, slope rate, and other factors [6]. The study of risk in slope engineering started in the 1980s, and the initial stage of the research was mainly to clarify the existence of inherent uncertainty in geotechnical engineering and to try to characterize the uncertainty of geotechnical engineering by using probabilistic methods [7].
Current studies generally use reliability analysis, the limit equilibrium method, and the strength reduction method for slope stability. Reliability analysis was applied to the study of slope sexual stability using soil parameter data extracted from field and laboratory data, and the relative contribution of the uncertainty of different parameters to slope reliability varies [8]. The impact of uncertainty on the reliability and performance evaluation of slope design is often significant. Traditional safety factor-based slope practices can not explicitly address uncertainty and thus affect the adequacy of predictions [9]. For simple homogeneous soil slopes, the calculation results of the limit equilibrium method and strength reduction method are essentially the same [10].
For slope construction safety, the stability of slopes has also been analyzed using kinematic laws and digital elevation models. Ref. [11] used kinematic laws and digital elevation models for the study area to develop probabilistic risk maps for planar, tipping, and wedge damage. By comparing the actual fault distribution in the area with the probabilistic risk map prepared for the study area, it was found that the identified faults were located in the higher risk areas on the probabilistic risk map. Ref. [12] analyzed the fundamental changes of a particle subjected to flow dynamics, deposition, and erosion processes at high slope angles. Ref. [13] developed a nonlinear mathematical model for the degradation of sensitive clay soils after peak undrained shear strength based on experimental results.
In summary, the existing research mainly focuses on the stability analysis of slopes and the analysis of landslide hazard risk during the operation period of HSR, while the research on the safety risks occurring during the construction period of HSR is relatively rare. In actual engineering practice, the existing analysis of sliding stability of high cutting slopes mostly adopts the deterministic analysis method, which determines whether the damage will occur by calculating the safety coefficient of anti-sliding stability. The deterministic analysis method is more frequently used because the calculation is relatively simple and the result is more intuitive. However, there are a lot of uncertain parameters in the actual construction process of the high cutting slope of HSR, and the deterministic analysis method can not consider the influence of parameter uncertainty. Therefore, consideration of random factors and their construction dynamics in the analysis of the high cutting slope of HSR deserves further discussion and has important research value.
In 1943, the first neuronal M-P model was proposed by McCulloch-Pitts, and the research on neural networks began [14,15]. Since then, more derivative models of neural networks have emerged. After Rosenblatt’s first perceptron model in 1957, many influential models have been proposed [16,17]. Neural networks rapidly developed and were used within different fields [18]. Neural networks have various functions, such as learning, training, simulation, storage, and error removal, which allow them to develop rapidly in many fields and achieve great success in signal processing, pattern recognition, etc. In recent years, more and more scholars have applied them in the research of artificial intelligence [19,20,21,22,23,24,25]. Scholars have applied BP neural networks to construction risk assessment and achieved a large number of results, which fully demonstrate the feasibility of BP neural networks for construction risk assessment [2,26,27,28]. A BP neural network is a nonlinear dynamical system that constructs a model to realize nonlinear analysis by learning and understanding historical data. Compared with the conventional linear analysis methods, a BP neural network has the following advantages [29,30]: (i) it can process data with ambiguous feature performance and logical relationships; (ii) it can process nonlinear characteristic random noisy data; and (iii) it does not require an in-depth understanding of the simulation process. In the case of having more uncertainty, the neural network model can fully demonstrate its superiority in processing data. Based on the above advantages, a BP neural network was selected as the model for risk evaluation in this study.
The paper is organized as follows. Section 2 introduces the data and methods, which includes factor identification and classification (Section 2.1, Section 2.2, Section 2.3), construction safety risk assessment index system (Section 2.4), risk classification criteria (Section 2.5), and assessment model (Section 2.6). Section 3 presents a case study to verify the practicality of the proposed model and discusses the results, then, major conclusions and implications are drawn (Section 4).

2. Data and Methods

Many factors that are not interconnected are stimulated by a certain condition to produce a chain reaction leading to the existence of risk. Thus, the existence of accidents is not caused by a single factor. The construction safety risk of the high cutting slope of HSR has the characteristics of suddenness, damage, complexity, objectivity, and development. This also determines the unpredictability and diversity of its risk-influencing factors.
This study started with the technical specification of railway roadbed risk management to grasp the process of high cutting slope engineering of HSR and the common accidents and problems in the process of slope construction. Our goal was to make it easier to understand construction safety risks. Through literature review and practical research on slope stability, the main influencing factors of instability were studied. The occurrence of accidents is often related to people, materials, the environment, construction management, and other factors. Therefore, through the collection of relevant information and cases to supplement the construction safety risk factors of HSR, the personnel factors and construction management factors were fully considered to form a comprehensive list of construction safety risks.

2.1. Construction Safety Risk Identification Based on Technical Specifications

Technical code for risk management of railway subgrade engineering [31] gives the influencing factors of the construction safety risks of the high cutting slope, which play a reference role in the selection of risk factors in this study. Construction safety risk factors identified for the high cutting slope in HSR are shown in Table 1.

2.2. Construction Safety Risk Identification Based on Documentary Data

Through combing and screening statistics of related literature, the factors affecting the construction safety of the high cutting slope in HSR were derived, as shown in Table 2.

2.3. Construction Safety Risk Identification Based on Statistical Analysis of Cases

The construction safety risk identification was carried out through the high cutting slopes related to HK and HSH, two high-speed railways in China, and the risk identification table for the statistical analysis of the cases was formed as shown in Table 3.

2.4. Construction Safety Risk Assessment Index System for High Cut Slope of HSR

Through SPSS software for analysis, combined with engineering practice, the construction safety risk factors were classified and summarized according to the principle of systemic feasibility. The secondary risk indicators include 5 items such as personnel risk, and the tertiary risk indicators include 39 items such as earth excavation. The risk assessment index system is formed in Table 4.

2.5. Risk Classification Criteria of Safety in Construction

With a large number of risks and a variety of risk control measures in the construction of high cutting slopes in HSR., it is necessary to evaluate risks reasonably, effectively, and objectively, select appropriate risk control measures, and carry out scientific engineering decisions and risk evaluation. A key part of the evaluation is the need to study the corresponding risk acceptance criteria and control countermeasures. According to the Technical Code for Risk Management of Railway Construction Engineering [47], the risk acceptance criteria for high cutting slopes in HSR are shown in Table 5.

2.6. BP Neural Network Model

2.6.1. Design of Network Topology

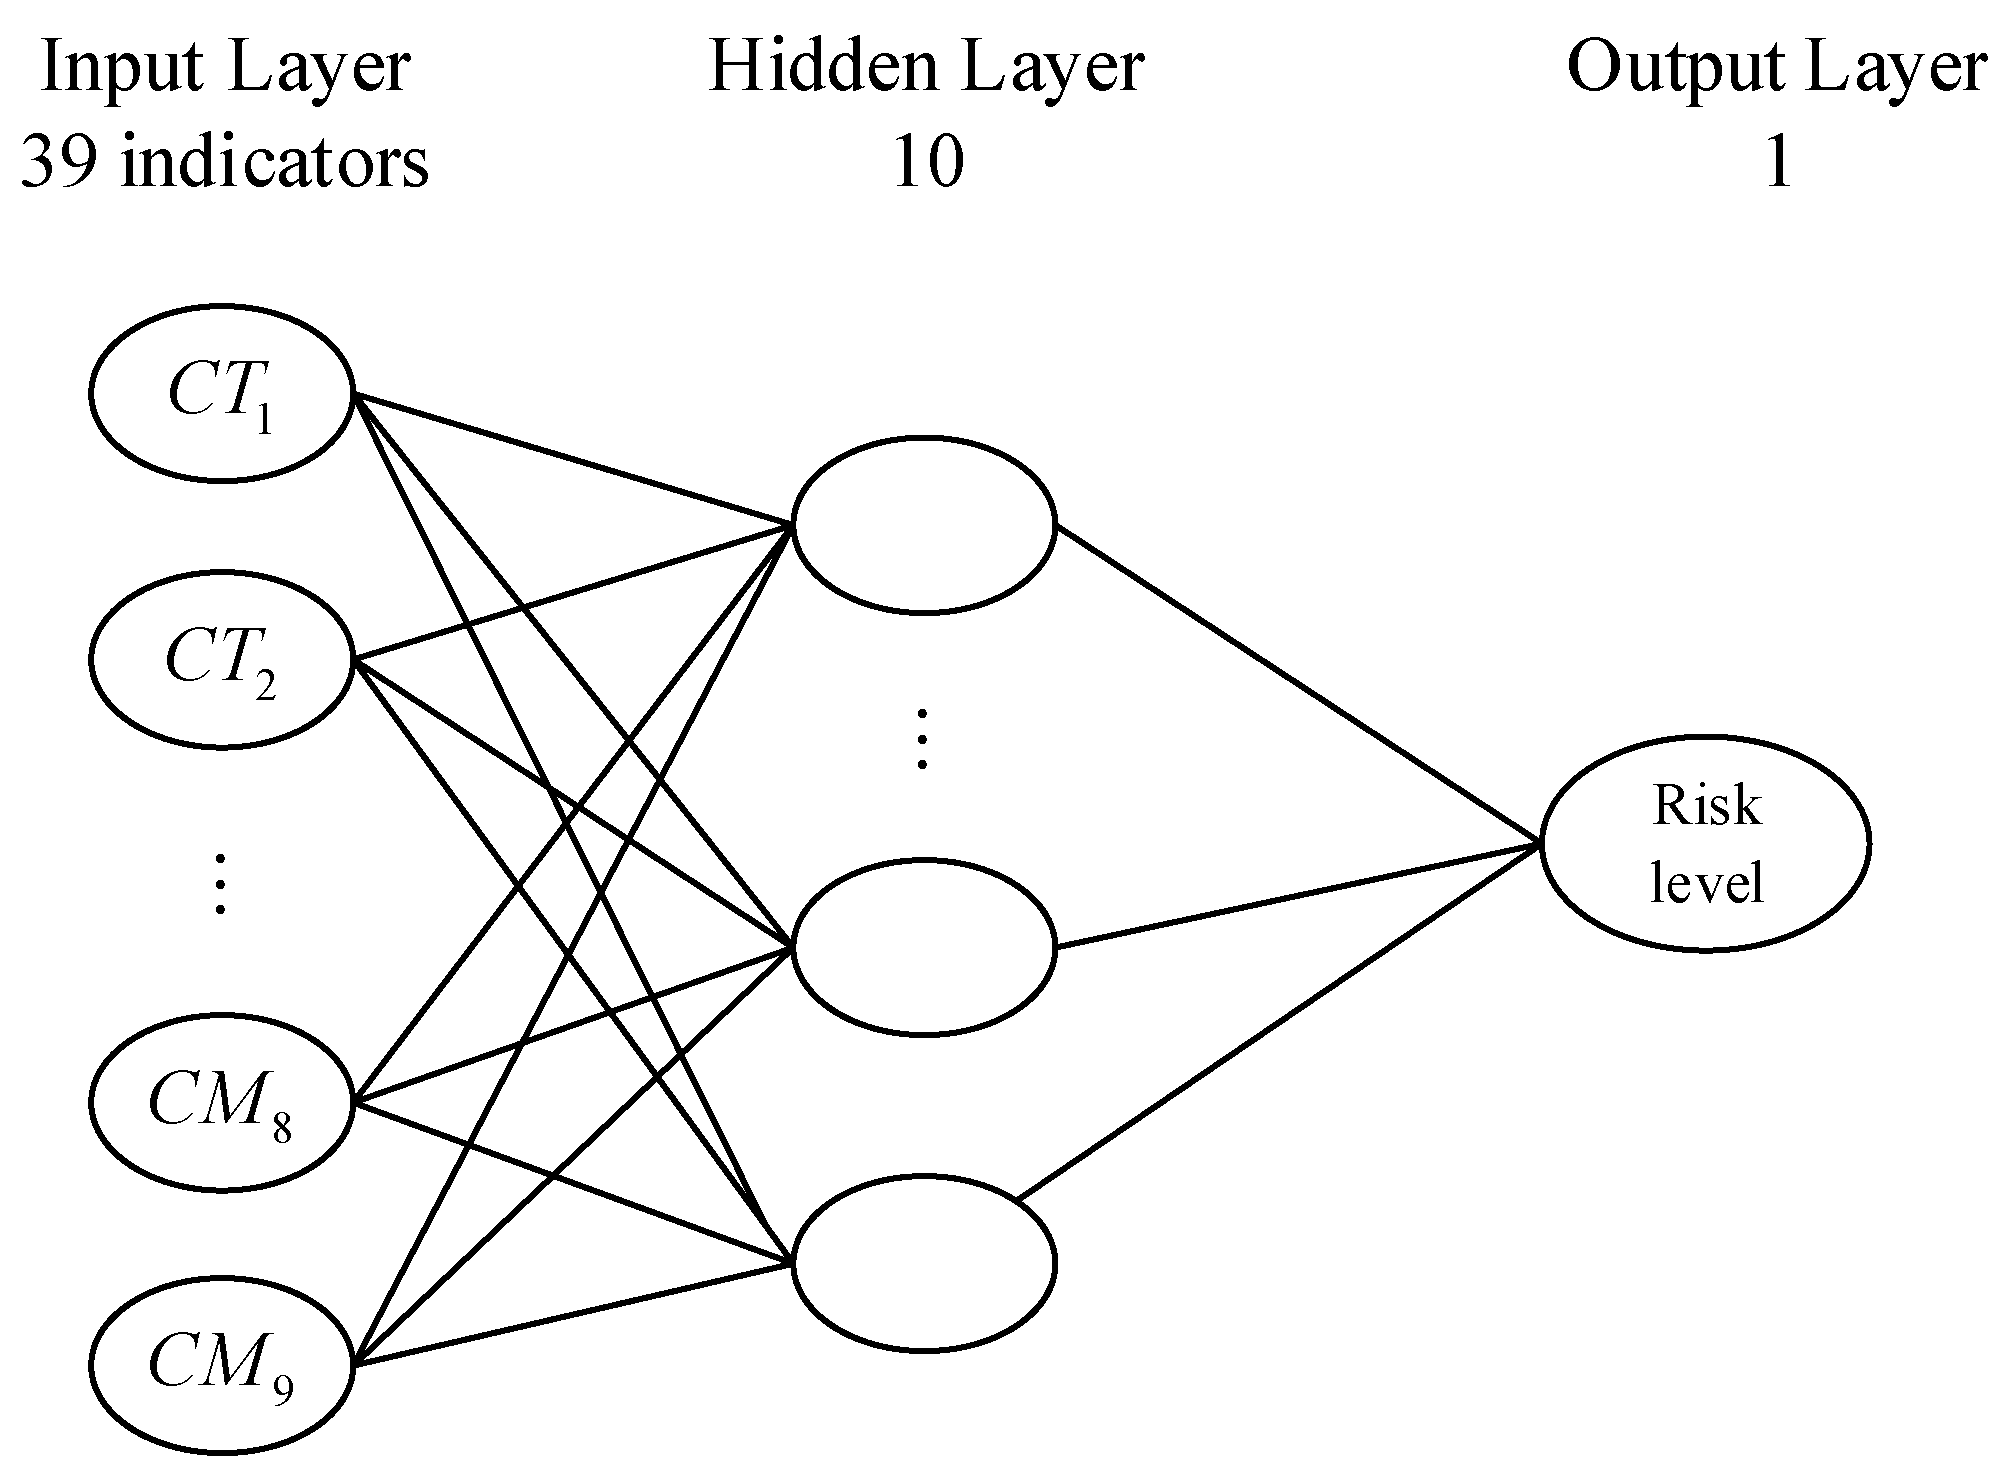
According to the risk assessment index system established above, combined with the BP network theory, three levels of indicators are used as the input layer, and risk levels are the output layer. Among them, the input layer has 39 indicators, and the output layer is the project risk level. The trial-and-error method was adopted to determine the number of hidden nodes corresponding to the fastest convergence and smallest error of the network. The operating mechanism diagram is shown in Figure 1.

2.6.2. Select the Activation Function of the Feedforward Neural Network

In this model, the maximum number of trainings is set to 20,000, after which the training is terminated. The error accuracy is set as 1 × 10 6 , and the operation is terminated when the accuracy is less than this error number. The model of this training is nonlinear, and the data need to be normalized to a certain extent before being brought in; therefore, the S-type function was chosen for this model.

2.6.3. Selection of Samples

The processing of samples directly affects the generalization mapping ability of BP networks [48]. When selecting the samples, we need to consider the engineering requirements and characteristics [49,50]. In this study, the sample parameters were obtained via a questionnaire survey; a total of 216 high cutting slopes in HSR of HK, HF, YG, and HSH were selected for the collection. The data were quantified by combining Table 7 and the method of expert interrogation. If the collected samples are evenly distributed, it is more conducive to the training of neural networks and can make a better prediction of the risk level of the cases.

2.6.4. Pretreatment of Input and Output Data

The collected data were divided into input data and output data, of which 80% were used as training samples and 20% as testing samples. The processed data of input nodes were regarded as the input layer, which was denoted by x . The processed data of output nodes were regarded as the output layer, which was denoted by y . In this study, the number of samples obtained was 216, denoted by m. The network inputs and outputs are shown in Table 6.
Each indicator has a different dimension; if the initial data are used directly, it will be difficult to ensure that indicators are in the same dimension, which will make the BP network converge slowly. If the indicators have the same dimension, the S-shaped function in the BP network can be fully utilized and the saturation area of the function can be avoided, thus enhancing the sensitivity of the BP neural network to the indicators. Therefore, it is important to reduce the magnitude of the variation of the sample values and to lock the interval of the definition domain of the samples within a certain range. This ensures that the derivative values of the input function are within the appropriate interval and have an important role in the training of the neural network and the prediction of the samples. Therefore, in this study, the collected sample data were normalized to reduce the magnitude variation of the predicted values. Firstly, each risk indicator was evaluated by the table of construction safety risk assessment of high cutting slopes in HSR (Table 7) and the method of expert interrogation. The statistical data were then normalized to obtain the risk value of relevant indicators. For example, the transformation of construction technology risk (CT) is shown as Formulas (1)–(3). The expression of the input value of the whole indicators system is shown as Formula (4).
C T i = j = 1 11 C T i j / 11 i = ( 1 , 2 , , 11 )
C T i = c t i X ( min ) X ( max ) X ( min ) ( i = 1 , 2 , 3 , , 11 )
C T = ( C T 1 , C T 2 , , C T 11 )
A l l = ( C T , M E , P , E , C M ) T
According to Table 5, combined with engineering practice, the construction safety risk evaluation levels can be divided into four levels, as shown in Table 7.

2.6.5. Selection of Initial Parameters

In this study, the BP neural network toolbox in MATLAB was used for simulation training, and the appropriate model parameters played a decisive role in the training quality and accuracy. The network creation function was debugged in the toolbox operation interface of the BP neural network, which is the first step to building the network object. Then, the transfer function was debugged. The transfer function represents the input and output objects with a correlation function using the logsig function. The learning function is to adjust the local error value size, and the training function is to adjust the global error value size; learngdm was chosen as the learning function, traingdx as the training function, and the network error performance function was the default MSE function of the toolbox. The network model parameters are set in Table 8.

2.6.6. Objective Function of Network Training

The initial expected predicted value of the objective function is X k ( k = 1 , 2 , , N ) , the output value of the final function is X k = ( k = 1 , 2 , , N ) , and the prediction error e is e = ( e 1 , e 2 , , e N ) = ( x 1 x 1 , x 2 x 2 , , x N x N ) . In the study, SSE was used to represent the evaluation value of neural network training maturity, which is shown in Formula (5).
S S E = 1 2 ( x k x k ) 2
where, x k is the expected output and x k is the actual output.
Simulation training was performed according to the neural network toolbox to achieve the minimum error criterion. If the trained neural network does not meet the error criterion, the BP neural network model parameters need to be readjusted to achieve a suitable neural network structure.

2.6.7. Selection of Output Node

The output node refers to the final information output, which is also the global control of the neural network training. The output nodes should be selected with reasonable and high credibility as often as possible to facilitate the collection of data and to normalize the sample data to obtain the output data that are beneficial to the neural network training. The sample data of the output nodes in this study were based on the risk levels corresponding to Table 7.

3. Results

3.1. Case Background

Hefei-Fuzhou HSR is an important part of Beijing-Fuzhou HRR; DK592 + 532.00~ + 562.00 is a section of the high cutting slope (Figure 2). The area is low and hilly with gentle terrain and developed vegetation. The groundwater is bedrock fracture water, which is more developed. The groundwater is not chemically erosive (judged by the chloride ion content, without chloride salt erosive).

3.2. Establish BP Neural Network Model

The samples of this case came from a total of 216 high cutting slopes of the HK, HF, YG, and HSH high-speed railway. By collecting the geological situation, special construction plan, and minutes of each high cutting slope and considering the relevant indicator rating methods in risk guidance combined with engineering practices and expert interviews, the indicators in each sample were assigned values according to Table 7, and all data were normalized. The details of the data processing are shown in the Appendix A. The Ordered Weighted Averaging is used to determine the weights of indicators at all levels, and the weight determination method is shown in Formula (6).
w = w ¯ i / i = 1 j w ¯ i , i = 1 , 2 , , n   j = i = 1 , 2 , , m
The weight values of CT, ME, P, E, and CM were 0.328, 0.104, 0.189, 0.258, and 0.121 respectively, as shown in Figure 3. From Figure 3, it can be seen that the risks of construction technology and environment have a relatively strong influence on the construction safety of high cutting slopes in HSR, and the risk of material and equipment, personnel, and construction management have a relatively weak influence on it.

3.3. Training Simulation

According to the BP neural network algorithm, Matlab was used to create the neural network and run the results. After 11 iterations, the training MSE value of the simulation training was 0.000176, which is less than the target value of 0.0003. This met the predetermined accuracy requirements, and the BP neural network model achieved convergence. The simulation results are shown in Figure 4; it can be seen that the R-values of the training set and test set are 0.947 and 0.808, which indicate that the model fits the observed values well.
The results of the error analysis for the test set data are shown in Figure 5. It can be seen that the maximum absolute value of the error is 8.22%; therefore, the training effect of the model is satisfactory.

3.4. Discussion

The trained BP artificial neural network was used to predict the risk of an HF grade eight high cutting slope construction project. After normalizing the data for each risk indicator (0.788, 0.394, 0.303, 0.303, 0.273, 0.455, 0.303, 0.303, 0.485, 0.273, 0.485, 0.273, 0.364, 0.485, 0.424, 0.212, 0.576, 0.278, 0.364, 0.389, 0.212, 0.697, 0.303, 0.818, 0.576, 0.273, 0.485, 0.424, 0.636, 0.394, 0.455, 0.364, 0.364, 0.394, 0.212, 0.394, 0.333, 0.424, 0.758), they were entered into the network to obtain the predicted value of 0.479. According to Table 7, the construction safety risk of the high cutting slope is predicted to be a medium risk, which is consistent with the risk level of the project; thus, the model fit is excellent.
According to the input value of each risk factor, the risk index greater than 0.5 is the main risk. It is known that the main risks of this high cutting slope construction are earthwork excavation method, scaffolding equipment, slope height, slope rate, groundwater, personnel safety awareness, and construction safety risk management system, and these influencing factors have a greater impact on the construction safety management of the project. Therefore, the safety control of this high cutting slope construction focuses on slope excavation risk control, slope reinforcement, waterproof measures, and construction safety management measures. The following control measures are proposed for the construction safety risks of this high cutting slope project: (1) choosing a reasonable earth excavation method; (2) setting up reinforcement protection measures; (3) strengthening of waterproof design; (4) conducting pre-reinforcement treatment; (5) monitoring stability; (6) strengthening construction management measures.

4. Conclusions

In this study, the safety risks of high cutting slope construction in HSR were identified in all aspects from three dimensions, risk technical specification, literature analysis, and case statistical analysis, and a list of risk influencing factors was formed. The evaluation indicator system was constructed by designing questionnaires and analyzing them with SPSS data statistical software. The assessment model was established by a BP neural network, and the pre-control measures were proposed for the risk factors. The construction safety risks of a high cutting slope of HF high-speed railway was analyzed and evaluated. The main findings of this study are (1) a list of construction safety risks of high cutting slopes in HSR was formed; (2) a risk assessment indicator system of high cutting slopes in HSR was constructed; (3) a construction safety risk assessment model based on a BP neural network was established; and (4) the feasibility of the assessment model was verified.
The limitation of this study is the identification and analysis of construction risk factors with a certain one-sidedness and subjectivity. Combined with the dynamic and difficult quantitative nature of construction risks, it needs to be further combined with engineering practice to refine and improve the construction safety impact factors. In addition, the number and authenticity of the learning samples directly ensure the feasibility of the trained neural network, and more samples need to be collected to improve the sample credibility. Finally, the BP neural network training process is related to set parameters, which will be combined with more intelligent algorithms for improvement to improve the accuracy of the training results in the future.

Author Contributions

Conceptualization, J.H. and H.C.; methodology, X.Z. and J.F.; software, X.Z.; validation, X.Z. and J.F.; formal analysis, X.Z.; investigation, J.H., X.Z., J.F., Y.H. and H.C.; resources, J.H. and H.C.; data curation, Y.H.; writing—original draft preparation, X.Z. and J.F.; writing—review and editing, X.Z.; visualization, X.Z.; supervision, J.H. and H.C.; project administration, J.H. and H.C.; funding acquisition, J.H. and H.C. All authors have read and agreed to the published version of the manuscript.

Funding

This study was funded by the National Key R&D Program of China (Grant Number 2021YFB2301802).

Institutional Review Board Statement

Not applicable.

Informed Consent Statement

Not applicable.

Data Availability Statement

All datasets generated for this study have been included in the article.

Conflicts of Interest

The authors declare no conflict of interest.

Appendix A

For the construction technology risk (CT), the collected assessment data are shown in Table A1.
Table A1. Raw data of construction technical risk (CT).
Expert1234567891011
Indicator
CT122332323322
CT232223322232
CT322112222321
CT443444433233
CT523332322333
CT632323323223
CT733232233434
CT822322222322
CT922112212222
CT1033233333233
CT1122122222122
By using Formula (1), data processing is shown in Table A2.
Table A2. Construction technical risk (CT) data processing.
IndicatorCT1CT2CT3CT4CT5CT6
Data processing2.4552.3641.8183.3642.6362.545
IndicatorCT7CT8CT9CT10CT11
Data processing2.9092.1821.7272.8181.818
The output values were normalized according to Formula (2), and the results are shown in Table A3.
Table A3. Normalized data of construction technical risk (CT).
IndicatorCT1CT2CT3CT4CT5CT6
Normalized data0.4850.4550.2730.7880.5450.515
IndicatorCT7CT8CT9CT10CT11
Normalized data0.6360.3940.2420.6060.273
For material and equipment risk (ME), the assessment data collected are shown in Table A4.
Table A4. Raw data of material and equipment risk (ME).
Expert1234567891011
Indicator
ME133232323321
ME221121111112
ME322121222111
ME421111111222
ME532222323222
ME643333333333
ME712222222222
By using Formula (1), data processing is shown in Table A5.
Table A5. Data processing of material and equipment risk (ME).
IndicatorME1ME2ME3ME4ME5ME6ME7
Data processing2.4551.2731.5451.3642.2733.0911.909
The output values are normalized according to Formula (2), and the results are shown in Table A6.
Table A6. Normalized data of material and equipment risk (ME).
IndicatorME1ME2ME3ME4ME5ME6ME7
Normalized data0.4850.0910.1820.1210.4240.6970.303
For environmental risk (E), the assessment data collected are shown in Table A7.
Table A7. Raw data of environmental risk (E).
Expert1234567891011
Indicator
E122112122322
E221111222222
E332332332232
E423333232332
E512111121222
E621212222221
E733323223222
By using the Formula (1), data processing is shown in Table A8.
Table A8. Data processing of environmental risk (E).
IndicatorE1E2E3E4E5E6E7
Data processing1.8181.6362.5452.6361.4551.7272.455
The output values were normalized according to Formula (2), and the results are shown in Table A9.
Table A9. Normalized data of environmental risk (E).
IndicatorE1E2E3E4E5E6E7
Normalized data0.2730.2120.5150.5450.1520.2420.485
For personnel risk (P), the assessment data collected are shown in Table A10.
Table A10. Raw data of personnel risk (P).
Expert1234567891011
Indicator
P134343224232
P212221212221
P322332332322
P421223122212
P523222122323
By using Formula (1), data processing is shown in Table A11.
Table A11. Data processing of Personnel risk (P).
IndicatorP1P2P3P4P5
Data processing2.9091.6362.4551.8182.182
The output values were normalized according to formula (2), and the results are shown in Table A12.
Table A12. Normalized data of personnel risk (P).
IndicatorP1P2P3P4P5
Normalized data0.6360.2120.4850.2730.394
For construction management risk (CM), the assessment data collected are shown in Table A13.
Table A13. Raw data of construction management risk (CM).
Expert1234567891011
Indicator
CM132322232223
CM233224332233
CM343332332333
CM433444334342
CM543222233233
CM643233332224
CM723323332322
CM823233243433
CM933333323322
By using Formula (1), data processing is shown in Table A14.
Table A14. Data processing of construction management risk (CM).
IndicatorCM1CM2CM3CM4CM5CM6CM7CM8CM9
Data processing2.3642.7272.9093.3642.6362.8182.5452.9092.909
The output values are normalized according to Formula (2), and the results are shown in Table A15.
Table A15. Normalized data of construction management risk (CM).
IndicatorCM1CM2CM3CM4CM5CM6CM7CM8CM9
Normalized data0.4550.5760.6360.7880.5450.6060.5150.6360.576
Due to space issues, only the first ten groups of case data processing results are listed in this study, as shown in Table A16.
Table A16. Input data for the first ten samples.
Sample12345678910
Indicator
10.485 0.727 0.697 0.727 0.636 0.545 0.697 0.545 0.545 0.667
20.455 0.424 0.455 0.424 0.303 0.152 0.212 0.273 0.212 0.515
30.273 0.606 0.424 0.606 0.273 0.333 0.333 0.424 0.394 0.545
40.788 0.485 0.758 0.424 0.182 0.515 0.364 0.606 0.606 0.667
50.545 0.515 0.576 0.636 0.515 0.485 0.455 0.545 0.455 0.576
60.515 0.333 0.667 0.545 0.576 0.364 0.606 0.455 0.364 0.545
70.636 0.758 0.697 0.788 0.576 0.424 0.576 0.333 0.424 0.758
80.394 0.424 0.636 0.455 0.121 0.152 0.182 0.303 0.303 0.636
90.242 0.455 0.636 0.515 0.303 0.424 0.394 0.576 0.485 0.636
100.606 0.485 0.667 0.364 0.091 0.394 0.242 0.515 0.394 0.667
110.273 0.606 0.545 0.636 0.485 0.576 0.758 0.545 0.606 0.606
120.485 0.576 0.576 0.576 0.606 0.606 0.333 0.333 0.212 0.606
130.091 0.333 0.727 0.636 0.545 0.303 0.364 0.485 0.515 0.515
140.182 0.455 0.364 0.455 0.152 0.515 0.515 0.515 0.636 0.424
150.121 0.485 0.636 0.545 0.303 0.485 0.515 0.606 0.697 0.667
160.424 0.515 0.485 0.485 0.152 0.242 0.455 0.515 0.455 0.545
170.697 0.303 0.424 0.485 0.455 0.303 0.636 0.333 0.273 0.636
180.303 0.636 0.788 0.606 0.667 0.242 0.303 0.455 0.424 0.758
190.273 0.515 0.576 0.545 0.485 0.333 0.394 0.485 0.455 0.545
200.212 0.455 0.576 0.697 0.182 0.515 0.273 0.485 0.545 0.576
210.515 0.485 0.636 0.515 0.303 0.424 0.485 0.455 0.364 0.455
220.545 0.455 0.485 0.485 0.121 0.455 0.636 0.545 0.394 0.636
230.152 0.485 0.394 0.455 0.364 0.182 0.697 0.545 0.545 0.545
240.242 0.455 0.727 0.727 0.697 0.333 0.485 0.333 0.424 0.545
250.485 0.364 0.455 0.364 0.455 0.121 0.515 0.333 0.242 0.576
260.636 0.485 0.636 0.515 0.152 0.152 0.303 0.576 0.515 0.515
270.212 0.424 0.636 0.545 0.273 0.394 0.333 0.758 0.758 0.818
280.485 0.667 0.697 0.788 0.242 0.576 0.515 0.273 0.455 0.667
290.273 0.424 0.667 0.515 0.455 0.485 0.515 0.303 0.364 0.606
300.394 0.364 0.636 0.515 0.636 0.394 0.394 0.545 0.545 0.515
310.455 0.515 0.515 0.576 0.697 0.515 0.424 0.364 0.455 0.727
320.576 0.545 0.545 0.485 0.455 0.364 0.091 0.455 0.455 0.545
330.636 0.515 0.636 0.515 0.152 0.364 0.515 0.545 0.455 0.455
340.788 0.394 0.515 0.788 0.303 0.212 0.455 0.576 0.576 0.636
350.545 0.545 0.576 0.545 0.212 0.273 0.485 0.333 0.364 0.576
360.606 0.455 0.364 0.455 0.364 0.182 0.455 0.303 0.364 0.606
370.515 0.485 0.758 0.576 0.667 0.485 0.636 0.333 0.515 0.667
380.636 0.333 0.515 0.606 0.333 0.485 0.333 0.667 0.667 0.515
390.576 0.576 0.636 0.576 0.606 0.533 0.485 0.394 0.545 0.576

References

  1. Lin, D.; Chen, P.; Ma, J.; Zhao, Y.; Xie, T.; Yuan, R.; Li, L. Assessment of slope construction risk uncertainty based on index importance ranking. Bull. Eng. Geol. Environ. 2019, 78, 4217–4228. [Google Scholar] [CrossRef]
  2. Deng, X.; Xu, T.; Wang, R. Risk evaluation model of highway tunnel portal construction based on BP fuzzy neural network. Comput. Intell. Neurosci. 2018, 2018, 8547313. [Google Scholar] [CrossRef] [PubMed] [Green Version]
  3. Alonso, E.E. Risk analysis of slopes and its application to slopes in Canadian sensitive clays. Geotechnique 1976, 26, 453–472. [Google Scholar] [CrossRef]
  4. Yilmaz, I. Comparison of landslide susceptibility mapping methodologies for Koyulhisar, Turkey: Conditional probability, logistic regression, artificial neural networks, and support vector machine. Environ. Earth Sci. 2010, 61, 821–836. [Google Scholar] [CrossRef]
  5. Fu, J. Research on Construction Safety Risk Management of High Cut Slope of High Speed Railway Based on BP Neural Network; Central South University: Changsha, China, 2019. [Google Scholar]
  6. Sidle, R.C.; Pearce, A.J.; O’Loughlin, C.L. Hillslope Stability and Land Use; American Geophysical Union: Washington, DC, USA, 1985. [Google Scholar]
  7. Brown, E.T. Risk assessment and management in underground rock engineering—An overview. J. Rock Mech. Geotech. Eng. 2012, 4, 193–204. [Google Scholar] [CrossRef] [Green Version]
  8. Christian, J.T.; Ladd, C.C.; Baecher, G.B. Reliability applied to slope stability analysis. J. Geotech. Eng. 1994, 120, 2180–2207. [Google Scholar] [CrossRef]
  9. El-Ramly, H.; Morgenstern, N.R.; Cruden, D.M. Cruden, Probabilistic slope stability analysis for practice. Can. Geotech. J. 2002, 39, 665–683. [Google Scholar] [CrossRef]
  10. Cheng, Y.M.; Lansivaara, T.; Wei, W.B. Two-dimensional slope stability analysis by limit equilibrium and strength reduction methods. Comput. Geotech. 2007, 34, 137–150. [Google Scholar] [CrossRef]
  11. Gokceoglu, C.; Sonmez, H.; Ercanoglu, M. Discontinuity controlled probabilistic slope failure risk maps of the Altindag (settlement) region in Turkey. Eng. Geol. 2000, 55, 277–296. [Google Scholar] [CrossRef]
  12. Farin, M.; Mangeney, A.; Roche, O. Fundamental changes of granular flow dynamics, deposition, and erosion processes at high slope angles: Insights from laboratory experiments. J. Geophys. Res. Earth Surf. 2014, 119, 504–532. [Google Scholar] [CrossRef]
  13. Dey, R.; Hawlader, B.; Phillips, R.; Soga, K. Modeling of large-deformation behaviour of marine sensitive clays and its application to submarine slope stability analysis. Can. Geotech. J. 2016, 53, 1138–1155. [Google Scholar] [CrossRef] [Green Version]
  14. McCulloch, W.S.; Pitts, W. A logical calculus of the ideas immanent in nervous activity. Bull. Math. Biophys. 1943, 5, 115–133. [Google Scholar] [CrossRef]
  15. Cowan, J.D. Discussion: McCulloch-Pitts and related neural nets from 1943 to 1989. Bull. Math. Biol. 1990, 52, 73–97. [Google Scholar] [CrossRef]
  16. Anderson, J.A. The BSB Model: A Simple Nonlinear Autoassociative Neural Network. In Associative Neural Memories: Theory and Implementation; Oxford University Press: Oxford, UK, 1993; pp. 77–103. [Google Scholar]
  17. Hecht-Nielsen, R. Theory of the Backpropagation Neural Network. In Neural Networks for Perception; Elsevier: Amsterdam, The Netherlands, 1992; pp. 65–93. [Google Scholar]
  18. Sadeghi, B. A BP-neural network predictor model for plastic injection molding process. J. Mater. Processing Technol. 2000, 103, 411–416. [Google Scholar] [CrossRef]
  19. Chen, H.; Li, H.; Goh, Y.M. A review of construction safety climate: Definitions, factors, relationship with safety behavior and research agenda. Saf. Sci. 2021, 142, 105391. [Google Scholar] [CrossRef]
  20. Boussabaine, A.H. The use of artificial neural networks in construction management: A review. Constr. Manag. Econ. 1996, 14, 427–436. [Google Scholar] [CrossRef]
  21. Forsythe, D.E. Engineering knowledge: The construction of knowledge in artificial intelligence. Soc. Stud. Sci. 1993, 23, 445–477. [Google Scholar] [CrossRef]
  22. Hou, C.; Wen, Y.; He, Y.; Liu, X.; Wang, M.; Zhang, Z.; Fu, H. Public stereotypes of recycled water end uses with different human contact: Evidence from event-related potential (ERP). Resour. Conserv. Recycl. 2021, 168, 105464. [Google Scholar] [CrossRef]
  23. Moselhi, O.; Hegazy, T.; Fazio, P. Potential applications of neural networks in construction. Can. J. Civ. Eng. 1992, 19, 521–529. [Google Scholar] [CrossRef]
  24. Changwei, Y.; Zonghao, L.; Xueyan, G.; Wenying, Y.; Jing, J.; Liang, Z. Application of BP neural network model in risk evaluation of railway construction. Complexity 2019, 2019, 2946158. [Google Scholar] [CrossRef] [Green Version]
  25. Shi, G.; Cheng, B.; Li, A. A mathematical model for calculating the “brittleness-ductility” drop coefficient of sandstone in mining zones. Discret. Dyn. Nat. Soc. 2020, 2020, 2621672. [Google Scholar] [CrossRef]
  26. Zichun, Y. The BP artificial neural network model on expressway construction phase risk. Syst. Eng. Procedia 2012, 4, 409–415. [Google Scholar]
  27. Shen, T.; Nagai, Y.; Gao, C. Design of building construction safety prediction model based on optimized BP neural network algorithm. Soft Comput. 2020, 24, 7839–7850. [Google Scholar] [CrossRef]
  28. Wang, H.; Wang, L.; Li, L.; Cheng, B.; Zhang, Y.; Wei, Y. The study on the whole stress–strain curves of coral fly ash-slag alkali-activated concrete under uniaxial compression. Materials 2020, 13, 4291. [Google Scholar] [CrossRef] [PubMed]
  29. Schultz, A.; Wieland, R. The use of neural networks in agroecological modelling. Comput. Electron. Agric. 1997, 18, 73–90. [Google Scholar] [CrossRef]
  30. Schultz, A.; Wieland, R.; Lutze, G. Neural networks in agroecological modelling—Stylish application or helpful tool? Comput. Electron. Agric. 2000, 29, 73–97. [Google Scholar] [CrossRef]
  31. China Railway. Technical Code for Risk Management of Railway Earthworks; China Railway Publishing House Co., Ltd.: Beijing, China, 2021. [Google Scholar]
  32. Seibold, E.; Hinz, K. Continental Slope Construction and Destruction, West Africa. In The Geology of Continental Margins; Springer: New York, NY, USA, 1974; pp. 179–196. [Google Scholar]
  33. Li, Z.; Huang, H.; Nadim, F.; Xue, Y. Quantitative risk assessment of cut-slope projects under construction. J. Geotech. Geoenviron. Eng. 2010, 136, 1644–1654. [Google Scholar] [CrossRef]
  34. Cunsen, J.; Shipeng, C.; Zuoxin, H. Reinforcement design and construction quality control for k24 cutting slope of south line of jinan belt highway. Chin. J. Rock Mech. Eng. 2004, 5260–5265. [Google Scholar] [CrossRef]
  35. Jiang, Q.; Yan, F.; Wu, J.; Fan, Q.; Li, S.; Xu, D. Grading opening and shearing deformation of deep outward-dip shear belts inside high slope: A case study. Eng. Geol. 2019, 250, 113–129. [Google Scholar] [CrossRef]
  36. Wei, L.; Debin, G.; Wankui, N. Research on surface plant protection for highway loess cutting slope. J. Catastrophology 2007, 3, 45–48. [Google Scholar]
  37. Park, H.; West, T.R.; Woo, I. Probabilistic analysis of rock slope stability and random properties of discontinuity parameters, Interstate Highway 40, Western North Carolina, USA. Eng. Geol. 2005, 79, 230–250. [Google Scholar] [CrossRef]
  38. Zhou, D.; Xiao, S.; Xia, X. Discussion on rational spacing between adjacent anti-slide piles in some cutting slope projects. Chin. J. Geotech. Eng. 2004, 1, 132–135. [Google Scholar]
  39. Wyllie, D.C.; Mah, C. Rock Slope Engineering; CRC Press: Boca Raton, FL, USA, 2004. [Google Scholar]
  40. Scarpelli, G.; Segato, D.; Sakellariadi, E.; Ruggeri, P.; Fruzzetti, V.M.E.; Vita, A. Slope Instability Problems in the Jonica Highway Construction, in Landslide Science and Practice; Springer: New York, NY, USA, 2013; pp. 275–282. [Google Scholar]
  41. Fell, R.; Hartford, D. Landslide Risk Management, in Landslide Risk Assessment; Routledge: Oxfordshire, UK, 2018; pp. 51–109. [Google Scholar]
  42. Tiwari, B.; Upadhyaya, S. Effect of Rainfall and Building Construction on a Marginal Slope in Triggering Landslide. In Landslide Science for a Safer Geoenvironment; Springer: New York, NY, USA, 2014; pp. 313–318. [Google Scholar]
  43. Zhang, Z.; Wang, T.; Wu, S.; Tang, H.; Liang, C. The role of seismic triggering in a deep-seated mudstone landslide, China: Historical reconstruction and mechanism analysis. Eng. Geol. 2017, 226, 122–135. [Google Scholar] [CrossRef]
  44. He, Z.; Liu, K.; Fu, H.; Wu, C. Safety risk assessment of high slope blasting construction based on set pair-extension analysis. J. Cent. South Univ. Sci. Technol. 2017, 48, 2217–2223. [Google Scholar]
  45. Dahal, R.; Hasegawa, S.; Masuda, T.; Yamanaka, M. Roadside Slope Failures in Nepal during Torrential Rainfall and Their Mitigation. In Disaster Mitigation of Debris Flows, Slope Failures and Landslides; Universal Academy Press: Irvine, CA, USA, 2006; pp. 503–514. [Google Scholar]
  46. Abdulwahid, W.M.; Pradhan, B. Landslide vulnerability and risk assessment for multi-hazard scenarios using airborne laser scanning data (LiDAR). Landslides 2017, 14, 1057–1076. [Google Scholar] [CrossRef]
  47. China Railway Eryuan Engineering Group Co. Ltd. Technical Code for Risk Management of Railway Construction Engineering; China Railway Publishing House Co., Ltd.: Beijing, China, 2015. [Google Scholar]
  48. Ma, J.; Cai, J.; Lin, G.; Chen, H.; Wang, X.; Wang, X.; Hu, L. Development of LC–MS determination method and back-propagation ANN pharmacokinetic model of corynoxeine in rat. J. Chromatogr. B 2014, 959, 10–15. [Google Scholar] [CrossRef]
  49. Qu, D.; Cai, X.; Chang, W. Evaluating the effects of steel fibers on mechanical properties of ultra-high performance concrete using artificial neural networks. Appl. Sci. 2018, 8, 1120. [Google Scholar] [CrossRef] [Green Version]
  50. Shi, E.; Shang, Y.; Li, Y.; Zhang, M. A cumulative-risk assessment method based on an artificial neural network model for the water environment. Environ. Sci. Pollut. Res. 2021, 28, 46176–46185. [Google Scholar] [CrossRef]
Figure 1. BP neural network operation structure.
Buildings 12 00598 g001
Figure 2. The high cutting slope of section DK592 + 532.00~ + 562.00.
Buildings 12 00598 g002
Figure 3. The weight values of the secondary risk indicators.
Buildings 12 00598 g003
Figure 4. Schematic diagram of BP Neural network training fit degree.
Buildings 12 00598 g004
Figure 5. Error analysis for the test set data.
Buildings 12 00598 g005
Table 1. Construction safety risk factors based on technical specifications.
ClassificationRisk Factors
Natural factor Topography, surface water, groundwater, scenic nature reserve, existing buildings (structures) and pipelines, rainstorms, floods, avalanches, thunder and lightning, etc.
Geological factor Degree of rock weathering, landslides, cave strata such as karst and mined-out regions, regional subsidence, swelling rock (soil), permafrost, soft soil, collapsible loess, liquid formation, etc.
Technical factor Improper classification and protection schemes of soil and rock, improper excavation methods, inadequate foundation treatment, staffing, mechanical equipment, material factors, disposal sites, and protection.
Social factor Land acquisition and demolition, external influence, humanistic environment.
Table 2. Construction safety risk factors based on literature.
Literature ResourcesRisk Factors
Seibold & Hinz [32]Water movement, geological factors, slope construction process.
Li et al. [33]Engineering geological conditions, construction methods, landslide treatment plans, slope construction remediation plans.
Cunsen et al. [34]Topography, geomorphology, stratigraphic lithology, geological structure, hydrogeological conditions, slope design scheme, slope construction technology.
Jiang et al. [35]Slope excavation methods, anchor cable arrangement, anchor section grouting, climatic factors, slope drainage facility.
Wei et al. [36]Slope scouring, climatic factors, geological conditions, groundwater.
Park et al. [37]Discontinuity of structural surface, lithological weathering and erosion, climatic conditions, groundwater.
Zhou et al. [38]Implementation strength of construction organization design, construction wiring survey, earthwork excavation, surface drainage, anchoring engineering construction.
Wyllie & Mah [39]Design of slope rate, reinforcement engineering, protection engineering, construction technology, construction wiring survey, geological conditions, groundwater displacement detection.
Scarpelli et al. [40]Soil support structure, preliminary geological exploration, excavating sequence, terrain monitoring.
Fell & Hartford [41]Geological conditions, climate, pre-reinforcement construction technology.
Tiwari & Upadhyaya [42]Rainfall, groundwater, slope rate, adjacent buildings construction.
Zhang et al. [43]Excavation height, slope rate, differences between stratigraphic and topographic
He et al. [44]Slope height, slope shape, slope ratio, geological conditions, design plan of blasting, blasting environment, safety supervision, management factors.
Dahal et al. [45]Excavation, surface water drainage system, anchor construction, planting bag construction, slope skeleton protection.
Abdulwahid & Pradhan [46]Construction scale, geological conditions, construction environment, data integrity.
Table 3. Construction safety risk identification based on statistical analysis of cases.
CasesRisk Factors
HK DK438 + 355~ + 510Soft rock high cutting slope. The main risk factors are slope excavation, geological environment, rainfall, personnel safety awareness, prestressing tensioning equipment, monitoring program reasonableness, mechanical excavation, and slope repair equipment.
HK DK830 + 955~DK831 + 020Hard rock high cutting slope, smooth blasting. The main risk factors are slope excavation, rock blasting, blasting material, rockfall, falling objects, and the perfection of emergency rescue measures.
HSH DK35 + 309.83~ + 392.00Soft rock high cutting slope, the groundwater is developed. The main risk factors are drainage tunnel technology and groundwater.
HSH DK97 + 006.89~DK99 + 227.52Expansive soil high cutting slope. The main risk factors are slope excavation, rainfall, surface drainage system, and data integrity of monitoring program.
HSH DK123 + 612.32~DK124 + 312.50Bedding high cutting slope. The main risk factors are slope structure, formation lithology, rainfall, slope excavation, and drilling rig equipment.
HSH DK269 + 378.81~ + 703.75Expansive soil high cutting slope with buildings around. The main risk factors are anti-slip pile technology, rainfall, groundwater, geological condition, and surrounding buildings.
HSH DK270 + 262.11~ + 411.00Bedding high cutting slope. The main risk factors are slope excavation, prestressing anchoring engineering technology, anchor cable material, geological condition, and scaffolding equipment.
HSH DK294 + 533.51~295 + 069.22Soft rock high cutting slope. The main risk factors are slope excavation, slope rate, slope skeleton protection, mechanical excavation and slope repair equipment, implementation of safety management measures, and concrete material.
HSH DK318 + 237.71~ + 558.50Bedding high cutting slope. The main risk factors are prestressed anchorage engineering technology, slope protection, personnel safety awareness, prestressed anchor anti-slip pile technology, and rainfall.
Table 4. Safety risk assessment index system for high cutting slope construction of HSR.
Goal LayerCriterion LayerIndicator Layer
Safety risk assessment indicator system for high cutting slope construction of HSR Risk factors of construction technology (CT)Earthwork excavation method CT1
Rock blasting CT2
Surface drainage system technology CT3
Anti-slip retaining wall technology CT4
Anti-slip pile technology CT5
Prestressed anchorage technology CT6
Prestressed anchor cable anti-slide pile technology CT7
Grouting micro-pile technology CT8
Tunnel drainage technology CT9
Slope skeleton protection CT10
Slope surface protection CT11
Risk factors of material and equipment (ME)Blasting materials ME1
Anchor cable materials ME2
Concrete materials ME3
Mechanical excavation and repairment equipment ME4
Drilling rig equipment ME5
Scaffolding equipment ME6
Prestressed tensioning equipment ME7
Risk factors of personnel (P)Basic quality level of personnel P1
Personnel working level P2
Personnel operation error P3
Personnel safety awareness P4
Staffing level P5
Risk factors of the environment (E)Slope height E1
Slope rate E2
Rainfall E3
Surrounding buildings E4
Falling objects E5
Groundwater E6
Geological conditions E7
Risk factors of construction management risk (CM)Quality assurance measures CM1
Quality testing standards CM2
Perfection of emergency rescue measures CM3
Degree of implementation of safety management fee CM4
Degree of implementation of construction organization design CM5
Reasonableness of monitoring program CM6
Completeness of monitoring data CM7
Communication and coordination among all parties involved in the project CM8
Construction safety risk management system CM9
Table 5. Risk acceptance criteria.
Risk LevelAcceptance Level
Level I (lower risk)Negligible
Level II (medium risk)Acceptable
Level III (high risk)Unexpected
Level IV (very high risk)Unacceptable
Table 6. Inputs and outputs data of network.
Input DataOutput Data
x 11 , x 12 , x 1 n y 1
x 21 , x 22 , x 2 n y 2
x n 1 , x n 2 , x n n y n
Table 7. Construction safety risk evaluation levels.
Comprehensive Risk Evaluation Value[0~0.25](0.25~0.5](0.5~0.75](0.75~1]
Risk LevelLow riskMedium riskHigh riskExtremely high risk
Table 8. BP network model parameters.
Network Creation FunctionTransfer FunctionLearning FunctionTraining FunctionNetwork Error Performance FunctionError Precision
newfflogsiglearngdmtraingdxMSE0.0003
Publisher’s Note: MDPI stays neutral with regard to jurisdictional claims in published maps and institutional affiliations.

