1. Introduction
The need to balance between growing global demands for energy and sustainability is paramount; however, its realization is stunted by today’s technologies, knowledge, and policies [
1,
2,
3]. For reference, the built environment in Canada produces about 17% of greenhouse gas (GHG) emissions [
4], with 14% attributed to existing residential buildings corresponding to 17% of all combined energy [
5]. In contrast, CAD 12 billion in energy saving were realized in Canada in 2013 through residential energy conservation measures [
4]. These statistics are supported by an econometric multivariate analysis, where inefficient thermal envelopes and heating systems have been identified as the dominant energy inefficiency problems in households [
6].
Buildings’ energy consumption depends on the climate, orientation, size, occupants, building envelope specifications, HVAC system specifications, lighting specifications, available controls and equipment, etc. [
7]. Regulating buildings’ energy efficiencies in codes and standards, which is increasingly being sought, [
8,
9], is starting to be recognized as one of the most cost-effective tools for achieving energy efficiency in buildings. In 2017, the Building Code of British Columbia (BCBC) prescribed the highest level of performance as annual net zero energy (NZE) consumption during occupancy [
10]. Towards this objective, thermal energy demand intensity (TEDI) and mechanical energy use intensity (MEUI) are utilized to regulate the energy efficiency of buildings [
10]. An examination of the premise of these two metrics reveals that TEDI and MEUI are not compatible and that only MEUI has been standardized. The MEUI includes absolute measures of efficiency, whereas the TEDI includes relative measures of thermal performance being climate condition and building archetype. Accordingly, building envelope energy efficiency as an absolute measure is missing.
Typical metrics employed to assess buildings energy efficiency are through qualitative comparative analysis (QCA), where the causal effects of the building characteristics on the energy consumption are measured. The representative metrics include (1) energy consumption per unit time, usually annual totals [
11]; (2) energy use intensity (EUI) [
12]; (3) relative energy consumption, as opposed to absolute energy consumption [
13]; (4) hybrid or combinations of the first three; and (5) other metrics, mostly calculated or deduced from regression type models [
14,
15,
16,
17,
18]. Moreover, economic justifications, which have been an inherent rationale for the incremental changes in codes and standards, have been substantiated by QCA results. The implications have been detrimental to sustainability, being ecological and economical, and most critically, the inability to quantify actual energy saving potentials has stunted the development of new and innovative energy efficient building envelope components and systems. This postulation is confirmed by findings of scientific studies reported in the literature:
- (1)
A multi-objective optimization study was carried out to assess the EU prescribed cost-optimal approach of a balance of energy and economic targets [
19]. The study showed that a zero-energy target is possible with current technology, provided a lower indoor thermal comfort is allowed [
19]. Accordingly, energy efficiencies of the current building envelope technologies are not adequate to meet zero-energy target.
- (2)
Results of life cycle cost implications of energy efficiency measures in new residential buildings reveal that higher levels of energy efficiency requirements via building regulations are justified based on both economic and environmental grounds [
20]. Findings demonstrate that the current energy efficiency requirements, particularly for the building envelope, are too low for new residential buildings to meet sustainability requirements.
- (3)
Results from a net zero energy buildings (NZEB) study show that increasing the thermal energy efficiency of the building envelope is a step towards fulfilling all of the NZEB balances [
15]. Others have reported that increasing the building envelopes insulative properties is more economically and ecologically effective in colder climates and less effective in warmer climates, depending on the internal heat loads [
21]. Findings on NZEB, which agree with the previous studies’ findings, confirm that the energy efficiency of the building envelope needs significant improvement and that the design requirements are climate dependent.
- (4)
A review of building envelope components for passive buildings concluded that the additional cost of an energy efficient building envelope can be recouped by the reduced size of mechanical systems [
22]. The results confirm that improving the thermal resistance of the building envelope is both economically and ecologically viable.
- (5)
Results from case studies conducted on a house located in Toronto Canada show that a 70% reduction in energy consumption of code minimum requirements by improving the building envelope’s thermal properties is achievable with a less than 7% increase in the construction budget [
23].
In brief, the results from several scientific studies reveal with certainty that higher energy efficiencies for the building envelope are needed to meet the NZEB target and that the most cost-effective and ecologically sound house design is always more energy efficient than the current energy code requirements. Accordingly, this study was undertaken to review the progress of Canada’s National Codes pertaining to the thermal performance of building envelopes for residential buildings with specific focus on housing, to discuss the implications of the codes on the development of new technologies, and to postulate a new metric for assessing the thermal efficiency of building envelopes. Case studies are then presented to demonstrate the range, sensitivity and applications of the proposed thermal efficiency metric for the building envelope.
2. Historical Development of Building Envelope Energy Efficiency Measures for Canadian Housing
2.1. Chronological Review
The National Building Code of Canada (NBC) first issued in 1941, is the model building code of Canada. Since 1960, NBC was revised every 5 years except for the change from prescriptive to objective-based codes between the 1995 and 2005 editions. Review of the NBC 1985 to 2010 pertaining to Housing and Small Buildings reveals that energy efficiency was not part of the code requirements. The prescribed requirements were for thermal insulation, air leakage and vapor barriers to prevent moisture condensation and to ensure comfortable conditions for the occupants [Article 9.26.2.1, [
24]; Article 9.25 [
25]]. In 2012 and through a special amendment for Part 9 of NBC, energy efficiency requirements were added to Section 9.36 in a 2012 Amendment [
25]. “The Environment” was added as an NBC objective in 2012 to mitigate the probability of harming the environment due to excessive use of energy [OE1.1] [
25]. The corresponding minimum requirements aimed at energy efficiency were prescribed using three paths to compliance: prescriptive, tradeoff, and performance. For the prescriptive path, the effective thermal resistances were specified for the building envelope and are reproduced in
Table 1 and
Table 2 for reference.
The Model National Energy Code of Canada for Buildings, introduced in 1997 [
27], was Canada’s first national standard for building energy performance that was updated in 2011 and renamed the National Energy Code of Canada for Buildings (NECB) [
28] and further updated in 2015 and 2017 [
29,
30] to ensure a high level of energy efficiency in new Canadian buildings. An objective of NECB is sustainable and energy efficient buildings with a focus on five key building elements: building envelope, lighting, HVAC, water heating, and electrical power systems and motors. Building envelope, which is the objective of this study, includes floors, walls, windows, doors and roofing, and air infiltration rates. Like the NBC, the NECB offers three compliance paths: prescriptive, trade-off, and performance. The prescriptive requirements for the building envelope thermal properties are reproduced from 1970 to 2017 per climate zone for wall, roof, ground floor and window in
Table 3,
Table 4,
Table 5 and
Table 6, respectively [
28,
29,
30,
31,
32]. Comparing NBC 2015 Part 9 and NECB 2017 building envelope’s thermal resistance requirements reveals that the latter prescribes higher energy efficiency requirements. Accordingly, NECB data are analyzed to critically assess the code’s approach vis-a-vie energy efficiency.
2.2. Analytical Review of the Building Envelope Minimum Requirements
Historically, the progression of the building envelope thermal resistance requirements is through a percentage increase in thermal resistance. Comparative analysis of the NECB wall properties shows that, on average, thermal resistance increased by 72% and 29% for the year 2007 and 2011, and 0% thereafter. For the NECB roof properties requirement, the thermal resistance increased by 260%, −7%, 11% and 17% for the year 2007, 2011, 2015 and 2017, respectively. For the ground floor, thermal resistance increased by 230% and 10% for the year 2007 and 2011, and 0% thereafter. As for the windows, thermal resistance decreased, on average, by 13% for the 2011 edition and remained the same, except for Zone 8 in the 2015 edition, and then increased, on average, by 15% for the 2017 edition. Although the motivation is energy efficiency, the logic supporting the changes is not consistent and appears to be arbitrary. The normalized heat transfer rate through the building envelope, calculated according to Equation (1), is employed to assess the impact of the thermal properties requirements on the building energy consumption.
In which U and HDD
Avg are the conductance (W/m
2 K) and average heating degree days corresponding to the climate zone, respectively. HDD for Canadian climate are given in
Table 7. The results, plotted in
Figure 1,
Figure 2,
Figure 3 and
Figure 4, corresponding to wall, roof, ground floor and window, respectively, reveal that (a) the heating energy is designed to increase with HDD, (b) the heat transfer rate differs for the different building envelope systems, and (c) the requirements which are incremental hardly changed for the past 10 years. Accordingly, and focusing solely on the building envelope, NECB requirements are designed to accept higher heating energy with increased HDD, which is counter intuitive from an economic and ecological perspective. Moreover, NECB assesses improvements through comparison with the preceding thermal resistance requirements. This methodology, which is adopted by most, if not all, codes. However, although it is sound mathematically, it is misleading as it measures improvements with the worst case and not the best or perfect case and is deterrent to technology development, as the potential energy savings are never realized. As such, a consistent and comprehensive metric for measuring the energy performance of the building envelope is needed.
3. Building Envelope Energy Efficiency Measure
Building energy efficiency metrics are assessment measures prescribed to compare the buildings energy consumption. For metrics that include mechanical equipment energy consumption, they include datums in the form of equipment efficiencies and COP that are standardized and embedded in the assessment measures. These datums ensure that the assessment employs the same yardstick and consistency for all equipment and systems. Whereas for metrics specifically designed for capturing the building envelope performance, the datums resemble more of moving averages in the form of compliance targets, which render the metrics inconsistent and irregular. To overcome this deficiency, an efficiency measure analogous to the mechanical equipment is adapted by postulating a “perfect” building envelope system as a datum. A “perfect” thermal insulating medium with a zero-thermal transmittance would be ideal for this application, except that a zero value for thermal property is problematic in energy modelling and mathematically. Accordingly, an equivalent “ideal” system for the building envelope is proposed that comprises the following properties:
Thermal conductance: 7.0 × 10⁻² W/m2 K;
Thermal diffusivity: 1.05 × 10⁻⁵ m2/h;
Absorptance: 0.2;
Air leakage: 0.1 ACH at atmospheric pressure.
The proposed “ideal” building envelope system provides a datum for assessing the thermal performance, similar or analogous to the COP of equipment, and to be used as the “ideal” building envelope (walls, roof, slabs, windows, and doors). As such, this metric is referred to as the Building Envelope Coefficient of Performance (BECOP), where
In which
and
are the heat losses through the building envelope, while employing the ideal system and the subject building, respectively. BECOP provides a consistent and relative measure of the building envelope thermal performance while keeping all other building variables the same. The metric is independent of the calculation method, being energy modelling tools, hand calculations or any other statistical or hybrid tools, and requires that the same analysis method be used throughout. The proposed BECOP is applicable to all building types and Climate Zones, and is designed to provide a measure that is compatible and comparable to existing systems within the building, such as HVAC, lighting, etc. Accordingly, the energy saving potential of the building envelope shifts from a passive to an active approach, where large energy savings can be realized [
22]. In this study, the energy modelling tool EnergyPlus [
33] is used to demonstrate the applicability, versatility and sensitivity of BECOP.
3.1. Range of BECOP
The range of BECOP for Canada is gauged by employing extreme Climate Zones 4 and 8 along with three levels of design specifications of the building envelope thermal performance, referred to as “low”, “typical” and “high” thermally efficient, relative to North American construction practices. The corresponding building characteristics and envelope properties are given in
Table 8 and
Table 9. The building is a single dwelling house, two-storeys high, with a basement, rectangular in shape, and long face oriented in the E-W direction (90° to North), and has the same window areas on all four sides. The plug loads, lighting loads, occupancy loads, domestic hot water load, etc., and their respective schedules are taken from the National Building Code of Canada Section 9.36 [
24] and/or the National Energy Code for Buildings [
30] and are given in
Table 10.
The thermal properties are derived from current codes, past codes, and expected future codes. The past codes represent older and low energy efficient construction practices, and the expected future codes represent anticipated future technologies and construction practices with higher energy efficiency, as compiled in
Table 8 and
Table 9. The results, presented in
Table 11 and
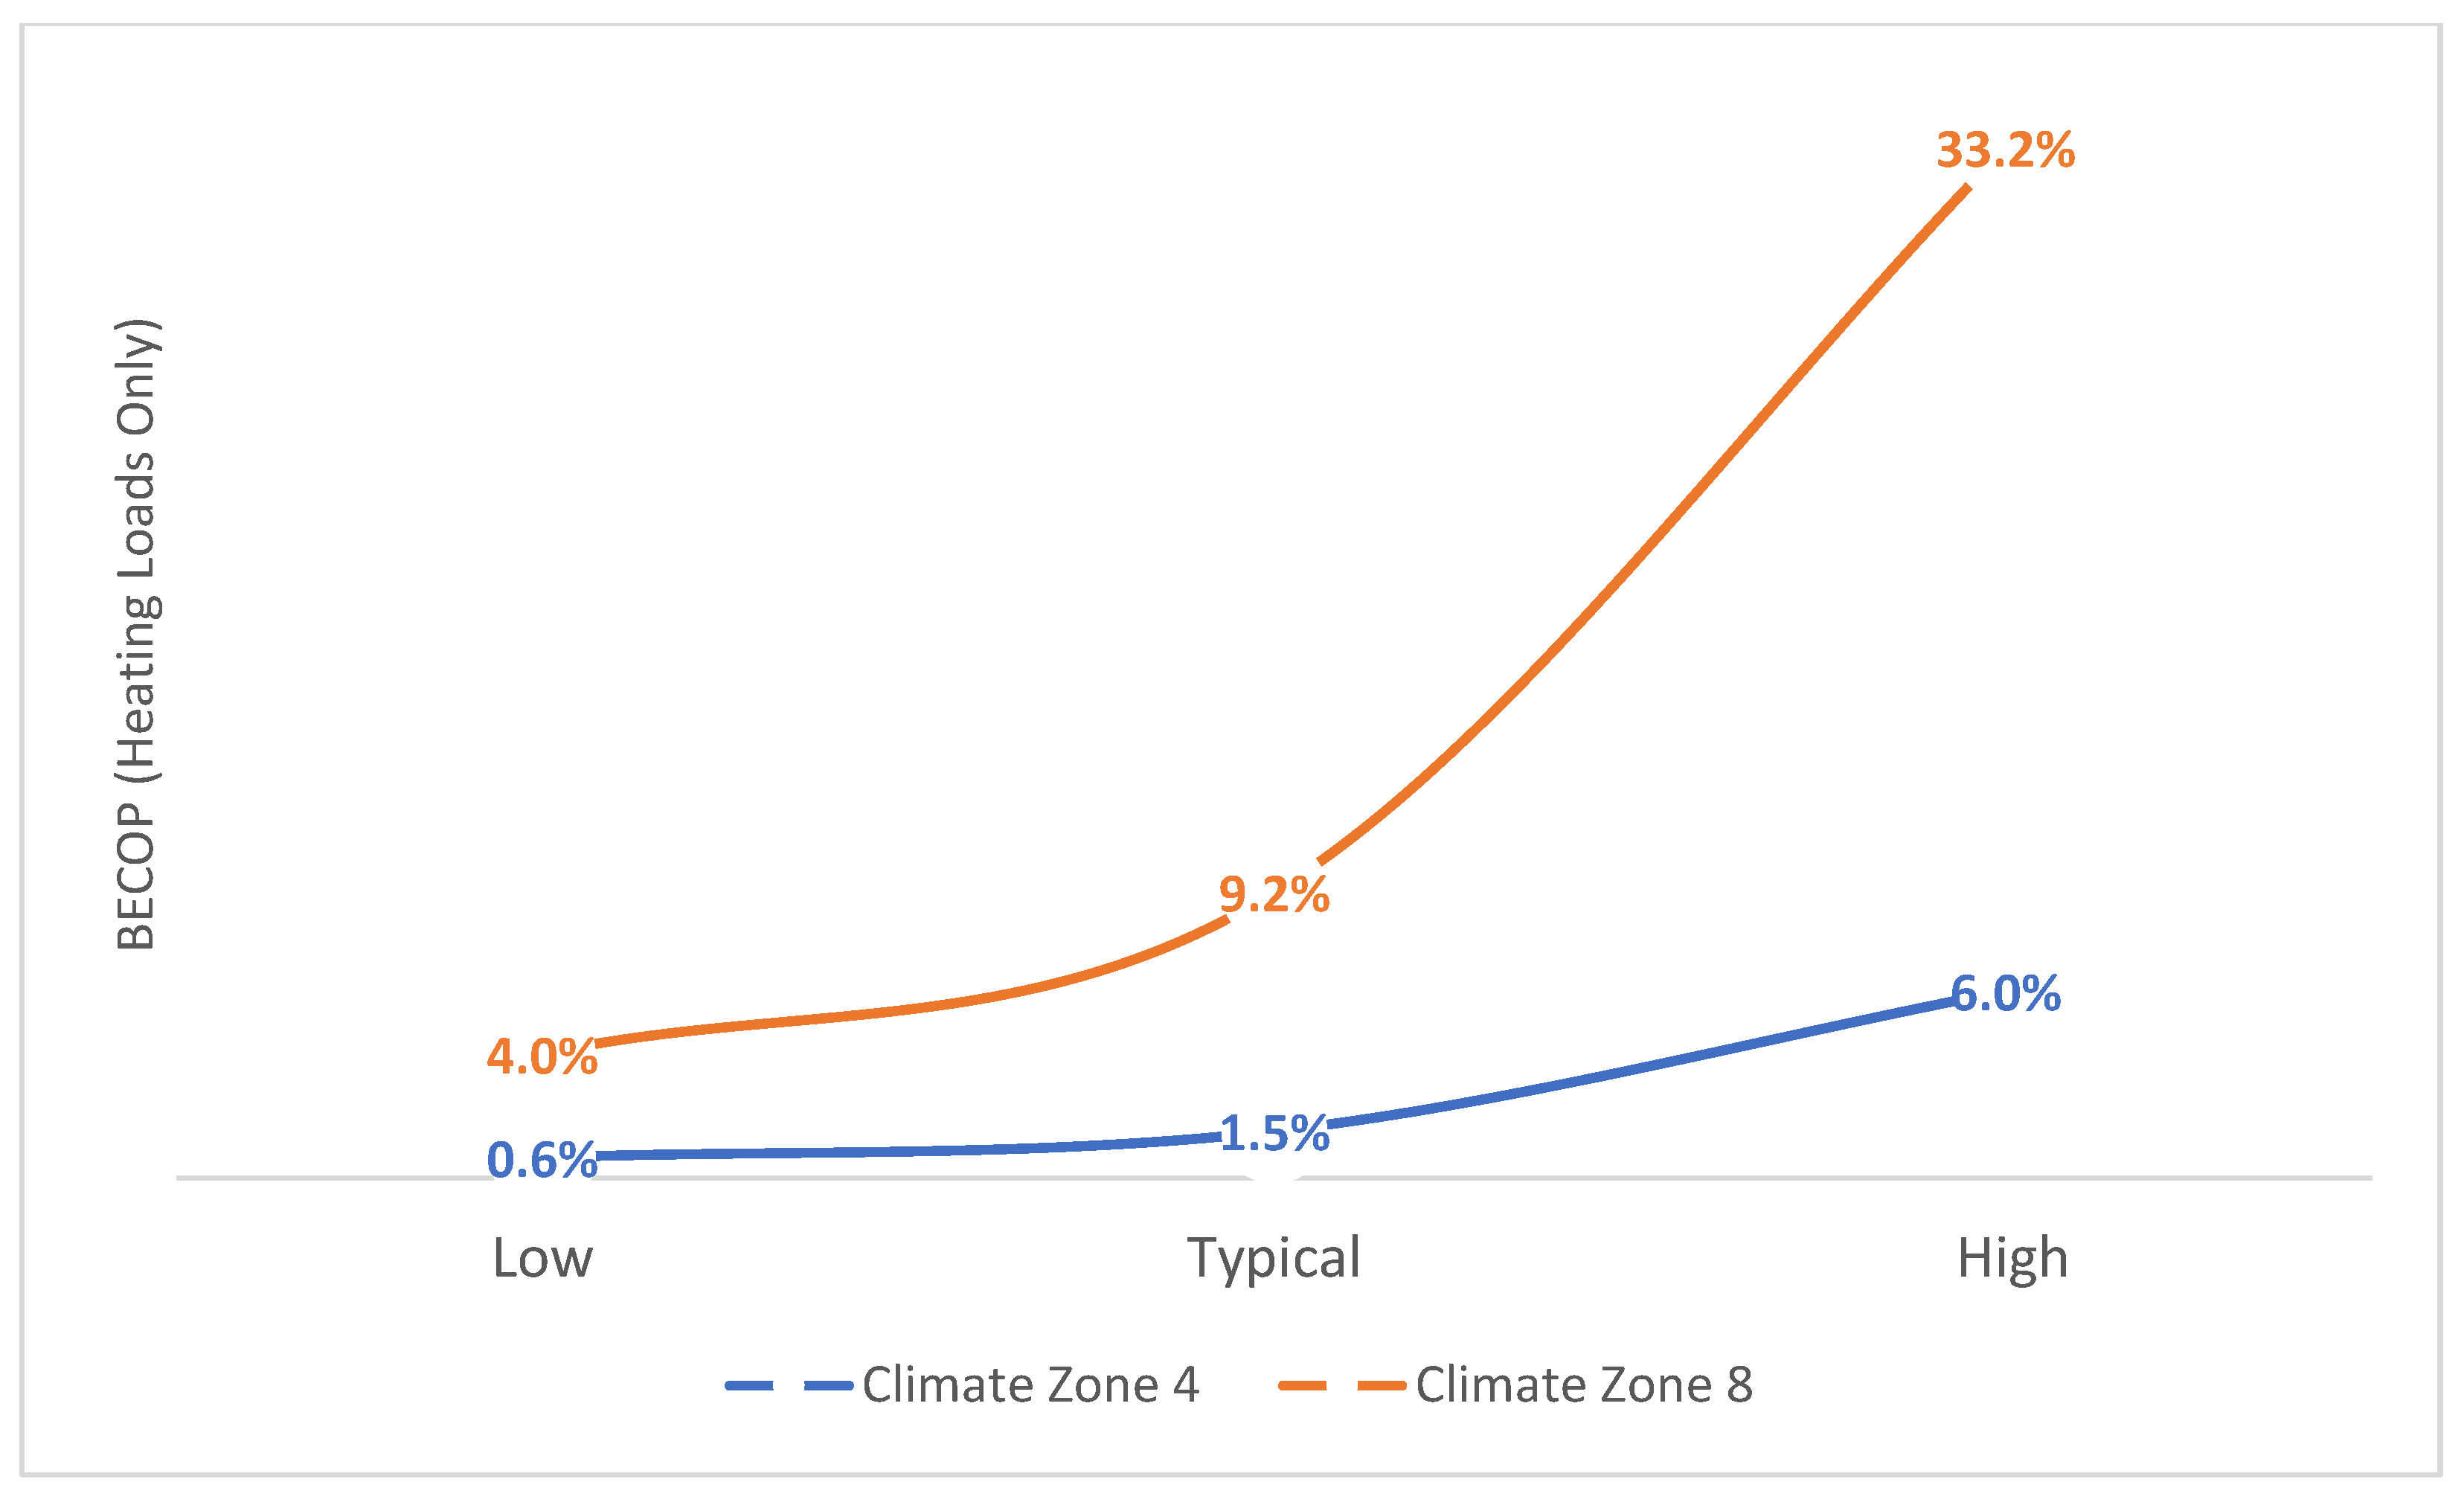
Table 12 show the energy consumption due to heat loss through the building envelope for the three archetypes and two climate zones. Abbotsford, BC and Iqaluit, NU represent Climate Zones 4 and 8, respectively. The first review of the BECOP reveals the extreme inefficiency of the building envelope from an energy perspective, where the best BECOP is below 35% compared to above 90% for furnaces and other electrical equipment. For low performance building envelopes, the calculated BECOP for Zone 4 is 0.1% and 4.0% for Zone 8. For the typical construction, the BECOP for Zone 4 is 0.2% and 9.2% for Zone 8. For the high-performance envelope, the BECOP for Zone 4 is 0.7% and 32.2% for Zone 8. These values indicate that the current BECOP ranges between 0.1% and 35%. A BECOP of 100% implies that the building envelope thermal performance is equivalent to that of the idealized building envelope.
Closer examination of the BECOP values reveals that the metric captures the coupled effect of the thermal resistance, Climate Zone, and internal heat gains. With the latter being constant, as the HDD increases, the impact of an efficient building envelope is captured and reflected with an increase in BECOP value. Moreover, the significance is most visible for the high-performance construction, where the BECOP value goes from less than 1% to 33%. If the values are compared across the levels of construction, a clear upward trend is observed from
Figure 5. For Zone 8, the impact of the building envelope properties on the BECOP is significant, with the value increasing exponentially to 33%.
For further context, the target heating energy consumption of 15 kWh/m
2.year is the current limit prescribed by Passive House [
34]. Accordingly, the house annual heating energy consumption would be 4872 kWh for all climate zones. The corresponding BECOP values for Climate Zones 4 and 8 are 0.8% and 120%, respectively. The results clearly show the deficiency and inconsistency in the approach currently followed by codes and standards pertaining to building envelope. The target needs to be a measure of efficiency or performance relative to a datum if energy efficiency is in fact the intended measure.
3.2. Sensitivity of BECOP
The results given in
Table 11 and
Table 12 are further studied to determine the sensitivity of the metric to the Climate Zone, design specification level, and both. For Zone 4, one observes that the BECOP values go from 0.1% to 0.7% and for Zone 8 from 4.0% to 33.2%. A ratio of approximately 9 is observed between the low and high construction, regardless of the Climate Zone. By examining the BECOP values across the Climate Zones, one observes a ratio of approximately 60 between Zone 8 and Zone 4, regardless of the design specification level. The fact that the same building envelope has a higher BECOP in Zone 8 relative to Zone 4 may be counterintuitive if the traditional logic that the envelope in Zone 8 would lose more energy than in Zone 4, simply due to the temperature difference. Instead, BECOP yields the improvement/opportunity potential by quantifying the relative performance of the design to the ideal design while accounting for all the building properties, including internal heat gains. The values indicate that BECOP is sensitive to the climate and that the measure is uniform when the properties of the building envelope are the same. When both the climate and the properties change, the ratio of BECOP is no longer the same, as the impact is amplified by the changes in both the climate and building envelope properties. The ratio of BECOP of a highly efficient building envelope in Zone 8 to a poorly efficient building envelope in Zone 4 is about 475, whereas the ratio of BECOP of a highly efficient building envelope in Zone 4 to a highly efficient building envelope in Zone 8 is about 6. This response is reflected in
Figure 5, where the increase in BECOP as a result of an improved building envelope performance is significantly higher in Climate Zone 8, where the improvement is more impactful. On the other hand, in Climate Zone 4, where the improved envelope has a more modest and linear impact, the BECOP displays that effect. These results clearly show the sensitivity of BECOP to the coupled effect of building envelope performance parameters in combination with the Climate Zone, along with the building’s properties and characteristics.
4. Application of BECOP
Three case studies are presented to demonstrate the applicability of the proposed metric. The case studies were selected to demonstrate the strength of the metric and the associated benefits/potentials, as well as identify potential weaknesses.
4.1. Case Study 1–Design of a New House
The first case study illustrates how a design professional could employ the BECOP to take inventory of the design decisions. For reference, the house is to be constructed in Toronto, ON, with a total living space specified by the owner to be approximately 240 m
2 without the basement and a ceiling height of 2.74 m. A 20% window to wall ratio (WWR) is selected contingent on the energy consumption. The city of Toronto, ON is in Zone 5 with a corresponding HDD18 and CDD18 of 3892 and 292, respectively [
35]. Accordingly, the variables to evaluate are the building orientation and the building envelope specifications. Firstly, the effect of WWR is investigated by considering three possibilities: 20%, 40% and 60%. The properties and characteristics of the house’s pre-design are given in
Table 13. The corresponding energy consumption and BECOP are given in
Table 14. Given the relative thermal properties of the building envelope, the energy consumption due to heating is expected to increase as WWR goes from 20% to 40%. This impact of doubling WWR is captured by BECOP as it drops from 5.4% to 4.4% reflecting a 19% relative loss in efficiency, which can be misleading as the actual loss in efficiency is only 1%. By further increasing the WWR to 60%, BECOP decreases to 3.7%, representing a 30% and 1.7% drop in relative and absolute loss of efficiency, respectively. These results show the significant difference between absolute and relative measure. The actual loss in efficiency is 1% and 1.7% as the WWR increases from 20% to 40% and from 20% to 60%, respectively. Therefore, reporting a relative loss in efficiency of 19% and 30%, which has been the norm for building envelope, can mislead the designer and lead to an erroneous design.
The heating energy consumption increases by 23% and 47% as WWR goes from 20% to 40% and from 20% to 60%, respectively. These results show that a percent increase in energy consumption is linearly proportional to WWR. Comparing the heating energy consumptions with those of BECOP, one observes that the former yields a linear trend, whereas the latter a non-linear one. Moreover, the information in the form of percent change in energy consumption can be misleading, as the results imply that the energy efficiency of the building decreased by 23% when WWR is increased by 20%. A non-apparent and critical implication is the sensitivity of the relative change in energy consumption to the building envelope properties, i.e., as the building envelope properties change the increase in heating energy consumption will be significantly different for the same WWR increases. In contrast, the change in the BECOP reflects the impact of WWR as it is a measure of the overall building envelope efficiency relative to a fixed ideal system.
In brief, BECOP provides an efficiency pattern that can be used to optimize the design. The loss in BECOP is indicative and intuitive for a designer to understand a loss in efficiency as opposed to increased energy consumption.
Secondly, the orientation of the building using a 40% WWR is investigated by varying the east–west orientation (0° to north) to the north–south orientation (90° to north). The results in the form of energy consumption and BECOP are summarized in
Table 15. They reveal that a change in orientation has no effect on the BECOP value as it goes from 4.38% to 4.36%. Although the change in BECOP value is considered negligible, it nonetheless shows the sensitivity of the metric to small changes in energy consumption. The heating energy consumptions give the same results. In brief, the minor change in BECOP and heating energy implies that the orientation has no impact on the house energy consumption for this configuration.
Further examination of the results provides an important insight into how the BECOP can provide additional information. With the slight drop in the heating energy from 24,917 kWh to 24,899 kWh, it implies a small benefit can be realized with the house oriented in the N-S direction. In contrast, the BECOP value drops from 4.38% to 4.36% indicating a decrease in the efficiency. This implies that the ideal building experienced a more significant drop in heating energy than did the investigated house, indicating that there are more potentials to improve the building envelope in the orientation facing N-S than in the E-W direction. This information, which is not intuitive from the heating energy consumption alone, is valuable and can lead the designer down the path of seeking further improvements.
4.2. Case Study 2–Retrofit Design for an Existing House
Upgrading the thermal resistance of an existing two-storey single family detached dwelling with a basement located in Toronto, ON is sought. The house is rectangular in shape with an aspect ratio of 1.5, floor area of 118.5 m
2, wall height of 2.74 m, 40% WWR, and long side facing south. The energy renovation measures (ERMs) include thermal upgrading of windows, walls, walls and windows, roof, or walls, windows, and roof. Assuming some budgetary constraint, the designer could estimate what improvements for each option could be achieved within the constraints. If BECOP is calculated for each of the options, the designer would have sufficient information to select the most impactful and cost-effective option.
Table 16 and
Table 17 show the effect of several energy retrofit measures (ERMs), improving the overall wall U-value from 0.159 W/m
2 K (R36) to 0.142 W/m
2 K (R40), improve window U-value from 1.704 W/m
2 K (R3.3) to 0.921 W/m
2 K (R6), both improvements, improving the overall U-value of the attic from 0.086 W/m
2 K (R66) to 0.071 W/m
2 K (R80), and all three improvements combined.
From
Table 17, it is evident that improving the windows provides the most savings in terms of energy consumption and improving the wall and attic U-values provides minimal benefit. Considering that the wall and attic insulation levels of the base-house are quite high relative to current codes and construction practices, this indicates that they have reached the point of diminishing returns with today’s technology. This knowledge is useful to the designer to make an informed decision. Moreover, the BECOP provides insight that is not evident from the energy consumption data, i.e., increasing the wall and attic thermal resistance using today’s technology would not improve the efficiency of the building envelope without improving other aspects of the building such as orientation, geometry, air tightness, WWR, etc. This insight allows the designer to investigate other options such as the ones presented in Case Study 1, as well as air tightness improvement, window shading, etc. As such, the path and design decisions will be guided by the information embedded in the relative changes in the BECOP. The absolute value of the BECOP also provides insight into the fact that there is still an opportunity to improve the performance with novel and advanced materials and systems, that may guide the designer to further explore. Moreover, the BECOP value accounts for the whole building envelope and rewards for having a compatible thermal resistance envelope, something which cannot be discerned directly from energy consumption data.
The changes in the BECOP value for each ERM relative to the base case are compared to the corresponding changes in energy consumptions,
Table 18. The BECOP values indicate that Option 3 provides a 1.93% increase in the building envelope efficiency, which is significantly less than the 31% reduction in the heating energy consumption. Moreover, changes in BECOP values of 0.05% and 0.03% are obtained for upgrading the wall and attic with a corresponding 1% and 0.6% reduction in heating energy. BECOP provides a measure of the building envelope efficiency which is different from energy savings. Although it is more appealing to report a saving of 31% in heating energy consumption, albeit it is a real measure, it dissuades from realizing that the heating energy saving potential for the house is significantly greater than the one obtained.
4.3. Case Study 3–Regulatory Compliance
Efficiency and COP are measures used to assess the absolute performance of equipment or systems. For buildings, these absolute measures are only prescribed for the electrical and mechanical equipment and systems such as the lighting, HVAC, pumps, fans, etc. For the building envelope thermal performance, there are no absolute measures for efficiency or COP. Present practice is to either specify a minimum thermal resistance for each sub-system (wall, window, roof, and floor) based on the climate zone, or an annual energy use and/or intensity. The regulators supporting rationale stems from comparative energy consumption, statistical analysis, or both. Case study 2 is a prime example where a 31% reduction in the heating energy consumption would resonate well with regulators not knowing that the savings correspond to 1.93% increase in the building envelope efficiency. In brief, the current approach does not provide an absolute measure of the thermal efficiency of the building envelope or account for the thermal compatibility of the various sub-systems that form the building envelope system.
BECOP is a simple, practical, and performance-based metric for regulating the energy efficiency of building envelopes. For illustration purpose, a BECOP of 4.50% as a minimum requirement for the City of Toronto is prescribed. This approach specifies an absolute efficiency measure as well as allows flexibility in the design to achieve the desired BECOP. From the results of the previous case studies, one can establish that a 20% WWR would meet the requirement,
Table 14. From
Table 15, the thermal resistance of the base house needs to be upgraded enough to improve its BECOP from 4.4% to 4.5%. Alternatively, upgrading the windows would provide more than sufficient improvement to comply with the regulation. Different approaches, designs or combinations are possible to achieve the same BECOP target, which is directly related to actual energy performance. Moreover, BECOP can be used early in the design process to account for the orientation and geometry, among other properties at no cost.
Replacing a target heating energy consumption with a BECOP value would revolutionize the regulatory compliance requirements. It would transform a deficient and inconsistent approach currently followed by codes and standards pertaining to building envelope to a measure of its performance relative to a well-defined datum. Moreover, BECOP measures the efficiency of the building envelope while accounting for the entire building properties, characteristics, climate-zone, occupancy, and operation.
5. Discussion
BECOP was developed to measure the thermal performance of the building envelope in a useful, consistent, and systematic manner. The benefits and strengths of BECOP were noted while analyzing the results of the case studies. A noted weakness is the range of the BECOP given the low efficiency of the building envelope compared to the ideal system. Nonetheless, this weakness can become a catalyst for designing a more efficient building envelope. Furthermore, BECOP values showcase the energy saving potentials that can be realized with newer and innovative building envelope systems.
The ideal system was inspired by a perfect opaque vacuum (zero conductivity, convection, and radiation properties), which was then translated into practical values for BECOP. BECOP can accommodate future advances in the building envelope technologies as it is a measure of performance and not a direct measure of efficiency.
For this study, the focus was on BECOP due to heating given Canada’s climate and was measured while accounting for all internal gains. An alternative approach is to exclude the internal gains as they depend on the occupancy and use of the building and not on the thermal performance of the building envelope. Accordingly, BECOP will provide an impartial measure of the building envelope thermal efficiency for both heating and cooling.
As demonstrated through the case studies, a significant capability of the metric is its ability to capture the performance and compatibility of the system as a whole, which traditional metrics currently used (total energy, TEUI, TEDI, etc.) are not able to capture, since there is no built-in datum. The BECOP achieves this target by ensuring that a compatible design is rewarded relative to an incompatible design. This results in a manual optimization of certain parameters, which is not possible to achieve without having an optimal design (or “idealized” design). Another advantage of the BECOP is its ability to penalize missed opportunities in the system design and reward the captured opportunities. For example, the BECOP will capture and inform the designer if, for a particular orientation, improving the thermal resistance of particular components does not offer a benefit. On the other hand, the same properties for a different orientation would further penalize the savings not achieved by that configuration. This is further demonstrated when comparing a fixed and absolute space heating EUI target (e.g., 15 kWh/m2.year). This target does not address the increased difficulty in achieving a set level of performance in colder climates, with the argument that colder climate requires a thermally efficient building envelope among other energy systems. The corresponding BECOP values identify which building envelope still has room for improvement (BECOP 0.8% in Climate Zone 4), and which one requires to be 20% more efficient than the idealized system (BECOP 120% or 1.2 in Climate Zone 8). These BECOP values show that it is not possible to build to PassivHaus in climate Zone 8 and demonstrate the impracticality of imposing a space heating EUI target for all climate zones.
6. Conclusions & Recommendations
The results from this study have revealed the following conclusions:
Current practices and regulations pertaining to the building envelope appears arbitrary and do not provide a defined measure of efficiency.
BECOP, which provides a performance measure, captures any deviations from an idealized system, and yields a measure of efficiency and thermal compatibility of the building envelope.
BECOP, which is invariant to the calculation methods and applicable to all building types and climate zones, exposes the difference between energy savings and building envelope efficiency.
QCA for the purpose of energy efficiency design can be misleading in establishing the optimal design and is deterrent to technology development as the potential energy savings are never realized.
Maximum BECOP values of 35% reveal the inefficiencies in the current building envelope technologies and the building envelope energy saving potentials.
BECOP provides a measure of the distance away from an optimized/idealized design.
The BECOP, or similar metric that utilizes a fixed ideal datum is a step in the right direction to revolutionize the regulatory methodology and philosophy and, subsequently, demand innovation from the construction industry, ensuring a positive economic and ecological impact.
This study is a first step in highlighting the differences between heating energy savings and efficiency of the building envelope. Accordingly, it is recommended that further studies be carried out to refine the properties of the ideal datum, as well as carry out extensive sensitivity analyses to guide in the interpretation of the BECOP values.
Author Contributions
Conceptualization, S.E.C. and G.E.M.; Formal analysis, G.E.M.; Investigation, G.E.M.; Methodology, S.E.C.; Resources, S.E.C.; Supervision, S.E.C.; Writing—original draft, G.E.M.; Writing—review and editing, S.E.C. All authors have read and agreed to the published version of the manuscript.
Funding
This research received no external funding.
Institutional Review Board Statement
Not applicable.
Informed Consent Statement
Not applicable.
Data Availability Statement
Not applicable.
Acknowledgments
This research was funded by McMaster University Centre for Effective Design of Structures.
Conflicts of Interest
The authors declare no conflict of interest.
References
- Marjaba, G.E.; Chidiac, S.E. Sustainability and resiliency metrics for buildings—Critical review. Build. Environ. 2016, 101, 116–125. [Google Scholar] [CrossRef]
- Nelms, C.; Russell, A.D.; Lence, B.J. Assessing the performance of sustainable technologies for building projects. Can. J. Civ. Eng. 2005, 32, 114–128. [Google Scholar] [CrossRef]
- Dadzie, J.; Runeson, G.; Ding, G. Sustainable technologies as determinants of energy efficient upgrade of existing buildings. In Proceedings of the 2018 International Conference on Smart Grid and Clean Energy Technologies (ICSGCE), Kajang, Malaysia, 29 May–1 June 2018; pp. 145–149. [Google Scholar]
- Government of Canada. Pan-Canadian Framework on Clean Growth and Climate Change: Canada’s Plan to Address Climate Change and Grow the Economy; Government of Canada: Ottawa, ON, Canada, 2016.
- Natural Resources Canada. Energy Use Data Handbook (1990 to 2016); Natural Resources Canada: Ottawa, ON, Canada, 2019.
- Gamtessa, S.F. An explanation of residential energy-efficiency retrofit behavior in Canada. Energy Build. 2013, 57, 155–164. [Google Scholar] [CrossRef]
- Babaei, T.; Abdi, H.; Lim, C.P.; Nahavandi, S. A study and a directory of energy consumption data sets of buildings. Energy Build. 2015, 94, 91–99. [Google Scholar] [CrossRef]
- Evans, M.; Yu, S.; Staniszewski, A.; Jin, L.; Denysenko, A. The international implications of national and local coordination on building energy codes: Case studies in six cities. J. Clean. Prod. 2018, 191, 127–134. [Google Scholar] [CrossRef]
- Rosenberg, M.; Jonlin, D.; Nadel, S. A Perspective of Energy Codes and Regulations for the Buildings of the Future. J. Sol. Energy Eng. 2016, 139, 010801. [Google Scholar] [CrossRef] [Green Version]
- Province of British Columbia. Regulation of the Minister of Natural Gas Development and Minister Responsible for Housing and Deputy Premier Ministerial Order No. 158; Province of British Columbia: Victoria, BC, Canada, 2017.
- Thomsen, K.E.; Rose, J.; Morck, O.; Jensen, S.Ø.; Østergaard, I. Energy consumption in an old residential building before and after deep energy renovation. Energy Procedia 2015, 78, 2358–2365. [Google Scholar] [CrossRef] [Green Version]
- Wang, E. Benchmarking whole-building energy performance with multi-criteria technique for order preference by similarity to ideal solution using a selective objective-weighting approach. Appl. Energy 2015, 146, 92–103. [Google Scholar] [CrossRef]
- Wang, E.; Shen, Z.; Alp, N.; Barry, N. Benchmarking energy performance of residential buildings using two-stage multifactor data envelopment analysis with degree-day based simple-normalization approach. Energy Convers. Manag. 2015, 106, 530–542. [Google Scholar] [CrossRef]
- Mathew, P.; Greenberg, S.; Sartor, D.; Rumsey, P.; Weale, J. Metrics for energy efficiency. ASHRAE J. 2008, 50, 40–47. [Google Scholar]
- Mohamed, A.; Hasan, A.; Sirén, K. Fulfillment of net-zero energy building (NZEB) with four metrics in a single family house with different heating alternatives. Appl. Energy 2014, 114, 385–399. [Google Scholar] [CrossRef]
- Arregi, B.; Garay, R. Regression analysis of the energy consumption of tertiary buildings. Energy Procedia 2017, 122, 9–14. [Google Scholar] [CrossRef] [Green Version]
- Chidiac, S.E.; Catania, E.J.C.; Morofsky, E.; Foo, S. Effectiveness of single and multiple energy retrofit measures on the energy consumption of office buildings. Energy 2011, 36, 5037–5052. [Google Scholar] [CrossRef]
- Chidiac, S.E.; Catania, E.J.C.; Morofsky, E.; Foo, S. A screening methodology for implementing cost effective energy retrofit measures in Canadian office buildings. Energy Build. 2011, 43, 614–620. [Google Scholar] [CrossRef]
- Penna, P.; Prada, A.; Cappelletti, F.; Gasparella, A. Multi-objectives optimization of Energy Efficiency Measures in existing buildings. Energy Build. 2015, 95, 57–69. [Google Scholar] [CrossRef]
- Morrissey, J.; Horne, R.E. Life cycle cost implications of energy efficiency measures in new residential buildings. Energy Build. 2011, 43, 915–924. [Google Scholar] [CrossRef]
- Li, D.H.W.; Yang, L.; Lam, J.C. Zero energy buildings and sustainable development implications—A review. Energy 2013, 54, 1–10. [Google Scholar] [CrossRef]
- Sadineni, S.B.; Madala, S.; Boehm, R.F. Passive building energy savings: A review of building envelope components. Renew. Sustain. Energy Rev. 2011, 15, 3617–3631. [Google Scholar] [CrossRef]
- Saunders, K. The Toronto Method of Construction—Re-Thinking How We Insulate Our Homes; Sustainable Building: Toronto, ON, Canada, 2016. [Google Scholar]
- Canadian Commission on Buildings and Fire Codes. National Building Code of Canada, 2015th ed.; National Research Council of Canada: Ottawa, ON, Canada, 1985; Available online: https://nrc-publications.canada.ca/eng/view/object/?id=453db3d5-7d64-4d00-8c6b-fd1fe342992f (accessed on 10 March 2022).
- Canadian Commission on Buildings and Fire Codes. National Building Code of Canada; National Research Council of Canada: Ottawa, ON, Canada, 2010; Available online: https://nrc-publications.canada.ca/eng/view/object/?id=cbd245df-bc91-4033-a538-fb20fcf536a1 (accessed on 10 March 2022).
- Canadian Commission on Buildings and Fire Codes. National Building Code of Canada; National Research Council of Canada: Ottawa, ON, Canada, 2015; Available online: https://nrc-publications.canada.ca/eng/view/object/?id=c8876272-9028-4358-9b42-6974ba258d99 (accessed on 10 March 2022).
- Canadian Commission on Buildings and Fire Codes. Model National Energy Code Canada for Buildings; National Research Council of Canada: Ottawa, ON, Canada, 1997; Available online: https://nrc-publications.canada.ca/eng/view/object/?id=3513c10b-54db-49c8-8d1e-6bd49e9ac597 (accessed on 10 March 2022).
- Canadian Commission on Buildings and Fire Codes. National Energy Code of Canada for Buildings; National Research Council of Canada: Ottawa, ON, Canada, 2011; Available online: https://nrc-publications.canada.ca/eng/view/object/?id=a34734e9-6f66-404f-883c-2361a5a08549 (accessed on 10 March 2022).
- Canadian Commission on Buildings and Fire Codes. National Energy Code for Buildings; National Research Council of Canada: Ottawa, ON, Canada, 2015; Available online: https://nrc-publications.canada.ca/eng/view/object/?id=ef02ee0b-e374-47ed-a0dd-c7bd63c45499 (accessed on 10 March 2022).
- Canadian Commission on Buildings and Fire Codes. National Energy Code for Buildings, 2017th ed.; National Research Council of Canada: Ottawa, ON, Canada, 2017; Available online: https://nrc-publications.canada.ca/eng/view/object/?id=3eea8f31-47ef-4280-86b0-1c148744f8f1 (accessed on 10 March 2022).
- Associate Committee on the National Building Code and National Research Council of Canada. Canadian Code for Residential Construction; National Research Council of Canada: Ottawa, ON, Canada, 1972. [Google Scholar]
- ASHRAE Standard 90.2-2007; Energy-Efficient Design of Low-Rise Residential Buildings. ASHRAE: Atlanta, BC, Canada, 2007.
- US Department of Energy. Getting Started with EnergyPlus: Basic Concepts Manual—Essential Information You Need about Running Energy Plus; US Department of Energy: Washington, DC, USA, 2010; p. 67.
- Passive House Canada. A Developer’s Guide to Passive House Buildings; Passive House Canada: Victoria, BC, Canada, 2017. [Google Scholar]
- ASHRAE. Climatic Design Information. In ASHRAE Fundamentals Handbook; ASHRAE: Atlanta, GA, USA, 2013. [Google Scholar]
| Publisher’s Note: MDPI stays neutral with regard to jurisdictional claims in published maps and institutional affiliations. |
© 2022 by the authors. Licensee MDPI, Basel, Switzerland. This article is an open access article distributed under the terms and conditions of the Creative Commons Attribution (CC BY) license (https://creativecommons.org/licenses/by/4.0/).


