1. Introduction
Supply chain management (SCM) is an essential element in many sectors and industries with different levels of influence and integration [
1]. The development of modern society requires the development of infrastructure and efficiency of a sustainable supply chain. As we should strive to develop new infrastructure, so we should take care of the existing infrastructure [
2] and its maintenance [
3]. In that way, we justify the funds we have invested in the construction of the existing infrastructure. When constructing new and maintaining existing infrastructure, an optimum relation between investment in construction/maintenance and future maintenance should be found. For this reason, in cases where it is possible and justified, we must tend to use both alternative and waste materials when building pavement structures. First of all, we should strive to reduce the use of quarry stone and gravel from separation because obtaining the material in this way leads to permanent consequences for the environment.
The reasons for the use of recycled asphalt and recycling in order to increase sustainability, as well as the rationale for the research in this paper are as follows: increase in the price of main raw materials (oil, stone materials) [
4], savings in terms of raw materials because the amount of new materials is reduced [
5,
6], reduced need for disposal of old material, environmental protection as an important part of sustainability [
7], energy saving during asphalt production, reduction in air pollution during the production of new asphalt [
8], and reducing the need to transport materials [
9].
Political events in the countries that are the main producers of oil, which is the basic raw material for bitumen production, very often affect the price of oil and bitumen and it certainly causes an increase in the price of asphalt production through the price of materials, but also through the costs of energy sources used for transport and production. The possibility to make savings in terms of raw materials in the supply chain does not need to be specifically proven or explained. A review of previous studies will indicate the quantities of conventional materials that have been replaced with recycled asphalt, cement, bitumen emulsion, fly ash, zeolite, and Bakelite as a type of plastic. It should be emphasized that it is particularly important to use materials that can no longer be used in the primary production from which they originate, such as fly ash and some types of plastic. Considering the reports of statistical offices related to the amount of waste, it is clear that it is necessary to examine, as much as possible, the use of different waste materials which, in addition to taking up huge space during their disposal, also have a very negative impact on the environment.
Population growth and urban development have led to the need to develop modern infrastructure. For the same reason, there is an increase in generation of waste materials, so it is necessary to use waste materials as much as possible in the construction of infrastructure. Use of waste materials has reduced the load on the complete supply chain raw material in asphalt production. Therefore, it is necessary to increase the scope of research in the field of waste materials in the construction and maintenance of infrastructure. It is also essential to adopt appropriate legal documents that would regulate and encourage the use of waste materials. Through these tasks are manifested essential needs in a sustainable supply chain in construction. The use of such materials in the construction of infrastructure would lead to a decrease in harmful gas emissions as an important part of sustainability. In-place recycling would further reduce emissions and heat.
The use of bitumen emulsion, cement, waste materials (slag, fly ash, and Bakelite), and other materials (zeolite) in cold recycling would lead to a reduction in the cost of recycling pavement structures, increase in environmental protection (sustainability), but, at the same time, remaining mechanical properties of pavement structures within permissible limits. The basic aims (BA) of the research in this paper are as follows:
BA1. To reduce the cost of cold in-place recycling by replacing parts of cement and bitumen emulsion with waste materials.
BA2. To reduce a negative impact on the environment by reducing the amount of cement and bitumen emulsion compared to standard cold in-place recycling procedures.
BA3. To apply and (or) use materials that can no longer be used in the main production processes from which they originate. This means to reduce the load on the complete supply chain raw material in the construction industry.
In addition to the basic aims, the secondary aims (SA) of the research are as follows:
SA1. The research should serve as a basis for emphasizing the advantages and popularization of recycling of old pavement structures by cold in-place recycling in relation to other types of recycling, reconstruction and rehabilitation that are more prevalent in the Republic of Serbia.
SA2. To prove that zeolite, fly ash, slag, and Bakelite in addition to cement and bitumen emulsion, which are commonly used as additives in cold recycling processes, can be used, while meeting the requirements in terms of mechanical properties.
SA3. Creating a novel integrated MCDM (multi-criteria decision-making) MEREC-CoCoSo model for evaluating mixtures. This is particularly important because, according to Anysz et al. [
10], one of the biggest problems in civil engineering is making objective decisions, especially when it comes to the selection of technologies and material variants as was a case in [
11]. Operational research provides a consistent and applicable groundwork for engineering decision-making. It is evidenced by a significant number of publications related to this topic, such as [
12,
13,
14].
2. Background
2.1. Overview of Studies with Asphalt Mixture
In the Republic of Serbia, in 2002, Uzelac and a group of authors, on behalf of the Republic Roads Directorate, defined instructions and conditions for deep recycling under a cold procedure [
15]. This document is the basis for further research since we did not have many cold-procedure rehabilitations in the past, so all studies, including this paper, will serve to supplement and improve these guidelines. Within [
16], Miljković presented the influence of the percentage of bitumen emulsion on asphalt mixtures. After technical instructions, it was the first significant research of Serbian scientists on bitumen emulsion. However, those tests were not related to cold recycling. The tests have shown an increase in indirect tensile strength and stiffness modulus over time, especially in the first 28 days. Significant research in the field of application of bitumen emulsion and cement in a cold recycling process in Serbia was conducted by Jakovljević [
17]. He examined six groups of mixtures that differed from each other in a content of crushed stone 0/22 mm, recycled asphalt, bitumen emulsion and cement. Based on the examination of indirect tensile strength and compressive strength, it can be seen that for mixtures bound only with cement, lower values are obtained by increasing the amount of recycled asphalt. When it comes to mixtures where binder materials are both cement and bitumen emulsion, it can be seen that, by increasing the amount of recycled asphalt in the mixture, the values of indirect tensile strength and compressive strength increase, too, i.e., the values of these two parameters are higher for mixtures with 80% of recycled asphalt compared to mixtures with 50% of recycled asphalt and mixtures without recycled asphalt.
The research [
18] compares three asphalt mixtures: (a) hot mixture containing limestone aggregate-filler (HMA), (b) HMA containing jet grouting waste JGW (HMAJ), (c) cold recycled asphalt mixture containing JGW (CRAJ). Leaching tests of JGW and reclaimed asphalt pavement (RAP) were conducted; the best configurations of the three mixtures were determined by using the volumetric method through gyratory compaction.
Kavussi [
19] also examined fatigue at different temperatures (−10 °C, 5 °C, 20 °C) and different curing times (7, 28, and 120 days). The author concluded that the addition of cement led to a reduction in the fatigue curve slope, which is especially evident at temperatures of −10 °C. Dołzycki and Jaskuła [
20] made a review of the situation in Poland, and partly in the world, in terms of the use of emulsion and cement. The same authors also examined the influence of the content percentage of emulsion and cement on the stiffness of the asphalt mixture. The reason why they examined the influence is that, during the end of the last century, a significant number of roads for light and medium traffic in Poland were rehabilitated by cold recycling. Maurizio Crispino and Claudio Brovelli [
21] presented some results obtained during the construction of roads in Italy. The obtained results refer to specimens of recycled base layers with bitumen emulsion cured for 72 h and at 40 °C. Their results show that there is no significant difference in Indirect Tensile Strength (ITS) with foam bitumen and bitumen emulsion. Raschia et al. [
22] conducted tests of the effects of water and cement on cold recycled mixtures. A total of four mixtures with two different water contents (2% and 4%) and two different cement contents (0% and 1.5%) were tested. The emulsion content was 5% by aggregate mass. One of the conclusions of the research is that cement-free mixtures provide sufficiently high values of ITS, so that the use of cement is unnecessary. The authors in [
23] examined the influence of the content of cement and bitumen emulsion on the values of indirect tensile strength (in dry and wet condition), rut resistance (at 60 °C), and the values of the BBR (bending beam rheometer) test (at −10 °C). According to these authors, the percentage of cement of 1.5% is also the optimum cement content for cold recycled mixtures. The authors in [
24] examined the influence of bitumen emulsion and cement on mixture properties. The recycled asphalt was from the territory of China. They made a total of 12 mixtures. They introduced the term CTI (cracking test index), which is a function of the mixed effect of the content of bitumen emulsion and cement and shows resistance to cracking. Increasing the emulsion content and decreasing the cement content increase the resistance to cracking.
Ma Tao et al. [
25] investigated the influence of cement and bitumen emulsion content on tensile strength, and also paid attention to the type of aggregate. Softić et al. [
26] varied the content of cement and bitumen emulsion within the research. They tested ITS on dry specimens and water-saturated specimens. After preparation, the specimens were kept in a dryer at 60 °C for 72 h. In general, from the tests performed, it can be concluded that with an increase in cement content, the values of ITS also increase. They concluded that the increase in cement content leads to an increase in tensile strength in both dry specimens and wet specimens. Significant increase in strength was expressed for up to 1.5% of cement. Various authors [
27,
28] have concluded similarly. It is noticeable that ITS first increases and then decreases with a further increase in water content. As in other studies, it is evident that ITS increases with increasing cement content [
29,
30,
31].
Pi, with four other authors [
32] in China, conducted a series of experiments to analyze the effect of granulometry, emulsion type, water content, and cement content on mixtures by cold procedures. What distinguishes this research is that they observed mortar obtained from cement and bitumen emulsion under a microscope [
33]. The conclusions of the research are that cement hydration products increase the contact surface between the mortar (of cement and emulsion) and the aggregate since the surface of the mortar becomes uneven. The authors emphasized the importance of controlling the amount of all materials because a larger increase in the amount of emulsion could weaken the binding properties of cement. Increasing the early strengths of cold mixtures, which are small, can be achieved by using emulsion activators or other emulsion additives as well as better emulsion types [
34]. In his research [
35], Chen came to the conclusion that the order of mixing the components is important. As the best variant, he suggests mixing cement and emulsions, then adding aggregates, but the author does not recommend a variant where all ingredients are mixed together or first to mix water, aggregate and cement.
During road maintenance works, it often happens that a large amount of waste materials appears. All materials that are originally treated as waste must be stored properly, which requires huge disposal areas. However, some materials do not necessarily have to be disposed of; they can also be reused. The recommendation of the European Asphalt Pavement Association (EAPA) is that 100% of the recycled asphalt should be used and recycled [
36]. Recycled asphalt is obtained by scraping the existing asphalt layers, grinding, and crushing them. The RAP obtained by grinding is finer and denser compared to the RAP obtained by crushing.
Table 1 lists the statistical data from 2017 on the quantities of recycled asphalt in some European and world countries.
In the available research, cold recycling mixtures were prepared with bitumen emulsion and cement. Some authors have tested mixtures only with cement or only with emulsion. As stated in regulations, attention must be paid to such mixtures because they are specific in relation to mixtures in which cement and bitumen emulsion are combined. In most studies, the cement content was 2% or less [
37,
38], although in some studies the cement content was 6% [
22]. The bitumen emulsion content in the studies was between 2% and 5% with few studies where the emulsion content was higher than 5%.
Table 1.
Overview of the quantities of recycled asphalt in Europe and in the world, and its use [
39].
Table 1.
Overview of the quantities of recycled asphalt in Europe and in the world, and its use [
39].
| Country | Quantities of Asphalt Recycled, 2017, (Tons) | Percentage of Total Recycled Asphalt (Different Uses) |
|---|
| HMA and WMA Produced | Half WMA Production | Cold Recycling | Unbound Road Layers | Other Civil Engineering Applications | Landfills/Use for Other Purposes/Unknown |
|---|
| Austria | 1,650,000 | 60 | no data | no data | no data | no data | no data |
| Belgium | 1030 | 95 | no data | no data | no data | no data | no data |
| Czech Republic | 2,600,000 | 14 | 0 | 30 | 20 | 10 | 26 |
| Denmark | 1,165,000 | 66 | 0 | 0 | 8 | 0 | 26 |
| Finland | 1,200,000 | 100 | 0 | 0 | 0 | 0 | 0 |
| France | 6,400,000 | 70 | no data | no data | no data | no data | no data |
| Germany | 13,000,000 | 84 | 0 | 0 | 16 | 0 | 0 |
| Great Britain | 3,400,000 | 90 | 0 | 0 | 0 |
| Hungary | 120,000 | 95 | 0 | 0 | 0 | 4 | 1 |
| Italy | 9,000,000 | 23 | no data | no data | no data | no data | no data |
| Netherlands | 4,500,000 | 71 | 0 | 11 | 0 | 0 | 18 |
| Norway | 1,101,000 | 30 | 0 | 1 | 69 | 0 | 0 |
| Slovakia | 50,000 | 96 | 0 | 2 | 1 | 1 | 0 |
| Slovenia | 84,000 | 24 | 0 | 6 | 10 | 0 | 60 |
| Spain | 494,000 | 83 | 0 | 0 | 14 | 0 | 3 |
| Turkey | 2,570,589 | 9 | 0 | 6 | 85 | 0 | 0 |
| USA | 72,500,000 | 96 | 0 | 0 | 4 | 0 | 0 |
Based on the reviewed available literature, it can be concluded that the studies are very heterogeneous.
2.2. Overview of the Application of MCDM Methods in Suply Chain and Civil Engineering
Rani et al. [
40] applied the MEREC method along with the ARAS (additive ratio assessment) method for selection of technology for food waste treatment. Keshavarz-Ghorabaee [
41] used the methods of MEREC, SWARA II (stepwise weight assessment ratio analysis) and WASPAS (The weighted aggregated sum product assessment) for selecting the location for new distribution centers. Simic et al. [
42] applied the MEREC and CoCoSo methods to increase the resilience of transport systems. In the paper [
43], the authors proposed a hybrid framework of the Pythagorean fuzzy analytic hierarchy process (PF-AHP) and Pythagorean fuzzy combined compromised solution (PF-CoCoSo) for identification of performance outcomes (POs) realized due to Circular Supply Chain (CSC) enablers (CSCEs) adoption. Ulutas et al. [
44] have proposed an MCDM model that consists of three fuzzy MCDM methods, including: the PIPRECIA (pivot pairwise relative criteria importance assessment), the PSI (Preference Selection Index), and the CoCoSo method. They performed measuring of performance of transportation companies and ranked them according to performance analysis. The CoCoSo method has been applied in various fields, so Wen et al. [
45] considered one of the most important tasks in the supply chain, the selection of 3PL (third-party logistics) service supplier selection. They extended the CoCoSo method to hesitant fuzzy linguistic environment. Yazdani et al. [
46] applied the Grey CoCoSo method to measure the performance of suppliers in a construction company in Spain. They combined this method together with DEMATEL (decision making trial and evaluation laboratory) and BWM (best worst method). As one of their conclusions, the authors noted that their approach facilitates the evaluation process while indicating trustable outcomes. Zavadskas et al. [
47] used integration of Delphi and fuzzy CoCoSo method in order to help to assess buildings’ end-use efficiency making an emphasis on sustainability and including criteria of social benefit. Zhang et al. [
48] made integration of BWM and CoCoSo model based on the interval rough boundaries for selecting the most suitable component supplier for housing development. Rough set theory has also been integrated into the following papers. Stević et al. [
49] developed a combined Rough DEMATEL and Rough EDAS (evaluation based on distance from average solution) model for supplier selection in the construction supply chain. A similar problem of supplier assessment in the construction supply chain has been considered in [
50], where the authors have developed the Fuzzy FUCOM (Full Consistency Method)—Rough COPRAS (COmplex PRoportional Assessment) model, and in [
51] where the authors have developed the Fuzzy FUCOM and Interval Rough SAW (simple additive weighting) model.
3. Materials and Methods
The experimental research was performed in accordance with the Wirtgen manual [
52]. This method was chosen because of its simplicity, but above all because of its wide distribution around the world. An additional reason for the selection of this manual is the fact that it represents the base for some national manuals; the Croatian one, for example. The materials were selected in order to meet the basic objectives of the test in terms of economic, mechanical, and environmental impact criteria. In previous research, only cement, bitumen emulsion, sparkling bitumen, or combinations of these materials have been used. Moreover, a novelty in this research is the examination of the effect of frost on cold recycled mixtures on the spot. Frost resistance has been tested very little so far. Recycled asphalt and recycled stone were taken from the pavement construction in Žabalj from homogeneous sections. Homogeneous sections were defined based on Benkelman beam measurements and visual inspection (
Figure A1—phase 1a, Phase 1b, Phase 2a). The granulometric composition of recycled material should be within the limits defined in a manual. After checking the granulometric composition and its possible correction, we proceeded to determine the optimum fluid content, which was determined for each different combination of binders. After determining the optimum fluid content, specimens with a certain optimum fluid content were made. The manual defines the conditions for curing specimens. After curing specimens, indirect tensile strength and the dynamic modulus of elasticity were tested after 7 and 28 days in dry conditions, 28 days in a water-saturated state and for specimens exposed to frost.
3.1. Materials Used in the Experiments
The emphasis is on the application of materials that would be used in a cold recycling process for base layers of pavement structures. The materials to be used in the tests are shown in
Table 2 (recycled asphalt, bitumen emulsion, cement, zeolite, Bakelite, slag, and fly ash).
We pointed out that 78% of the existing recycled material was used because it lacked fine particles, so we had to add a smaller filler.
All materials were dry when making samples. Zeolite, cement, slag, and fly ash were dried to constant mass at a temperature of 105 ± 5 degrees.
3.2. Granulometric Composition
After mixing materials, a representative specimen was taken by the quartering method. The representative specimen was taken to determine the granulometric composition of the recycled mixture. The sifted material, as is common in recycled asphalt and recycled mixtures, had a shortage of fine grains (
Table 3). This can be explained by the fact that small particles of stone flour and sand are bound with bitumen, and also depends on the milling machine used [
54].
Therefore, it is necessary to correct the granulometric composition by adding finer fractions. All tests within this paper were performed according to the Wirtgen manual for cold recycling [
52]. The granulometric composition of the mixture was corrected by adding a stone filler. Filler was material passing at 0.063 mm. Since the tests were performed on specimens of 5500 g, it was determined the content of individual fractions for that amount of material on the basis of the content percentage obtained by the calculation.
3.3. Composition of the Mixtures
With the aim of reusing materials from existing pavement structures and waste materials from other industries, reducing the cost of construction and reducing environmental pollution, materials tested within cold recycling mixtures were selected. The materials were selected on the basis of previous experiences of the usage of waste materials as well as considering materials used in other technologies of construction, rehabilitation, and reconstruction of roads. The following materials were selected for testing:
Bitumen emulsion;
Cement—as a common additive to bitumen emulsion in cold recycling;
Zeolite—a partial replacement of cement;
Fly ash—a partial replacement of cement;
Slag—a partial replacement of cement;
Bakelite as a type of plastic—a partial replacement of bitumen emulsion.
After correcting the granulometric composition, the optimum fluid content was examined for the mixtures. The optimum fluid content means the fluid content at which the maximum bulk density is reached. When the term fluid is used, it means the water content added to the mixture and the water content contained in the emulsion. For each different binder combination, it was necessary to determine the optimum binder content. The optimum binder content was determined for:
Mixtures with 2% of cement;
Mixtures with 3% of cement, which were later rejected due to efforts to reduce the cement content as much as possible; however, most recommendations are based on limiting the cement content to 2%;
Mixtures with cement and slag (20% of cement mass has been replaced by slag);
Mixtures with cement and fly ash (20% of cement mass has been replaced by fly ash);
Mixtures with cement and zeolite (20% of cement mass has been replaced by zeolite);
Mixtures with cement and Bakelite (20% of bitumen emulsion mass has been replaced by Bakelite).
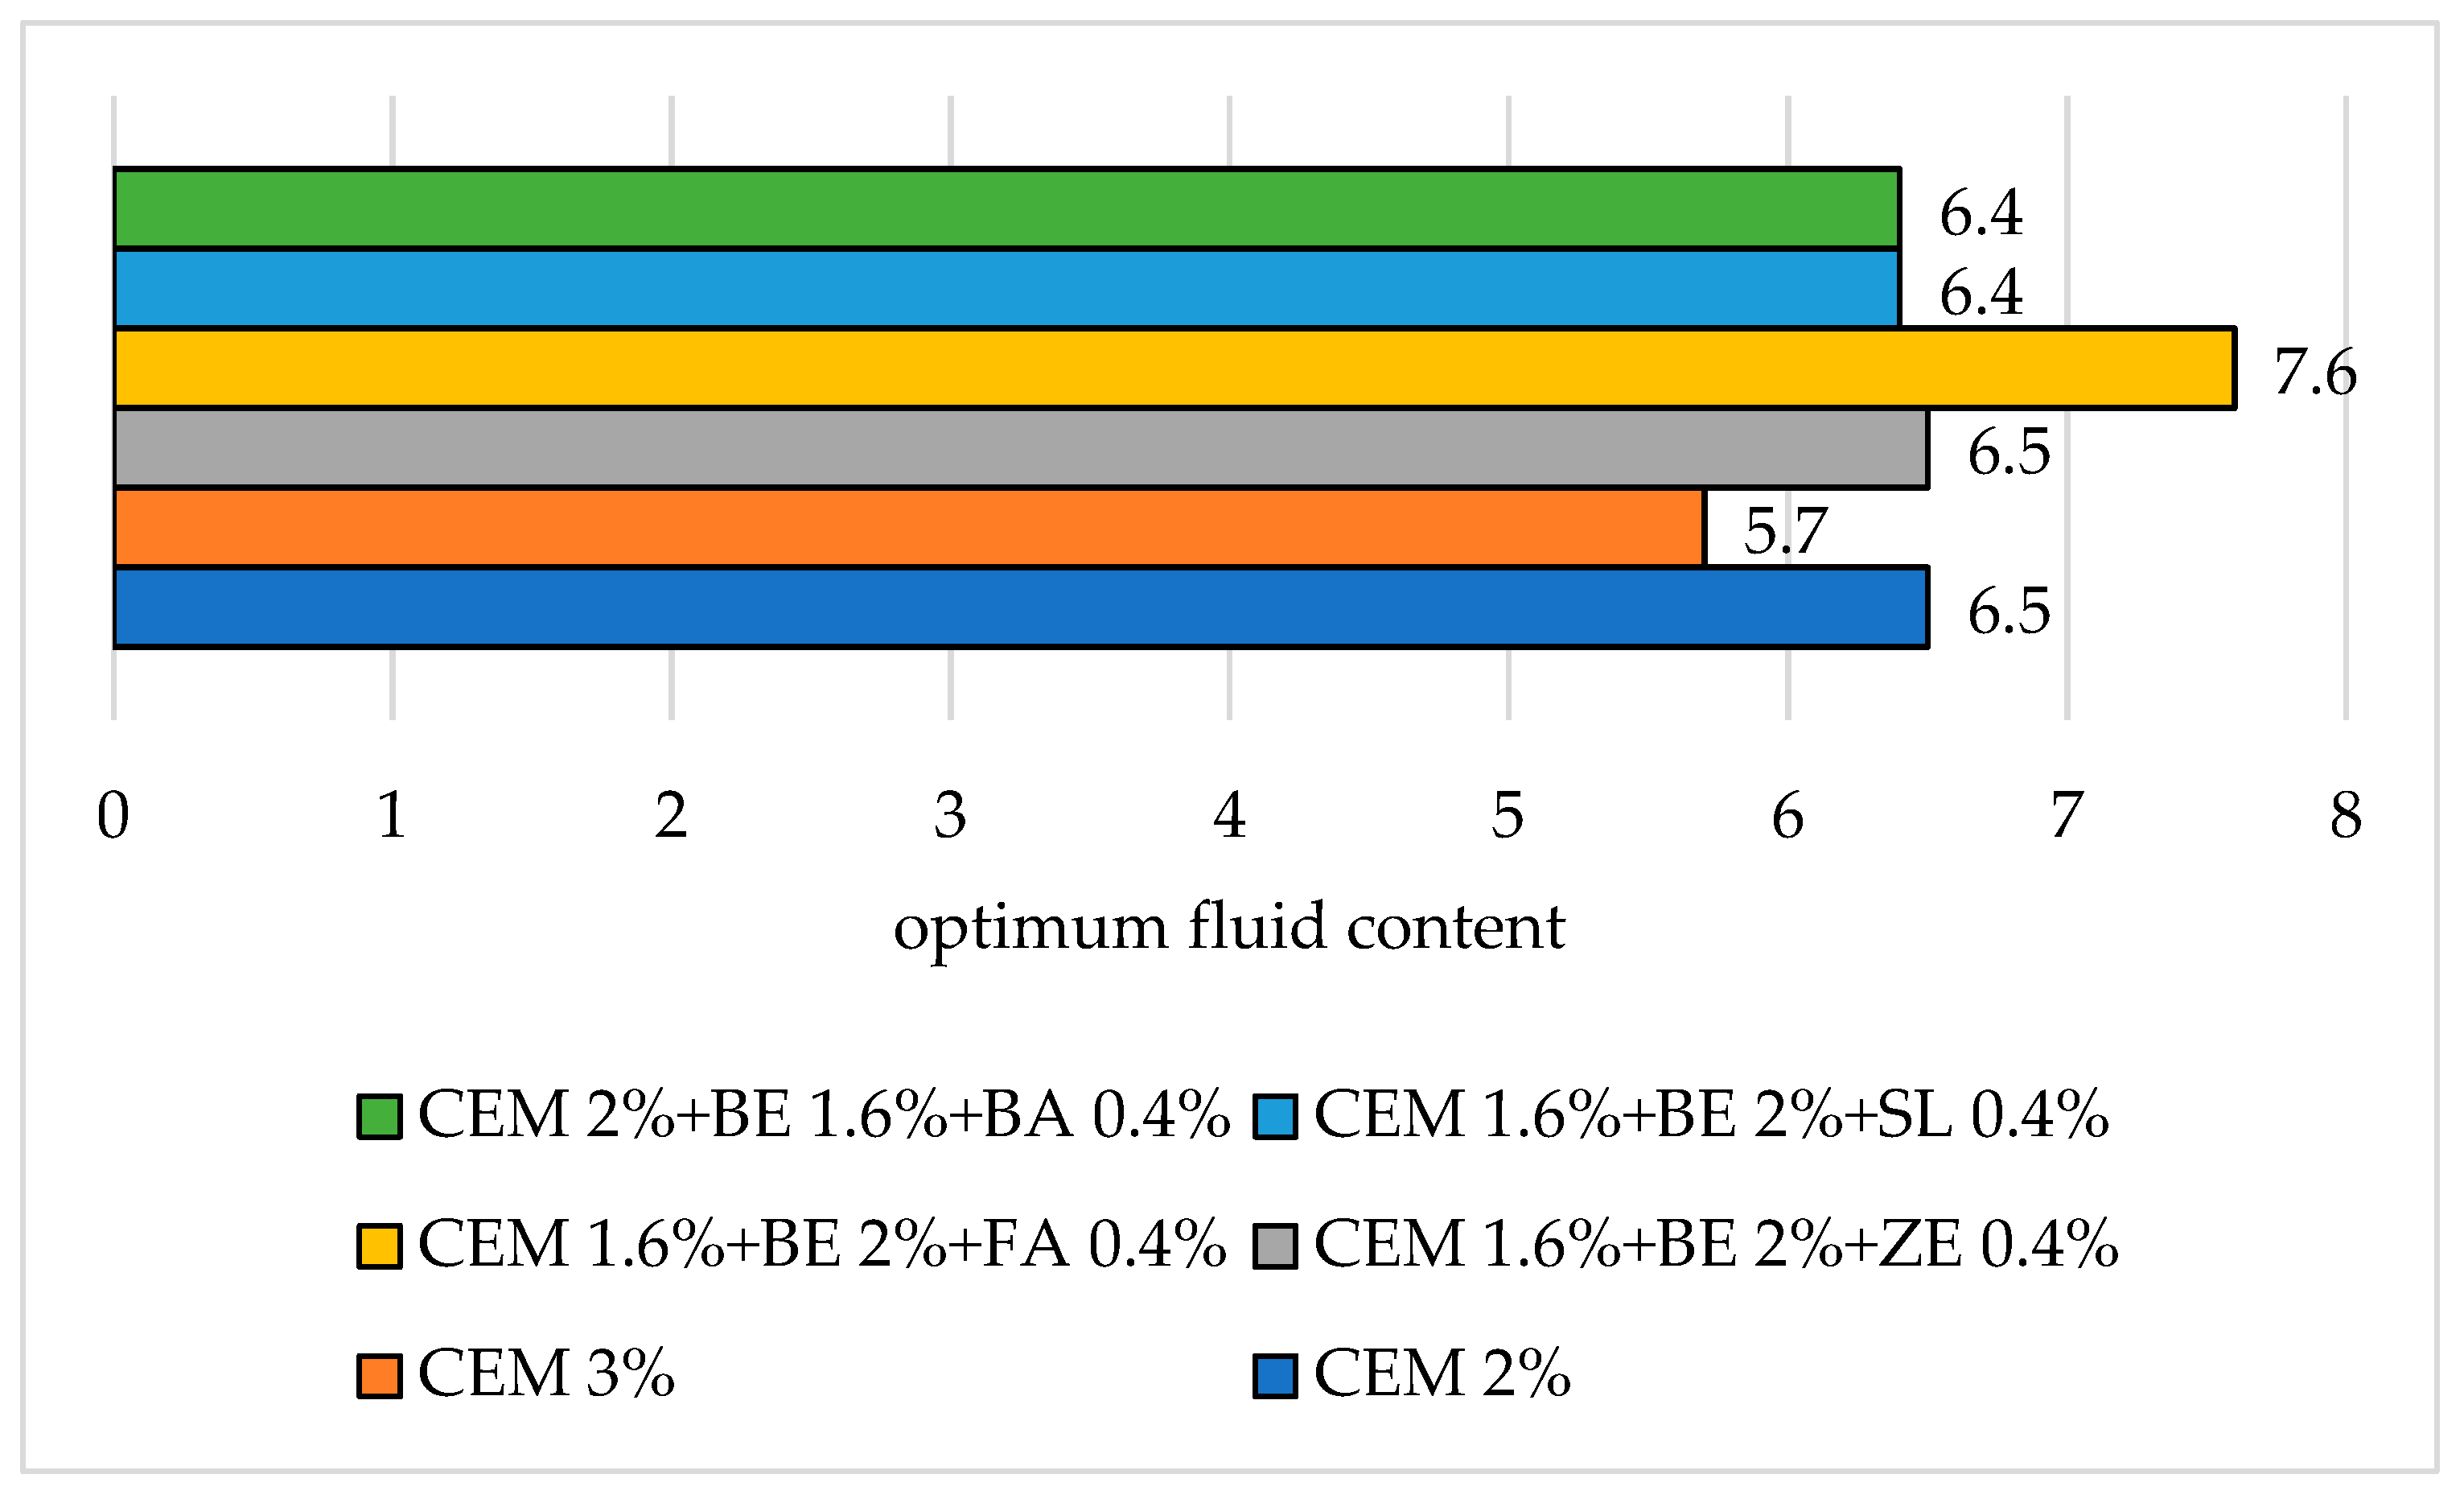
When testing specimens to determine the optimum fluid content, water and bitumen emulsion were added to the previously prepared mixture of the fractions of recycled asphalt and stone, filler, and cement. It is important to note that both recycled asphalt and stone were dried to constant mass and only in that case was it possible and justified to determine the optimum fluid content. After preparing a test specimen and compacting it with a compactor, the specimen was dried at 40 °C to constant mass. The synthetic representation of optimum fluid contents depending on the mixture is shown in
Figure 1.
The experiment can be described in two parts. The first part represents the optimum determination of fluid content (OFC). The optimum fluid content is determined for each different content of hydraulic binder (binder such as cement, slag, zeolite, and fly ash). Optimum fluid content represents optimum water content and bitumen emulsion. For example, we have determined the optimum fluid content for a mixture with 2% of cement.
In the second part of the experiment, the mixtures with the determined OFC content were prepared. If we added 3% of bitumen emulsion (which is a liquid in itself) to the mixture with 2% of cement, we had the same OFC (for 2% of cement) again, but by adding more emulsion, less water was needed.
By determining the optimum fluid content, all the data for defining the quantities of individual materials for specimen preparation were determined.
The formulation of all mixtures tested is given in
Table 4.
3.4. Preparing and Curing of Specimens
A total of 56 specimens were made in the second part of the study. Bitumen emulsion was added to the prepared mixture of recycled asphalt, stone, and filler. All materials were then mixed to obtain a compact mixture. The mixture was compacted by compactor so that five layers of the mixture are poured into a mold. The compaction energy, according to the modified Proctor test, is 2750 kNm/m3.
The specimens that were compacted and removed from the mold were placed in a dryer at 40 °C and dried to constant mass. The mass of the specimens is periodically checked, and all specimens reached a constant mass in a period of about three days from the beginning of drying. After reaching a constant mass, the specimens were cured in a humid chamber (increased humidity) at a temperature of 20 ± 2 °C to simulate field conditions. The specimens tested dry were cured in a humid chamber until the day of the test and then removed from the chamber one hour before the test. The specimens tested wet were cured in a humid chamber for up to one day before the test, then immersed in water for one day, and after removal from the water were wiped off (excess surface water was wiped off) and then tested. The specimens tested for frost were cured in a humid chamber for up to 14 days, and then exposed to freezing and thawing cycles for 14 days, before being tested on the last day (28th day) according to EN 13286-54 [
55].
3.5. Laboratory Tests
Indirect tensile strength was tested in accordance with EN 12697-23 [
56] for dry specimens, while for water-saturated specimens, the strength was determined in accordance with EN 12697-12 [
57].
The specimens were tested on a press manufactured by Matest. Indirect tensile strength is determined on the basis of Equation (1):
where:
ITS—indirect tensile strength (MPa);
P—maximum applied load (kN);
H—average height of specimen (mm);
D—diameter of specimen (mm).
The specimens were broken in a way that the load was applied at a speed of 50.8 mm/min. It is set on the press that the load is applied until the moment when, after reaching the maximum strength, the strength decreases by 10%. Since the dimensions of specimens varied very little from standard dimensions, with a height of 120 mm and diameter of 150 mm, all obtained results were corrected to be comparable. In general, the corrections were very small, so even if they were not made, the results obtained would not be much different. The differences between the corrected and uncorrected values are less than 1%.
The dynamic modulus of elasticity, determined by the ultrasound method, was based on determining the time of travel of longitudinal waves through the base of a specimen of a certain length. Unlike the resonant frequency method, the ultrasound method does not depend on a shape of specimen, but depends on the elastic properties of medium. Ultrasound testing equipment consisted of pulse generators, transmitters, receivers, electrical pulse amplifiers, and timers. The appearance of the ultrasound equipment of the manufacturer Matest and the method of performing the experiment are shown in
Figure 2.
The time of travel of longitudinal waves was measured from the moment of sending a pulse from one side of the sample to its reception on the other side of the sample. The time of travel is denoted by
T. Ultrasound speed (
V) is determined by the Equation (2):
where:
Based on the speed of ultrasound, the dynamic modulus of elasticity (
E) is calculated according to the Equation (3):
where:
For cement-stabilized materials, the values of the Poisson’s ratio range from 0.15 to 0.30. A value of 0.25 was adopted for the calculation. The air void contents of the specimens were determined following EN 12697-8 [
58].
3.6. Method Based on the Removal Effects of Criteria (MEREC)
MEREC is an objective weight method constructed on the elimination effects of criteria to compute the criteria’s weights in an MCDM problem. MEREC uses specific steps to determine objective weights [
59].
Formation of an initial decision matrix.
Normalization of the initial matrix (
X) which consists of elements
xij by simple linear normalization by applying Equations (4) and (5).
Compute the alternatives’ total performance (
Si). A logarithmic measure with equal criteria weights is used to determine the overall performance of alternatives, which is based on a non-linear function. It ensures that lower values of
generate larger values of performances (
Si) based on the normalized values acquired in the preceding phase, and Equation (6) is used.
Remove each condition and use the logarithmic measure to calculate the performance of the alternatives. There are
m sets of outcomes that are linked to
m different criteria.
denotes the total performance of
ith option in terms of removing the
jth criteria, refer to Equation (7).
Calculate the absolute deviations’ total influenced by the values acquired in stages 3 and 4, the elimination impact of the
jth criteria. Let
signify the effect of deleting the
jth criteria, refer to Equation (8).
Determine the criteria’s final objective weights using the removal effects
from step
v. The weight of the
jth criteria is denoted by
by Equation (9).
3.7. Combined Compromise Solution (CoCoSo) Method
Yazdani, Zarate, Zavadskas, and Turskis, [
60] established the CoCoSo method [
61,
62]. It is based on the integration of two most popular MCDM methods, namely Simple Additive Weighting (SAW) and Exponentially Weighted Product (MEP). The CoCoSo method consists of the following easy steps [
63]:
Step 1. Formation of the original decision matrix.
Step 2. Then, normalize the decision matrix using Equations (10) and (11).
4. Results and Discussion
4.1. Indirect Tensile Strength Analysis
Following the results of individual specimens, the mean values of the properties for all mixtures were calculated (
Table 5).
It is noticeable, for all mixtures, that indirect tensile strength increases over time. The indirect tensile strength of the specimens tested after 28 days is higher than the indirect tensile strength after seven days. The highest value of ITS (dry conditions) is registered in mixture M1. Replacing part of the cement with waste materials reduces the ITS after 7 and 28 days for samples cured in dry conditions. The increase in indirect tensile strength over time is evident in all mixtures except in mixtures with slag where the increase in strength is very small. The water-saturated specimens, after 28 days of curing, have mostly less indirect tensile strength compared to dry specimens. Exceptions are a mixture with 2% of cement and 3% of bitumen emulsion and a mixture with the addition of Bakelite. The specimens tested for frost, after 28 days of curing, have lower strength compared to the strength obtained on dry specimens. The highest value of ITS, for samples exposed to frost and wet samples, was obtained on samples from mixtures M2.
Table 5 shows the results on air voids content. M3 has the most air voids, while M7 had the least air voids.
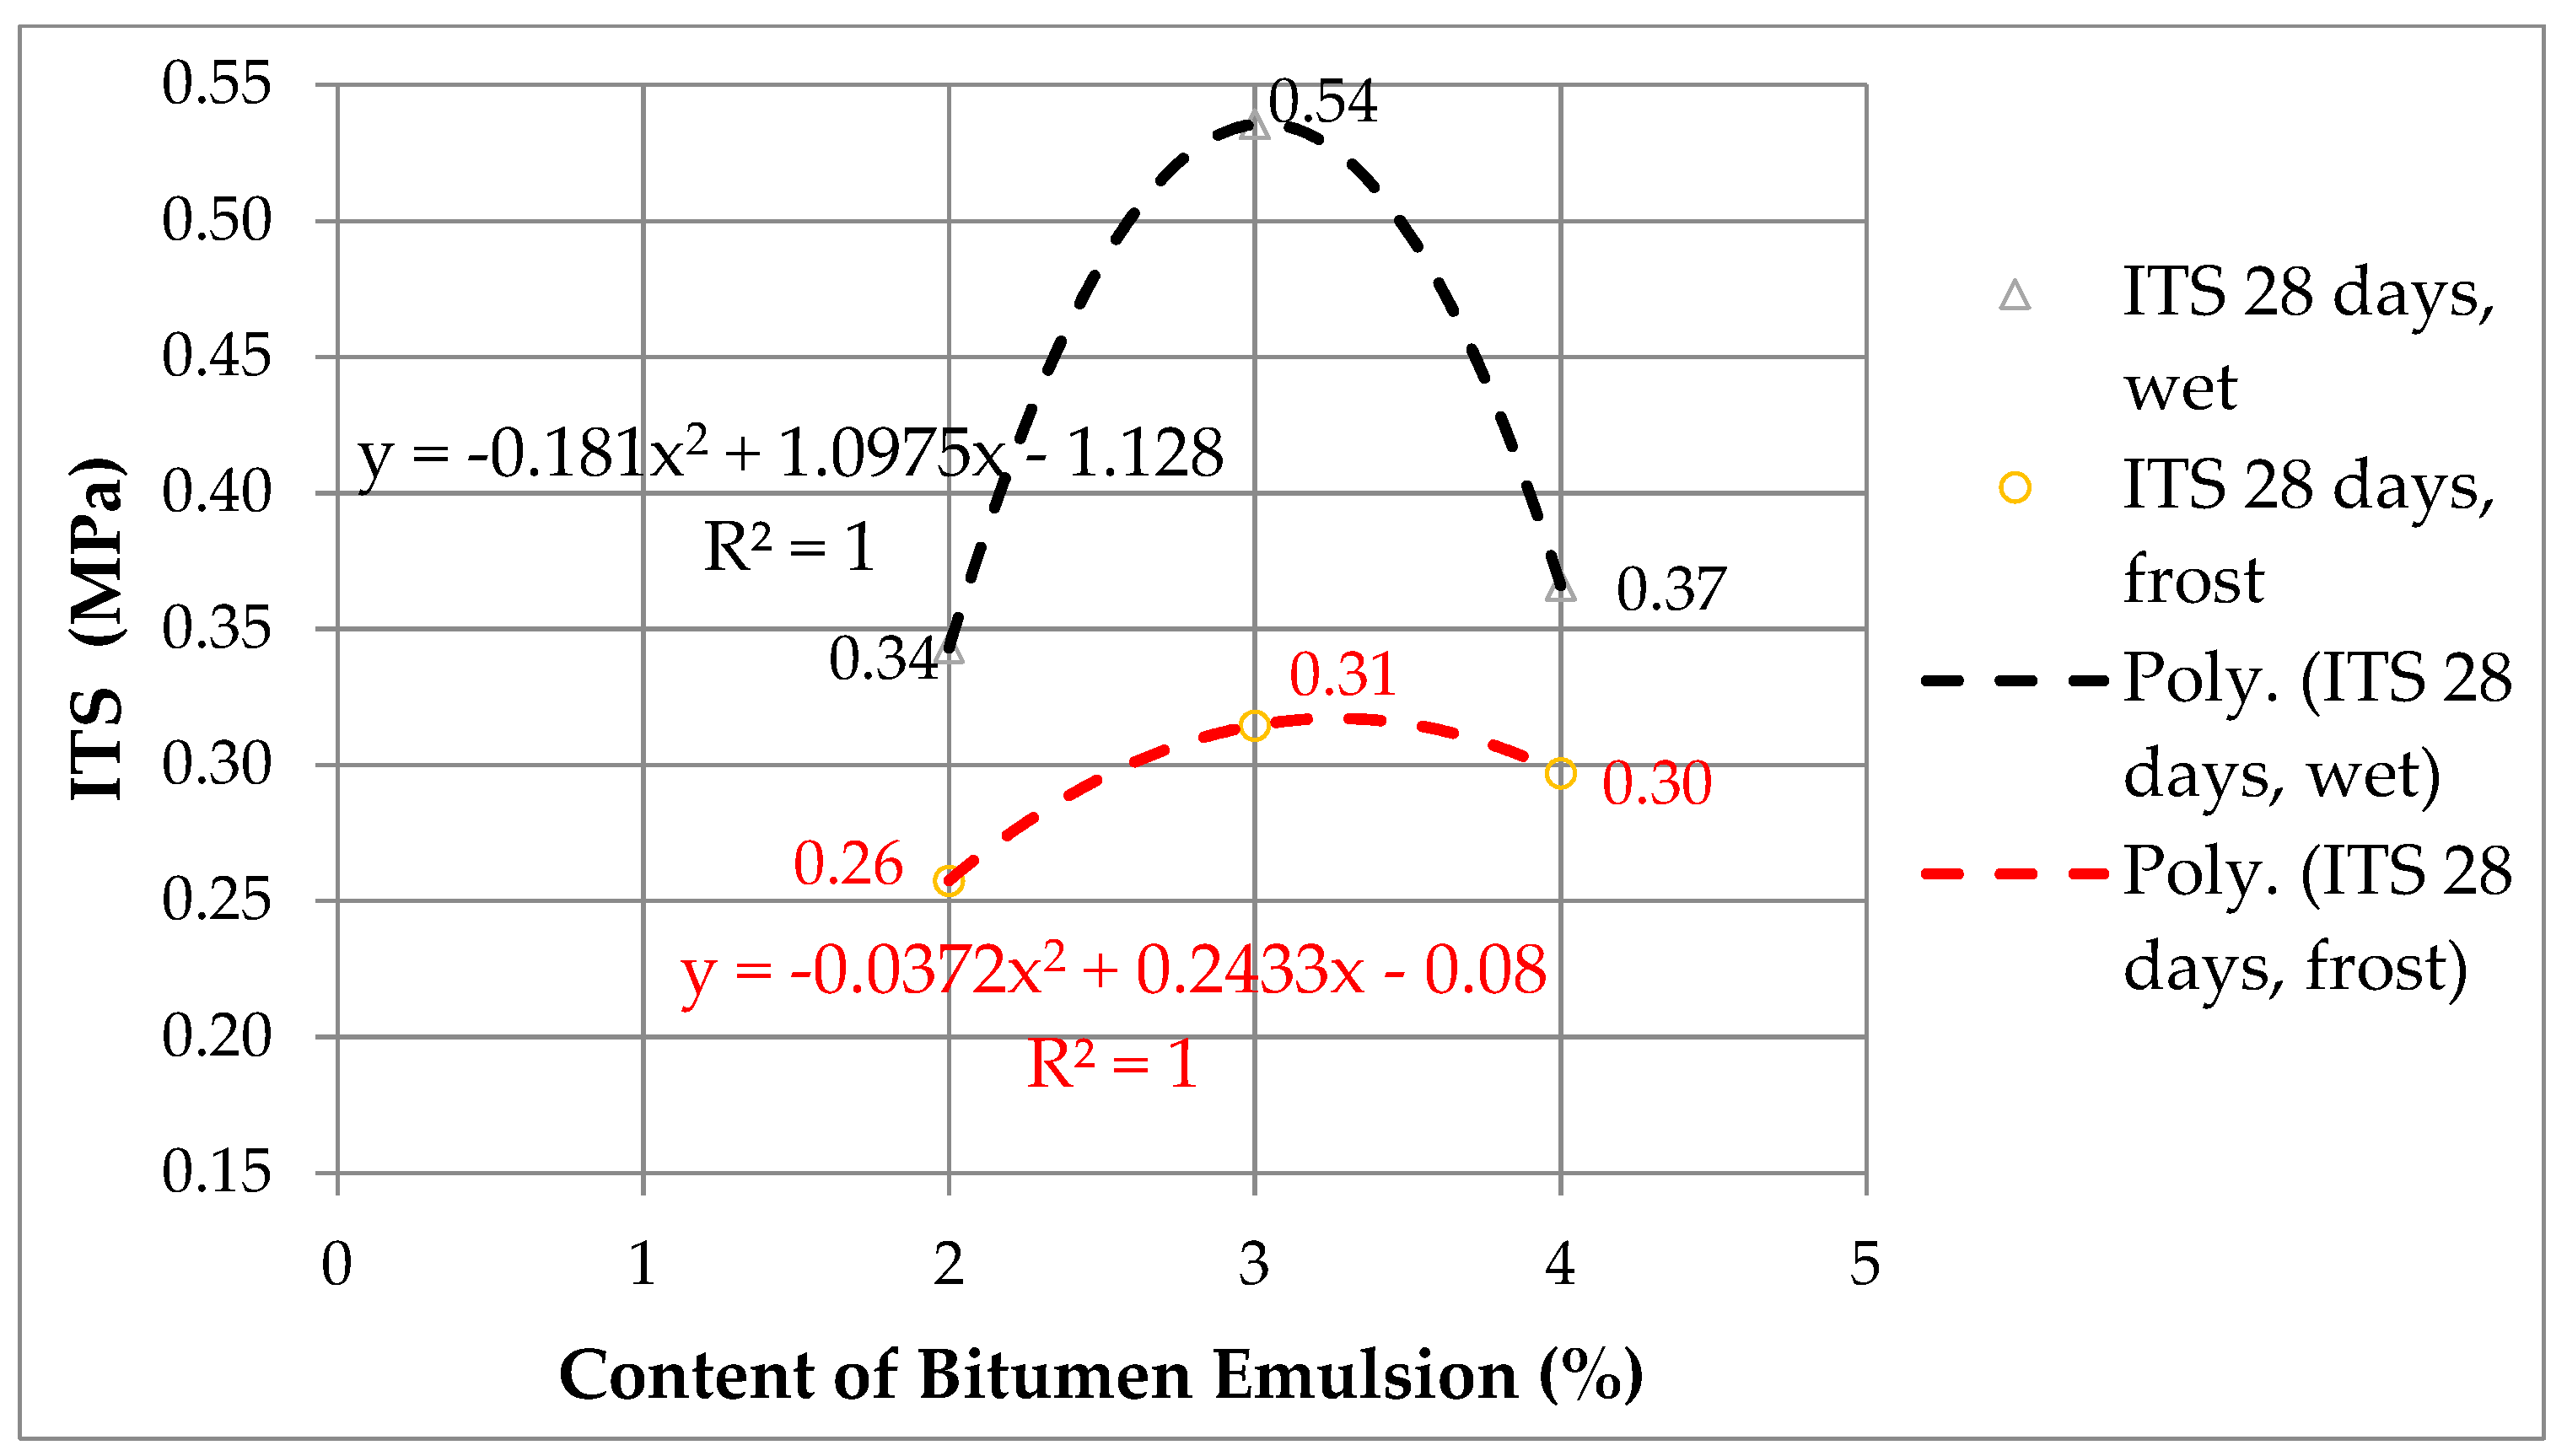
Mixtures M1, M2, and M3 were compared to determine the influence of bitumen emulsion content on mechanical properties. In these mixtures, cement content is constant and the bitumen emulsion content is variable. This is the reason why we can draw a conclusion about the influence of bitumen emulsion on the value of ITS. Mixture M1 is the basic mixture and other mixtures are compared to it. Increasing the content of bitumen emulsion in dry specimens (
Figure 3) leads to a decrease in indirect tensile strength. Similar trends were obtained by the authors [
20] for mixtures with 4% of cement. In water-saturated specimens and those exposed to frost (
Figure 4) there is an increase and then decrease in values of indirect tensile strength. Similar trends are observed with the ITS for all four cases.
4.2. Tensile Strength Ratio Analysis
Tensile strength ratio (
TSR), i.e., the strength ratio of wet and dry specimens is determined on the basis of the following Equation (18):
TSR—Tensile Strength Ratio (%);
avITSWET—average ITS value of wet specimens (MPa);
avITSDRY—average ITS value of dry specimens (MPa).
The tensile strengths after immersion are mostly lower than in dry specimens (
Table 6). Within this research, tensile strengths were made for specimens exposed to frost, which was not a common practice in previous studies. No specific tensile strengths have been defined for cold-recycled mixtures with the addition of cement and bitumen emulsions. Croatian guidelines [
64] require TSR to be higher than 80% for cold recycling with hydraulic binders. The same is stated according to the standard EN 13286-41:2021 [
55].
4.3. Analysis of Dynamic Modulus of Elasticity
The mean values of dynamic modulus of elasticity, for all mixtures, were calculated (
Table 7) and, based on these data, it can be concluded that the dynamic modulus decreases with increasing bitumen emulsion content. Additionally, it is noticed that the dynamic modulus of elasticity of mixtures increases over time, i.e., that it is higher on specimens cured for 28 days compared to specimens cured for seven days (
Figure 5). The dynamic modulus of elasticity for specimens exposed to frost is smaller compared to specimens cured in a dry state (
Figure 6).
The dynamic modulus of elasticity is the greatest for M1 mixtures (dry conditions). For wet samples, mixture M2 has the highest DME value. Mixture M6 has the highest DME for samples exposed to frost.
4.4. Economic Analysis of Mixtures Tested
The following assumptions were adopted for the economic analysis of the mixtures tested:
It is considered the amount of material required to stabilize one kilometer of road by cold in-place recycling.
It is considered the stabilization of existing structure in the thickness of 20 cm by cold recycling.
The width of the road is assumed to be 6.50 m.
Prices of materials and transport of materials per ton are given in
Table 8. These prices we have obtained from companies that sold these materials.
For each mixture analyzed (
Table 9), it was adopted a mean bulk density to obtain the cubic meter weights of the mixture. Per kilometer of stabilized layer (thickness of 20 cm), the most expensive is a mixture with 2% of cement and 4% of bitumen emulsion, while the cheapest is a mixture in which Bakelite is used. The price of binder for mixtures with 2% of cement and 2% of emulsion is very similar to the price of binder mixtures with the addition of slag and fly ash. The cheapest price of binder is for a mixture with Bakelite, and the most expensive, as expected due to the price of bitumen emulsion, is a mixture with 2% of cement and 4% of bitumen emulsion.
4.5. Analysis of Environmental Protection
Analysis of environmental protection is an important task of sustainable construction supply chain, so it is explained in detail in this subsection. The use of waste materials in cold recycling of pavement structures reduces the amount of materials (primarily stone) used in standard recycling procedures. This further affects the reduced need for stone aggregate and reduces the need for exploitation of quarry stone, which leads to a reduction in emissions of harmful gases and dust during stone extraction, but also less disruption of the environment. As it was not possible to collect all the data for all the materials used in the research, the following assumptions were adopted for the analysis of environmental protection:
Only the emission of CO2 for cement and bitumen emulsion was analyzed based on their quantitative difference in mixtures.
CO2 emission values have not been adopted for all waste materials, as these are products generated in other production processes. These materials occupy certain areas where they are disposed.
Waste materials occupy certain areas, so it is possible to state a “positive” effect on environmental protection when using it. Avoiding the disposal and treatment of waste materials also reduces costs.
The quantities of recycled material and fillers are the same for all mixtures and are therefore excluded from the calculation.
No analysis was performed for the transport of materials since it is not possible to determine the capacities of means of transport that are different for all materials.
The values of CO
2 emission of cement and bitumen emulsion are given in
Table 10 according to source [
65] for cement and [
66] for bitumen emulsion.
By analyzing the difference in the amount of cement and bitumen emulsion among mixtures and their impact on gas emissions, it can be concluded that mixtures with fly ash and slag have the lowest total CO
2 emission, while a mixture with 2% of cement and 4% of bitumen emulsion emits the most CO
2. In addition,
Table 11 shows the quantities of additional materials per kilometer of road. The quantities of used materials are over 10 t per km of road, which are large quantities of waste materials.
4.6. Final Analysis of Mixtures Using an MCDM Model
4.6.1. The Application of Integrated MEREC-CoCoSo Model
The final analysis was performed taking into account all three criteria: criterion of mechanical properties (C1), economic criterion (C2), and criterion of environmental protection (C3).
The mixtures have been ranked based on the multi-criteria MEREC-CoCoSo model. All seven mixtures were ranked taking into consideration all three criteria in order to determine the mixture that has the best mechanical properties, while having the least impact on the environment and having the lowest construction costs.
The mixtures were evaluated on the basis of a linguistic scale 1–7 where 1 represents the best characteristic, while 7 represents the worst characteristic. Taking this into account, all three criteria were modeled as cost criteria. The initial decision matrix is shown in
Table 12.
After applying the procedure of MEREC method described in
Appendix B.1, the final criteria weights have been obtained (
Figure 7).
The results obtained after the application of the MEREC method show that the first, criterion of mechanical properties, is of the greatest importance in the evaluation of mixtures.
After calculating the weights of the criteria, the mixtures were ranked using the CoCoSo method. The initial matrix is previously shown in
Table 12, but normalization is performed using Equation (11). The normalized matrix for the CoCoSo method is shown in
Table A3. Estimation of sum of weighted comparability (
Si) sequence and power weighted comparability sequences (
Pi) for each alternative respectively has been performed and showed in
Table A4. By applying Equations (14)–(17), the final results are obtained, and presented in
Table 13.
Based on the final analysis using the MCDM model, it can be concluded that the best mixtures are M6, M5, and M1 under the given conditions of consideration. Considering the ranking of mixtures using the CoCoSo method, the highest quality mixtures, for most combinations of weight factors, are mixtures with slag, mixtures with fly ash, and mixtures with 2% of cement and 2% of bitumen emulsion. These results can help decision-makers to make adequate decisions in different conditions. The usefulness of this model can be manifested through decision-making in real-time on the basis of considering more influence factors.
4.6.2. Sensitivity Analysis
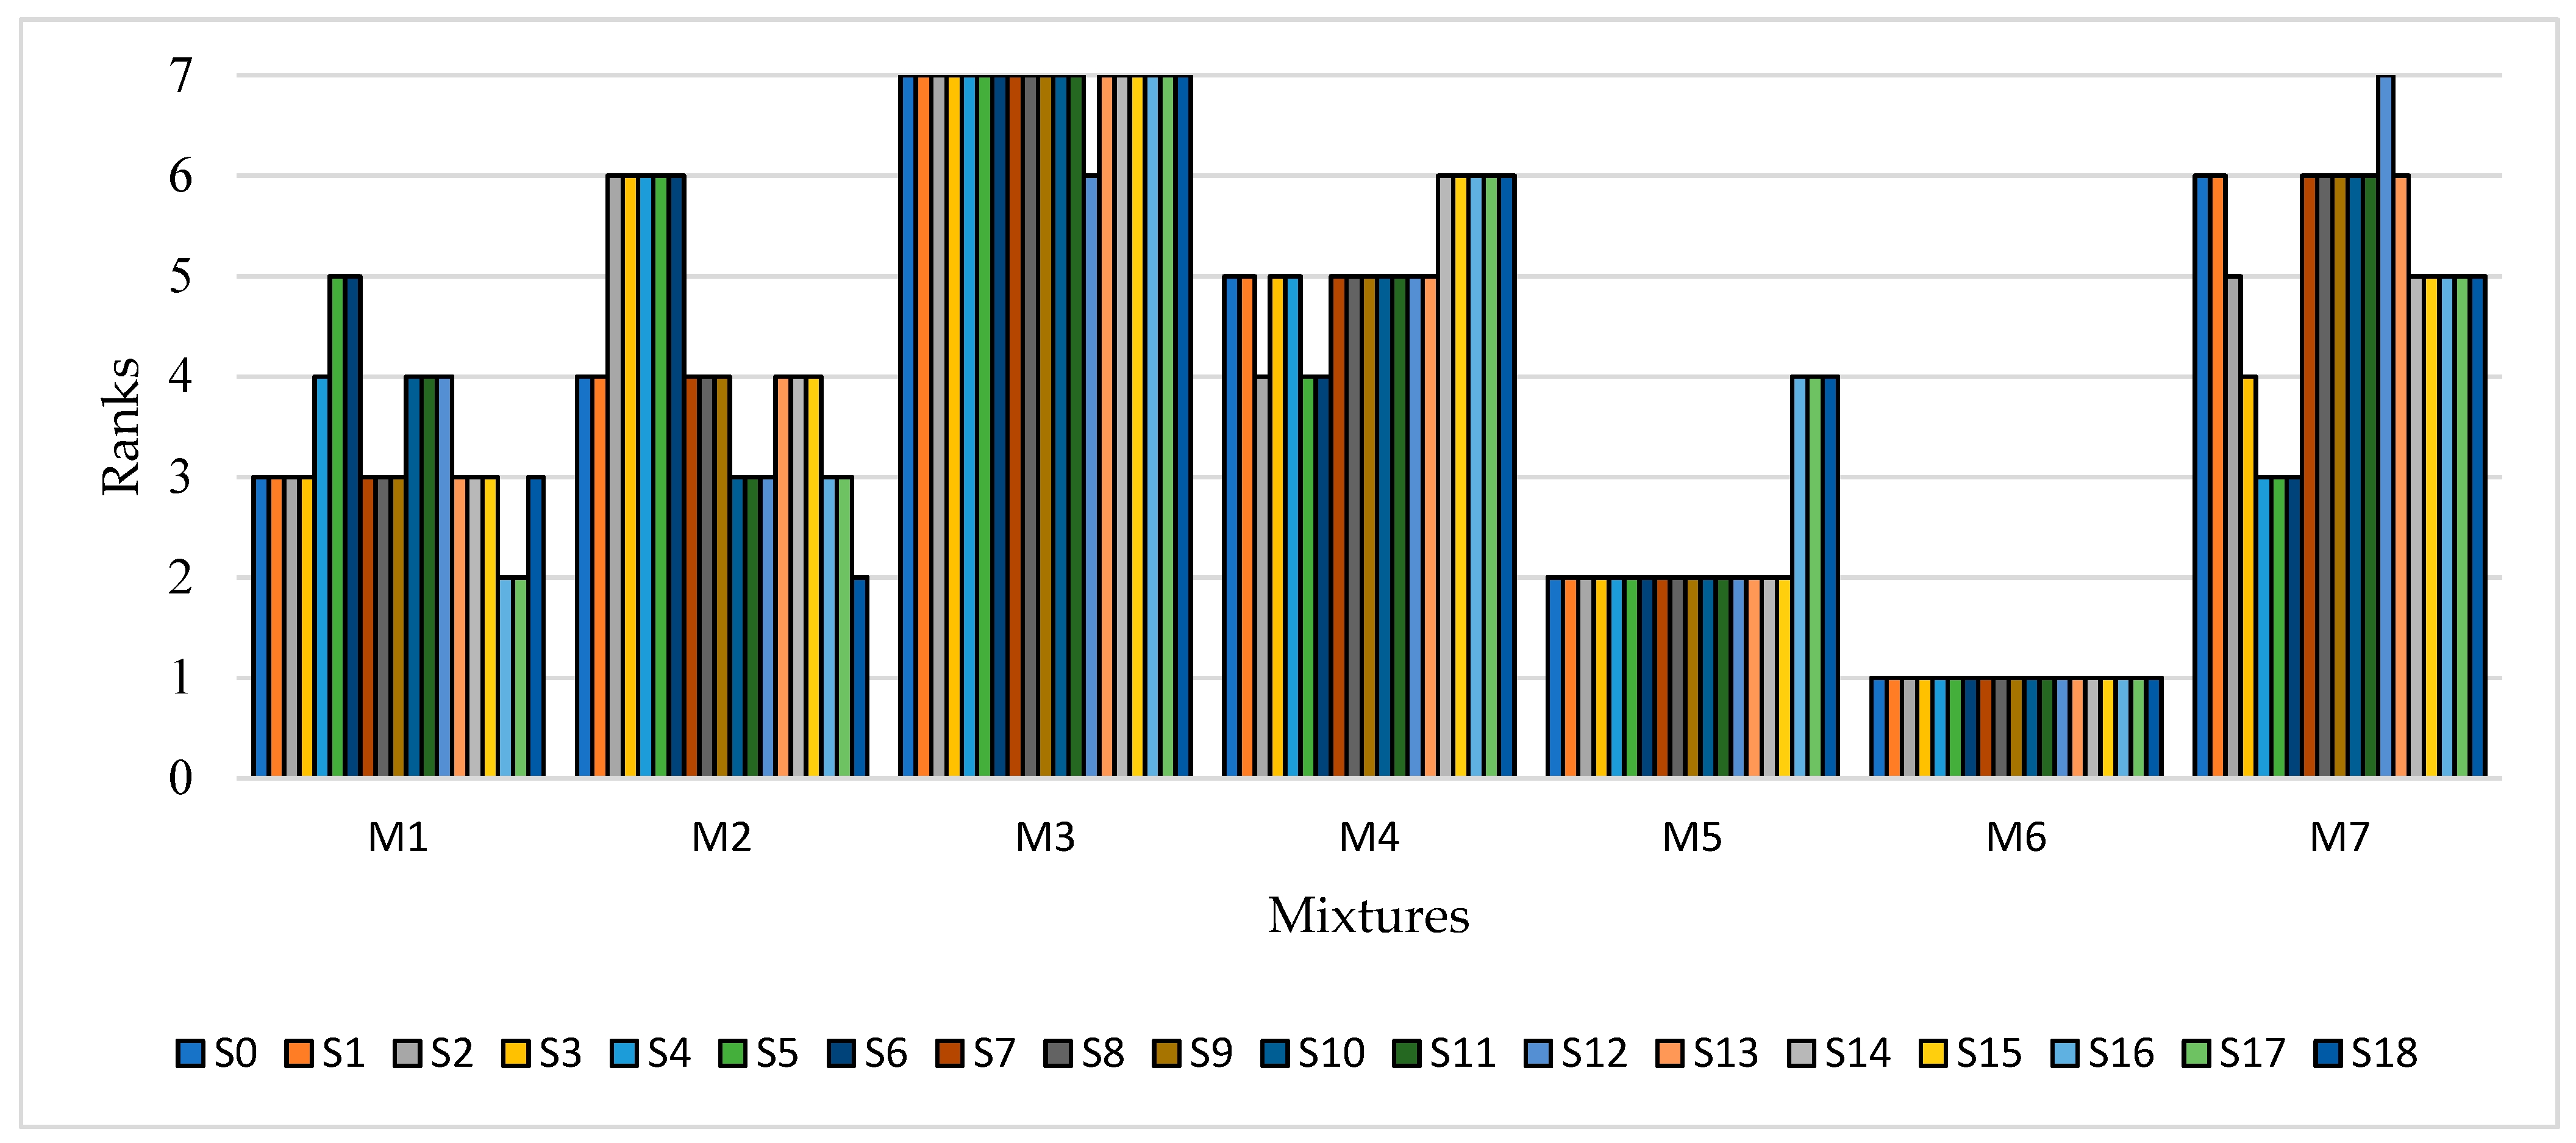
In this section, the weights of the criteria are simulated through 18 new scenarios (S1–S18), (
Table 14) by applying Equation (19). Criteria weights are changed in a range of 15–90%, starting from the most significant criterion C1, followed by criteria C2, and C3. For example, the values of the first criterion are as follow: 0.343, 0.282, 0.222, 0.161, 0.101, and 0.040, respectively, for scenarios S1–S6.
The next step is the implementation of new simulated criterion values in the evaluation and ranking of alternatives using the CoCoSo method.
Figure 8 shows the ranks of all mixtures through the change of criterion weights in 18 scenarios.
Sensitivity analysis shows that the ranking results of mixtures depend on the values of the criteria. Out of a total of 18 scenarios, there are no changes in the ranks of mixtures in only five scenarios (S1, S7–S9, and S13). It is important to note that the best mixture, M6, does not change its position in any scenario, regardless of the value of the criteria. When it comes to the second-best mixture, M5, it does not change its position in the first 15 scenarios, while in the last three scenarios, when the value of the criterion of environmental protection is reduced to a minimum, it takes the third and fourth place, respectively. In the first six scenarios, when the value of the criterion of mechanical properties decreases by as much as 90%, the biggest change is with the M7 mixture, which moves from the sixth through the fifth and fourth position to the third. By reducing the importance of economic and environmental criteria, no significant changes in the ranks of mixtures occur.
Given that there have been changes in the ranks of mixtures in the sensitivity analysis, it is necessary to calculate their correlation. For these purposes, two statistical correlation tests were applied: Spearman [
67] and WS correlation coefficient [
68], which is shown in
Figure 9.
Results showed in
Figure 9 represents the correlation of ranks in various scenarios of sensitivity analysis. Full correlation is between the initial set and the following sets (S1, S7–S9, and S13) in which there are no changes. The least correlation is in set S6 in which the value of the most important criterion has been reduced by 95%. According to the obtained values, the Spearman’s coefficient value of 0.679 represents a good correlation. The obtained WS coefficient shows a larger correlation because of no significant changes in the first places.
5. Conclusions
In this paper, it has been considered cold in-place recycling. In-place recycling has an advantage over other types of recycling because it increases sustainability in the whole construction supply chain: it saves material resources, reduces environmental pollution, reduces the need for disposal of materials and shortens the time of road maintenance works. Until now, the practice has been to use cement, bitumen emulsion, foamed bitumen, and a combination of these materials when recycling existing roads. In the research, recycled asphalt and stone, fly ash, slag, and Bakelite were used as waste materials, while zeolite was used as other materials. The research included seven types of mixtures with different contents of cement, bitumen emulsion, zeolite, fly ash, slag, and Bakelite. The three base mixtures were with 2% of cement and with 2%, 3%, and 4% of bitumen emulsion, respectively. In the next three mixtures, 20% of the cement content was replaced with zeolite, fly ash, and slag. In the seventh mixture, 20% of the bitumen emulsion was replaced with Bakelite. The experimental part of the research can be divided into two parts. The first part involved determining the sustainable and optimum fluid content for each of the different types of mixtures, while in the second, main part of the research, the mechanical properties of the mixtures were determined.
The indirect tensile strength was tested after 7 and 28 days for specimens cured in dry conditions, the indirect tensile strength after 28 days for water-saturated specimens, and the indirect tensile strength after 28 days for specimens exposed to freezing and thawing cycles. An important note is that mechanical properties were analyzed in relation to permissible values.
Considering all three criteria together, with different factors of importance of the criteria obtained using the MEREC method, and the ranking of mixtures using the CoCoSo method, the highest quality mixtures, for most combinations of weight factors, are mixtures M6, M5, and M1.
The conclusions related to the hypothesis are as follows: the use of bitumen emulsion, cement, waste materials (slag, fly ash, and Bakelite), and other materials (zeolite) in cold recycling would reduce the cost of recycling pavement structures, increase environmental protection, while the mechanical properties of the pavement structures are within acceptable limits. The comparison has been made in relation to standard mixtures in which only cement and bitumen emulsion are used. The use of zeolite, as a substitute for 20% of cement, with bitumen emulsion in cold in-place recycling would not reduce the cost of recycling pavement structures, would not increase environmental protection, and mechanical properties are not within acceptable limits. The comparison has been made in relation to standard mixtures in which only cement and bitumen emulsion are used. The use of Bakelite, as a replacement for 20% of bitumen emulsion, with cement in cold in-place recycling would reduce the cost of recycling pavement structures, would not increase environmental protection, and mechanical properties are not within acceptable limits. The comparison has been made in relation to standard mixtures in which only cement and bitumen emulsion are used.
As, during the research, the percentages of replacement of individual materials have been equal (20%) in order to be comparable, further research will strive for the following:
Change Bakelite in an amount of less than 20% in relation to the amount of bitumen emulsion and vary the content of Bakelite to determine the optimum amount of Bakelite;
Change slag in different quantities to determine the optimum slag content;
Change zeolite in different quantities (less than 20% in relation to the amount of cement);
Reduce the amount of cement below 1%;
Reduce the amount of bitumen emulsion to 1% and increase the amount of other materials;
Use 100% of recycled material to increase the amount of utilization of existing materials and save raw materials in construction supply chain;
Curing the specimens by faster procedure, i.e., at higher temperatures to shorten research time and time to obtain results.


 ,
, 


