1. Introduction
Drastic changes in all aspects of society are required to keep global warming within the 1.5 degrees target and avoid the most dangerous effects of global warming [
1]. The greenhouse gas (GHG) emissions related to the fossil energy use in the building and transport sectors account for considerable shares in the quantity of global GHG emissions, with a share of 28%, and 23%, respectively. An additional 10% can be reallocated from the other industry sectors to the buildings’ sector to account for building construction materials such as steel, cement, and glass [
2]. Thus, addressing the nexus of buildings, mobility, and energy supply by assessing life-cycle emissions at the neighborhood scale is a tremendous step towards drawing holistic and powerful climate mitigation strategies.
The neighborhood scale is crucial to enable the transition towards a decarbonized society. Neighborhoods can be assessed with a focus on different elements, such as buildings or infrastructure components, as well as their interplay and overall function, such as how they are a part of the larger energy supply system. Neighborhoods must clearly also be understood from beyond a technological perspective, including the cultural, political, and business perspectives, with regards to user preferences, policy alignment, innovation opportunities, and new business models.
How science-based knowledge on GHG emissions can be integrated more effectively at local levels, such as developing neighborhoods by use of practice-based design and planning instruments and tools, is a key challenge. Life Cycle Assessment (LCA) is a method that is today commonly used to provide objective and science-based information on the environmental impacts of a specified system, with a specified function or set of functions, and is well-suited for this task.
The Norwegian Research Center on Zero Emission Neighborhoods (ZEN) in smart cities (FME ZEN) [
3] addresses exactly these aspects by offering knowledge for designing, building, transforming, and managing sustainable neighborhoods towards net-zero GHG emissions. Solutions are also tested through living labs and pilot projects in the research center, documenting these through Key Performance Indicators (KPIs), see also
Table 1 [
4].
One of the KPIs assesses the climate mitigation performance of the pilot projects by means of the potential for life cycle GHG emission reductions, measured in kgCO2-eq. A key requirement for this GHG emissions’ KPI is the development of a common LCA methodology, that in turn depends on the development of a common structure for life cycle inventory (LCI) data and a common database that can be used in multiple analytical tools for the planning and design of ZEN projects, hereafter called the “ZEN toolbox”.
The purpose of a LCA database of this kind is to serve the LCA needs of multiple stakeholders who require LCA-based information. A LCA database does not operate on its own. It must be seen in its context in terms of the other tools that will feed it and the overall data architecture [
5]. It is therefore necessary to develop a user-centric database that can generate data for other tools in the ZEN toolbox [
6]. This type of structure can, in turn, be used to calculate the KPI for GHG emissions for the ZEN pilot projects at all project phases [
4].
The specific purpose of this paper is to analyze the needs and requirements and provide a foundation for the development of a user-oriented LCA database at neighborhood level that includes the following sub-elements: buildings, mobility, infrastructure, and energy. Two essential criteria for the database are that it should be: (a) able to provide users with an interface to find and access life cycle data (LCI datasets) delivered—where possible—in the users’ preferred format, and (b) structured according to the other tools that will feed it and vice versa as part of a larger ZEN toolbox. Important to note is that, whereas this LCA database currently under development is developed for a Norwegian context, the principles and structure are not intrinsic to Norway but are exportable to other contexts addressing the planning and design of neighborhoods with high environmental ambitions in a life cycle perspective.
An outline of this study is given in this paragraph. The FME ZEN definition of Zero Emission Neighborhoods is given in
Section 2. The needs and requirements of the database are discussed in
Section 3,
Section 4 and
Section 5, from a user perspective (
Section 3), data structure and standardization (
Section 4), and data management and documentation (
Section 5).
Section 6 addresses methodological aspects in the LCA that need to be further developed to meet the needs and requirements presented in
Section 3,
Section 4 and
Section 5. These gaps include parametrization, scenario development, temporal aspects, and regionalization.
Section 7 concludes with recommendations for meeting the user needs in the short- and long-term perspective.
2. Zero Emission Neighborhoods
2.1. Definition
In the last few years, the focus has shifted from the building scale to larger urban scales, and assessing the environmental impact at the neighborhood/district/block scale is a vital step towards sustainable cities [
7].
In the FME ZEN Center, a ZEN is defined as [
8]:
“A group of interconnected buildings with distributed energy resources such as solar energy systems, electric vehicles, charging stations and heating systems, located within a confined geographical area and with a well-defined physical boundary to the electric and thermal grids. The neighborhood is not seen as a self-contained entity but is connected to the surrounding mobility and energy infrastructure and will be optimized in relation to larger city and community structures”.
A ZEN should:
Plan, design and operate buildings and associated infrastructure components towards net-zero life cycle GHG emissions;
Become highly energy efficient and powered by a high share of new renewable energy in the neighborhood energy supply system;
Manage energy flows (within and between buildings) and exchanges with the surrounding energy system in a smart and flexible way);
Promote sustainable transport patterns and smart mobility systems;
Plan, design, and operate with respect to economic sustainability, by minimizing total life cycle costs;
Plan and locate amenities in the neighborhood to provide good spatial qualities and stimulate sustainable behavior.
Important to note is that whilst the ZEN definition is intrinsically scalable, it should always be adapted to its local spatial, economic, technical, environmental, governance, and social contexts.
2.2. Key Performance Indicators
The aspects included in the ZEN definition are reflected throughout the different project phases (strategic planning phases, implementation phases, and operational phases) in a set of seven KPIs; GHG emissions, Energy, Power/load, Mobility, Economy, Spatial qualities, and Innovation. The KPIs are described in
Table 1, according to Wiik, Fjellheim et al. [
4].
The system boundaries may vary according to the scope and data resolution required to understand the assessment criteria and the KPI being assessed.
2.3. Pilot Projects
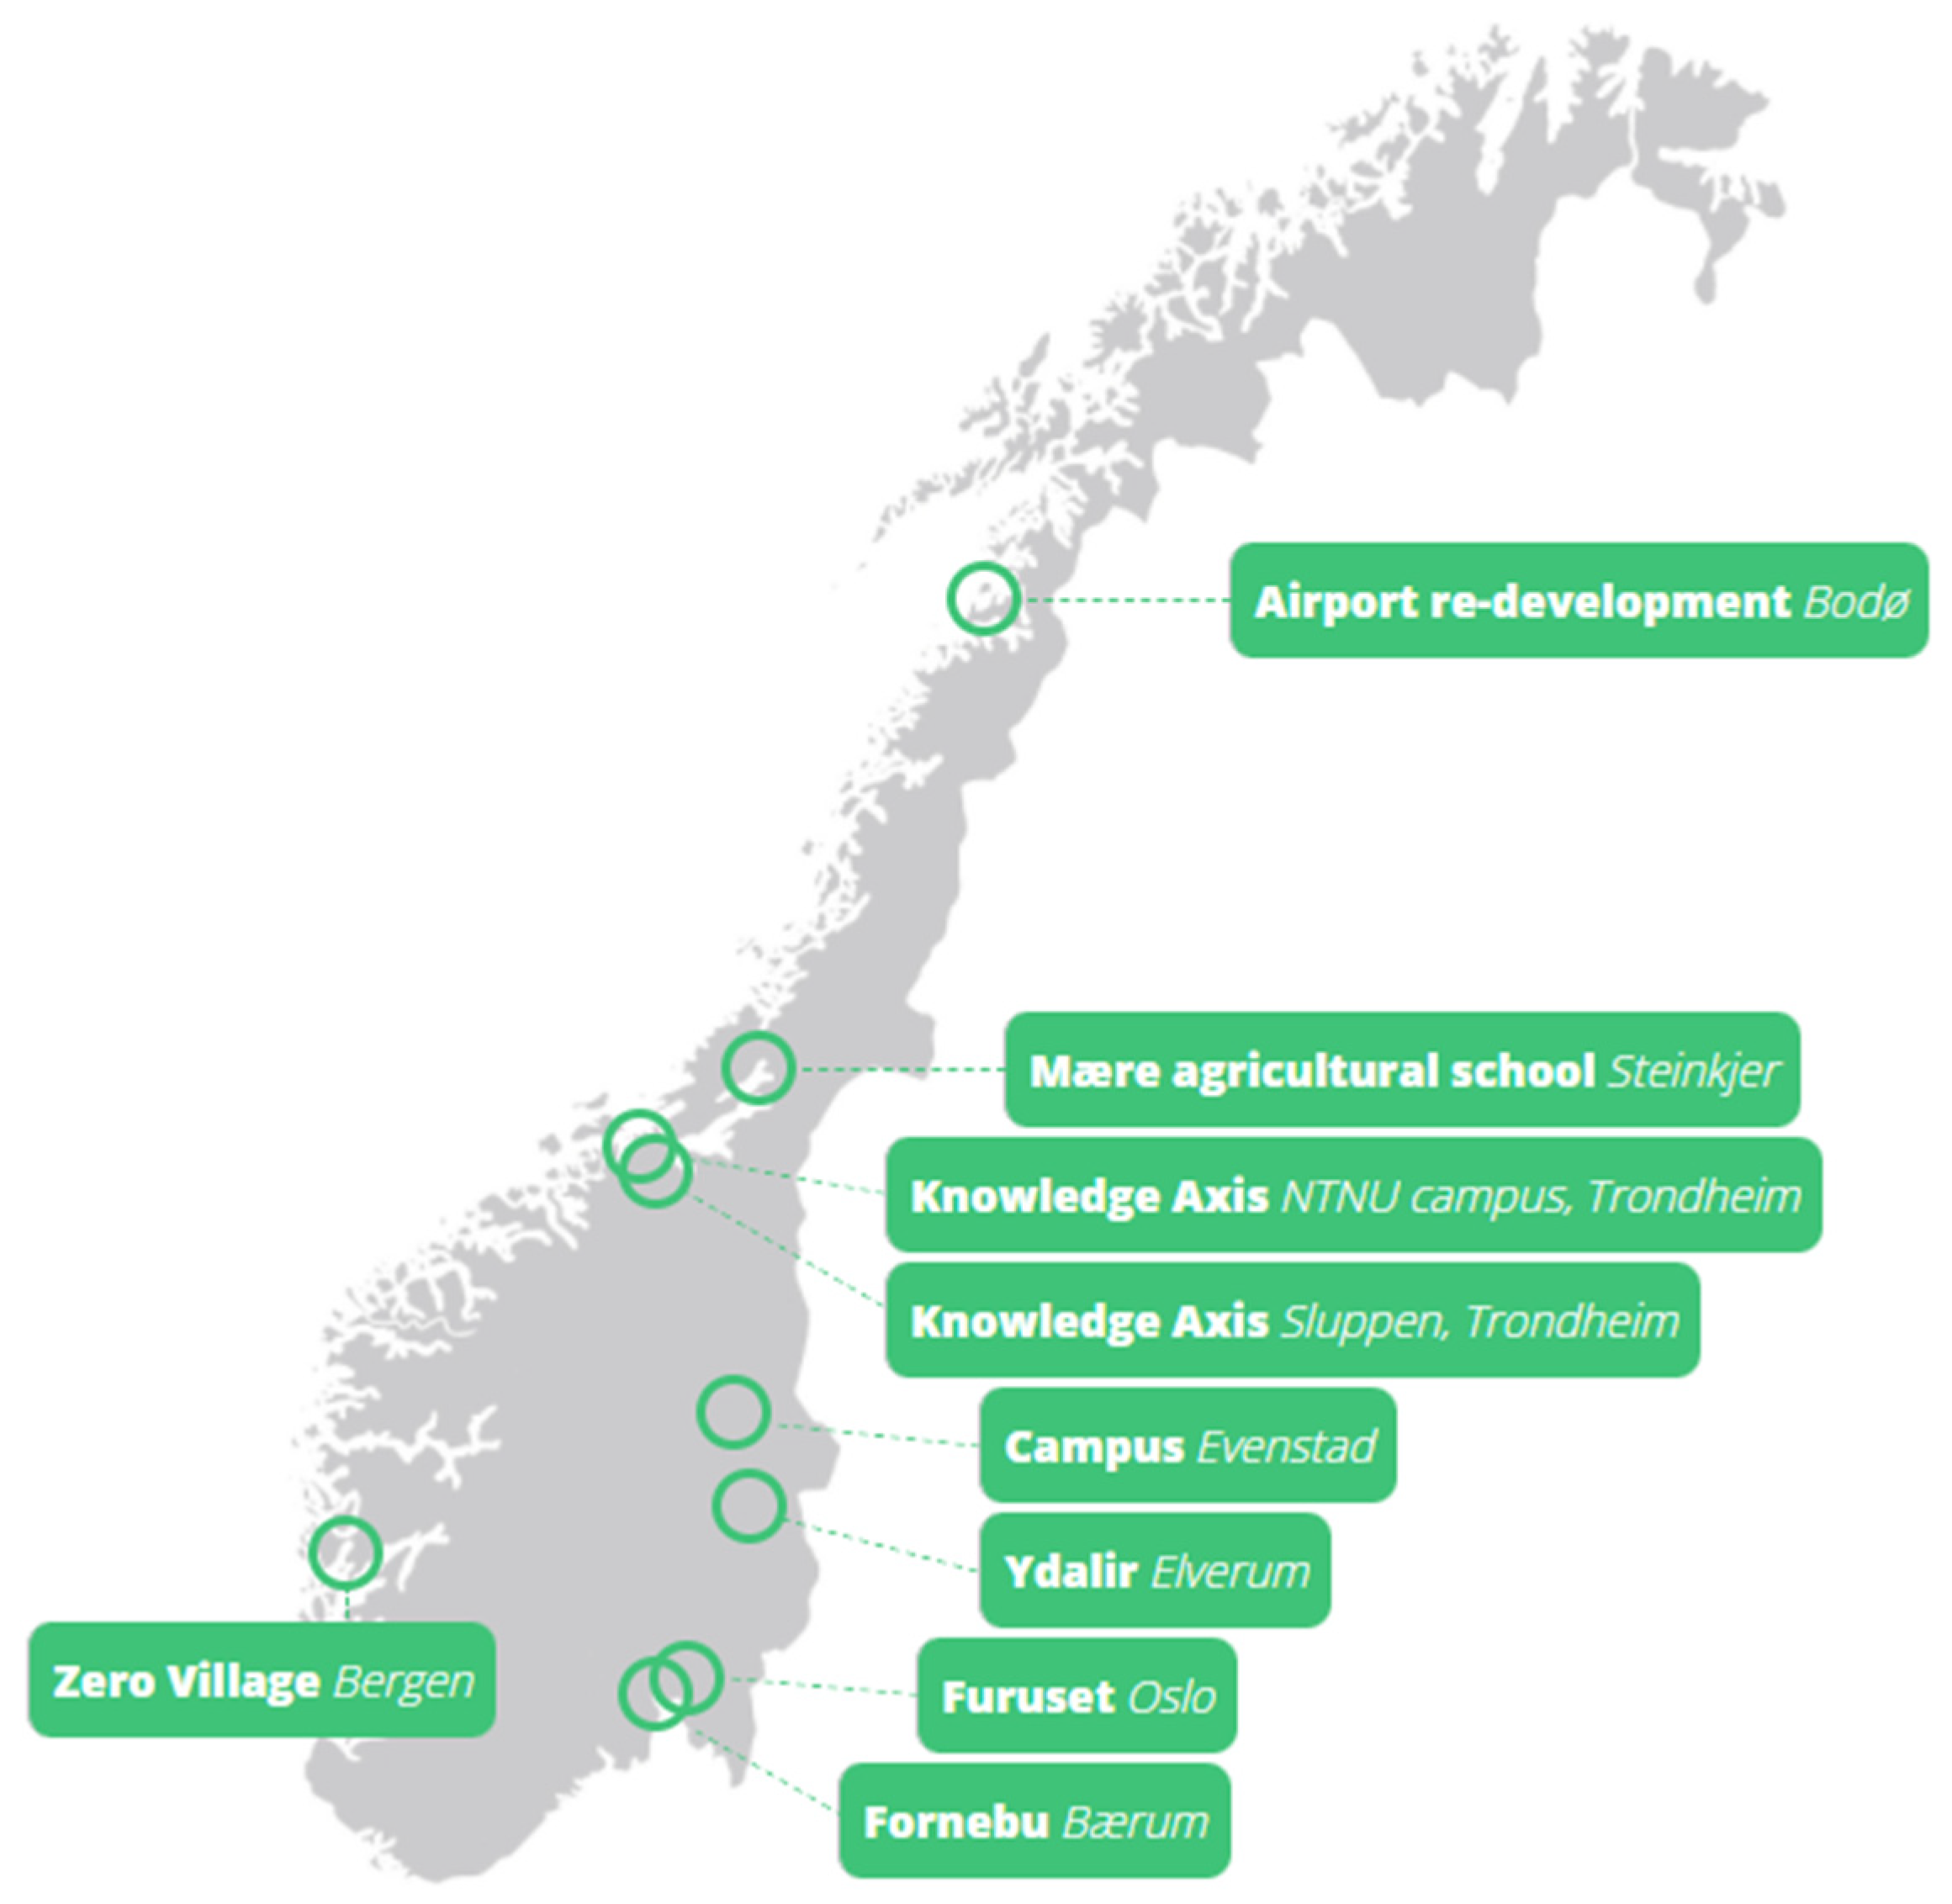
The purpose of the LCA database is to enable the calculation of the carbon footprint of the pilot projects. These are real life pilot projects located in Norwegian municipalities, as shown on
Figure 1, providing an opportunity to test solutions developed in real life [
9]. The pilot projects, or “innovation hubs”, are varied in type and size, ranging from large urban re-developments to smaller rural communities. In total, the pilot projects encompass more than 1 million m
2 of building mass and will have more than 30,000 inhabitants.
3. LCA Database for the Planning and Design of Neighborhoods
3.1. User-Centric
For a database to deploy its full potential, it shall be developed with its users in mind. According to Freeman [
10], a stakeholder can be defined as “any group or individual that can affect or be affected by the realization of an organization’s purpose”.
For the context of the FME ZEN Research Center, stakeholders have been mapped by Baer [
6] with three main categories:, those who can affect the project, are affected by the project, and are interested in the project. For the LCA database, the primary stakeholders will be the users that need LCA-based information. These may be in any of the three categories of stakeholders, and the LCA needs can be either in form of primary inventory data or overall performance results. However, the users of a LCA database are not limited to LCA practitioners. They can be found in a broad range of disciplines such as architects, engineers, environmental consultants, contractors, property developers, manufacturers, building products/components, urban planners, municipalities, and politicians. Interesting to note is that an indirect approach to mapping stakeholders’ needs and requirements is to identify tools that can be used and linked to the LCA database. Most probably, a vast majority of the users will only have indirect needs for the LCA data in terms of LCA-based results.
3.2. Overall Data Management and Architecture
A key aspect of the LCA database is how science-based knowledge on GHG emissions can be integrated more effectively into practice-based neighborhood design and planning instruments and tools that are being developed as part of the ZEN toolbox.
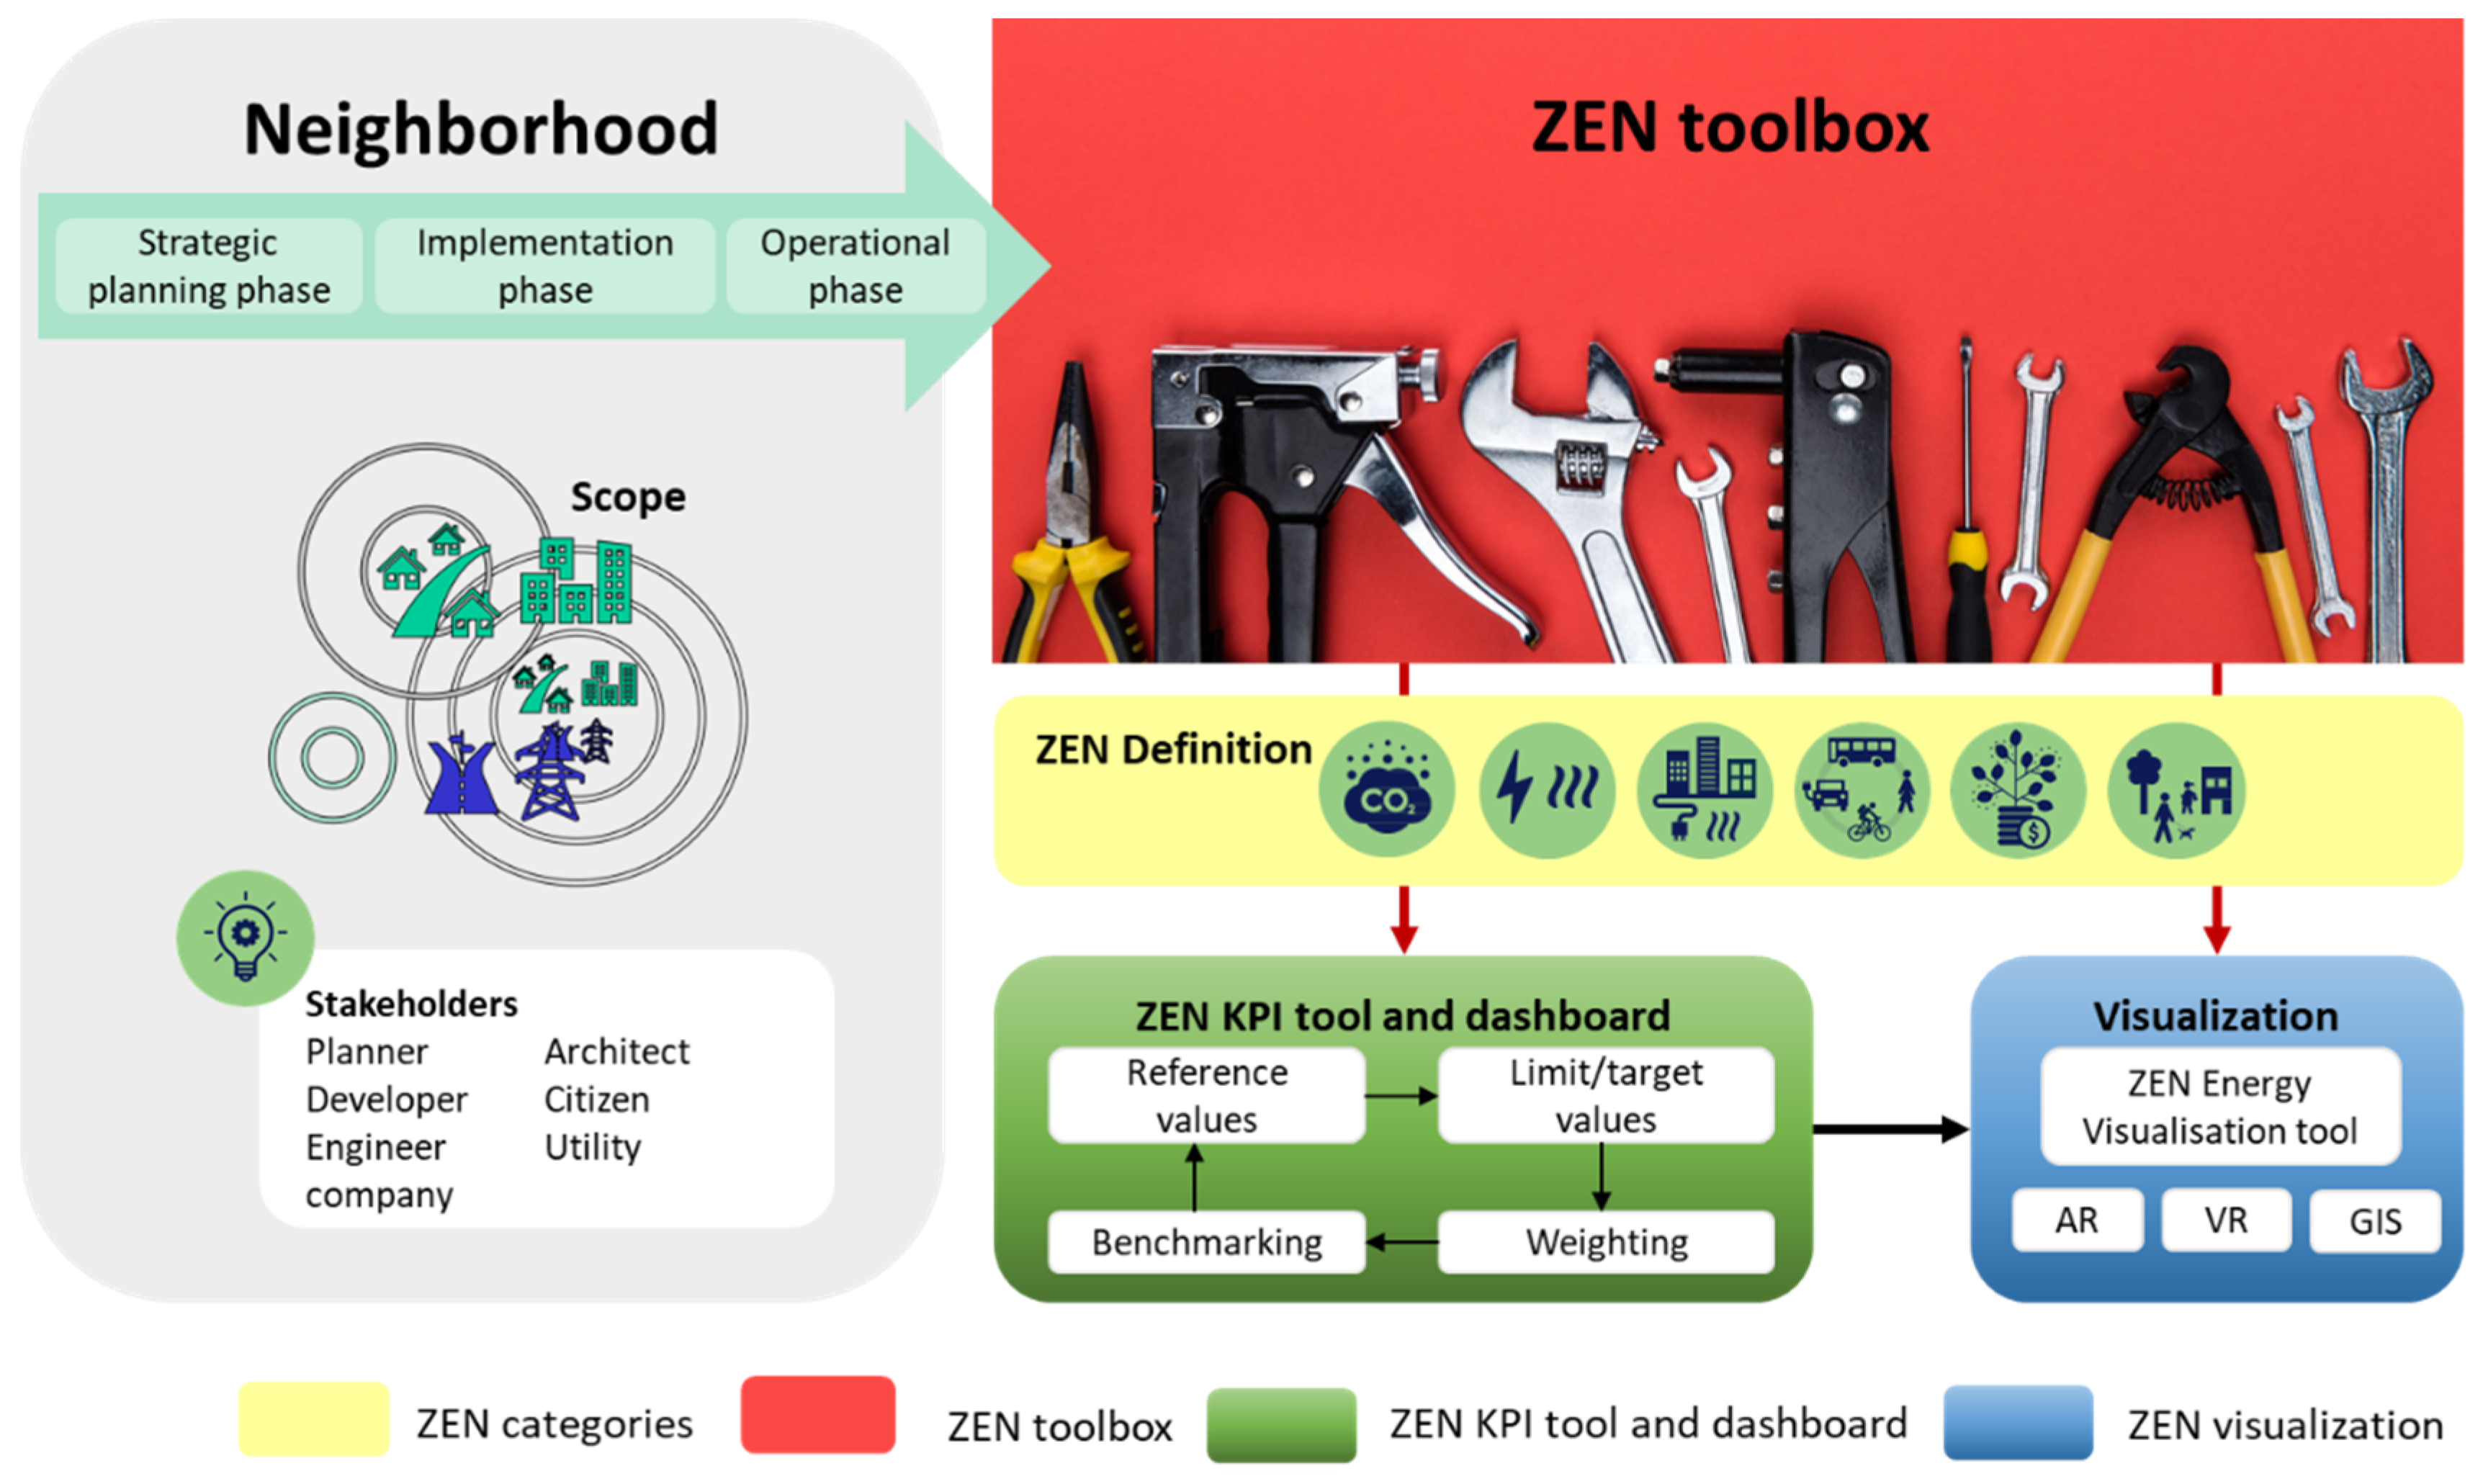
An overview of the ZEN toolbox and its use for planning and design purposes is displayed in
Figure 2. The ZEN toolbox (red box) consists of the tools needed to assess a given ZEN pilot project at different project phases (grey box) according to the ZEN definition and the KPIs (yellow box), described in
Table 1, to assess and benchmark (green box) their performance in relation to KPI reference and limit/target values, before visualizing this performance (blue box) such as with help of augmented reality (AR), virtual reality (VR), and geographic information system (GIS) visualization tools.
The minimum requirements for the LCA database—as part of the ZEN toolbox—are to provide data for the tools that are used for calculating the GHG emission KPIs in accordance with agreed-upon standards such as EN15804 [
11] and NS3720 [
12]. The most basic direct LCA need will be a database with GHG factors for the materials and energy that enter and leave the pilot projects system boundary. A more advanced need will be a database that can be used to assess the variability, sensitivity, and uncertainty of the results, including methodological choices. An advanced database must support parameter analysis, scenario analysis, and sensitivity analysis.
Ahlers and Krogstie [
5] have outlined a high-level architecture for ZEN data management where the LCA database would be part of the external and/or internal data. A key challenge is that the solutions developed should be future proof, which means that they should be viable for the full eight years of the ZEN center and beyond. This could require that a business model is developed for the LCA database during the operation of the FME ZEN Center.
Such a business model should be based on the following quality aspects [
5]: data sources, pathway from core/raw data sources to the platform, quality and context of data, data model, ownership of data, openness of data, terms and conditions of data usage, limitations on availability (security and privacy issues), versioning information, and mapping of which other tools in the ZEN toolbox utilize what data, to what purpose and fitness for use. Developing the LCA database requirements must be coordinated between LCA experts and ICT experts, with input from other involved stakeholders.
3.3. Existing Tools and Database Structures
Existing LCA software are many: SimaPro, GaBi, openLCA, Umberto, Brightway2, to name a few. These are developed to address LCA questions in general, thus requiring a high level of LCA knowledge as well as software training. In addition to the general LCA tools, several tools for specific applications exist as well. These have typically been developed to provide advantages such as simplified data entry, reduced time use, conformance to specific standards, and tailormade inventory.
Examples of such tools that are tailored for building level assessments are One Click LCA [
13], LCAbyg [
14], and Byggsektorens Miljöberäkningsverktyg [
15]. One Click LCA, developed in Finland, is commonly used in Norway in BREEAM-NOR projects and in Statsbygg projects. Statsbygg is the Norwegian government’s building commissioner, property manager, and developer. OneClickLCA is compatible with the Norwegian standard NS3720:2018 “Method for greenhouse gas calculations for buildings” [
12]. LCAbyg is a Danish LCA tool for buildings developed by the BUILD institute at Aalborg university and the Danish Agency for Housing and Planning (BPST). Byggsektorens Miljöberäkningsverktyg is a Swedish LCA tool for buildings that has been developed by the Swedish Environmental Research Institute (IVL). The “ZEB tool” was developed by SINTEF and NTNU in Norway through the Research Center on Zero Emission Buildings (ZEB Center) [
16]. The purpose of these tools is to calculate and analyze the carbon footprint of buildings from a life cycle perspective. Common for all is a database with environmental profiles for materials and processes, often from Environmental Product Declarations (EPD) or with data based on LCA databases, such as ecoinvent [
17] or GaBi [
18].
3.4. Current Approaches
A number of LCA and GHG studies have been performed within FME ZEN, in particular in connection with pilot projects. Lausselet, Borgnes et al. [
19] and Lausselet, Ellingsen et al. [
20] propose, based on the ZEN definition, a modular LCA model, based on the following subsystems: (1) buildings, (2) mobility, (3) infrastructure, and (4) energy systems. The ambition level undertaken in their studies is “ZEB-OM” [
21]. “O” refers to all operational energy, equipment, and appliances (module B6), and “M” to the embodied emissions from the materials’ production (modules A1–A3) and replacement (modules B1-B4), in accordance with NS 3720:2018 [
12]. NS3720 is the Norwegian equivalent of the European standard EN15804+A2 [
11], but with an additional module B8 that accounts for mobility-related emissions during operations over 60 years of neighborhood service life.
Thus, the total life-cycle GHG emissions of the neighborhood is the sum of the GHG emissions stemming from the building materials E
B,M, building operation E
B,O, PV production E
PV, mobility materials E
M,M, mobility operation E
M,O, infrastructure materials E
I,M, and infrastructure operation E
I,O, as shown in Equation (1):
A sensitivity analysis was performed by varying the functional unit, scenarios for the development of the neighborhood, and scenarios for the development of the background electricity system.
Resch, Lausselet et al. [
22] have developed a database tool for the buildings in ZEN with strong illustrating features. The results can be displayed per building element (outer walls, outer roof, and the photovoltaic system), per material category, per emissions factors, and lifetime factors.
In those studies, it is possible to have several levels of dynamic modeling, e.g., material use, and production technology. A dynamic material use allows the modeling of the inputs over time, induced by a need for replacements at the end of the service life of materials or components. A dynamic production technology enables the modeling of the evolution of the production technology over time. The LCA database should be able to support these two, dynamic modeling approaches.
Another tool called “Område LCA” (Område = neighborhood in Norwegian) has been developed by a consultancy company with high knowledge of LCA and further described in Yttersian, Fuglseth et al. [
23].
This shows that there is a multitude of LCA tools used in the assessment of ZEN projects, and an increased awareness about assessments at an interconnected area-level. It is unlikely that one single tool will be able to meet the needs of all users. A LCA database must therefore be able to serve multiple tools with relevant data.
4. LCA Database Structure
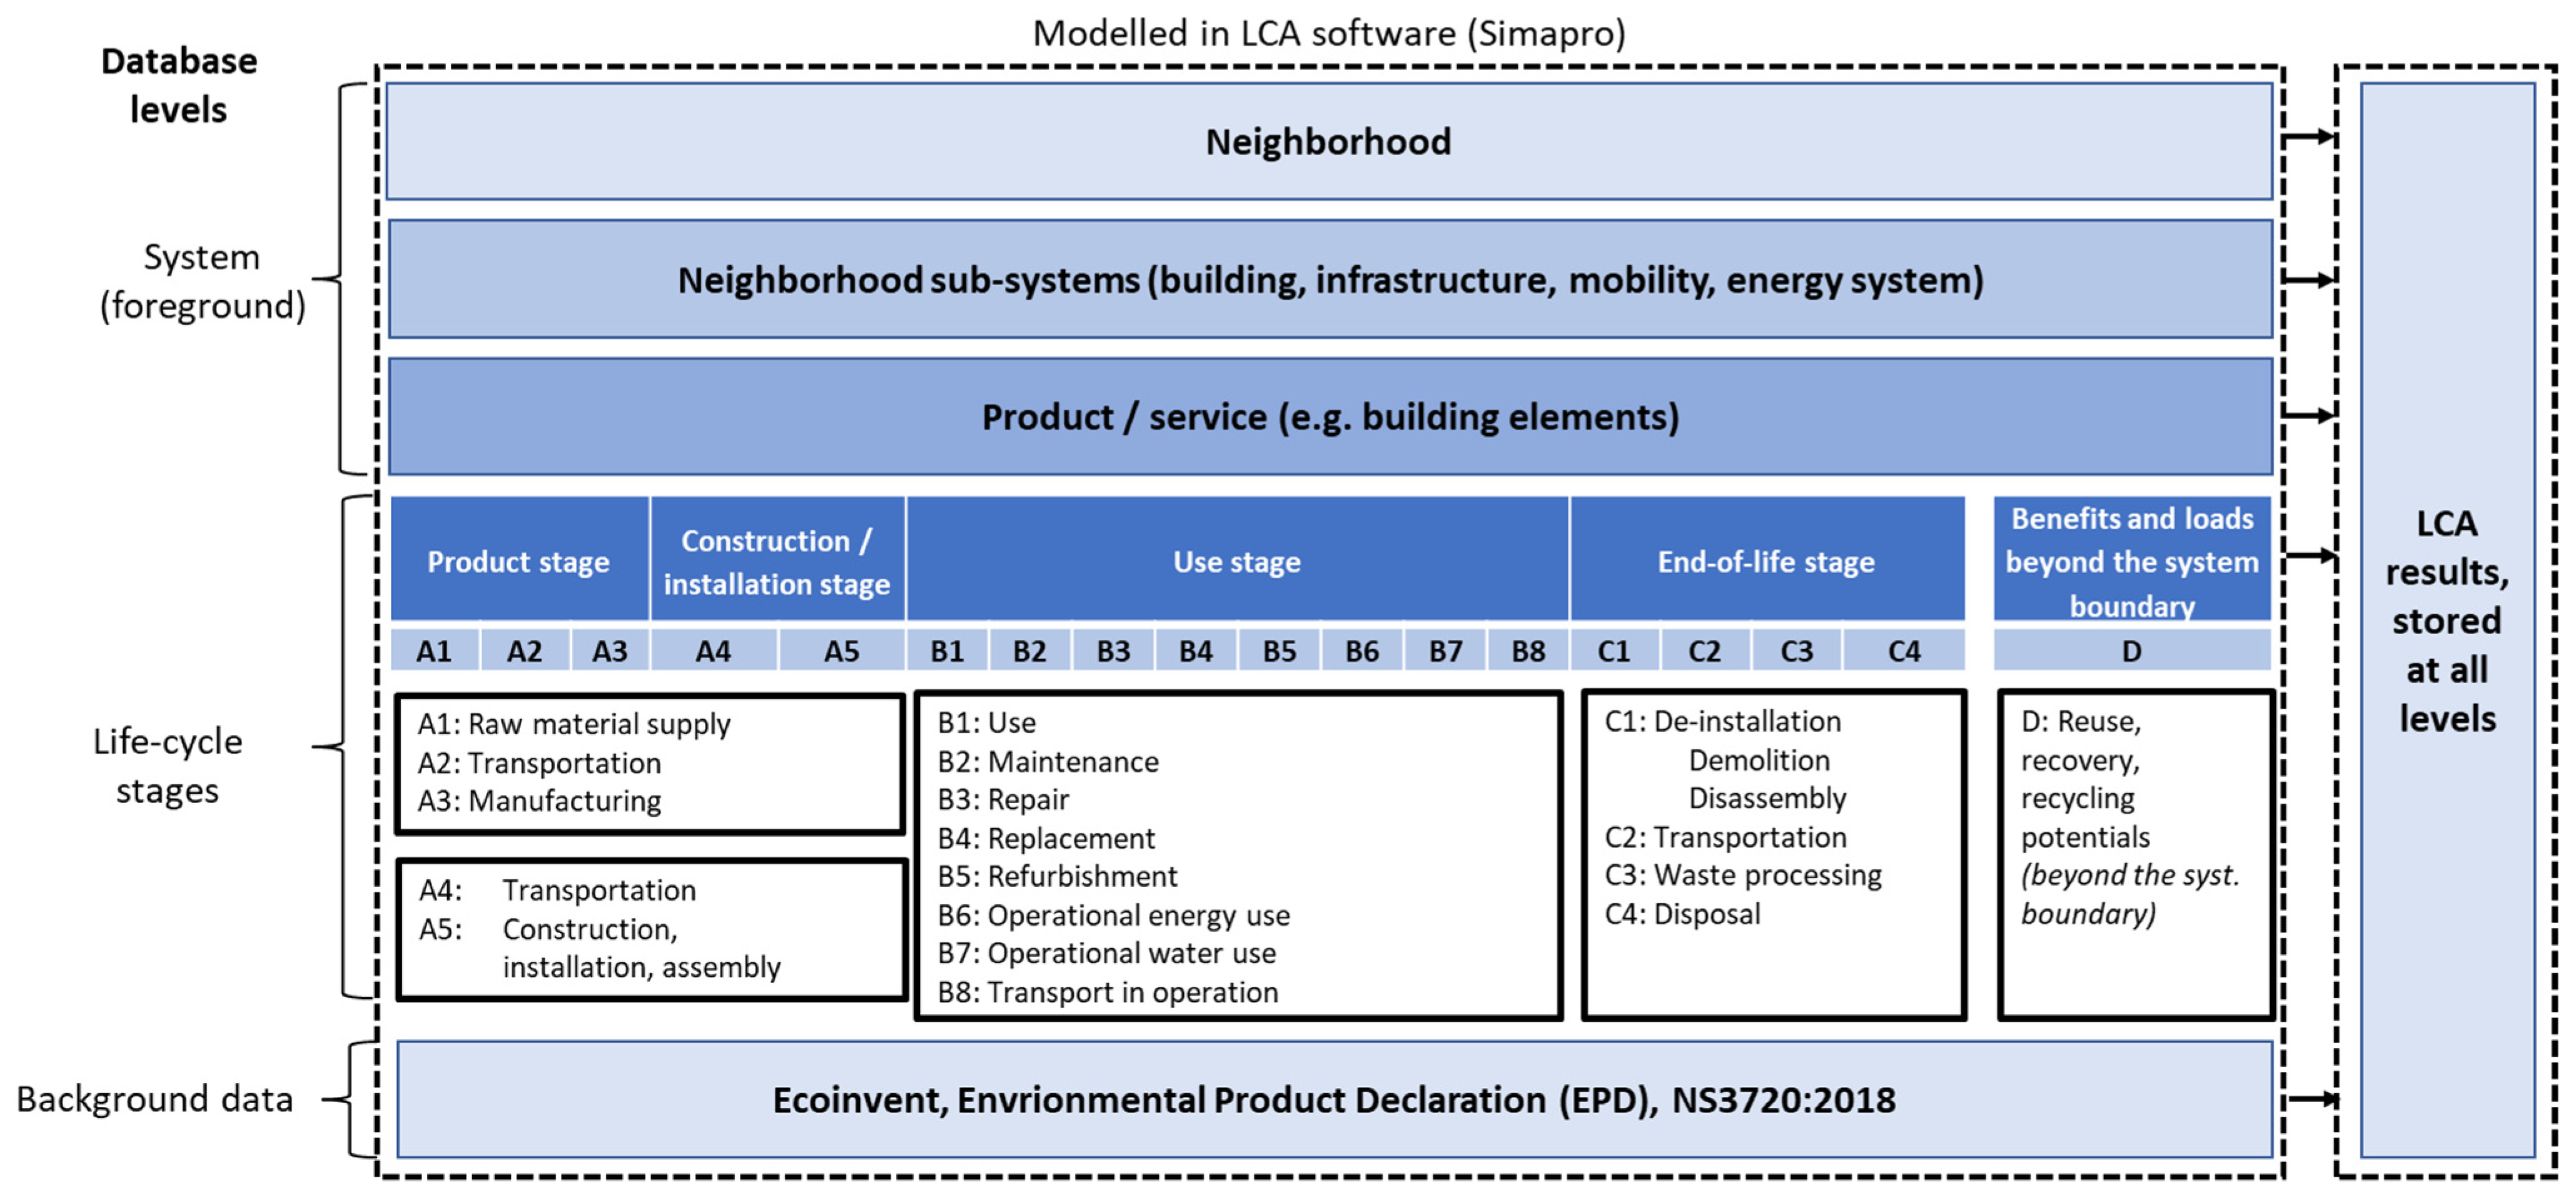
A high-level outline of a database structure that can serve the needs of the various stakeholders is illustrated in
Figure 3. Three main levels are defined: system (foreground), life-cycle stages, and background data.
At the system (foreground) level, the different neighborhood sub-systems (buildings, infrastructure, mobility, and energy supply) are defined.
At the life-cycle stages level, the life-cycle stages of the different sub-systems of the neighborhood are further defined, according to EN15804 [
11] and NS3720 [
12]: product stage (A1–A3), construction and installation stage (A4–A5), use stage (B1–B8), end-of-life stage (C1–C4), and benefits and loads beyond the system boundary (D). Please observe that the B8 module for emissions due to transport in operations is included in the NS3720 standard, as an extension to the EN15804 standard.
At the background data level, the processes that are used to construct and maintain the different neighborhood elements defined at the system (foreground) level are stored as system processes (EPD or NS3720:2018), or as unit processes with full value chain resolution (Ecoinvent). This serves as a library of products and processes that can be used for assessing the pilot projects. The data covered include contextual information such as location, year of construction, areas and volumes, typology, construction type, contractor, LCA practitioner, and so on.
Feedback from the system level to the background level will also be possible. This top-down approach is useful when developing average or generic data based on case studies. In addition, the possibility of querying not only unit processes or aggregated LCA results at building level, but also something in between, can be valuable.
The LCA results are stored outside the LCA database at all database levels. LCA results, quantities, and emission factors of building elements and material categories separated into life cycle stages can be valuable in early-phase applications, as well as for benchmarking and validation purposes.
4.1. Mapping
Data in the LCA database need to be exportable in a format that matches the data structure of the tools in the ZEN toolbox. This requires a mapping scheme, where processes in the tools are matched with the relevant processes in the LCA database. Mapping can, for example, be between two specific processes when selecting a specific product in the tool and the data matching it with an EPD in the database. Mapping can also be used to match a generic choice (e.g., “concrete”) with a representative average or generic process, including data on the average value of the selection and the variability of the results.
Mapping is closely related to what Edelen and Ingwersen [
24] have called “fitness for purpose”, ensuring that relevant LCA data are applied. Mapping schemes must evolve over time and will have to be updated for each new version of the LCA database and each new version of the tools using the mapping scheme.
4.2. Operation and Database Management
To avoid that the data degrade or lose their relevance over time it is necessary to develop a business model for maintenance of the database. It is also necessary to develop routines for data harvesting, data validation, and quality assurance. Finally, the management of the LCA database must be seen in the context of the ZEN toolbox data management and monitoring architecture [
5].
At its simplest, the LCA database provides data for the tools in the ZEN toolbox, in a one-way (unidirectional) relationship. However, when the goal is interoperability, a two-way (bidirectional) relationship is required. Interoperability allows for the use of the results from the ZEN toolbox to, for example, build a library of components in the LCA database.
5. Data Management
This section outlines the key challenges of the methodological aspects which have implications for the structure of the LCA database—in a ZEN context but also valid for other contexts—providing guidelines for data management (interoperability, data documentation, and data quality).
5.1. Interoperability
Interoperability, defined [
25] as the “ability for systems to exchange information and to use the exchanged information” is at the core of any database.
The LCA database must provide interoperability intrinsically and towards the other tools in the ZEN toolbox. The output of the ZEN toolbox should subsequently be able to feed back into the LCA database to continually expand the database contents. Interoperability is also required at a background level (see
Figure 3) between multiple LCI formats.
The LCA database should also be seen in context with other LCA database harmonization approaches, for example, the InData network [
26], the EU’s Life Cycle Data Network and the International Reference Life Cycle Data System (ILCD) nodes, [
27] and the GLAD network [
28].
5.2. Data Documentation
Data documentation is of key importance for the correct use (current and future) of the database because it allows the users to validate their data choices, make sure they are representative of the system they model, and that any comparisons are based on consistent system boundaries and assumptions. The minimum requirements for every dataset/process in the database are presented in
Table 2.
Many existing LCA data formats could suit the needs of the ZEN LCA database. The most commonly formats used in Europe are Ecospold and ILCD, in addition to proprietary formats used in SimaPro and GaBi. Ecospold is the data format used by ecoinvent [
17,
28]. The ILCD data format has been developed by the European Commission’s Joint Research Center [
29]. It has been used in the pilot studies on EU’s Product Environmental Footprint (PEF) [
30]. There is a quantity of freely accessible LCI data available in the ILCD format, e.g., through the EU’s soda4LCA nodes in the PEF pilots. The ILCD+EPD format is an extension of the ILCD format that accommodates Environmental Product Declarations (EPDs), especially in the building industry and in accordance with the EN15804 standard [
11]. This format has been developed in a cooperation between European EPD programs in an initiative called “InData”. EPD-Norway has launched an online database using this format [
31]. The ILCD+EPD format shows the flexibility of the ILCD+EPD format, and how it can be extended and adapted to accommodate additional requirements. An example of this can be found in Sweden, where what is termed as “Q metadata” has been added [
32,
33]. This additional metadata concerns topics such as if the LCI data are for one product or a group of products, for example, if there are significant underlying assumptions.
Two approaches for selecting a data format can be highlighted. The first is based on identifying a database software that best meets the needs and requirements of the database. The second is based on identifying which format best meets the needs and requirements of the project that the database serves (ZEN toolbox, in that case).
For the first approach, several available software may fulfil the requirements, including SimaPro, GaBi or Soda4LCA. For the second approach, based on an assessment of the needs and requirements identified for the ZEN toolbox, the ILCD format appears as the best match in terms of content. This is a data format that is extensively used both by the EU and by EPD programs (e.g., through the InData network and in EPD-Norway’s digital EPD database digi.epd-norge.no). For both approaches, the LCA database will therefore need to be able to use data based on the ILCD format.
A challenge with the ILCD format is that it has many fields with metadata. For most of the LCI datasets this will be time consuming without necessarily providing additional value from a ZEN perspective. To populate the database in a timely manner, it should be possible to add preliminary data without filling in all fields, e.g., as a separate part of the database (clearly identified as incomplete data sets).
5.3. Data Quality
Data quality has significance for quantifying uncertainty and variability of the data sets and needs to be addressed in the database. Data quality has been classified as intrinsic and contextual [
24,
34]. Intrinsic data quality is an inherent data property describing the data quality, whereas contextual data quality is an aspect of the data that is situationally dependent.
A dataset that has good intrinsic data quality can, for example, describe a production process very well, but not be used as input in another dataset where the contextual quality is low i.e., contextually wrong in terms of technology representation, geographical location, temporal representation, etc. The database will primarily relate to intrinsic data quality, but as datasets will build on each other, it will also involve situationally dependent choices that are important for the contextual quality of the resulting datasets. Contextual quality is important for the database since it is intended to be used by different users with different levels of LCA competence and for a variety of purposes. It is therefore important that the database guides the user in the selection of appropriate datasets for different contexts and purposes.
The most used approach for evaluation and documentation of data quality are the pedigree matrix approach used in Ecoinvent [
17] and the ILCD approach by the European Commission [
30]. An updated pedigree matrix has been proposed by the EPA in the USA [
35].
The pedigree approach assesses data quality through five quality indicators: reliability (how data have been generated and validated), completeness (value chain coverage), temporal correlation (age of data), geographical correlation (location), and technological correlation (relevance of industry/technology assumption). The quality indicators are evaluated with a score between 1 and 5 (1—verified data based on measurements and 5—undocumented estimate). An estimated geometric standard deviation for datapoints in the inventory dataset can be computed.
The ILCD Handbook [
30] lists the following six components of data quality: Technological representativeness, Geographical representativeness, Temporal representativeness, Completeness, Precision, and Methodological appropriateness. An advantage of the pedigree approach is that it allows implementation of uncertainty evaluation in the inventories. This feature is not directly possible in the ILCD approach. Implementation of the data quality indicators as described in the ILCD Handbook results in an overall data quality rating for the dataset.
A third approach is the European Commission’s Product Environmental Footprint methodology that applies data quality indicators such as ILCD. As in ILCD, the overall quality of the dataset is evaluated rather than individual datapoints, and equal weight is assigned to the six data quality categories [
36].
For the ZEN LCA database we recommend relying on the pedigree approach due to its implementation of data quality indicators directly in the inventories for each data point.
6. LCA Modelling: Methodological Aspects
6.1. Parametrization
Parametric models are useful for creating representative scenarios for transportation (capacity utilization, car fleet composition, etc.), building stock development over time, sensitivity analysis, probability analysis, algorithmic optimization, etc. [
37,
38,
39,
40,
41,
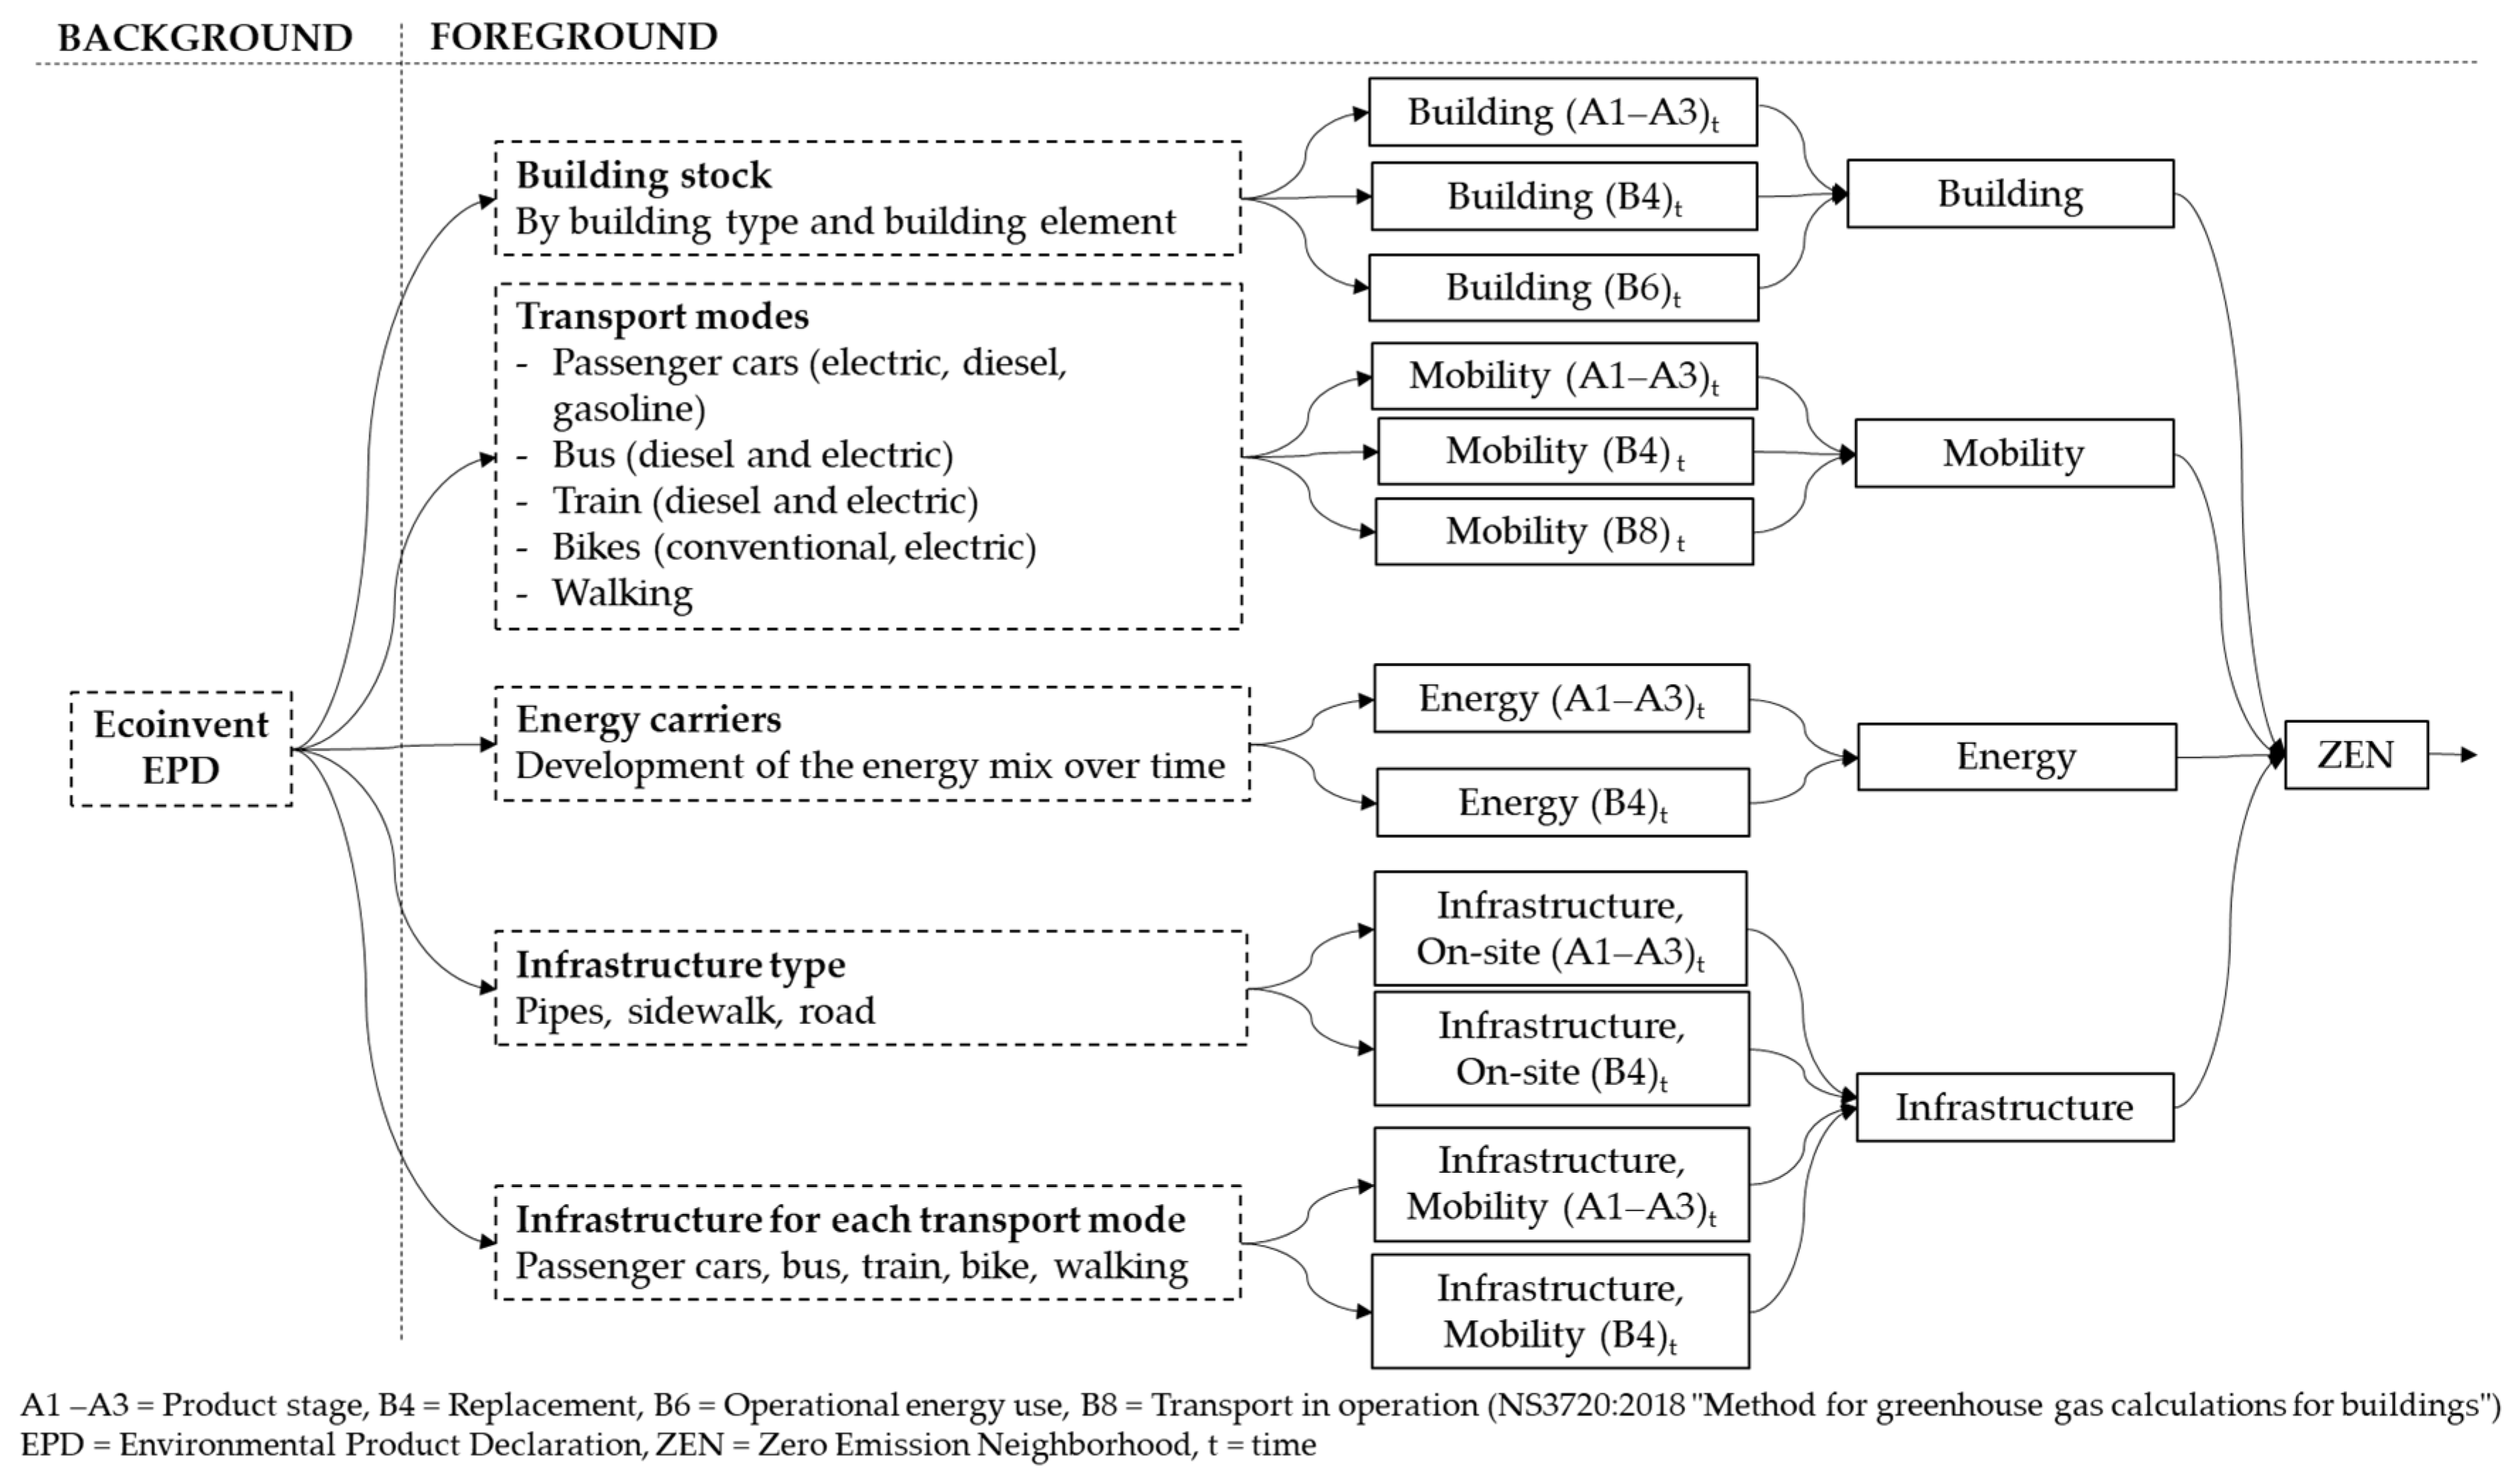
42]. Parametrization can be done at all levels of the database to link the different database elements, as shown in
Figure 4.
6.2. Scenarios Development
Scenario development can be seen in the context of parametrization by using parameters that facilitate scenario creation. Typical scenarios could address and predict potential pathways for the repair and maintenance of products or components, development of the mobility fleet over time, production technology, energy scenarios (use and decarbonization rate), the inclusion or exclusion of biogenic carbon, land use, and land use changes, etc.
The LCA database is not intended to be a scenario generating tool but should support such tools with the necessary LCI data. When examining the emission performance of a project over time, we recommend that scenarios are initially developed outside of the LCA database. The parameters and results of scenario analysis can then be entered into the database to provide additional data for subsequent studies.
6.3. Temporal Aspects
Combining building, mobility, and the local and connected energy system over a given time frame of 60 years—as done when assessing neighborhoods according to EN15804 and NS3720—is about combining different subsystems that evolve or change at very different rates [
20]. The change rate of buildings is slow. Once built, the dynamic or internal rate can be assumed constant until the next renovation or refurbishment event takes place. On the other hand, vehicles have much shorter lifetimes than buildings, and hence, the change rate of a neighborhood’s vehicle fleet and its fuel- or material-related emissions are considerably higher and must be carefully accounted for in scenario analyses.
Temporal aspects can be relevant for many product systems but are typically not addressed in LCA databases [
43]. Studies of temporal effects are commonly done outside of LCA databases. This is the case in a study by [
44] where a conventional and a dynamic LCA was performed with climate change, human toxicity, and ecotoxicity as target impact categories to determine the sensitivity of the LCA results to temporal parameters. In Temporalis, a free and open source software package developed by Cardellini, Mutel et al. [
45], dynamic LCIs are developed to account for environmental interventions at their time of occurrence. However, those approaches are still experimental and not yet operationalized into a readily usable tool. Several approaches to integrate energy scenarios in LCA are summarized in a review by Vandepaer and Gibon [
46]. Studies on temporal aspects can also done in combination with other methods such as extended environmental input output assessment [
47].
In a neighborhood context, salient temporal aspects include developments in the building stock over time. This type of temporality can be accounted for with the help of general algorithms and probably functions [
40] and the use of segmented building stock [
48]. Other temporal aspects that have to be accounted for in a neighborhood context include aspects related to carbon sequestration, biogenic carbon [
49,
50,
51], carbonation, and energy systems [
52].
The emissions related to the production of materials as well as emissions from their transportation can be expected to decrease in the future due to technological improvements in material technology, production technology, transportation technology, and the electrification of those processes together with decarbonization of the energy grid. The future emissions from material replacements can thus not be based solely on today’s emission factors for production and transport. The LCA database must thus facilitate the use of time series. When possible, unit processes should be modeled to facilitate the use of temporal resolution. A first approach would be to model unit processes for different years (e.g., concrete production in 2020, 2030, 2050) that would be stored as a reference flow.
We recommend that the LCA database is developed to support the inclusion of temporal aspects in LCA, for example, by providing relevant unit processes for scenario development. An iterative approach can be used, addressing the most significant processes first. A key challenge will be processes that are inherently not possible to adjust for temporal aspects, for example, static data from EPDs, where such aspects must be addressed through assumptions (e.g., estimate of x% improvement per year, or similar). One way to implement these technological developments is to introduce “technological factors”, as suggested by Lausselet and Brattebo [
53] and Resch, Lausselet et al. [
22] based on an assumed development in emission reductions’ intensity of overall material production emission and transport emissions’ intensity for each year in the study period.
In addition to those LCA specificities, the development of on-site renewable energy production and demand management on a building and/or neighborhood scale calls for a deeper understanding of the interaction between building operation and the electricity grid. We suggest a further and better integration of the KPIs Power/load and Energy into the LCA database, in the direction taken by Roux, Schalbart et al. [
54] or Clauß, Stinner et al. [
55] that use energy profiles with an hourly resolution. By doing so, the temporal variation in use, production, storage, and import/export of electricity could be better considered. To use seasonal averages such as those used by Kristjansdottir, Heeren et al. [
56] can also be an alternative. In addition to those LCA specificities, energy storage alternatives and the development of on-site renewables should also be included in the database.
6.4. Spatial Aspects (Regionalization)
Regional aspects and resolution are relevant both for inventory precision and impact assessment. Inventory precision is related to technology representation and corresponding emissions’ intensities, such as energy/electricity mix, industry production technology, mobility mix (transport means and vehicle fleet composition), all of which are relevant in neighborhood assessments. Different approaches to regionalization and aggregation levels exist. The most common regionalization is to distinguish on national or continental levels, or to some extent between markets or subsets of larger countries, e.g., the electricity markets in the USA, as in the ecoinvent database. The extent of regionalization to provide location-specific input data or impact assessment depends on the resolution of the life-cycle impact assessment method.
New approaches are under development, using geospatial information and linking geographical grid data information with, for example, precipitation statistics to provide location-specific subsets [
47,
57,
58]. However, in many cases the specific location of the production or activity is not known, either because the purpose is to provide average or generic data or because the study is in an early stage where the specific location of activities is not determined yet.
Regional differences are also relevant from the impact assessment perspective [
45,
59,
60]. The effect of a given emission can vary depending on location due to differences in background contamination levels, and ecosystem vulnerability. There is a general need for harmonization of how regionalization is defined and implemented [
45,
61]. This includes aspects related to nomenclature and hierarchies, geography with mixed watersheds, biomes etc., formatting (both two- and three-letter used), consistency in region codes, and more.
In the case of the ZEN LCA database, we consider temporal resolution to be a more pressing demand than spatial resolution. Regional aspects could be included iteratively, prioritizing the data that are most significant for the context of the database.
7. Conclusions and Recommendations for the Next Steps
This study outlines the foundations of a user-centric LCA database for neighborhoods including several sub-systems (buildings, infrastructure, mobility, and energy supply). The database does not operate on its own as it is part of a wider context, the ZEN toolbox. The following recommendations for the next steps are given as conclusive remarks:
A key requirement for the database is that it must be able to provide users with timely and relevant LCA data in the context of the ZEN toolbox, the need of the pilot projects, and involved stakeholders;
The minimum requirement is to provide the ZEN toolbox with the data that are required for calculating the GHG emission KPI in all project phases, and in accordance with agreed-upon standards;
Additional requirements depend on the specific tools that are connected to the database, and their needs and requirements;
Developing the LCA database requirements must be seen in relation with the ZEN toolbox and must be coordinated between LCA experts and ICT experts, with input from the stakeholders. This to ensure interoperability, consistency, harmonization between projects over time, and provision of relevant and timely LCA data to the users;
The database is currently under development with its content being extended over time. In the initial stages, the focus is set on the parametrization, temporal aspects, regionality and scenario development, and coordination with the pilot projects to consider their data needs and requirements;
A data management plan and business model are also developed to secure efficient operation of the database today and over time, and to ensure the operation of the LCA database in a broader perspective.
The recommendations above are specifically aimed at Zero Emission Neighborhoods, but they are also relevant and applicable for planning and design of neighborhoods with other types of environmental ambitions in a life cycle perspective. Key success factors are mapping the needs and requirements of users, connecting the database to the tools used by the stakeholders, to populate the database, to be able to adapt to methodological improvements over time, and to have a well-founded data management plan and business model.
Author Contributions
Conceptualization, C.S., C.L., H.B. (Håvard Bergsdal) and H.B. (Helge Brattebø); methodology, C.S., C.L. and H.B. (Håvard Bergsdal); writing—original draft preparation, C.S., C.L. and H.B. (Håvard Bergsdal); writing—review and editing, C.S., C.L. and H.B. (Håvard Bergsdal); visualization, C.S. and C.L.; funding acquisition, H.B. (Helge Brattebø). All authors have read and agreed to the published version of the manuscript.
Funding
This research was funded by the Research Council of Norway, grant number 257660.
Acknowledgments
The authors gratefully acknowledge the support of the Research Council of Norway and several partners through the Research Center on Zero Emission Neighborhoods in Smart Cities (FME ZEN).
Conflicts of Interest
The authors declare no conflict of interest.
Appendix A
Table A1.
List of parameters for the neighborhood sub-element building.
Table A1.
List of parameters for the neighborhood sub-element building.
| Life Cycle Stage | Parameter | Unit |
|---|
Buildings
(A1–A3) | ServiceLife_Building | year |
Buildings
(B4) | ServiceLife_Bitumen | year |
| ServiceLife_Ceramics | year |
| ServiceLife_Cladding | year |
| ServiceLife_Covering | year |
| ServiceLife_Door | year |
| ServiceLife_Flooring | year |
| ServiceLife_Furniture | year |
| ServiceLife_Glass | year |
| ServiceLife_Insulation | year |
| ServiceLife_Metals | year |
| ServiceLife_Paint | year |
| ServiceLife_Plastics | year |
| ServiceLife_Sealing | year |
| ServiceLife_Technical | year |
| ServiceLife_Ventilation | year |
| ServiceLife_Window | year |
| ServiceLife_Wood | year |
Buildings
(B6) | | kWh/(m2·year) |
| | kWh/(m2·year) |
Table A2.
List of parameters for the neighborhood sub-element mobility.
Table A2.
List of parameters for the neighborhood sub-element mobility.
| Life Cycle Stage | Parameter | Unit |
|---|
Mobility
(A1–A3, B4) | PassengerLoad_Car | person/car |
| ServiceLife_Car | km |
| TravelDistance_Share_Foot | [-] |
| TravelDistance_Share_Bike | [-] |
| TravelDistance_Share_Car | [-] |
| TravelDistance_Share_Bus | [-] |
| TravelDistance_Share_Train | [-] |
| Car_Electric_Share_2022 | [-] |
| Car_Diesel_Share_2022 | [-] |
| Car_Petrol_Share_2022 | [-] |
| Car_Electric_Share_2030 | [-] |
| Car_Diesel_Share_2030 | [-] |
| Car_Petrol_Share_2030 | [-] |
| Car_Electric_Share_2050 | [-] |
| Car_Diesel_Share_2050 | [-] |
| Car_Petrol_Share_2050 | [-] |
Mobility
(B8) | Car_Electric_ElUse | kWh/(km·car) |
Table A3.
List of parameters for the neighborhood sub-element energy.
Table A3.
List of parameters for the neighborhood sub-element energy.
| Life Cycle Stage | Parameter | Unit |
|---|
Energy
(A1–A3, B4) | PV_InstalledCapacity | m2/residential unit |
| PV_Efficiency | kWh/(m2·year) |
| ServiceLife_PV | year |
| ElHydro_Share_NO_2022 | [-] |
| ElWind_Share_NO_2022 | [-] |
| ElVarmekraft_Share_NO_2022 | [-] |
| ElHydro_Share_NO_2050 | [-] |
| ElWind_Share_NO_2050 | [-] |
| ElVarmekraft_Share_NO_2050 | [-] |
| ElHydro_Share_EU_2022 | [-] |
| ElWind_Share_EU_2022 | [-] |
| ElVarmekraft_Share_EU_2022 | [-] |
| ElVarmekraft_Coal_Share_EU_2022 | [-] |
| ElPV_Share_EU_2022 | [-] |
| ElGeo_Share_EU_2022 | [-] |
| ElNuclear_Share_EU_2022 | [-] |
| ElHydro_Share_EU_2050 | [-] |
| ElWind_Share_EU_2050 | [-] |
| ElVarmekraft_Share_EU_2050 | [-] |
| ElVarmekraft_Coal_Share_EU_2050 | [-] |
| ElPV_Share_EU_2050 | [-] |
| ElGeo_Share_EU_2050 | [-] |
| ElNuclear_Share_EU_2050 | [-] |
| ElVarmekraftCCS_Share_EU_2050 | [-] |
References
- IPCC. IPCC, 2018: Summary for Policymakers. In Global Warming of 1.5 °C. An IPCC Special Report on the Impacts of Global Warming of 1.5 °C above Pre-Industrial Levels and Related Global Greenhouse Gas Emission Pathways, in the Context of Strengthening the Global Response to the Threat of Climate Change, Sustainable Development, and Efforts to Eradicate Poverty; Masson-Delmotte, V., Zhai, P., Pörtner, H.-O., Roberts, D., Skea, J., Shukla, P.R., Pirani, A., Moufouma-Okia, W., Péan, C., Pidcock, R., et al., Eds.; World Meteorological Organization: Geneva, Switzerland, 2018. [Google Scholar]
- United Nations Environment Programme; Global Alliance for Buildings and Construction. 2020 Global Status Report for Buildings and Construction: Towards a Zero-Emissions, Efficient and Resilient Buildings and Construction Sector; UNEP: Nairobi, Kenya, 2020. [Google Scholar]
- FME ZEN Homepage. Available online: https://fmezen.no/ (accessed on 2 January 2022).
- Wiik, M.K.; Fjellheim, K.; Vandervaeren, C.; Krekling Lien, S.; Meland, S.; Nordström, T.; Baer, D.; Cheng, C.; Truloff, S.; Brattebø, H.; et al. Zero Emission Neighbourhoods in Smart Cities: Definition, Assessment Criteria and Key Performance Indicators: Version 3.0. English; SINTEF/NTNU: Trondheim, Norway, 2021; Forthcoming. [Google Scholar]
- Ahlers, D.; Krogstie, J. ZEN Data Management and Monitoring: Requirements and Architecture—ZEN Memo No. 7; SINTEF/NTNU: Trondheim, Norway, 2018. [Google Scholar]
- Baer, D. Tools for Stakeholder Engagement in Zero Emission Neighbourhood Developments—ZEN Report No. 13; SINTEF/NTNU: Trondheim, Norway, 2019. [Google Scholar]
- Brozovsky, J.; Gustavsen, A.; Gaitani, N. Zero emission neighbourhoods and positive energy districts—A state-of-the-art review. Sustain. Cities Soc. 2021, 72, 103013. [Google Scholar] [CrossRef]
- Wiik, M.K.; Fufa, S.M.; Fjellheim, K.; Lien, S.K.; Krogstie, J.; Ahlers, D.; Wyckmans, A.; Driscoll, P.; Brattebø, H.; Gustavsen, A. Zero Emission Neighbourhood in Smart Cities Definition, Key Performance Indicators and Assessment Criteria: Version 2.0. Bilingual Version—ZEN Report 32; NTNU/SINTEF: Trondheim, Norway, 2021. [Google Scholar]
- Baer, D.; Andresen, I. ZEN PILOT PROJECTS: Mapping of the Pilot Projects within the Research Centre on ZERO Emission Neighbourhoods in Smart Cities—ZEN Report No.10; SINTEF/NTNU: Trondheim, Norway, 2018. [Google Scholar]
- Freeman, R.E. Stakeholder Theory: The State of the Art; Cambridge University Press: Cambridge, UK, 2010; 343p. [Google Scholar]
- CEN EN 15804:2012+A1:2013; Sustainability of Construction Works—Environmental Product Declarations—Core Rules for the Product Category of Construction Products. International Organization for Standardization: Geneva, Switzerland, 2013.
- NS3720:2018; Method for Greenhouse Gas Calculations for Buildings. Standards Norway: Oslo, Norway, 2018.
- One Click LCA Homepage. Available online: https://www.oneclicklca.com/ (accessed on 2 January 2022).
- LCAbyg Homepage. Available online: https://www.lcabyg.dk/da/ (accessed on 2 January 2022).
- IVL. Byggsektorens Miljöberäkningsverktyg. Available online: https://www.ivl.se/projektwebbar/byggsektorns-miljoberakningsverktyg.html (accessed on 2 January 2022).
- FME ZEB. The Research Centre on Zero Emission Buildings (FME ZEB). Available online: https://www.zeb.no/index.php/no/ (accessed on 2 January 2022).
- Ecoinvent, Ecoinvent. Available online: https://ecoinvent.org/ (accessed on 2 January 2022).
- Sphera. GaBi—Product Sustainability Software & Data. Available online: https://sphera.com/product-sustainability-software/ (accessed on 2 January 2022).
- Lausselet, C.; Borgnes, V.; Brattebo, H. LCA modelling for Zero Emission Neighbourhoods in early stage planning. Build. Environ. 2019, 149, 379–389. [Google Scholar] [CrossRef]
- Lausselet, C.; Ellingsen, L.A.W.; Strømman, A.H.; Brattebø, H. A life-cycle assessment model for zero emission neighborhoods. J. Ind. Ecol. 2019, 24, 500–516. [Google Scholar] [CrossRef]
- Fufa, S.M.; Schlanbusch, D.R.; Sørnes, K.; Inman, M.; Andresen, I. A Norwegian ZEB Definition Guideline; SINTEF/NTNU: Trondheim, Norway, 2016. [Google Scholar]
- Resch, E.; Lausselet, C.; Brattebo, H.; Andresen, I. An analytical method for evaluating and visualizing embodied carbon emissions of buildings. Build. Environ. 2020, 168, 106476. [Google Scholar] [CrossRef]
- Yttersian, V.L.; Fuglseth, M.; Lausselet, C.; Brattebo, H. OmradeLCA, assessment of area development: Case study of the Zero-Emission Neighbourhood Ydalir. In IOP Conference Series Earth and Environmental Science; IOP Publishing: Bristol, UK, 2019; Volume 352, p. 012041. [Google Scholar]
- Edelen, A.; Ingwersen, W.W. The creation, management, and use of data quality information for life cycle assessment. Int. J. Life Cycle Assess. 2018, 23, 759–772. [Google Scholar] [CrossRef]
- SEBoK. SEBoK—Guide to the Systems Engineering Body of Knowledge. Available online: https://www.sebokwiki.org/wiki/Interoperability_(glossary) (accessed on 1 November 2021).
- Oekobaubat. Oekobaubat: Sustainable Construction Information Portal. Available online: https://www.oekobaudat.de/en/international/indata.html (accessed on 1 November 2021).
- European Commission. European Platform on Life Cycle Assessment. Available online: https://eplca.jrc.ec.europa.eu/LCDN/ (accessed on 1 November 2021).
- GLAD. The Global Life Cycle Assessment Data Access Network (GLAD). Available online: https://www.globallcadataaccess.org/about (accessed on 1 November 2021).
- Simone, F.; Kusche, O.; Luca, Z. Life Cycle Data Network—Handbook for Data Developers and Providers; Eouropean Comission: Luxembourg, 2016. [Google Scholar]
- European Commission; Joint Research Centre; Institute for Environment and Sustainability. International Reference Life Cycle Data System (ILCD) Handbook—General Guide for Life Cycle Assessment—Detailed Guidance; Publications Office of the European Union: Luxembourg, 2010. [Google Scholar]
- The Norwegian EPD Foundation. Available online: https://digi.epd-norge.no/ (accessed on 1 November 2021).
- Erlandsson, M. Q Metadata for EPD: Quality-Assured Environmental Product Declarations (EPD) for Healthy Competition and Increased Transparency; Smart Buildt Environment: Stockholm, Sweden, 2018. [Google Scholar]
- Smart Built Environment. Introduction to a Digital EPD Format for Swedish Building Products; Smart Buildt Environment: Stockholm, Sweden, 2017. [Google Scholar]
- Ciroth, A.; Arbuckle, P.; Cherubini, E.; Ugaya, C.; Edelen, A. WG3 of GLAD, Task 3: Core Meta-Data Descriptios and Guidance on Pop-605 Ulating Descriptors; Global LCA Access: Switzerland, 2017; Available online: https://wedocs.unep.org/bitstream/handle/20.500.11822/22539/ReportWG3_final_Nov.%2017%20(1).pdf (accessed on 2 January 2022).
- Edelen, A.; Ingwersen, W.W. Guidance on Data Quality Assessment for Life Cycle Inventory Data; United States Environmental Protection Agency (USEPA): Cincinnati, OH, USA, 2016. [Google Scholar]
- Fazui, S.; Zampori, L.; De Scryver, A.; Kusche, O. Guide on Life Cycle Inventory (LCI) Data Generation for the Environmental Footprint—Version 1.0; European Commision: Luxembourg, 2018. [Google Scholar]
- Lobaccaro, G.; Wiberg, A.H.; Ceci, G.; Manni, M.; Lolli, N.; Berardi, U. Parametric design to minimize the embodied GHG emissions in a ZEB. Energy Build. 2018, 167, 106–123. [Google Scholar] [CrossRef] [Green Version]
- Lolli, N.; Fufa, S.M.; Inman, M. A parametric tool for the assessment of operational energy use, embodied energy and embodied material emissions in building. Energy Procedia 2017, 111, 21–30. [Google Scholar] [CrossRef]
- Fufa, S.M.; Skaar, C.; Gradeci, K.; Labonnote, N.; Time, B.; Kohler, J. Parametric LCA of a ventilated timber wall con-618 struction in tall timber buildings. In Proceedings of the XIV DBMC—14th International Conference on Durability of Building 619 Materials and Components, Ghent, Belgium, 29–31 May 2017. [Google Scholar]
- Sartori, I.; Sandberg, N.H.; Brattebo, H. Dynamic building stock modelling: General algorithm and exemplification for Norway. Energy Build. 2016, 132, 13–25. [Google Scholar] [CrossRef] [Green Version]
- Skaar, C.; Labonnote, N.; Gradeci, K. From Zero Emission Buildings (ZEB) to Zero Emission Neighbourhoods (ZEN): A Mapping Review of Algorithm-Based LCA. Sustainability 2018, 10, 2405. [Google Scholar] [CrossRef] [Green Version]
- Skaar, C.; Solem, B.; Rüther, P. Composite floors in urban buildings: Options for a low carbon building design. In Proceedings of the 6th Forum Wood Building Nordic 2017, Trondheim, Norway, 27–29 September 2017. [Google Scholar]
- Pinsonnault, A.; Lesage, P.; Levasseur, A.; Samson, R. Temporal differentiation of background systems in LCA: Relevance of adding temporal information in LCI databases. Int. J. Life Cycle Assess. 2014, 19, 1843–1853. [Google Scholar] [CrossRef]
- Shimako, A.H.; Tiruta-Barna, L.; Bisinella de Faria, A.B.; Ahmadi, A.; Spérandio, M. Sensitivity analysis of temporal parameters in a dynamic LCA framework. Sci. Total Environ. 2018, 624, 1250–1262. [Google Scholar] [CrossRef]
- Cardellini, G.; Mutel, C.L.; Vial, E.; Muys, B. Temporalis, a generic method and tool for dynamic Life Cycle Assessment. Sci. Total Environ. 2018, 645, 585–595. [Google Scholar] [CrossRef]
- Vandepaer, L.; Gibon, T. The integration of energy scenarios into LCA: LCM2017 Conference Workshop, Luxembourg, September 5, 2017. Int. J. Life Cycle Assess. 2018, 23, 970–977. [Google Scholar] [CrossRef]
- Gibon, T.; Wood, R.; Arvesen, A.; Bergesen, J.D.; Suh, S.; Hertwich, E.G. A Methodology for Integrated, Multiregional Life Cycle Assessment Scenarios under Large-Scale Technological Change. Environ. Sci. Technol. 2015, 49, 11218–11226. [Google Scholar] [CrossRef] [Green Version]
- Sandberg, N.H.; Sartori, I.; Vestrum, M.I.; Brattebo, H. Using a segmented dynamic dwelling stock model for scenario analysis of future energy demand: The dwelling stock of Norway 2016–2050. Energy Build. 2017, 146, 220–232. [Google Scholar] [CrossRef]
- Cherubini, F.; Fuglestvedt, J.; Gasser, T.; Reisinger, A.; Cavalett, O.; Huijbregts, M.A.J.; Johansson, D.J.A.; Jorgensen, S.V.; Raugei, M.; Schivley, G.; et al. Bridging the gap between impact assessment methods and climate science. Environ. Sci. Policy 2016, 64, 129–140. [Google Scholar] [CrossRef] [Green Version]
- Guest, G.; Bright, R.M.; Cherubini, F.; Stromman, A.H. Consistent quantification of climate impacts due to biogenic carbon storage across a range of bio-product systems. Environ. Impact Assess. Rev. 2013, 43, 21–30. [Google Scholar] [CrossRef]
- Levasseur, A.; Lesage, P.; Margni, M.; Samson, R. Biogenic Carbon and Temporary Storage Addressed with Dynamic Life Cycle Assessment. J. Ind. Ecol. 2013, 17, 117–128. [Google Scholar] [CrossRef]
- Seljom, P.; Lindberg, K.B.; Tomasgard, A.; Doorman, G.; Sartori, I. The impact of Zero Energy Buildings on the Scandinavian energy system. Energy 2017, 118, 284–296. [Google Scholar] [CrossRef]
- Lausselet, C.; Brattebo, H. Environmental co-benefits and trade-offs of climate mitigation strategies applied to net-zero-emission neighbourhoods. Int. J. Life Cycle Assess. 2021, 26, 2263–2277. [Google Scholar] [CrossRef]
- Roux, C.; Schalbart, P.; Peuportier, B. Accounting for temporal variation of electricity production and consumption in the LCA of an energy-efficient house. J. Clean. Prod. 2016, 113, 532–540. [Google Scholar] [CrossRef]
- Clauß, J.; Stinner, S.; Sartori, I.; Georges, L. Predictive rule-based control to activate the energy flexibility of Norwegian residential buildings: Case of an air-source heat pump and direct electric heating. Appl. Energy 2019, 237, 500–518. [Google Scholar] [CrossRef]
- Kristjansdottir, T.F.; Heeren, N.; Andresen, I.; Brattebo, H. Comparative emission analysis of low-energy and zero-emission buildings. Build. Res. Inf. 2018, 46, 367–382. [Google Scholar] [CrossRef]
- Wernet, G.; Bauer, C.; Steubing, B.; Reinhard, J.; Moreno-Ruiz, E.; Weidema, B. The ecoinvent database version 3 (part I): Overview and methodology. Int. J. Life Cycle Assess. 2016, 21, 1218–1230. [Google Scholar] [CrossRef]
- Patouillard, L.; Bulle, C.; Querleu, C.; Maxime, D.; Osset, P.; Margni, M. Critical review and practical recommendations to integrate the spatial dimension into life cycle assessment. J. Clean. Prod. 2018, 177, 398–412. [Google Scholar] [CrossRef] [Green Version]
- Bulle, C.; Margni, M.; Patouillard, L.; Boulay, A.M.; Bourgault, G.; De Bruille, V.; Cao, V.; Hauschild, M.; Henderson, A.; Humbert, S.; et al. IMPACT World+: A globally regionalized life cycle impact assessment method. Int. J. Life Cycle Assess. 2019, 24, 1653–1674. [Google Scholar] [CrossRef] [Green Version]
- Verones, F.; Bare, J.; Bulle, C.; Frischknecht, R.; Hauschild, M.; Hellweg, S.; Henderson, A.; Jolliet, O.; Laurent, A.; Liao, X.; et al. LCIA framework and cross-cutting issues guidance within the UNEP-SETAC Life Cycle Initiative. J. Clean. Prod. 2017, 161, 957–967. [Google Scholar] [CrossRef] [Green Version]
- Mutel, C.; Liao, X.; Patouillard, L.; Bare, J.; Fantke, P.; Frischknecht, R.; Hauschild, M.; Jolliet, O.; Maia de Souza, D.; Laurent, A.; et al. Overview and recommendations for regionalized life cycle impact assessment. Int. J. Life Cycle Assess. 2019, 24, 856–865. [Google Scholar] [CrossRef] [Green Version]
| Publisher’s Note: MDPI stays neutral with regard to jurisdictional claims in published maps and institutional affiliations. |
© 2022 by the authors. Licensee MDPI, Basel, Switzerland. This article is an open access article distributed under the terms and conditions of the Creative Commons Attribution (CC BY) license (https://creativecommons.org/licenses/by/4.0/).


