Article

Ultrasonic Coda Wave Experiment and Simulation of Concrete Damage Process under Uniaxial Compression

State Key Laboratory for Geomechanics and Deep Underground Engineering, School of Mechanics and Civil Engineering, China University of Mining and Technology, Xuzhou 221116, China
*
Author to whom correspondence should be addressed.
Buildings 2022, 12(5), 514; https://doi.org/10.3390/buildings12050514
Submission received: 21 March 2022 / Revised: 16 April 2022 / Accepted: 17 April 2022 / Published: 20 April 2022
(This article belongs to the Topic Recent Advances in Structural Health Monitoring)

Abstract

:
Using the coda wave interferometry (CWI) method to obtain the ultrasonic coda wave characteristics of loaded concrete is an important method to evaluate the mechanical response of concrete. In this paper, the ultrasonic coda wave characteristics of C40–C70 concrete specimens (four strengths of concrete) under uniaxial compression were tested by laboratory experiments. Furthermore, to clarify the relationship between the internal damage process of concrete and the change rate of coda wave velocity, an ultrasonic coda wave discrete element simulation model combined with digital image processing technology was established. The results show that the coda wave is very sensitive to small changes in the compressive damage to concrete, and the change in coda wave velocity can correspond to the development process of concrete damage. This research is conducive to a better understanding of the complex material behavior of compressive concrete and proves the feasibility of ultrasonic field simulation and processing by using numerical simulation images of concrete damage.

1. Introduction

Concrete ultrasonic nondestructive testing technology refers to the use of signal processing methods to analyze the changes in acoustic parameters such as wave speed, frequency, and amplitude of ultrasonic waves after passing through the concrete medium, and then to evaluate the mechanical properties and damage status of concrete [1]. However, concrete is a nonuniform and anisotropic composite material with a wide range of heterogeneous interfaces inside; complex reflection and refraction phenomena will occur when ultrasonic waves propagate through it [2], making it difficult to measure wave speed changes accurately. However, coda wave interferometry (CWI), developed by seismologists, provides a way to solve this problem [3]. A coda wave refers to the long tail part that extends behind the direct wave in the waveform [4]. Compared with direct waves, it is more sensitive to changes in the internal scattering of the medium, so it can be used to identify small changes in concrete [5,6]. Coda wave interferometry compares the waveforms at different times to determine the travel time offset change law between the waveforms and then obtains the relative change rate in the wave velocity [7]. Related research indicates that its wave velocity measurement accuracy can reach up to 0.001% [8]. Therefore, coda wave interferometry has been introduced into civil engineering as a high-sensitivity monitoring tool, and it has shown great potential and broad application prospects in the health monitoring of concrete structures [9,10]. Presently, many scholars have performed a series of concrete ultrasonic nondestructive testing studies using coda wave interference technology. The research directions include stress monitoring [11,12], damage estimation [13,14], crack positioning imaging [15,16,17], temperature influence, and correction [18,19,20].
This research focuses on the sound velocity response of concrete mechanical behavior under load [21]. Laboratory sample tests are a common method to obtain the ultrasonic coda wave characteristics of concrete under stress. In the process of uniaxial step-by-step compression, the coda wave velocity first slowly increases with the increase in the stress level and then decreases sharply due to the intensified damage [22]. For the multi-cycle loading test, after each unloading, the initial wave velocity of re-compression continues to decrease, reflecting the increase in the degree of internal damage to the concrete [23]. Considering the influence of the number of cycles, the slope of the wave velocity load (stress) function can be used to characterize fatigue damage, which increases with the number of cycles [24]. In the short-time fixed-loading experiment, the wave velocity change increases with increasing fixed-loading time [25]. On the other hand, under the action of tensile stress, the wave velocity decreases with the increase in stress; during the loading and unloading processes, the attenuation of the velocity continues to accumulate [26]. To realize the application of CWI technology in real-world engineering monitoring, the coda wave test was performed on real-size reinforced concrete components, and more attention was given to obtaining local acoustic velocity changes through a reasonable sensor layout. A four-point bending test of reinforced concrete T-beams demonstrated that the coda wave velocity can detect changes in compressive and tensile stresses and accurately locate the position of the neutral axis [27]. A 16-ton truck was used to carry out on-site load measurement of an old box girder bridge that had never been put into use. The results show that the coda wave velocity changes obtained by different sensor combinations can detect the position of the truck to varying degrees [28].
The above experimental results qualitatively explain the characteristics of concrete ultrasonic coda waves, but the experiment volume was limited by the research cost. Numerical simulations can perform a large number of simulation calculations on concrete load conditions and damage conditions by adjusting parameter settings, and can effectively eliminate the adverse effects of environmental factors. It is an effective tool for analyzing and interpreting the CWI features of concrete. Using the two-dimensional finite-difference time-domain model within the framework of the locadiff imaging technique, the extended changes in multiple scattering media characterized by coda wave decorrelation can be calculated [29]. A 2D spectral element method was applied to simulate complex coda signals to study the sensitivity of nonlinear coda interference parameters of samples with local damage, and the research scale was gradually refined: the effective elastic characteristics of the sample, the local crack area, and the effective length of the microcrack [30,31,32]. In order to explore the susceptibility of the coda wave to various damages in the concrete failure process at the micro-scale, a research system of concrete mesostructure generator discrete element calculation of concrete fracture finite-difference simulation of the ultrasonic field was constructed [33].
To date, relevant scholars have achieved good results in research on establishing the relationship between ultrasonic coda wave characteristics and concrete stress or damage. Larose performed linear regression on the data of coda wave relative velocity change and stress change and defined the estimated value of the nonlinear parameter with an estimation accuracy of 5% for this parameter [8]. Schurr used the acoustoelasticity constant and nonlinear elastic parameters to estimate the damage degree and proved the two parameters of the damaged samples are typically multiple times higher than those of the damaged samples [24]. Hafiz used magnitude-squared coherence to evaluate stress change versus ultrasonic waveform change and obtained a test constant as a measure of the sensitivity by linear regression [34]. Clauß derived the correlation between ultrasonic coda wave relative velocity changes and reinforcement strains, covering 90% of the complex load-bearing behavior in reinforced concrete members, and demonstrated a feasible method for evaluating structural state objectives using ultrasonic coda wave characteristic parameters [35].
Existing studies have qualitatively analyzed the characteristics of ultrasonic coda waves in the development process of loaded concrete damage. The research objects are mainly concrete strength (C30–C50) samples commonly used in practical engineering [11,22,23,25]. In this paper, through laboratory experiments and numerical simulations, the correlation between the damage degree of concrete and the ultrasonic coda wave velocity under uniaxial load was studied. A high-strength concrete (C60–C70) ultrasonic coda wave test group was set up to broaden the research scope. Based on the variation curve of concrete coda wave velocity with the percentage of maximum load, a mathematical formula for evaluating concrete damage was fitted. The uniaxial compression simulation model established by this discrete element method can clarify the damage and failure mechanism of concrete. The ultrasonic field simulation model based on digital image processing technology, as an attempt to quantify the relationship between the damage degree and coda wave velocity change rate, provides a feasible platform for further research.

2. Experimental Study

2.1. Test Specimen

This test requires concrete test blocks of 100 mm and 150 mm cubes. The cement material is ordinary Portland cement. The fine aggregate is the finished river sand (2.8 mm), which has not been screened again, and the gradation curve cannot be provided. The coarse aggregate is continuous graded basalt crushed stone (5–10 mm), and the proportion of each particle size will be illustrated in Section 4.1.1. Based on relevant engineering practical experience and specifications, the material mix ratio of the concrete selected in this paper is shown in Table 1.

2.2. Test Device and Coda Wave Test Parameters

The equipment required for the test includes a pressure loading system and an ultrasonic coda wave test system, as shown in Figure 1. The pressure loading system is a YAN-2000 electrohydraulic servo pressure testing machine (Jinan Dongtest Testing Machine Technology Co., Ltd., Jinian, China). The ultrasonic coda wave test system consists of a signal generator, sensor, oscilloscope, signal amplifier, and corresponding signal lines (33522B arbitrary function generator, DSOX2014G dual-channel color digital oscilloscope, Keysight Technologies, USA. Sensor, 25K-P28F, 50K-P28F, 100K-P40F, 0.25P-40F, Guangdong Goworld Co., Ltd., Shantou, China).
During the implementation of the test, in order to reduce the friction between the concrete and the steel plate of the press, lubricating oil was applied to the end face of the test sample. The contact surface of the sample was polished and then coated with couplant. A rubber sleeve was used to fix the ultrasonic probe. Finally, the probe and the sample were squeezed to remove air, so that the two items were in full contact to ensure the testing effect.
The pre-experiment was carried out under no-pressure conditions to determine the relevant parameters of the ultrasonic coda wave test, namely the ultrasonic excitation frequency (50 kHz, 100 kHz, 250 kHz), the ultrasonic excitation voltage (1 V, 5 V, and 10 V), and the ultrasonic test path length (100 mm and 150 mm, which is the size of the concrete sample). Using the control single-variable method, the original waveforms of the corresponding parameter conditions are shown in Figure 2. The degree of ultrasound scattering in concrete is related to its frequency; usually, lower frequencies correspond to weak scattering. Therefore, the original waveform corresponding to the 50 kHz excitation frequency has a larger amplitude and a longer waveform duration, which is convenient for data processing and analysis. Similarly, the excitation voltage and sample size were determined to be 10 V and 100 mm, respectively. The optimal parameters determined above were used in subsequent ultrasonic wake wave tests and numerical simulation studies: ultrasonic excitation frequency (50 kHz), the ultrasonic excitation voltage (10 V), and the ultrasonic test path length (100 mm, i.e., the concrete sample is a 100 × 100 × 100 mm cube).

2.3. Loading Plan and Coda Wave Test Process Control

Uniaxial loading was performed at a rate of 2 kN/s and in steps of 20 kN. The load was fixed for 40 s for every 20 kN increase, and the process continued until the design load of the concrete specimen was reached. To prevent the rupture of the concrete from damaging the sensor probe, 75% of the average axial compressive strength of the concrete of each strength was taken as the maximum load of the corresponding test, as seen in Table 2.
The ultrasonic coda wave test used pulse waves as the source signal. Before the start of the test, the parameters of instruments were adjusted. Before loading, the ultrasonic coda wave test system was started, and the waveform u 0 ( t ) at the moment of 0 kN was recorded. When the load reached 20 kN, the pressure remained constant for 40 s, and signal u 1 ( t ) was recorded at 30 s. Then, the ultrasonic signal u i ( t ) ( i 1 ) was recorded for every 20 kN increase in the load. The loading step and data acquisition control are shown in Figure 3 (taking the C40 concrete specimen as an example), and the loading and ultrasonic test process is shown in Figure 4.
Concrete loading and ultrasonic coda wave tests were performed at a stable room temperature (26 °C), and the experimental time was relatively short; thus, it was considered that environmental factors had little influence on the experimental results [8,18,19]. It is worth noting that the creep effect of concrete is unavoidable during the experiment. However, compared with concrete stress damage, the degree of change in ultrasonic coda wave velocity caused by creep is not significant [26]. Therefore, this study did not analyze this aspect.

2.4. Coda Wave Test Data Processing

The existing CWI data processing methods include the doublet technique (DT) and the stretching technique (ST). The calculation results of the DT method vary with the selected time window. In contrast, the ST method can process the entire waveform to obtain more consistent results that are also closer to the actual situation [9]. Therefore, this paper adopts the ST method to analyze the signal of the ultrasonic coda wave. Although the stretching technique eliminates the time dependence, the corresponding velocity change is the average of the entire propagation period, so the wave velocity sensitivity is slightly reduced. To solve this problem, a stepwise CWI method was introduced; that is, only the previous coda wave measurement signal was used as a reference to calculate the stepwise change in acoustic wave velocity [11].
u i ε ( t ) = u i ( t ( 1 + ε ) )
C C i ( ε ) = u i ε ( t ) u i - 1 ( t ) d t ( u i ε ( t ) ) 2 d t ( u i - 1 ( t ) ) 2 d t
ε i = arg max ( C C i ( ε ) ) = d v i v i
d v v ( 1 + ε i ) ( 1 + ε i - 1 ) ( 1 + ε 1 ) 1
The collected waveforms of the two different loads before and after are u i - 1 ( t ) ( i 1 ) and u i ( t ) . First, the stretching processing is performed in the time domain of u i ( t ) to obtain u i ε ( t ) , and the stretching coefficient is ε . Then, when the cross-correlation coefficient C C i ( ε ) calculated by the stretched waveform u i ε ( t ) and the reference waveform u i - 1 ( t ) is largest, the corresponding stretching coefficient ε i is the change rate of the i-th coda wave velocity d v i / v i . Finally, the stepwise wave velocity change value is calculated by the corresponding multiplication to obtain the accumulated relative change of coda wave velocity d v / v .

3. Experimental Results and Discussion

3.1. Waveform Cross-Correlation Analysis

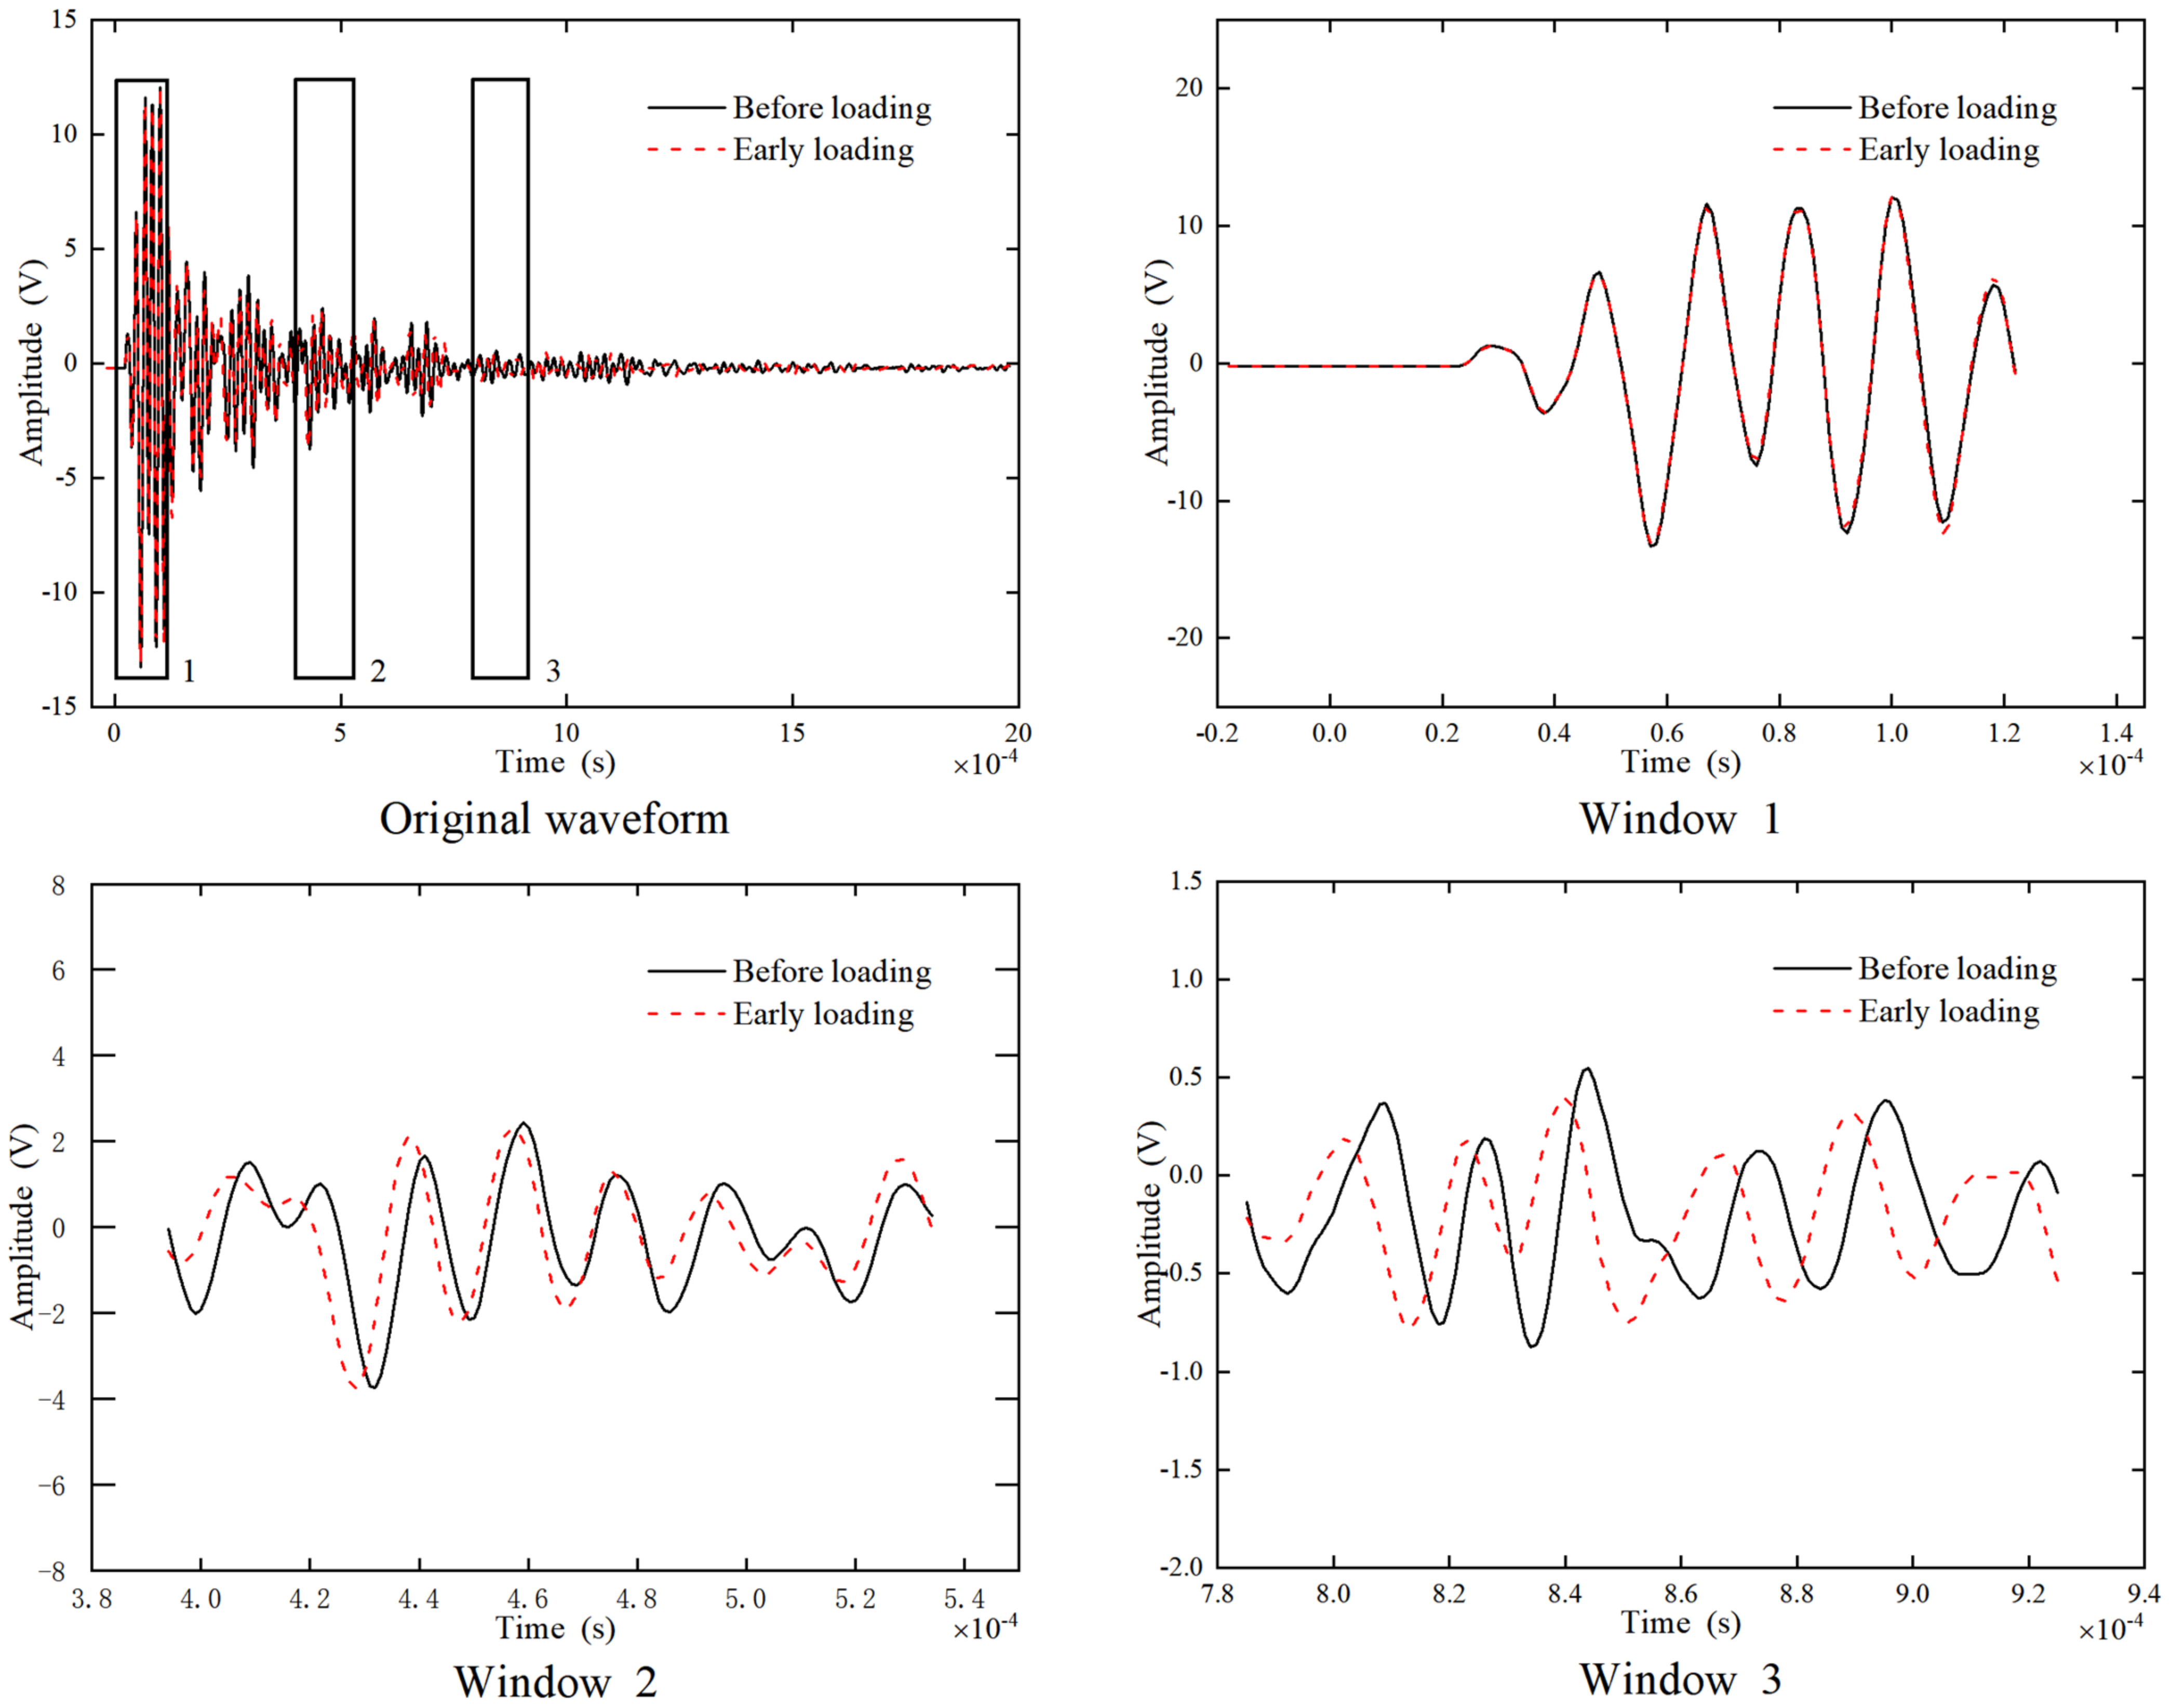
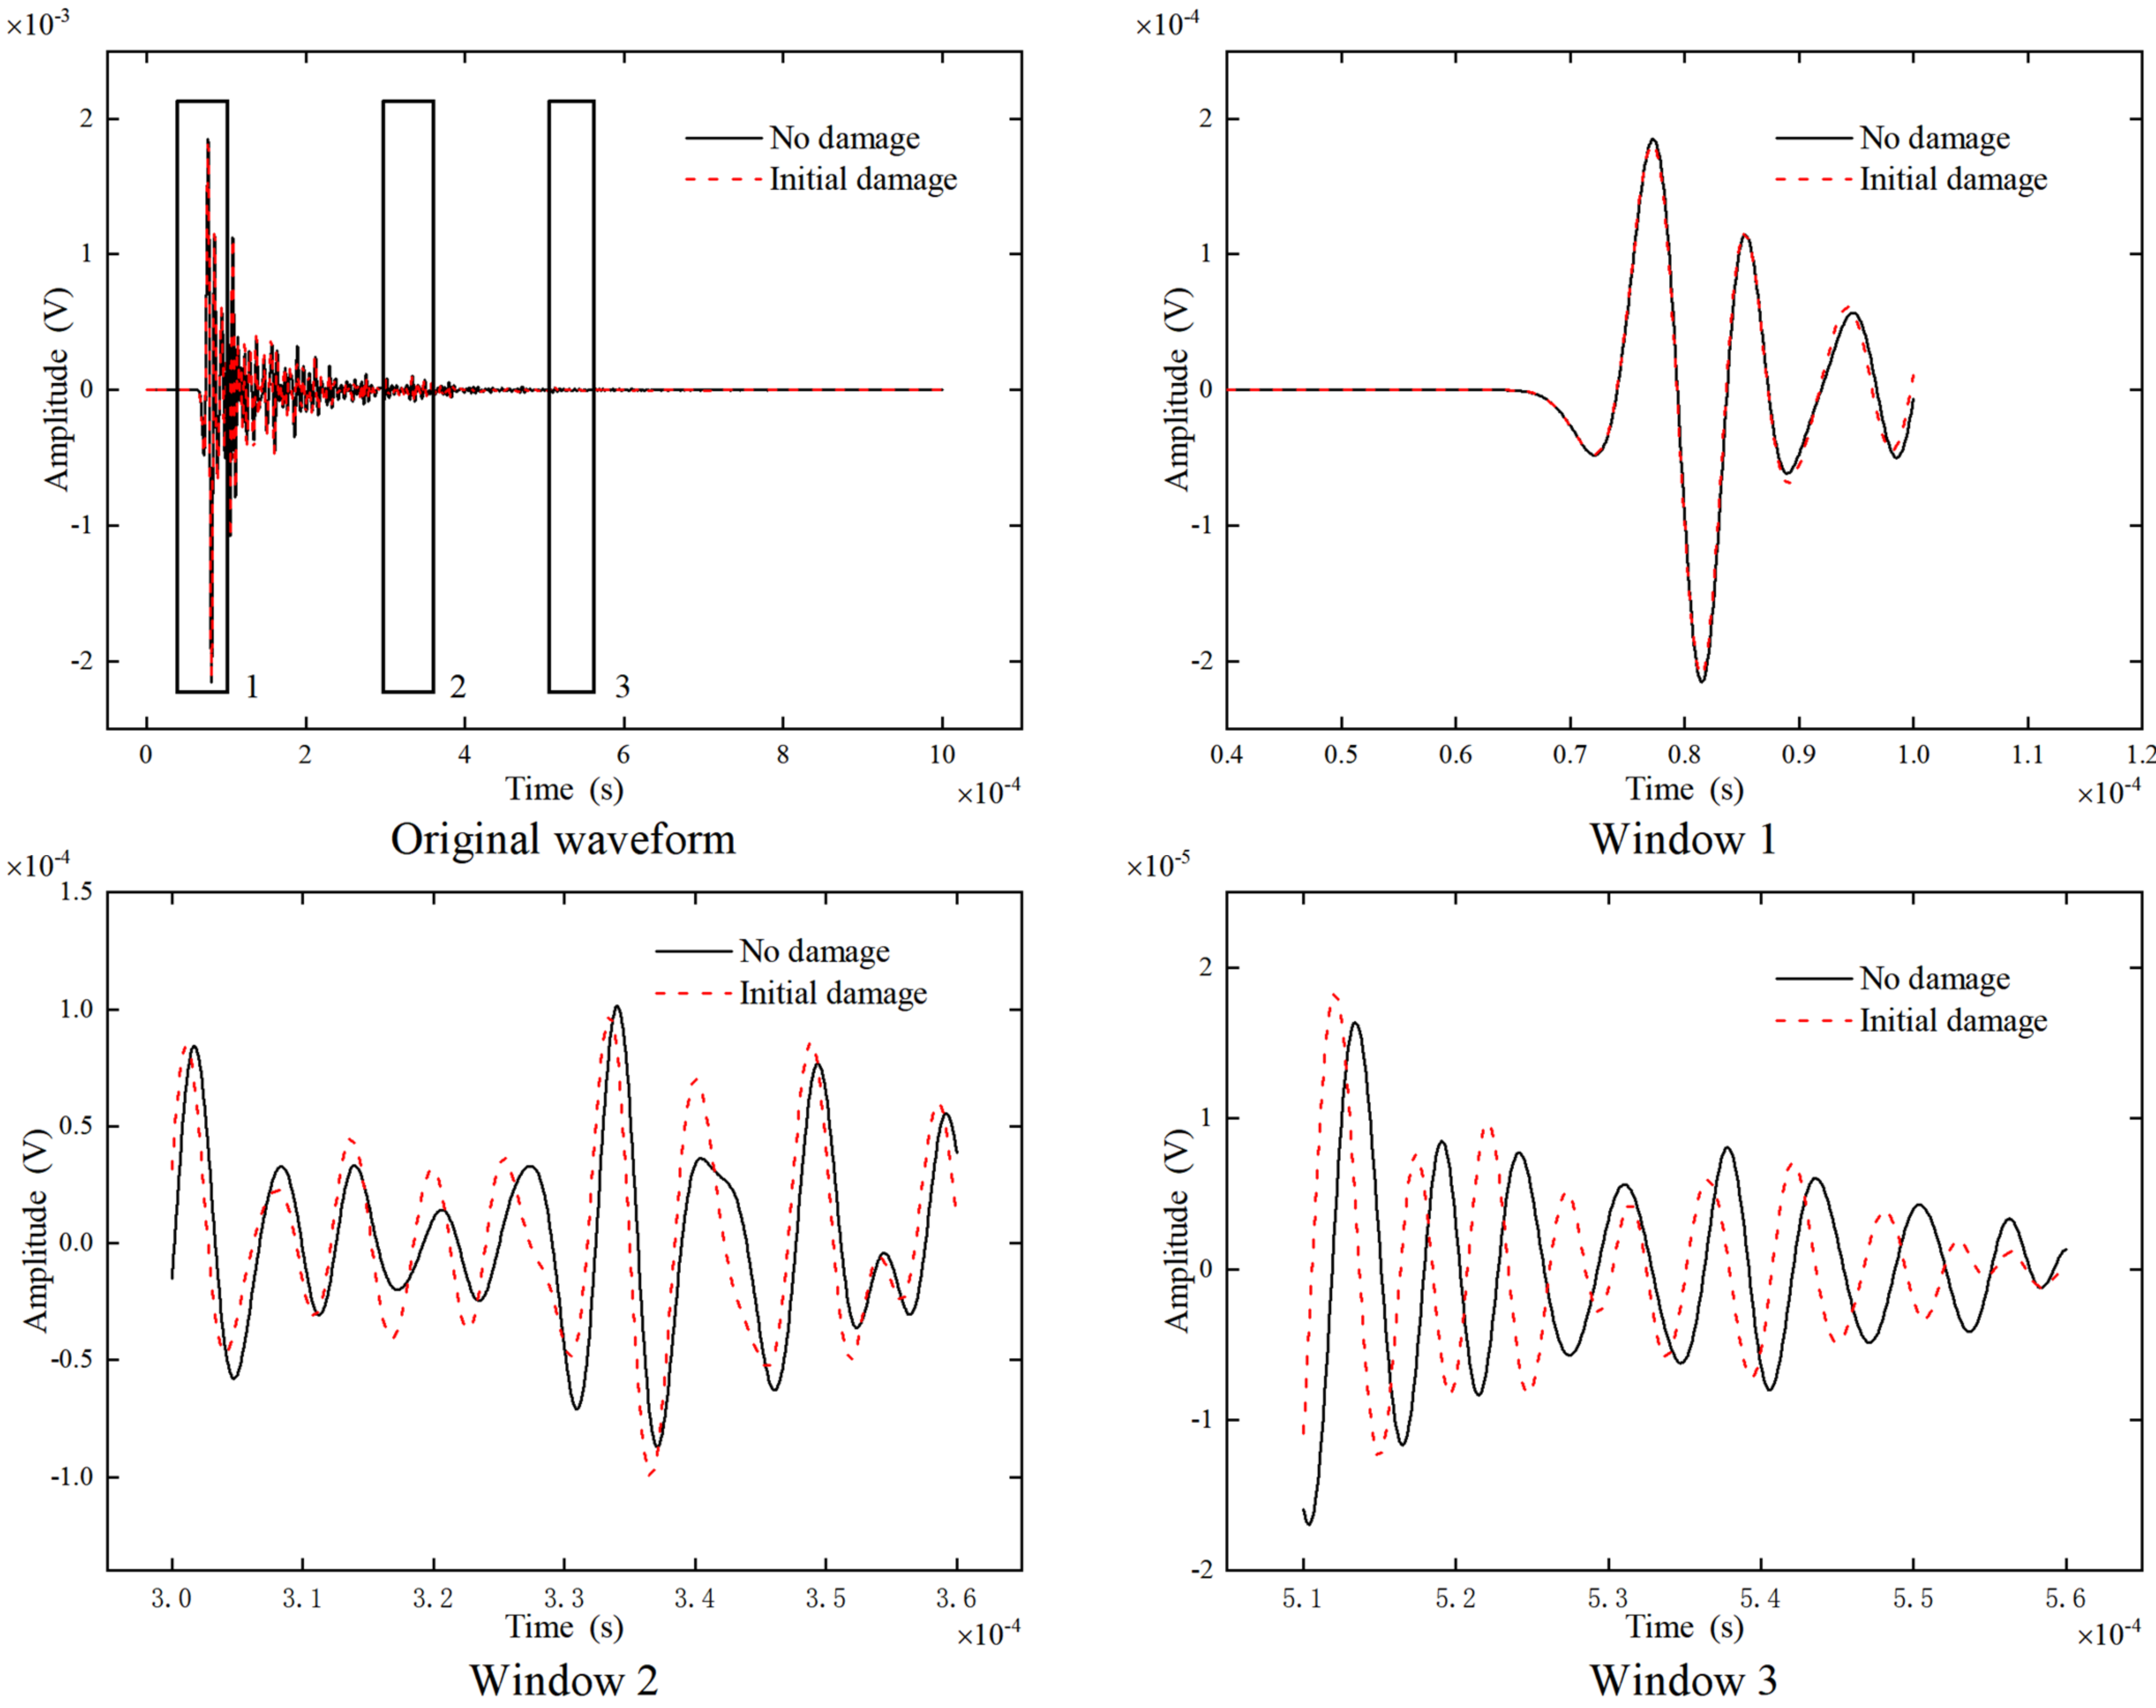
The changes in internal damage of concrete were detected through the coda wave interferometry method, mainly to determine the small difference between the coda wave waveforms before and after the concrete is loaded. A comparison of the received signal waveforms before and at the beginning of loading is shown in Figure 5. In time window 1, the two received signals are completely coincident, which ensures the repeatability of the wave source. In time windows 2 and 3, there is a phase difference between the two signals that gradually increases. Comparing windows 1, 2, and 3 proves that the coda wave is very sensitive to small changes in the random medium of concrete.
The value of the cross-correlation coefficient C C i ( ε ) ranges from 0 to 1. A value of 0 means that the two waveforms are completely uncorrelated; 1 means that the two waveforms are completely the same [23]. 
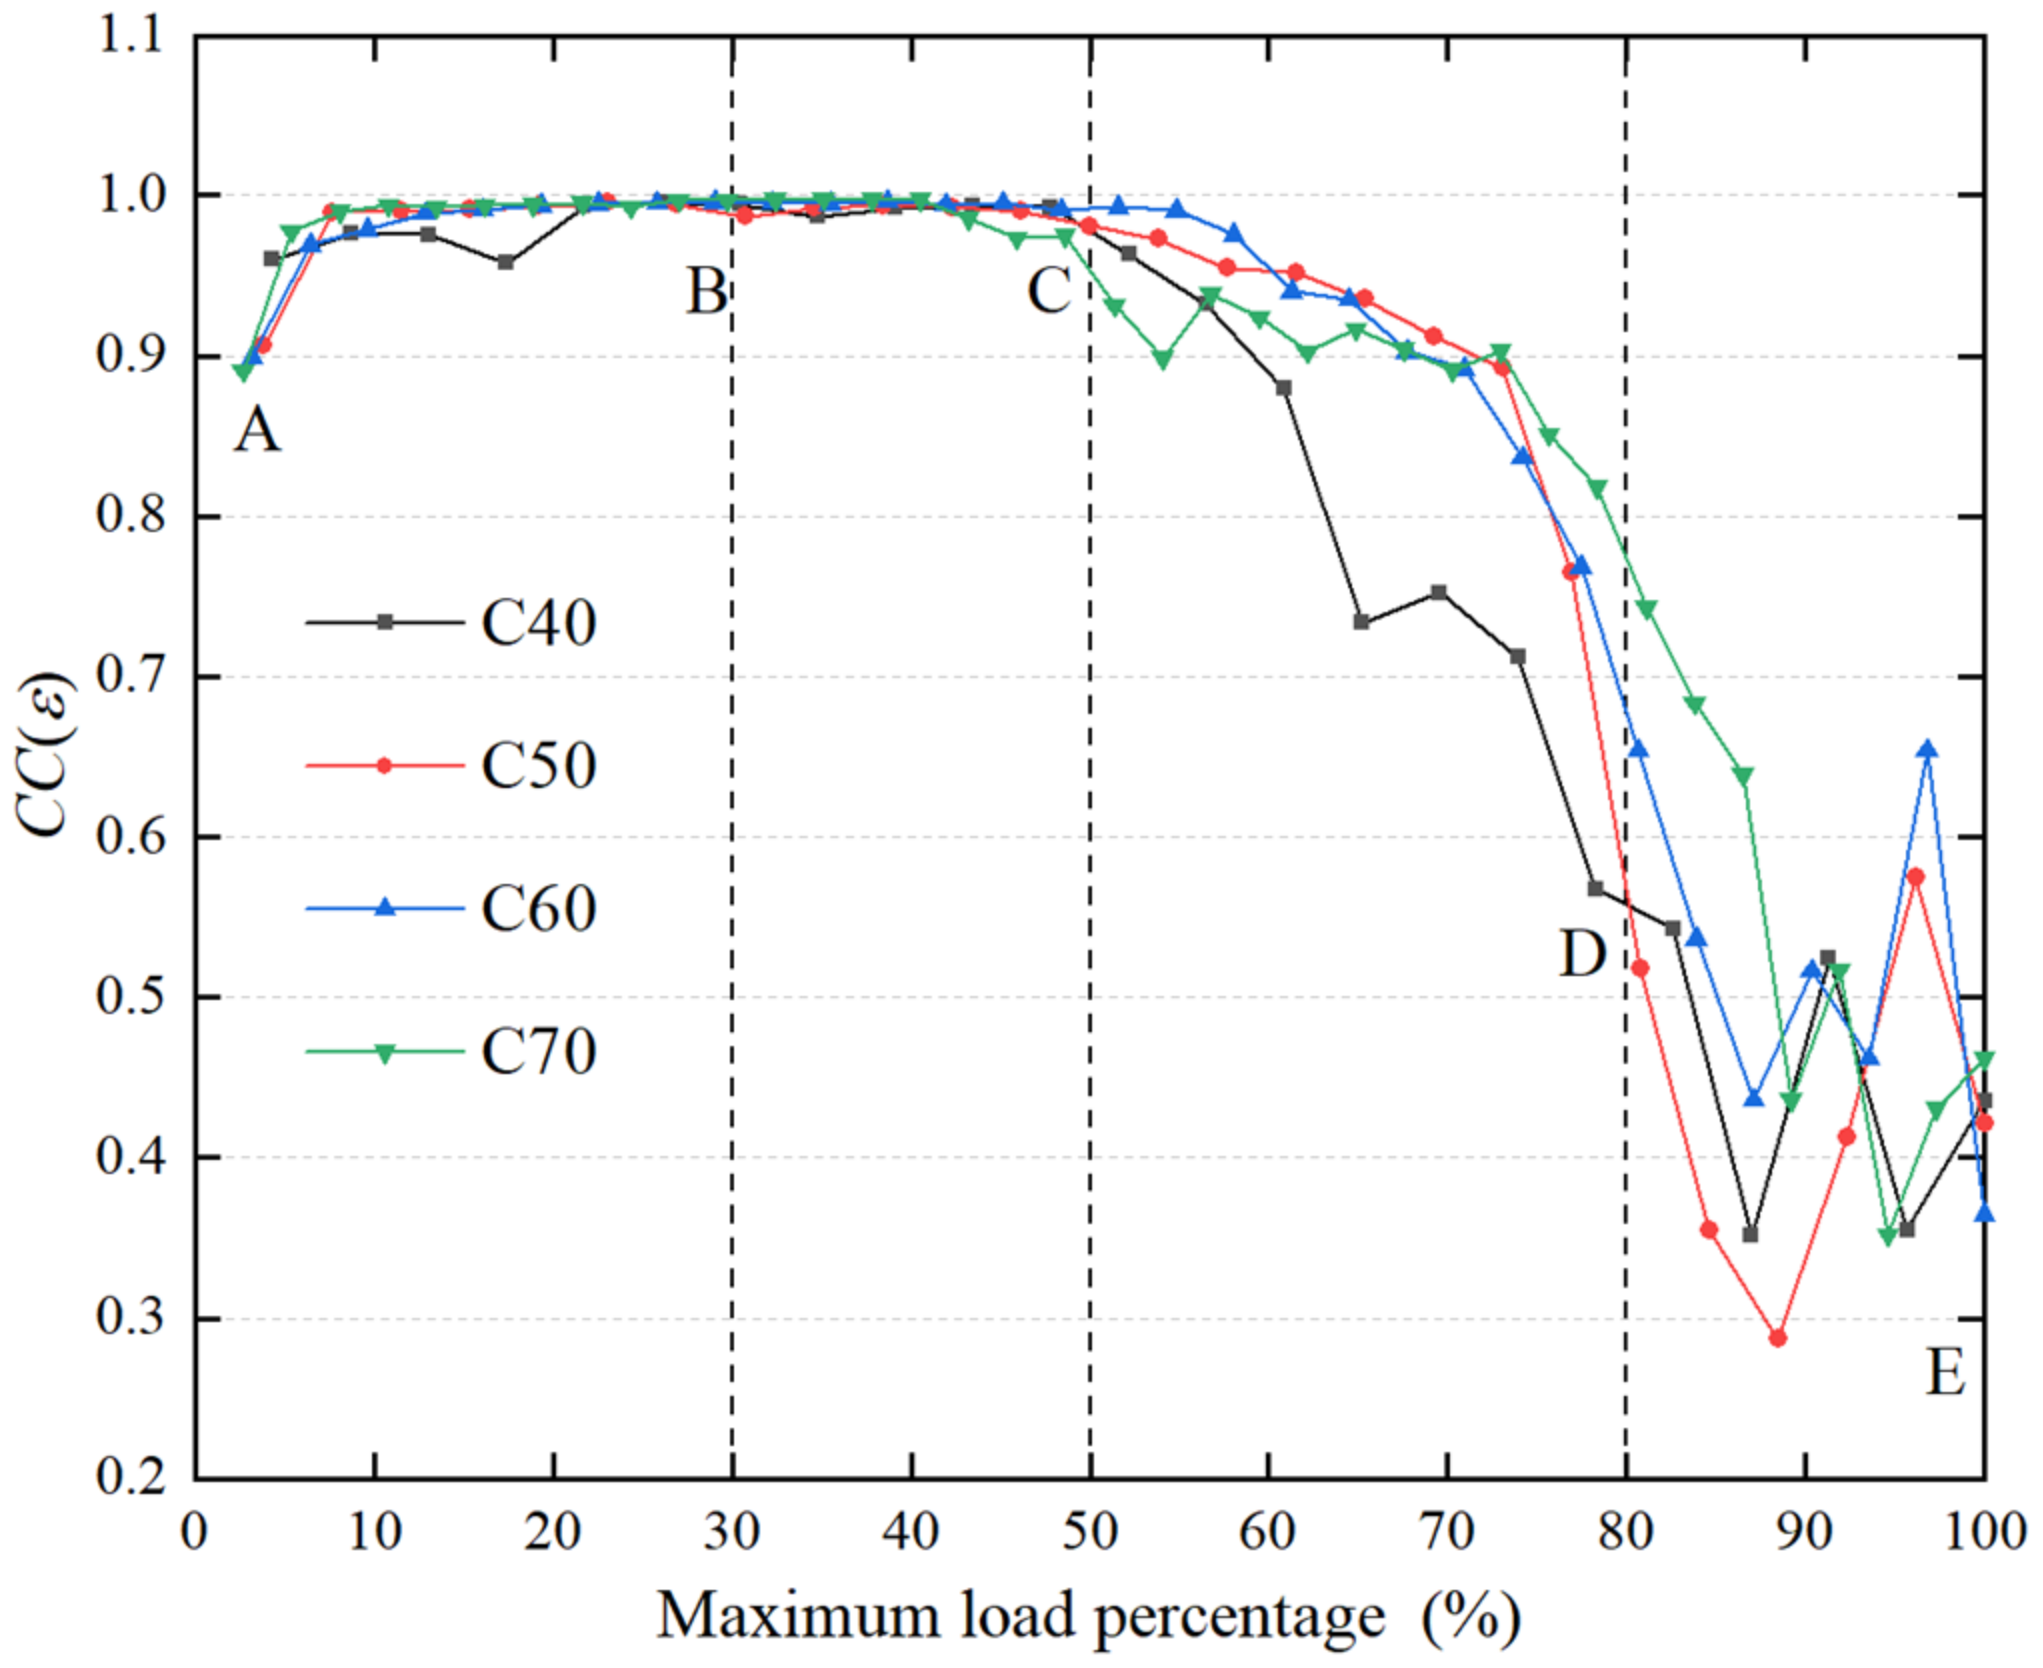
Figure 6 shows the correlation between the coda wave cross-correlation coefficient and the maximum load percentage of the concretes. Within 50% of the maximum load percentage (A–B–C), the correlation coefficient of each concrete is approximately equal to 1, so the corresponding wave velocity change is linear and uniform [36]. When the maximum load percentage is between 50–80% (C–D), the cross-correlation coefficient decreases continuously, indicating that coda wave propagation is strongly affected by the internal damage to the concrete, which causes the waveform to be distorted. As the load exceeds 80% of the maximum load percentage (D–E), the cross-correlation coefficient exhibits a larger range of fluctuations based on further reduction, indicating that the typical causing of scatter inside the concrete, that is, the cracks, has further widened or linked up.

3.2. Coda Wave Velocity Change Rate Analysis

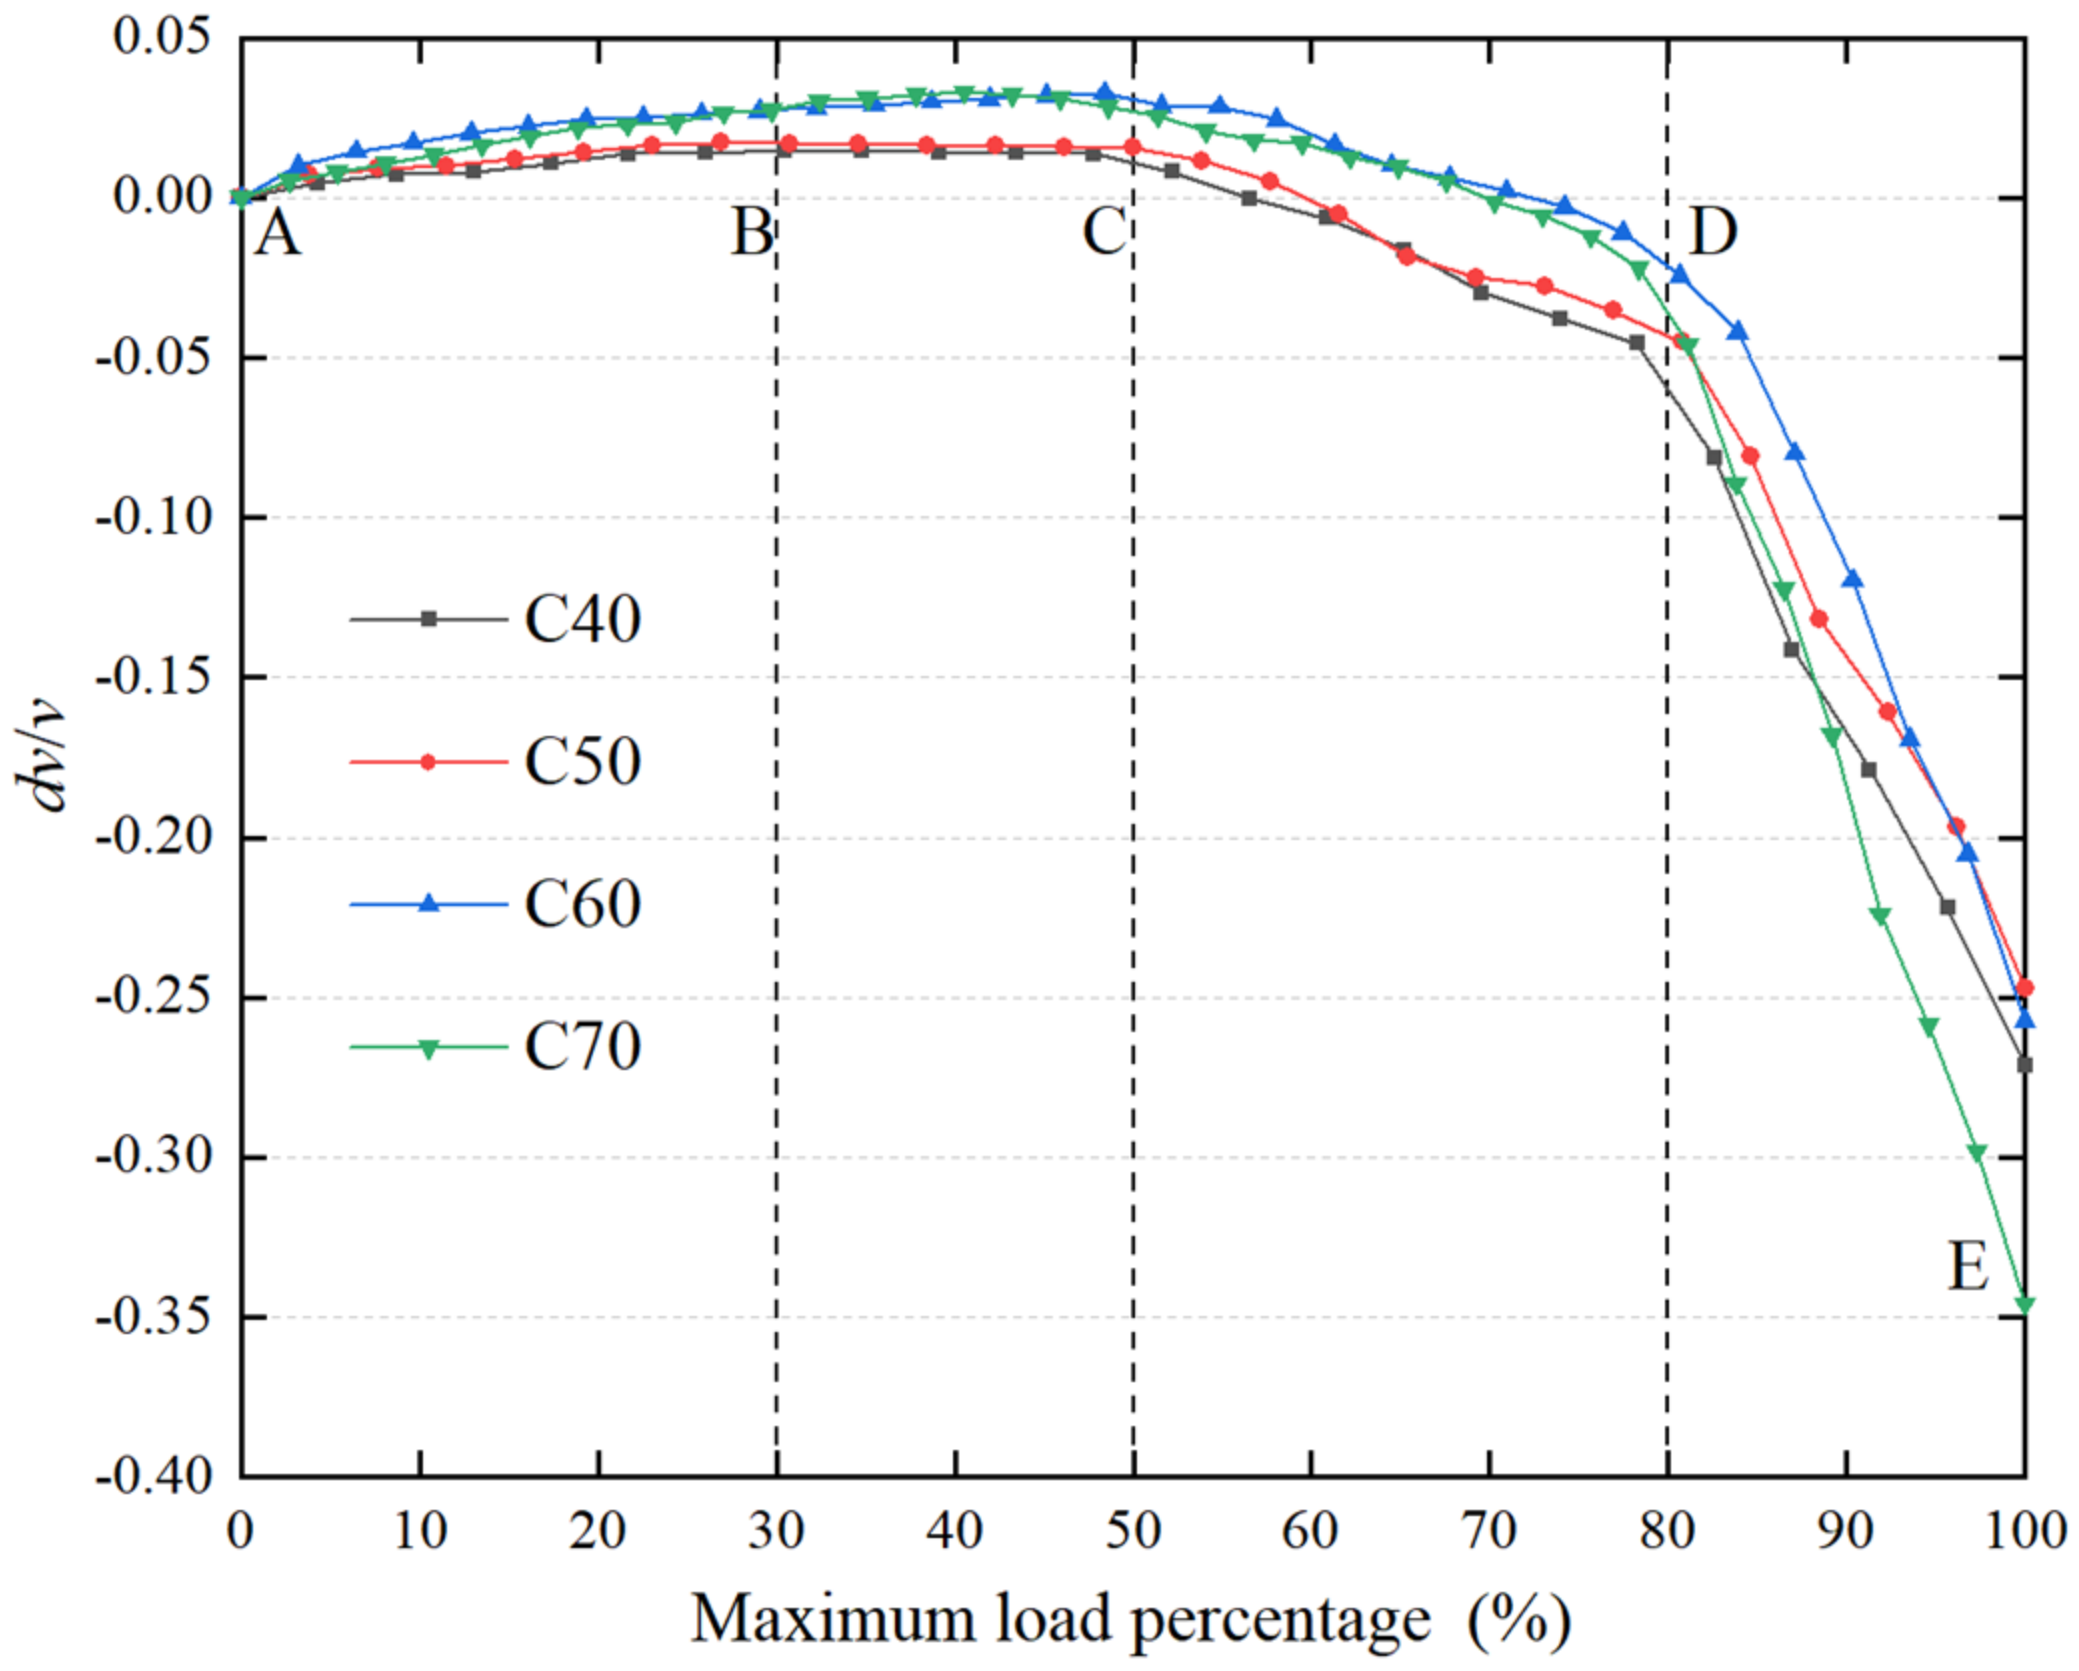
The curves of the maximum load percentage–wave velocity change rate of the four strengths of concrete samples are shown in Figure 7. According to the trend of the changes, the curve can be divided into four parts: strengthening (A–B), stabilizing (B–C), weakening (C–D), instability (D–E).
The strengthening section (A–B) of the curve ranges from 0% to 30% of the maximum load percentage. The coda wave velocity of the concrete sample shows a slowly increasing trend with increasing the load percentage, and the increased speed is negatively correlated with the load increase. This is because, in the early stage of loading, the internal cracks slowly close, making the internal microstructure denser. The stabilizing section (B–C) of the curve ranges from 30% to 50% of the maximum load percentage. The rate of change of the coda wave velocity of the C40 and C50 concrete specimens remained stable. The coda wave velocity changes of C60 and C70 concrete specimens first increase and then tend to be generally stable. It is speculated that within this range, the original microcracks in the concrete are further closed, and at the same time, the material particles are squeezed and elastically deformed. However, with the increase of pressure, the degree of development of internal microcracks may increase slightly. The range of the weakening section (C–D) is approximately 50% to 80% of the maximum load percentage. The wave velocity of the coda wave decreases with the increase of external load. At this time, the closed cracks inside the concrete begin to expand and secondary cracks are generated, causing the wave velocity to drop. The instability section (D–E) ranges from 80% to 100% of the maximum load percentage. In this interval, the coda wave velocities of the four strengths of concrete showed a rapid downward trend with the increase of the load, indicating that the scale of the internal cracks in the concrete continued to increase and gradually connected. Eventually, a macroscopic fracture surface will be formed.
This experiment comprised a coda wave test on a limited number of concrete samples. Due to the complexity and randomness of concrete materials, the relationship between the rate of change of coda wave velocity of uniaxially compressed concrete and its strength grade has not yet been clarified. To complete the research for this aspect, many tests of concretes of various strengths are still needed.

3.3. Coda Wave Velocity Change Rate Fitting

Piecewise linear fitting was performed on the coda wave velocity change curve of the abovementioned concrete uniaxial compression process. The fitting function expression is y = a x + b , where x = F / F max . F is the concrete load value, F max is the concrete ultimate load value, and F / F max is the ratio of the concrete load value to its ultimate load value; that is, the maximum load percentage. The notations a and b are constants. The curve fitting results of four kinds of concrete coda wave velocity change rates are shown in Table 3. The fitting effect of C70 concrete is poor when the load level is in the range of 30–50% of the maximum load (R2 = −0.10323). The data show a trend of increasing first and then decreasing. The poor fitting effect is mainly due to the large difference between the maximum value and the minimum value of the data in this group (the difference is equal to 0.00469). However, as shown in Figure 7, the general trend in this section is the same as that of C60 concrete. It is speculated that the dispersion of the existing data is caused by the complexity of the test material and the deviations in the operating process.
Combined with Table 3, a mathematical formula for concrete damage under uniaxial compression based on the rate of change in coda wave velocity is constructed:
d v v = a 1 F F max + b 1 0 < F F max 30 % a 2 F F max + b 2 30 % < F F max 50 % a 3 F F max + b 3 50 % < F F max 80 % a 4 F F max + b 4 80 % < F F max 100 %
In the above formula, a i is the slope of the fitted straight line for each interval. Considering the discreteness of individual data, the overall law of the experiment is 0 < a 1 < 0.1 , a 2 0 , - 1 a 3 < 0 , and a 4 < 1 . b i is a constant and depends on the strength of the concrete.

4. Numerical Simulation

4.1. Numerical Simulation of Damaged Concrete under Uniaxial Compression

4.1.1. Concrete Model Establishment

In the particle discrete element program, clump theory is used to overlap most particles to form an irregularly shaped aggregate. It is a rigid body that will not break under the action of external force and always maintains a complete shape [37,38]. Therefore, it is feasible to use irregular clump bodies to simulate the real coarse aggregates in concrete when establishing the PFC2D model (PFC software: Particle Flow Code, Copyright Itasca Consulting Group, Inc. PFC Version 5.0, last updated 24 June 2016.)
First, a picture of the coarse basalt aggregate was taken (Figure 8a), closed multiline segments were used to outline the boundary of the aggregate, and 21 types of coarse bone particle patterns were finally selected. The abovementioned particle geometry model was imported into the software to generate a clump template, which represents the real coarse aggregate. The contact model between particles was defined as a parallel bonding model in which there are forces and moments between the particles. This feature is consistent with the material stress on the inside of the structure when the actual concrete is under pressure. The boundary wall was generated according to the size of the concrete sample, and then the “distribute” command was used in the wall area to randomly generate the set size particle unit to represent the mortar. Subsequently, clump bodies are generated randomly in the corresponding particle size gradation range, as shown in Figure 8b. In this paper, the “solve aratio” command in PFC2D is used to make the initial sample reach the equilibrium state. The aratio (or average ratio) is the ratio of the average value of the unbalanced force magnitude (i.e., the magnitude of the sum of the contact forces, body forces, and applied forces) on overall bodies to the average value of the sum of the magnitudes of the contact forces, body forces and applied forces on overall bodies. In this simulation, the value of aratio is set to 1e-4. In the enclosed space surrounded by the surrounding walls, the particles are calculated to an equilibrium state, and the unbalanced force gradually decreases, making aratio less than 1e-4, which has no impact on the subsequent calculation. The specimen is not consolidated; in other words, the initial pressure is 0. The voids in the concrete c in the equilibrium state are all distributed, and there is a certain contact between the particles, as shown in Figure 8c.

4.1.2. Calibration of the Meso-Parameters of the Concrete Model

In this paper, five meso-parameters, namely the elastic modulus E c , stiffness ratio k n / k s , friction coefficient μ , parallel bond normal strength σ ¯ c , and parallel bond tangential strength τ ¯ c , are calibrated. Using the control single variable method, the changes in the peak strength and damage failure mode of concrete caused by the change of meso-parameters of each particle are discussed. After the values of each meso-parameter are tested, the parameter set that best matches the stress–strain curve obtained from the experiment is selected. This chapter presents the established numerical model of C40 concrete specimen, and the discussion values and final simulation values of each particle meso-parameter are shown in Table 4.
The uniaxial compression simulation results of the C40 concrete sample were compared with the test results. The main mechanical parameters are shown in Table 5. Figure 9 shows that before the concrete reaches the peak stress, the experimental and simulated stress–strain curves are almost the same, but there is a clear difference in the stress softening stage. Compared with the experimental value, the simulated curve yields and decreases earlier. The main reason is that the two-dimensional model used in the simulation cannot truly reflect the three-dimensional compression situation. The experimental and simulated values are very close, and the deviation is small. Figure 10 shows that the concrete failure modes obtained by the uniaxial compression experiment and PFC2D simulation are the same; both are “C”-shaped crack fracture zones.

4.1.3. Numerical Simulation Results of Concrete Uniaxial Compression

Using the abovementioned concrete uniaxial compression simulation model, the development process of concrete internal cracks is obtained, as shown in Figure 11. At the initial stage of loading, the particle stress level in the model is low, and a small number of particles gradually generate microcracks. Early damage occurs between the coarse aggregate and small particle mortar on the upper bearing surface and the middle of the model. Subsequently, stress redistribution occurs in the concrete sample, and the stress concentration phenomenon is easily formed in the place where the microcrack occurs, which intensifies its continuous expansion. As the load further increases, the original cracks at the interface between the aggregate and the mortar, as well as inside the mortar, will extend, while many new cracks will appear at the interface of other aggregates. When peak stress is reached, displacement of the block under the action of external force is increased so that the local cracks become fully expanded and linked up, forming evident macroscopic cracks.

4.2. Ultrasonic Field Simulation Based on Damaged Concrete Images

4.2.1. Ultrasonic Field Model of Damaged Concrete

  • Ultrasonic field setting
Based on the existing elastic wave equation, the first-order velocity–stress equation of the two-dimensional acoustic wave equation is derived, namely:
P t = λ v x x + v z z ρ v x t = P x ρ v z t = P z
where P is the sound pressure, ρ is the density of the particle, t is the time, λ is the Lame constant, and v x and v z are the velocity components of the particle vibration in the x and z directions, respectively.
The finite-difference time-domain method is used to solve the above equation to simulate the propagation of ultrasonic waves in concrete. The receiving boundary of the concrete model is set as the total reflection boundary, and the other boundaries are set as the perfect matching layer (PML) absorbing boundary [39,40]. The source excitation waveform is the Ricker wavelet, and the seismic source is loaded on the center of the upper surface of the concrete model as a point source.
  • Digital image processing
Digital image processing [41,42] was performed on concrete images with different damage degrees obtained in the numerical simulation of concrete damage under uniaxial compression in Section 4.1. In a grayscale image, the brightness of different colors represents a grayscale value, which can be divided into values from 0 to 255. The higher the grayscale value, the lighter the color. Figure 12a is the damage image of 100% concrete ultimate strength calculated by uniaxial compression simulation and Figure 12b is the corresponding grayscale damage image.
  • Threshold segmentation and assignment
The image is segmented according to the difference in gray value, where gray 0 represents aggregate, gray 255 represents fracture, and other gray values represent mortar. Image units of the same brightness are assigned the same number, and the wave velocity and density are assigned to the corresponding numbered image areas. The actual physical parameters of the different grid materials are assigned in the model; that is, the wave speed of mortar is set to 4000 m/s and the density is 2073 kg/m3; the wave speed of aggregate is set to 5500 m/s and the density is 2760 kg/m3; the wave speed of air is 340 m/s and the density is 1200 kg/m3. After multi-threshold segmentation is performed on the grayscale damage grayscale images of 0% and 100% concrete ultimate strength, the velocity assignment statistics can be obtained, as shown in Figure 13. The concrete numerical model after wave velocity assignment is shown in Figure 14.

4.2.2. Analysis of the Ultrasonic Field of Damaged Concrete

Twenty-four concrete images with different damage degrees were selected to carry out the numerical simulation of the ultrasonic field of the damaged concrete. Since the lateral boundaries of the 2D concrete model are simplified as PML absorption boundaries, the simulated coda signal is very weak. Figure 15 shows the comparison diagram of the ultrasonic signal of the concrete non-damage and the initial damage models; the corresponding load value is about 10% of the maximum load. Comparing the waveforms in time windows 1, 2, and 3, the two waveform signals in window 3 have an obvious phase difference, indicating that the coda wave is very sensitive to the slight changes in the concrete random medium. The waveform signal comparison chart obtained by simulation and experiment showed similar characteristics, which proved the credibility of ultrasonic field simulation.
The coda wave signal of 24 concrete models with different damage degrees was processed by the stretching technique, and the corresponding coda velocity change rate was calculated, as shown in Figure 16. The change rate of the coda wave velocity measured in the experiment is roughly the same as the change rate of the coda wave velocity obtained by the ultrasonic field simulation. However, the numerical simulation result of the ultrasonic field is slightly larger than the actual test result. It is speculated that the reason may be that the concrete simulation model is simplified to two dimensions, and the boundary condition settings are also different from the real boundary.
The load percentage is in the range of 30–100%, and the wave velocity change trend of simulation and experiment is roughly the same. However, there is a large difference between the two in the load percentage of 0–30%. The main reason is that the uniaxial compression damage simulation of concrete based on the PFC2D discrete element method cannot simulate the process of concrete compaction during the initial compression stage in the test. Table 6 compares the fitting slope of the wave velocity curve calculated by the simulation with the test results. In the 0–30% interval, as mentioned earlier, the difference between the two is mainly caused by the deficiencies of the simulation calculation software. In the load range of 30–50%, the slope of the two still has a large deviation. However, the curve corresponding to the range of 30–40% tends to be horizontal, and the calculated slope is −0.00821, which conforms to the law of the fitting formula. In the 50–80% and 80–100% sections, the simulation, experiment, and fitting formulas all show a high degree of agreement. In general, the numerical simulation results are consistent with the experimental results, which proves the feasibility of monitoring concrete damage using the fitting formula of the coda wave velocity change rate and the maximum load percentage of concrete under uniaxial compression.

5. Discussion

In this paper, four types of concrete test blocks, namely C40, C50, C60, and C70, were tested under uniaxial compression to study the coda wave velocity changes during the damage process in concrete of different strengths. The stretching technique was used to analyze the ultrasonic coda signal of concrete with different strengths of concrete under uniaxial stepwise compression. Both the correlation coefficient and the rate of change of coda wave velocity can reflect the internal damage degree of concrete under load. According to the slope of the rate of change of coda wave velocity, the relationship curve between the rate of change of coda wave velocity and the percentage of maximum load during uniaxial compression can be divided into four sections: strengthening, stabilizing, weakening, and instability. The turning points of adjacent sections are 30%, 50%, and 80% of the maximum load percentage. A concrete damage fitting formula based on the relationship between the rate of change of the coda wave velocity and the percentage of the maximum load under uniaxial compression is established. The slope of the coda wave velocity change rate is greater than or close to 0, the internal microcracks in the concrete are closed, and the particles are squeezed and deformed. The slope of the coda wave velocity rate change between −1 and 0 indicates that the initial concrete cracks are propagating and new cracks are initiating and developing. When the slope of the coda wave velocity change rate is less than −1, the internal cracks of the concrete will be connected and link up, then the block will slide under the action of external force, causing macroscopic rupture. It is worth noting that within the scope of this study, no clear relationship between the ultrasonic coda wave signal characteristics of uniaxially compressed concrete and its intensity level was found. Due to the discrete nature of concrete materials, a lot of experimental research is still needed on this problem.
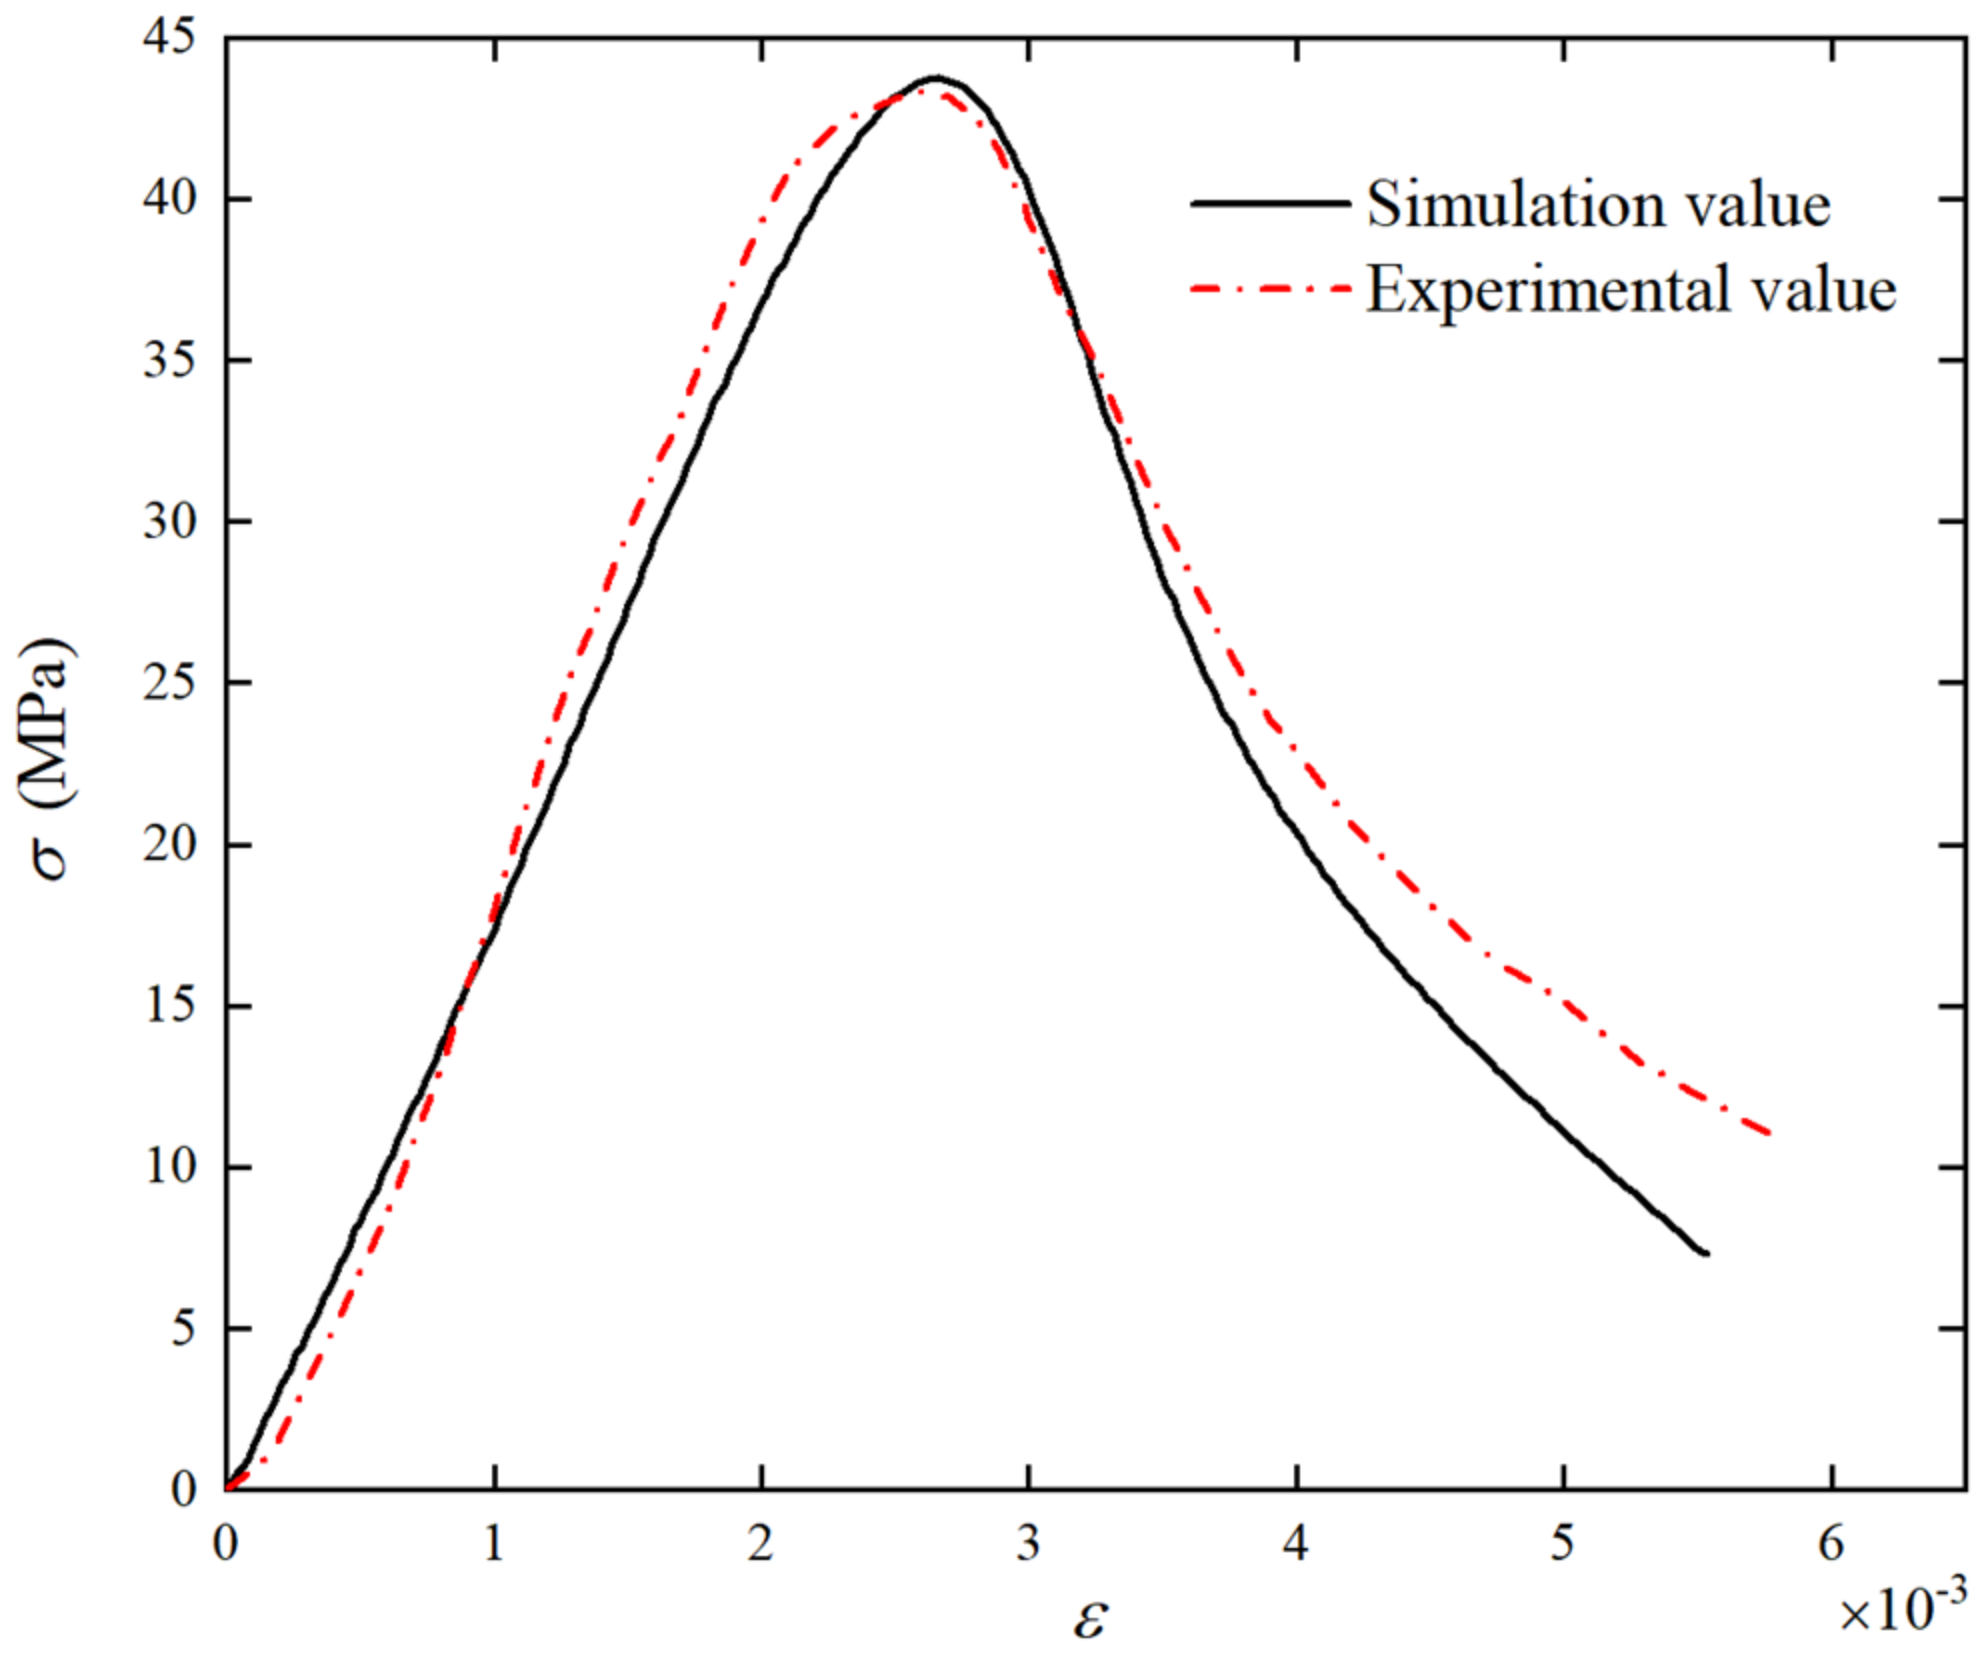
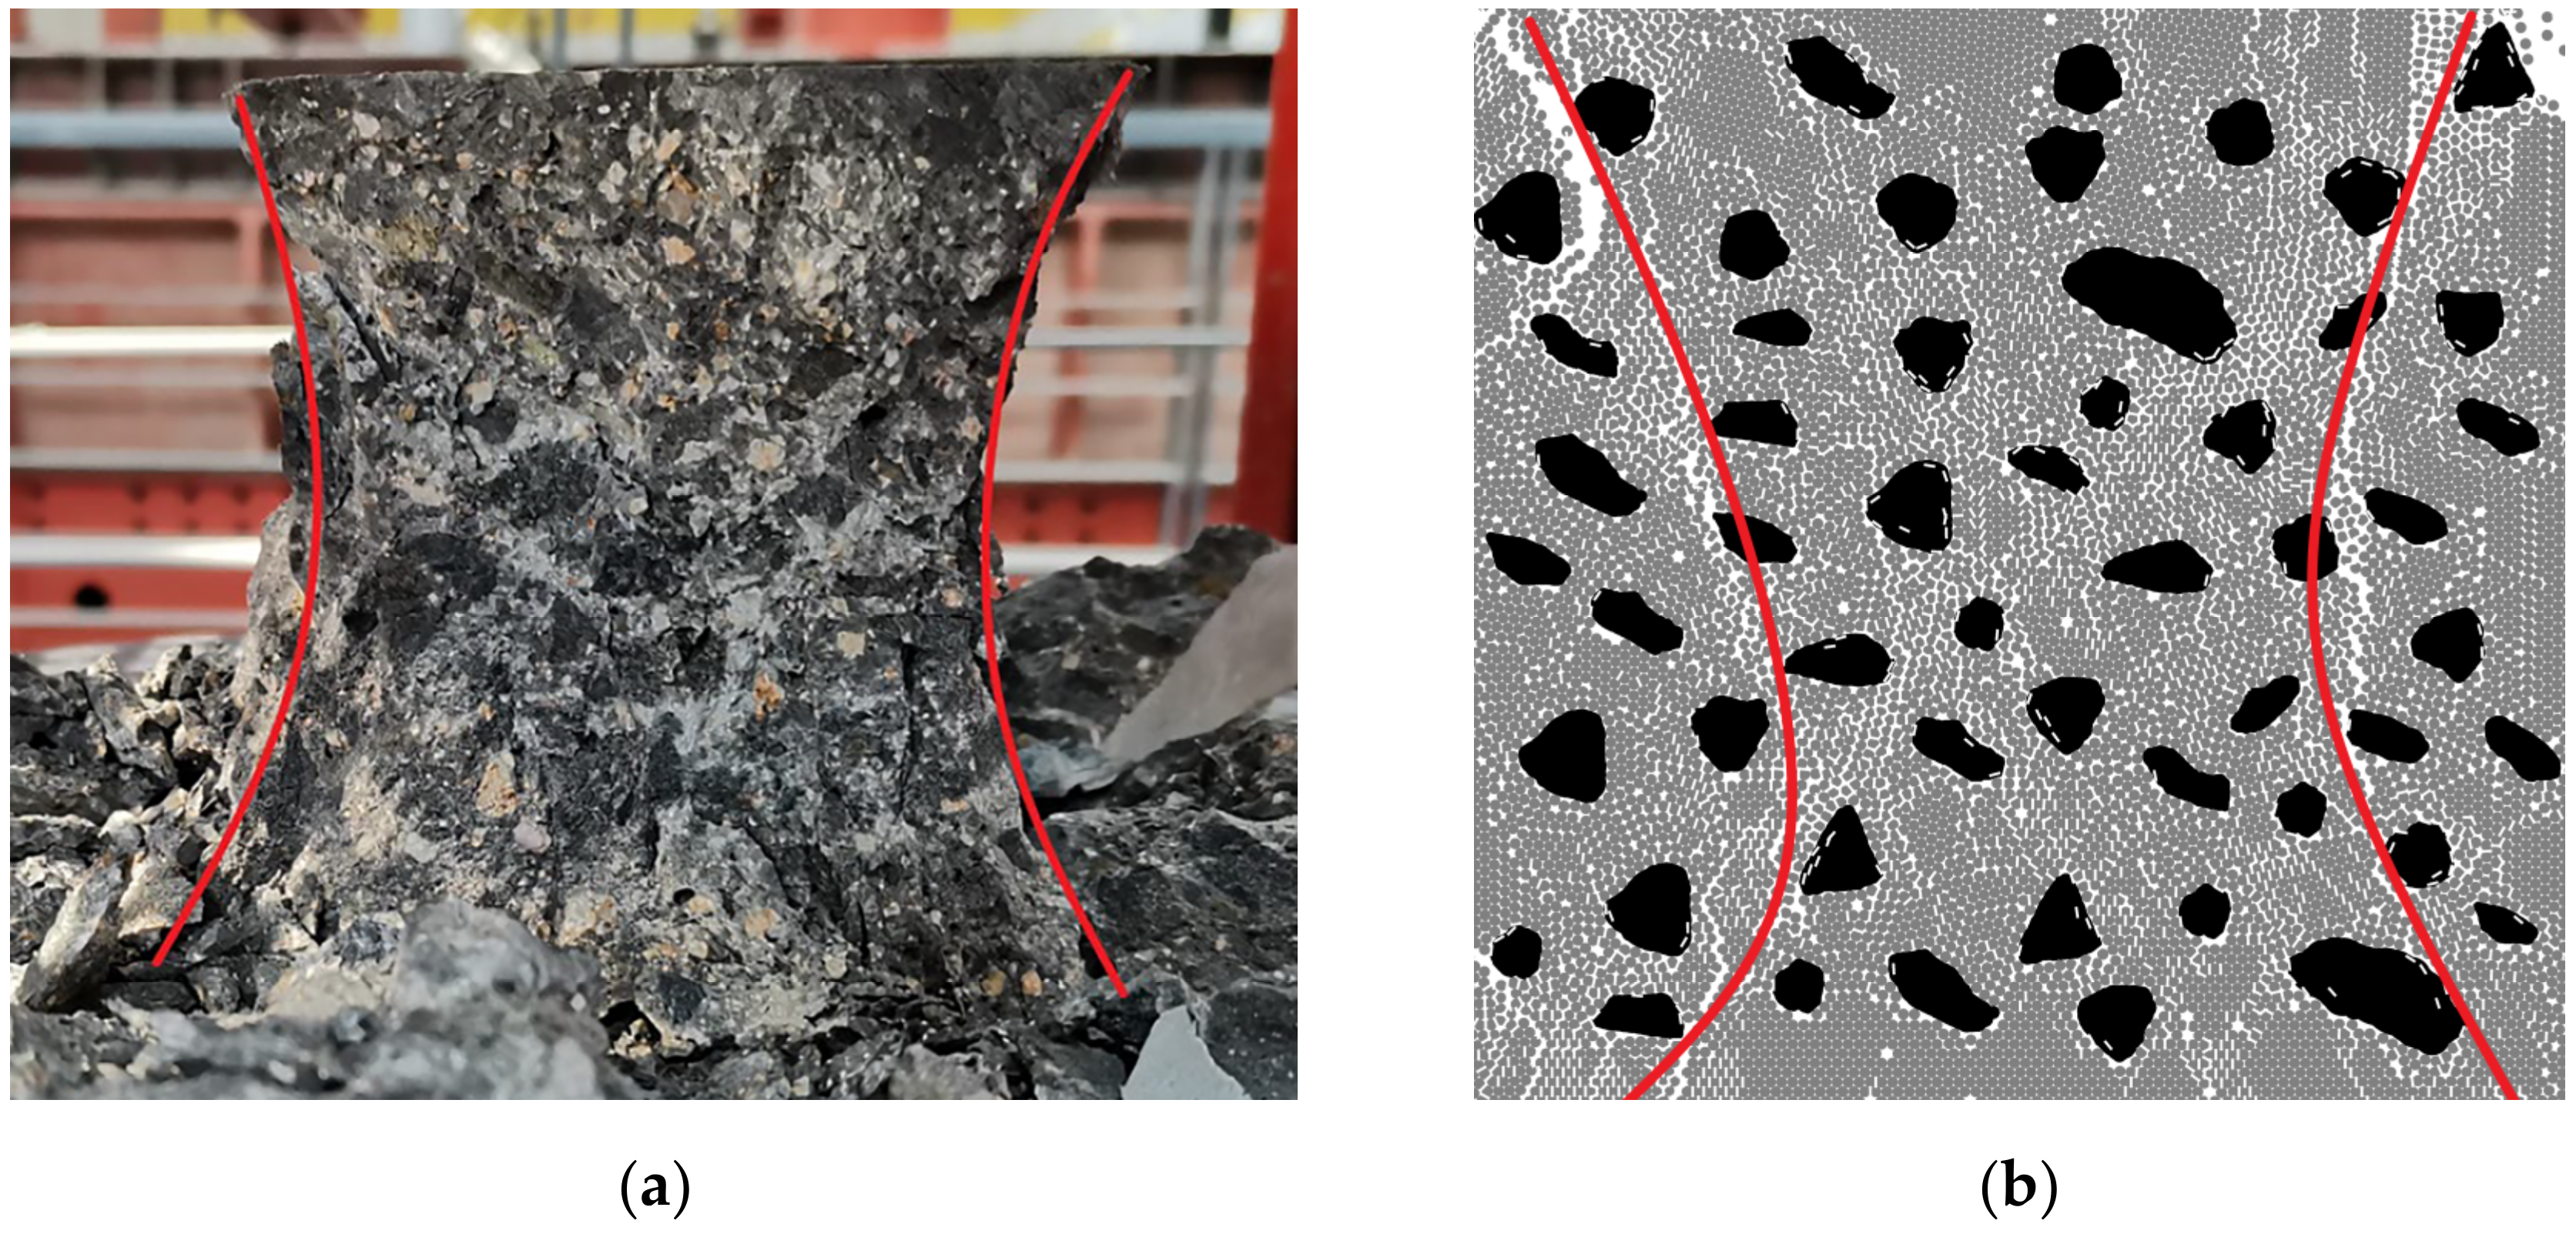
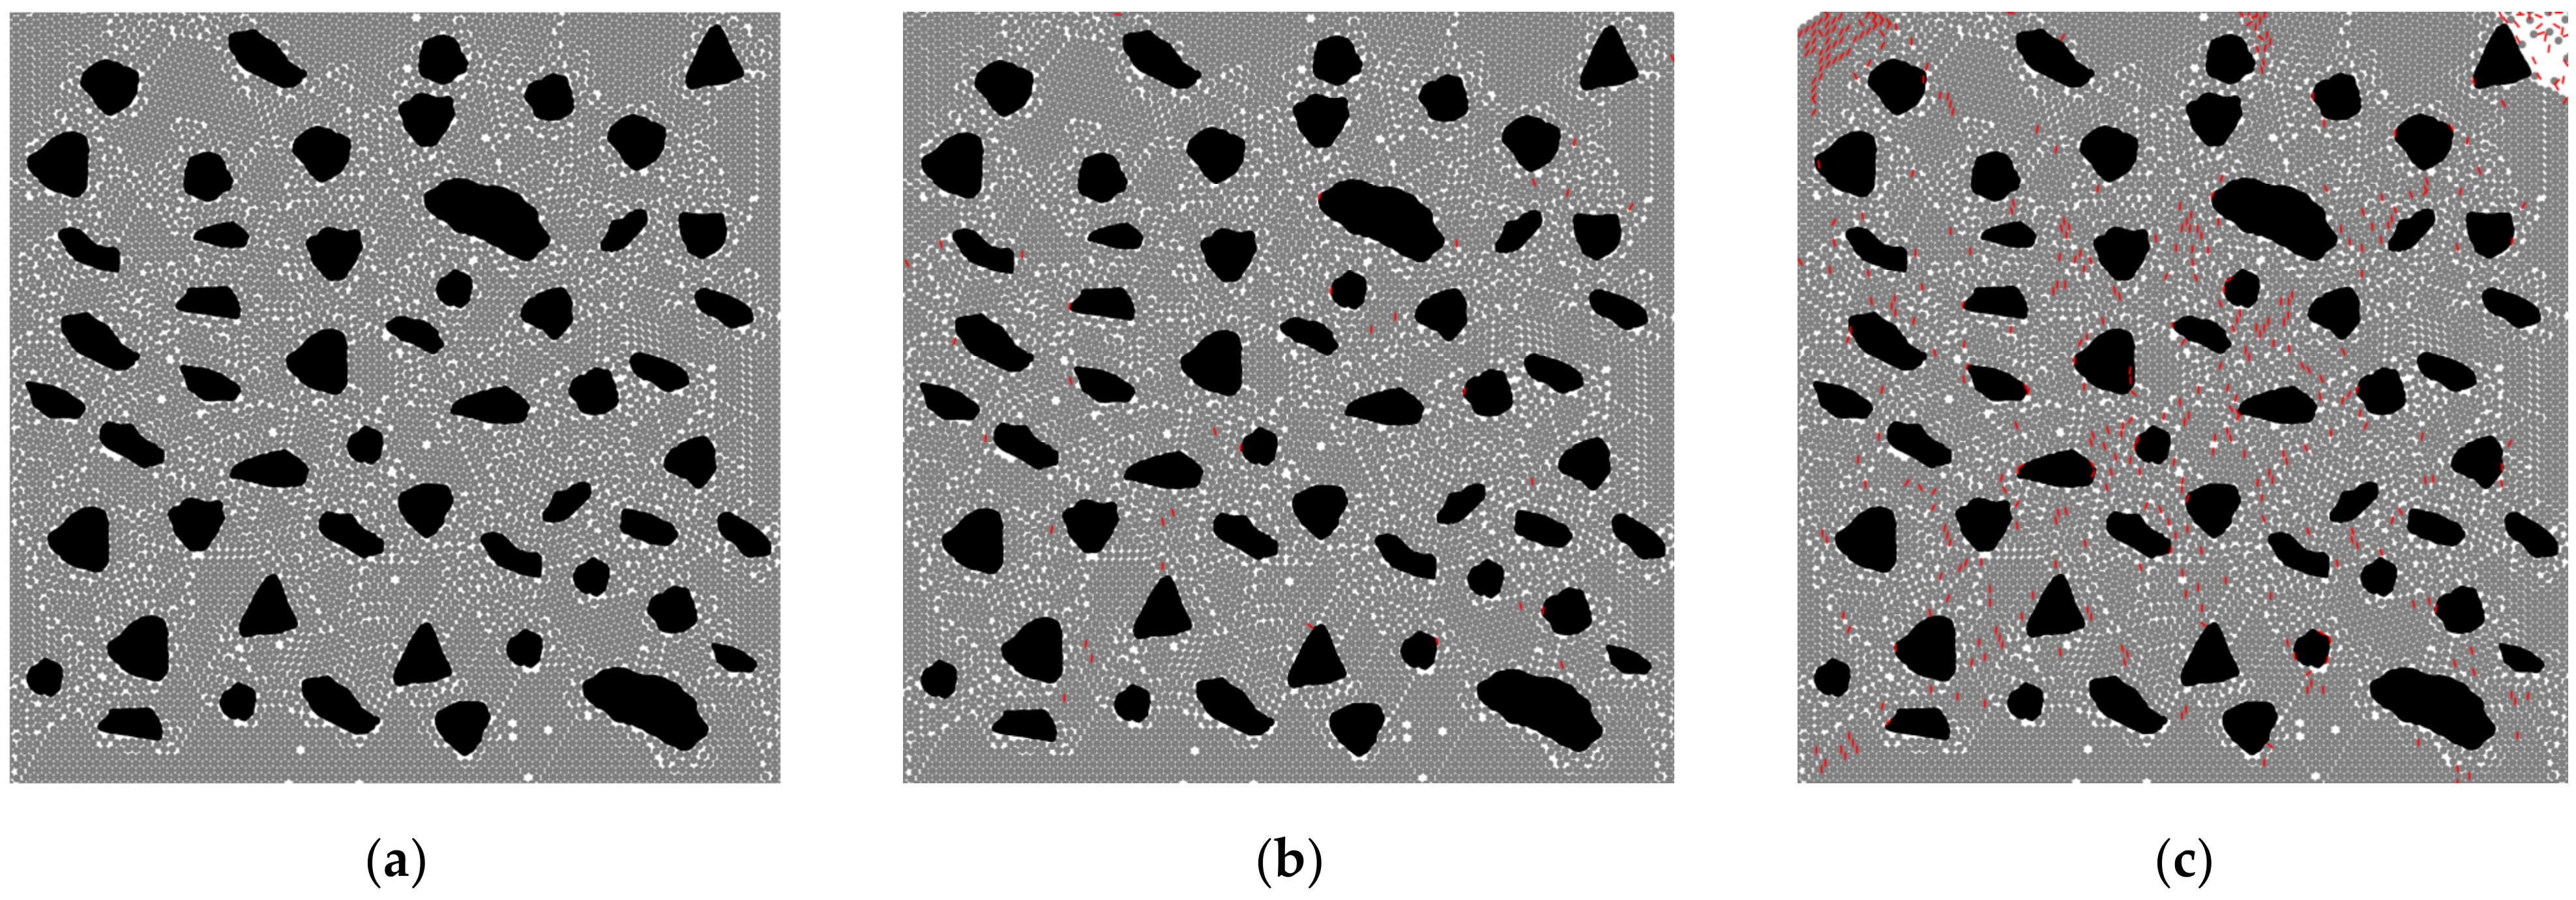
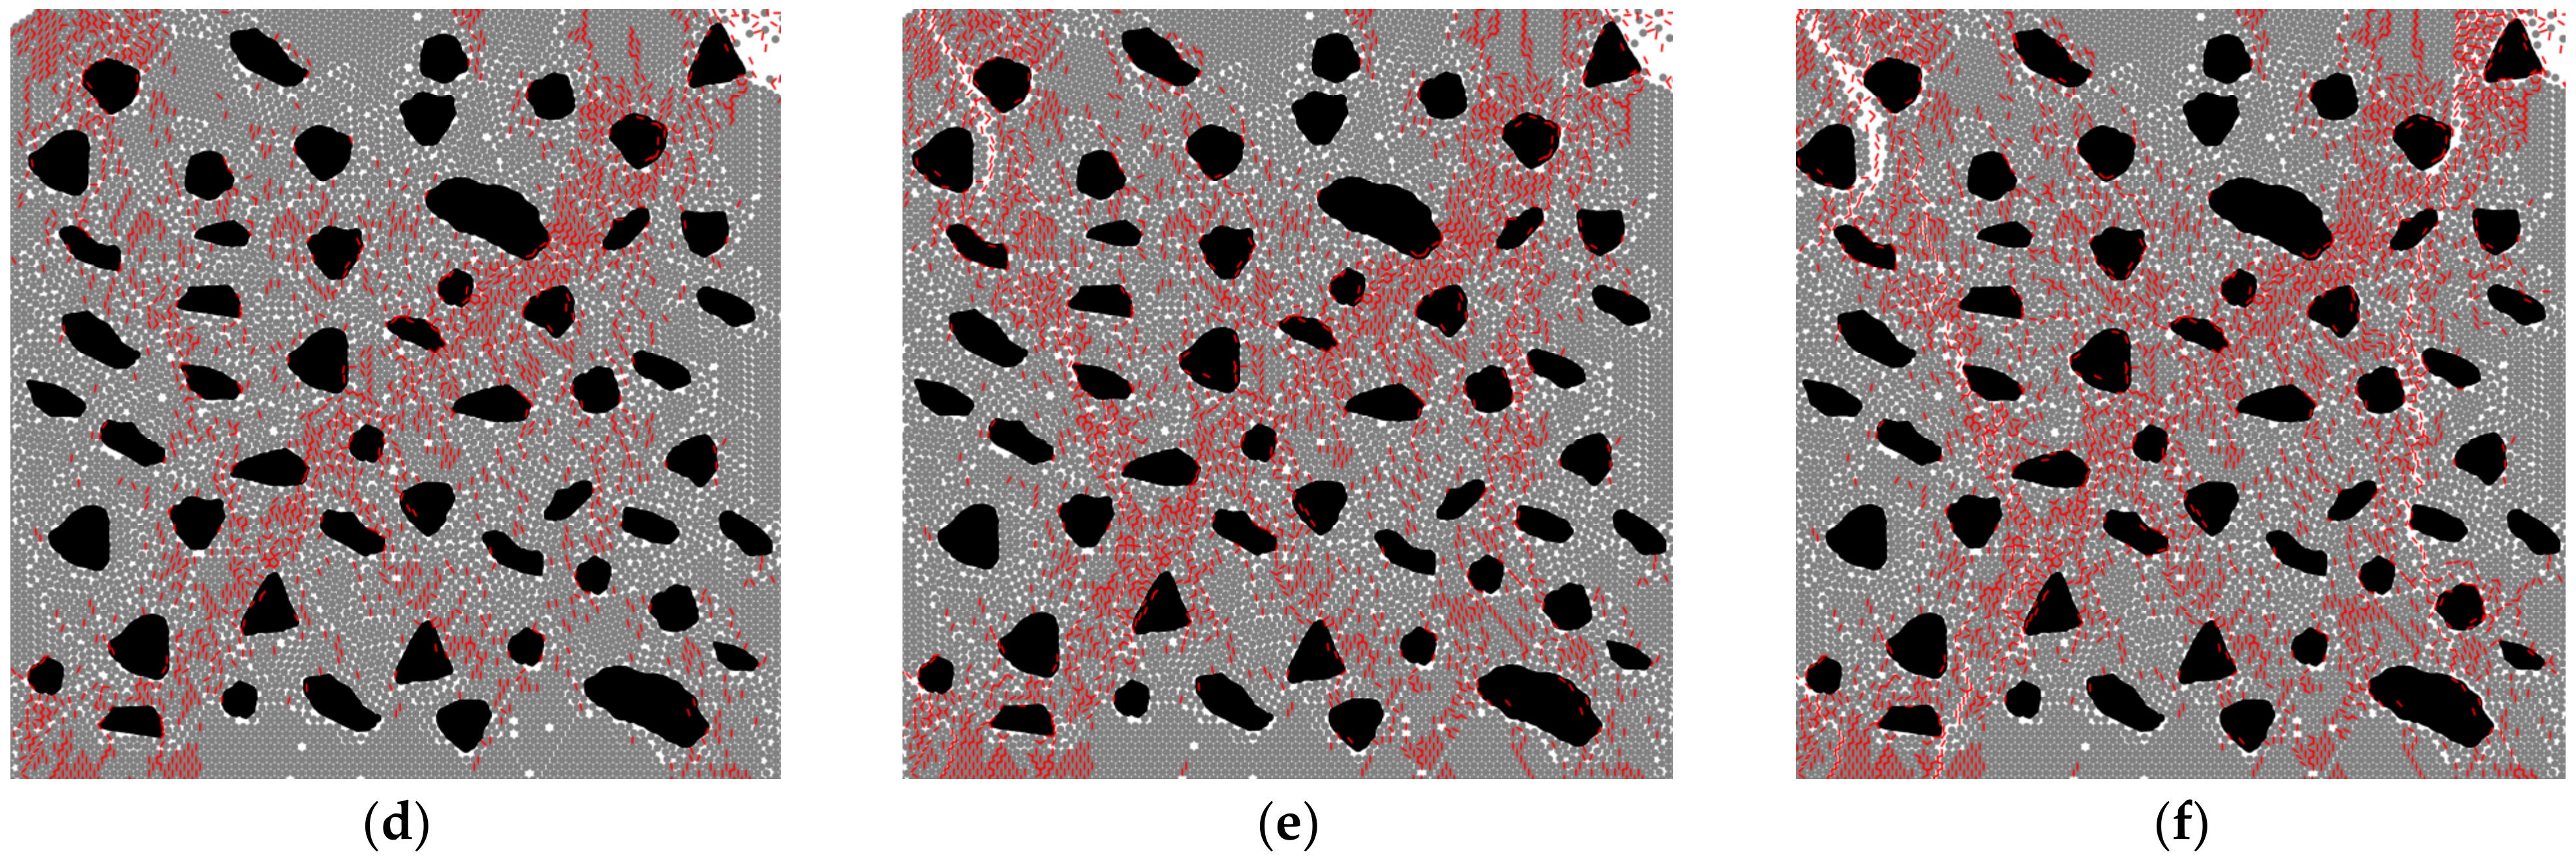
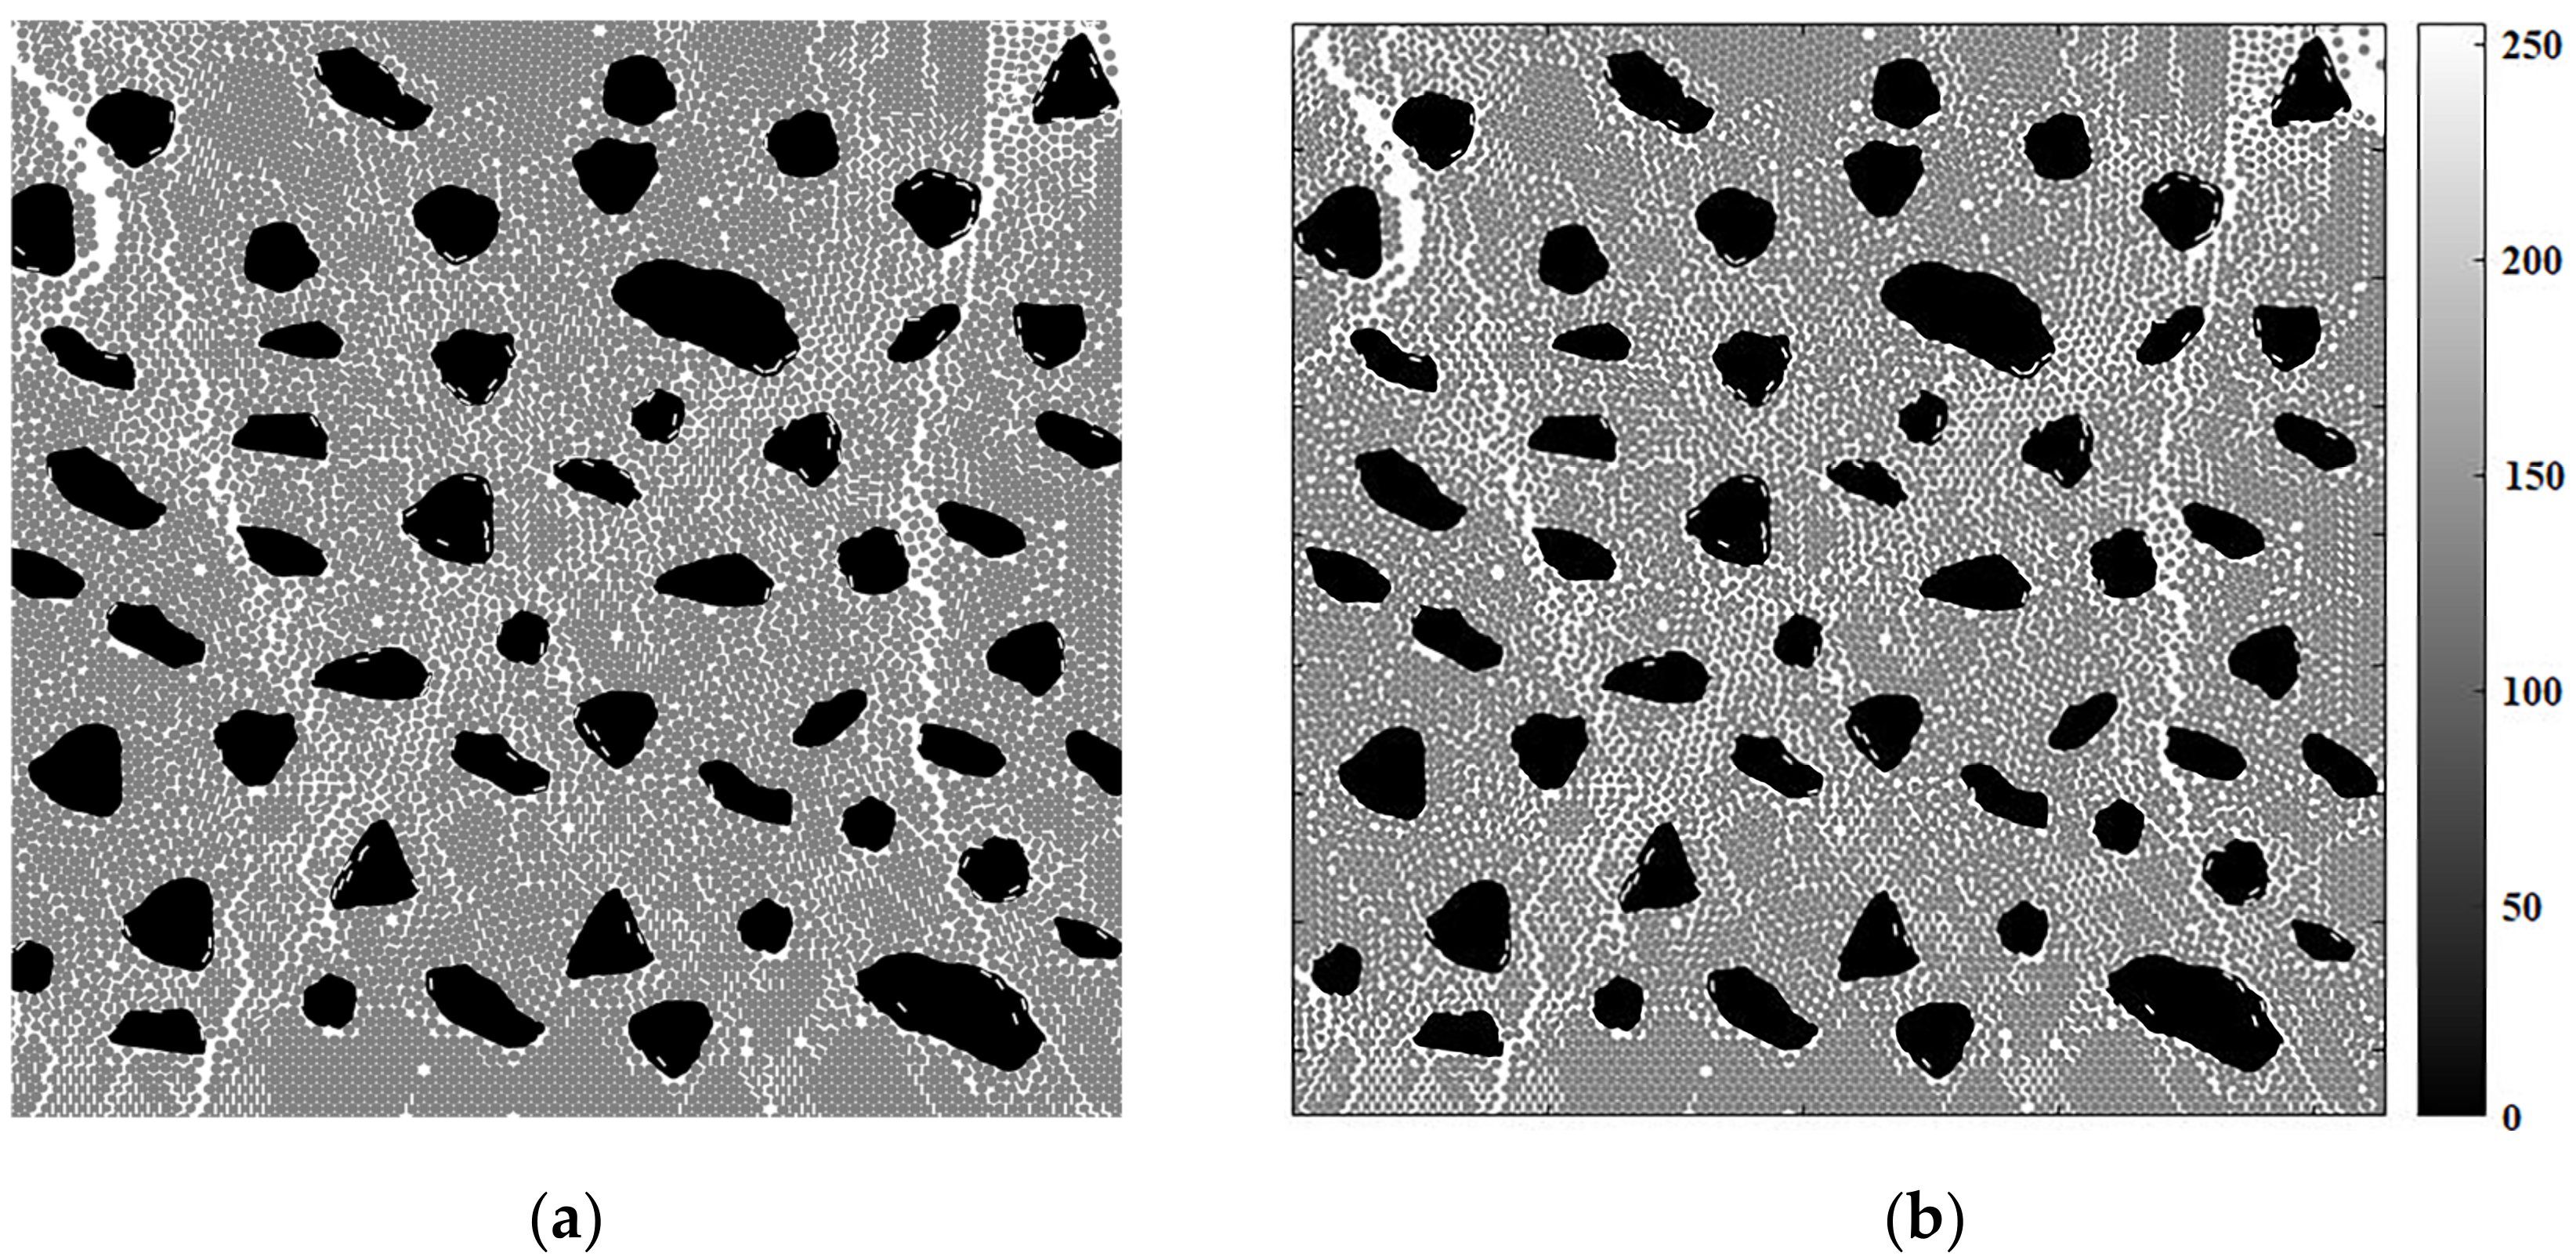
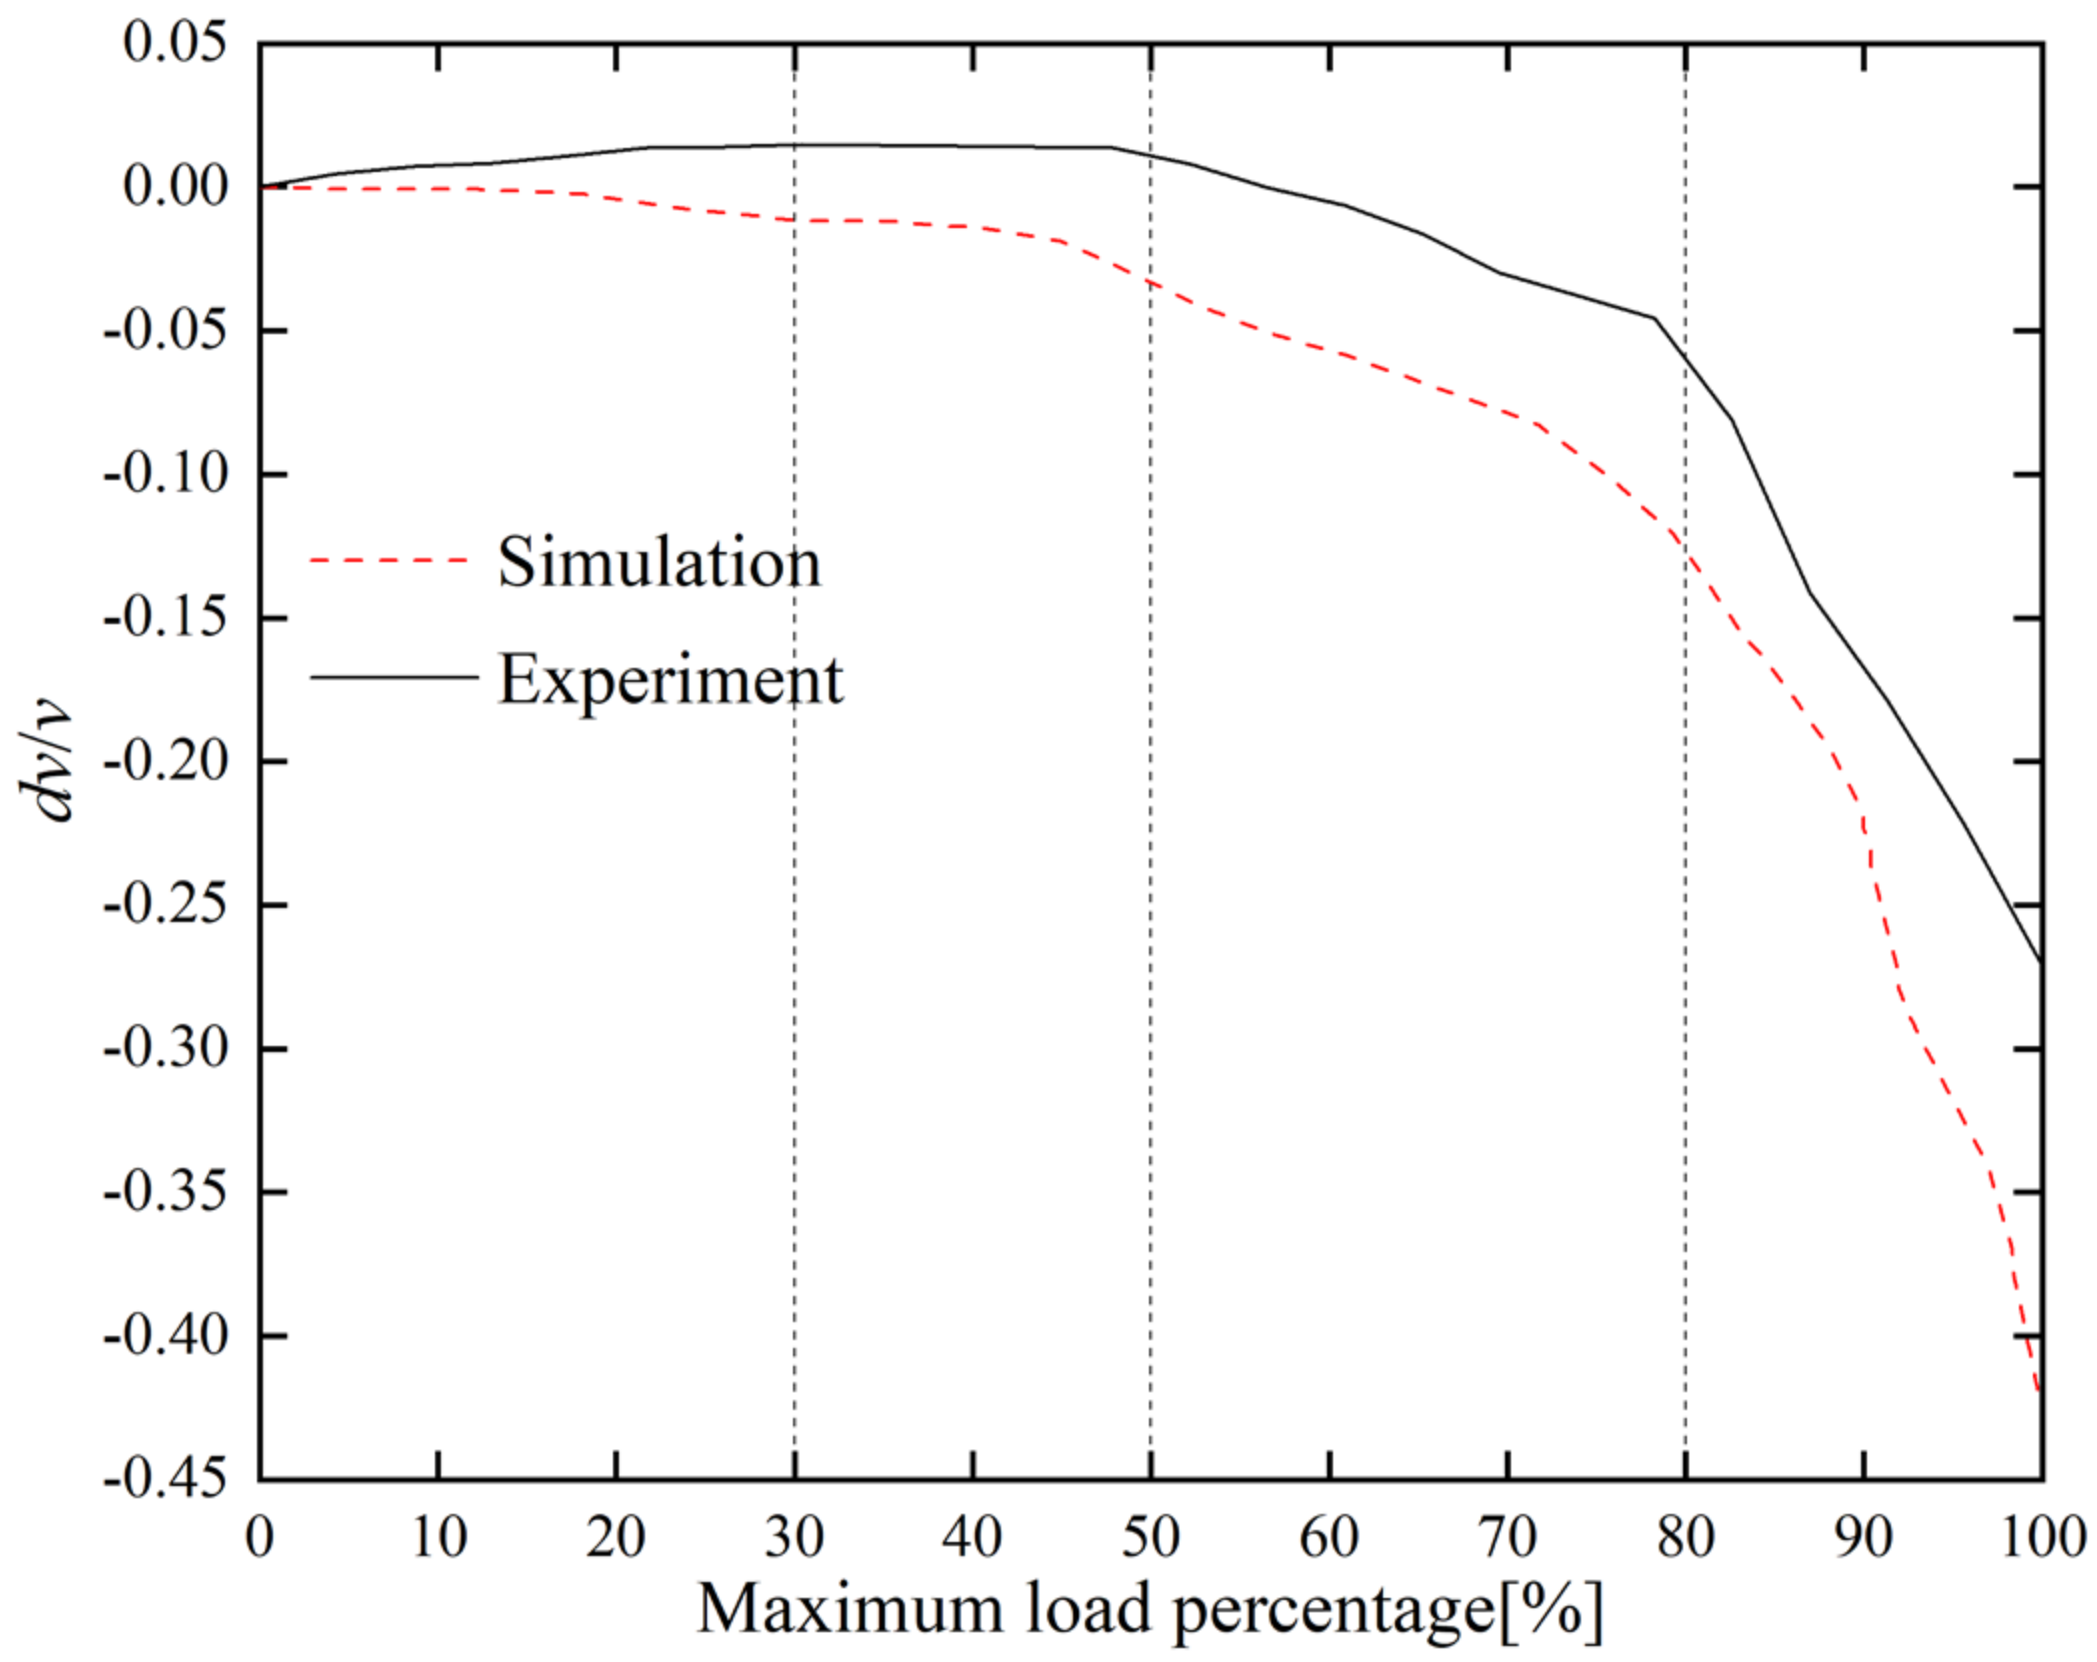
The simulation method is used to capture the whole process of uniaxial compression concrete damage and destruction. Damage cracks should first appear at the weak interface between aggregate and mortar. As the load increases, the original cracks and the new cracks that are generated continue to expand and connect. In the end, the concrete was severely damaged and its bearing capacity was lost, and the damage was in the form of double “C”-shaped macroscopic cracks. This method provides images of different degrees of damage for concrete ultrasonic field simulation. The digital image processing technology was used to extract aggregate, cement mortar, and crack information from concrete images of different degrees of damage. The concrete damage model established by processing grayscale images by threshold segmentation technology simulated the propagation of ultrasonic coda waves in concrete with different damage levels and quantitatively calculated the coda wave velocity change rate. The results show that the concrete wave velocity change rate obtained by the numerical simulation is consistent with the overall change trend obtained by the experiment, and the expected effect is achieved. Because the numerical modeling requires a lot of trial calculations and adjustment, within this research period, only the uniaxial compression simulation and the ultrasonic field simulation of the C40 concrete was completed. In the later stage, it is still necessary to optimize the numerical simulation, so as to realize the ultrasonic field numerical simulation of a large number of concrete damage processes using the above method and provide a database for related research.
Based on the perspective of correlating the characteristics of ultrasonic coda waves with the damage and failure process of concrete structures, only the compressive failure of pure concrete was studied in this work. However, in practical engineering, structural components are usually made of reinforced concrete, and the failure modes of components under different mechanical effects are complex. This study simplifies the research problem but can provide a basis for further research on the ultrasonic coda wave characteristics of reinforced concrete members under complex mechanics.

6. Conclusions

In this paper, a combination of tests and simulations is used to explore the ultrasonic coda wave characteristics of uniaxially compressed concrete. The main conclusions are as follows:
The ultrasonic coda signal is processed by the stretching technique. The cross-correlation coefficient and the relative change in coda wave velocity are very sensitive to small changes in the concrete. The regularity of the relationship between the change rate of the coda wave velocity and the percentage of the ultimate load is more significant than the cross-correlation coefficient.
According to the slope of the curve, the relationship curve between the concrete coda wave velocity change rate and the maximum load percentage is divided into four sections, namely strengthening (the slope is greater than 0), stabilizing (the slope is approximately equal to 0), weakening (the slope is between −1 and 0), and instability (the slope is less than −1). The internal damage changes of the concrete corresponding to the curves of the four sections are pore compaction, grain deformation, crack propagation, and block slip in sequence.
Using the PFC uniaxial compression simulation, the image of the internal damage development process of the concrete can be obtained, and the ultrasonic field simulation of the concrete damage and rupture process can be completed by further combining the image processing technology. The calculation results obtained by the above methods are in line with expectations. However, in the process of PFC modeling, it is necessary to perform trial calculation and calibration of multi-parameters to match the experimental results. Due to the uniqueness of concrete compression test results, the obtained damage rupture model (C40) is not suitable for simulating the compressive failure mode of concrete with various strengths. The modeling method of concrete compressive failure still needs to be further optimized.
The numerical simulation method of concrete ultrasonic coda wave characteristics established in this paper is conducive to the simulation calculations for many concretes and provides a feasible method for further obtaining a more accurate quantitative relationship between concrete damage degree and coda wave characteristics.

Author Contributions

Conceptualization, Y.H., L.S. and S.L.; methodology, Y.H. and K.X.; software, Y.H. and K.X.; formal analysis, L.S., S.L. and H.L.; investigation, Y.H. and K.X.; resources, W.Y. and J.H.; data curation, Y.H. and L.S.; writing—original draft preparation, Y.H. and K.X.; writing—review and editing, L.S. and S.L.; visualization, H.L.; supervision, L.S. and W.Y.; project administration, W.Y. and J.H.; funding acquisition, L.S. and J.H. All authors have read and agreed to the published version of the manuscript.

Funding

This research was funded by National Natural Science Foundation of China, grant number 41974164.

Institutional Review Board Statement

Not applicable.

Informed Consent Statement

Not applicable.

Data Availability Statement

Data are contained within the article. Additional supporting data presented in this study are available on request from the corresponding author.

Conflicts of Interest

The authors declare no conflict of interest.

References

  1. McCann, D.M.; Forde, M.C. Review of NDT methods in the assessment of concrete and masonry structures. NDT E Int. 2001, 34, 71–84. [Google Scholar] [CrossRef]
  2. Anugonda, P.; Wiehn, J.S.; Turner, J.A. Diffusion of ultrasound in concrete. Ultrasonics 2001, 39, 429–435. [Google Scholar] [CrossRef]
  3. Snieder, R.; Gret, A.; Douma, H.; Scales, J. Coda wave interferometry for estimating nonlinear behavior in seismic velocity. Science 2002, 295, 2253–2255. [Google Scholar] [CrossRef] [Green Version]
  4. Aki, K.; Chouet, B. Origin of coda waves: Source, attenuation, and scattering effects. J. Geophys. Res. 1975, 80, 3322–3342. [Google Scholar] [CrossRef]
  5. Larose, E.; de Rosny, J.; Margerin, L.; Anache, D.; Gouedard, P.; Campillo, M.; van Tiggelen, B. Observation of multiple scattering of kHz vibrations in a concrete structure and application to monitoring weak changes. Phys. Rev. 2006, 73 Pt 2, 016609. [Google Scholar] [CrossRef] [PubMed]
  6. Rossetto, V.; Larose, É.; Margerin, L.; Planès, T.; Hadziioannou, C. Locating a small change in a multiple scattering environment. IESC Proc. Mesoscopic Phys. Complex Media 2010, 2010, 03001. [Google Scholar] [CrossRef] [Green Version]
  7. Snieder, R. The Theory of Coda Wave Interferometry. Pure Appl. Geophys. 2006, 163, 455–473. [Google Scholar] [CrossRef]
  8. Larose, E.; Hall, S. Monitoring stress related velocity variation in concrete with a 2 × 10⁻⁵ relative resolution using diffuse ultrasound. J. Acoust. Soc. Am. 2009, 125, 1853–1856. [Google Scholar] [CrossRef] [PubMed] [Green Version]
  9. Jiang, H.; Zhang, J.; Jiang, R. Stress Evaluation for Rocks and Structural Concrete Members through Ultrasonic Wave Analysis: Review. J. Mater. Civ. Eng. 2017, 29, 04017172. [Google Scholar] [CrossRef]
  10. Planès, T.; Larose, E. A review of ultrasonic Coda Wave Interferometry in concrete. Cem. Concr. Res. 2013, 53, 248–255. [Google Scholar] [CrossRef]
  11. Zhan, H.; Jiang, H.; Zhuang, C.; Zhang, J.; Jiang, R. Estimation of Stresses in Concrete by Using Coda Wave Interferometry to Establish an Acoustoelastic Modulus Database. Sensors 2020, 20, 4031. [Google Scholar] [CrossRef] [PubMed]
  12. Zhang, Y.; Planes, T.; Larose, E.; Obermann, A.; Rospars, C.; Moreau, G. Diffuse ultrasound monitoring of stress and damage development on a 15-ton concrete beam. J. Acoust. Soc. Am. 2016, 139, 1691. [Google Scholar] [CrossRef] [PubMed] [Green Version]
  13. Grabke, S.; Clauss, F.; Bletzinger, K.U.; Ahrens, M.A.; Mark, P.; Wuchner, R. Damage Detection at a Reinforced Concrete Specimen with Coda Wave Interferometry. Materials 2021, 14, 5013. [Google Scholar] [CrossRef] [PubMed]
  14. Liu, S.; Bundur, Z.B.; Zhu, J.; Ferron, R.D. Evaluation of self-healing of internal cracks in biomimetic mortar using coda wave interferometry. Cem. Concr. Res. 2016, 83, 70–78. [Google Scholar] [CrossRef]
  15. Legland, J.B.; Zhang, Y.; Abraham, O.; Durand, O.; Tournat, V. Evaluation of crack status in a meter-size concrete structure using the ultrasonic nonlinear coda wave interferometry. J. Acoust. Soc. Am. 2017, 142, 2233. [Google Scholar] [CrossRef]
  16. Wang, X.; Chakraborty, J.; Bassil, A.; Niederleithinger, E. Detection of Multiple Cracks in Four-Point Bending Tests Using the Coda Wave Interferometry Method. Sensors 2020, 20, 1986. [Google Scholar] [CrossRef] [Green Version]
  17. Zhan, H.; Jiang, H.; Jiang, R. Three-dimensional images generated from diffuse ultrasound wave: Detections of multiple cracks in concrete structures. Struct. Health Monit. 2019, 19, 12–25. [Google Scholar] [CrossRef]
  18. Niederleithinger, E.; Wunderlich, C. Influence of small temperature variations on the ultrasonic velocity in concrete. AIP Conf. Proc. 2013, 1511, 390–397. [Google Scholar] [CrossRef]
  19. Moradi-Marani, F.; Kodjo, S.A.; Rivard, P.; Lamarche, C.-P. Effect of the Temperature on the Nonlinear Acoustic Behavior of Reinforced Concrete Using Dynamic Acoustoelastic Method of Time Shift. J. Nondestruct. Eval. 2014, 33, 288–298. [Google Scholar] [CrossRef]
  20. Zhang, Y.; Abraham, O.; Tournat, V.; le Duff, A.; Lascoup, B.; Loukili, A.; Grondin, F.; Durand, O. Validation of a thermal bias control technique for Coda Wave Interferometry (CWI). Ultrasonics 2013, 53, 658–664. [Google Scholar] [CrossRef] [Green Version]
  21. Hughes, D.S.; Kelly, J.L. Second-Order Elastic Deformation of Solids. Phys. Rev. 1953, 92, 1145–1149. [Google Scholar] [CrossRef]
  22. Shokouhi, P.; Niederleithinger, E.; Zoëga, A.; Barner, A.; Schöne, D. Using Ultrasonic Coda Wave Interferometry for Monitoring Stress-Induced Changes in Concrete. In Proceedings of the 23rd SAGEEP Symposium on the Application of Geophysics to Engineering and Environmental Problems, Denver, CO, USA, 11–15 April 2010; pp. 650–654. [Google Scholar] [CrossRef]
  23. Stahler, S.C.; Sens-Schonfelder, C.; Niederleithinger, E. Monitoring stress changes in a concrete bridge with coda wave interferometry. J. Acoust. Soc. Am. 2011, 129, 1945–1952. [Google Scholar] [CrossRef] [PubMed] [Green Version]
  24. Schurr, D.P.; Kim, J.-Y.; Sabra, K.G.; Jacobs, L.J. Damage detection in concrete using coda wave interferometry. NDT E Int. 2011, 44, 728–735. [Google Scholar] [CrossRef]
  25. Hu, H.; Li, D.; Wang, L.; Chen, R.; Xu, X. An improved ultrasonic coda wave method for concrete behavior monitoring under various loading conditions. Ultrasonics 2021, 116, 106498. [Google Scholar] [CrossRef]
  26. Zhang, Y.; Abraham, O.; Grondin, F.; Loukili, A.; Tournat, V.; le Duff, A.; Lascoup, B.; Durand, O. Study of stress-induced velocity variation in concrete under direct tensile force and monitoring of the damage level by using thermally-compensated Coda Wave Interferometry. Ultrasonics 2012, 52, 1038–1045. [Google Scholar] [CrossRef] [PubMed] [Green Version]
  27. Jiang, H.; Zhan, H.; Zhang, J.; Jiang, R.; Zhuang, C.; Fan, P. Detecting Stress Changes and Damage in Full-Size Concrete T-Beam and Slab with Ultrasonic Coda Waves. J. Struct. Eng. 2021, 147, 04021140. [Google Scholar] [CrossRef]
  28. Wang, X.; Niederleithinger, E.; Hindersmann, I. The installation of embedded ultrasonic transducers inside a bridge to monitor temperature and load influence using coda wave interferometry technique. Struct. Health Monit. 2021; online. [Google Scholar] [CrossRef]
  29. Xie, F.; Larose, E.; Moreau, L.; Zhang, Y.; Planes, T. Characterizing extended changes in multiple scattering media using coda wave decorrelation: Numerical simulations. Waves Random Complex Media 2018, 28, 1–14. [Google Scholar] [CrossRef]
  30. Chen, G.; Pageot, D.; Abraham, O.; Zhang, Y.; Chekroun, M.; Tournat, V. Nonlinear Coda Wave Interferometry: Sensitivity to wave-induced material property changes analyzed via numerical simulations in 2D. Ultrasonics 2019, 99, 105968. [Google Scholar] [CrossRef]
  31. Chen, G.; Zhang, Y.; Abraham, O.; Pageot, D.; Chekroun, M.; Tournat, V. Numerical parametric study of Nonlinear Coda Wave Interferometry sensitivity to microcrack size in a multiple scattering medium. Ultrasonics 2021, 116, 106483. [Google Scholar] [CrossRef]
  32. Chen, G.; Pageot, D.; Legland, J.-B.; Abraham, O.; Chekroun, M.; Tournat, V. Numerical modeling of ultrasonic coda wave interferometry in a multiple scattering medium with a localized nonlinear defect. Wave Motion 2017, 72, 228–243. [Google Scholar] [CrossRef]
  33. Finger, C.; Saydak, L.; Vu, G.; Timothy, J.J.; Meschke, G.; Saenger, E.H. Sensitivity of Ultrasonic Coda Wave Interferometry to Material Damage-Observations from a Virtual Concrete Lab. Materials 2021, 14, 4033. [Google Scholar] [CrossRef] [PubMed]
  34. Hafiz, A.; Schumacher, T. Monitoring of Stresses in Concrete Using Ultrasonic Coda Wave Comparison Technique. J. Nondestruct. Eval. 2018, 37, 73. [Google Scholar] [CrossRef]
  35. Clauß, F.; Epple, N.; Ahrens, M.A.; Niederleithinger, E.; Mark, P. Correlation of Load-Bearing Behavior of Reinforced Concrete Members and Velocity Changes of Coda Waves. Materials 2022, 15, 738. [Google Scholar] [CrossRef] [PubMed]
  36. Niederleithinger, E.; Wang, X.; Herbrand, M.; Muller, M. Processing Ultrasonic Data by Coda Wave Interferometry to Monitor Load Tests of Concrete Beams. Sensors 2018, 18, 1971. [Google Scholar] [CrossRef] [Green Version]
  37. Cho, N.; Martin, C.D.; Sego, D.C. A clumped particle model for rock. Int. J. Rock Mech. Min. 2007, 44, 997–1010. [Google Scholar] [CrossRef]
  38. Manso, J.; Marcelino, J.; Caldeira, L. Effect of the clump size for bonded particle model on the uniaxial and tensile strength ratio of rock. Int. J. Rock Mech. Min. Sci. 2019, 114, 131–140. [Google Scholar] [CrossRef]
  39. Collino, F.; Tsogka, C. Application of the perfectly matched absorbing layer model to the linear elastodynamic problem in anisotropic heterogeneous media. Geophysics 2001, 66, 294–307. [Google Scholar] [CrossRef] [Green Version]
  40. Pled, F.; Desceliers, C. Review and Recent Developments on the Perfectly Matched Layer (PML) Method for the Numerical Modeling and Simulation of Elastic Wave Propagation in Unbounded Domains. Arch. Comput. Methods Eng. 2021, 29, 471–518. [Google Scholar] [CrossRef]
  41. Mamand, H.; Chen, J. Extended Digital Image Correlation Method for Mapping Multiscale Damage in Concrete. J. Mater. Civ. Eng. 2017, 29, 04017179. [Google Scholar] [CrossRef] [Green Version]
  42. Yu, Q.L.; Yang, T.H.; Zhu, W.C.; Zheng, C. Digital Image-Based Model for Concrete Fracturing Process Analysis. In Proceedings of the 6th International Conference on Physical and Numerical Simulation of Materials Processing, Guilin, China, 16 November 2010; Volume 704–705, pp. 980–988. [Google Scholar] [CrossRef]
Figure 1. Experimental device: (a) electrohydraulics; (b) signal generator and oscilloscope.
Buildings 12 00514 g001
Figure 2. The original waveforms at the receiving end under different test parameters: (a) excitation frequencies; (b) excitation voltages; (c) test path length.
Buildings 12 00514 g002aBuildings 12 00514 g002b
Figure 3. Concrete specimen loading and data collection process.
Buildings 12 00514 g003
Figure 4. Ultrasonic coda wave test process under uniaxial loading.
Buildings 12 00514 g004
Figure 5. Comparison of the ultrasonic receiving waveform before and after loading.
Buildings 12 00514 g005
Figure 6. Correlation of the coda wave’s cross-correlation coefficient to the maximum load percentage.
Buildings 12 00514 g006
Figure 7. Correlation of the coda wave velocity with the maximum load percentage.
Buildings 12 00514 g007
Figure 8. PFC2D model diagram of concrete damage simulation: (a) a picture of the coarse basalt aggregate; (b) the proportion of each particle size of coarse basalt aggregate; (c) PFC2D diagram of concrete model.
Buildings 12 00514 g008
Figure 9. Comparison of the stress–strain curves of the C40 concrete indoor test and numerical simulation.
Buildings 12 00514 g009
Figure 10. Concrete damage and failure forms: (a) experimental; (b) numerical simulation.
Buildings 12 00514 g010
Figure 11. Simulation of the damage process in concrete specimens. (Load percentage: (a) 0%, (b) 57.5%, (c) 65.0%, (d) 83.5%, (e) 92.8%, (f) 100%).
Buildings 12 00514 g011aBuildings 12 00514 g011b
Figure 12. Comparison of the damage map and damage gray map: (a) damage map; (b) damage gray map.
Buildings 12 00514 g012
Figure 13. Statistics of the number of speeds assigned.
Buildings 12 00514 g013
Figure 14. Numerical damage mode: (a) concrete ultimate strength 0%; (b) concrete ultimate strength 100%.
Buildings 12 00514 g014
Figure 15. Comparison of the ultrasonic receiving waveform before and after damage.
Buildings 12 00514 g015
Figure 16. Comparison of the C40 concrete test and simulated coda wave velocity change rate.
Buildings 12 00514 g016
Table 1. Material mix ratios.
Concrete Strength GradeMaterial Consumption (Weight Ratio)
CementWaterSandPebbleMineral PowderFly AshWater Reducing Agent
C401.000 (P.O42.5)0.4501.3603.030///
C501.000 (P.O42.5)0.3500.9102.380///
C601.000 (P.O52.5)0.3591.6632.2980.1380.0690.032
C701.000 (P.O52.5)0.3801.6202.6500.2350.1170.054
Table 2. Maximum load of each strength of concrete.
Concrete StrengthAxial Compressive Strength/MPaMaximum Load/kN
C4044.1460
C50 53.87520
C6063.8620
C7073.6740
Table 3. Fitting curve parameters of concrete with different strengths.
Concrete Strengthx = F/FmaxabR2
C400–30%0.05260.001530.94931
30–50%−0.007070.017091
50–80%−0.213540.121010.99099
80–100%−1.060240.789130.99304
C500–30%0.057870.003010.9146
30–50%−0.008010.019541
50–80%−0.202560.118690.97374
80–100%−1.030740.787990.99365
C600–30%0.082130.006860.84953
30–50%0.028180.018791
50–80%−0.158840.113970.98072
80–100%−1.234380.986720.98572
C700–30%0.089390.003050.96862
30–50%−0.007450.03426−0.10323
50–80%−0.162070.111390.95158
80–100%−1.936051.534820.99379
Table 4. Mesoscopic parameter values of C40 concrete.
Meso-Parameters E c /GPa k n / k s μ σ ¯ c /MPa τ ¯ c /MPa
Discussed Value27.90.3808.533
32.91.380.313.538
37.92.380.618.543
42.93.380.923.548
47.94.381.228.553
52.95.381.532.558
The best value for simulation42.93.380.923.548
Table 5. Comparison of the simulation results and test results of C40 concrete uniaxial compression.
ComparisonElastic Modulus/GPaPeak Stress/MPaPeak Strain
Simulation33.4343.850.002603
Experiment33.3243.350.002593
Deviation percentage0.33%1.12%0.38%
Table 6. Comparison of the simulation results and test results of C40 concrete uniaxial compression.
Slope0–30%30–50%50–80%80–100%
Simulation−0.03845−0.06839−0.27649−1.48015
Experiment0.052−0.00707−0.21354−1.06024
Fitting formula 0 < a 1 < 0.1 a 2 0 1 a 3 < 0 a 4 < 1
Publisher’s Note: MDPI stays neutral with regard to jurisdictional claims in published maps and institutional affiliations.

