Article

Graphite Tailings’ Effects on Mechanical and Physical Properties of Eco-Efficient Steel Fiber-Reinforced Concrete

1
School of Civil Engineering, HeilongJiang University, Harbin 150080, China
2
Key Laboratory of Functional Inorganic Material Chemistry (Heilongjiang University), Ministry of Education of the People’s Republic of China, Harbin 150080, China
*
Authors to whom correspondence should be addressed.
Buildings 2022, 12(5), 509; https://doi.org/10.3390/buildings12050509
Submission received: 26 March 2022 / Revised: 16 April 2022 / Accepted: 18 April 2022 / Published: 20 April 2022
(This article belongs to the Collection Utilization of Waste Materials in Building Engineering)

Abstract

:
As impacted by environmental concerns and the demand for high-strength concrete, novel ideas of the development of eco-efficient, steel fiber-reinforced concrete have been proposed. In this study, the aim is to develop a type of eco-efficient steel fiber-reinforced concrete with graphite tailings and steel fiber. Steel fibers act as a type of concrete toughening material, and graphite tailings serve as a partially alternated aggregate to sand. Mechanical properties exhibited by the concrete are assessed based on different volume fractions of graphite tailings (i.e., 0%, 10% and 20%). The concrete mixture proportion is determined in accordance with the theory of particle densely packing, and the concrete mechanical properties are more specifically studied by performing compressive and flexural tests. As indicated by the results, the maximal mixed bulk density of graphite tailings at different grades is greater than that of sand, so concrete with graphite tailings exhibits higher compressive strength. For the content of graphite tailings, the addition of graphite tailings impacts the interfacial adhesion between aggregates and cementing matrix, thereby inhibiting bifurcation and convergence of cracks. However, excessive mixing of graphite tailings would decrease the specimen’s effective water-to-binder ratio (W/B), thereby adversely affecting the internal structure of the concrete. The amount of graphite tailings impacts the distribution of steel fibers at the concrete interface, which could be the most conducive to the distribution of steel fibers under the graphite tailings’ content of 10%. This study demonstrates that graphite tailings and steel fibers are feasible to prepare eco-efficient, steel fiber-reinforced concrete.

1. Introduction

Developed nations comprise 20% of the world’s population, and they emitted 70% of the greenhouse gases before the 1990s; they well deserved the title “emitters” [1,2,3]. Countries worldwide are encountering the challenge of carbon emission reduction with the world’s continuous economic development and global climate change. Concrete has been most extensively employed to reduce carbon emissions, improve greenness and take the road of high-quality development by ensuring product quality [4]. Concrete is the most widely used building material and it has significantly contributed to the construction of buildings, bridges, tunnels, highways, railways, airports, docks, municipalities, and water conservancy projects [5]. The most significant challenge facing the concrete industry is reported as the change in the “supply and demand relationship” of the largest volume of mineral granular raw materials, i.e., sand and gravel aggregates and powder materials. Such a change is currently shifting from one-time mining and fewer varieties of natural resources to multi-variety alternative resources or solid waste [6].
Concrete, the main material for infrastructure construction, is increasingly demanded every year. Aggregates can be applied to fill in the production of concrete, taking up nearly 75% of the overall volume, in which sand takes up nearly 30% of the total volume [7,8]. With the continuous mining of river sand, a shortage of sand supply and rising prices have been caused. The use of tailings as fine aggregate instead of sand in concrete materials turns out to be a research hotspot in the construction industry. By substituting iron or copper tailings for sand, the density of concrete can be improved [9,10,11,12]. With the amount of fixed cementing material unchanged, iron tailings concrete and natural sand concrete exhibit similar mechanical properties, ultimate tensile strain, compressive elastic modulus and frost resistance [13]. When iron tailings and admixture work together, the utilization rate of iron tailings reaches 40% [14]. Copper tailings concrete exhibits high segregation resistance and long-term strength development [15]. The concrete meeting the construction requirements can still be prepared under the copper tailings content of 60% [16,17]. Graphite tailings refers to a type of slag, and composite powders after graphite tailings are recovered have been studied [18]. Thus far, methods of efficiently utilizing graphite tailings and processing them in large quantities have been rarely developed. The particle size of graphite tailings is small, and the tailings particles are easily dispersed in the air in windy weather, thereby inevitably polluting the atmospheric environment and water resources. Furthermore, the accumulation of graphite tailings takes up considerable land and wastes land resources. The particle size of graphite tailings is consistent with that of sand (0 to 5 mm) [19]. Graphite tailings and sand exhibit numerous similarities as indicated by the analysis of appearance, physical properties and chemical properties. As indicated from the chemical composition analysis, the composition of graphite tailings complies with that of pozzolan and exhibits pozzolanic activity [20], so graphite tailings can more likely replace fine aggregates in cement-based materials. Using graphite tailings instead of sand as aggregate to prepare concrete can effectively solve the shortage of sand. Liu et al. [21,22,23,24,25] replaced sand with graphite tailings and successfully fabricated concrete exhibiting higher mechanical properties. Moreover, ideal results have been achieved in the subsequent research on the conductivity exhibited by graphite tailings concrete. As reported by Peng et al. [26], the addition of graphite tailings could change the Ca/Si ratio in the gel matrix; an appropriate addition of graphite tailings can increase the production of hydrated calcium silicate gel, thereby increasing the strength of concrete. Numerous gaps have been found in the application research of graphite tailings in concrete.
The expansion application of concrete has been limited by self-weight, low tensile strength, poor crack resistance and defects of concrete as a brittle material [27]. The mentioned defects can be addressed in the form of cement-based composite materials, i.e., using cement as the carrier and employing various synthetic fibers, ceramic fibers, metal wires, natural plant and mineral fibers as the reinforcements, as well as adding fillers, chemical additives and water based on a composite process to fabricate composite materials [28,29,30,31,32]. Steel fiber has been found to be a generally applied toughening material in concrete. The incorporation of steel fiber can improve the fatigue life of concrete and the compressive strength of concrete [33,34,35,36]. Due to the multi-directional and non-uniformity of the structure and composition of steel fiber concrete, as well as the short characteristics exhibited by steel fiber, steel fiber is distributed in random directions in the concrete, thereby making it significantly more complex than ordinary materials. Adding steel fiber to concrete can essentially improve the mechanical properties exhibited by concrete and play a role in strengthening, toughening and cracking resistance of concrete [37]. The synergistic effect of steel fiber and iron tailings can enhance the durability and compactness of tailings concrete [38,39]. However, excessive steel fiber content adversely impacts the fluidity of concrete [40,41], so the uniform distribution of steel fibers acts as a vital factor for the maximal improvement of concrete strength by steel fibers. Graphite tailings exhibit a small average particle size and are easily dispersed in concrete, thereby improving the uniform dispersion of steel fibers [25]. This is because safety and durability are vital issues for concrete structures. This study employs steel fiber as the toughening material of concrete to prepare eco-efficient, steel fiber-reinforced concrete based on the discussion above. Moreover, graphite tailings-based eco-efficient steel fiber-reinforced concrete should be further studied in the future.
To effectively utilize graphite tailings, the following studies are conducted. First, local raw materials in Heilongjiang Province, China are used for experiment. Based on the particle densely packing theory, the mix ratio is designed, and specific preparation steps are employed to optimize the concrete strength. Then, by performing compressive and flexural experiments, the strength and stress–strain are analyzed and the effect of graphite tailings’ content on the mechanical properties exhibited by concrete is studied. Lastly, the number and distribution of steel fibers in the flexural section of the specimen are studied, and the characteristics of the collaborative work of steel fibers and graphite tailings are discussed.

2. Experimental Programs

2.1. Materials

(1)
Cement. The cement applied in this survey was Portland cement produced in Harbin Yatai Cement Factory, exhibiting a density of 3.0 g/cm3 and a specific surface area of 380 m2/kg.
(2)
Silica fume. The Silica fume was provided by Xinming New Building Materials Co., Ltd., Heilongjiang, China, exhibiting an average particle size of 0.1~0.3 μm and a specific surface area of 20~28 m²/g.
(3)
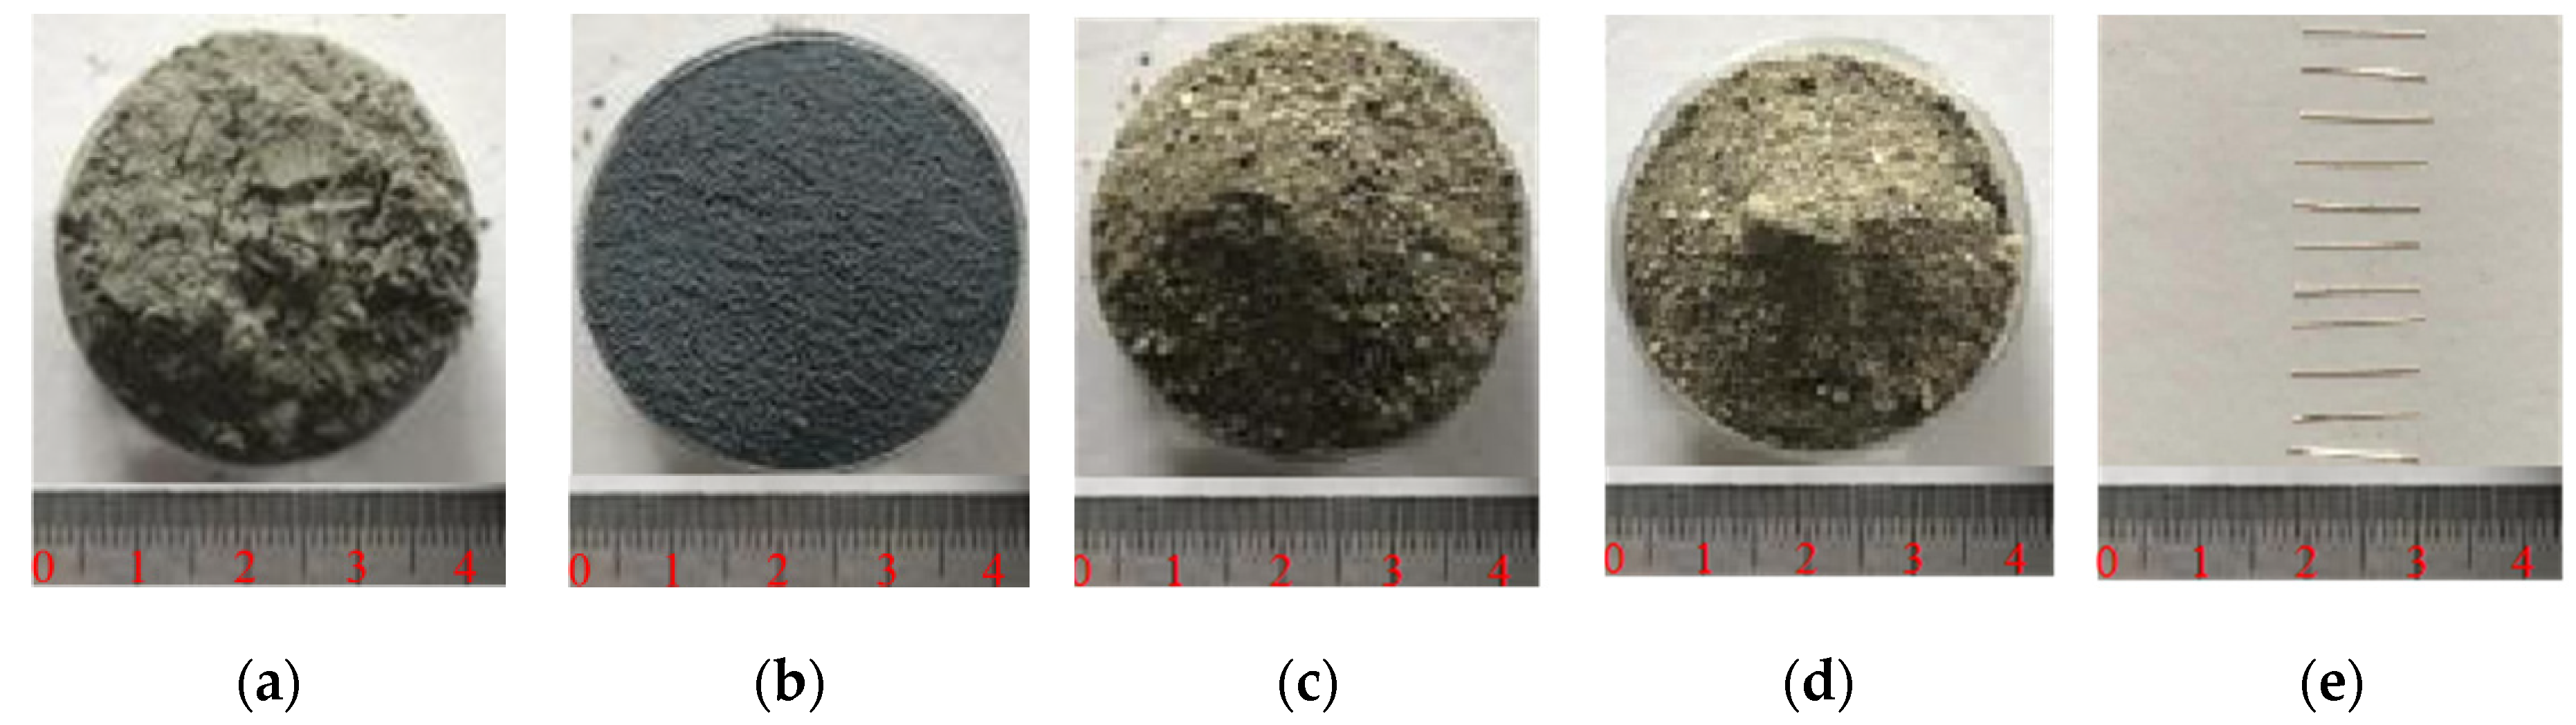
Sand. The maximal particle size of the sand (fineness modulus of 2.5) employed in the experiment was 2.5 mm.
(4)
Graphite tailings (GT). The maximal particle size of the GT (fineness modulus of 1.0) employed in the experiment was 1.25 mm. In this study, the GT was replaced as sand at different volume ratios from 0% to 20%.
(5)
Steel fiber. Copper-plated steel fiber with the following dimensions: a length of 12~14 mm, a diameter of 0.18~0.23 mm, and a tensile strength of the fibers ≥2850 MPa.
(6)
Admixture. Polycarboxylate superplasticizer acted as the admixture, with a water reduction rate not less than 25%, and PH value in 1% aqueous solution was 7~9.
Figure 1a–e present the pictures of cement, silica fume, sand, GT and steel fiber. Table 1 lists the chemical composition of cement, silica fume and GT. The major chemical components of cement were CaO, SiO2, Al2O3, Fe2O3 and MgO (Table 2), of which CaO and SiO2 accounted for about 80% of the total chemical content. The main chemical composition of silica fume was SiO2, taking up over 90% of the total chemical content. The chemical composition of GT mainly included SiO2, CaO, Al2O3 and Fe2O3, SiO2 accounted for about half of the total composition, and CaO, Al2O3 and Fe2O3, respectively, took up about 10% of the total chemical composition.
Table 1 gives a comparison chart of the particle size of sand and GT. The particle size distribution interval of sand was concentrated in four intervals (i.e., 2.50~1.25 mm, 1.25~0.63 mm, 0.63~0.315 mm and 0.315~0.15 mm). The particle size distribution of GT was concentrated in three intervals (i.e., 0.63~0.315 mm, 0.315~0.15 mm and 0.15~0 mm). The particle size distribution of sand tended to increase first and then decrease, and the particle size distribution of GT was irregular. The intersection of the two particle size distribution intervals was 0.63~0.315 mm and 0.315~0.15 mm.
The crushing rate and water absorption of aggregate were measured according to Chinese standard for technical requirements and test method of sand and crushed stone (or gravel) for ordinary concrete (JGJ 52-2006) [42].
Table 3 gives a comparison chart of crushing value and water absorption rate of GT and sand. According to the table, the crushing value and water absorption rate of GT were greater than those of sand. In terms of water absorption, there are two effects for GT on concrete: reducing the actual W/B and increasing agglomeration of cement powder, which have opposite functions for the strength of concrete. Analysis of crushing rate shows that the crushing rate of GT is larger than that of sand, which means that GT has a detrimental effect on concrete elastic modulus.
Table 4 presents the microscopic pictures of sand and GT with different particle sizes. The surface of sand was smoother, and the surface of GT was rough and uneven. The smooth surface of the sand slightly affected the reaction of the cementitious material in the mixing and curing process. Although the rough and uneven surface of GT can slightly increase the bite force between the aggregate and the cementitious matrix, it can easily adsorb cement and silica fume, thereby causing more cementitious materials that cannot participate in the hydration reaction and the pozzolanic reaction.

2.2. Mix Design Based on Particle Densely Packing Theory

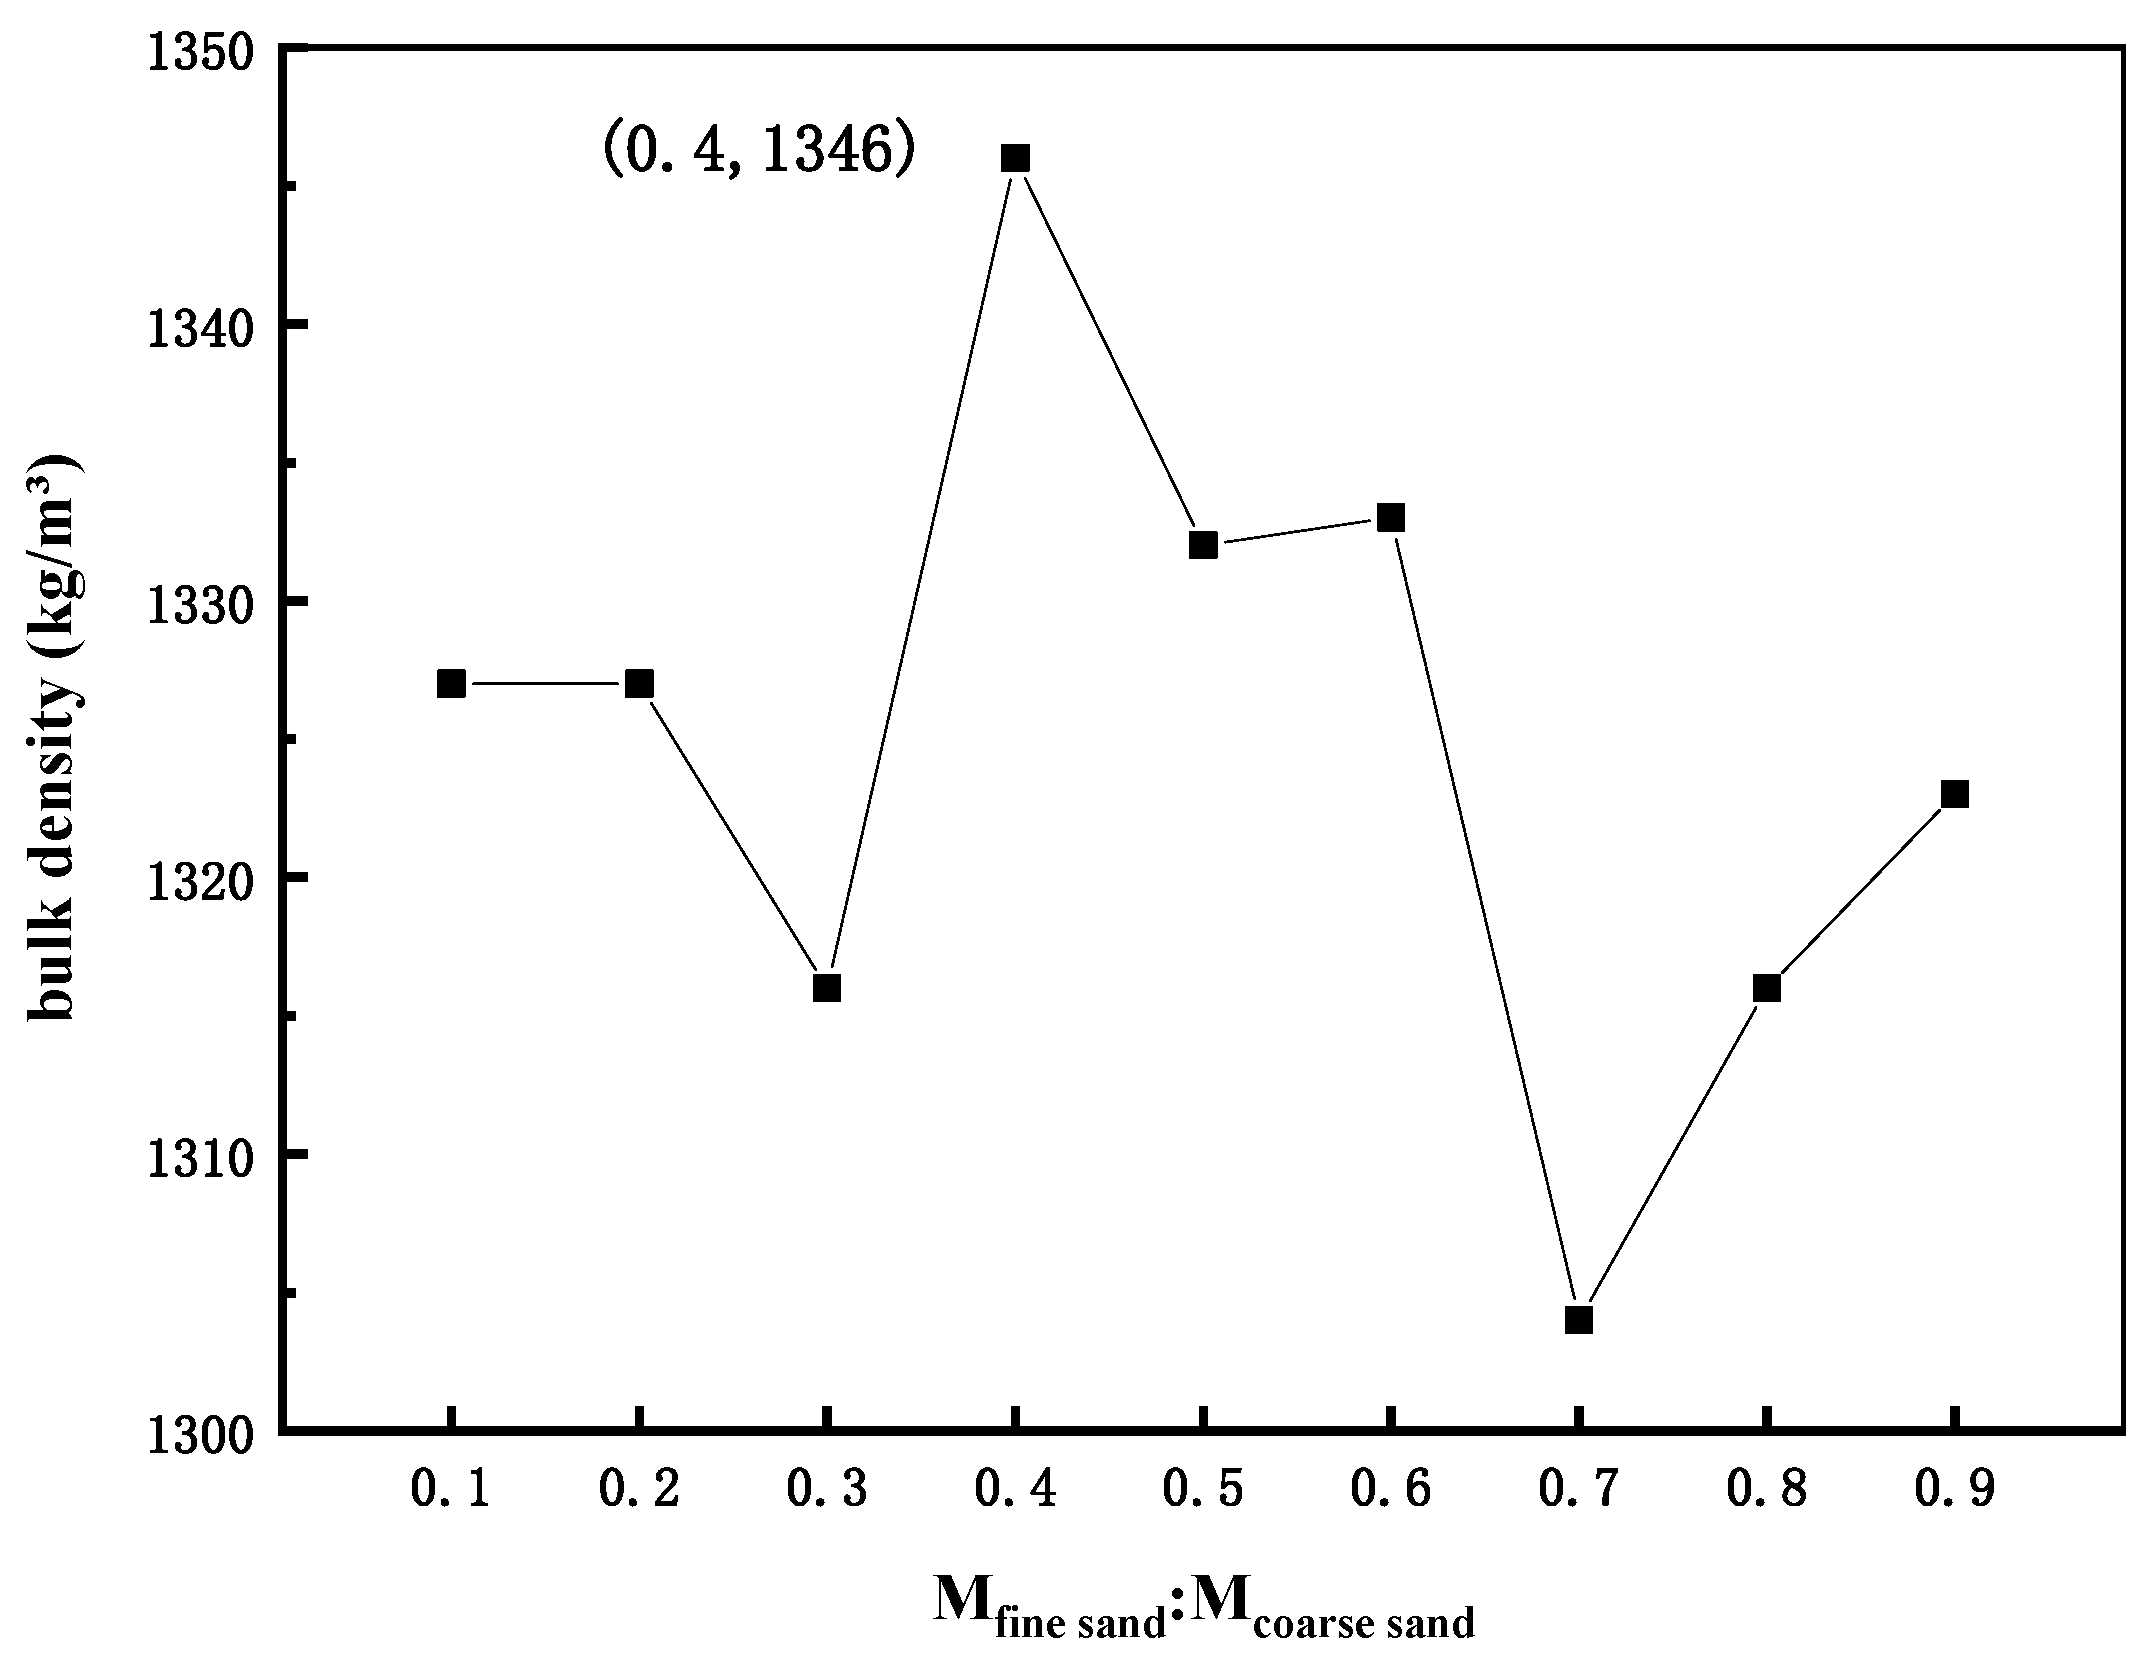
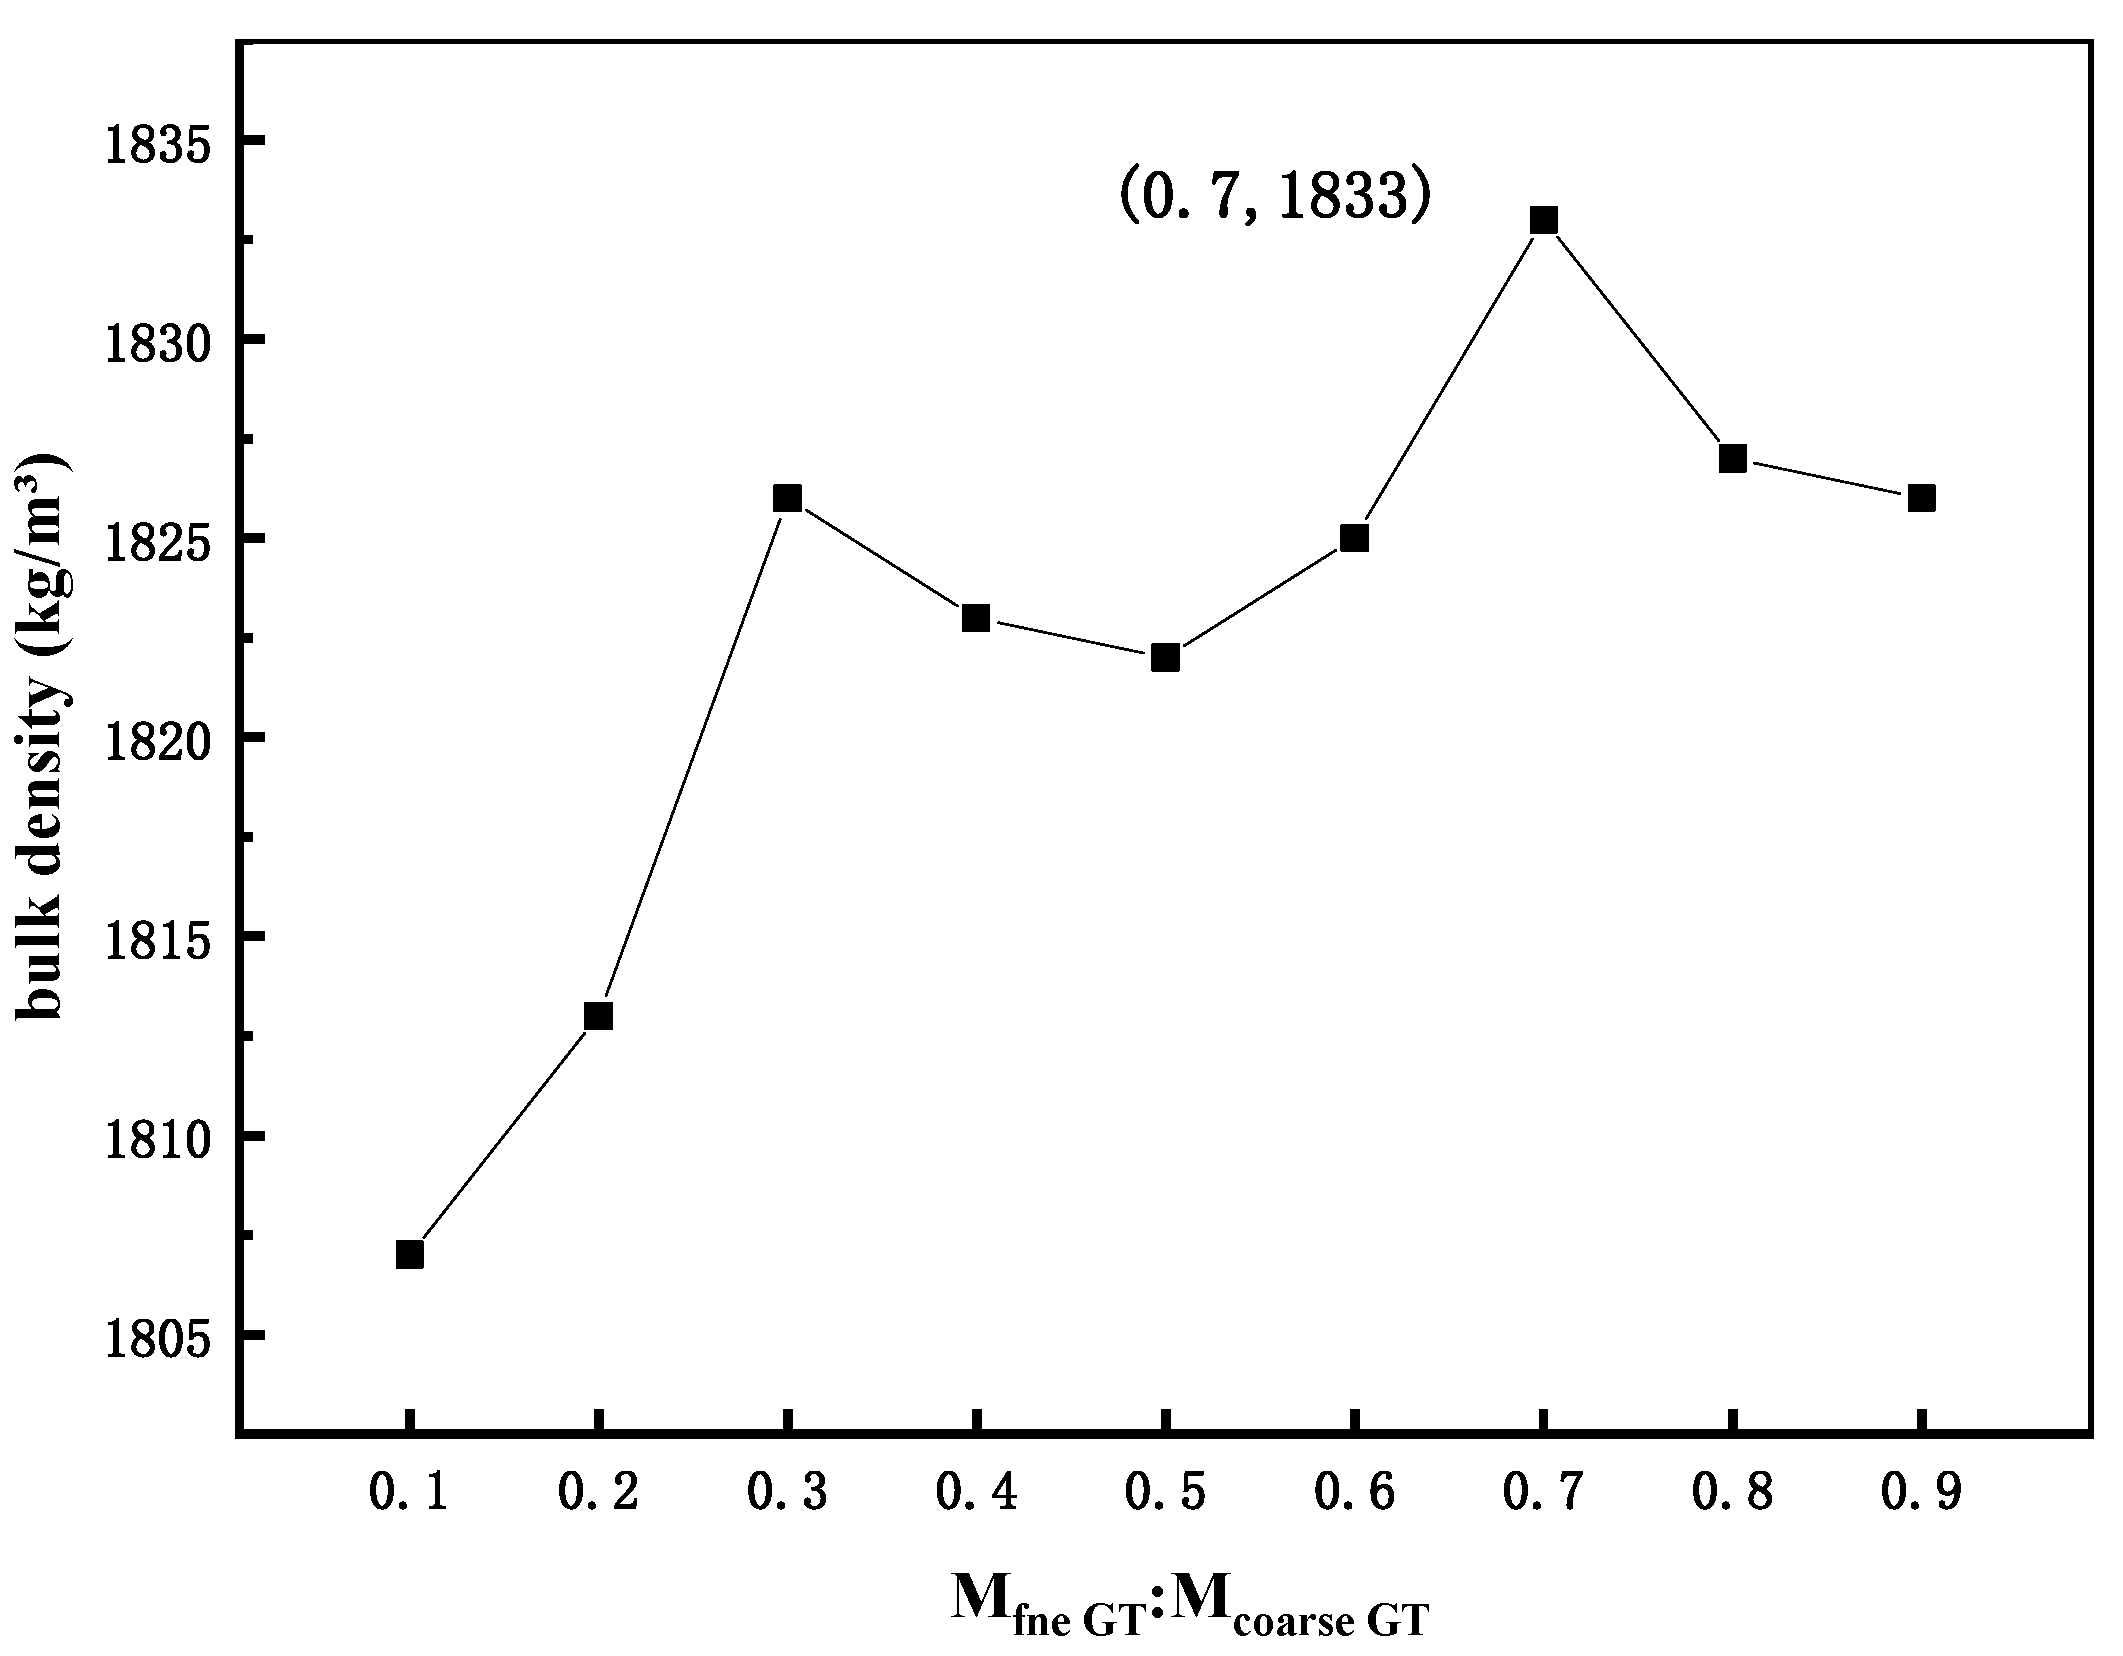
2.2.1. Maximal Mixed Bulk Density of Sand and GT in Different Grades

Aggregate gradation significantly impacts the strength of concrete matrix [43,44,45,46]. The experiments were performed by referencing related theories [47] to make the distribution of aggregates more reasonable. GT replacement sand was replaced in the identical particle size range. Table 1 shows that the main particle size distribution range of sand was concentrated between 2.5 and ~0.15 mm, and the main particle size distribution range of GT was concentrated between 0.63 and ~0 mm. The identical range of particle size distribution of sand and GT was 0.63~0.315 mm and 0.315~0.15 mm. Accordingly, the selected aggregate particle size range for the experiment was 0.63~0.315 mm and 0.315~0.15 mm. Sand/GT with a particle size range of 0.63~0.315 mm was termed coarse sand/GT, and the particle size range of 0.315~0.15 mm was termed fine sand/GT. The basic physical parameters of sand and GT were measured before the test (Table 5).
(1)
Determination of the optimal ratio of different grades of sand and GT
In theory, fine sand /GT can be overall filled into coarse sand/GT. First, the fine sand /GT with a particle size of 0.315~0.15 mm was mixed into the coarse sand/GT with a particle size of 0.63~0.315 mm. After fully mixing, a test was applied to the samples to determine the maximal unit weight of the mixture. Lastly, the optimal ratio of fine sand/GT and coarse sand/GT was determined. The test result of sand is presented in Figure 2, and the test result of GT is shown in Figure 3. The filling coefficient of fine sand/GT filled with coarse sand/GT was defined as α, and it was calculated by Equation (1).
α = W 0.315 ~ 0.15   mm W 0.315 ~ 0.15   mm + W 0.63 ~ 0.315   mm
where α denotes the fill coefficient; W 0.315 ~ 0.15   mm represents the initial dosage of sand/GT with a particle size of 0.315~0.15 mm (kg/m³); W 0.63 ~ 0.315   mm expresses the initial dosage of sand/GT with a particle size of 0.63~0.315 mm (kg/m³).
According to Figure 2, when fine sand and coarse sand were mixed at 0.4:1, the maximal bulk density could be 1346 kg/m3, and the apparent density at this time measured through the test was 2586 kg/m3.
Figure 3 shows that when fine GT and coarse GT were mixed at 0.7:1, the maximal bulk density was 1833 kg/m³, and the apparent density measured by the test was 2858 kg/m3.
The optimal gradation of sand and GT is shown in Table 6.
(2)
Preliminary determination of different grades of sand and GT
The maximal bulk density of sand/GT per unit volume refers to the sum of the initial dosages of aggregates in different particle size ranges. Based on Equation (1), the initial dosage of sand and GT can be determined. The maximal packing density of sand/GT is determined in Equation (2). Table 7 lists the initial dosage of sand and GT.
ρ density , max = W 0.315 ~ 0.15   mm + W 0.63 ~ 0.315   mm
where ρ density , max denotes the maximal packing density of sand/GT (kg/m³).
(3)
Determination of the final dosage of different grades of sand and GT
The void ratio was calculated after the optimal compaction state of the aggregate was determined, as shown in Equation (3). The number of cementitious materials and aggregates (sand/GT) was determined according to the void ratio.
P = ( 1 ρ bulk   density ρ apparent   density ) × 100 %
where P denotes the Porosity of different graded sand/GT system (%); ρ bulk   density is the bulk density of sand/GT (kg/m³); ρ apparent   density is the apparent density of sand/GT (kg/m³).
The cementitious material fills the voids of the fine aggregate. Furthermore, it should wrap the aggregate. Therefore, the calculation of the volume of the cementitious material requires the void volume to be multiplied by an additional coefficient n, which is taken as 1.4 [48,49]. The calculation of the amount of cementing material per unit volume is expressed in Equation (4).
V p = n P
where V p denotes the amount of cementing material per unit volume; n is the additional coefficient.
The calculation of the amount of aggregate per unit volume is shown in Equation (5).
V a g g = 1 V p = W 0.315 ~ 0.15   mm ρ 0.315 ~ 0.15   mm + W 0.63 ~ 0.315   mm ρ 0.63 ~ 0.315   mm
where V a g g denotes the amount of aggregate per unit volume; W 0.315 ~ 0.15   mm represents the final dosage of sand/GT with a particle size of 0.315~0.15 mm (kg/m³); W 0.63 ~ 0.315   mm is the final dosage of sand/GT with a particle size of 0.63~0.315 mm (kg/m³); ρ 0.63 ~ 0.315   mm expresses the apparent density of sand/GT with a particle size of 0.63~0.315 mm (kg/m³); ρ 0.315 ~ 0.15   mm expresses the apparent density of sand/GT with a particle size of 0.315~0.15mm (kg/m³).
The final dosages of sand and GT are listed in Table 8.
(4)
Determination of the amount of cementitious material
According to the pilot test, when the W/B was 0.2, the replacement rate of silica fume to cement reached 20%, and the volume content of steel fiber was 2%. The cement paste system could reach the optimal water demand, and the concrete strength was also better. The density of the mixed cementing material measured by the test was 2812 kg/m³, and the correlation between the cementing material and the water consumption is expressed in Equation (6).
V p = m W ρ W + m C M ρ C M
where V p denotes the total amount of cementing material; m W is the water consumption per unit volume (kg/m³); ρ W is the density of water (kg/m³), take 1000 kg/m³; m C M is the amount of cementing material per unit volume (kg/m³); ρ C M expresses the density of cementitious material (kg/m³).

2.2.2. Mixing Proportions of Concrete

According to the above tests and related calculations, the final test mix ratio is listed in Table 9: GT replaces sand by volume, where GT00 denotes the specimen with 0% graphite tailings’ content. GT10 represents the specimen with 10% graphite tailings’ content, and GT20 is the specimen with 20% graphite tailings’ content.

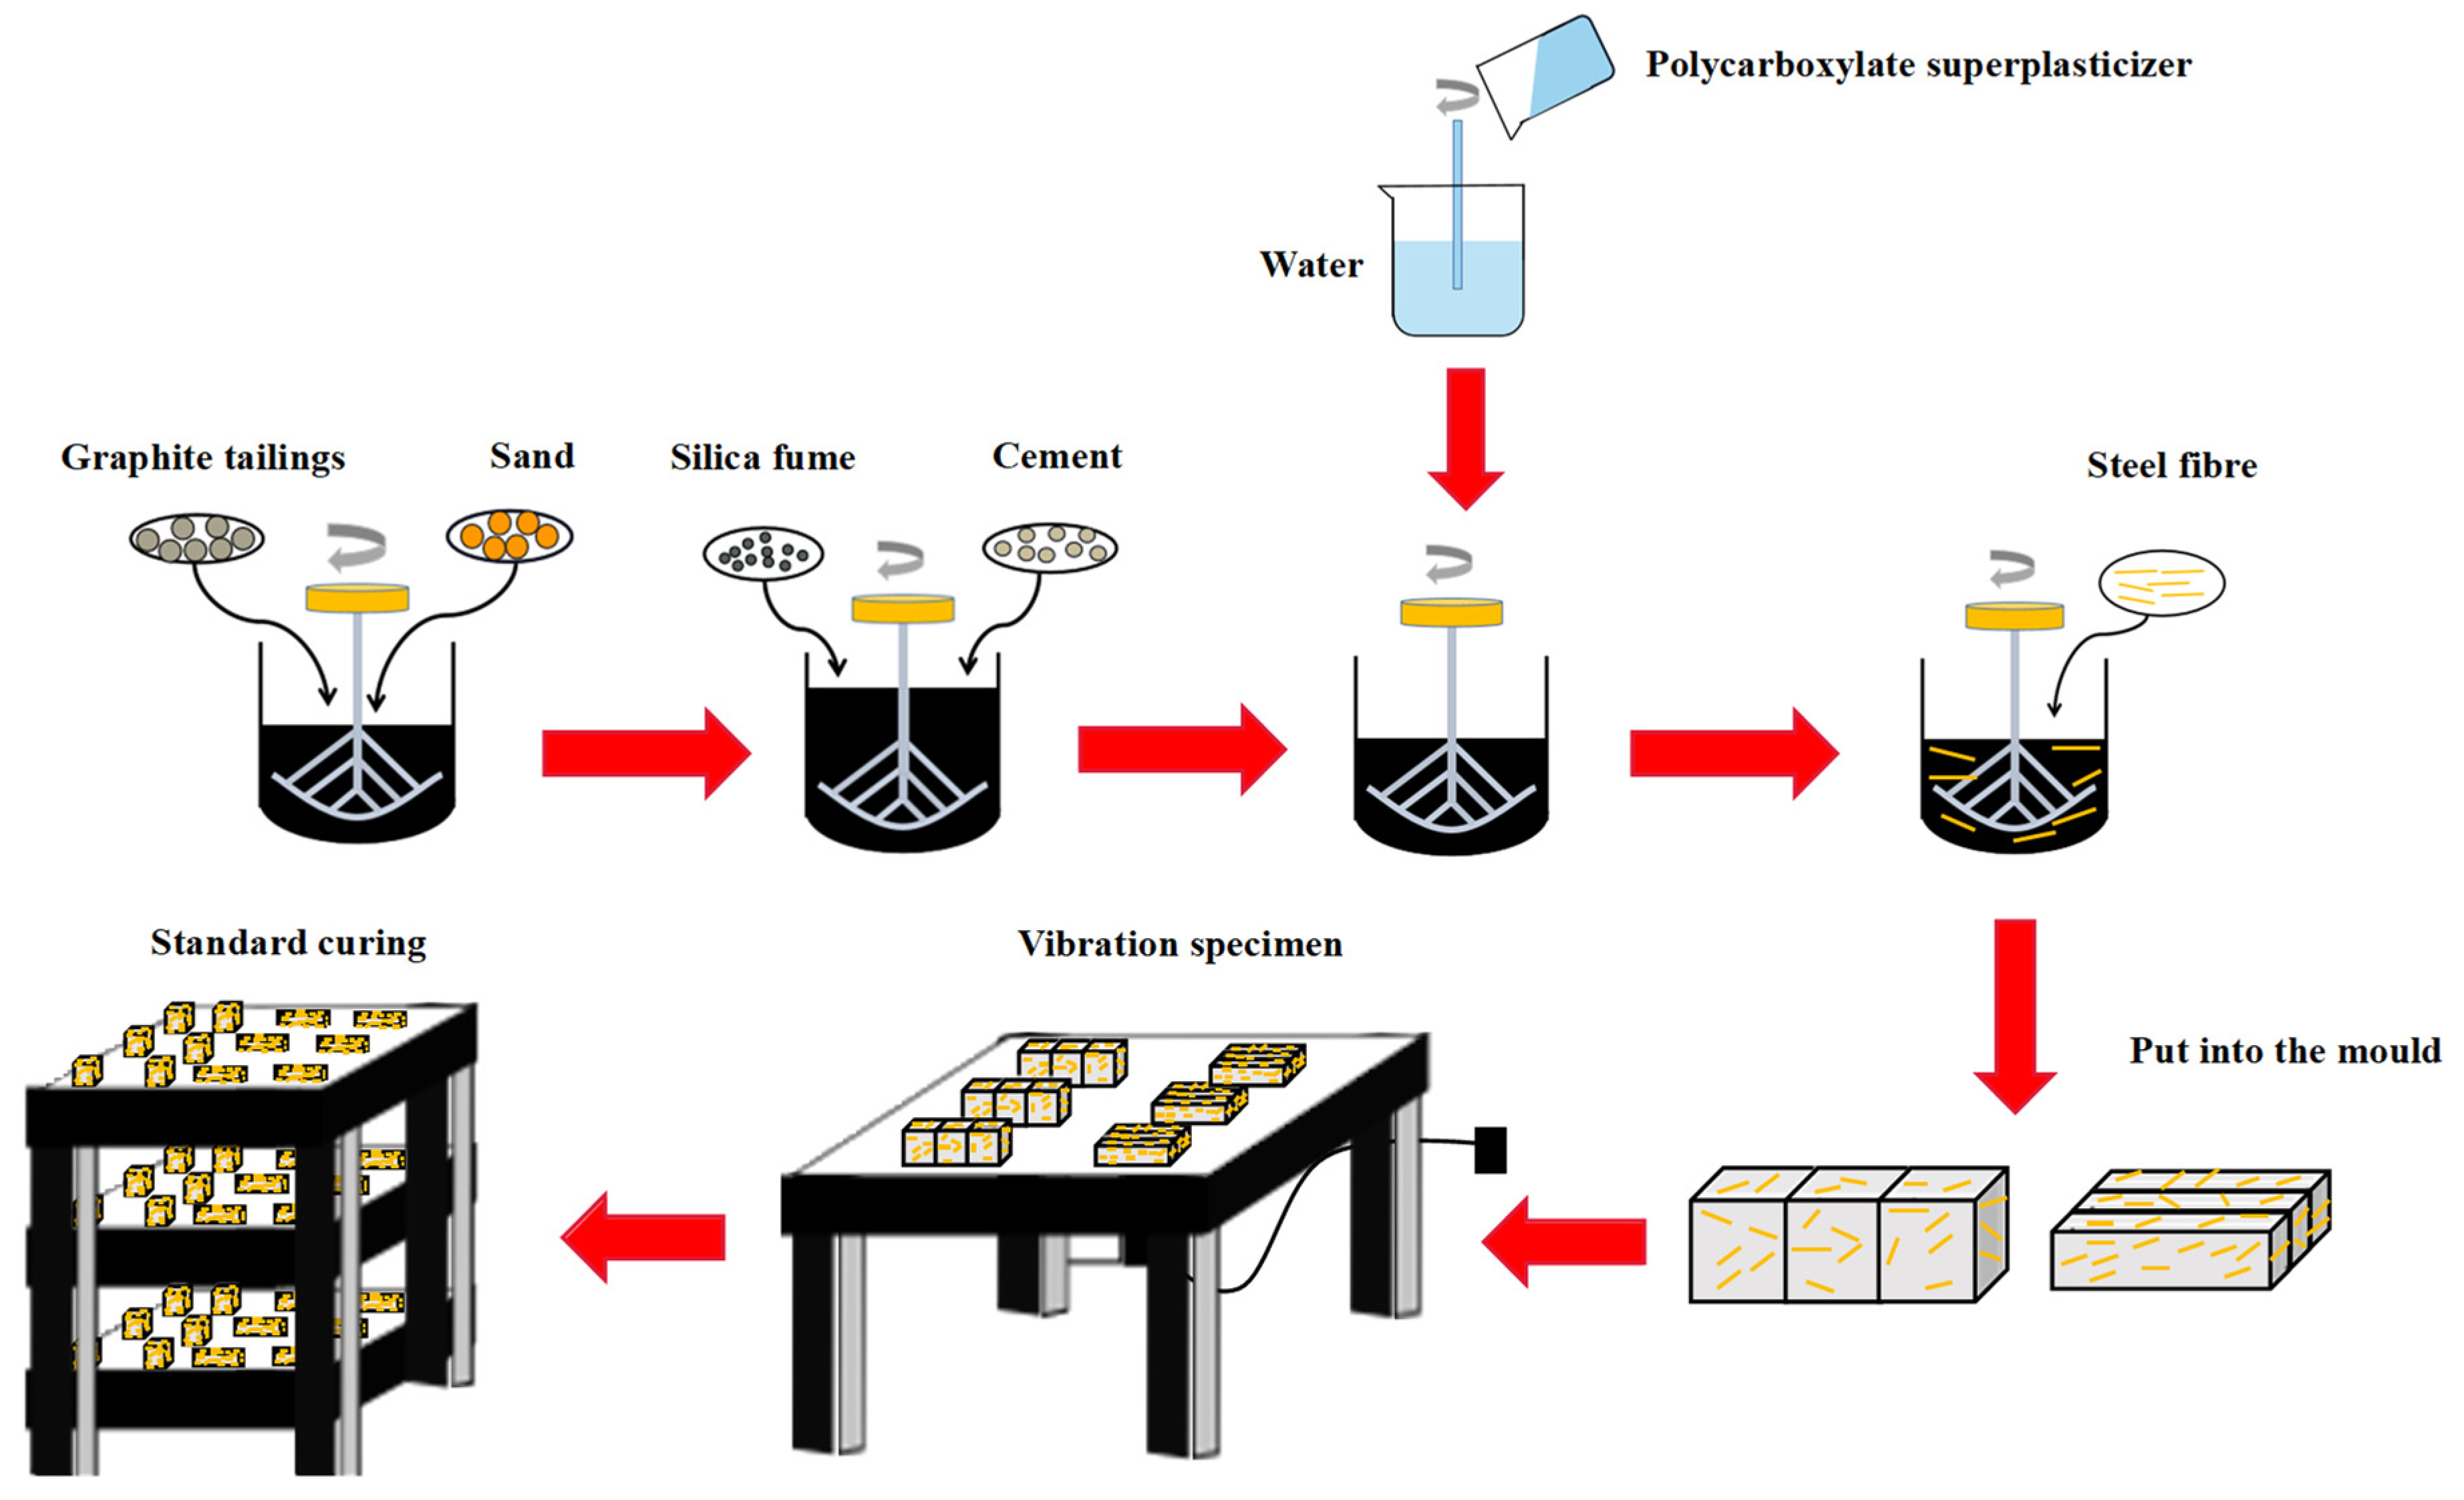
2.3. Concrete Preparation Process

The preparation process of GT ecological concrete is illustrated in Figure 4, and the preparation steps are as follows:
(1)
The sand and GT were poured into the mixing pot and rotated at a low speed for 120 s. The fine-grained sand/GT and coarse-grained sand/GT were mixed thoroughly. Sand and GT were employed for the first stage of filling.
(2)
Silica fume and cement were poured into the mixing pot and rotated at a low speed for 120 s. Silica fume and cement were applied for the second stage of filling.
(3)
The mixed liquid of water and admixture that was evenly stirred in advance was poured and stirred at a low speed for 120 s and then at a high speed for 180 s. The tricalcium silicate (C3S) and dicalcium silicate (C2S) in the cement were hydrated to form hydrated calcium silicate (C-S-H) and Ca(OH)2 at this time. Pozzolanic reaction between SiO2 and Ca(OH)2 in silica fume synthesized C-S-H. Two reactions above complemented and coordinated with each other, i.e., Ca(OH)2 was consumed, and considerable C-S-H gel was distributed in the slurry, which increased the strength of the slurry after hardening. The pores of the body were filled for the third time, which made the slurry denser.
(4)
Steel fibers were poured into the mixing pot, and the mixing was accelerated until the raw materials in the slurry were evenly mixed. The addition of a small number of steel fibers slightly impacted the fluidity of the slurry. Due to the high tensile properties exhibited by steel fibers, the flexural and compressive strength of concrete were improved.
(5)
The mixture was poured into a mold of 70.7 mm × 70.7 mm × 70.7 mm and 40 mm × 40 mm × 160 mm and the ZDP-1200 × 1200 vibration table was used for vibration molding.
(6)
It was stored in an environment at an ambient temperature of 20 ± 1℃ and a relative humidity of 60% for one day. After the samples were demolded, they were cured in a curing room at an ambient temperature of 20 ± 2℃ and a relative humidity of ≥95%. The specimens were cured, and the ages were 3 days, 7 days and 28 days.

2.4. Experiment Methods

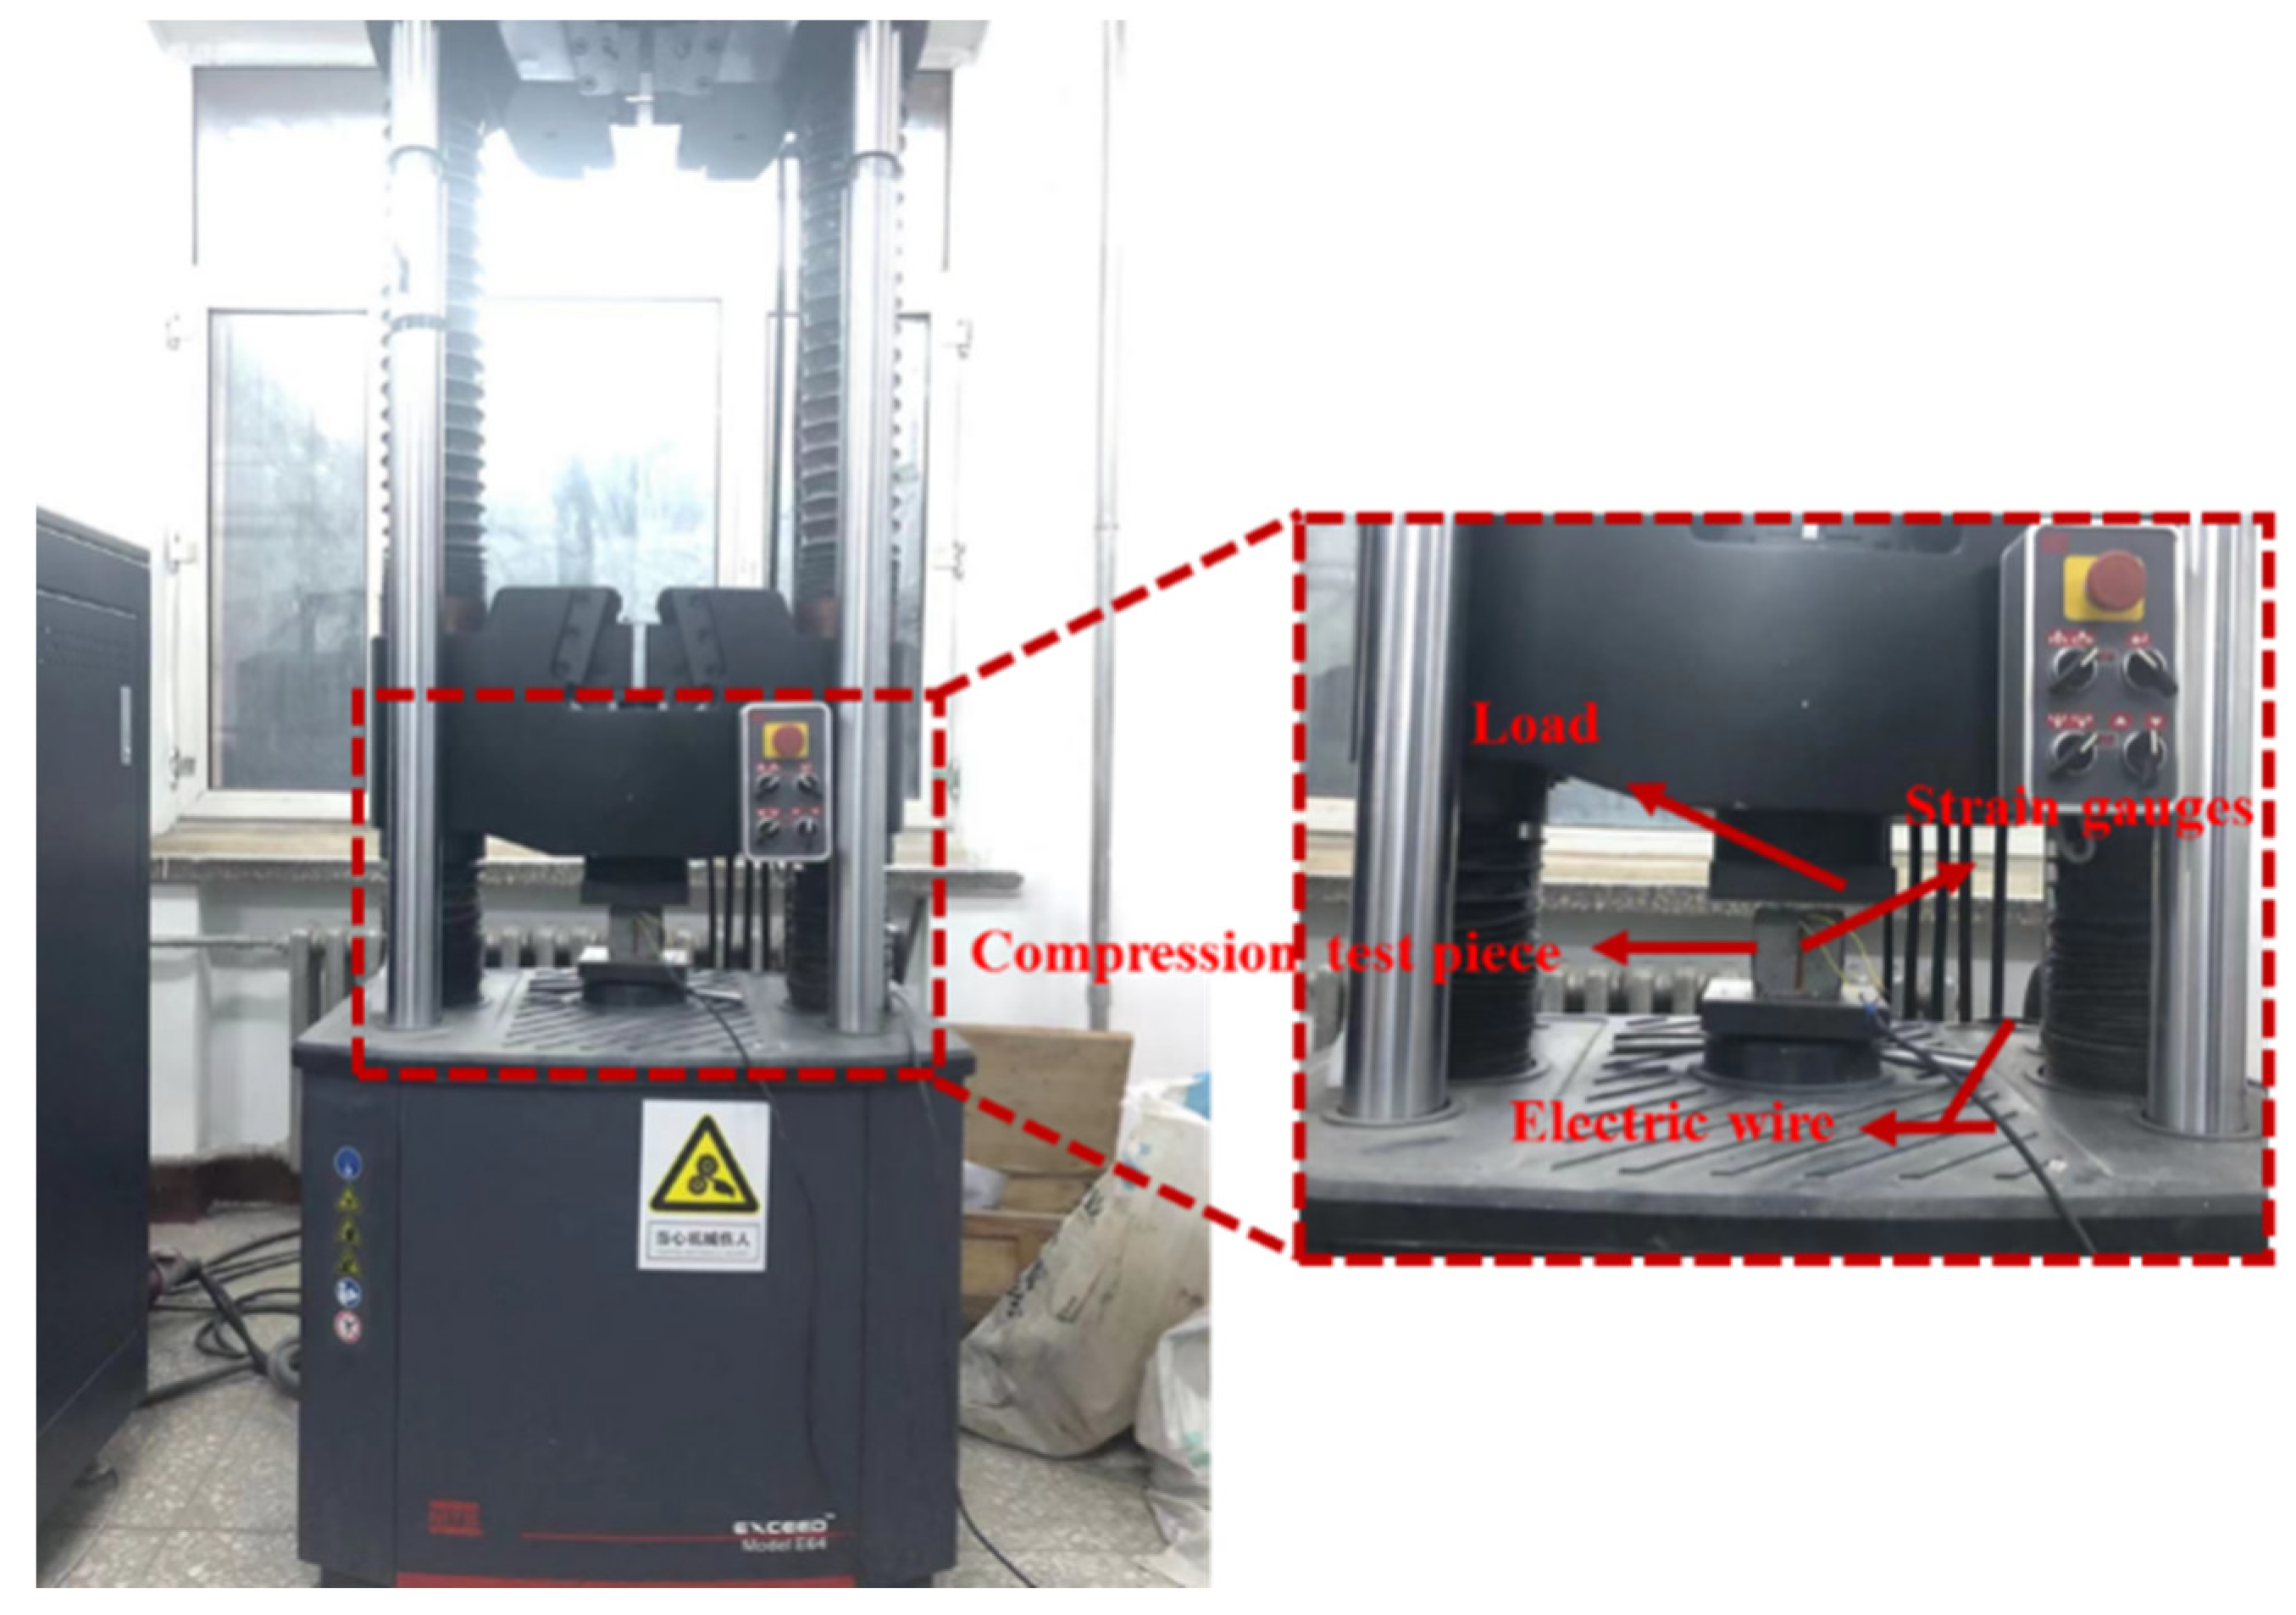
2.4.1. Compression Test

The compressive test was performed in accordance with Chinese regulations GB/T 17671-1999 [50]. For the test, the electronic universal testing machine (maximal load of 600 KN), produced by MTS Corporation (Eden Prairie, Minnesota, United States), was used. The compression test is presented in Figure 5; the load was applied continuously and uniformly at a loading speed of 2400 N/s during the test. Strain gauges were used to measure the strain of the compression test piece and the computer recorded the load on the specimen in real time. The compressive strength was obtained by Equation (7), and the arithmetic average of the measured values of 3 test pieces was taken as the strength value of the group of specimens.
f c c = F A
where f c c denotes the compressive strength of concrete (MPa); F is the load when the specimen is broken (N); A is the area of the specimen under pressure (mm2).

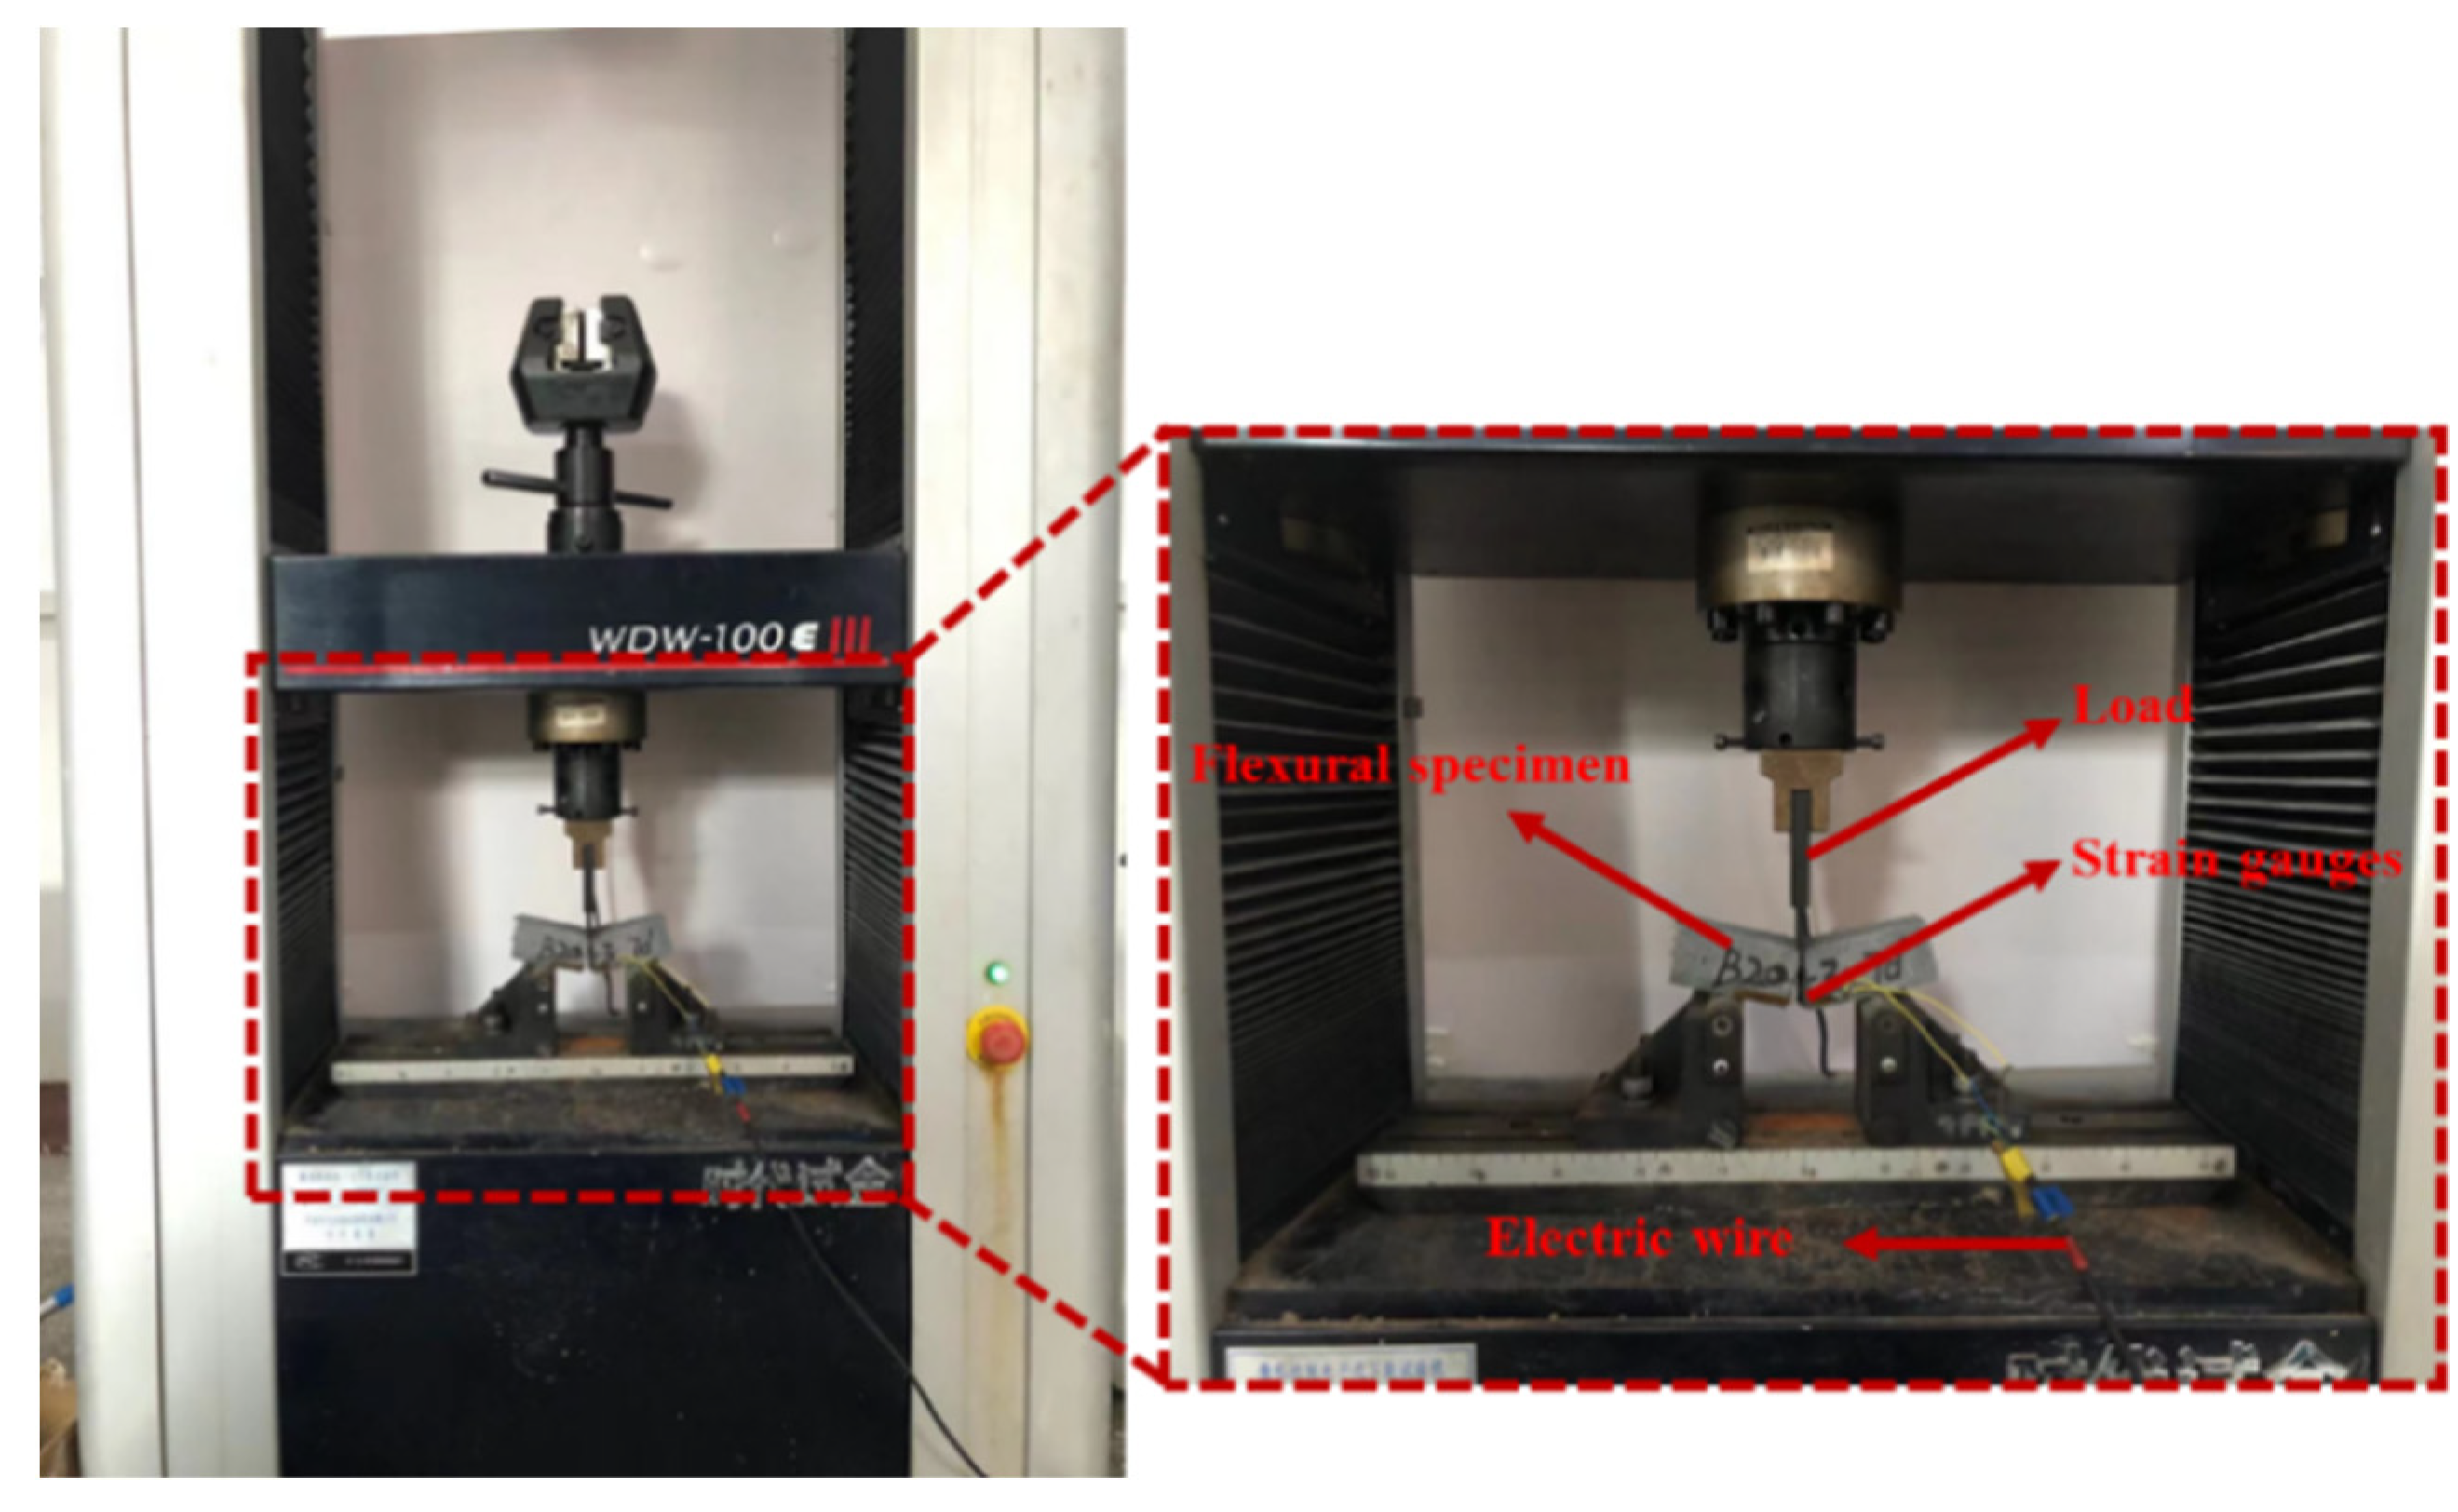
2.4.2. Flexural Test

The flexural test was performed by complying with Chinese regulations GB/T 17671-1999 [50]. According to the test, the microelectronic control electronic universal testing machine was applied (maximal load of 100 KN), which was manufactured by Jinan Shijin Testing Machine Company, Shandong, China. The flexural test is illustrated in Figure 6. The load was applied continuously and uniformly at a loading speed of 50 N/s during the test. Strain gauges were used to measure the strain of the flexural specimen and the computer recorded the load on the specimen in real time. The flexural strength of the test piece was obtained from Equation (8), and the arithmetic average of the measured values of the 3 test pieces was taken as the strength value of the group of specimens.
f f = 3 F l 2 b 3
where f f is the concrete flexural strength (MPa); F is the load when the specimen is broken (N); l is the span between supports (mm); b is the side length of square section (mm).

3. Results and Discussion

3.1. Test Phenomenon Analysis

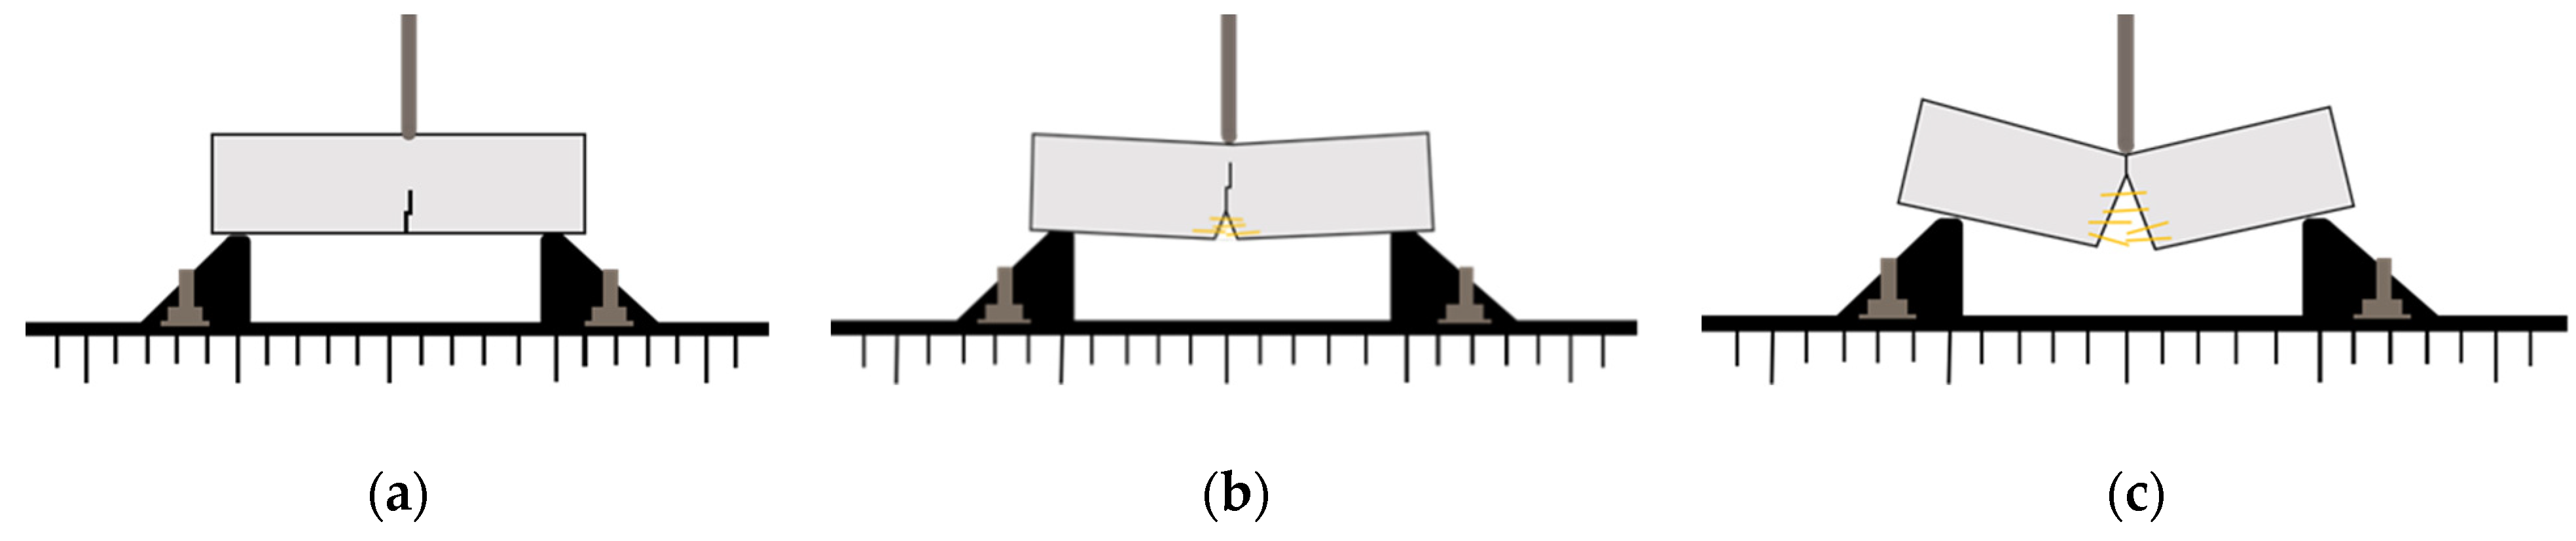
3.1.1. Phenomenon Analysis of Compression Test

At first, the specimen was compressed, and no significant signs were found. Subsequently, a small number of concrete fragments were gradually peeled off on the surface, micro-cracks were generated and the cracks tended to be expanded. Lastly, a crack penetrated the specimen (accompanied by a loud noise), and the specimen was crushed. The specimen was not crushed under the drawing connection effect of steel fibers. Moreover, the specimen remained a complete whole, and the residual strength of the test piece was still high. The compression failure patterns of different mixes are illustrated in Figure 7. The compression process of the specimen underwent 4 stages (i.e., compression stage, linear enhancement stage, defect expansion stage and the destruction stage of the specimen).
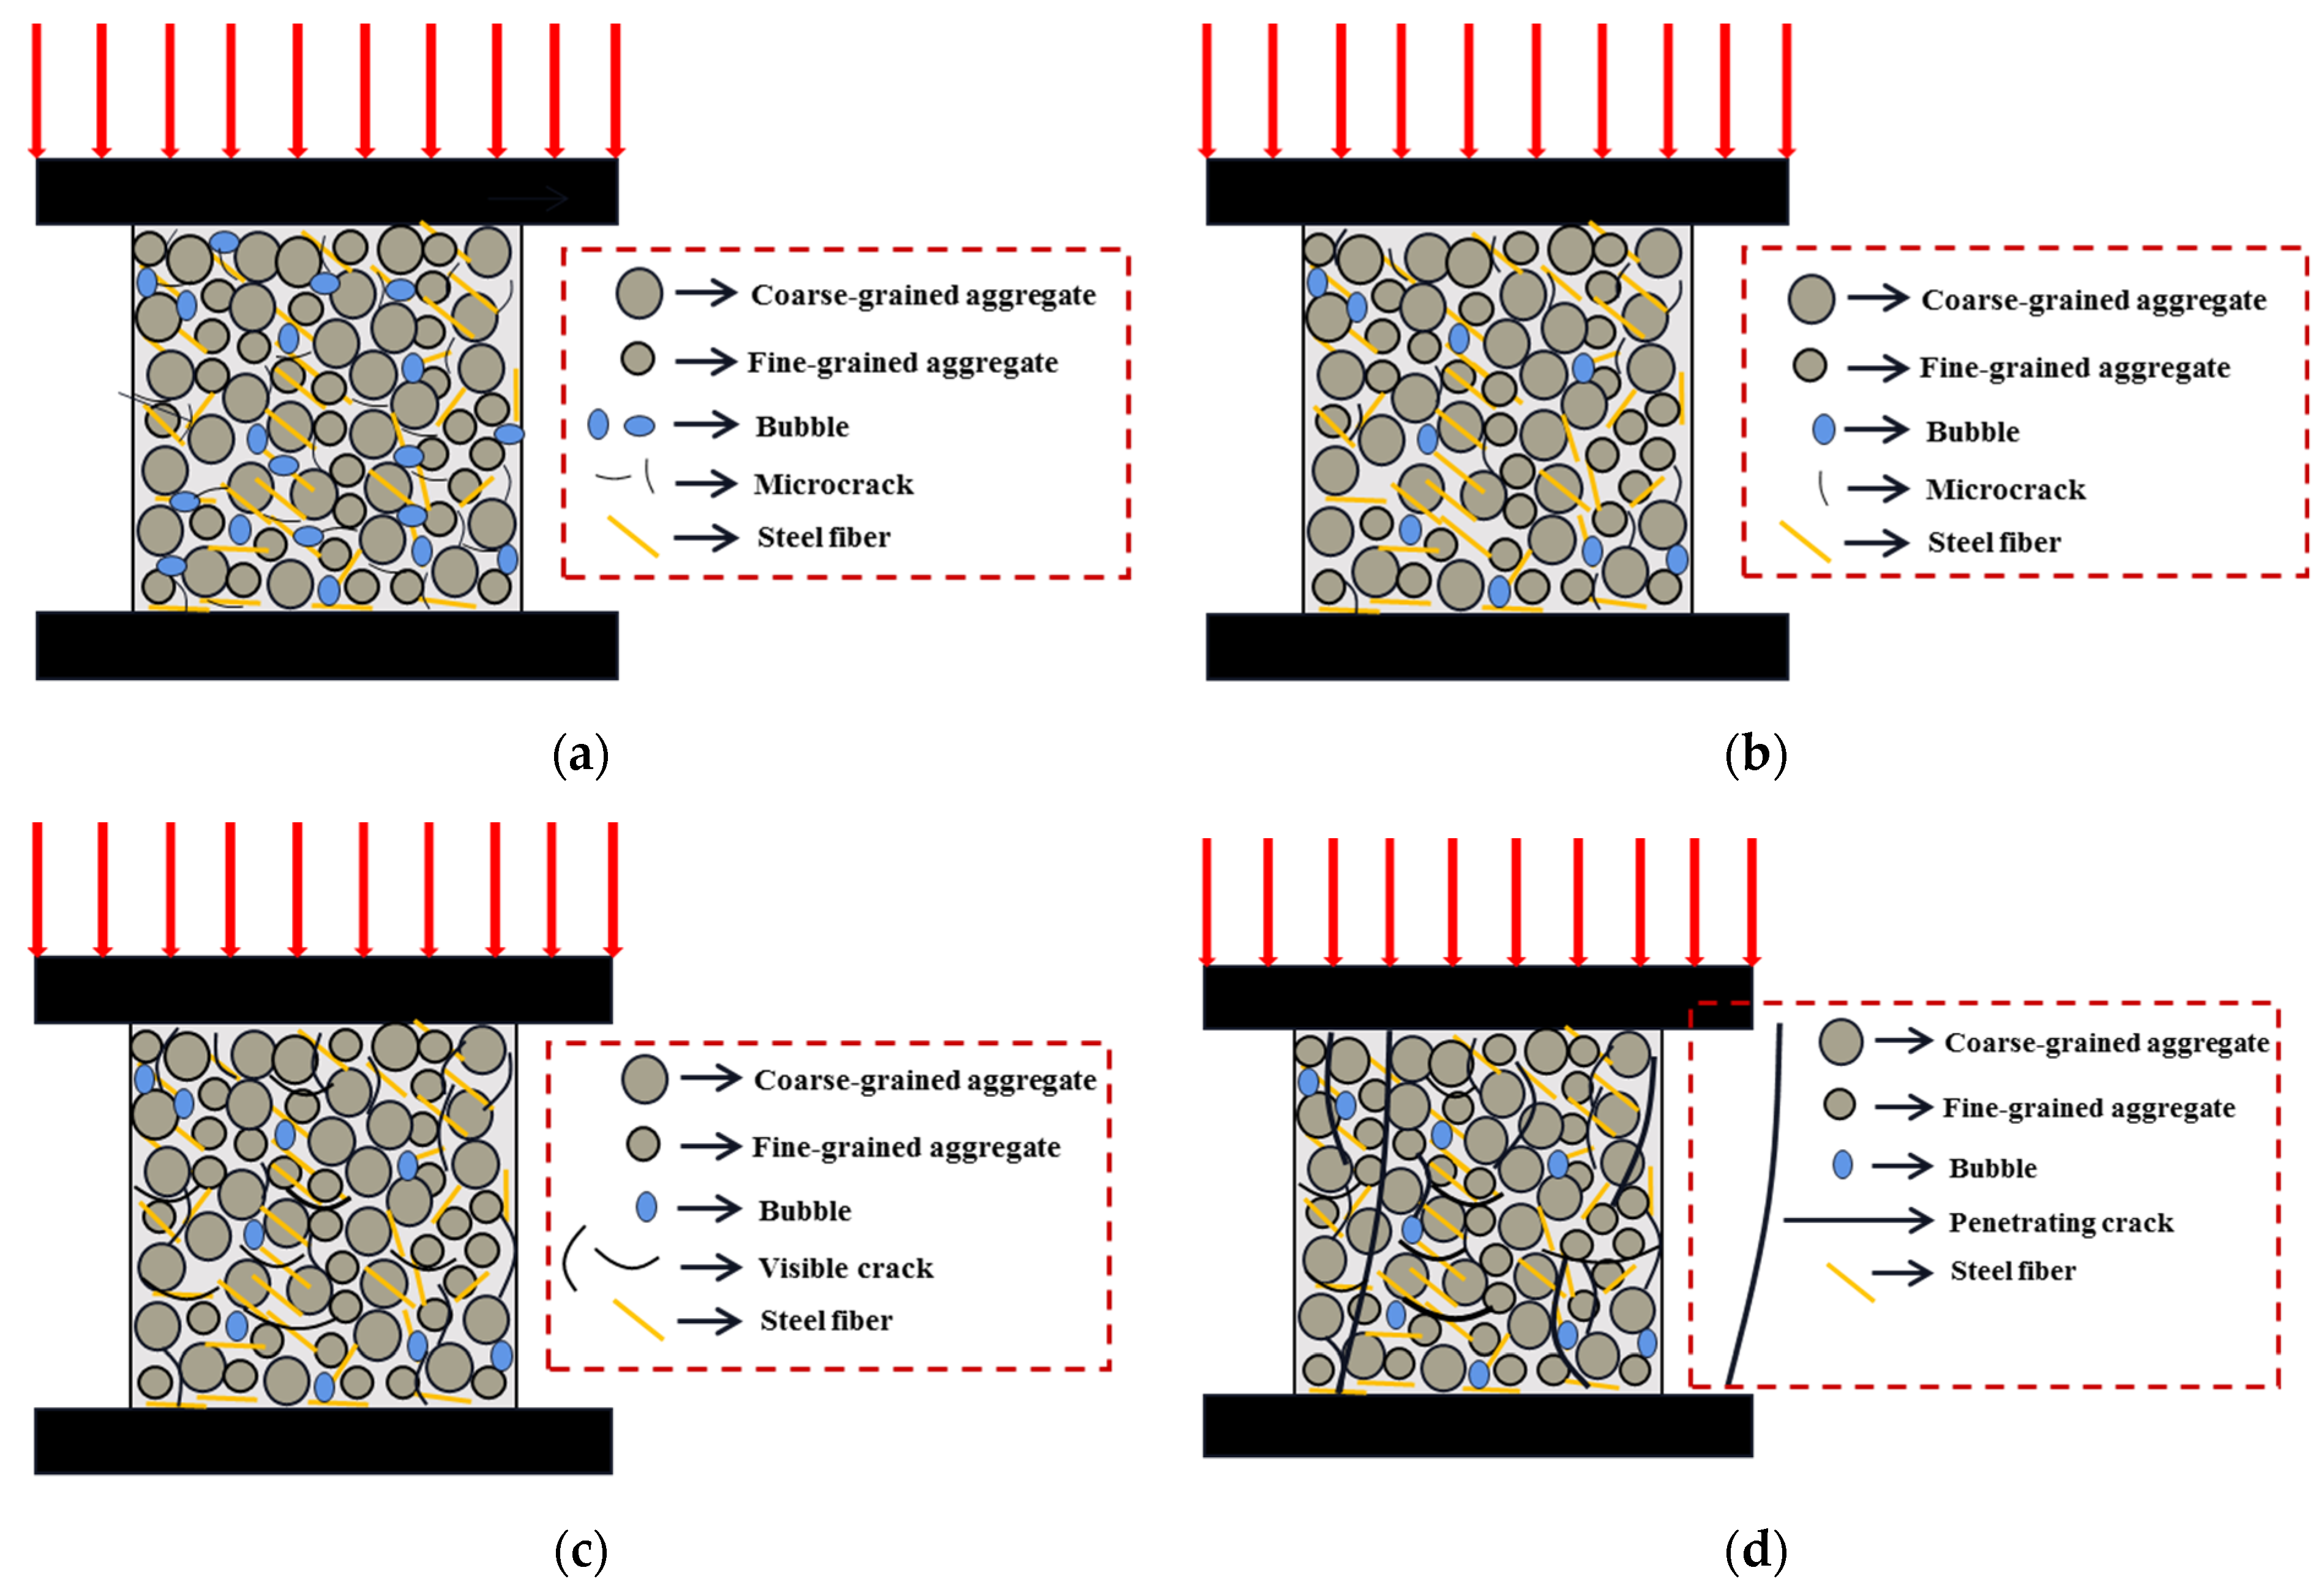
  • Compression stage. The schematic diagram of compression stage is given in Figure 8a. The internal structure of the concrete varied, and the internal cracks and pores of the concrete perpendicular to the direction of the force were gradually compacted, which made the concrete denser.
  • Linear enhancement stage. The schematic diagram of linear enhancement stage is shown in Figure 8b. The external force was not large, and the stress concentration within the concrete caused by the external force was insufficient to affect the strength of the concrete. The internal bonding force of the concrete matrix was strong and the deformation attributed to the interaction between the materials was coordinated with the others. The deformation response and the stress and strain of the material varied linearly.
  • Defect expansion stage. The diagram of defect expansion stage is presented in Figure 8c. The effect of the external force began to manifest. Cracks and remaining pores in the concrete parallel to the direction of the force underwent stress concentration under the huge external force, thereby causing concrete surface to peel off. The cracks in the identical part of the concrete began to bifurcate and gradually merged in different parts.
  • Destruction stage. The schematic diagram of destruction stage is illustrated in Figure 8d. The cracks in the identical part of the concrete continued to expand, and the cracks in different parts penetrated together. Lastly, the specimen was penetrated and damaged by the cracks, and the compression test was over.

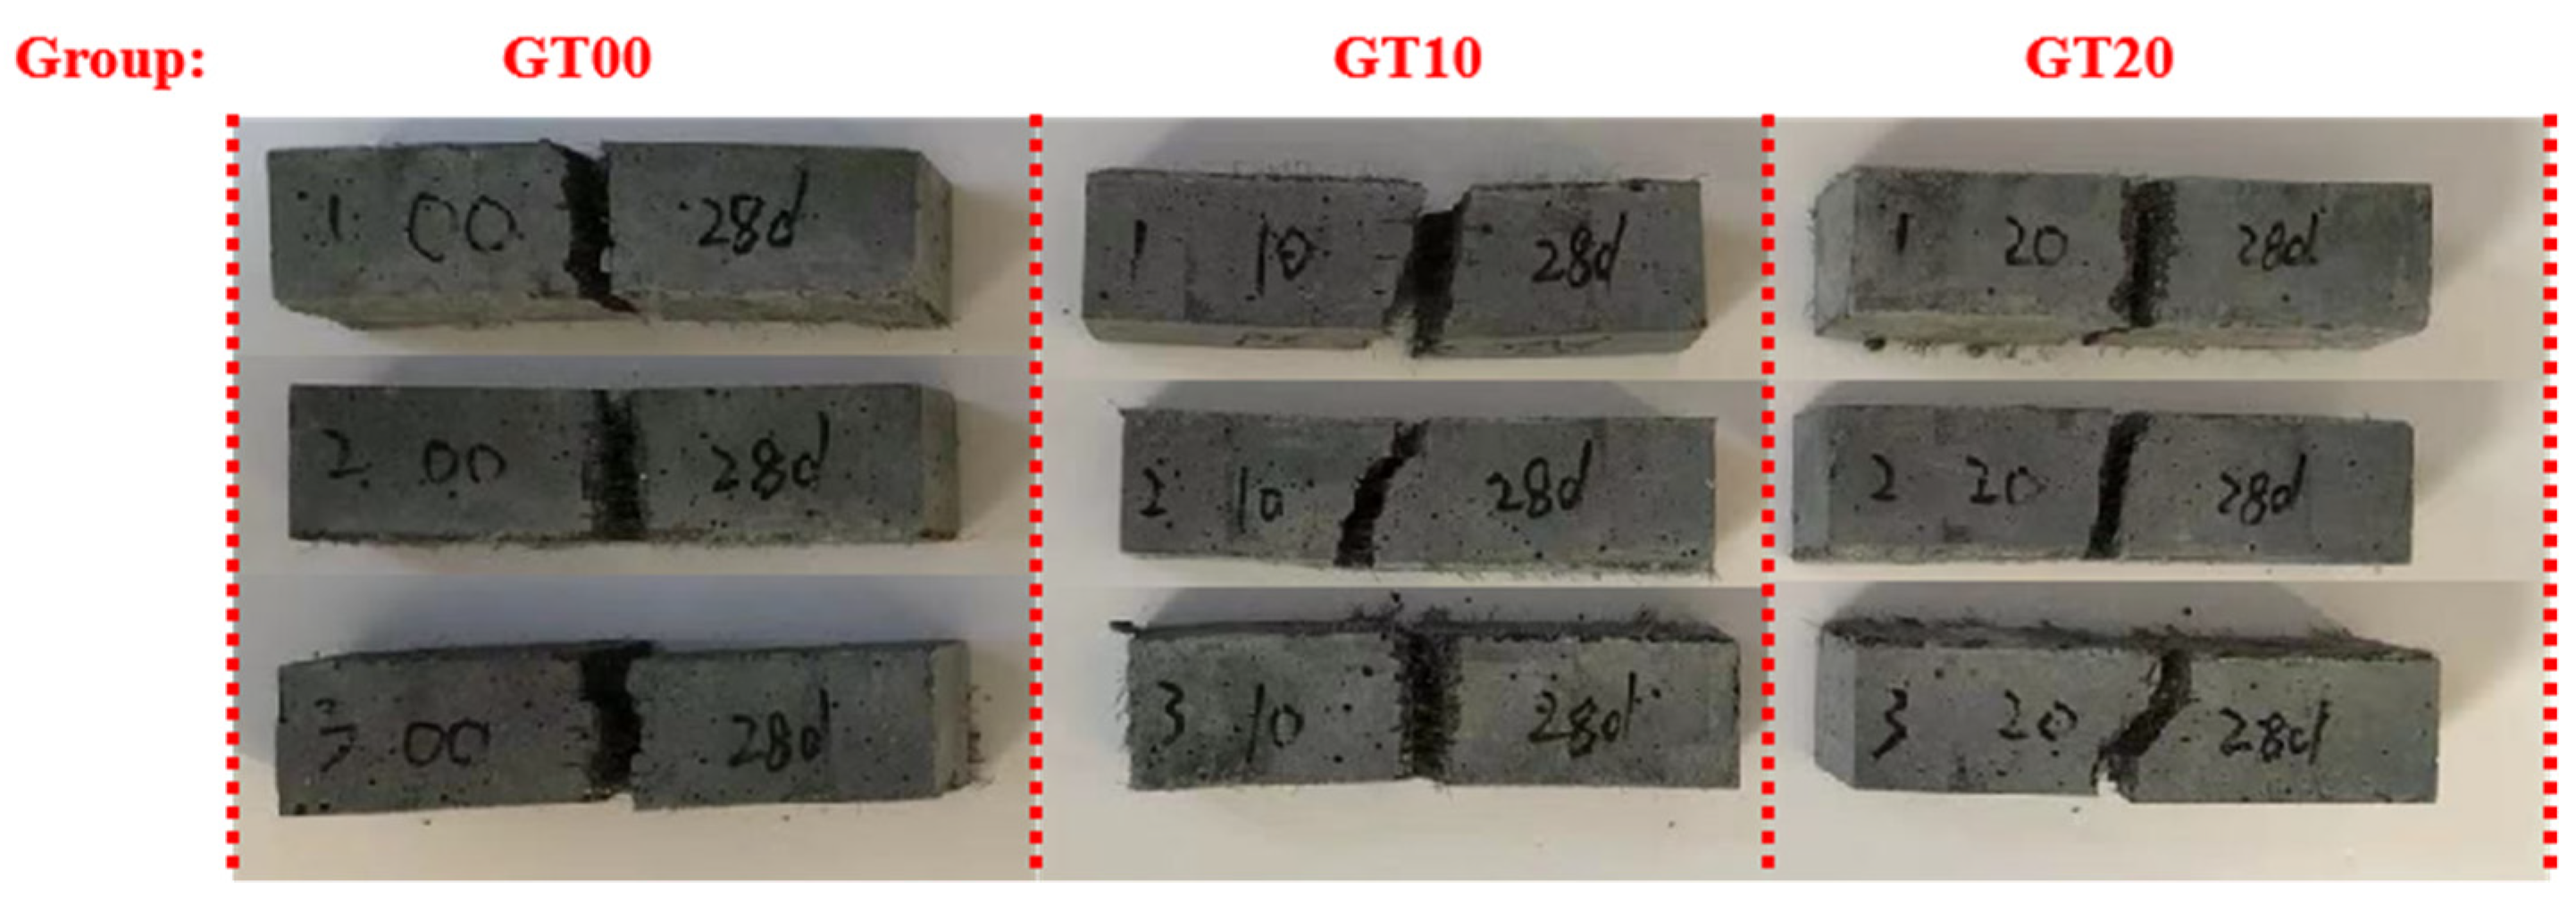
3.1.2. Phenomenon Analysis of Flexural Test

At first, no deformation or damage was caused to the specimen when the indenter of the machine was in contact with the specimen, and the duration at this stage was significantly shorter. Subsequently, micro-crack occurred in the specimen at the mid-span position. Lastly, the micro-crack developed into penetrating crack, the width of which became larger and lastly extended to the entire section. The flexural failure patterns of different mixes are presented in Figure 9. The flexural resistance of concrete can fall into three stages (i.e., initial stress stage, stress enhancement stage and ultimate failure stage).
  • Initial stress stage. The schematic diagram of initial stress stage is presented in Figure 10a. The specimen surface substrate fell off as the force continued to be loaded. The main body of force at this stage was the concrete matrix. The factors included the degree of concrete compactness, the degree of cement hydration and the degree of pozzolanic reaction of silica fume. The drawing effect of steel fibers was found as a secondary influencing factor.
  • Stress enhancement stage. The schematic diagram of the stress enhancement stage is shown in Figure 10b. The crack continued to expand and extend inside with the load applied continuously. It gradually developed into penetrating cracks, and steel fibers came into play and were continuously pulled out. At this stage, the main body of the force was the concrete matrix and the steel fibers, which was represented by the synergy of the matrix and steel fibers. The factors included the degree of adhesion between concrete matrix, the compactness of concrete matrix and the adhesion between steel fibers and concrete matrix.
  • Ultimate failure stage. The schematic diagram of the fracture stage is shown in Figure 10c. At this stage, the crack completely penetrated the specimen, and the bonding force between the substrates had basically lost its effect. Steel fibers were the main body of the force; the strength factors included the interface bonding force between steel fibers and the matrix and the friction force when the fibers were pulled out.

3.2. Experiment Analysis

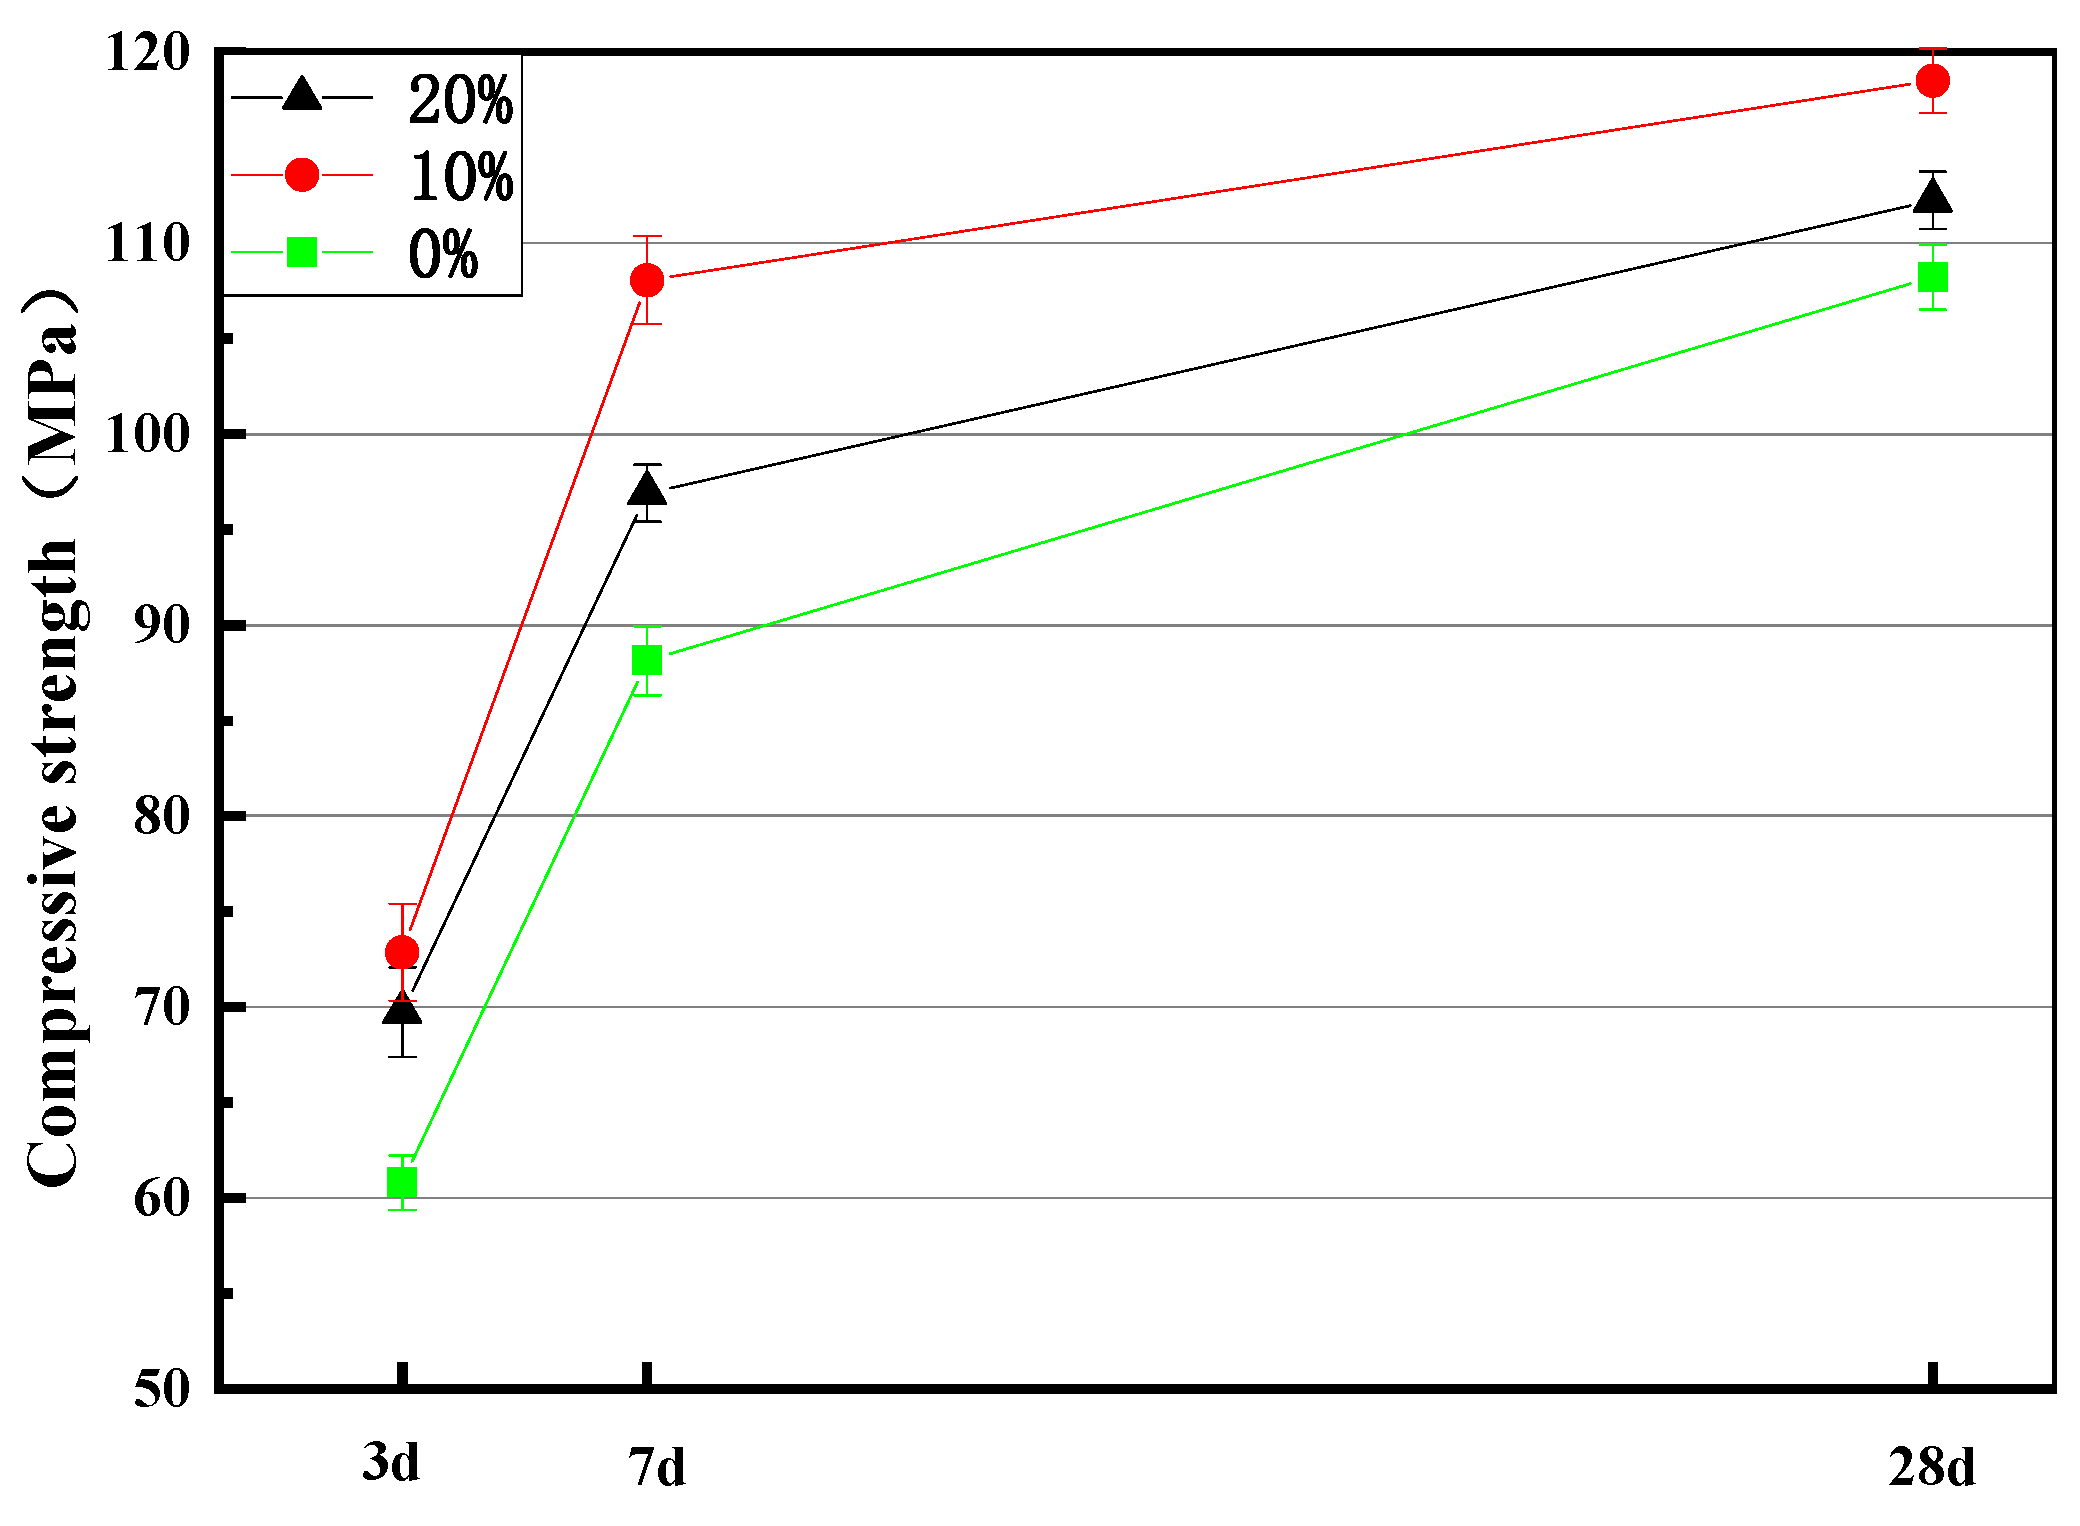
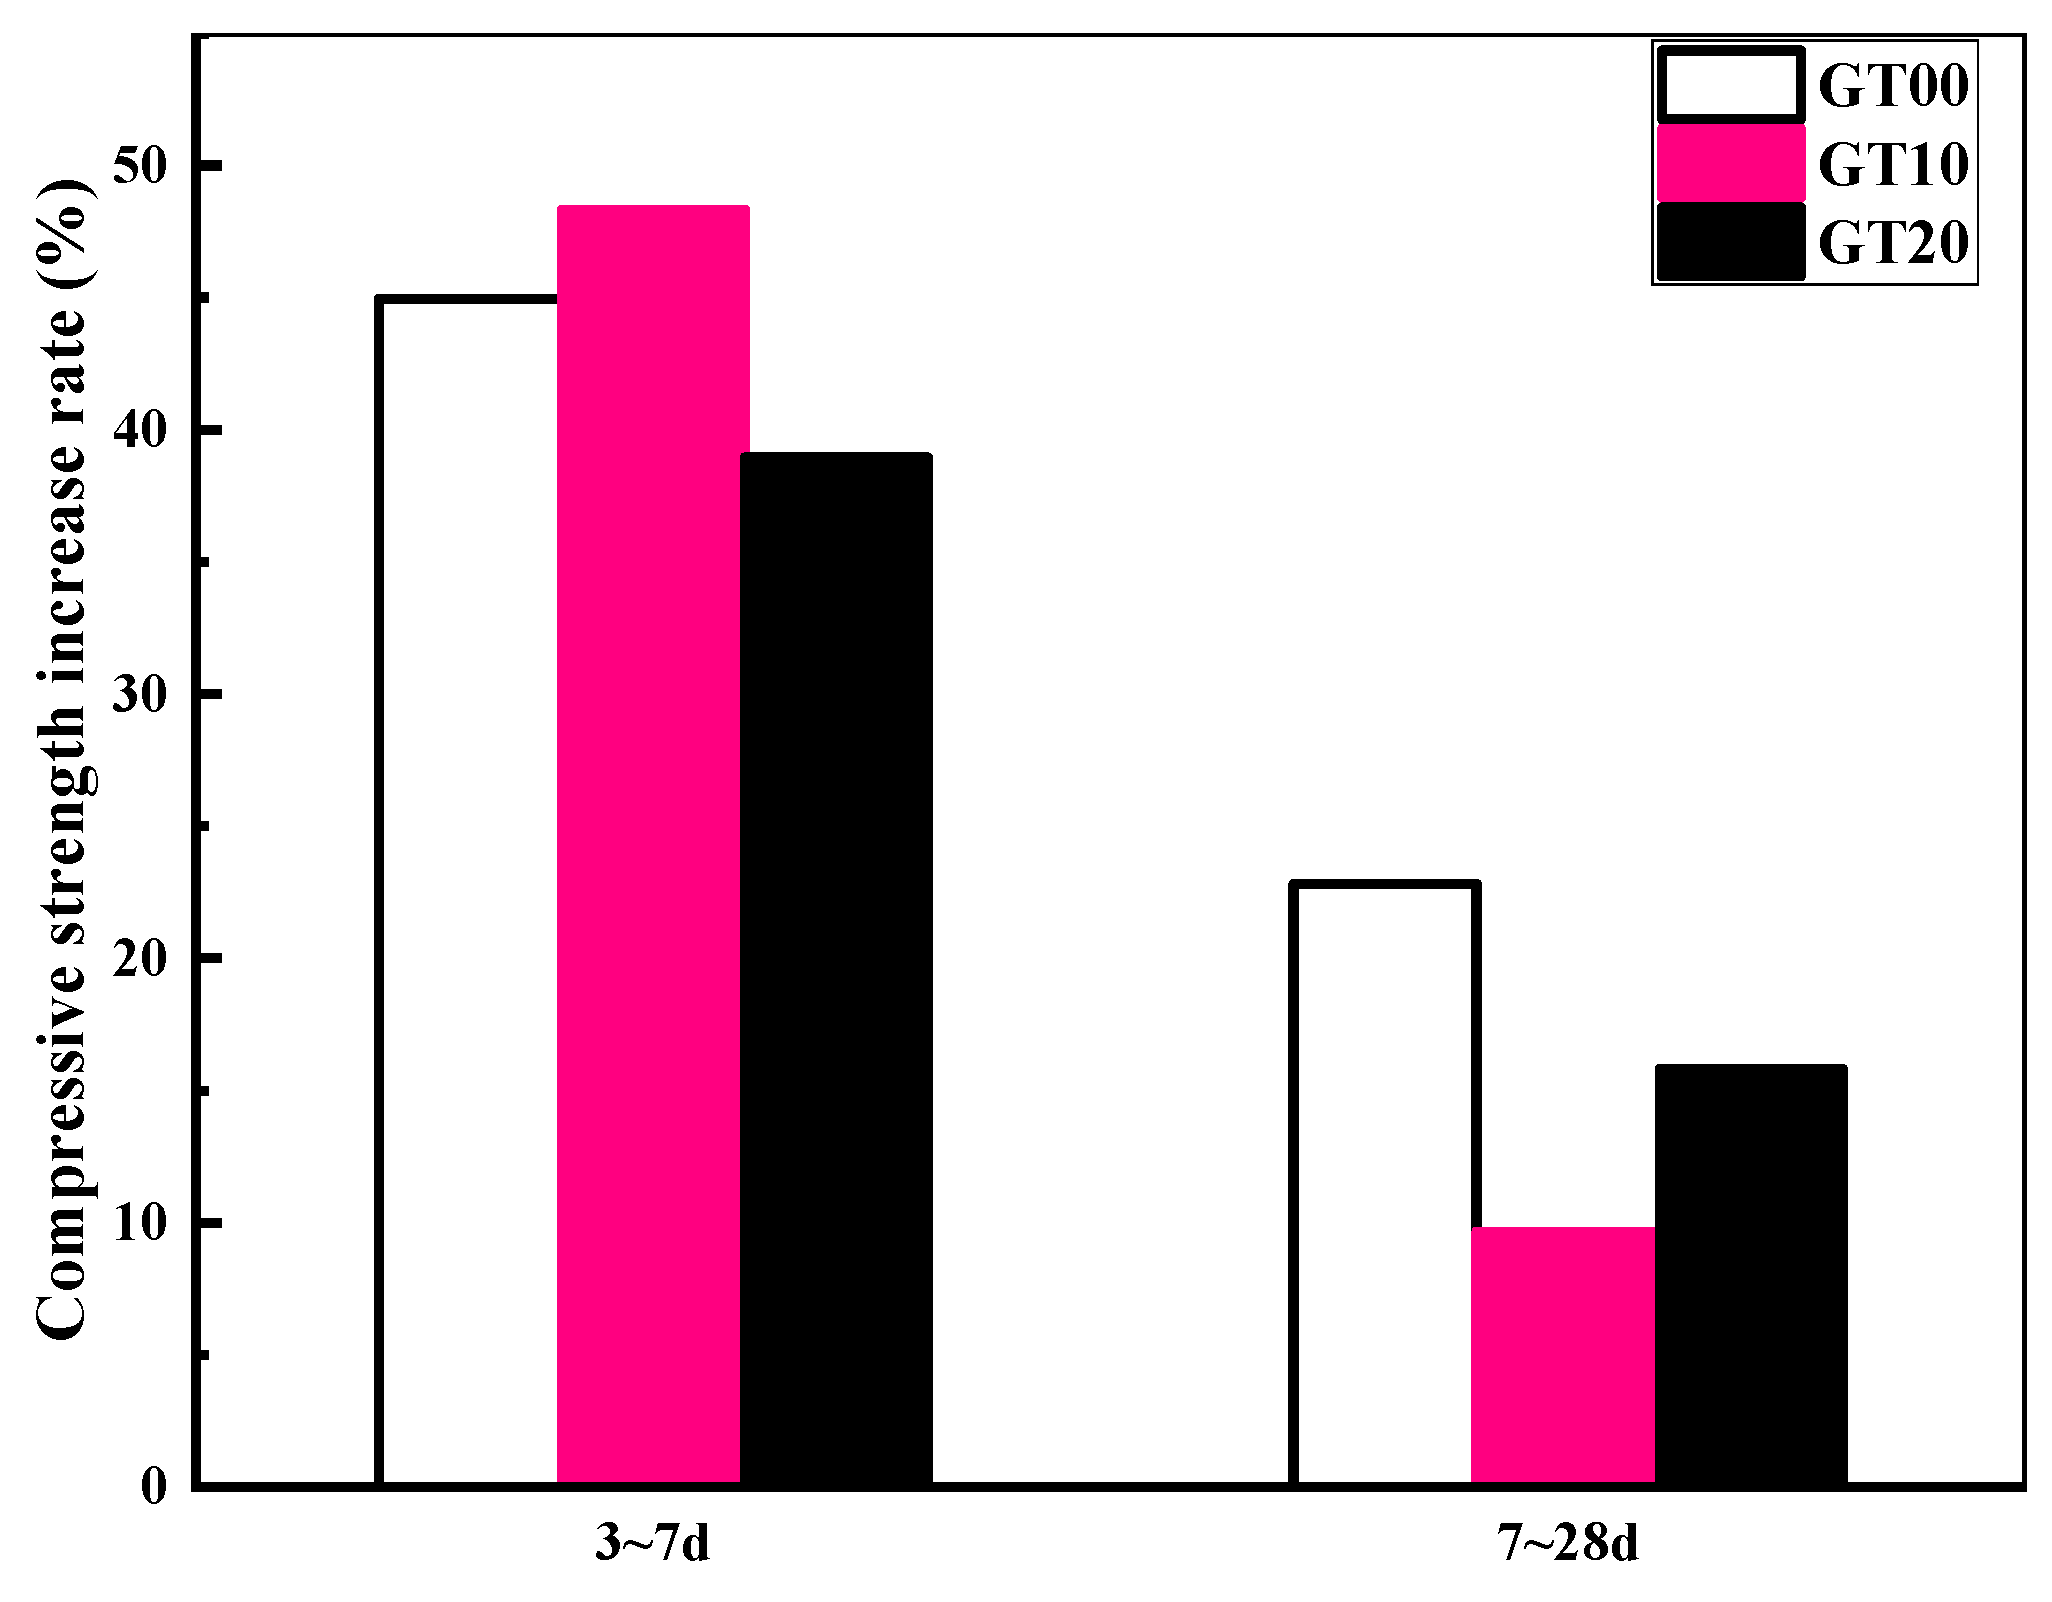
3.2.1. Compression Test Analysis

Compressive Strength

The main mechanism of the uniaxial failure of concrete is that under the continuous action of the load, the specimen will be expanded laterally, which causes the specimen to fail. As shown in Figure 11, the strength of the specimen first increased and then decreased as the GT content increased. Uniaxial compressive strengths of three groups of specimens were all higher than 100 MPa after 28 days of curing, which indicated that the addition of steel fibers could more significantly inhibit the lateral expansion of the specimen under uniaxial compression. According to Figure 12, strength improvement rates of GT00, GT10 and GT20 from 3 days to 7 days reached 44.95%, 48.31% and 38.96%, respectively, and the strength improvement rates from 7 days to 28 days were 22.81%, 9.65% and 15.82%, respectively. With the incorporation of silica fume, the early strength characteristics of concrete specimens turned out to be remarkable [51,52]. The incorporation of GT improved the strength of specimens, the compressive strength of GT10 increased by 19.85%, 22.63% and 9.49% at 3 days, 7 days and 28 days, respectively. The compressive strength of GT20 respectively increased by 14.69%, 9.95% and 3.70% at 3 days, 7 days and 28 days.
d W 1 = d W 2 + d W 3
Equation (9) expresses the correlation between work and energy. Where d W 1 denotes the work done by unit load on specimen; d W 2 represents the energy required for crack propagation; d W 3 expresses the unit elastic strain energy of steel fibers and matrix composite system.
The factors of the elastic strain energy of steel fibers and matrix composite system under the identical unit load are presented below: (1) the degree of bonding between steel fibers and the matrix, (2) the degree of bonding between the matrix and the aggregate, (3) the degree of cement hydration reaction in the matrix and (4) the degree of silica fume pozzolanic reaction. The densest packing density of GT exceeded that of sand, and the porosity was smaller, and the density of GT-sand composite system exceeded that under only sand according to the comparison between GT10 and GT00. The GT content was low, the high water absorption rate of GT during stirring insignificantly impacted cement hydration and silica fume pozzolanic reaction and the production of hydrated C-S-H was nearly not impacted. The strength of the concrete matrix increased, and the rigidity was improved after hardening, so micro-deformation could have been difficult to produce. Elastic strain energy of the composite system of steel fibers and the matrix was reduced, and crack propagation required more energy.
GT20 exerted better filling effect than GT10, whereas the high water absorption rate of GT prevented the cement from being fully hydrated. The amount of C-S-H produced was significantly reduced. Unhydrated cement spreading all over the interior of the concrete matrix, the interface between matrix and aggregate and the interface between matrix and steel fibers could not act as the skeleton, thereby causing more defects in matrix, more pores and more micro-deformation. The elastic strain energy of the composite system of steel fibers and matrix increased, and cracks may have found it easier to expand. The compressive strength of GT20 decreased. Nevertheless, the compressive strength of GT20 is larger than that of GT00. It is believed that the addition of GT to the matrix has two opposite effects on the compressive strength of the concrete material. The filling effect of GT on the matrix increases the compressive strength of the concrete, while its disadvantage for high water absorption reduces that.

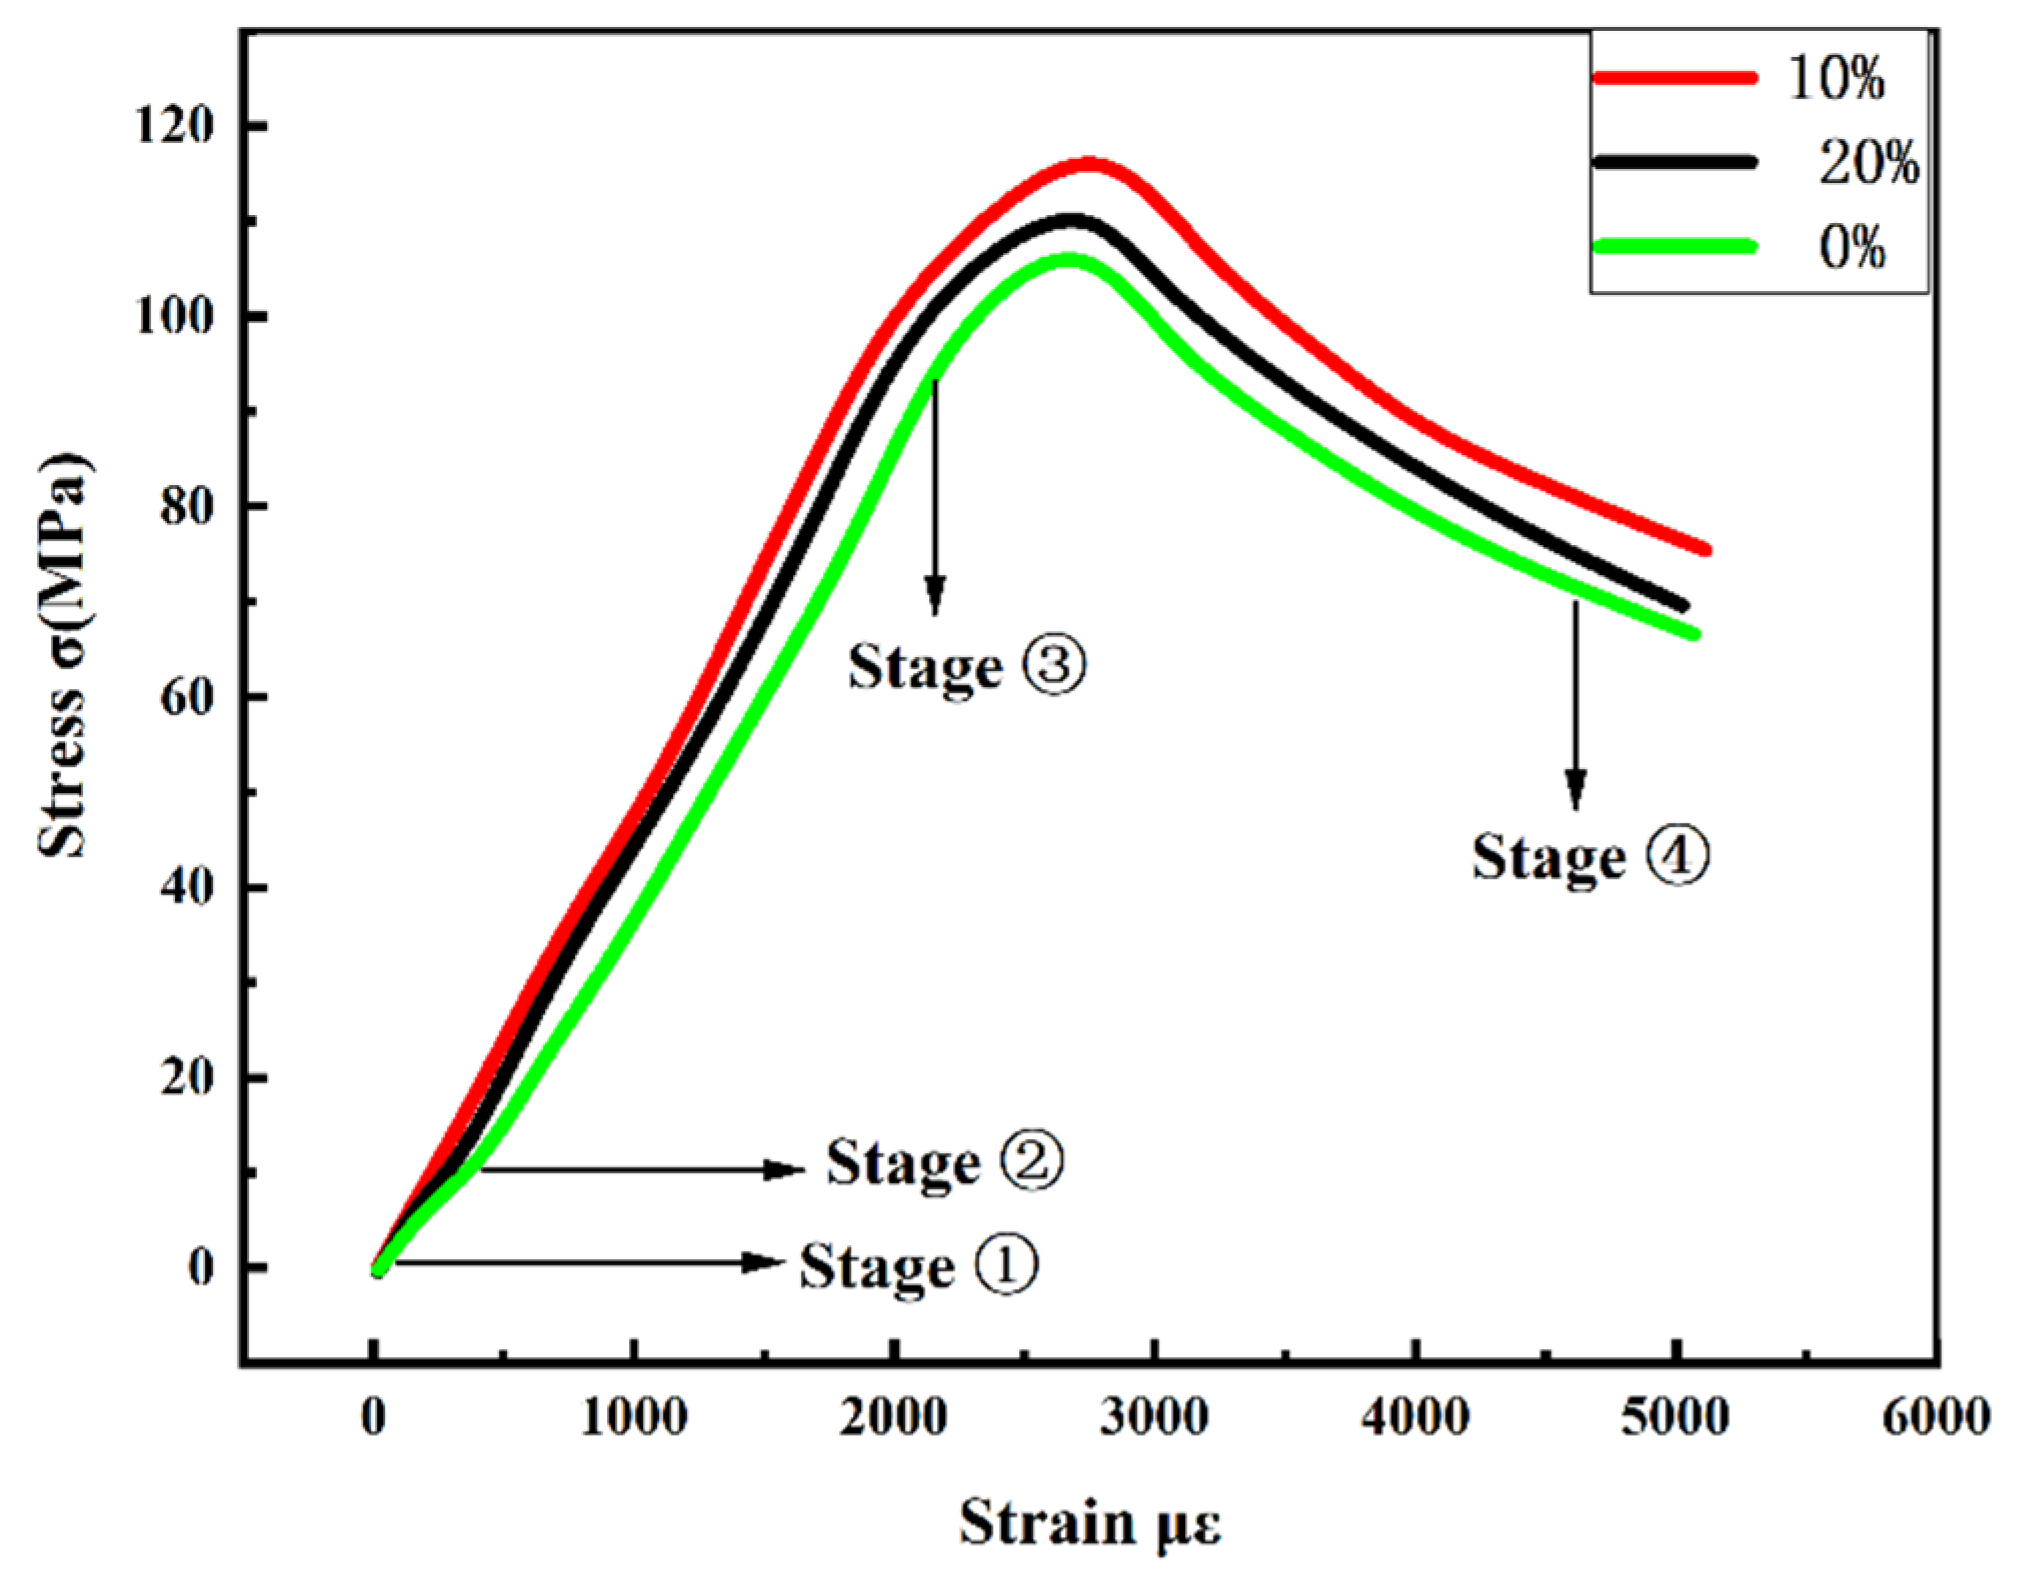
Compressive Stress–Strain Curve

According to Figure 13, the stress–strain curve of specimens corresponded to the four stages of compressive resistance. (1) Compression stage. Impacted by the micro-cracks in specimen, micro-cracks perpendicular to the direction of the force would be closed when the specimen was stressed, thereby strengthening concrete; the internal microstructure of the specimen varied accordingly. However, the stress intensity at this stage was low, and the duration was short. (2) Linear enhancement stage. According to Figure 13, the stress–strain curve of the specimen developed linearly as a whole. GT10 achieved the largest slope, and GT00 had the smallest slope. Based on the slope of the stress–strain curve at this stage, the elastic modulus could be determined (Figure 14). The deformation of concrete was highly dependent of the elastic deformation of aggregate [53]. We have already discussed in Table 4 that the surface of GT is rough and the occlusal force between GT particles is enhanced, with more edges and corners, more contact points, and a stronger skeleton is formed between the cement and GT when the cement is hydrated. Compared with GT00, the addition of 10% GT effectively improved the elastic modulus of concrete (modulus of elasticity increased by 8.02%). The crush value of the aggregate has a greater effect on the elastic modulus than on the compressive strength [54]. When the content of GT reaches 20%, the slurry adhering to the surface of GT transmits stress through the skeleton of GT and sand under the action of force. The GT was continuously subjected to force and the energy could not be released, which eventually led to cracks in the GT. However, there were still many GT that maintained their integrity; therefore, GT20 still have 6.12% more elastic modulus than GT00. The internal cracks in the concrete caused stress concentration in the partial areas of the specimen and produced some micro-cracks, whereas the force at this time was relatively small. Thus, the appearance of the mentioned cracks would share the stress in the larger cracks, thereby reducing the effect of stress concentration on the specimen. If unloaded at the elastic phase, the specimen would exhibit a better self-healing ability. (3) Defect expansion stage. The micro-cracks increased, and their width increased with the increasing load. Cracks continued to expand and converge, and the stress–strain curve at this time deviated from the original linear development trend. The viscoplasticity and cracks of the concrete expanded randomly, thereby making the concrete vary from a recoverable elastic state to an unrecoverable plastic state. As indicated by Figure 13, the specimen with GT10 had the largest peak stress, and the curve subsequently tended to be flat. The specimen still exhibited a higher residual strength after unloading at this stage. (4) Destruction stage. The destruction patterns of GT00, GT10 and G20 are similar. The cracks in the concrete spread more rapidly, and the micro-cracks spread all over the specimens. Moreover, the cracks at different positions penetrated each other and developed into large cracks, thereby penetrating the entire specimen and the damaging specimen.

3.2.2. Flexural Test Analysis

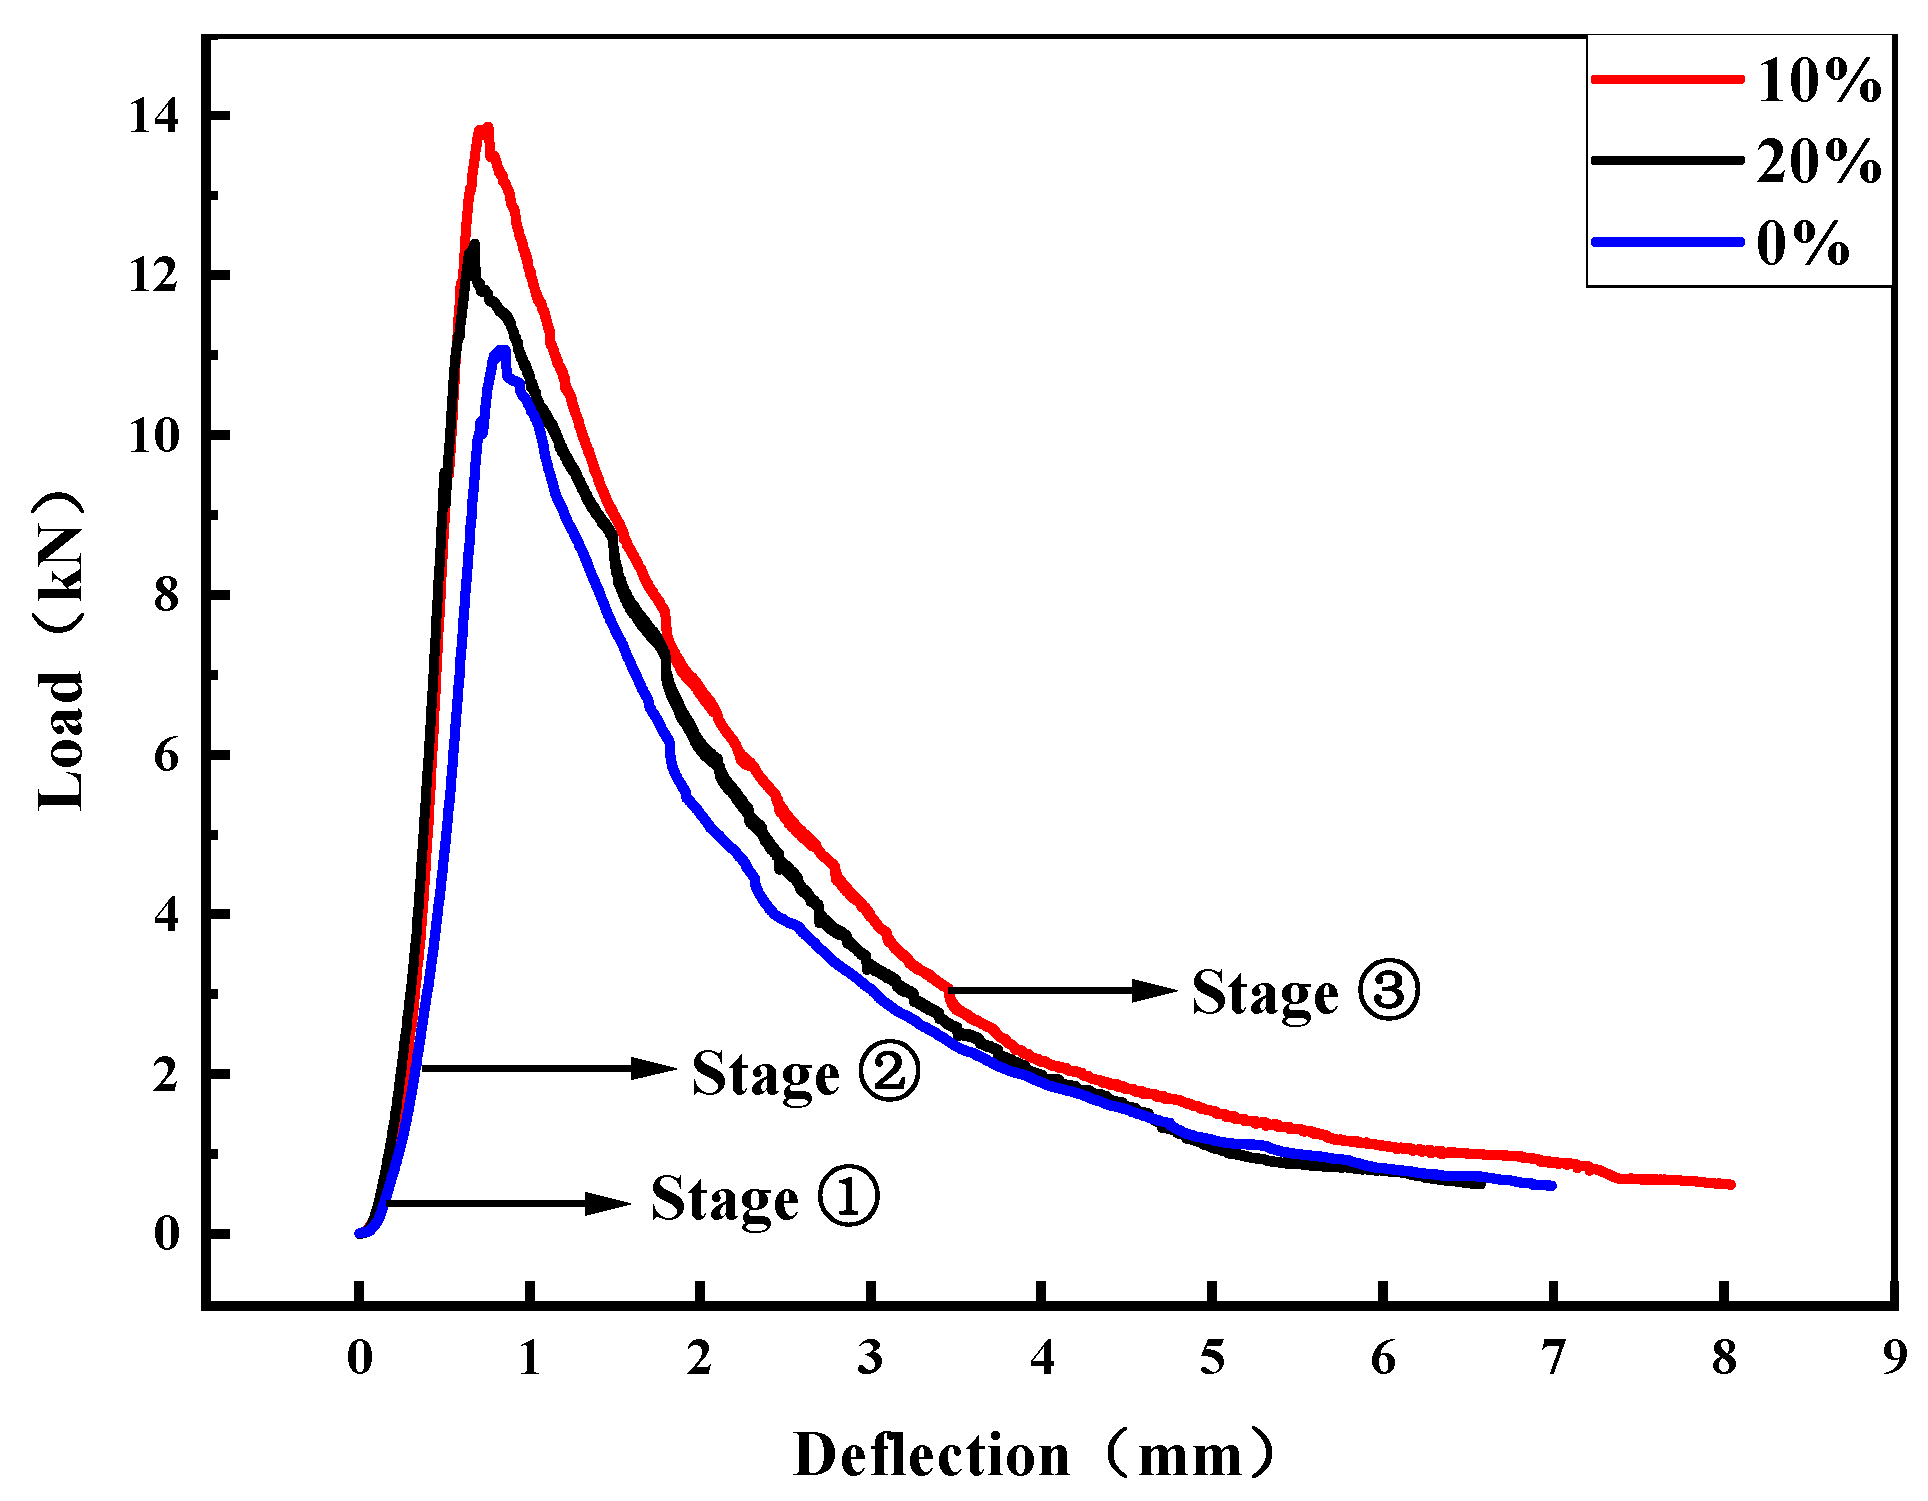
Load–Deflection Curve

The load deflection curve (Figure 15) indicates the three stages of bending resistance of the specimen. (1) Initial stress stage. According to Figure 15, the three curves basically coincided. Only one visible micro-crack was generated on the specimen surface at this stage. The drawing effect of steel fiber and the replacement effect of GT were insignificant, and the duration of this stage was significantly shorter. (2) Stress enhancement stage. As the load continued to be applied, the specimen entered the stress enhancement stage that lasted the longest. When the concrete was destroyed, the steel fibers at the cross-section would be all pulled out, and no fracture would occur. The drawing strength of steel fiber was significantly greater than the bonding force between the steel fiber and the specimen. Impacted by the drawing action of steel fiber, the cracked section exhibited good ductile failure characteristics [55,56,57,58,59], and the first half of the peak load was the linear elastic response stage. As shown in Figure 15, the GT-sand aggregate structure effectively transfers the load to the fibers, and the fibers can bridge the GT and the slurry, reduce crack openings, and thus increase the flexural strength of concrete (Figure 16). Part of the GT in GT20 failed to make good contact with the matrix, and the residual GT contributed to the increase in porosity, so the peak load of GT20 was smaller and the elastic modulus was lower than that of GT10. At this stage, the maximal bending and tensile strain (Figure 17) of different specimens were determined according to Equations (10) and (11). Combining Equation (12), the bending stiffness modulus of the corresponding specimen was determined (Figure 18).
R B = 3 L P B 2 b h 2
ε B = 6 h d L 2
S B = R B ε B
where b denotes the width of the cross-interrupt interview piece (mm); h is the height of the cross-interrupt interview piece (mm); L is the span of test piece (mm); P B is the maximal load when the specimen fails; d represents the mid-span deflection when the specimen fails (mm); R B is the bending and tensile strength when the specimen is broken (MPa); ε B denotes the maximal bending and tensile strain when the specimen fails (με); S B expresses the flexural modulus when the specimen is broken (MPa).
The flexural strength and the compressive strength were affected by the internal bonding force of the matrix. Figure 16 complies with the rule of Figure 11: the specimen achieved the maximal flexural strength under the GT content of 10%. The second half of the peak load was the stress softening stage, and the width of the main crack at the bottom of the specimen increased continuously. The deflection of GT00 is larger than that of GT10 and GT20 under the same load; the cracks in GT00 cannot develop in time to follow the original path and form more fine branch cracks to consume energy, which accelerates the loss of energy in GT00. The engagement force between GT and steel fiber in GT20 is not as large as that of GT10, and the ability of GT20 to resist bending and suppress deformation is weaker than that of GT10. (3) Ultimate failure stage. At the final fracture stage, the peak load continued to decrease and gradually approached zero. The aggregate in the cross-section of the crack was almost completely separated from the hardened cementitious slurry, and it lost its connection to the specimen. Both the bonding force between the steel fiber and the cementitious matrix and the friction force between the steel fiber and the specimen when it is pulled out could be vital factors for maintaining the integrity of the specimen.

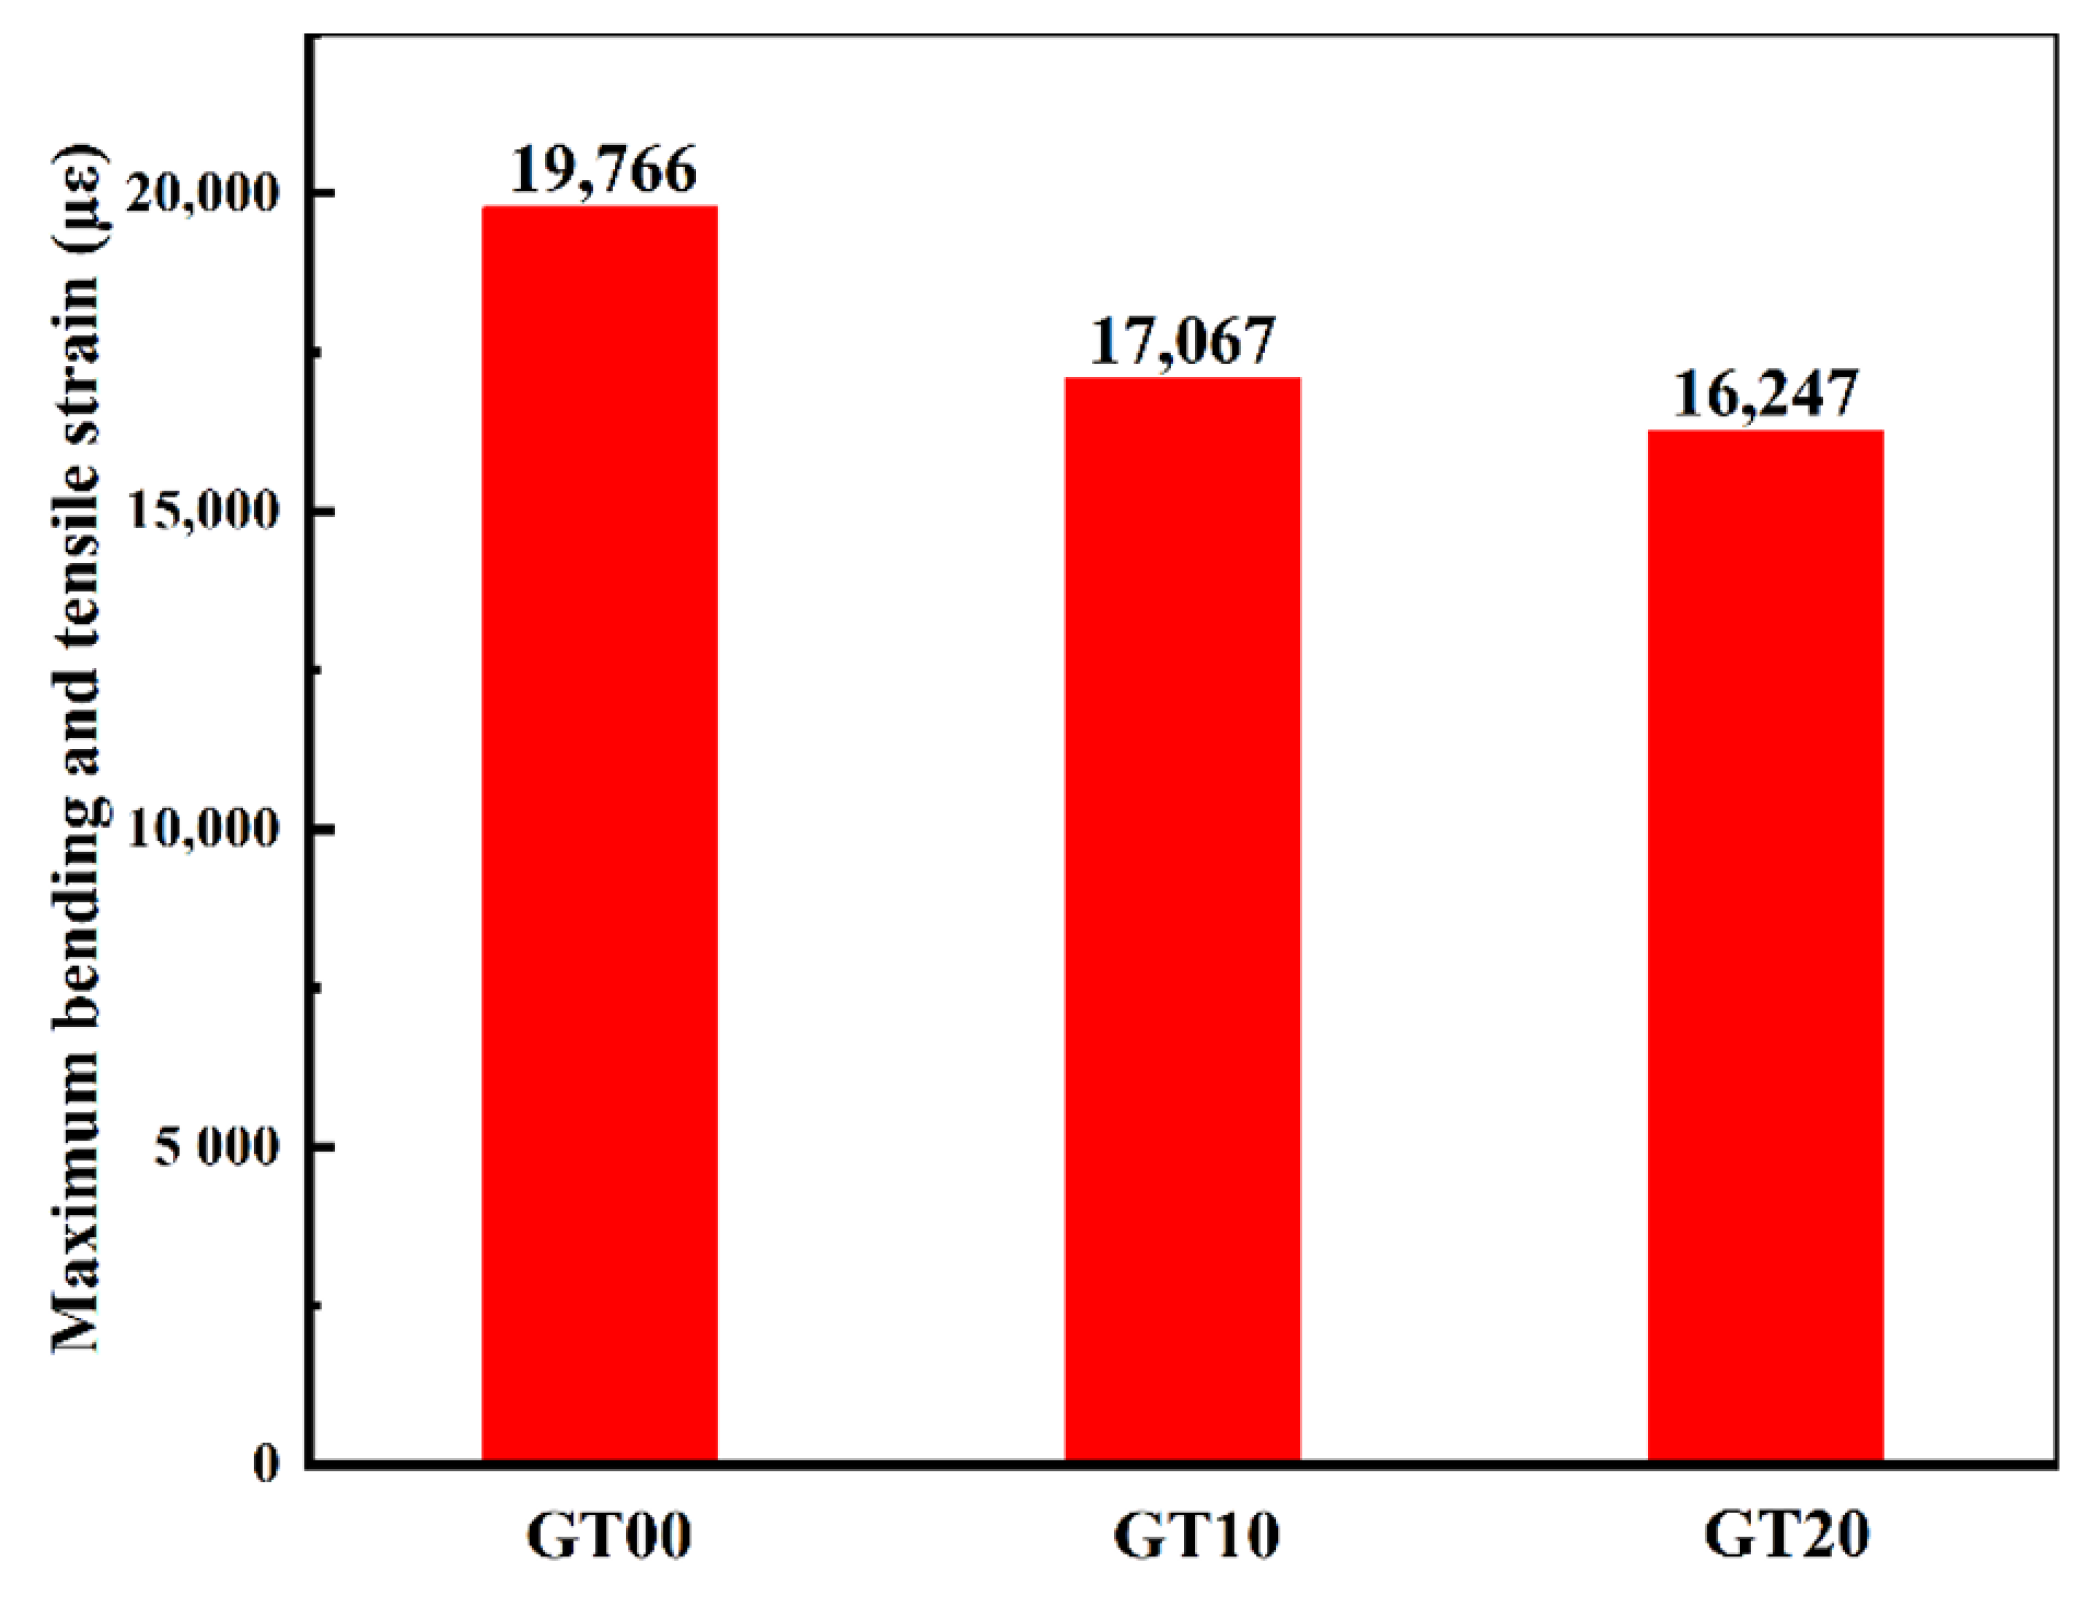
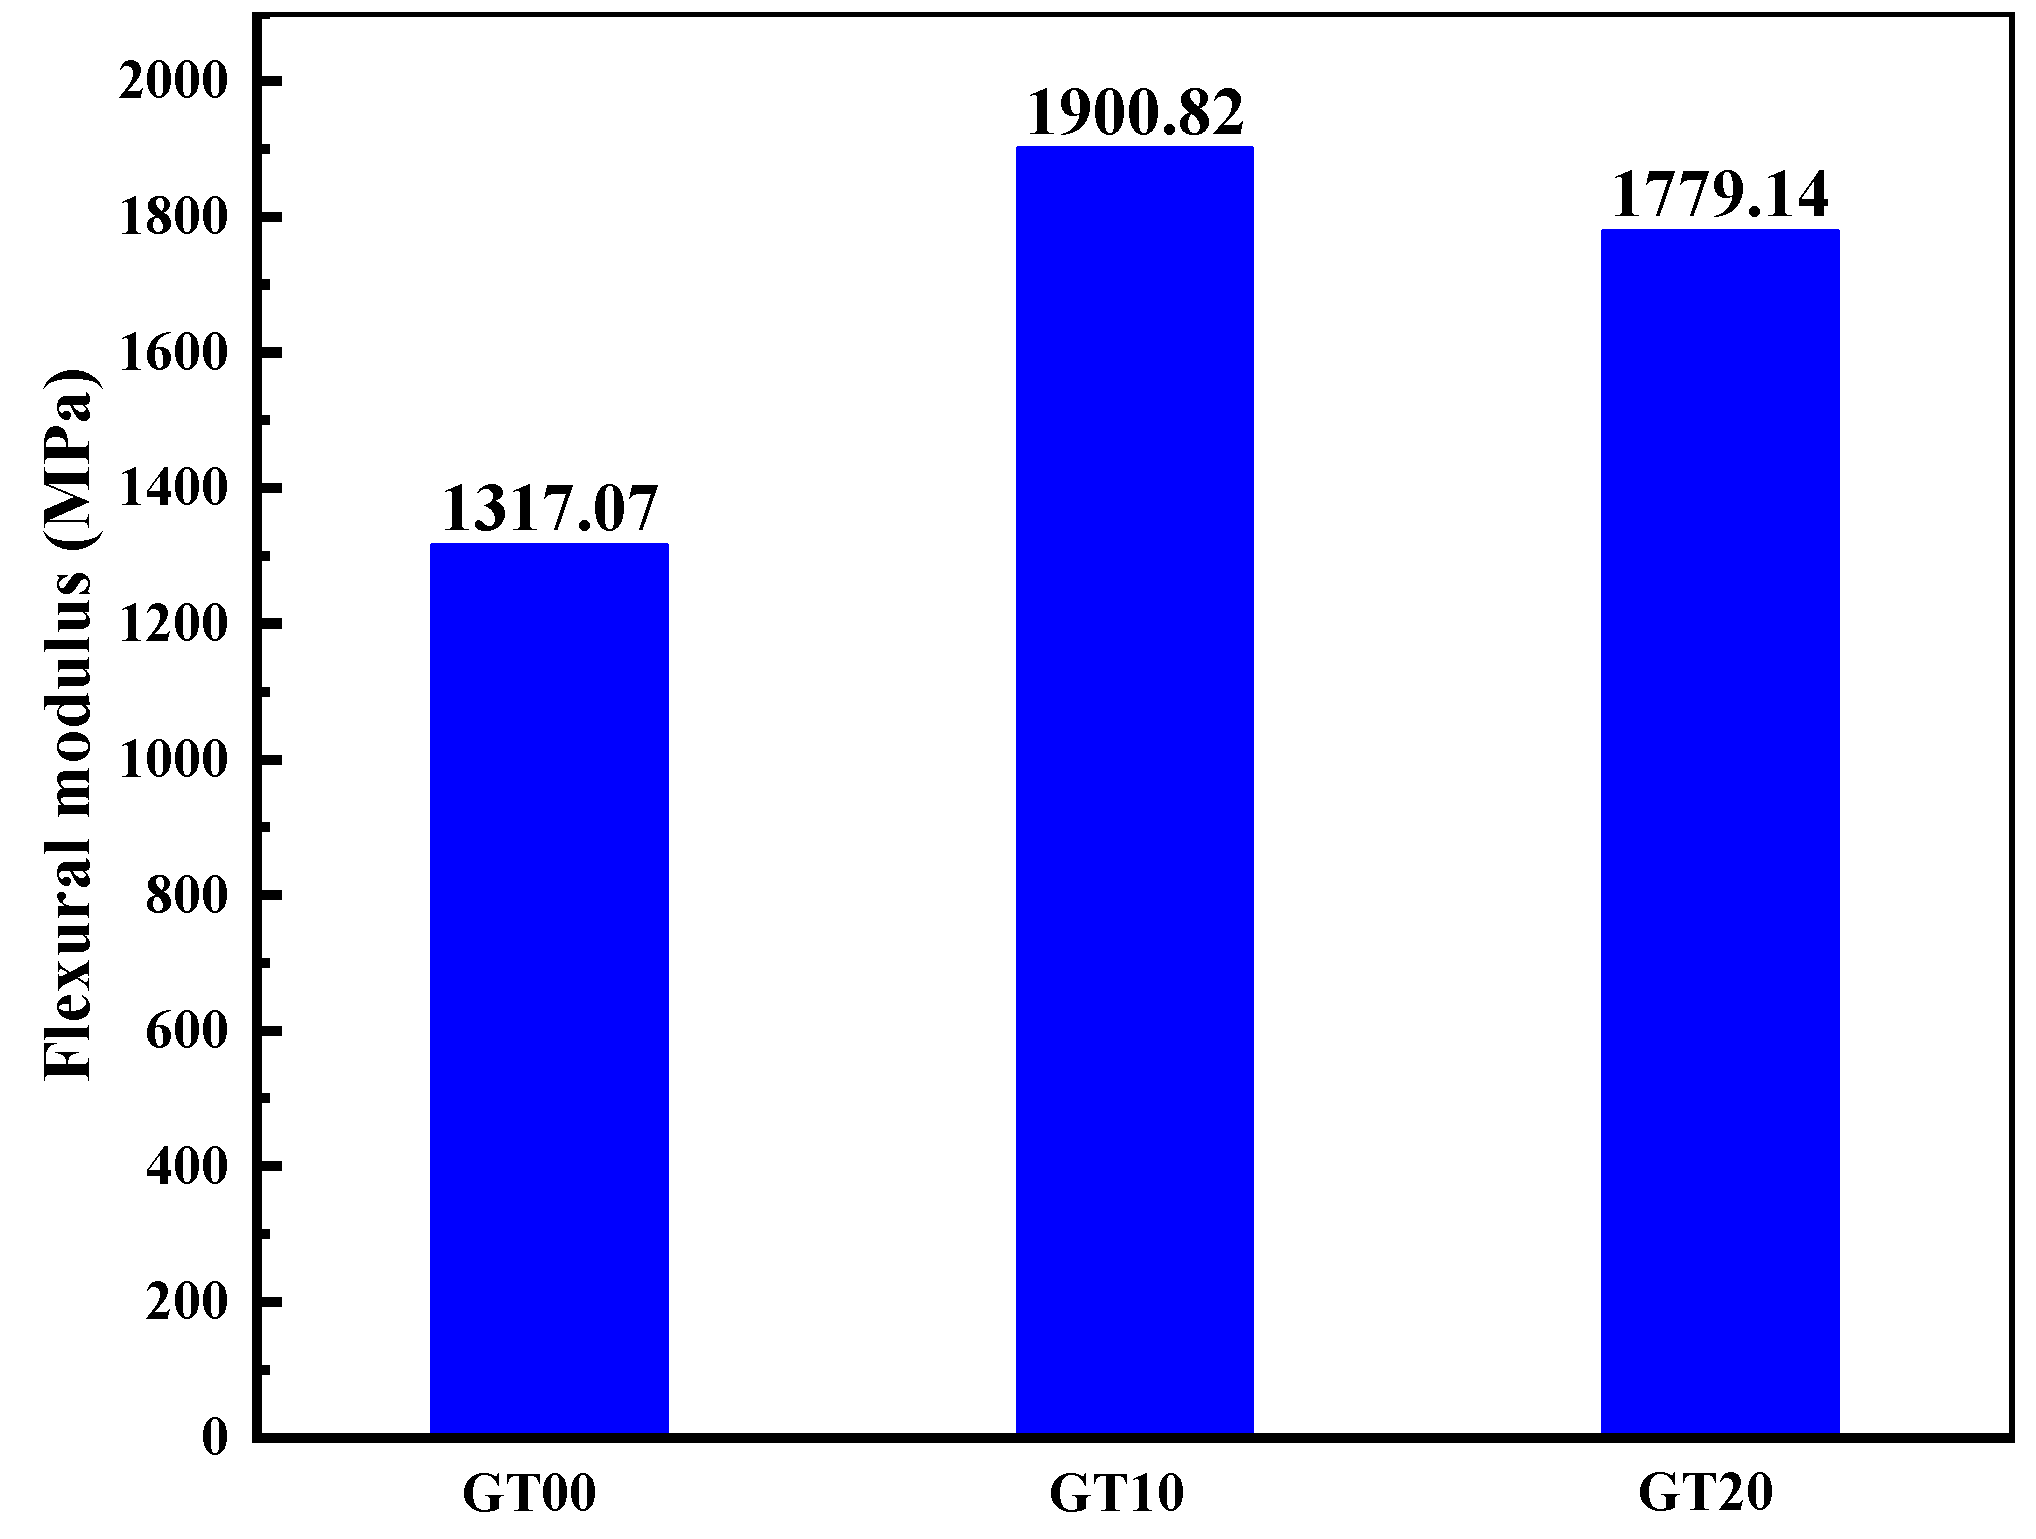
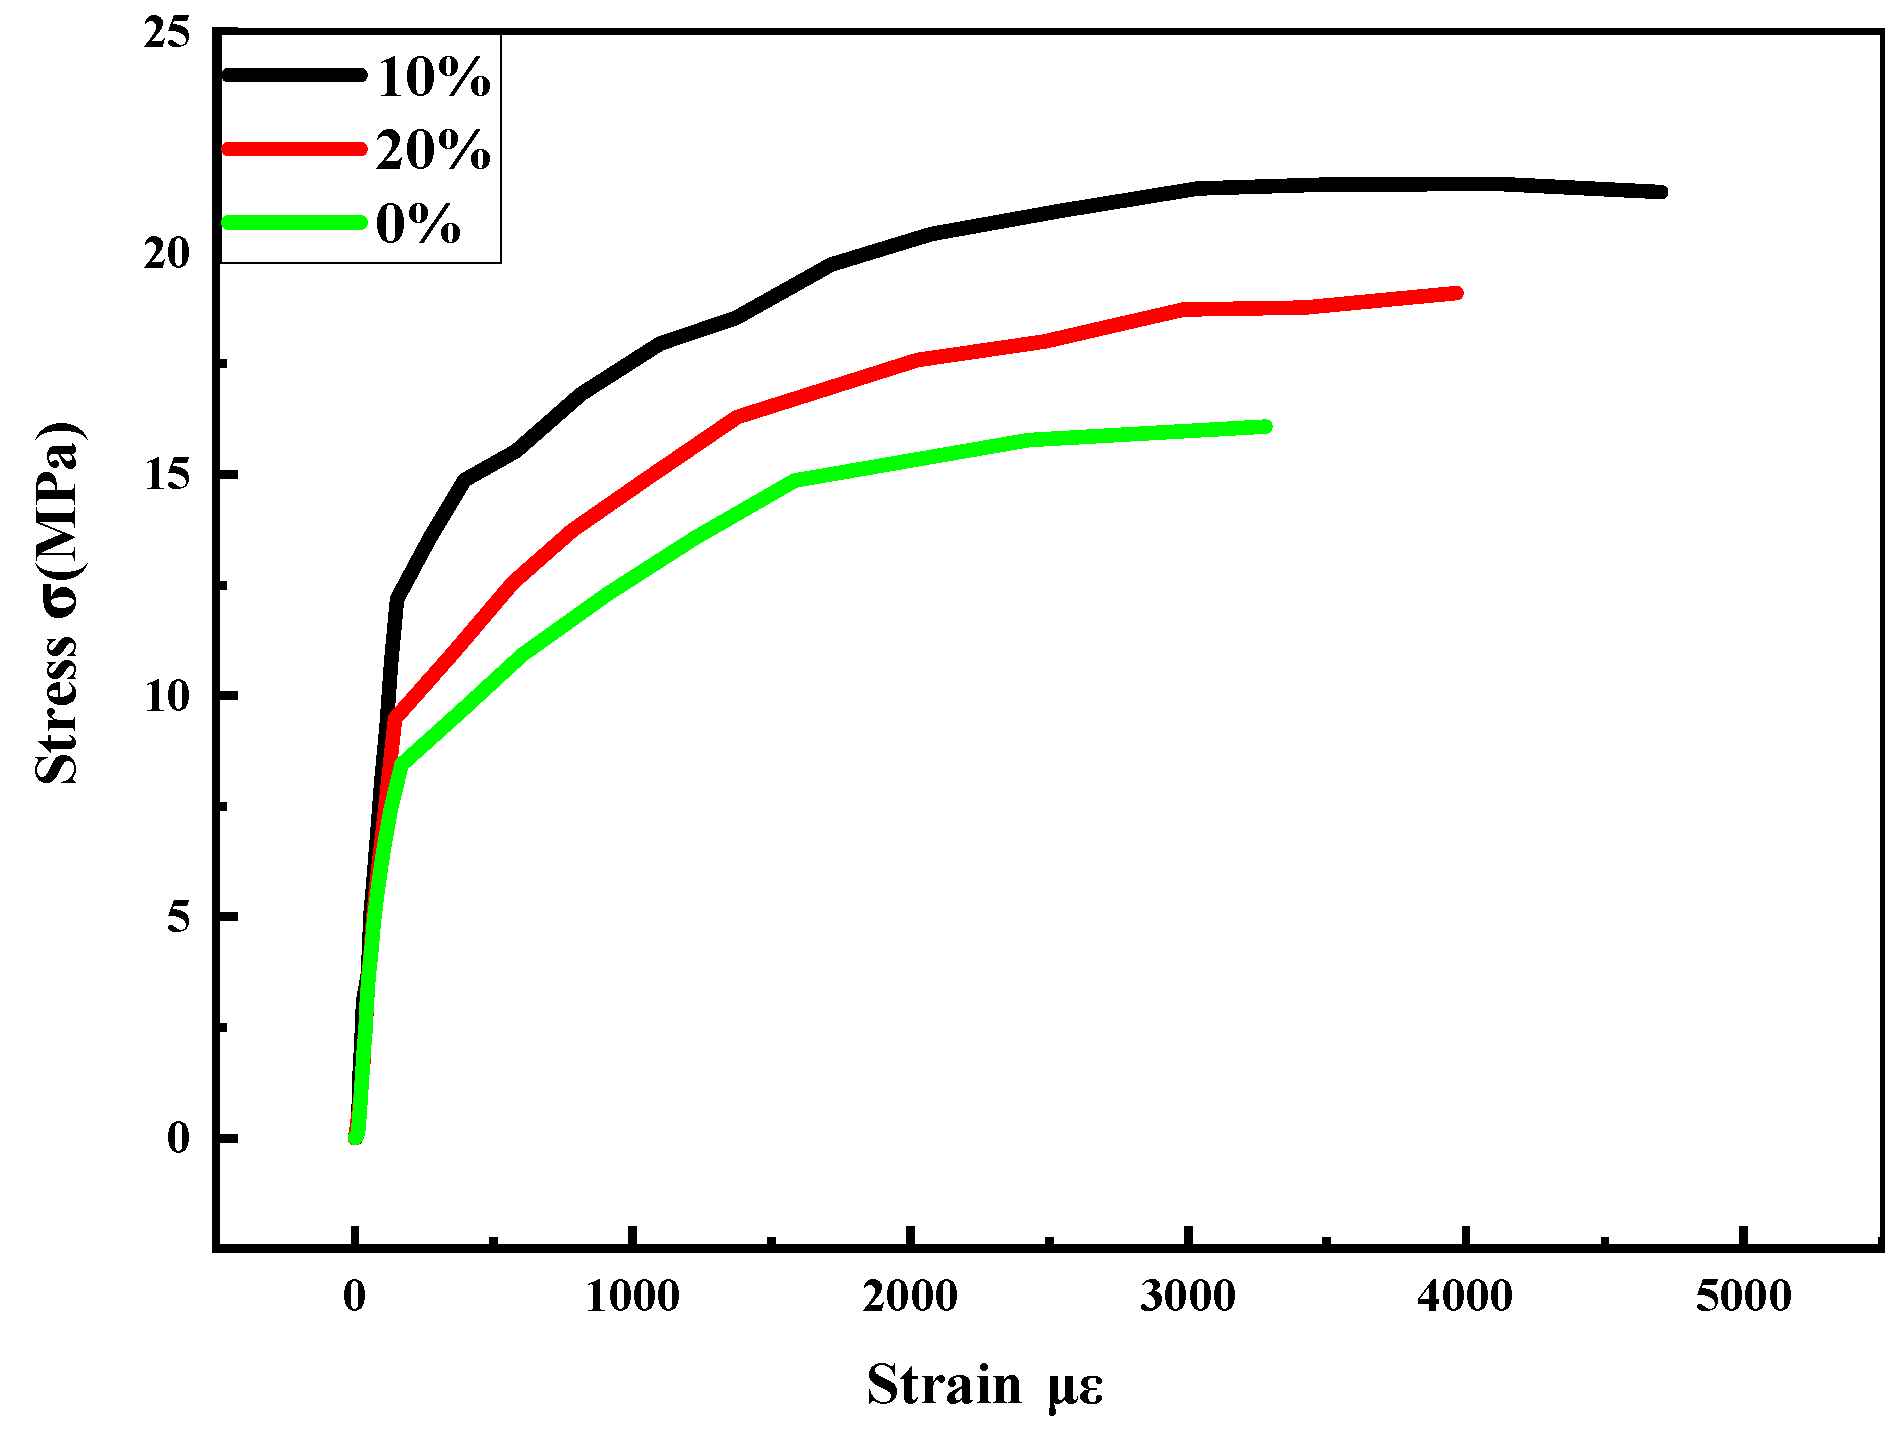
Flexural Stress–Strain Curve
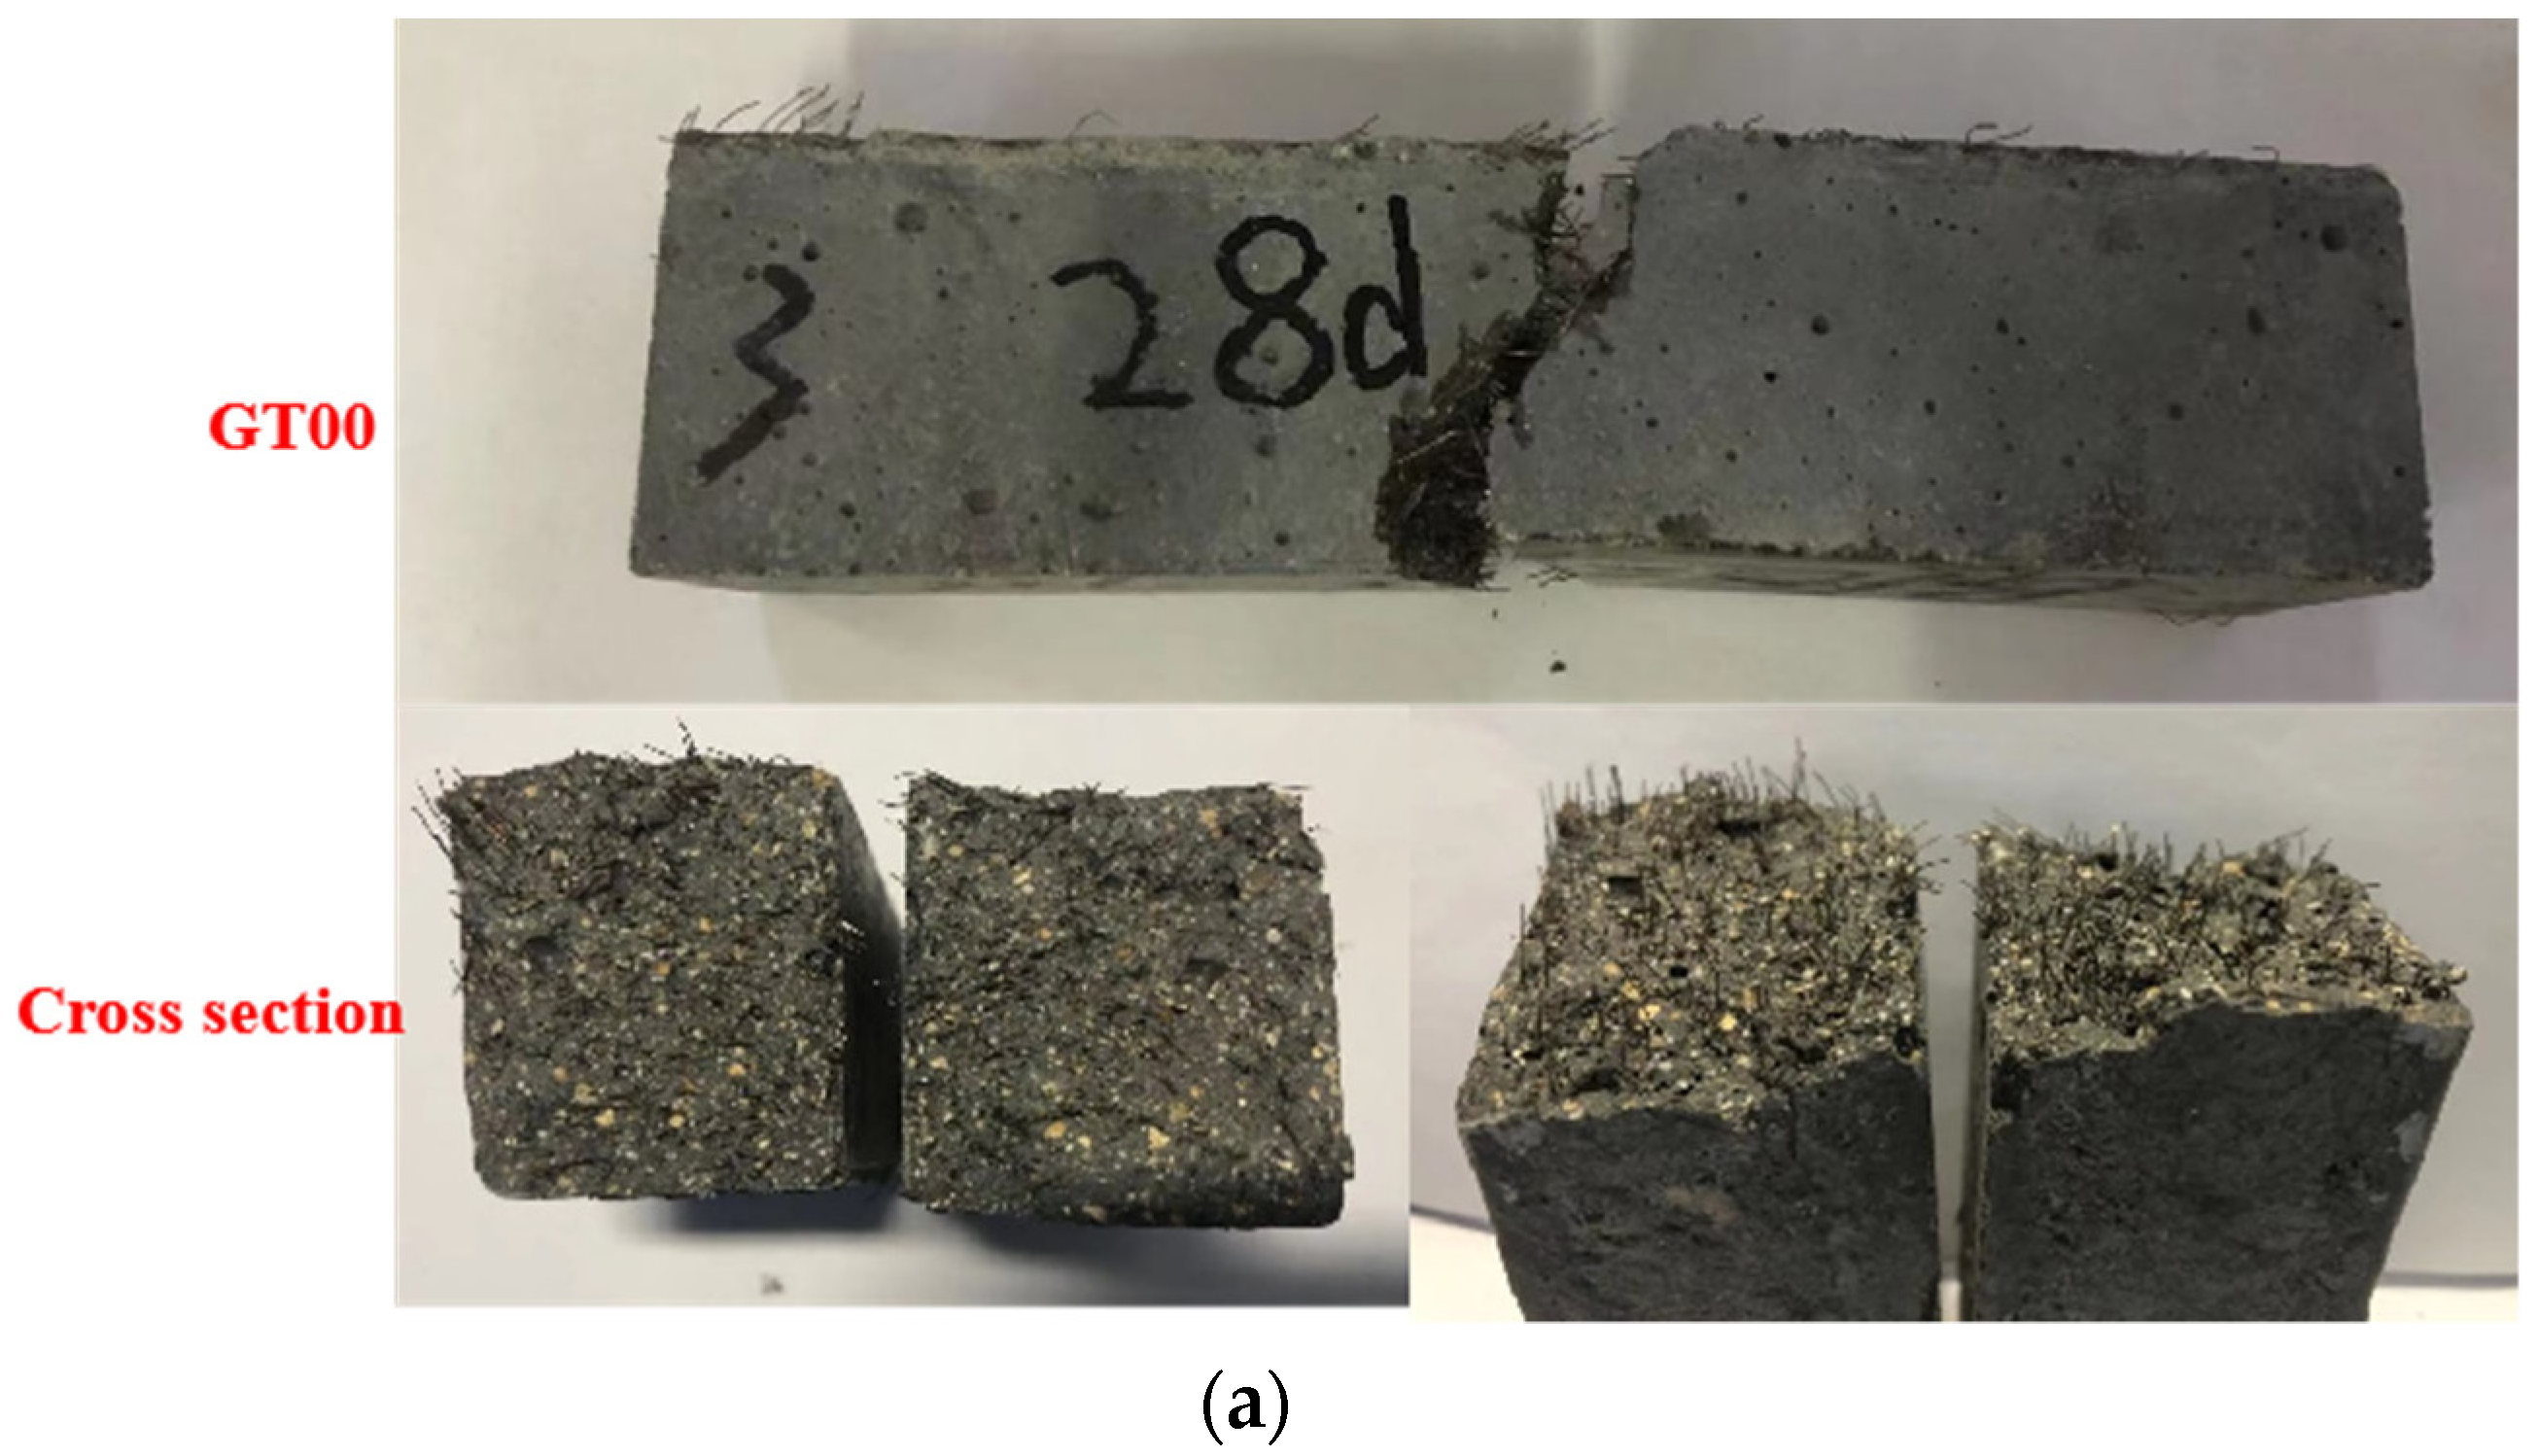
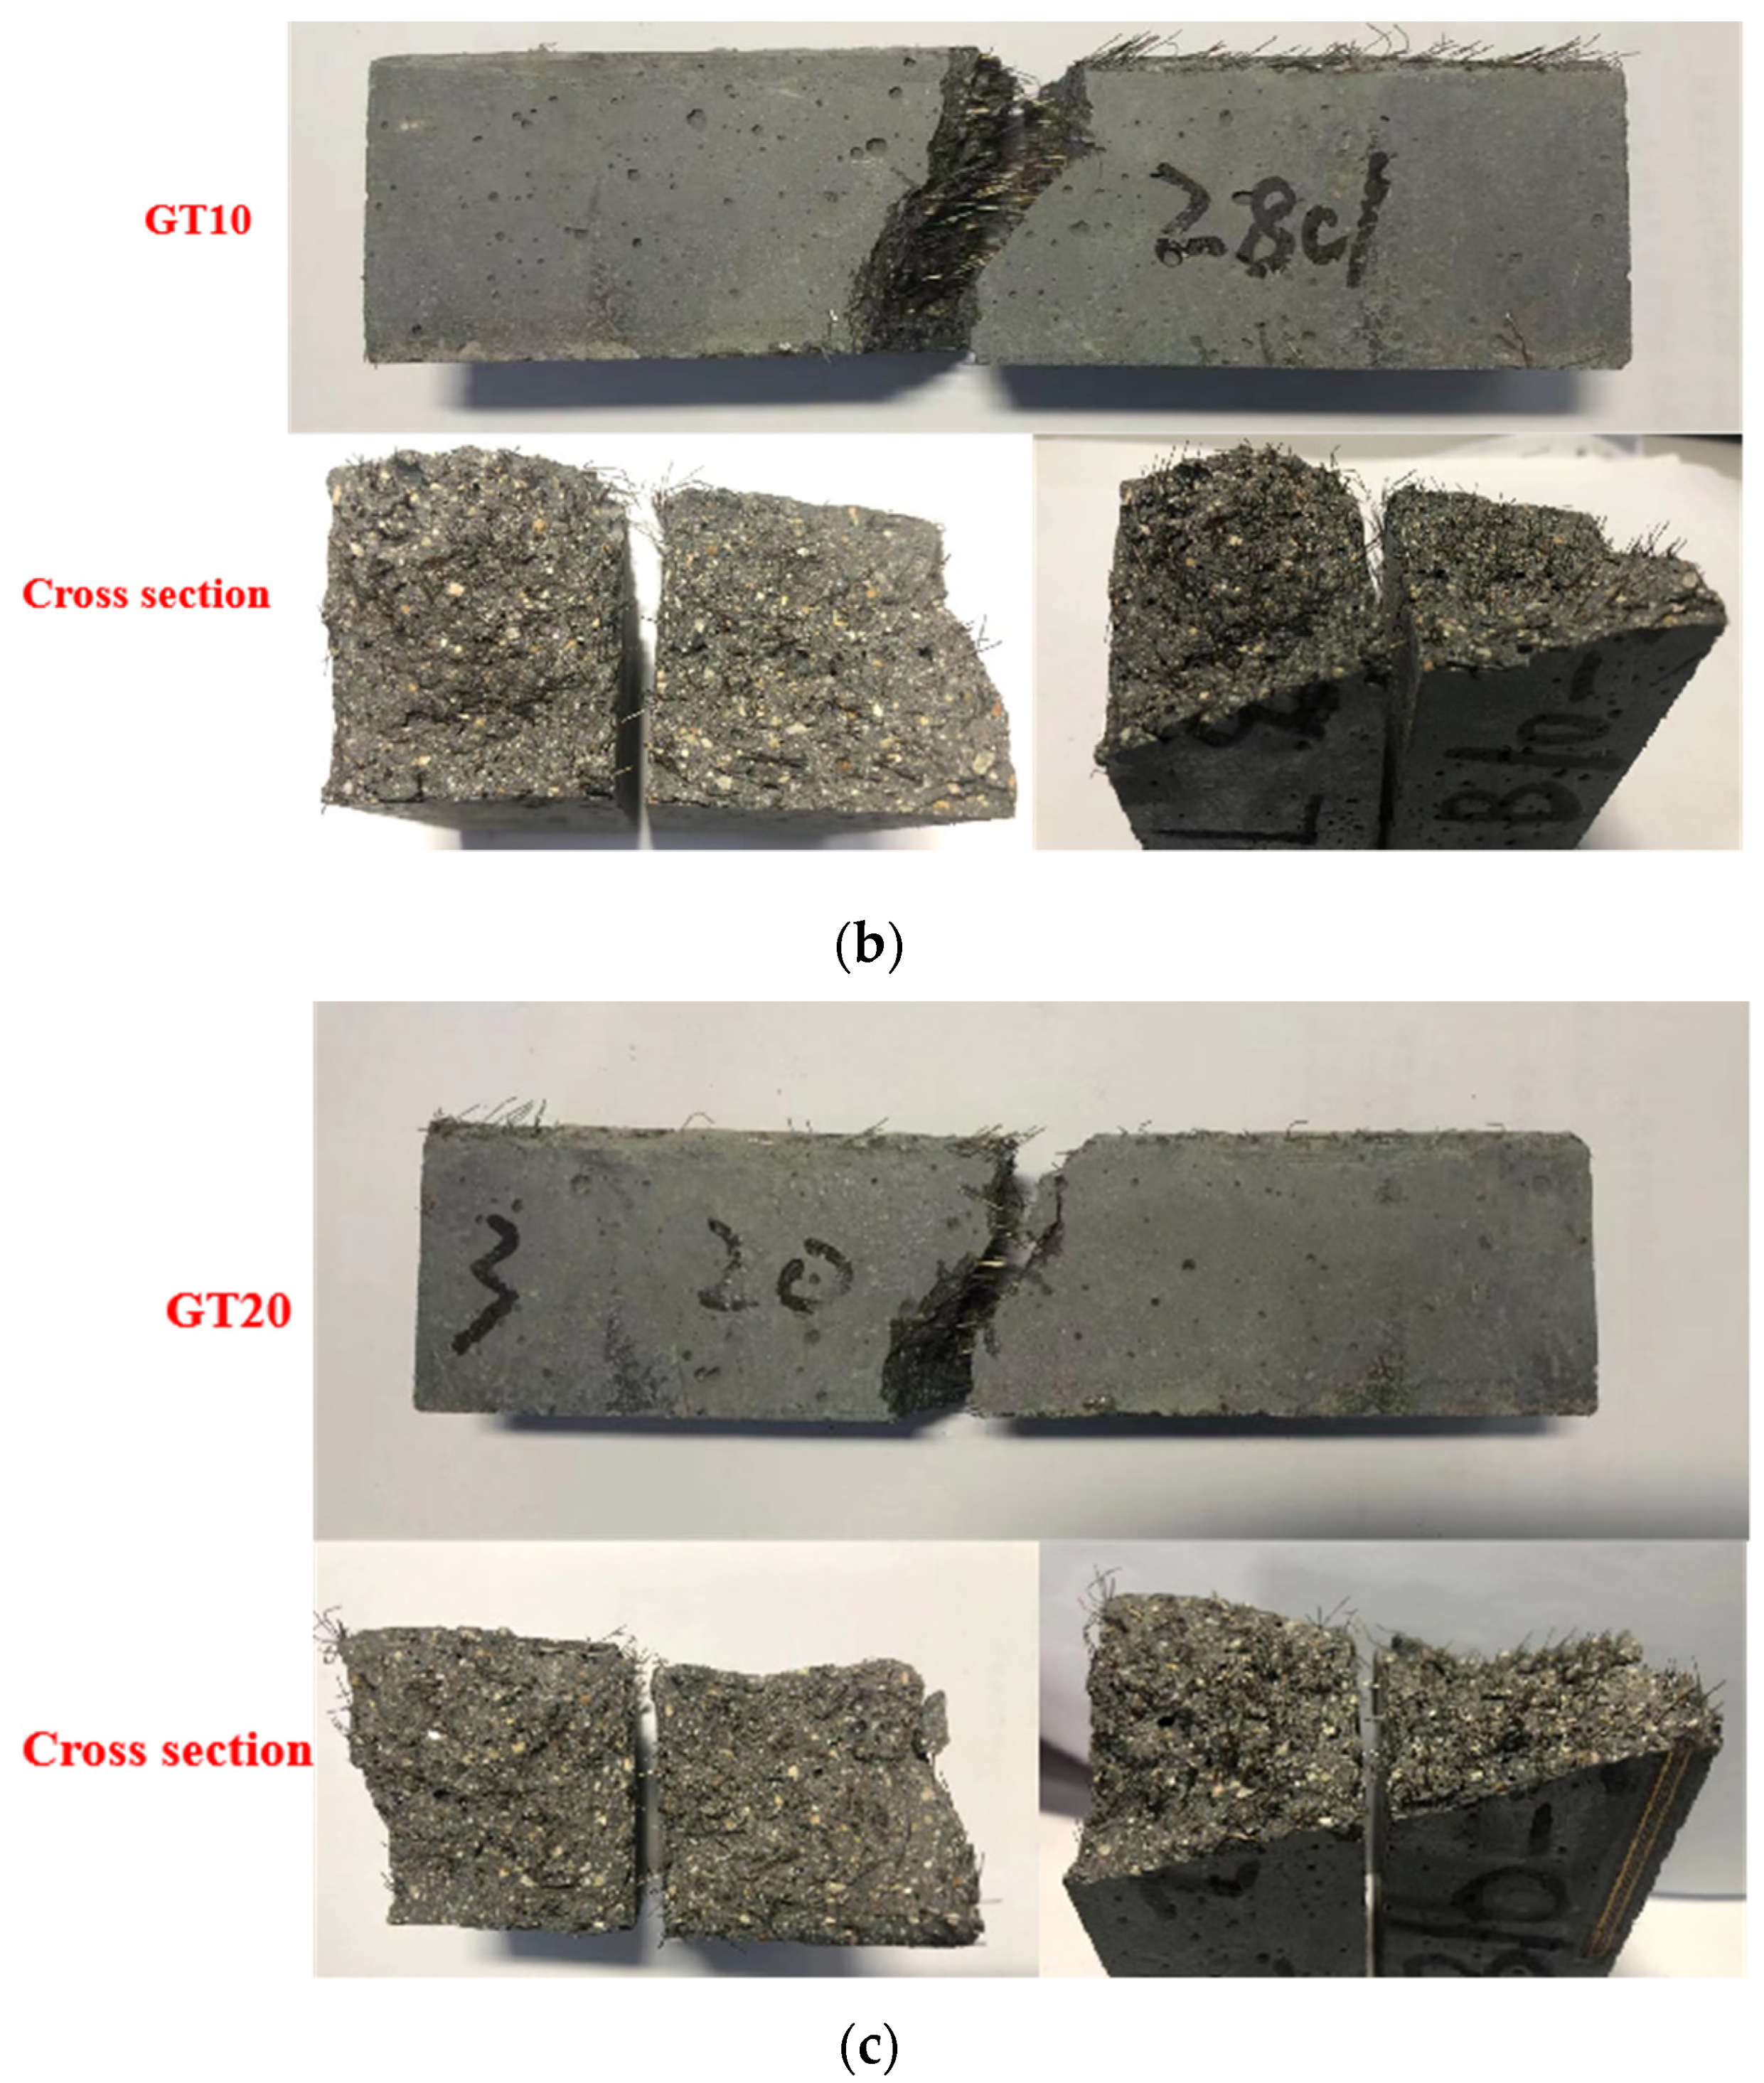
The micro-cracks continued to expand, merged from the initial stress stage to the stress enhancement stage and tended to develop into destructive cracks with a certain width. Figure 19 presents the stress–strain relationship at the initial stress stage. The specimen under the initial force passed through two stages, i.e., the elastic stage and the plastic stage. The strain was tensile strain at the elastic stage, and the stress and strain in the tiny area of the crack tip were basically linear. The curves of GT00, GT10 and GT20 basically overlap. The specimen enters the plastic stage under continuous applied load. The curve of GT00 tends to be flat at first, indicating that the concrete in the GT00 crack tip area is the first to crack due to stress concentration. The curve of GT20 tends to be flattened earlier than that of GT10, indicating that the deformation of the crack tip tending to concrete in GT20 needs to be released first, and GT10 can store more energy than GT20. As the load acted on the specimen, the aggregate, cement stone and steel fiber redistributed the load transmitted by the machine to the specimen. The addition of GT could impact the coordination between the cementitious matrix, aggregates and steel fibers and change the overall distribution of the interface transition zone, thereby impacting the ratio of the force to the transfer force of the respective component. Compared with GT00, the length of elastic interval and plastic interval corresponding to GT10 and GT20 are the largest, indicating that the addition of GT can increase the ability of concrete to resist external force and restrain deformation.
The specimens were composed of five parts, i.e., steel fibers, cement stone, aggregate, the interface transition zone between cement stone and steel fibers and the interface transition zone between cement stone and aggregate. The interface transition zone was the weakest among them, and steel fibers could hinder the propagation of cracks. To expand cracks more easily, the cracks will bypass the steel fiber and aggregate and expand in the transition zone of the interface when the micro-cracks encounter steel fibers or aggregates [60,61,62]. Figure 20 shows the area enclosed by the stress–strain curve in Figure 19; the figure presents the energy required for cracks to propagate in the interface transition zone at the initial stress stage. According to Figure 20, the specimens without GT required the least energy to expand and extend in the interface transition zone and the energy of GT10 and GT20 increased by 44.32% and 36.60%, respectively, as compared with GT00. According to the above test results, the incorporation of GT improved the original structure of the concrete interface transition zone, thereby complying with the research results of Liu et al. [19]. The rougher aggregate surface had stronger physical interaction and mechanical interlocking between the mortar and the mortar [62]; the addition of GT increases the roughness of the aggregate system in concrete compared to GT00. The frictional force when the steel fibers are pulled out from the matrix increases, which makes GT10 and GT20 require more energy to pull out when the aggregate steel fibers are fractured. This is consistent with previous analysis results. The GT particles are irregular. The GT particles and the slurry are easily separated, and segregation occurs when the GT content is 20%. The GT, the slurry and the steel fiber cannot be well bonded, and the steel fibers are easier to pull out. This is in line with the functional relationship established by the compression test.

Flexural Section

The toughening effect of fiber on concrete is dependent of the interaction between the fibers and the concrete matrix, as well as the distribution effect of the fiber group [63,64,65]. To further explore the effect of GT content on the distribution of steel fibers in concrete, the flexural section of specimens (Figure 21) was studied. Figure 22 presents the distribution diagram of 40 mm*40 mm flexural cross-section steel fibers distribution from GT00 to GT20, which indicates that the total number of cross-section fibers of GT00, GT10 and GT20 reached 415, 469 and 433, respectively, from Figure 22.
The respective section was divided into 16 regions, and an in-depth analysis was conducted to generate Figure 23. The red circle represents less than 10 steel fibers and the green circle represents more than 10 steel fibers. According to Figure 23a,b, there were eight areas with fiber number less than 10, three areas with fiber number greater than 20 and 21 areas with fiber numbers between 10 and 20 in the 32 areas in the GT00 cross-section. There were five areas where the number of fibers was less than 10, five areas where the number of fibers exceeded 20 and 20 areas where the number of fibers ranged from 10 to 20 in the 32 areas in the GT10 cross-section. There were six areas where the number of fibers was less than 10, five areas where the number of fibers exceeded 20 and 21 areas where the number of fibers ranged from 10 to 20 in the 32 areas of the GT20 cross-section.
Since the stress at the bending section of the specimen was significantly smaller at the initial stage of bending resistance, the stress was uniformly distributed in the bending section at this time. Initial micro-cracks began to form inside the specimen over the flexural test, and stress and strain were developing in a non-uniform direction. There would be stress concentration close to the micro-cracks. Sudden changes of crack length led to abrupt variations in stress and strain. The stress concentration was more obvious when the initial cracks merged with the inherent cracks of the specimen. The GT-sand aggregate system is more compact than the sand aggregate system. GT10 and GT20 have more reasonable steel fiber distribution than GT00 (Figure 23), which provides a favorable proof for the excellent mechanical properties of GT concrete. The areas with 10~20 steel fibers decrease when the GT content reaches 20%, and the areas with less than 10 fibers increase. Compared with GT10, GT20 has two differences, one is that the rough surface of GT hinders the uniform distribution of steel fibers, and the other is that 20% GT content leads to a decrease in the water content of hydration reaction, which reduces the effective W/B in the raw material. Both of these aspects are detrimental to the GT-sand aggregate system.
Excessive mixing of GT led to a decrease in the water content involved in the hydration reaction, thereby reducing the effective W/B in the raw materials. Thus, the degree of chemical reaction between cement and silica fume was reduced, and the synergistic effect of the GT-sand composite system was affected. The uniformity of steel fibers distribution was closely related to the strength of concrete; the slurry could not fully surround the steel fibers if the GT content was too high. As a consequence, not only would the fibers form agglomerates, but the overall skeleton of the specimen would be affected. The steel fibers distribution of GT10 was more uniform, and the number was larger, which could alleviate stress concentration [66]. Pull-out of steel fiber had less influence on the section stress and strain and the required pull-out force was also greater when there was bending resistance. The steel fiber distribution of GT10 and GT20 is more ideal than that of GT00 in the 32 regions, the stress concentration is lower when the steel fibers are pulled out, and more energy is required to pull out, which is consistent with the previous test results.

4. Conclusions

Graphite tailings are waste residues left after graphite mining. In this study, the physical and mechanical properties exhibited by concrete containing different content of GT as a part of its fine aggregate volume were investigated, and the following conclusions are drawn:
  • The physical properties of GT have a great influence on the mechanical strength of concrete. GT has higher water absorption than sand, which reduces the effective W/B ratio in concrete and affects the hydration of cementitious materials. The rough surface of GT can increase the occlusal force between steel fibers, aggregates and matrix.
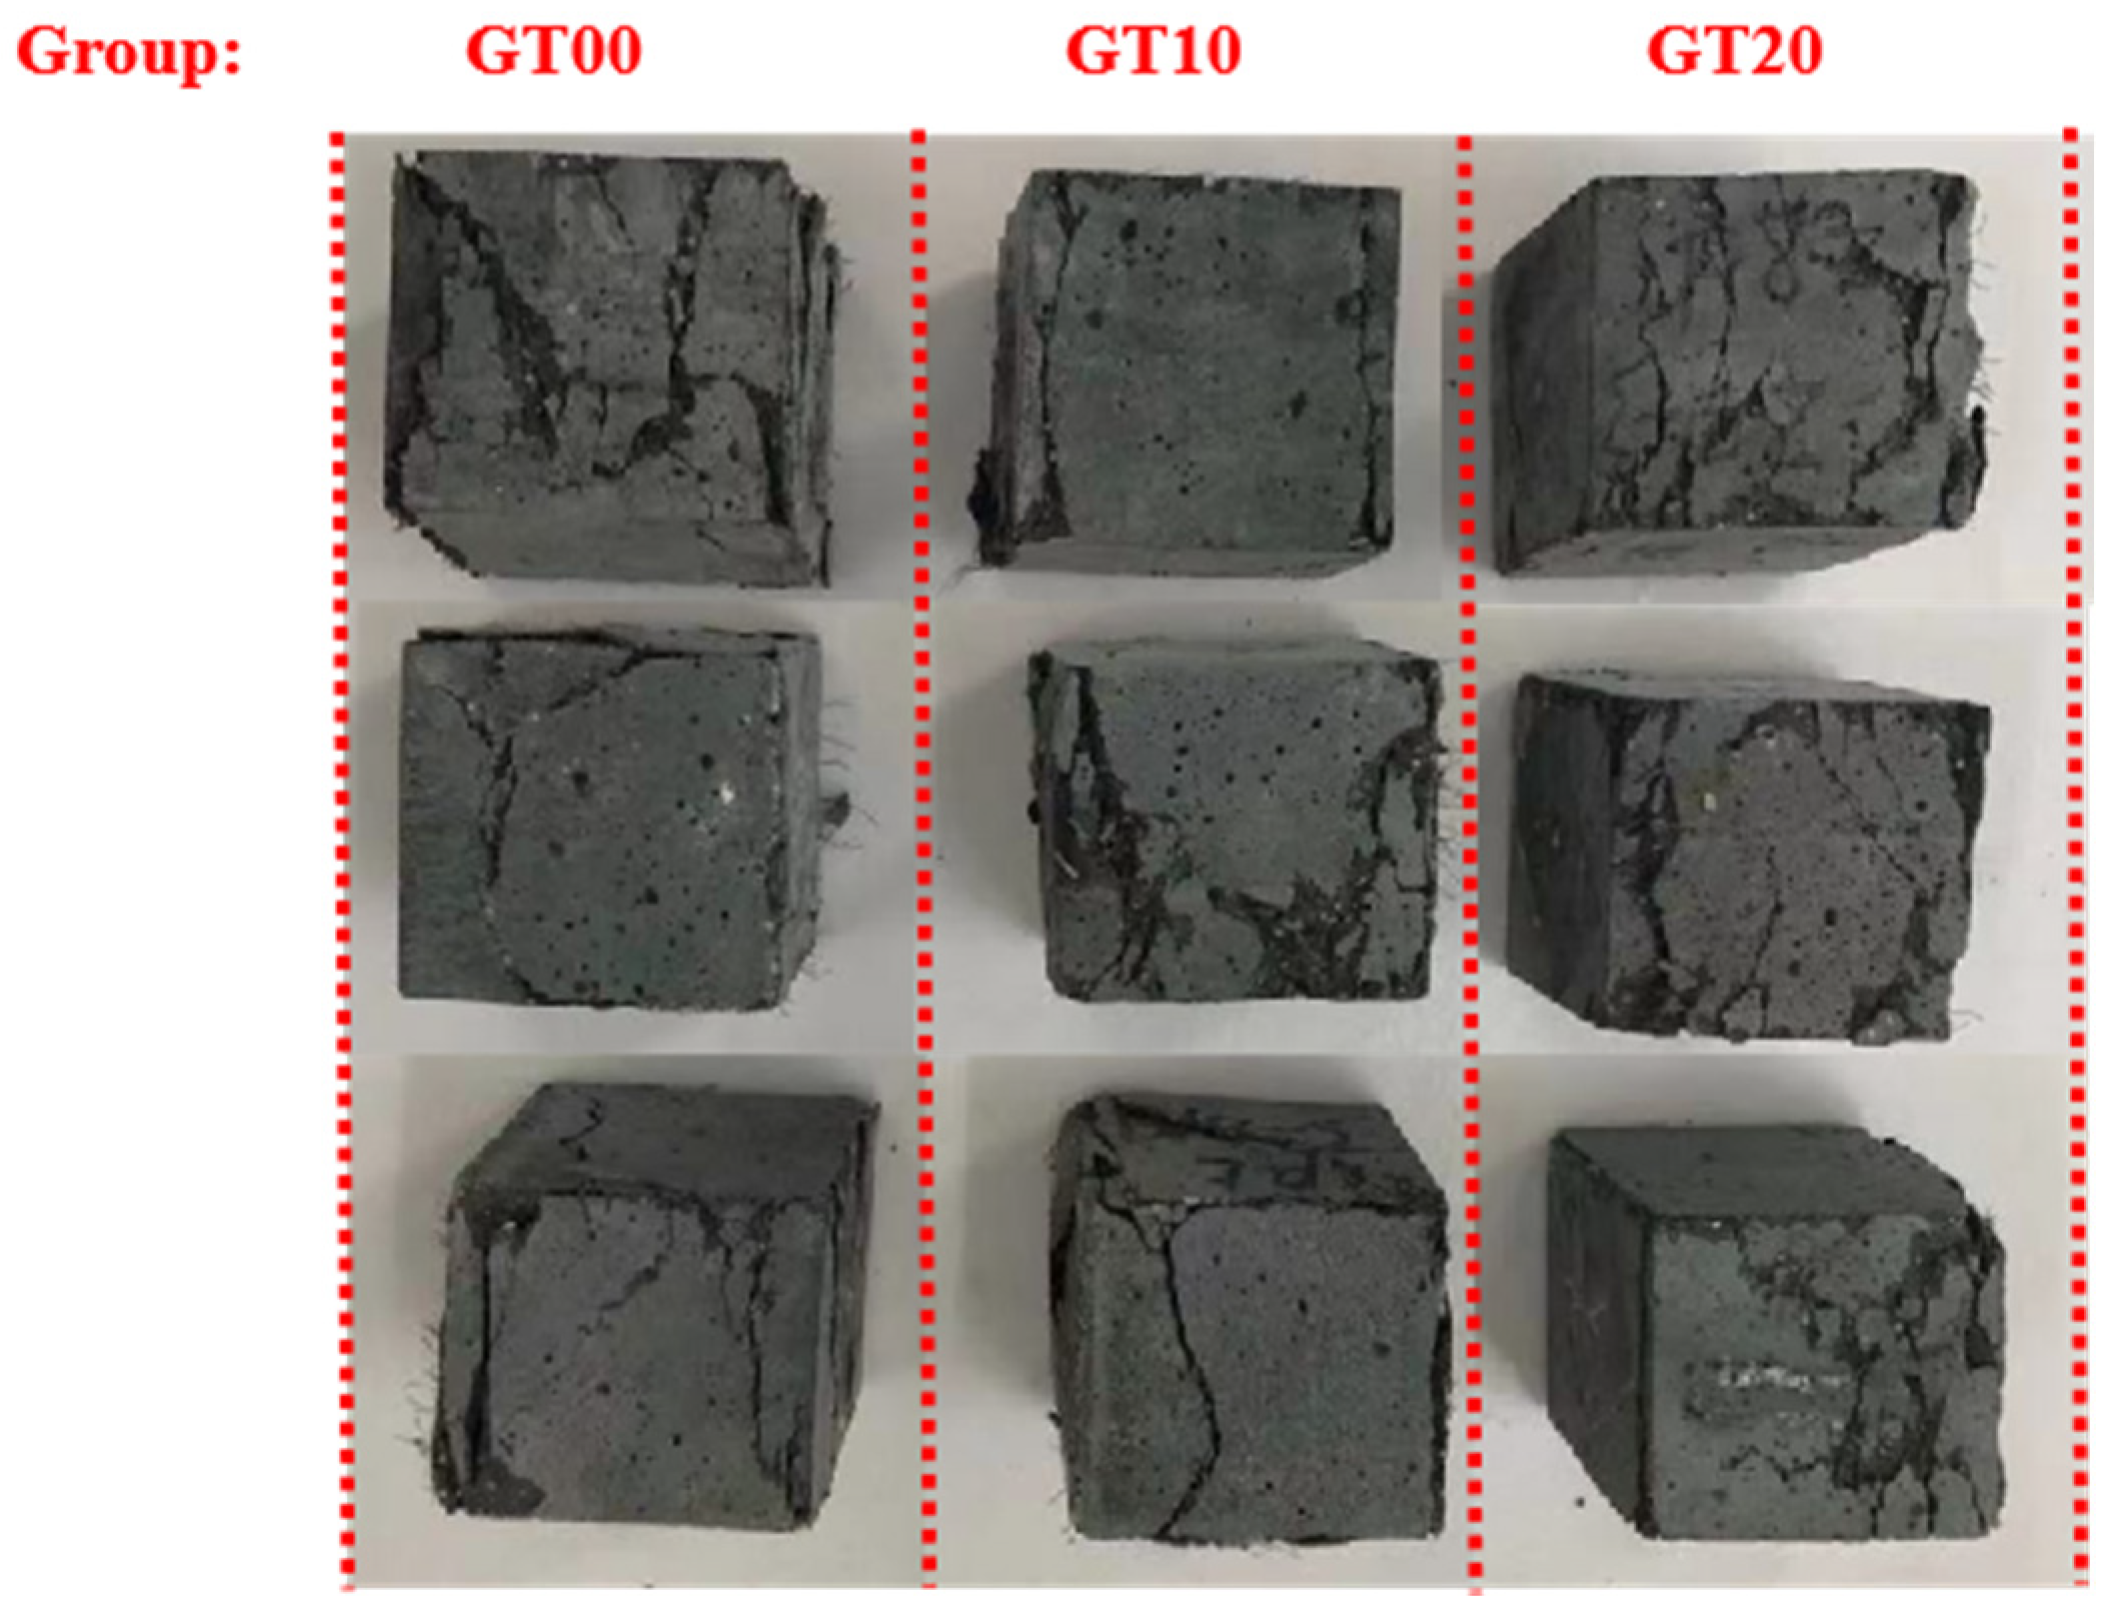
  • The GT ecological concrete was successfully produced based on particle densely packing theory. This method could provide a new idea for the preparation of high-strength concrete by GT in the future. The compressive and flexural test phenomena of GT00, GT10 and GT20 are similar, but the mechanical strength shows different characteristics.
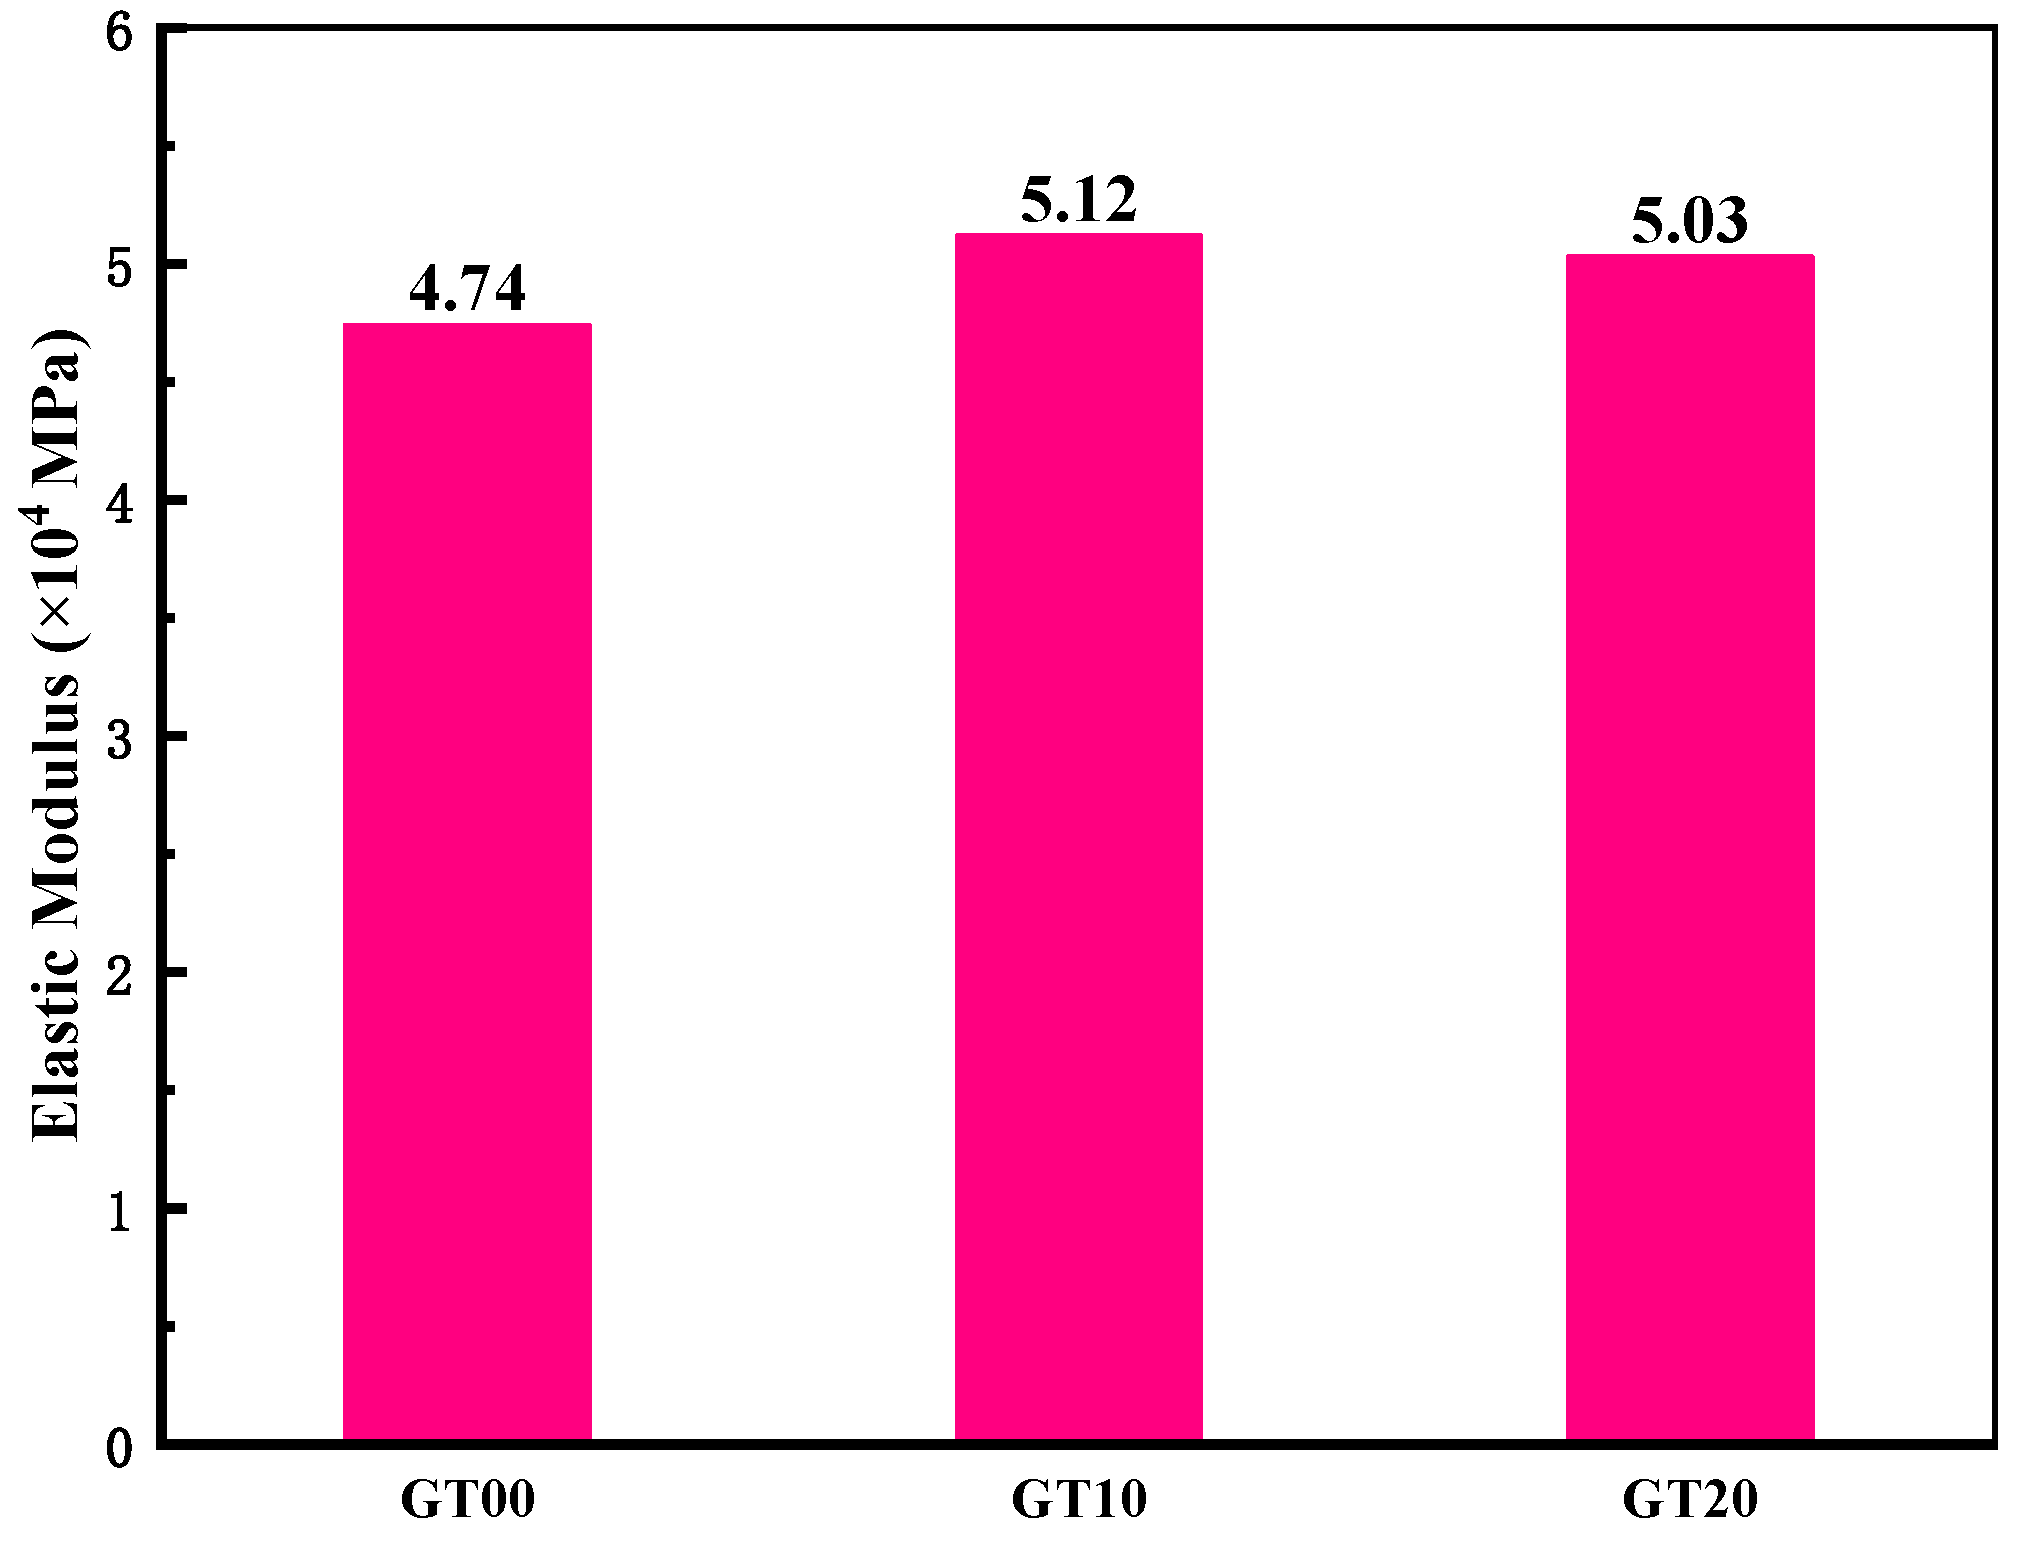
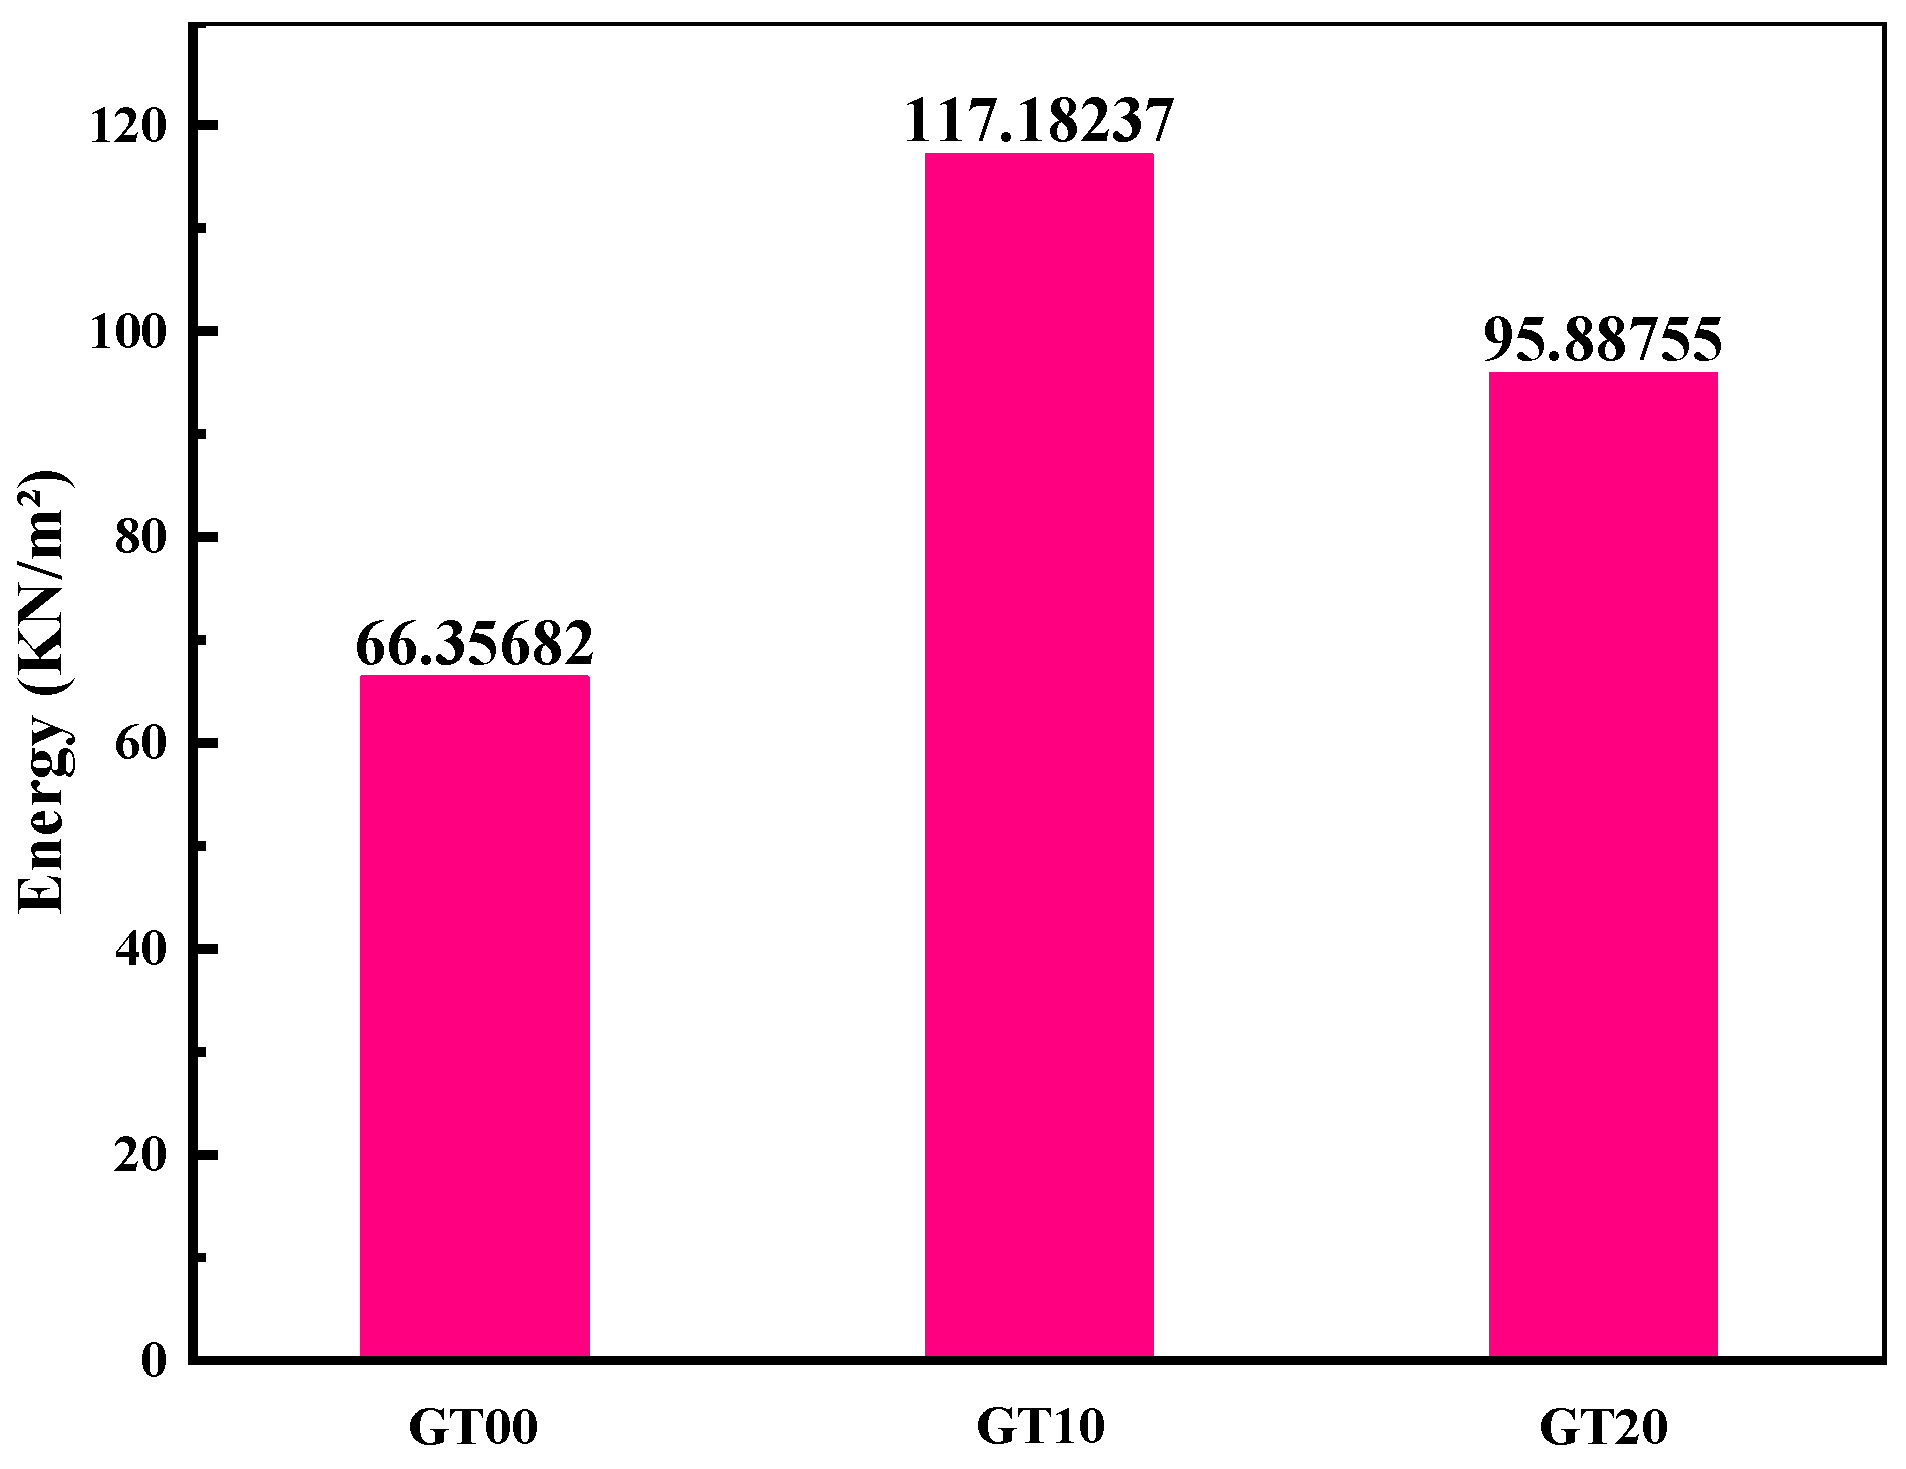
  • GT can reduce the elastic strain energy between the steel fiber and the matrix, which increases the energy required for crack propagation. Compared with GT00, the compressive strength of GT10 and GT20 increased by 9.49% and 3.70%, respectively. When the GT content reaches 20%, the energy of the slurry attached to the GT surface cannot be released under the action of force; this results in an 8.02% increase in elastic modulus for GT10 and only 6.12% for GT20.
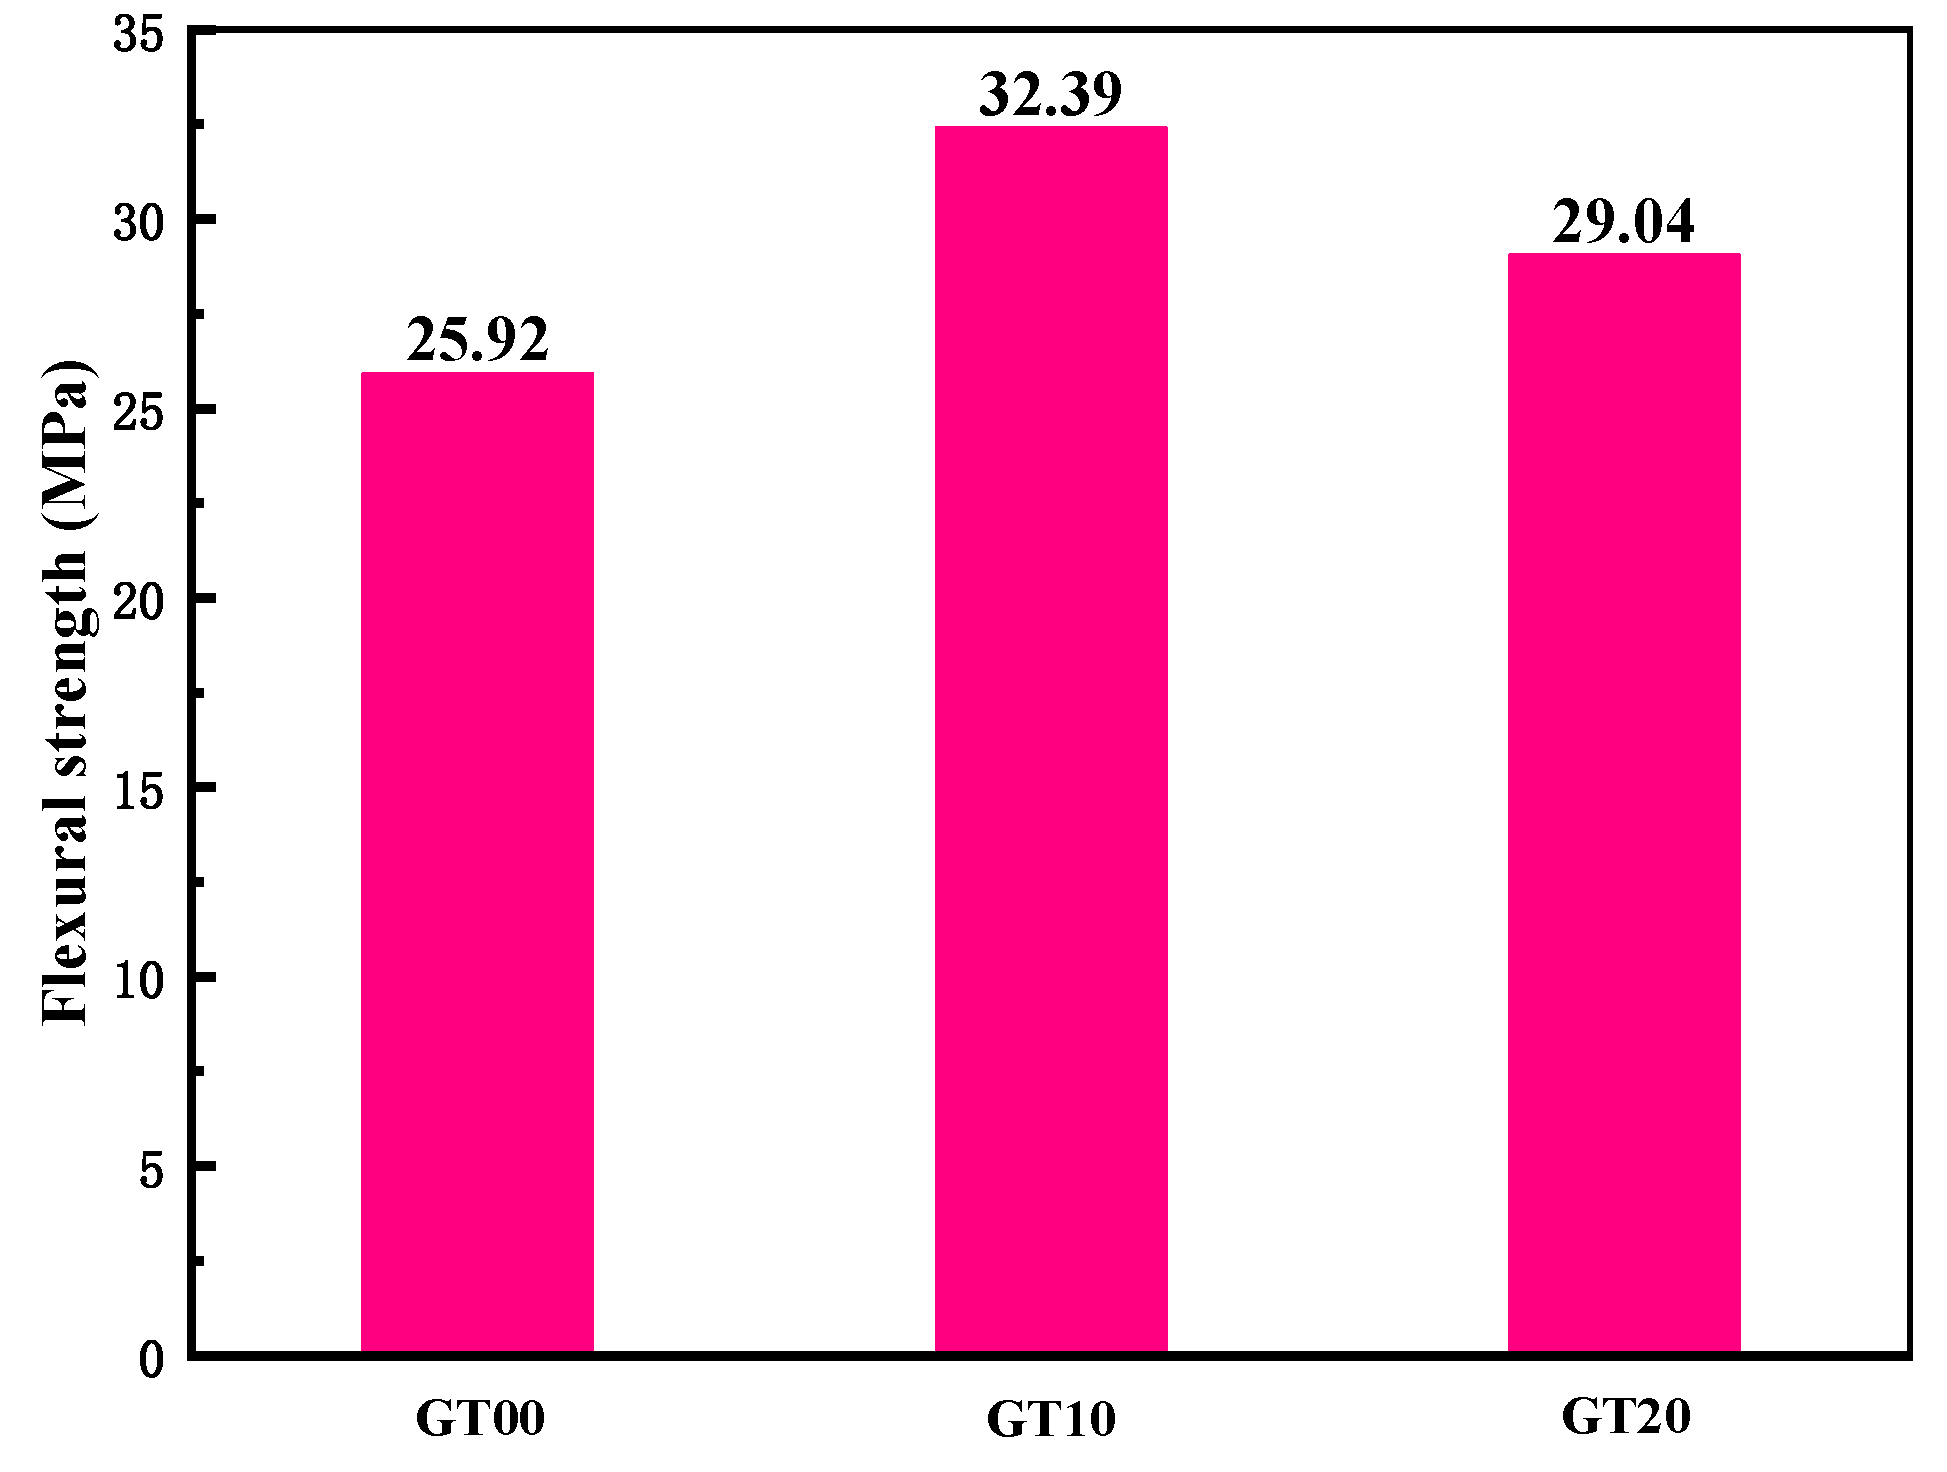
  • The flexural strengths of GT00, GT10 and GT20 (25.92 MPa, 32.39 MPa and 29.04 MPa) were obtained from the load–deflection curves. The stress–strain curves of the flexural specimens were measured, and the energy required for the specimens to be flexed was quantitatively analyzed, which was in line with the functional relationship in the compressive analysis.
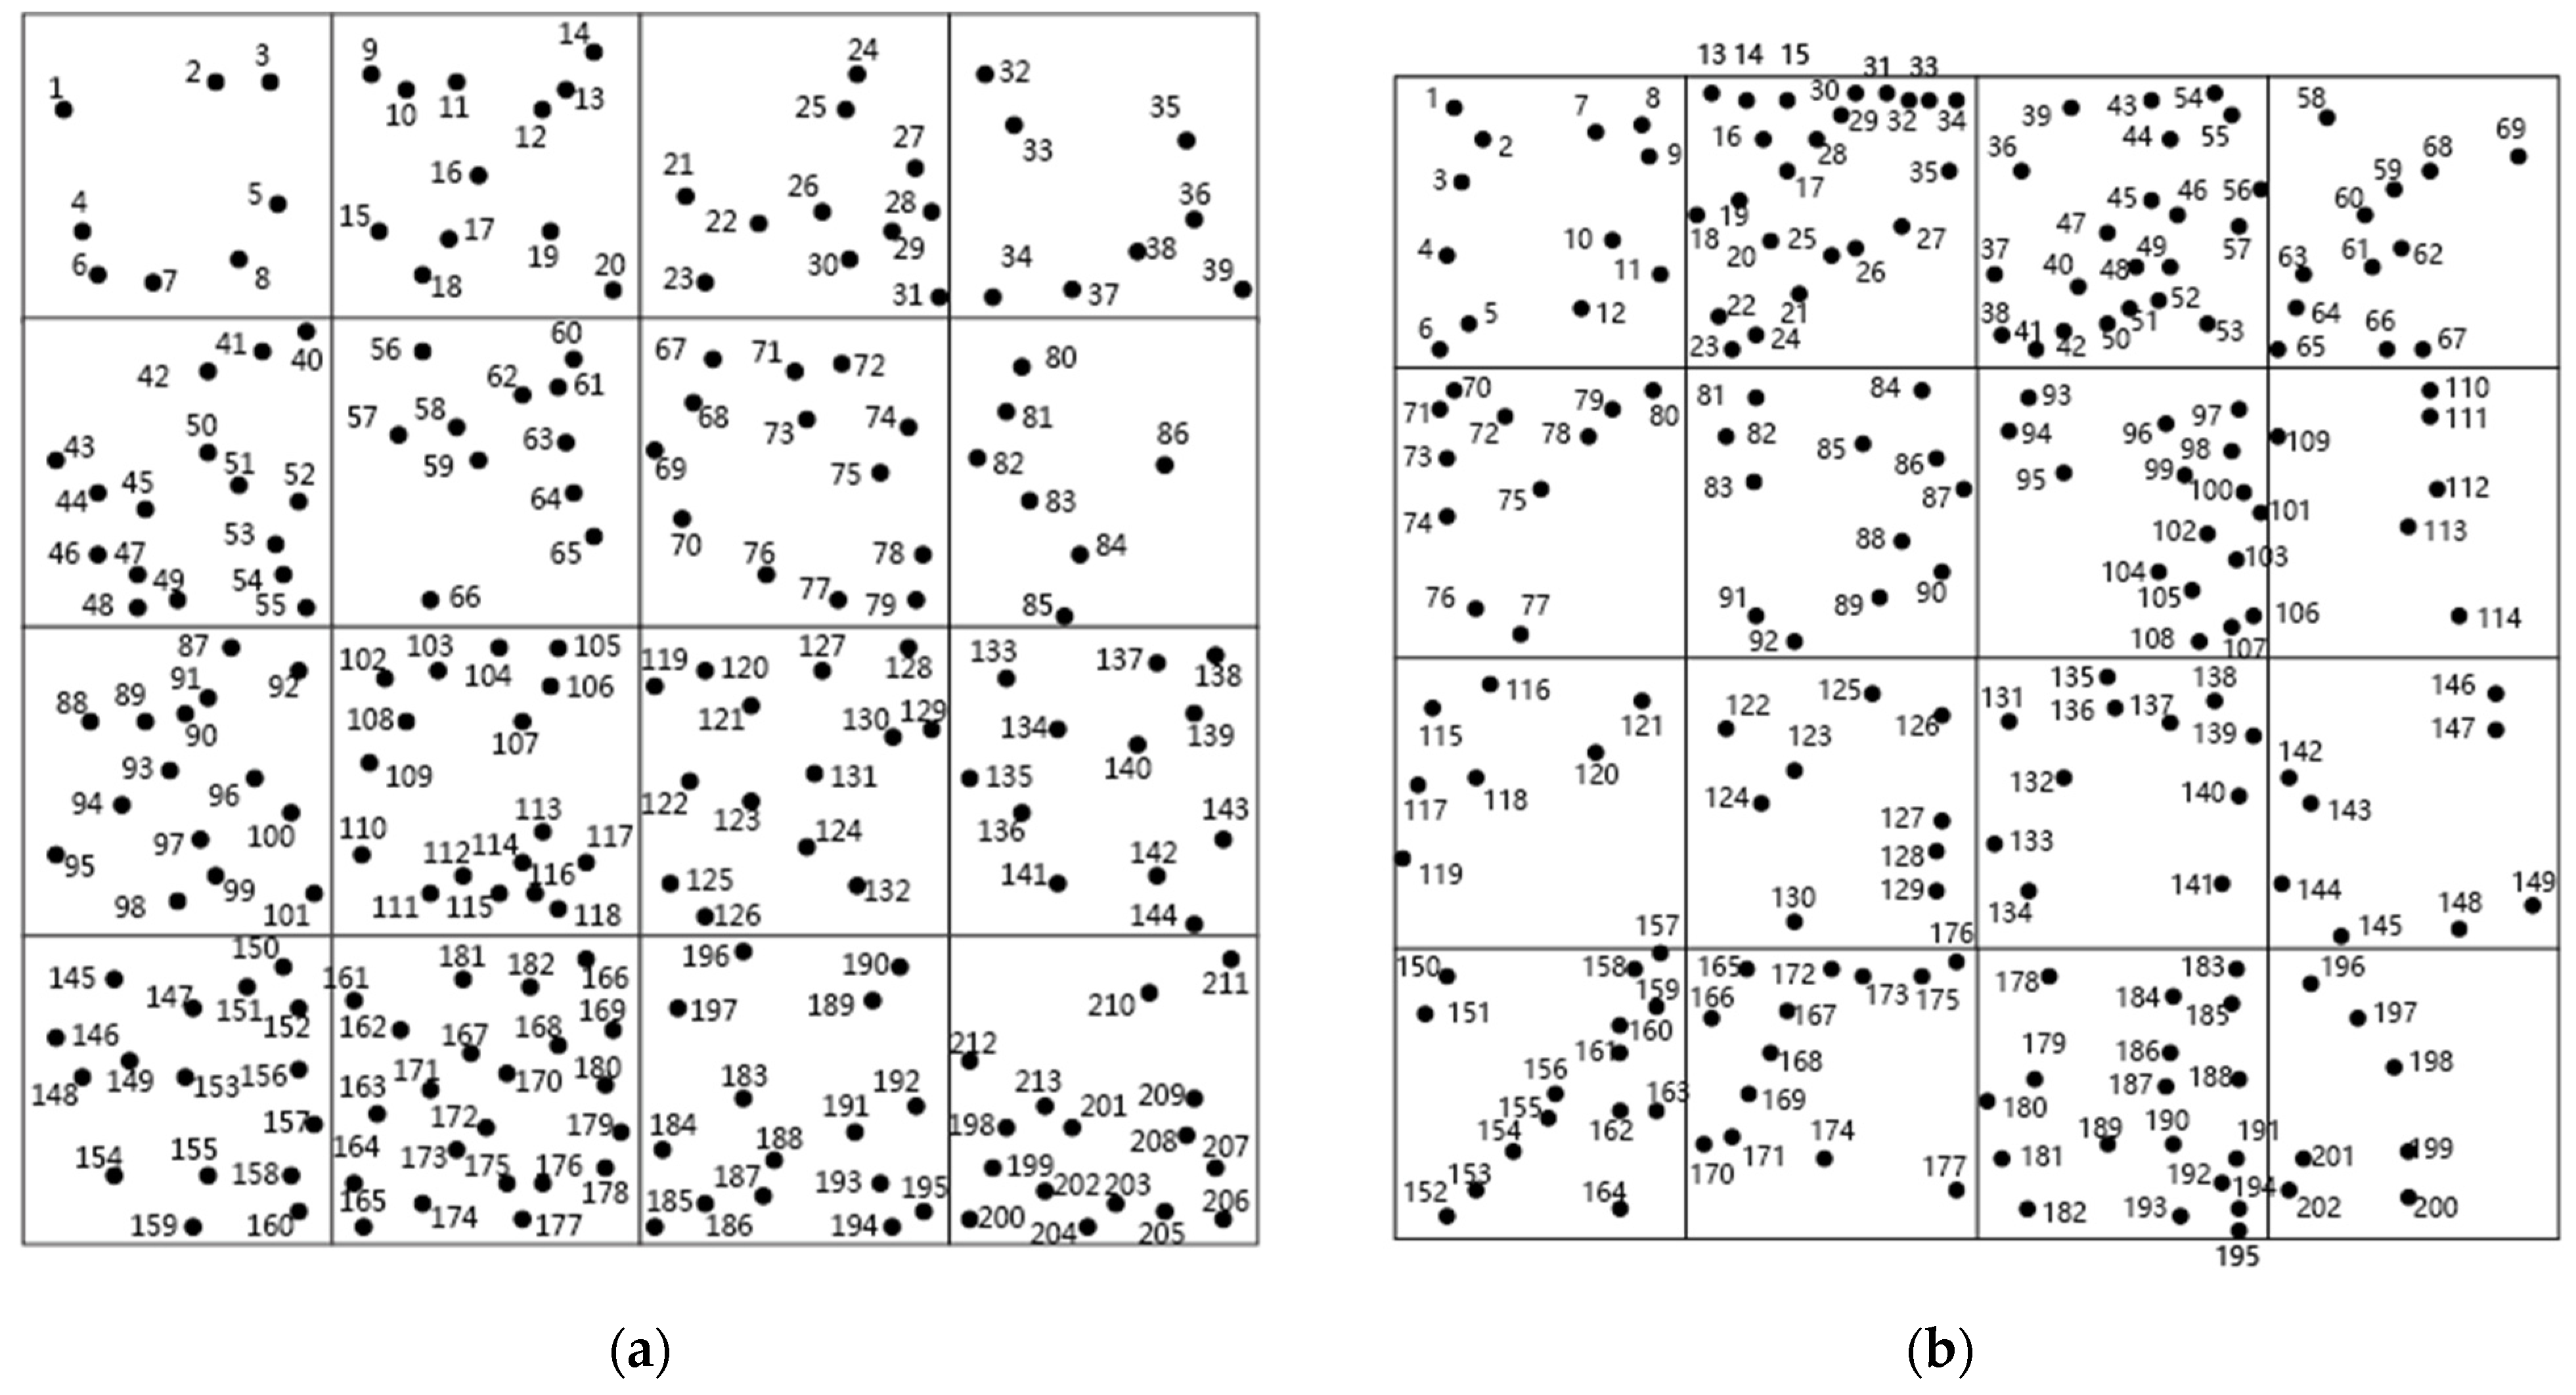
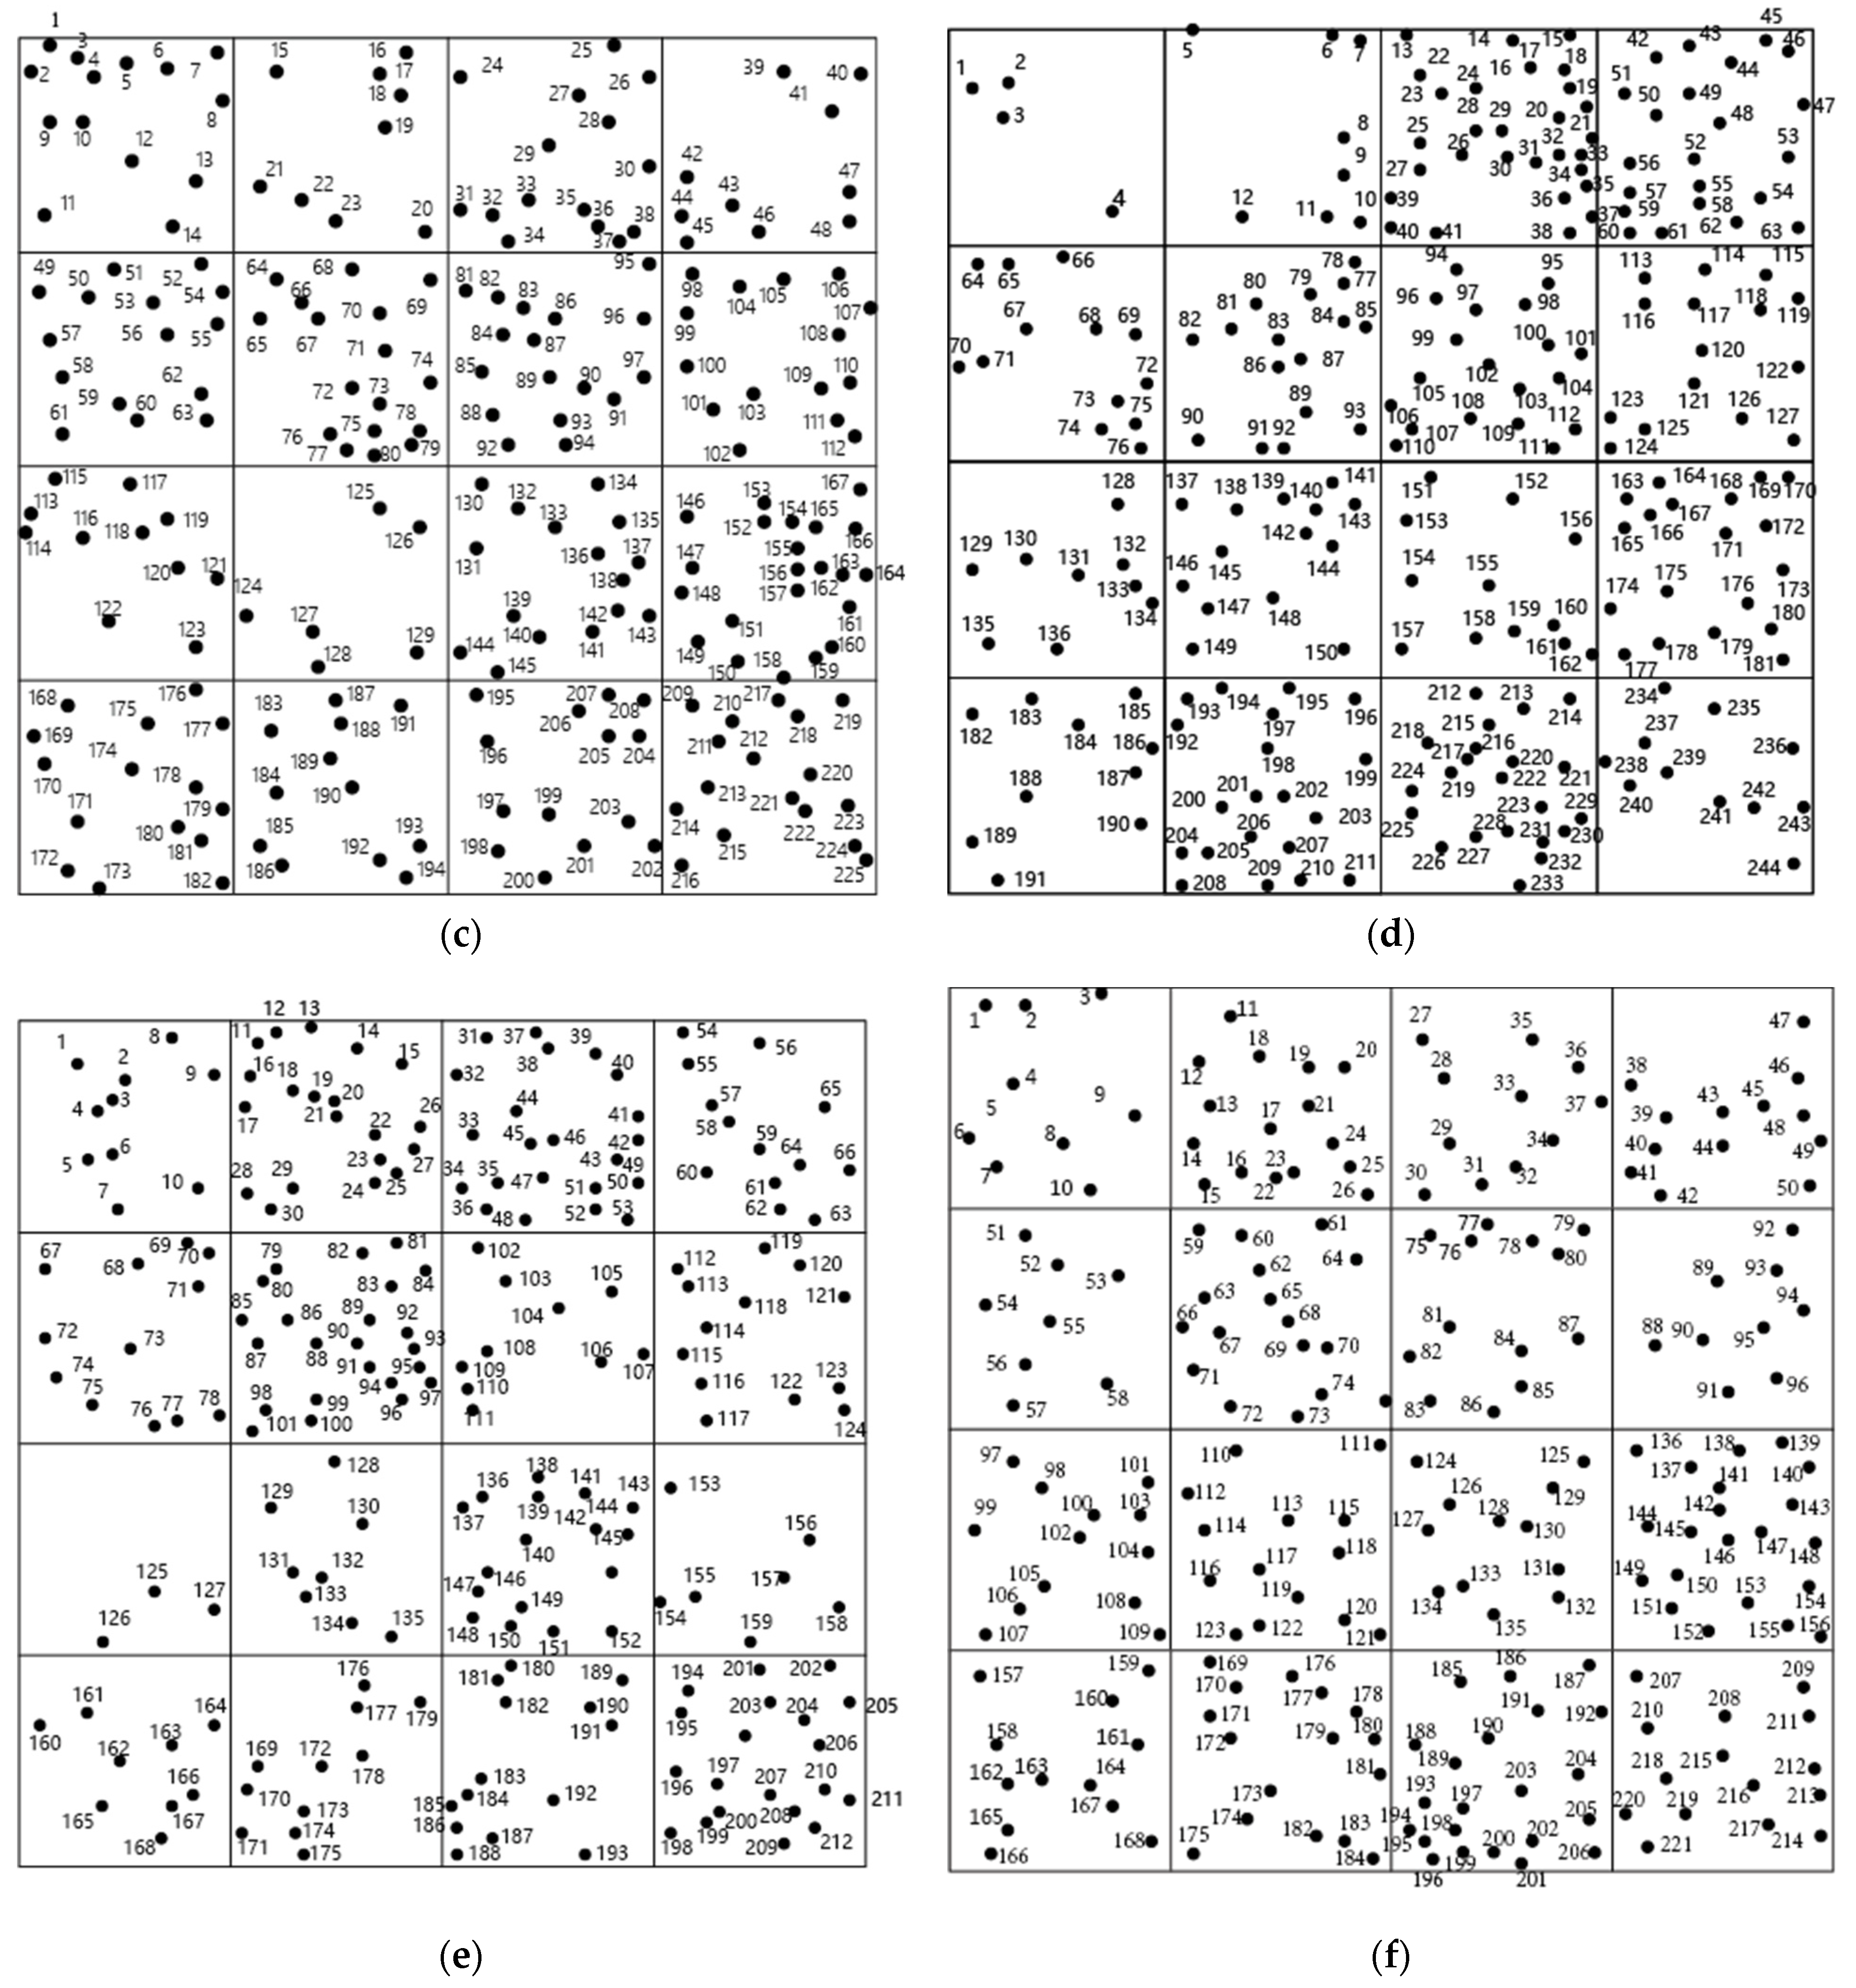
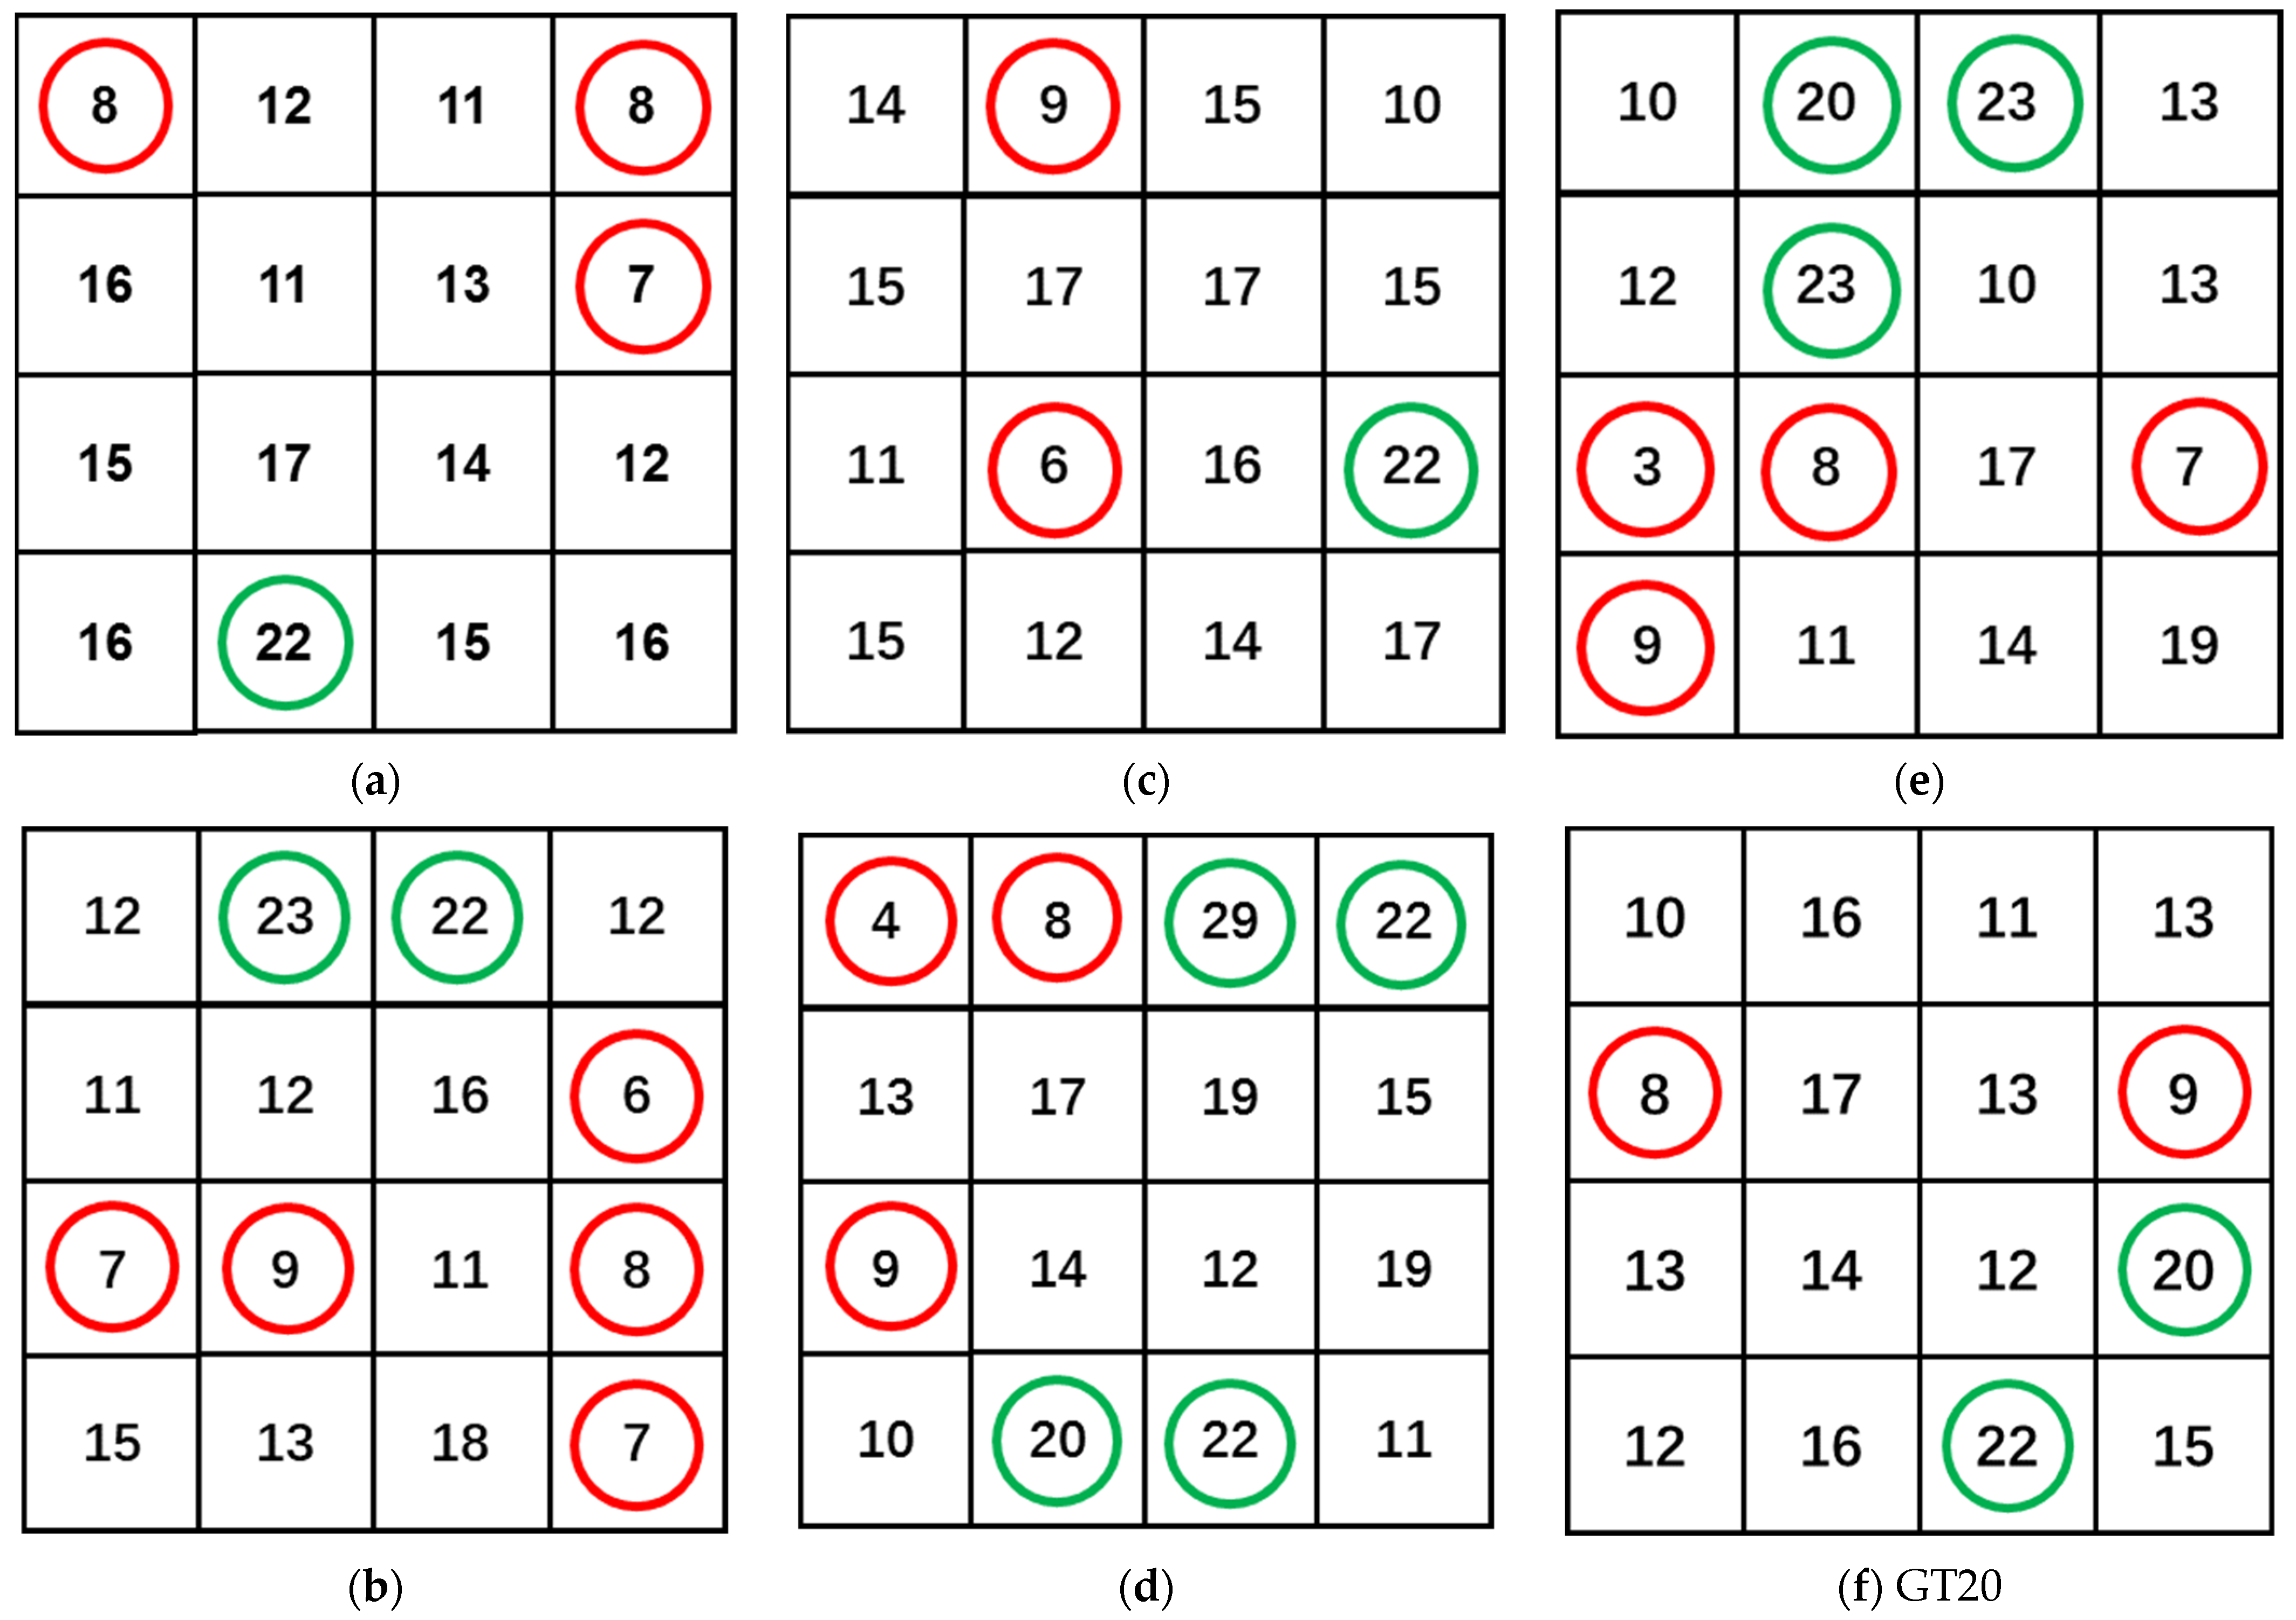
  • The influence of GT on the distribution of steel fibers was studied, and the relative position of each steel fiber was marked. The incorporation of GT could improve the distribution of steel fibers, and the distribution of steel fibers in GT10 was the best.

Author Contributions

Conceptualization, H.D. and H.G.; Data curation, H.D. and J.Z.; Formal analysis, H.G.; Funding acquisition, H.L. and H.G.; Investigation, Z.W. and J.Z.; Methodology, H.G. and J.Z.; Project administration, H.L. and H.G.; Resources, H.L.; Software, H.D. and J.Z.; Supervision, Z.W.; Validation, Z.W. and J.Z.; Visualization, H.L.; Writing – original draft, H.D.; Writing – review & editing, H.D. and H.G. All authors have read and agreed to the published version of the manuscript.

Funding

The authors acknowledge the financial support provided by scientific research projects of basic scientific research expenses in Heilongjiang Provincial Colleges and Universities (2020-KYYWF-1038), the National Natural Science Foundation of China (51678221), Key Laboratory of Functional Inorganic Material Chemistry (Heilongjiang University), Ministry of Education of the People’s Republic of China and Heilongjiang Provincial Universities Central Support Local Universities Reform and Development Funding.

Institutional Review Board Statement

Not applicable.

Informed Consent Statement

Not applicable.

Data Availability Statement

Data derived from the current study can be provided to readers upon request.

Conflicts of Interest

The authors declare no conflict of interest.

References

  1. Carneiro, D.; Irffi, G. The dynamic intensity of CO2 emissions: Empirical evidence for the 20th century. Braz. J. Polit. Econ. 2017, 37, 772–788. [Google Scholar] [CrossRef] [Green Version]
  2. Wei, T.; Dong, W.J.; Yan, Q.; Chou, J.M.; Yang, Z.Y.; Tian, D. Developed and developing world contributions to climate system change based on carbon dioxide, methane and nitrous oxide emissions. Adv. Atmos. Sci. 2016, 33, 632–643. [Google Scholar] [CrossRef] [Green Version]
  3. Yu, Y.Q.; Zhi, H.; Wang, B.; Wan, H.; Li, C.; Mu, H.L.; Li, W.; Zheng, W.P.; Zhou, T.J. Coupled model simulations of climate changes in the 20th century and beyond. Adv. Atmos. Sci. 2008, 25, 641–654. [Google Scholar] [CrossRef] [Green Version]
  4. Gu, C.; Ye, G.; Sun, W. Ultrahigh performance concrete-properties, applications and perspectives. Sci. China Technol. Sci. 2015, 58, 587–599. [Google Scholar] [CrossRef]
  5. Liew, K.M.; Sojobi, A.O.; Zhang, L.W. Green concrete: Prospects and challenges. Constr. Build. Mater. 2017, 156, 1063–1095. [Google Scholar] [CrossRef]
  6. Han, B.; Xiang, T.-Y. Axial compressive stress-strain relation and Poisson effect of structural lightweight aggregate concrete. Constr. Build. Mater. 2017, 146, 338–343. [Google Scholar] [CrossRef]
  7. Kim, Y.; Hanif, A.; Kazmi, S.M.S.; Munir, M.J.; Park, C. Properties enhancement of recycled aggregate concrete through pretreatment of coarse aggregates—Comparative assessment of assorted techniques. J. Cleaner Prod. 2018, 191, 339–349. [Google Scholar] [CrossRef]
  8. Xu, W.; Wen, X.; Wei, J.; Xu, P.; Zhang, B.; Yu, Q.; Ma, H. Feasibility of kaolin tailing sand to be as an environmentally friendly alternative to river sand in construction applications. J. Cleaner Prod. 2018, 205, 1114–1126. [Google Scholar] [CrossRef]
  9. Han, F.; Song, S.; Liu, J.; Huang, S. Properties of steam-cured precast concrete containing iron tailing powder. Powder Technol. 2019, 345, 292–299. [Google Scholar] [CrossRef]
  10. Chinnappa, G.B.; Karra, R.C. Experimental and Statistical Evaluations of Strength Properties of Concrete with Iron Ore Tailings as Fine Aggregate. J. Hazard Toxic Radioact. Waste 2020, 24, 04019038. [Google Scholar] [CrossRef]
  11. Vijayaraghavan, J.; Jude, A.B.; Thivya, J. Effect of copper slag, iron slag and recycled concrete aggregate on the mechanical properties of concrete. Resour. Policy 2017, 53, 219–225. [Google Scholar] [CrossRef]
  12. Dandautiya, R.; Singh, A.P. Utilization potential of fly ash and copper tailings in concrete as partial replacement of cement along with life cycle assessment. Waste Manag. 2019, 99, 90–101. [Google Scholar] [CrossRef] [PubMed]
  13. Lv, X.; Shen, W.; Wang, L.; Dong, Y.; Zhang, J.; Xie, Z. A comparative study on the practical utilization of iron tailings as a complete replacement of normal aggregates in dam concrete with different gradation. J. Cleaner Prod. 2019, 211, 704–715. [Google Scholar] [CrossRef]
  14. Cheng, Y.; Huang, F.; Li, W.; Liu, R.; Li, G.; Wei, J. Test research on the effects of mechanochemically activated iron tailings on the compressive strength of concrete. Constr. Build. Mater. 2016, 118, 164–170. [Google Scholar] [CrossRef]
  15. Zhang, Y.; Shen, W.; Wu, M.; Shen, B.; Li, M.; Xu, G.; Zhang, B.; Ding, Q.; Chen, X. Experimental study on the utilization of copper tailing as micronized sand to prepare high performance concrete. Constr. Build. Mater. 2020, 244, 118312. [Google Scholar] [CrossRef]
  16. Sharma, R.; Khan, R.A. Durability assessment of self compacting concrete incorporating copper slag as fine aggregates. Constr. Build. Mater. 2017, 155, 617–629. [Google Scholar] [CrossRef]
  17. Thomas, B.S.; Damare, A.; Gupta, R.C. Strength and durability characteristics of copper tailing concrete. Constr. Build. Mater. 2013, 48, 894–900. [Google Scholar] [CrossRef]
  18. Hai, Y.; Liao, L.; Lv, G.; Qin, F.; Mei, L.; Wei, Y. Application of Composite Powders Recycled from Graphite Tailings in Styrene-Butadiene Rubber. J. Manag. 2015, 67, 2733–2738. [Google Scholar] [CrossRef]
  19. Liu, H.; Li, B.; Xue, J.; Hu, J.; Zhang, J. Mechanical and Electroconductivity Properties of Graphite Tailings Concrete. Adv. Mater. Sci. Eng. 2020, 2020, 9385097. [Google Scholar] [CrossRef] [Green Version]
  20. Zheng, X.; Ji, T.; Easa, S.M.; Ye, Y. Evaluating feasibility of using sea water curing for green artificial reef concrete. Constr. Build. Mater. 2018, 187, 545–552. [Google Scholar] [CrossRef]
  21. Xue, J.; Wang, X.; Wang, Z.; Xu, S.; Liu, H. Investigations on influencing factors of resistivity measurement for graphite tailings concrete. Cem. Concr. Compos. 2021, 123, 104206. [Google Scholar] [CrossRef]
  22. Wang, Z.-R.; Li, B.; Liu, H.-B.; Zhang, Y.-X.; Qin, X. Degradation characteristics of graphite tailings cement mortar subjected to freeze-thaw cycles. Constr. Build. Mater. 2020, 234, 117422. [Google Scholar] [CrossRef]
  23. Liu, H.; Zhang, Y.; Li, B.; Wang, Z. Combined Effects of Graphite Tailings and Curing Conditions on the Early-Age Performances of Cement Mortar. Adv. Civ. Eng. 2020, 2020, 5965328. [Google Scholar] [CrossRef] [PubMed]
  24. Liu, H.; Xue, J.; Li, B.; Wang, J.; Lv, X.; Zhang, J. Effect of graphite tailings as substitute sand on mechanical properties of concrete. Eur. J. Environ. Civ. Eng. 2020, 2020, 1–19. [Google Scholar] [CrossRef]
  25. Liu, H.; Liu, K.; Lan, Z.; Zhang, D. Mechanical and Electrical Characteristics of Graphite Tailing Concrete. Adv. Mater. Sci. Eng. 2018, 2018, 9297628. [Google Scholar] [CrossRef] [Green Version]
  26. Peng, Y.; Liu, Y.; Zhan, B.; Xu, G. Preparation of autoclaved aerated concrete by using graphite tailings as an alternative silica source. Constr. Build. Mater. 2021, 267, 121792. [Google Scholar] [CrossRef]
  27. Awoyera, P.; Adesina, A. Durability Properties of Alkali Activated Slag Composites: Short Overview. Silicon 2020, 12, 987–996. [Google Scholar] [CrossRef]
  28. Cui, Y.; Chen, Y.; Cen, G.; Peng, G. Comparative Study on the Effect of Organic and Inorganic Fiber on the Anti-wheel Impact Performance of Airport Pavement Concrete under Freeze-thaw Environment. Constr. Build. Mater. 2019, 211, 284–297. [Google Scholar] [CrossRef]
  29. Sun, X.; Gao, Z.; Cao, P.; Zhou, C. Mechanical properties tests and multiscale numerical simulations for basalt fiber reinforced concrete. Constr. Build. Mater. 2019, 202, 58–72. [Google Scholar] [CrossRef]
  30. Naraganti, S.R.; Pannem, R.M.R.; Putta, J. Impact resistance of hybrid fibre reinforced concrete containing sisal fibres. Ain Shams Eng. J. 2019, 10, 297–305. [Google Scholar] [CrossRef]
  31. Noushini, A.; Hastings, M.; Castel, A.; Aslani, F. Mechanical and flexural performance of synthetic fibre reinforced geopolymer concrete. Constr. Build. Mater. 2018, 186, 454–475. [Google Scholar] [CrossRef]
  32. Qin, Y.; Zhang, X.; Chai, J.; Xu, Z.; Li, S. Experimental study of compressive behavior of polypropylene-fiber-reinforced and polypropylene-fiber-fabric-reinforced concrete. Constr. Build. Mater. 2019, 194, 216–225. [Google Scholar] [CrossRef]
  33. Parvez, A.; Foster, S.J. Fatigue Behavior of Steel-Fiber-Reinforced Concrete Beams. J. Struct. Eng. 2015, 141, 04014117. [Google Scholar] [CrossRef]
  34. Okuyucu, O.; Jayawickrama, P.; Senadheera, S. Mechanical Properties of Steel Fiber-Reinforced Self-Consolidating Controlled Low-Strength Material for Pavement Base Layers. J. Mater. Civ. Eng. 2019, 31, 04019177. [Google Scholar] [CrossRef]
  35. Isojeh, B.; El-Zeghayar, M.; Vecchio, F.J. Fatigue Behavior of Steel Fiber Concrete in Direct Tension. J. Mater. Civ. Eng. 2017, 29, 04017130. [Google Scholar] [CrossRef] [Green Version]
  36. Abdallah, S.; Fan, M.; Rees, D.W.A. Bonding Mechanisms and Strength of Steel Fiber-Reinforced Cementitious Composites: Overview. J. Mater. Civ. Eng. 2018, 30, 04018001. [Google Scholar] [CrossRef]
  37. Bragov, A.M.; Petrov, Y.V.; Karihaloo, B.L.; Konstantinov, A.Y.; Lamzin, D.A.; Lomunov, A.K.; Smirnov, I.V. Dynamic strengths and toughness of an ultra high performance fibre reinforced concrete. Eng. Fract. Mech. 2013, 110, 477–488. [Google Scholar] [CrossRef]
  38. Li, Y.; Gao, Y.; Zheng, X.T.; Wang, F.Z. Pore Structure and Compressive Strength of Tailings Concrete under Dry-Wet Cycles of Chloride Attack. J. Perform. Constr. Facil. 2021, 35, 04021048. [Google Scholar] [CrossRef]
  39. Karthikeyan, B.; Kathyayini, R.; Kumar, V.A.; Uthra, V.; Kumaran, S.S. Effect of dumped iron ore tailing waste as fine aggregate with steel and basalt fibre in improving the performance of concrete. Mater. Today: Proc. 2021, 46, 7624–7632. [Google Scholar] [CrossRef]
  40. Zhou, R.; Jin, Y. Study on Mechanical Properties of Concrete with Different Steel Fiber Content. Int. J. Multiphys. 2021, 15, 87–99. [Google Scholar]
  41. Mehdipour, I.; Horst, M.; Zoughi, R.; Khayat, K.H. Use of Near-Field Microwave Reflectometry to Evaluate Steel Fiber Distribution in Cement-Based Mortars. J. Mater. Civ. Eng. 2017, 29, 04017029. [Google Scholar] [CrossRef]
  42. JGJ52; Standard for the Quality and Inspection Methods of Sand and Stone for Ordinary Concrete. China Architecture & Building Press: Beijing, China, 2006.
  43. Martinez-Garcia, R.; de Rojas, M.I.S.; Moran-del Po, J.M.; Fraile-Fernandez, F.J.; Juan-Valdes, A. Evaluation of Mechanical Characteristics of Cement Mortar with Fine Recycled Concrete Aggregates (FRCA). Sustainability 2021, 13, 414. [Google Scholar] [CrossRef]
  44. Saiz Martinez, P.; Gonzalez Cortina, M.; Fernandez Martinez, F.; Rodriguez Sanchez, A. Comparative study of three types of fine recycled aggregates from construction and demolition waste (CDW), and their use in masonry mortar fabrication. J. Cleaner Prod. 2016, 118, 162–169. [Google Scholar] [CrossRef] [Green Version]
  45. Cai, L.; Ma, B.; Li, X.; Lv, Y.; Liu, Z.; Jian, S. Mechanical and hydration characteristics of autoclaved aerated concrete (AAC) containing iron-tailings: Effect of content and fineness. Constr. Build. Mater. 2016, 128, 361–372. [Google Scholar] [CrossRef]
  46. Cai, L.; Li, X.; Liu, W.; Ma, B.; Lv, Y. The slurry and physical-mechanical performance of autoclaved aerated concrete with high content solid wastes: Effect of grinding process. Constr. Build. Mater. 2019, 218, 28–39. [Google Scholar] [CrossRef]
  47. Juanhong, L.; Shaoming, S.; Shigang, M. RPC Study on preparation and properties of high performance cement-based composites. J. Wuhan Univ. Technol. 2001, 23, 14–18. [Google Scholar]
  48. Shi, D.S.; Xue, X.X.; Li, K. Experiment of mix proportion and mechanical performance about reactive powder concrete using granulated blast furnace slag as fine aggregate. Concrete 2015, 19, 73–78. (In Chinese) [Google Scholar]
  49. Tao, Y.; Zhang, H.Z.; Wang, Q.W.; Shi, Q.X. Experimental Study on mixture design of Reactive Powder Concrete by the theory of the most compact. J. Yunnan Univ. 2017, 39, 107. (In Chinese) [Google Scholar]
  50. GB/T 17671; Method of Testing Cements—Determination of Strength. The State Bureau of Quality and Technical Supervision: Beijing, China, 1999.
  51. Siddique, R. Utilization of silica fume in concrete: Review of hardened properties. Resour. Conserv. Recycl. 2011, 55, 923–932. [Google Scholar] [CrossRef]
  52. Nazarimofrad, E.; Shaikh, F.U.A.; Nili, M. Effects of steel fibre and silica fume on impact behaviour of recycled aggregate concrete. J. Sustainable Cem. Based Mater. 2017, 6, 54–68. [Google Scholar] [CrossRef]
  53. Rahmani, E.; Dehestani, M.; Beygi, M.H.A.; Allahyari, H.; Nikbin, I.M. On the mechanical properties of concrete containing waste PET particles. Constr. Build. Mater. 2013, 47, 1302–1308. [Google Scholar] [CrossRef]
  54. Hong, L.; Gu, X.L.; Lin, F. Influence of aggregate surface roughness on mechanical properties of interface and concrete. Constr. Build. Mater. 2014, 65, 338–349. [Google Scholar] [CrossRef]
  55. Li, F.; Cui, Y.; Cao, C.; Wu, P. Experimental study of the tensile and flexural mechanical properties of directionally distributed steel fibre-reinforced concrete. Proc. Inst. Mech. Eng. Pt. L-J. Mater. Design Appl. 2019, 233, 1721–1732. [Google Scholar] [CrossRef]
  56. Zhao, S.; Jiang, L.; Chu, H. A preliminary investigation of energy consumption in fracture of ultra-high performance concrete. Constr. Build. Mater. 2020, 237, 117634. [Google Scholar] [CrossRef]
  57. Chen, A.; Han, X.; Chen, M.; Wang, X.; Wang, Z.; Guo, T. Mechanical and stress-strain behavior of basalt fiber reinforced rubberized recycled coarse aggregate concrete. Constr. Build. Mater. 2020, 260, 119888. [Google Scholar] [CrossRef]
  58. Carpinteri, A.; Accornero, F. Residual crack opening in fiber-reinforced structural elements subjected to cyclic loading. Strength Fract. Complexity 2020, 12, 63–74. [Google Scholar]
  59. Zhang, C.Y.; Sun, Y.K.; Xu, J.G.; Wang, B. The Effect of Vibration Mixing on the Mechanical Properties of Steel Fiber Concrete with Different Mix Ratios. Materials 2021, 14, 3669. [Google Scholar] [CrossRef]
  60. Visintin, P.; Oehlers, D.J. Fundamental mechanics that govern the flexural behaviour of reinforced concrete beams with fibre-reinforced concrete. Adv. Struct. Eng. 2018, 21, 1088–1102. [Google Scholar] [CrossRef]
  61. Gumus, M.; Arslan, A. Effect of fiber type and content on the flexural behavior of high strength concrete beams with low reinforcement ratios. Structure 2019, 20, 1–10. [Google Scholar] [CrossRef]
  62. Ju, Y.; Jia, Y.; Liu, H.; Chen, J. Mesomechanism of steel fiber reinforcement and toughening of reactive powder concrete. Sci. China Ser. E: Technol. Sci. 2007, 50, 815–832. [Google Scholar] [CrossRef]
  63. Alberti, M.G.; Enfedaque, A.; Galvez, J.C. Fracture mechanics of polyolefin fibre reinforced concrete: Study of the influence of the concrete properties, casting procedures, the fibre length and specimen size. Eng. Fract. Mech. 2016, 154, 225–244. [Google Scholar] [CrossRef]
  64. Sigruner, M.; Muscat, D.; Strubbe, N. Investigation on pull-out behavior and interface critical parameters of polymer fibers embedded in concrete and their correlation with particular fiber properties. J. Appl. Polym. Sci. 2021, 138, 50745. [Google Scholar] [CrossRef]
  65. Peng, Y.; Zhang, J.; Liu, J.; Ke, J.; Wang, F. Properties and microstructure of reactive powder concrete having a high content of phosphorous slag powder and silica fume. Constr. Build. Mater. 2015, 101, 482–487. [Google Scholar] [CrossRef]
  66. Guo, X.L.; Pan, X.J. Mechanical properties and mechanisms of fiber reinforced fly ash-steel slag based geopolymer mortar. Constr. Build. Mater. 2018, 179, 633–641. [Google Scholar] [CrossRef]
Figure 1. Materials used in the production of concrete. (a) Cement; (b) Silica fume; (c) Sand; (d) GT; (e) Steel fiber.
Buildings 12 00509 g001
Figure 2. Bulk density test of sand.
Buildings 12 00509 g002
Figure 3. Bulk density test of GT.
Buildings 12 00509 g003
Figure 4. Preparation process of GT ecological concrete.
Buildings 12 00509 g004
Figure 5. Compression test.
Buildings 12 00509 g005
Figure 6. Flexural test.
Buildings 12 00509 g006
Figure 7. Specimens after compression damage.
Buildings 12 00509 g007
Figure 8. Schematic diagram of the compression stage of the specimen. (a) Compression stage; (b) Linear enhancement stage; (c) Defect expansion stage; (d) Destruction stage.
Buildings 12 00509 g008
Figure 9. Specimens after flexural failure.
Buildings 12 00509 g009
Figure 10. Schematic diagram of the bending resistance stage of the specimen. (a) Initial stress stage; (b) Stress enhancement stage; (c) Ultimate failure stage.
Buildings 12 00509 g010
Figure 11. Compressive strength of specimens with different substitution rates.
Buildings 12 00509 g011
Figure 12. Strength increase rate of each age.
Buildings 12 00509 g012
Figure 13. Compressive stress–strain curve.
Buildings 12 00509 g013
Figure 14. Elastic modulus.
Buildings 12 00509 g014
Figure 15. Load deflection curve.
Buildings 12 00509 g015
Figure 16. Flexural strength.
Buildings 12 00509 g016
Figure 17. Maximum bending and tensile strain.
Buildings 12 00509 g017
Figure 18. Flexural modulus.
Buildings 12 00509 g018
Figure 19. Stress–strain curve at the initial stress stage.
Buildings 12 00509 g019
Figure 20. The energy required for crack propagation in the initial stress stage.
Buildings 12 00509 g020
Figure 21. The selected flexural specimens and their cross-sections. (a) GT00 and its cross-sections; (b) GT10 and its cross-sections; (c) GT20 and its cross-sections.
Buildings 12 00509 g021aBuildings 12 00509 g021b
Figure 22. Distribution diagram of 40 mm×40 mm flexural cross-section steel fibers. (a) GT00 Left section (The number of fibers is 213); (b) GT00 Right section (The number of fibers is 202); (c) GT10 Left section (The number of fibers is 225); (d) GT10 Right section (The number of fibers is 244); (e) GT20 Left section (The number of fibers is 212); (f) GT20 Right section (The number of fibers is 221).
Buildings 12 00509 g022aBuildings 12 00509 g022b
Figure 23. Simplified diagram of the number of cross-section steel fibers. (a) GT00 Left section (b) GT00 Right section; (c) GT10 Left section; (d) GT10 Right section; (e) GT20); (f) GT20 Right section.
Buildings 12 00509 g023
Table 1. Comparison of particle size between sand and GT.
Particle Size (mm)2.50~1.251.25~0.630.63~0.3150.315~0.150.15~0
Proportion of sand particle size (%)13.6224.5639.9616.934.93
Proportion of GT particle size (%)--2.1928.2328.2741.32
Table 2. Chemical composition of cement, silica fume and GT.
Mineral CompositionSiO2CaOAl2O3Fe2O3MgOK2OLoss
Mass percentage %Cement24.6655.467.092.712.150.657.28
Silica fume92.80.310.760.520.532.22.88
GT56.6413.3411.527.253.723.543.99
Table 3. The crushing rate and water absorption rate of sand and GT.
Material TypeCrushing Rate (%)Water Absorption (%)
Sand15.040.5
GT28.591.7
Table 4. Microscopic pictures of sand and GT with different particle sizes.
Particle Size (mm)2.50~1.251.25~0.630.63~0.3150.315~0.150.15~0
Sand Buildings 12 00509 i001 Buildings 12 00509 i002 Buildings 12 00509 i003 Buildings 12 00509 i004 Buildings 12 00509 i005
GT Buildings 12 00509 i006 Buildings 12 00509 i007 Buildings 12 00509 i008 Buildings 12 00509 i009
Table 5. Physical parameters of sand.
Aggregate TypeParticle Size (mm)Apparent Density/(kg/m3)Bulk Density/(kg/m3)Porosity/(%)
Coarse sand0.6 0.32591.121278.4850.66
Fine sand0.3 0.152583.101262.9251.11
Coarse GT0.6 0.32864.781202.6358.02
Fine GT0.3 0.152854.211812.9536.48
Table 6. Optimal gradation of sand and GT.
Aggregate TypeRatio of Coarse and Fine Particle SizePorosity after Close Packing (%)
Coarse
(0.63~0.315 mm)
Fine
(0.315~0.15 mm)
Sand10.420.44
GT10.725.54
Table 7. Optimal gradation of sand and GT.
SandGT
α 0.280.51
W 0.63 ~ 0.315 mm   kg / m 3 9611078
W 0.315 ~ 0.15 mm   kg / m 3 384755
Table 8. Determination of final dosage of sand and GT.
P / % V p V a g g W 0.315 ~ 0.15   mm / kg / m 3 W 0.63 ~ 0.315   mm / kg / m 3
Sand48.0%0.6720.328238611
GT35.9%0.5030.497487696
Table 9. Concrete mixture proportion of GT00 to GT20 (kg/m³).
GroupWaterCementSilica FumeSandGTSteel
Fibers
Admixture
CoarseFineCoarseFine
GT00224896224611.0238.00015716.8
GT10224896224545.8218.349.934.915716.8
GT20224896224485.1194.199.969.915716.8
Publisher’s Note: MDPI stays neutral with regard to jurisdictional claims in published maps and institutional affiliations.

