Article

Physical Properties and Environmental Impact of Sound Barrier Materials Based on Fly Ash Cenosphere

1
Faculty of Architecture and Urban Planning, Chongqing University, Chongqing 400045, China
2
Key Laboratory of New Technology for Construction of Cities in Mountain Area, Ministry of Education, Chongqing University, Chongqing 400045, China
3
Department of Technology of Building Materials and Construction, Tashkent Institute of Architecture and Constructions, Tashkent 10011, Uzbekistan
4
China Construction Science & Technology Group Co., Ltd., Beijing 100070, China
*
Authors to whom correspondence should be addressed.
Buildings 2022, 12(3), 322; https://doi.org/10.3390/buildings12030322
Submission received: 31 December 2021 / Revised: 15 February 2022 / Accepted: 18 February 2022 / Published: 8 March 2022
(This article belongs to the Special Issue Sustainable Concrete Construction: Methods and Practices)

Abstract

:
Traffic noise and solid waste pollution are two major problems that restrict urban development and affect urban environments. In this study, a new kind of cement-based material for sound barriers was prepared using industrial waste fly ash cenosphere to explore the material ratio of the sound absorption, sound insulation, and composite layers and to optimize the material’s properties. The research findings showed that the compressive strength had significant effects on the material properties of the sound absorption layer, with the optimal compressive strength range being 0.2–0.4 MPa. At 0.4 MPa, the material with an aggregate-to-binder ratio of 1.0 had the best comprehensive properties. The sound insulation layer had the best compressive strength of 29.00 MPa at a 45% fiber admixture. The composite had the best sound insulation when the thickness ratio of the sound absorption and insulation layers was 60:40, and the sound transmission loss was 38 dB. The embodied carbon (EC) and embodied energy (EE) of the new fly ash cenosphere across the whole life cycle were 57.57 kgCO2e and 477.08 MJ, respectively, which were 4.8−52.9% and 53.2−82.3% lower than other traditional sound barriers, respectively. Thus, they were environmentally friendly and had satisfactory energy-saving and environmental protection values.

1. Introduction

With the rapid development of urbanization, the acoustic environment has been confronted with increasingly prominent quality problems and has thus attracted much attention [1,2]. In 2020, the competent authorities in Chinese cities received a total of 2.018 million complaints and reports on environmental noise, accounting for 41.2% of all of the reports on environmental pollution [3]. As an environmental pollutant, traffic noise has affected the living quality and lifestyle of nearby residents for a long time [4,5,6], and the parameters affecting its emission are many [7]. Aside from the engines and flow composition, the acoustic impedance [8,9], tire model [10], pavement aging [11], pavement texture [12,13], and mixture [14,15] are all important parameters. According to many years of practice across the world, scientifically designing and planning noise reduction facilities such as sound barriers has the most remarkable effect on noise reduction and absorption [16,17,18]. As such, the noise reduction of the “sound shadow area” can reach 5–15 dB, offering a flexible and controllable protection range, being easy to maintain [19,20,21].
A sound barrier is an installation placed between a noise source and a receiver. The noise reduction mechanism of a sound barrier is achieved mainly by cutting off the path of sound transmission [22]. Improving the sound absorption performance of a sound barrier and reducing the reflected sound can effectively reduce the negative effects of traffic noise on human settlements. There are also innovative noise barriers based on sonic crystals, which are designed to recycle materials and be more appreciated by residents [23,24,25]. At present, the commonly used sound barriers are composed of cement, metal composites, acrylic, and wood [26]; however, they generally have no effect on sound absorption. Road noise barriers installed on the ground can be made of reinforced concrete slabs, which are commonly used in expressways [27,28]. This product is low in cost, but it is heavy, and the material’s edge is likely to be damaged during transportation. For rail transit, metal composite sound barriers are usually used [29], in which light fiber sound absorption materials such as glass wool are usually used to fill in the metal plates. However, such materials have some defects, such as a poor dustproof effect and poor weather resistance. In addition, acrylic sound barriers are expensive, while wooden sound barriers have poor durability and low corrosion resistance. Therefore, it is of significance for traffic noise reduction to research and prepare sound barriers with good acoustic properties.
Concrete is a kind of building material with various functions, a long lifespan, and a low price. Ordinary concrete has good sound insulation properties, owing to its high density, but its sound absorption capacity is limited [30]. Previous research has shown that the open pore ratio of concrete can be effectively increased through physical pores or lightweight aggregates such as cenosphere [31], recycled plastic [32], and crumb rubber [33] to improve the sound absorption effect of cement-based materials [34,35,36]. The open pores and the outer surface of the material form a continuous channel. When sound is incident on the surface of the material, the sound energy is converted into heat energy, and the sound energy dissipation is realized [37,38]. In addition, some studies have shown that adding an appropriate amount of glass fiber into concrete can effectively reduce the micro-cracks in concrete materials and improve their crack resistance and toughness [39,40,41].
The lightweight aggregate selected in this work was fly ash cenosphere. Due to the notable demand for energy, thermal power plants in China are producing an enormous amount of coal fly ash every year. To avoid severe environmental pollution, fly ash should be treated and utilized properly. As an effective utilization approach, in the combustion process of fly ash, hollow glass spheres with a density less than water, namely fly ash cenosphere, can be extracted. Compared with other lightweight aggregates, fly ash cenosphere has several advantages, including high strength, stable chemical properties, and low thermal conductivity [42,43]. At present, fly ash cenosphere is widely used in the insulation of industrial equipment, but research on their acoustic properties is quite limited [43,44].
Therefore, under the challenge and objective of global carbon neutrality, this study aimed to develop a new type of cement-based composite material suitable for road sound barriers by utilizing industrial solid wastes such as fly ash cenosphere and waste glass fibers to further broaden the associated recycling methods and types of solid wastes and promote sustainable and greener development of the building material industry.

2. Materials and Method

2.1. Experimental Materials

The fly ash cenosphere adopted in this experiment were purchased from Henan Borun Casting Materials Co., Ltd., and the glass fiber came from Changzhou Beiyang Building Materials Co., Ltd., China. The cement was Baichuan P.W 52.5 high-strength white cement produced by Sichuan Zongsheng Special Cement Co., Ltd. The silica fume was produced by Chengdu Ludatong New Material Technology Co., Ltd., and the water-reducing agent used was the TS-8 polycarboxylic acid water-reducing agent.

2.2. Test Methods

2.2.1. Open Pore Ratio Test

In this study, the open pore ratio of the cement-based materials was tested by the water saturation method and calculated according to the Equation (1) [45,46] as follows:
P = W 2 W 1 V ρ w × 100 %
where P refers to the open pore ratio of the specimen (%), W 1 refers to the mass of the specimen under absolute dry conditions (g), W 2 refers to the mass of the specimen with a surface under absolute dry conditions (g), V refers to the volume of the specimen (cm3), and ρ w refers to the density of the water (g/cm3).

2.2.2. Compressive Strength Test

The compressive strength test of the fly ash cenosphere cement-based materials was carried out according to GB/T 50081-2019 Standard for Test Methods of Concrete Physical and Mechanical Properties. A 100 mm × 100 mm × 100 mm non-standard specimen was used for the compressive strength test.

2.2.3. Sound Absorption Property Test

Based on the standard ISO 10534-2:2001 [47], the sound absorption property of the materials was evaluated with an impedance tube testing system (B&K 4206-T) according to the transfer functions between microphones.

2.2.4. Sound Insulation Property Test

The sound transmission loss of the materials was measured by the B&K impedance tube testing system to evaluate the sound insulation property of said materials at a certain frequency. The sound transmission loss of the materials was calculated according to Equation (2):
T L = 10 lg 1 | T a | 2
where T L refers to the sound transmission loss (dB) and T a refers to the transmission coefficient.
In order to comprehensively evaluate the sound insulation property of the materials at various frequencies, the evaluation quantity for a single value of the sound insulation of fly ash cenosphere cement-based materials was determined based on the measurement of sound insulation at a 1/3 octave band according to the standard GB/T 50121 Evaluation Standard for Building Sound Insulation.

2.3. Preparation Process

The fly ash cenosphere cement-based sound barrier materials were composed of a sound absorption layer and a sound insulation layer. The preparation process is shown in Figure 1, and the details are as follows:
(1)
Preparation of the sound insulation layer: The cenosphere particles and the waste glass fiber were premixed for 30 s so as to mix them evenly. Then, approximately 50% water was added into the mixed aggregate and stirred for 30 s. Next, the weighed silica fume and cement were added, and stirring continued for 30 s evenly. The water-reducing agent and the remaining water were evenly stirred together and then added to the mixture and stirred for 90 s. Finally, the stirred mixture was poured into the test mold. The dimensions of the mechanical mold were 100 mm × 100 mm × 150 mm, and those of the acoustic specimen mold were φ99 mm × 150 mm and φ28.5 mm × 130 mm. Finally, the molds were pre-pressed by the press.
(2)
Preparation of the sound absorption layer: The cenosphere particles and approximately 50% test water were evenly premixed for 30 s. Then, the weighed cement was added into the aggregate and stirred for 30 s so that the cement could wrap around the cenosphere particles fully. Next, the water-reducing agent and the remaining water were stirred together evenly and then added into the mixture and continuously stirred for 60 s. Finally, the stirred stock was poured into the mold quickly and then pressed to form the two layers of materials.
(3)
Maintenance of the specimen: The mold was immediately wrapped after the specimen had been formed. Then, the mold was removed after maintenance for 24 h indoors, and water was sprayed on the specimen, which was then maintained to test the age. All tests in this study were repeated 3 times.

2.4. Design of the Fly Ash Cenosphere Cement-Based Property Test

2.4.1. Design of the Sound Absorption Layer Test

This study aimed to develop novel sound barrier materials with good acoustic characteristics on the basis of satisfying the basic mechanical requirements of road sound barriers. In the preliminary test, it was found that the water-to-binder ratio might have been high and that the bleeding of the specimen was serious. The mixing ratio was expressed in mass percentage wt%, and the mass of white cement was recorded to be 100 wt%. The basic ratio was determined as follows: water-to-binder ratio of 0.35, water-reducing agent dosage of 0.6 wt%, and specimen thickness of 50 mm. The sound absorption property of the concrete materials was largely determined by the pore structure in the concrete materials [48]. According to the raw material ratio and the formation process of fly ash cenosphere cement-based sound absorption materials studied here, the pore structure was mainly affected by the formation pressure, aggregate-to-binder ratio, and other factors. In this work, the effects of the formation pressure and aggregate-to-binder ratio on the apparent density, porosity, compressive strength, and sound absorption characteristics of the sound absorption layer materials were studied by a single-factor test. The test group number was formatted as “A formation pressure-thickness-aggregate-binder ratio”, and the specific test design is shown in Table 1.
Therefore, the basic ratio was determined as follows: water-to-binder ratio of 0.35, water-reducing agent dosage of 0.6 wt%, and specimen thickness of 50 mm.

2.4.2. Design of the Sound Insulation Layer

The sound insulation layer mainly guarantees the mechanical and sound insulation properties of sound barrier composite materials, and high-strength and compact materials are beneficial for meeting these requirements. Moreover, it has been found that the replacement of cement with 10% silica fume was beneficial for improving the compressive strength of concrete [49,50], and thus the mass sum of the white cement and silica fume was recorded to be 100 wt%, and the silica fume dosage was 10%. According to the preliminary test, the sound insulation layer had the best formation effects when the aggregate-to-binder ratio was 0.35, the water-to-binder ratio was 0.4, the water-reducing agent dosage was 0.8 wt%, and the pressure was 3 MPa. The method of a single-factor design was also adopted to study the effects of the fiber admixture on the acoustic and mechanical properties of the sound insulation layer materials and then to investigate the effects of the thickness on the acoustic properties of the sound insulation layer. The test group number was formatted as “I fiber admixture-thickness”, and the specific test design is shown in Table 2.

2.4.3. Design of the Composite Layer Test

In this section, the sound absorption and sound insulation layers are compounded together to study the comprehensive properties of the novel fly ash cenosphere cement-based composite materials. The preliminary experiment found that in the compression test, the failure of the specimen mainly occurred in the sound insulation layer. The middle part of the sound insulation layer was broken, whereas the sound absorption layer had no obvious damage. Although the overall strength of the composite was mainly contributed by the sound insulation layer, the difference in the properties of the two layers also affected the overall performance due to the weak interface formed by the connecting layer of the composite. Additionally, since the thickness had a significant impact on the properties of the sound absorption and sound insulation layers, a relatively good material group of the sound absorption and sound insulation layers was selected to study the effects of different thickness ratios (A:I) on the acoustic and mechanical properties of the specimen.

2.5. Environmental Impact Assessment

To evaluate the impact of materials on the environment, it is necessary to take into account the impact of each stage of the material’s life. This generally refers to the impact of a product’s interaction with the environment from the beginning of the production of raw materials until the product is scrapped or recycled. In this part, the environmental impact assessment of the sound barrier materials is conducted based on material sustainability indicators (MSIs) [51]. The carbon emission data in the process of raw material procurement, processing, and manufacturing were taken into account. The data were mainly based on the statistical database of the UK‘s Inventory of Carbon and Energy (ICE) [52,53]. The ICE database provides embodied carbon and energy factors for more than 200 common building materials, such as aggregates, aluminum, cement, and glass and is widely used all over the world [54]. It can meet the needs of building life cycle assessment and carbon emission research for other materials. The embodied energy calculation model of the materials was mainly based on Equation (3) (taking cement as an example):
E = ( 1 + M ) ( C x C + S x S + A x A + W x W + R x R + P x P + O + T )
where M refers to the waste rate of materials, C , S , A , W , R , and P refer to the mix proportions of cement, sand, aggregate, water, other cementitious materials, and additives, respectively, O refers to the energy required for operating equipment in the preparation of specimens, and T refers to the energy required for transporting materials and cement products. The parameters x C , x S , x A , x W , x R , and x P refer to the embodied energy of the materials per unit mass. Similarly, the contained energy and calculation methods of the materials were the same. Only the contained energy of the materials per unit mass was changed to the contained carbon per unit mass for calculation, and the unit was kgCO2e/kg.

3. Results and Discussions

3.1. Properties of the Sound Absorption Layer

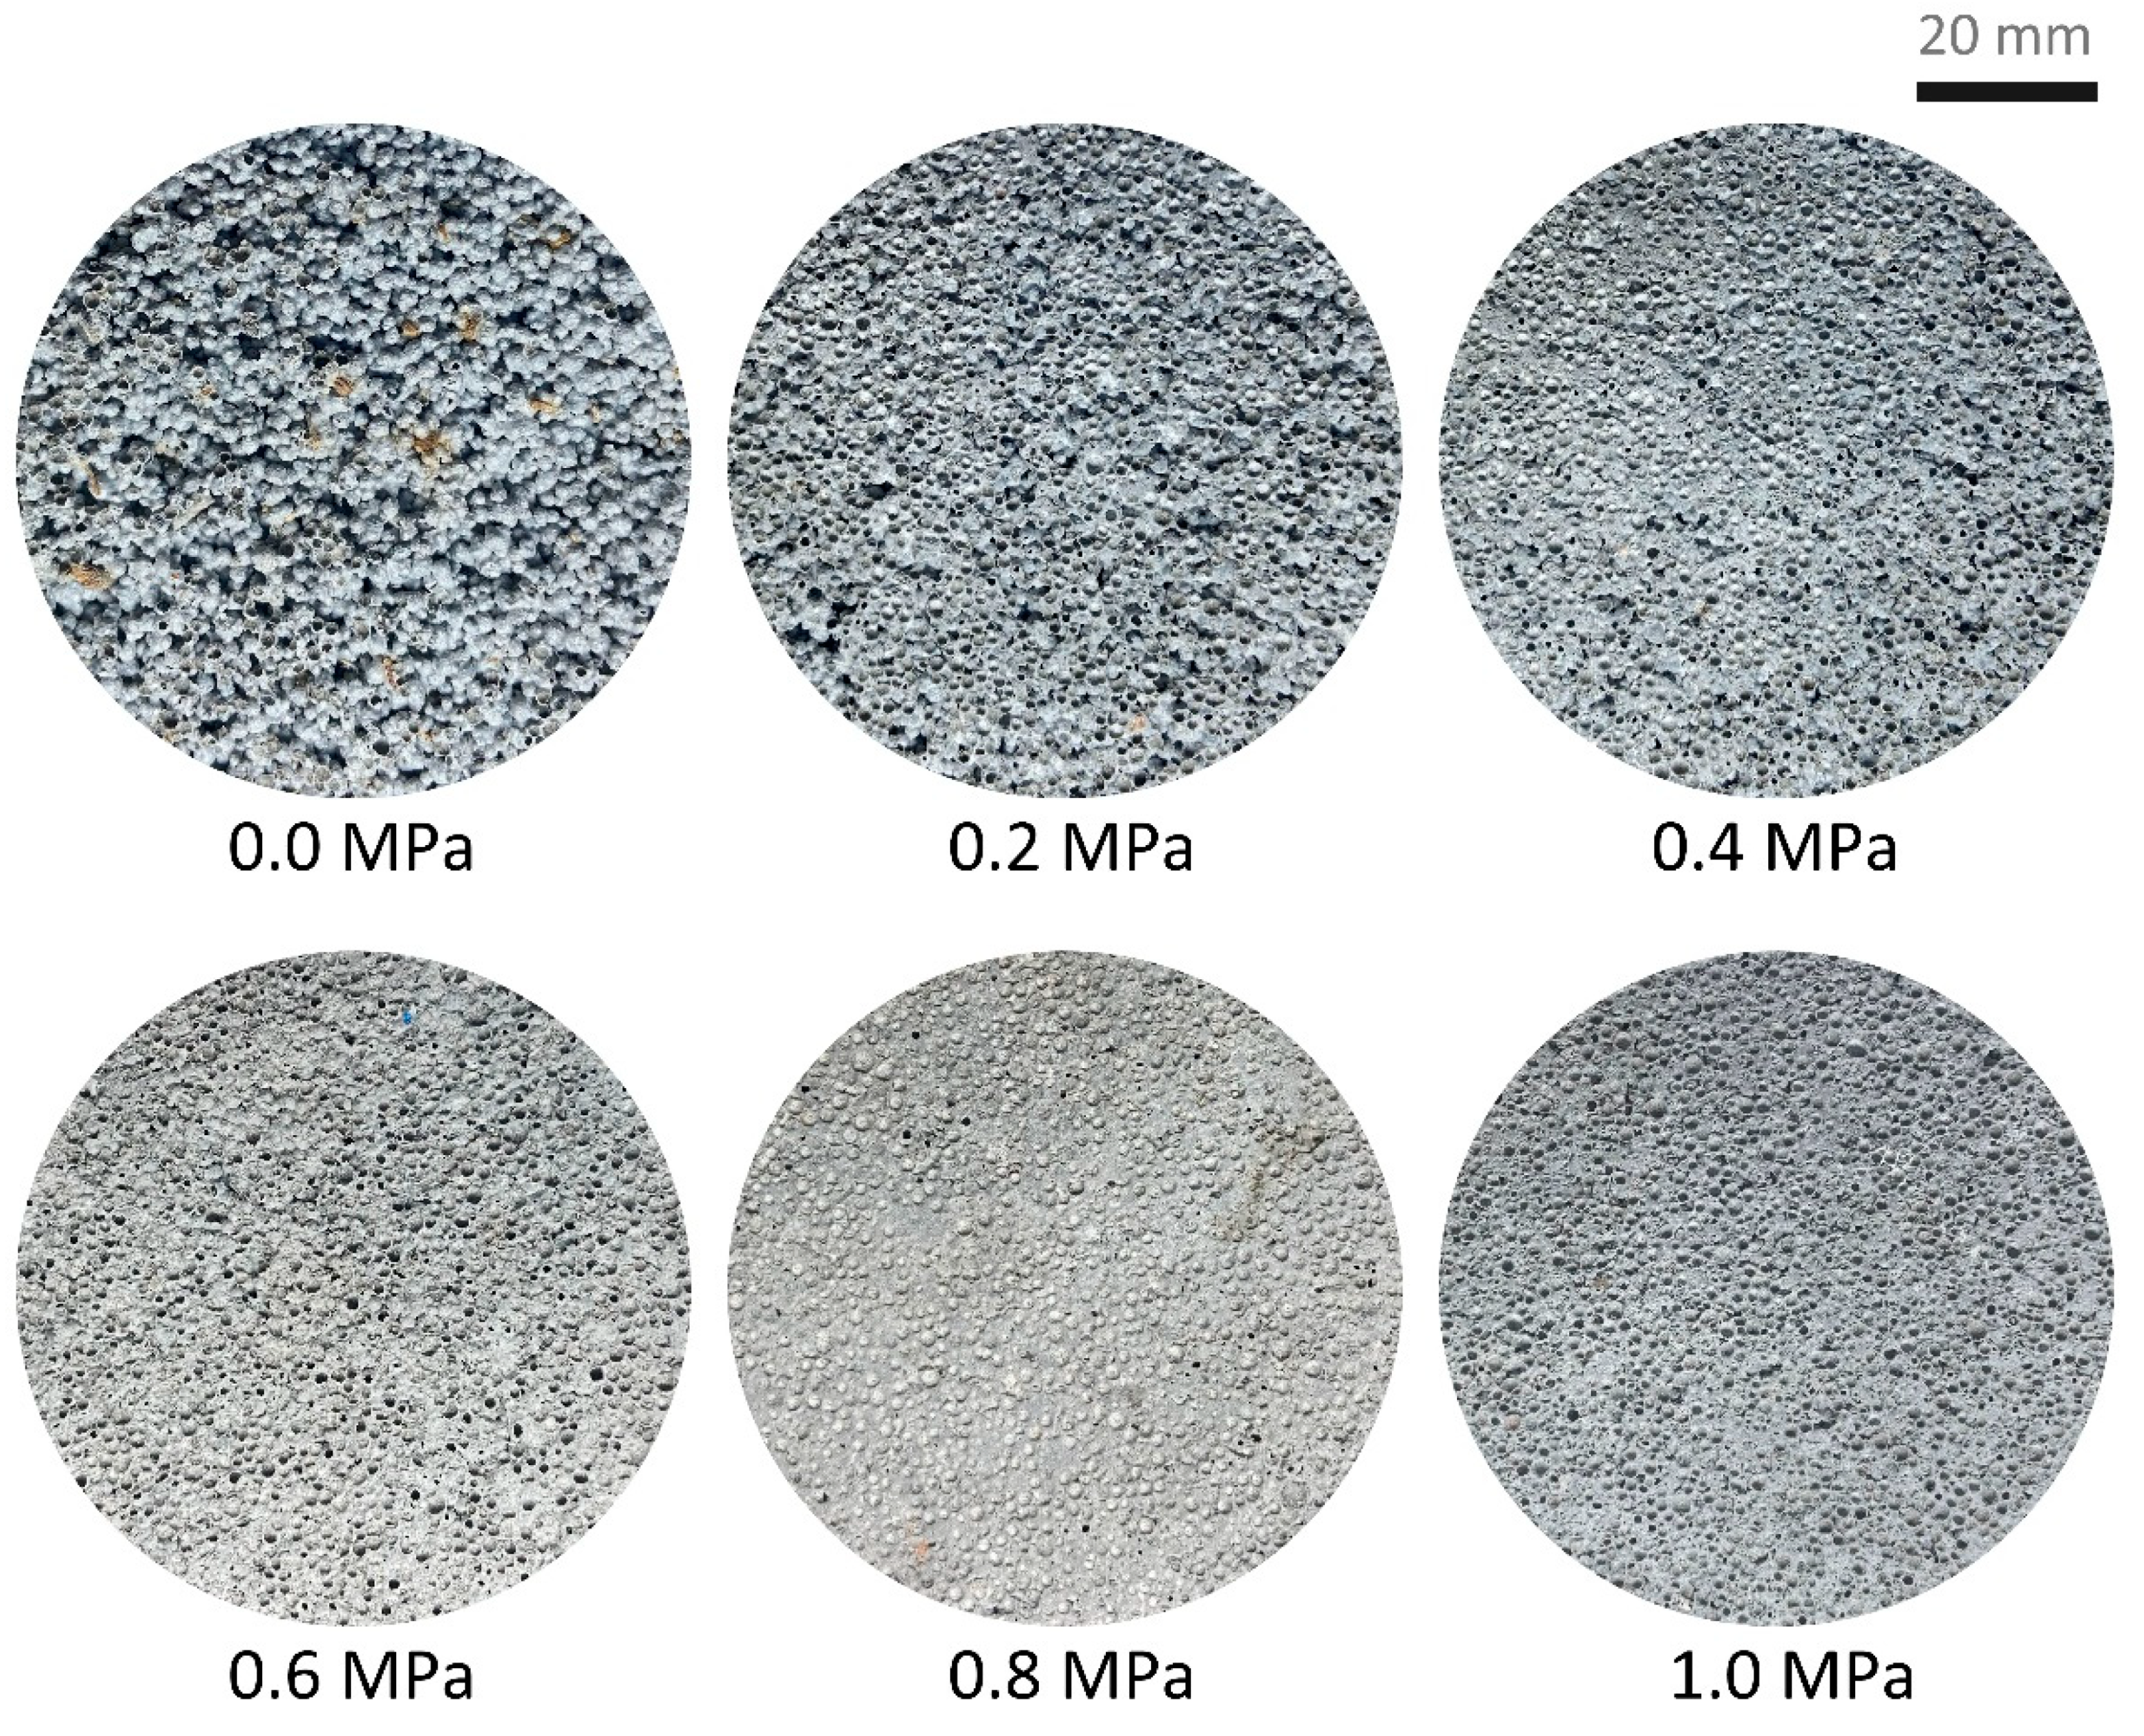
3.1.1. Effect of the Formation Pressure on the Properties of the Sound Absorption Layer

Cenosphere particles are light, the strength of materials formed only via natural formation is very low, and the formation effect is poor, so it is very important to exert certain pressure in the formation process of sound absorption layer materials. However, if the pressure is too high, the pore structures of fly ash cenosphere cement-based porous materials will be destroyed, thus reducing the sound absorption properties. Therefore, for the novel composite materials studied here, it was of importance to choose a proper formation pressure.
As illustrated in Figure 2, when the specimen had not been pressed for formation, the material particles were loose and unevenly filled, and the formation effect was poor. As the pressure increased, the fly ash cenosphere also piled up more densely. When the formation pressure reached 0.2 and 0.4 MPa, the pore distribution of the specimen was uniform. However, when the formation pressure rose to 0.6 MPa or above, it can be seen from the surface of the specimen that some pores were already filled with cement cementitious materials.
As provided in Table 3, with the increase in pressure, the material density also increased. When the pressure was 1.0 MPa, the material density reached the maximum of 1057.68 kg/m3. From the change rate of the material density, with the increase in pressure, the change first increased and then decreased. Contrary to the change rules of the apparent density of the materials, the open pore ratio of the materials declined with the increase in pressure. When the pressure was 0.0–0.6 MPa, the porosity change rates were 5.32%, 16.40%, and 17.36%. However, when the pressure was 0.6–0.8 MPa, the open pore ratio of the materials suddenly dropped. When the pressure exceeded 0.6 MPa, the hollow spherical aggregates were crushed, and the pores between the materials due to the accumulation of aggregate almost disappeared. When the pressure exceeded 0.8 MPa, the open pore ratio of the materials remained almost unchanged because the materials had been completely compacted.
The compressive strength is an important indicator of sound barriers. As a new composite material studied in this work, although the sound insulation layer provided the main mechanical strength, the material was still easy to break if the material strengths of the sound absorption layer and the sound insulation layer were too different, so the compressive strength of the sound absorption layer was also very important. The compressive strength of the materials increased with the increase in pressure during formation, and the growth rate first increased and then decreased, with the maximum being 11.88 MPa. However, when the pressure exceeded 0.8 MPa, the compressive strength of the materials decreased.
The arithmetic averages of the sound absorption coefficient of the center frequency (125, 250, 500, 1000, 2000, and 4000 Hz) were used to express the average sound absorption coefficient of a certain material, while the noise reduction coefficient refers to the average value of the sound absorption coefficient (measured at 250, 500, 1000, and 2000 Hz). The maximum noise reduction coefficient (NRC) of the sound absorption materials in this test group was 0.40. The NRC did not change obviously when the pressure of the materials increased from 0 to 0.2 MPa. Subsequently, with the increase in pressure, the sound absorption ability of the materials became worse. When the pressure exceeded 0.8 MPa, the materials basically had no sound absorption properties. Figure 3 shows the sound absorption coefficient α of the specimens in each group at 100–4000 Hz. It can be seen that when the formation pressure was 0 and 0.2 MPa, the sound absorption coefficient curve had two obvious peaks. When the pressure was 0 MPa, the absorption coefficient of the specimen at 1000 Hz was able to reach 0.97, and when the pressure was 0.2 MPa, the absorption coefficient reached 0.90 at 800 Hz, which was consistent with the sound absorption characteristics of other porous materials formed by aggregate accumulation.
Since the sound absorption layer should give priority to the sound absorption performance of the material, the mechanical performance was slightly worse when the pressure strength was 0.2 MPa, but its sound absorption coefficient was higher. When the pressure strength was 0.4 MPa, the noise reduction coefficient was lower than the previous group at 0.10, but its mechanical properties increased by 78.40%. In summary, when the pressure was 0.2–0.4 MPa, the comprehensive property of the fly ash cenosphere cement-based sound absorption materials was the best.

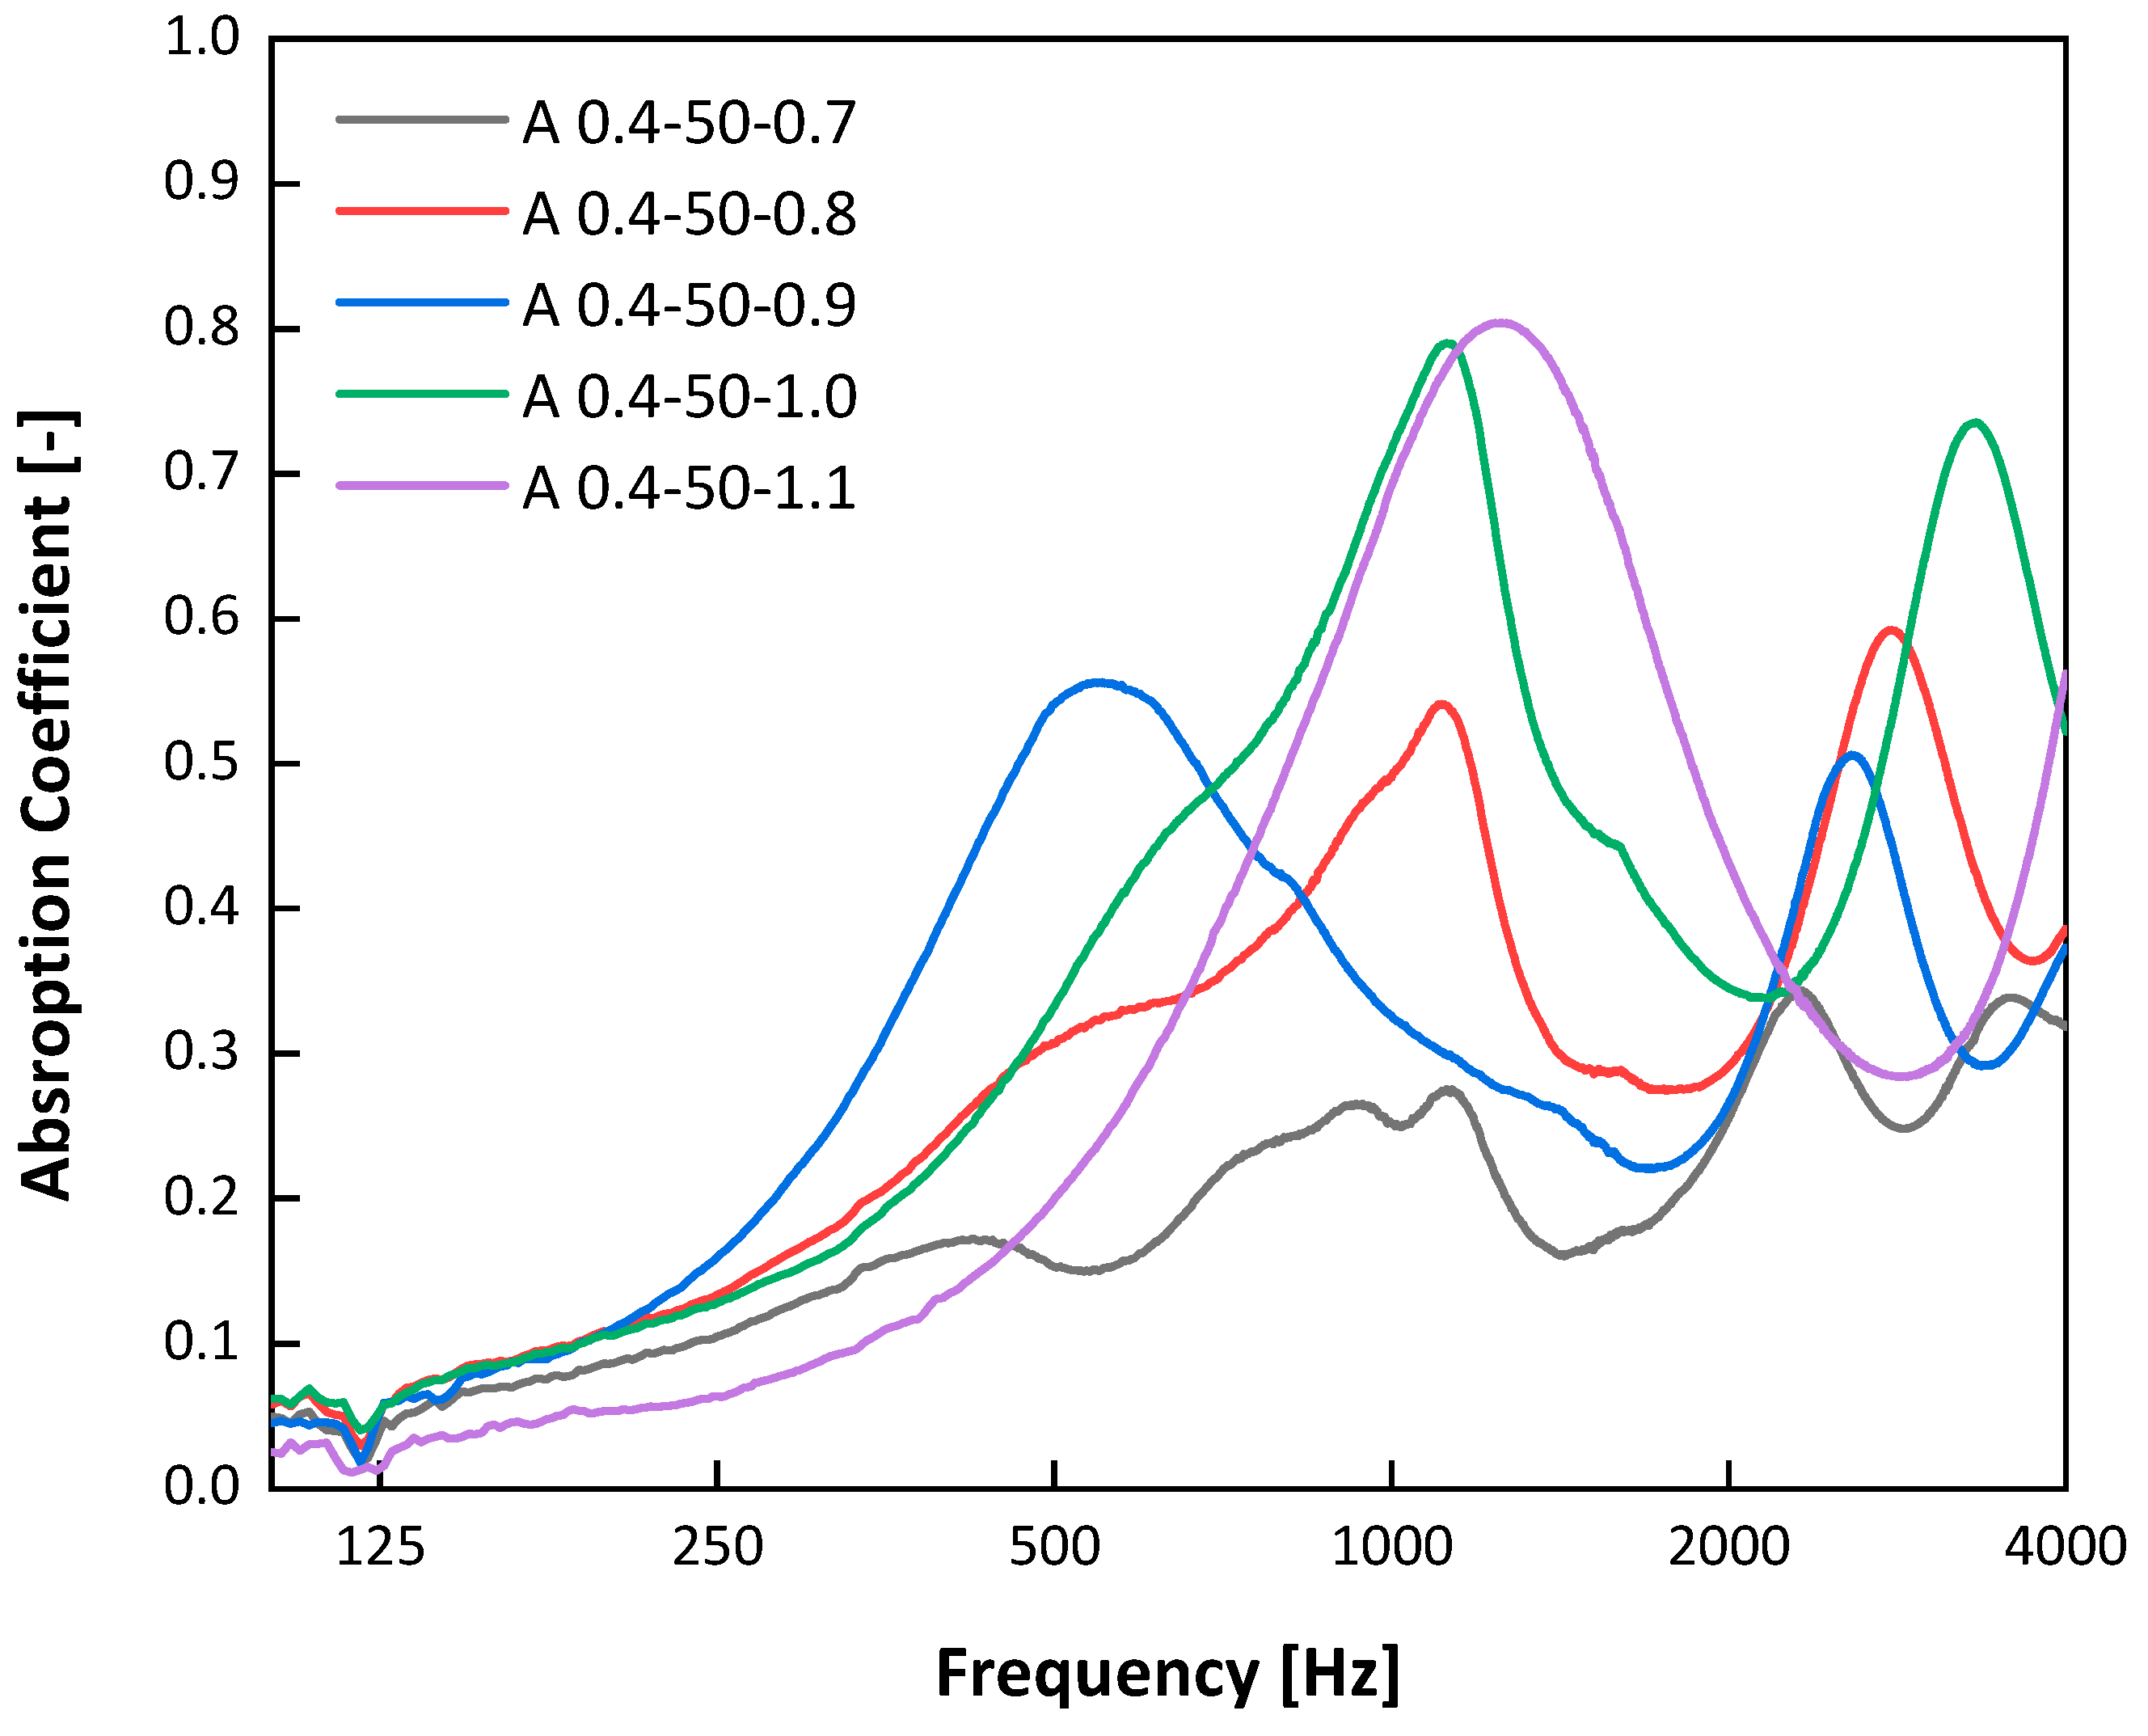
3.1.2. Effects of the Aggregate-to-Binder Ratio on the Properties of the Sound Absorption Layer

Following the test results given above, the specimens with different ratios of aggregate to cement were tested at a pressure of 0.2 and 0.4 MPa. Table 4 and Table 5 show the property changes in the sound absorption layer materials under different ratios of aggregate to cement at 0.2 MPa and 0.4 MPa.
As demonstrated in Table 4 and Table 5, with the increase in the aggregate-to-binder ratio, the apparent density decreased, but the open pore ratio increased. With the increase in the aggregate-to-binder ratio, the noise reduction coefficient of the specimens, except for the specimen with a pressure of 0.2 and an aggregate-to-binder ratio of 1.0, increased, and the compressive strength weakened. With the increase in the aggregate-to-binder ratio, the cement slurry coated on the aggregate surface evenly decreased, so the bonding strength between the aggregates weakened, and the compressive strength of the materials dropped. When the aggregate-to-binder ratio was 1.0, the abnormal situation was probably caused by excessive pressure during material formation, thus reducing the porosity between the materials and decreasing the noise reduction coefficient.
Figure 4 shows the sound absorption coefficient α of the specimens in each group under different ratios of aggregate to cement at 100–4000 Hz and at a pressure of 0.2 MPa. The absorption coefficient curve of the specimens with different ratios of aggregate to cement demonstrated typical characteristics of aggregate accumulation, with two to three sound absorption peaks. When the pressure was 0.2 MPa, the absorption coefficient of each group of specimens increased with the increase in the aggregate-to-binder ratio. Moreover, when the aggregate-to-binder ratio increased, the highest peak value of the sound absorption coefficient curve of the specimens gradually moved from an intermediate frequency to a high frequency. However, when the aggregate-to-binder ratio exceeded 0.9, the highest peak value of the absorption coefficient was in the range of 800–1250 Hz. These results were consistent with the analysis of the pressure test group. As the priority was given to their sound absorption performance, at 0.2 MPa, the comprehensive property of the specimens was stronger when the aggregate-to-binder ratio was 0.9.
At 0.4 MPa, it can be seen from Figure 5 that the change rule of the sound absorption coefficient curve was basically the same when the aggregate-to-binder ratio was 0.8, 1.0, and 1.1, with the first peak at 1000 Hz and another peak at around 3150 Hz. When the aggregate-to-binder ratio was 0.7 at 0.4 MPa, the sound absorption spectrum characteristic curve of the specimen did not conform to the characteristics of the aggregate stacking materials, and the highest absorption coefficient at a single frequency was only 0.32.
In addition, it can be seen from the change rule of the specimens with varied ratios of aggregate to cement under two formation pressures that the pore structure between materials had a certain restoring ability at 0.2 MPa, which led to the unstable property of the materials after formation. Therefore, from the point of view of material quality stability, it is more appropriate to keep the compressive strength of the materials during formation at 0.4 MPa.

3.2. Properties of the Sound Insulation Layer

3.2.1. Effects of the Fiber Admixture on the Properties of the Sound Insulation Layer

For the change in the apparent density of each group of specimens with different fiber admixtures, it can be seen from Table 6 that with the increase in the fiber admixture, the density of the specimens increased continuously but changed in a small range. The density of those specimens with 60% glass fiber was only 11.24% higher than that with 30% glass fiber. With the addition of glass fiber, the compressive strength of the sound insulation layer materials rose first and then fell. When the fiber admixture was 45%, the compressive strength of the materials reached its highest point (i.e., 29.00 MPa). The fiber had good water absorption. When the fiber admixture was less than 45%, the paste with the fiber, cement, and water had good fluidity. The fiber was able to fill the pores between the aggregates, and thus the strength of the materials continuously improved with the increase in the fiber admixture. However, when the fiber admixture exceeded 45%, most of the free water in the paste was absorbed by the fiber, and the remaining water was insufficient for resulting in a hydration reaction of the cement fully occurring. Furthermore, short glass fiber is also a fine aggregate. With the increase in the fiber admixture, the average cement paste coated on the surface of the fly ash cenosphere and short fiber decreased, resulting in a sharp drop in the concrete strength.
The single-number quantity is a single value rating that characterizes the sound insulation properties of building components. It can be seen from the test results that the fiber admixture had no obvious influence on the single-number quantity. In Figure 6, f0 refers to the frequency of first panel resonance, and fc refers to the critical frequency. It can be seen that the change rule of the sound transmission loss curves of specimens with different fiber admixtures was essentially the same. The above analysis shows that the fiber admixture had no obvious effect on the sound insulation property of the fly ash cenosphere cement-based materials, but there was an optimal value for the compressive strength. Namely, when the fiber admixture was 45%, the compressive strength of the specimen reached its highest point (i.e., 29.00 MPa).

3.2.2. Effects of the Specimen’s Thickness on the Properties of the Sound Insulation Layer

As suggested by the above results, the 45% ratio of fiber admixture was selected to further explore the effects of the thickness. Areal density is an important factor to determine the sound insulation properties of traditional dense and homogeneous materials, while the thickness of materials is a key factor to determine their areal density. Thus, thickness has an important influence on the sound insulation property of a material. Table 7 demonstrates the test results of the single-number quantities of sound insulation layers with different thicknesses. Within the thickness range of 30–70 mm, the single-number quantity of each specimen basically increased linearly with the thickness.
Figure 7 shows the sound transmission loss of the different specimens in the full frequency band. It can clearly be seen that, similar to the f0 of each specimen in the group of variable fibers, the frequency of first panel resonance of the group of variable thicknesses was also concentrated around 70 Hz. In addition, the sound insulation at the f0 of each specimen also rose continuously with the increase in the specimen’s thickness. Meanwhile, the fc of each specimen gradually moved in the high-frequency direction with the increase in the specimen’s thickness. The sound insulation property of the materials was mainly controlled by the stiffness of the materials, and the stiffness grew continuously with the increase in the material’s thickness.

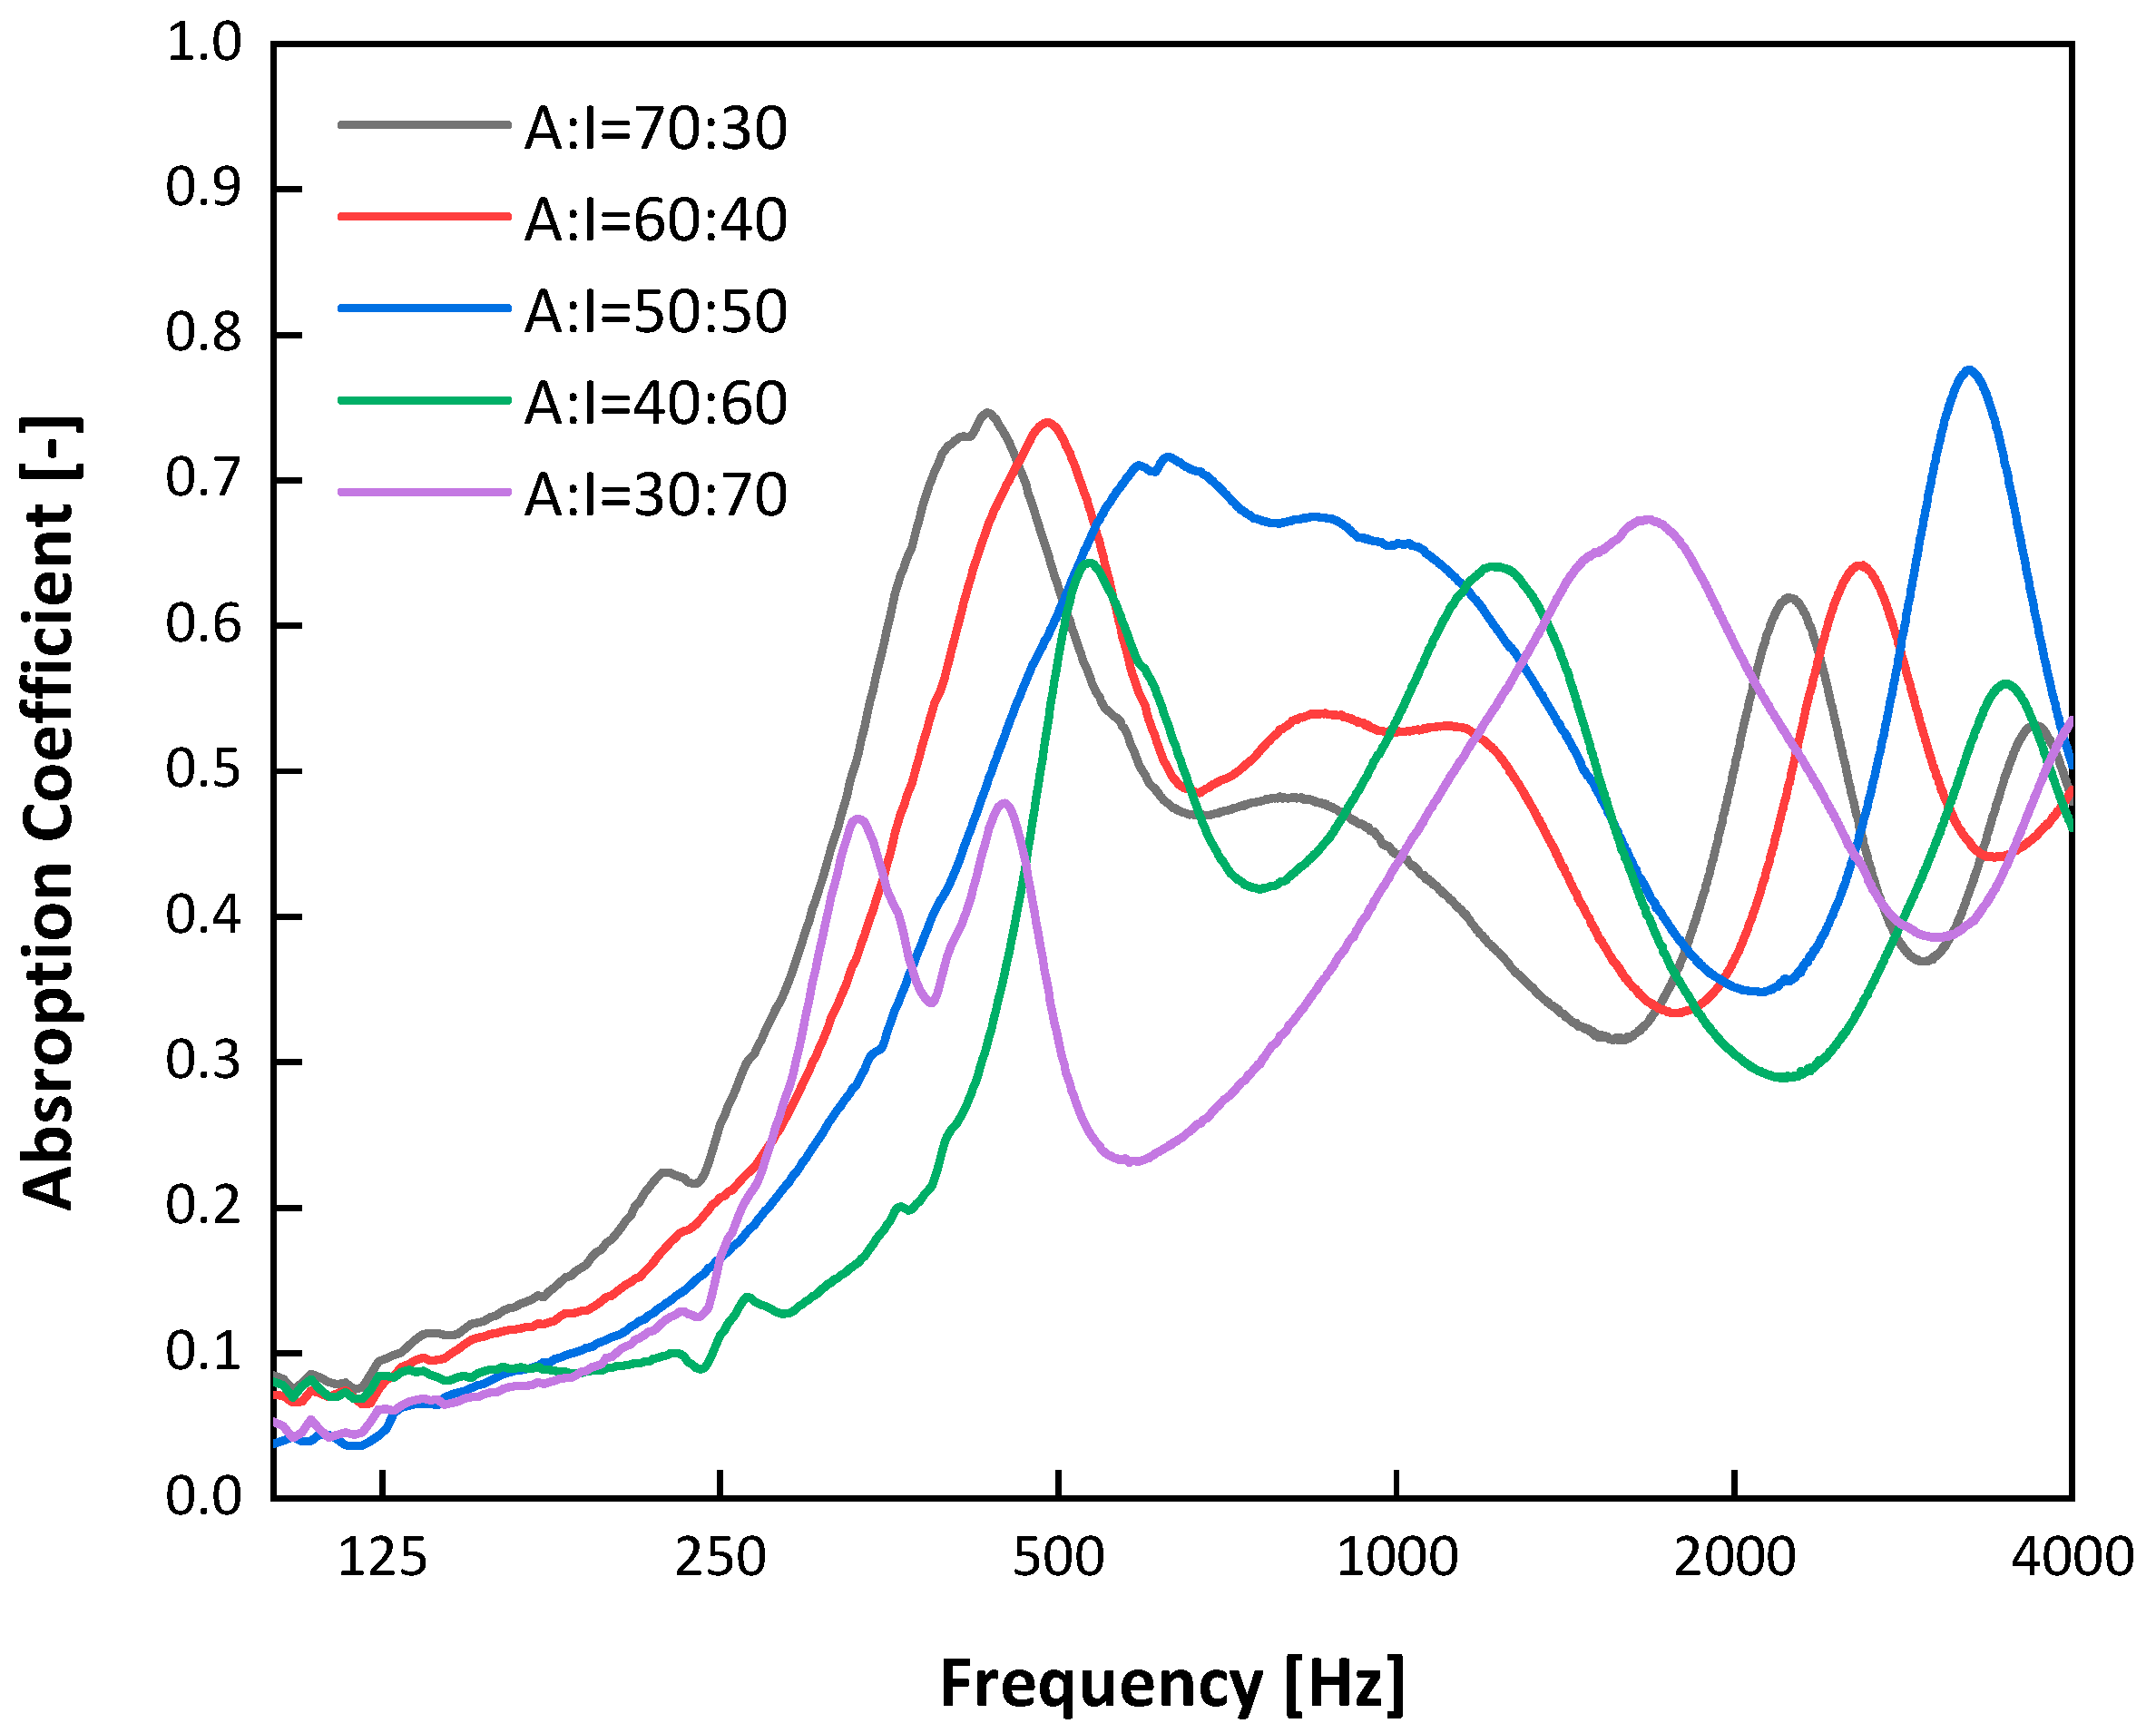
3.3. Properties of the Composite Layer

If the sound insulation layer is too thin, the overall mechanical property of the sound insulation material will be affected. Meanwhile, if the sound insulation layer is too thick, the overall density of the sound barrier plank will be too large. Considering the above sound absorption and insulation properties, the preparation process and size parameters of the specimens in groups “A 0.4-50-1.0” and “I 45-50” were selected in this section to investigate the effects of the thickness’s ratio of the sound absorption layer to the sound insulation layer (A:I) on the overall properties of the composite material. Five thickness ratios “A:I” of 70:30, 60:40, 50:50, 40:60, and 30:70 were chosen, and the total thickness of the specimens was 100 mm.
Table 8 shows the property indexes of the composite layer with different thickness ratios. With the increase in the thickness of the composite sound insulation layer, the compressive strength of the material was also strengthened. The compressive strength of the specimen with a thickness ratio of the sound absorption to the insulation layer of 30:70 was 1.79 times that of the 70:30 ratio. Regarding the sound absorption and insulation layers, the increase rate of the apparent density change rate of the specimens with different thickness ratios was consistent with the compressive strength, indicating that the apparent density of the materials affected their compressive strength. In addition, during the experiment of the composite specimens, there was no peeling between the sound absorption layer and the sound insulation layer. Nevertheless, the interface bonding of this composite material can be further investigated in the future through molding study of the complete sound barrier.
The sound absorption and insulation layers with different proportions had little effect on the noise reduction coefficient and average absorption coefficient of the materials. When the thickness of the sound absorption layer was 50–70 mm, the noise reduction coefficient of the composite was 0.45. When the material thickness dropped to 30–40 mm, the noise reduction coefficient of the composite material became 0.40.
However, it can be seen from Figure 8 that although the noise reduction and average absorption coefficients of the specimens with different sound absorption and insulation layer thickness ratios were not much different, the sound absorption coefficients remained quite different. The specimen groups “70:30,” “60:40,” and “50:50” had similar overall change trends for the sound absorption coefficient. This is consistent with the change rule of the single-factor study of the sound absorption layer. The absorption peak of the composite materials moved in the low-frequency direction with the increase in the thickness of the sound absorption layer. When the thickness of the sound insulation layer exceeded that of the sound absorption layer, the peak absorption coefficient of the composite material obviously dropped, and a low valley of the absorption coefficient appeared in the mid- and high-frequency ranges. Moreover, the frequency range of the low valley of the absorption coefficient became wider with the increase in the thickness of the sound insulation layer.
Figure 9 illustrates the sound insulation characteristic curve with different thickness ratios. The sound insulation property of the composite was not reinforced with the increase in the thickness of the sound insulation layer, but it was first strengthened and then weakened. No matter whether A:I = 70:30 or A:I = 30:70, the single-number quantity of both groups of specimens was 30 dB. However, the single-number quantity of the 60:40 specimen reached the highest level at 38 dB. Therefore, neither a thick sound absorption layer nor a thick sound insulation layer could improve the insulation properties of the composite significantly. The insulation properties of the composite were good only when the thickness of the sound absorption and insulation specimens were comparable.
Lightweight aggregate concrete, pervious concrete, and foamed concrete are all categorized as porous materials. Table 9 compares the different types of porous materials studied in recent years. It can be seen that the compressive strength of the fly ash cenosphere cement-based composite was 6.7−53.6% higher than the maximum values of the other porous materials. In terms of acoustic performance, the NRC of this new material was 11.1−44.4% higher than that of other materials. Moreover, the maximum absorption coefficient frequency range of the cenosphere composite material was around 500 Hz, which was consistent with the typical dominant frequency range of traffic noise around 250–1000 Hz, indicating an appropriate application prospect as a sound barrier.

3.4. Environmental Impact Assessment

Data on the energy and carbon content per unit mass of each raw material of the fly ash cenosphere cement-based composite sound barrier studied in this work are listed in Table 10. The white cement in this study was mainly portland cement with silica fume added as a type of industrial solid waste, and this type of cement mixed with silica fume had lower embodied energy and embodied carbon than traditional cement. The ICE database does not contain data on the energy and carbon content of the cement admixture, and the proportion of these materials is very small. Thus, they were ignored in this calculation. Because both the cenosphere and glass fiber in this study are solid waste materials for reuse, the corresponding energy and carbon contents of the materials should be subtracted when calculating the embodied energy and embodied carbon of the materials to evaluate the contribution of solid waste materials to environmental protection.
According to the analysis in the previous section, the sound barrier materials commonly used at present mainly include transparent sound barriers made of tempered glass, metal composite sound barriers made of metal panels and glass wool, ordinary concrete sound barriers, and wooden sound barriers. According to the ICE database [53], the data on the embodied energy and embodied carbon contents of each material are shown in Table 11.
According to this investigation, the modulus size of the sound barriers made of different materials on the market is mostly 2000 mm × 500 mm. Their thickness may be 80, 100, 120 mm, etc. (The size of transparent sound barriers depends on the size of the acrylic board or tempered glass.) Based on calculation and analysis, the energy and carbon contents of the new fly ash cenosphere cement-based sound barrier and other materials were evaluated by the unit plate. The mass of each component material of the unit plate and the total embodied energy and embodied carbon of each material were mainly considered. The thickness of the acrylic veneer of the transparent sound barrier was 6 mm, while that of the other sound barriers was 100 mm. Table 11 shows the density of the different materials and the proportion of each component material, as well as calculations of the embodied energy and embodied carbon of various types of sound barriers.
Table 12 provides a comparison of the embodied carbon (EC), embodied energy (EE), and mass of different sound barrier unit plates. The embodied carbon of the fly ash cenosphere cement-based composite sound barrier board was second-last in the whole life cycle from raw material production to product recycling. It was second only to the acrylic sound barrier. This was because the acrylic sound barrier unit plate had the lightest weight. The new fly ash cenosphere cement-based composite sound barrier in this study had the lowest embodied energy in the whole life cycle, far lower than that of the acrylic sound barrier. This benefitted from the use of a large amount of industrial solid wastes, such as cenosphere particles and waste glass fiber, which effectively reduced the embodied energy and embodied carbon required for raw material production, thus contributing to the good environmental benefits of the materials. For the metal composite sound barrier unit plate widely used at present, regardless of its low mass, it had poor environmental benefits due to the high carbon and energy contents of the galvanized steel plate, glass fiber, and metal aluminum frame in the whole life cycle.
Therefore, the embodied carbon (EC) and embodied energy (EE) of the new fly ash cenosphere cement-based sound barrier per unit plate in the whole life cycle were calculated to be 57.57 kgCO2e and 477.08 MJ. Compared with other traditional sound barriers, they were reduced by 4.8−52.9% and 53.2−82.3%, respectively. This new type of sound barrier demonstrated the relative advantages of energy saving and environmental protection, as a large amount of industrial solid wastes can be reused compared with other widely used sound barriers. A similar cenosphere study also found that the embodied energy of cement-based composites containing 30% cenosphere was significantly reduced [58]. In another study on foamed concrete [59], its embodied carbon was about 0.60–0.67 kgCO2e/kg and 29.5−44.6% higher than this cenosphere cement-based composite. Therefore, the reuse of fly ash cenosphere to develop environmentally friendly cement-based composite materials is an obvious advantage.

4. Conclusions

In this study, a new type of fly ash cenosphere cement-based composite was developed with industrial solid waste materials such as fly ash cenosphere and waste glass fiber to achieve the recycling of solid waste, with the key findings being the following:
(1)
The sound absorption layer obtained the best performance when the forming pressure was 0.4 MPa and the aggregate-to-binder ratio was 1.0, while the compressive strength of the sound insulation layer was as high as 29.0 MPa when the fiber content was 45%.
(2)
When the thickness ratio of the sound absorption and insulation layers was 60:40, the sound transmission loss of the composite reached the highest level of 38 dB.
(3)
The compressive strength of the composite material was 6.7−53.6% higher than that of other porous materials. Its NRC was up to 0.45, which was 11.1−44.4% higher than those of other materials.
(4)
The embodied carbon and embodied energy of the fly ash cenosphere cement-based composite sound barrier across the whole life cycle were 4.8−52.9% and 53.2−82.3% lower than the others, respectively, suggesting high values in energy saving and environmental protection.

Author Contributions

Conceptualization, H.X. and E.K.; methodology, H.X. and Y.L.; software, Y.L., X.G. and G.L.; validation, H.X., Y.L. and B.W.; formal analysis, H.X., Y.L. and E.K.; data curation, Y.L. and E.K.; writing—original draft preparation, H.X. and Y.L.; writing—review and editing, H.X., E.K. and B.W.; visualization, X.G. and G.L.; supervision, H.X. and E.K.; project administration, H.X. and B.W. All authors have read and agreed to the published version of the manuscript.

Funding

This research was funded by Science, Technology and Innovation Commission of Shenzhen Municipality grant number [JSGG20191129110221063].

Institutional Review Board Statement

Not applicable.

Informed Consent Statement

Not applicable.

Data Availability Statement

Data is contained within the article. Additional supporting data presented in this study are available on request from the corresponding author.

Conflicts of Interest

The authors declare no conflict of interest.

References

  1. Vianna, K.M.D.; Cardoso, M.R.A.; Rodrigues, R.M.C. Noise pollution and annoyance: An urban soundscapes study. Noise Health 2015, 17, 125–133. [Google Scholar] [CrossRef]
  2. Morano, P.; Tajani, F.; Di Liddo, F.; Daro, M. Economic Evaluation of the Indoor Environmental Quality of Buildings: The Noise Pollution Effects on Housing Prices in the City of Bari (Italy). Buildings 2021, 11, 213. [Google Scholar] [CrossRef]
  3. Ministry of Ecology and Environment of the People’s Republic of China. Annual Report on China Environmental Noise Pervention and Control; Ministry of Ecology and Environment of the People’s Republic of China: Bejing, China, 2021.
  4. Ndrepepa, A.; Twardella, D. Relationship between noise annoyance from road traffic noise and cardiovascular diseases: A meta-analysis. Noise Health 2011, 13, 251–259. [Google Scholar] [CrossRef] [PubMed]
  5. Beutel, M.E.; Brahler, E.; Ernst, M.; Klein, E.; Reiner, I.; Wiltink, J.; Michal, M.; Wild, P.S.; Schulz, A.; Munzel, T.; et al. Noise annoyance predicts symptoms of depression, anxiety and sleep disturbance 5 years later. Findings from the Gutenberg Health Study. Eur. J. Public Health 2020, 30, 516–521. [Google Scholar] [CrossRef] [PubMed]
  6. Ruiz-Padillo, A.; Ruiz, D.P.; Torija, A.J.; Ramos-Ridao, Á. Selection of suitable alternatives to reduce the environmental impact of road traffic noise using a fuzzy multi-criteria decision model. Environ. Impact Assess. Rev. 2016, 61, 8–18. [Google Scholar] [CrossRef] [Green Version]
  7. Sandberg, U.; Ejsmont, J.A. Tyre/Road Noise Reference Book; INFORMEX: Kisa, Sweden, 2002; ISBN 9789163126109; ISBN 9163126109. [Google Scholar]
  8. Bianco, F.; Fredianelli, L.; Lo Castro, F.; Gagliardi, P.; Fidecaro, F.; Licitra, G. Stabilization of a pu sensor mounted on a vehicle for measuring the acoustic impedance of road surfaces. Sensors 2020, 20, 1239. [Google Scholar] [CrossRef] [Green Version]
  9. Praticò, F.G.; Fedele, R.; Pellicano, G. Monitoring Road Acoustic and Mechanical Performance. In European Workshop on Structural Health Monitoring; Rizzo, P., Milazzo, A., Eds.; Springer: Cham, Switzerland, 2020; Volume 127, pp. 594–602. [Google Scholar]
  10. Licitra, G.; Teti, L.; Cerchiai, M.; Bianco, F. The influence of tyres on the use of the CPX method for evaluating the effectiveness of a noise mitigation action based on low-noise road surfaces. Transp. Res. Part D Transp. Environ. 2017, 55, 217–226. [Google Scholar] [CrossRef]
  11. Teti, L.; de León, G.; Del Pizzo, A.; Moro, A.; Bianco, F.; Fredianelli, L.; Licitra, G. Modelling the acoustic performance of newly laid low-noise pavements. Constr. Build. Mater. 2020, 247, 118509. [Google Scholar] [CrossRef]
  12. Del Pizzo, A.; Teti, L.; Moro, A.; Bianco, F.; Fredianelli, L.; Licitra, G. Influence of texture on tyre road noise spectra in rubberized pavements. Appl. Acoust. 2020, 159, 107080. [Google Scholar] [CrossRef]
  13. Praticò, F.G. On the dependence of acoustic performance on pavement characteristics. Transp. Res. Part D Transp. Environ. 2014, 29, 79–87. [Google Scholar] [CrossRef]
  14. Praticò, F.G.; Anfosso-Lédée, F. Trends and issues in mitigating traffic noise through quiet pavements. Procedia-Soc. Behav. Sci. 2012, 53, 203–212. [Google Scholar] [CrossRef]
  15. de León, G.; Del Pizzo, A.; Teti, L.; Moro, A.; Bianco, F.; Fredianelli, L.; Licitra, G. Evaluation of tyre/road noise and texture interaction on rubberised and conventional pavements using CPX and profiling measurements. Road Mater. Pavement Des. 2020, 21, S91–S102. [Google Scholar] [CrossRef] [Green Version]
  16. Ishizuka, T.; Fujiwara, K. Performance of noise barriers with various edge shapes and acoustical conditions. Appl. Acoust. 2004, 65, 125–141. [Google Scholar] [CrossRef]
  17. Keller, T.; Riebel, F.; Vallee, T. GFRP posts for railway noise barriers–Experimental validation of load-carrying performance and durability. Compos. Struct. 2008, 85, 116–125. [Google Scholar] [CrossRef]
  18. Li, K.M.; Law, M.K.; Kwok, M.P. Absorbent parallel noise barriers in urban environments. J. Sound Vibr. 2008, 315, 239–257. [Google Scholar] [CrossRef]
  19. Al Jumaily, H.M. The Effect of Design Efficiency of the Wall Barrier (Screen) On Traffic Noise Attenuation. IJISET 2016, 3, 242–259. [Google Scholar]
  20. Li, L.; Wang, Y.; Li, L.; Fan, X.; Li, H.; Fan, S.; Zou, Z.; Ma, C. Design and application of sound barrier for substation noise control. In Proceedings of the Journal of Physics: Conference Series, Kuala Lumpur, Malaysia, 12–13 June 2021; p. 012185. [Google Scholar]
  21. Fang, B.; Chen, L.C.; Xu, H.; Cai, J.; Li, D. Research on Urban Road Traffic Noise Control. IOP Conference Series: Earth and Environmental Science. In Proceedings of the 2020 4th International Conference on Traffic Engineering and Transportation System, Dalian, China, 21–23 August 2020; p. 012110. [Google Scholar]
  22. Cianfrini, C.; Corcione, M.; Fontana, L. Experimental verification of the acoustic performance of diffusive roadside noise barriers. Appl. Acoust. 2007, 68, 1357–1372. [Google Scholar] [CrossRef]
  23. Radosz, J. Acoustic performance of noise barrier based on sonic crystals with resonant elements. Appl. Acoust. 2019, 155, 492–499. [Google Scholar] [CrossRef]
  24. Peiró-Torres, M.d.P.; Redondo, J.; Bravo, J.; Pérez, J.S. Open noise barriers based on sonic crystals. Advances in noise control in transport infrastructures. Transp. Res. Procedia 2016, 18, 392–398. [Google Scholar] [CrossRef]
  25. Fredianelli, L.; Del Pizzo, A.; Licitra, G. Recent developments in sonic crystals as barriers for road traffic noise mitigation. Environments 2019, 6, 14. [Google Scholar] [CrossRef] [Green Version]
  26. Kotzen, B.; English, C. Environmental Noise Barriers: A Guide to Their Acoustic and Visual Design; CRC Press: Boca Raton, FL, USA, 2014. [Google Scholar]
  27. Heutschi, K.; Bühlmann, E.; Oertli, J. Options for reducing noise from roads and railway lines. Transp. Res. Part A Policy Pract. 2016, 94, 308–322. [Google Scholar] [CrossRef]
  28. Klingner, R.E.; McNerney, M.T.; Busch-Vishniac, I.J. Design Guide for Highway Noise Barriers; Research Report 0-1471-4; Center for Transportation Research, The University of Texas at Austin: Austin, TX, USA, 2003. [Google Scholar]
  29. Morgan, P.A.; Hothersall, D.C.; Chandler-Wilde, S.N. Influence of shape and absorbing surface—A numerical study of railway noise barriers. J. Sound Vibr. 1998, 217, 405–417. [Google Scholar] [CrossRef]
  30. Tie, T.S.; Mo, K.H.; Putra, A.; Loo, S.C.; Alengaram, U.J.; Ling, T.C. Sound absorption performance of modified concrete: A review. J. Build. Eng. 2020, 30, 10. [Google Scholar] [CrossRef]
  31. Tiwari, V.; Shukla, A.; Bose, A. Acoustic properties of cenosphere reinforced cement and asphalt concrete. Appl. Acoust. 2004, 65, 263–275. [Google Scholar] [CrossRef]
  32. Boucedra, A.; Bederina, M.; Ghernouti, Y. Study of the acoustical and thermo-mechanical properties of dune and river sand concretes containing recycled plastic aggregates. Constr. Build. Mater. 2020, 256, 11. [Google Scholar] [CrossRef]
  33. Holmes, N.; Browne, A.; Montague, C. Acoustic properties of concrete panels with crumb rubber as a fine aggregate replacement. Constr. Build. Mater. 2014, 73, 195–204. [Google Scholar] [CrossRef] [Green Version]
  34. Arenas, C.; Luna-Galiano, Y.; Leiva, C.; Vilches, L.F.; Arroyo, F.; Villegas, R.; Fernandez-Pereira, C. Development of a fly ash-based geopolymeric concrete with construction and demolition wastes as aggregates in acoustic barriers. Constr. Build. Mater. 2017, 134, 433–442. [Google Scholar] [CrossRef]
  35. Cavalline, T.L.; Gallegos, J.; Castrodale, R.W.; Freeman, C.; Liner, J.; Wall, J. Influence of Lightweight Aggregate Concrete Materials on Building Energy Performance. Buildings 2021, 11, 94. [Google Scholar] [CrossRef]
  36. Xie, H.; Liu, J.; Hou, S. Experimental Study on Sound Absorption Performance of Alkali Activated Slag Cement Foam Concrete. Bull. Chin. Ceram. Soc. 2017, 36, 2775–2780. [Google Scholar]
  37. Arenas, J.P.; Crocker, M.J. Recent Trends in Porous Sound-Absorbing Materials. Sound Vib. 2010, 44, 12–17. [Google Scholar]
  38. Siqueira, F.; Cosse, R.L.; Pinto, F.; Mareze, P.H.; Silva, C.F.E.; Nunes, L.C.C. Characterization of Buriti (Mauritia flexuosa) Foam for Thermal Insulation and Sound Absorption Applications in Buildings. Buildings 2021, 11, 292. [Google Scholar] [CrossRef]
  39. Jones, M.R.; McCarthy, A. Preliminary views on the potential of foamed concrete as a structural material. Mag. Concr. Res. 2005, 57, 21–31. [Google Scholar] [CrossRef]
  40. Zheng, D.; Song, W.; Fu, J.; Xue, G.; Li, J.; Cao, S. Research on mechanical characteristics, fractal dimension and internal structure of fiber reinforced concrete under uniaxial compression. Constr. Build. Mater. 2020, 258, 120351. [Google Scholar] [CrossRef]
  41. Lei, B.; Li, W.; Liu, H.; Tang, Z.; Tam, V.W. Synergistic effects of polypropylene and glass fiber on mechanical properties and durability of recycled aggregate concrete. Int. J. Concr. Struct. Mater. 2020, 14, 1–14. [Google Scholar] [CrossRef]
  42. Huang, X.Y.; Ranade, R.; Zhang, Q.; Ni, W.; Li, V.C. Mechanical and thermal properties of green lightweight engineered cementitious composites. Constr. Build. Mater. 2013, 48, 954–960. [Google Scholar] [CrossRef]
  43. Danish, A.; Mosaberpanah, M.A. Formation mechanism and applications of cenospheres: A review. J. Mater. Sci. 2020, 55, 4539–4557. [Google Scholar] [CrossRef]
  44. Agrawal, U.; Wanjari, S. Physiochemical and engineering characteristics of cenosphere and its application as a lightweight construction material-A review. Mater. Today Proc. 2017, 4, 9797–9802. [Google Scholar] [CrossRef]
  45. Montes, F.; Valavala, S.; Haselbach, L.M. A new test method for porosity measurements of Portland cement pervious concrete. J. ASTM Int. 2005, 2, 1–13. [Google Scholar]
  46. Hunce, S.Y.; Soyer, E.; Akgiray, O. Characterization of Granular Materials with Internal Pores for Hydraulic Calculations Involving Fixed and Fluidized Beds. Ind. Eng. Chem. Res. 2016, 55, 8636–8651. [Google Scholar] [CrossRef]
  47. ISO 10534-2; Acoustics-Determination of Sound Absorption Coefficient and Impedance in Impedance Tubes—Part 2: Transfer-Function Method. Available online: https://www.iso.org/standard/22851.html (accessed on 15 October 2021).
  48. Cao, L.T.; Fu, Q.X.; Si, Y.; Ding, B.; Yu, J.Y. Porous materials for sound absorption. Compos. Commun. 2018, 10, 25–35. [Google Scholar] [CrossRef]
  49. Ahmad, M.R.; Chen, B.; Shah, S.F.A. Investigate the influence of expanded clay aggregate and silica fume on the properties of lightweight concrete. Constr. Build. Mater. 2019, 220, 253–266. [Google Scholar] [CrossRef]
  50. Ghafari, E.; Ghahari, S.A.; Costa, H.; Julio, E.; Portugal, A.; Duraes, L. Effect of supplementary cementitious materials on autogenous shrinkage of ultra-high performance concrete. Constr. Build. Mater. 2016, 127, 43–48. [Google Scholar] [CrossRef]
  51. Keoleian, G.A.; Kendall, A.M.; Lepech, M.D.; Li, V.C. Guiding the design and application of new materials for enhancing sustainability performance: Framework and infrastructure application. In Proceedings of the Symposium on Life-Cycle Analysis Tools for Green Materials and Process Selection held at the 2005 MRS Fall Meeting, Boston, MA, USA, 28–30 November 2005; Volume 895. [Google Scholar]
  52. Jones, C.; Hammond, G. Embodied Carbon—The ICE Database. 2019. Available online: https://circularecology.com/embodied-carbon-footprint-database.html (accessed on 27 January 2022).
  53. Hammond, G.; Jones, C. Inventory of Carbon & Energy: ICE; Sustainable Energy Research Team, Department of Mechanical Engineering: Bath, UK, 2011. [Google Scholar]
  54. Mohebbi, G.; Bahadori-Jahromi, A.; Ferri, M.; Mylona, A. The role of embodied carbon databases in the accuracy of life cycle assessment (LCA) calculations for the embodied carbon of buildings. Sustainability 2021, 13, 7988. [Google Scholar] [CrossRef]
  55. Kim, H.-K.; Lee, H.-K. Influence of cement flow and aggregate type on the mechanical and acoustic characteristics of porous concrete. Appl. Acoust. 2010, 71, 607–615. [Google Scholar] [CrossRef]
  56. Mastali, M.; Kinnunen, P.; Isomoisio, H.; Karhu, M.; Illikainen, M. Mechanical and acoustic properties of fiber-reinforced alkali-activated slag foam concretes containing lightweight structural aggregates. Constr. Build. Mater. 2018, 187, 371–381. [Google Scholar] [CrossRef]
  57. Luna-Galiano, Y.; Leiva, C.; Arenas, C.; Fernández-Pereira, C. Fly ash based geopolymeric foams using silica fume as pore generation agent. Physical, mechanical and acoustic properties. J. Non-Cryst. Solids 2018, 500, 196–204. [Google Scholar] [CrossRef]
  58. Chen, W.H.; Qi, Z.F.; Zhang, L.; Huang, Z.Y. Effects of cenosphere on the mechanical properties of cement-based composites. Constr. Build. Mater. 2020, 261, 13. [Google Scholar] [CrossRef]
  59. Jones, M.R.; Ozlutas, K.; Zheng, L. High-volume, ultra-low-density fly ash foamed concrete. Mag. Concr. Res. 2017, 69, 1146–1156. [Google Scholar] [CrossRef] [Green Version]
Figure 1. Preparation process.
Buildings 12 00322 g001
Figure 2. Appearance of specimen after formation.
Buildings 12 00322 g002
Figure 3. Sound absorption properties under different levels of pressure.
Buildings 12 00322 g003
Figure 4. Sound absorption properties under different ratios of aggregate to cement at 0.2 MPa.
Buildings 12 00322 g004
Figure 5. Sound absorption properties under different ratios of aggregate to cement at 0.4 MPa.
Buildings 12 00322 g005
Figure 6. Sound insulation properties at different amounts of fiber admixture.
Buildings 12 00322 g006
Figure 7. Sound insulation properties at different thicknesses.
Buildings 12 00322 g007
Figure 8. Sound absorption properties of composite layer with different thickness ratios.
Buildings 12 00322 g008
Figure 9. Sound insulation properties of composite layer with different thickness ratios.
Buildings 12 00322 g009
Table 1. Design of sound absorption layer test.
Test GroupForming Pressure
(MPa)
Aggregate-to-Binder Ratio
(-)
A 0.0-50-0.90.00.9
A 0.2-50-0.90.2
A 0.4-50-0.90.4
A 0.6-50-0.90.6
A 0.8-50-0.90.8
A 1.0-50-0.91.0
A X1-50-0.7X10.7
A X1-50-0.80.8
A X1-50-1.01.0
A X1-50-1.11.1
Note: X1 is the optimum formation pressure determined by the test.
Table 2. Design of sound insulation layer test.
Test GroupFiber Admixture
(wt%)
Thickness
(mm)
I 30.0-5030.050
I 37.5-5037.5
I 45.0-5045.0
I 52.5-5052.5
I 60.0-5060.0
I X2-30X230
I X2-4040
I X2-6060
I X2-7070
Note: X2 is the optimum fiber content determined by the test.
Table 3. Sound absorption indicators under different levels of pressure.
Forming Pressure
(MPa)
Apparent Density
(kg/m3)
Open Pore Ratio
(%)
Compressive Strength
(MPa)
Average Sound
Absorption
Coefficient
(-)
Noise
Reduction
Coefficient
(-)
0.0698.8425.182.310.360.40
0.2768.4323.843.240.340.40
0.4884.7219.935.780.260.30
0.6983.8516.479.850.220.25
0.81042.8710.7011.880.200.20
1.01057.689.2911.290.170.20
Table 4. Property indicators of sound absorption layer under different ratios of aggregate to cement at 0.2 MPa.
Ratios of Aggregate
(-)
Apparent Density
(kg/m3)
Open Pore
Ratio
(%)
Compressive Strength
(MPa)
Average Sound
Absorption
Coefficient
(-)
Noise Reduction Coefficient
(-)
0.71068.9213.368.170.270.35
0.8894.4422.274.630.280.35
0.9768.4323.843.240.340.40
1.0765.3024.513.760.350.35
1.1683.5228.632.800.380.45
Table 5. Property indicators of sound absorption layer under different ratios of aggregate to cement at 0.4 MPa.
Ratios of
Aggregate
(-)
Apparent Density
(kg/m3)
Open Pore
Ratio
(%)
Compressive Strength
(MPa)
Average Sound
Absorption
Coefficient
(-)
Noise Reduction
Coefficient
(-)
0.71038.139.379.710.190.20
0.8941.9816.057.270.280.30
0.9884.7219.935.780.260.30
1.0825.6323.135.100.330.35
1.1807.3025.723.750.360.40
Table 6. Property indexes of sound insulation layer at different amounts of fiber admixture.
Glass Fiber Admixture
(wt%)
Apparent Density
(kg/m3)
Compressive Strength
(MPa)
Single-Number Quantity
(dB)
30.01396.6626.2022
37.51432.5127.2222
45.01450.5529.0023
52.51504.8223.2423
60.01553.6516.9523
Table 7. Property indexes of sound insulation layer at different thicknesses.
Thickness
(mm)
Single-Number Quantity
(dB)
3020
4021
5023
6024
7026
Table 8. Property indexes of composite layer with different thickness ratios (A:I).
Thickness Ratios
A:I
Apparent
Density
(kg/m3)
Compressive Strength
(MPa)
Average Sound
Absorption
Coefficient
(-)
Noise
Reduction
Coefficient
(-)
Single-Number Quantity
(dB)
70:301103.2611.370.400.4530
60:401158.6613.460.400.4538
50:501202.8715.210.390.4535
40:601301.6919.210.350.4035
30:701340.4620.300.350.4030
Table 9. Comparison of acoustic and mechanical properties of porous materials.
MaterialsAcoustic PropertiesCompressive Strength
Concrete with fly ash cenosphereThe maximum sound absorption coefficient frequency range: around 500 Hz
The average sound absorption coefficient: 0.35–0.40
NRC: 0.40–0.45
11.37–20.30 MPa
With A:I = 60:40 (optimal ratio), the compressive strength can reach 19.21 MPa
Porous concrete with expanded shale [55]The maximum sound absorption coefficient frequency range: 500–900 Hz1.45–15.02 MPa
Dune and river sand concretes containing recycled plastic aggregates [32]NRC: 0.30–0.4016.00–18.00 MPa
Fiber-reinforced alkali-activated slag foam concretes [56]The maximum sound absorption coefficient frequency range: 1600–2500 Hz
The average sound absorption coefficient: 0.50 in the medium-to-high frequency regions
2.50–13.00 MPa
Porous geopolymeric foam using silica fume as the pore generation agent [57]NRC: 0.10–0.252.00–12.50 MPa
Table 10. List of embodied energy and embodied carbon contents of raw materials for fly ash cenosphere cement-based sound barriers in the ICE database.
MaterialEE
(MJ/kg)
EC
(kgCO2e/kg)
Notes
Cement5.500.912Reference to ordinary portland cement
Fly ash cenosphere0.100.008Reference to fly ash
Glass fiber28.001.53-
Water-reducing agent--No relevant data
Table 11. Embodied energy and embodied carbon content of other sound barrier materials.
MaterialEE
(MJ/kg)
EC
(kgCO2e/kg)
Notes
Galvanized steel22.603.03Reference to electrogalvanized steel
Aluminum plate155.006.67Reference to general aluminum
Acrylic board90.67-No relevant data
Tempered glass23.501.67Reference to toughened glass
Mineral wool16.601.20-
Wood16.000.815Reference to hardboard
Concrete0.820.115Reference to ordinary concrete, cement:sand:aggregate = 1:2:4
Table 12. Embodied energy and embodied carbon of sound barriers per unit plate made of different materials.
Sound Barrier TypeMain MaterialMass
(kg)
Proportion of Materials
(%)
EE
(MJ/kg)
EC
(kgCO2e/kg)
Energy
Consumption
(MJ)
Carbon
Emissions
(kgCO2e)
Fly ash cenosphere cement-based composite sound barrier boardCement12053.545.500.912477.0857.57
Fly ash cenosphere30.520.100.008
Glass fiber15.9328.001.53
Metal frame4.275100155.006.67
Acrylic sound barrier1-mm aluminum frame3.335-155.006.672693.0122.24
6-mm acrylic broad24-90.67-
Metal composite sound barrier board0.8-mm galvanized steel12.56-22.603.031842.48115.53
Glass wool32-28.001.53
1-mm aluminum frame4.275-155.006.67
Wooden sound barrierWood150-16.000.8152400.00122.25
Concrete sound barrier (with cavity)Concrete150-0.820.1151019.0060.45
Glass fiber32-28.001.35
Publisher’s Note: MDPI stays neutral with regard to jurisdictional claims in published maps and institutional affiliations.

