1. Introduction
Currently, considering the wide availability of powerful computational tools and software, it is possible to use more complex models (e.g., the beam-column element models or solid element models) to perform analyses for obtaining the structural seismic responses. However, if providing structural responses only at the “story” level is the target, the use of simplified modeling assumptions such as the shear-building concept is necessary and convenience in these cases. Shear-building models are widely used to study the seismic response of multi-story buildings because of their simplicity and low computational cost [
1]; especially, it facilitates performing comprehensive statistical analyses and parametric studies. Alongside the seismic response analyses on ordinary multi-story buildings, the idealizations of actual buildings to the shear-building model have been used in many research aspects, e.g., soil-structure-interaction analysis [
2,
3,
4], pounding analysis [
5], health monitoring and system identification [
6,
7,
8,
9,
10], damper placements [
11], isolated buildings [
12,
13], structural optimum design [
14,
15,
16,
17], pushover analysis [
18,
19], and city earthquake response analysis [
20,
21,
22,
23], etc. This type of model is also the basis of methods or regulations in some seismic design codes, e.g., the derivation of the vertical distribution of seismic forces for low and middle-height buildings [
24,
25,
26], design requirements for nonbuilding structures [
24], calculation models of isolated buildings [
25], modification factors in nonlinear static procedure [
27], etc.
The problems are as follows. (1) When the seismic response analysis is performed, how accurate are the results obtained by using shear-building models? Additionally, (2) if a structure is designed according to the regulations derived based on shear-building models, how does the capacity curve of the actual building need to be. The above problems are relevant to the idealization method of the shear-building model and its accuracy, which are the objective of this study. The main objective of this research is to investigate the accuracies of five different idealization methods and provide some advice on selection of proper idealization method for the shear-building model in dynamic time analysis.
2. Review of Idealization Methods of Shear-Building Models
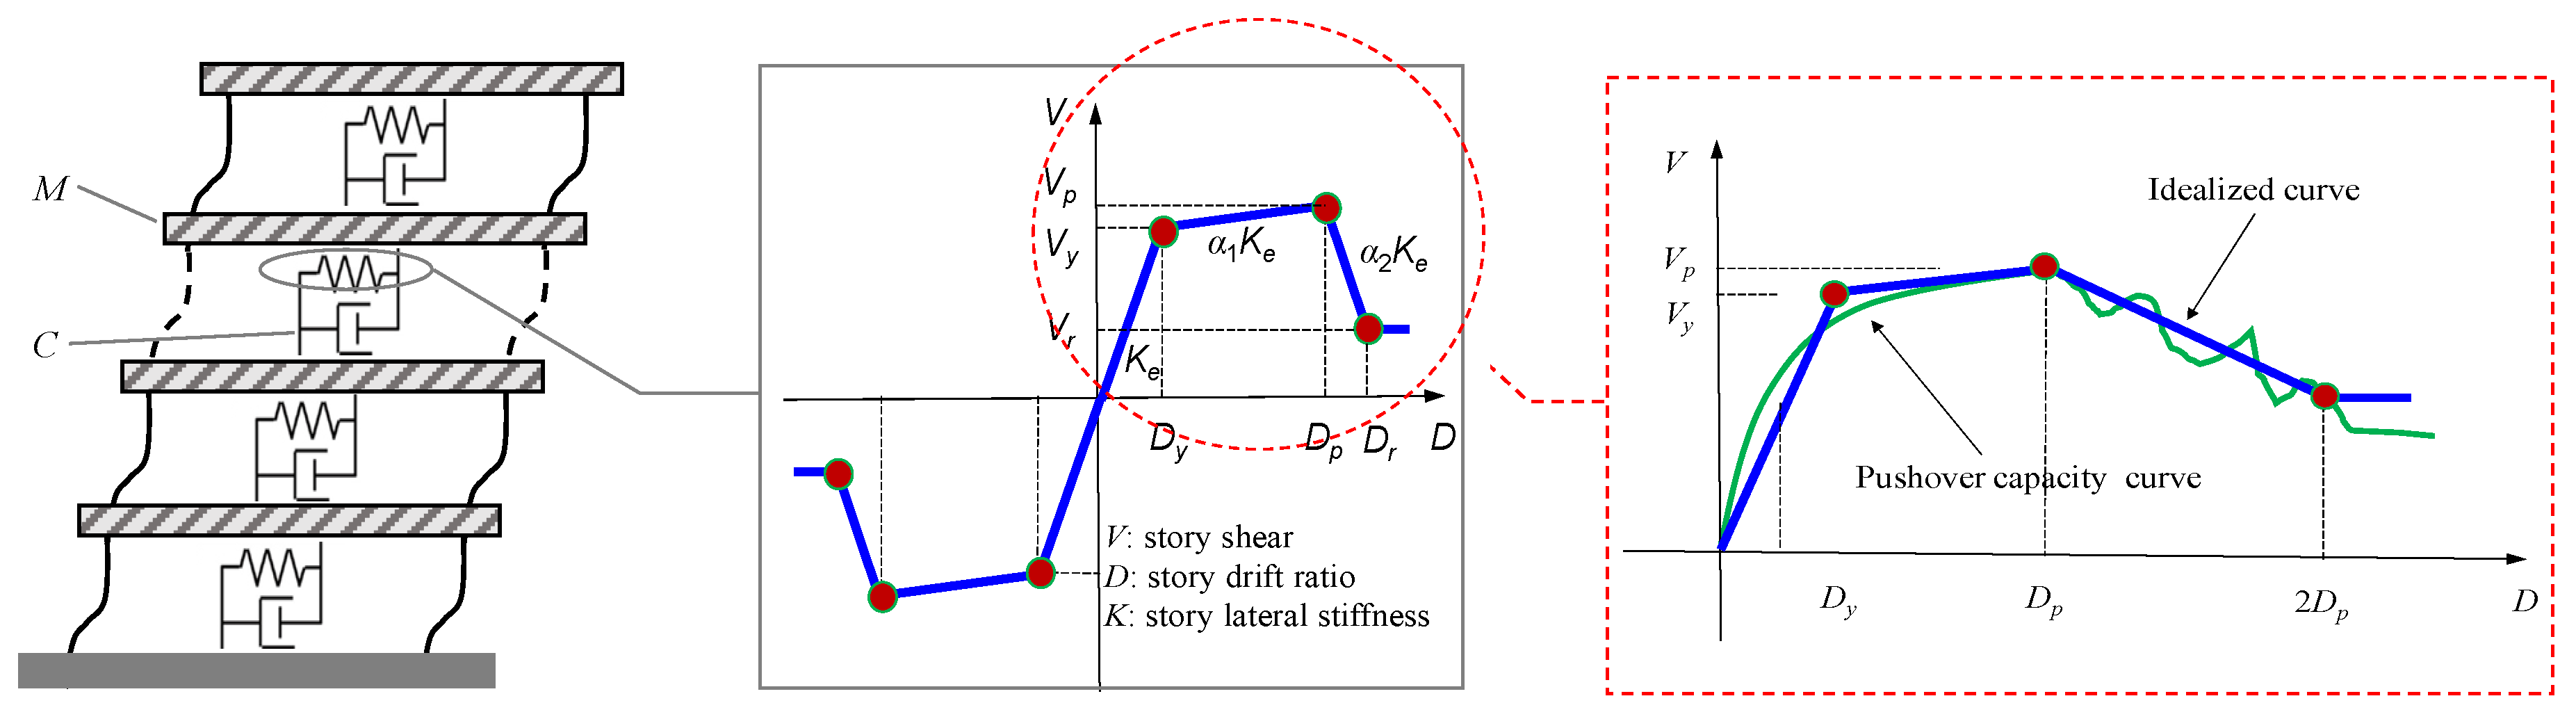
In shear-building models, floor slabs are modeled as lumped masses and columns are modeled as elastic–plastic springs that only exhibit deformations in horizontal direction when subjected to lateral forces. The story lumped mass at the floor slab is set as the sum of masses between half-upper and half-lower of the story. The four-branch backbone curve shown in
Figure 1 is adopted in this study to provide a representation of the non-linear behavior of the elastic–plastic springs. The story backbone curve, which has four key parameters including elastic stiffness
Ke, post-yielding stiffness ratio
α1, degrading stiffness
α2, and residual shear
Vr. In other words, the key points (
Dy,
Vy), (
Dp,
Vp), and (
Dr,
Vr) in the idealized curve need to be determined from the story capacity curve.
Five idealization methods are verified in this study from previous studies.
Table 1 shows the five idealization methods, and they are used to determine the elastic stiffness
Ke and post-yielding stiffness ratio
α1 based on the story capacity curves. The point (
Dp,
Vp) in the idealized curve is defined as the point with maximum shear in the capacity curve in this study. In the references [
18,
27,
28,
29,
30,
31,
32], some regulations are flexible to a practical analyst. In this study, what “has leveled off” (see
Table 1) in the ATC-40 method means that the range starts from the point where tangent stiffness reduces to 20% of the initial stiffness and ends at the point (
Dp,
Vp), then the initial tangent stiffness is calculated using the average of three stiffness values adopted (0, 0) and the first, second, and third points in the capacity curve.
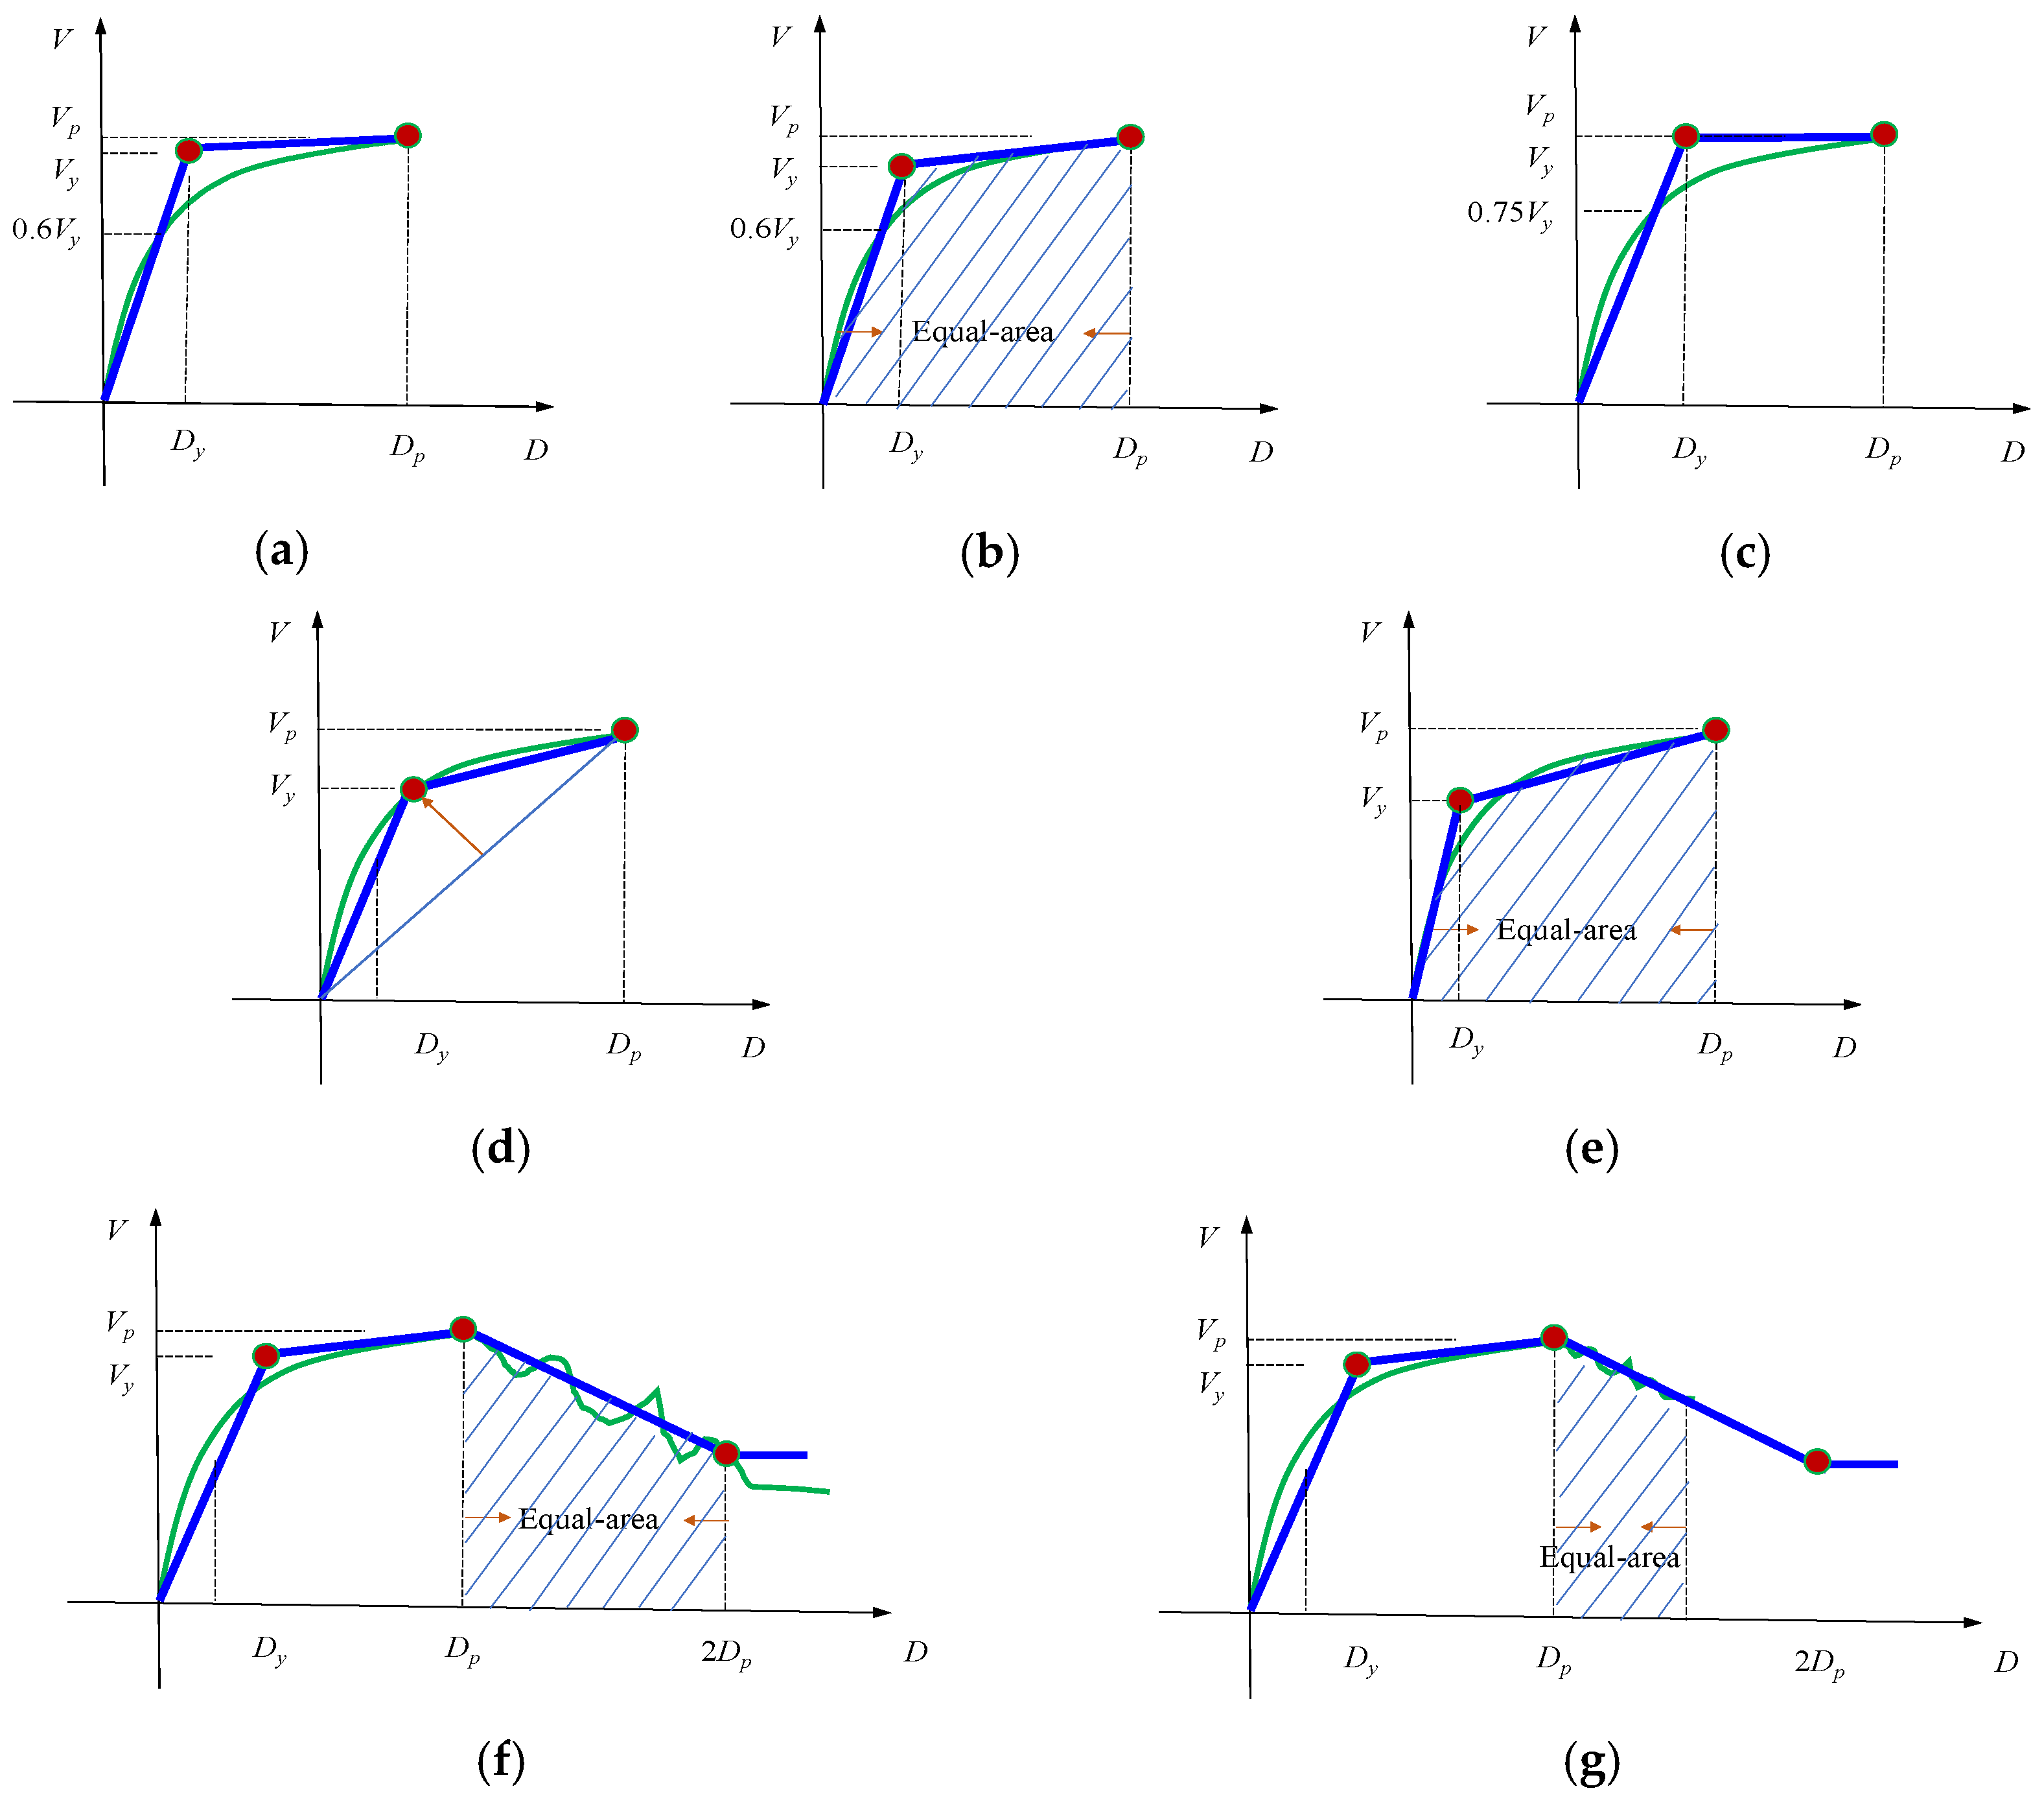
Figure 2a–e provide the schematic diagram of these five methods.
For the idealization of the story capacity curve after point (
Dp,
Vp), only ASCE 41-13 [
27] and FEMA 440 [
29] provide regulations. This segment is determined by the point (
Dp,
Vp) and the point at which the shear declines to 60% of the
Vy. Actually, the above idealization method has some inconveniences in practical idealized processes because the unstable numerical analysis results are commonly obtained in the prediction of the story capacity curve in the negative-stiffness region, e.g., (1) the results in this segment may not be accurate because the calculation is in the negative stiffness region; and (2) the data may be lost and not reach to the point with shear declines to 60% of the
Vy.
Figure 2f,g provide a schematic diagram for idealization of the capacity curve after point (
Dp,
Vp). In this study, the following method is advised to idealize the curve:
α2Ke is a line passing the point (
Dp,
Vp) and crossing a vertical line with horizontal coordinate 2
Dp.
α2Ke is determined by having equal areas within the range of
Dp–2
Dp; if the data are not enough, the last point of the story capacity curve is used to determine
α2Ke, in which the equal-area principle is satisfied within
Dp and the last point of the story capacity curve. Then, the segment will extend to the vertical line with horizontal coordinate 2
Dp. In this way, the point (
Dr,
Vr) is determined.
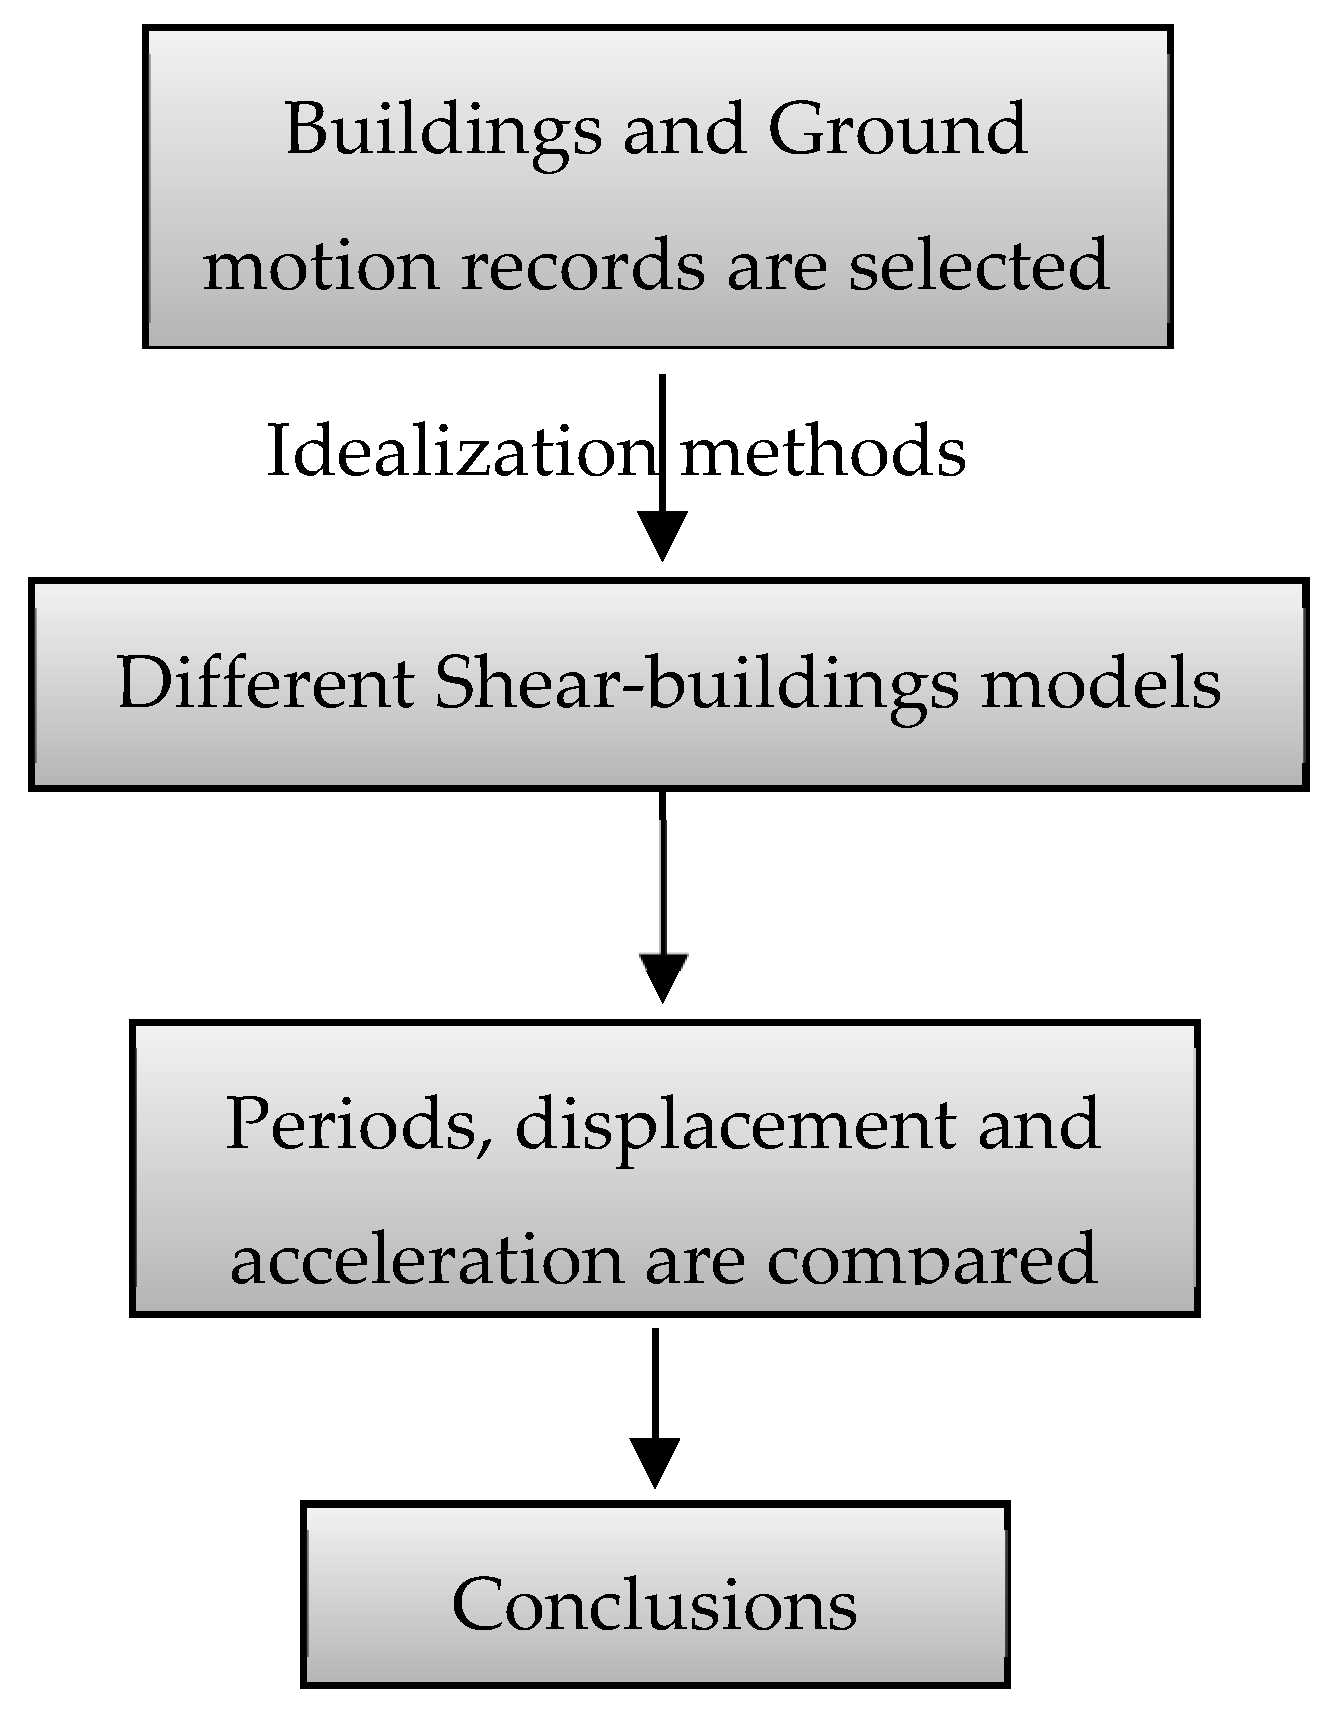
Figure 3 shows a flowchart of the paper in the following sections. Firstly buildings and ground motions used in this paper are selected in
Section 3. In
Section 4, the selected buildings are idealized to different shear-building models according to the five idealization methods, and the shear-building models are excited by ground motions. Then the structural responses (periods, displacements and accelerations) are compared to investigate the accuracy of different idealization methods. Finally, the conclusions are obtained and suggestions are provided to select proper idealization method for the buildings in dynamic time analysis.
3. Buildings, Selected Ground Motions and Modelling
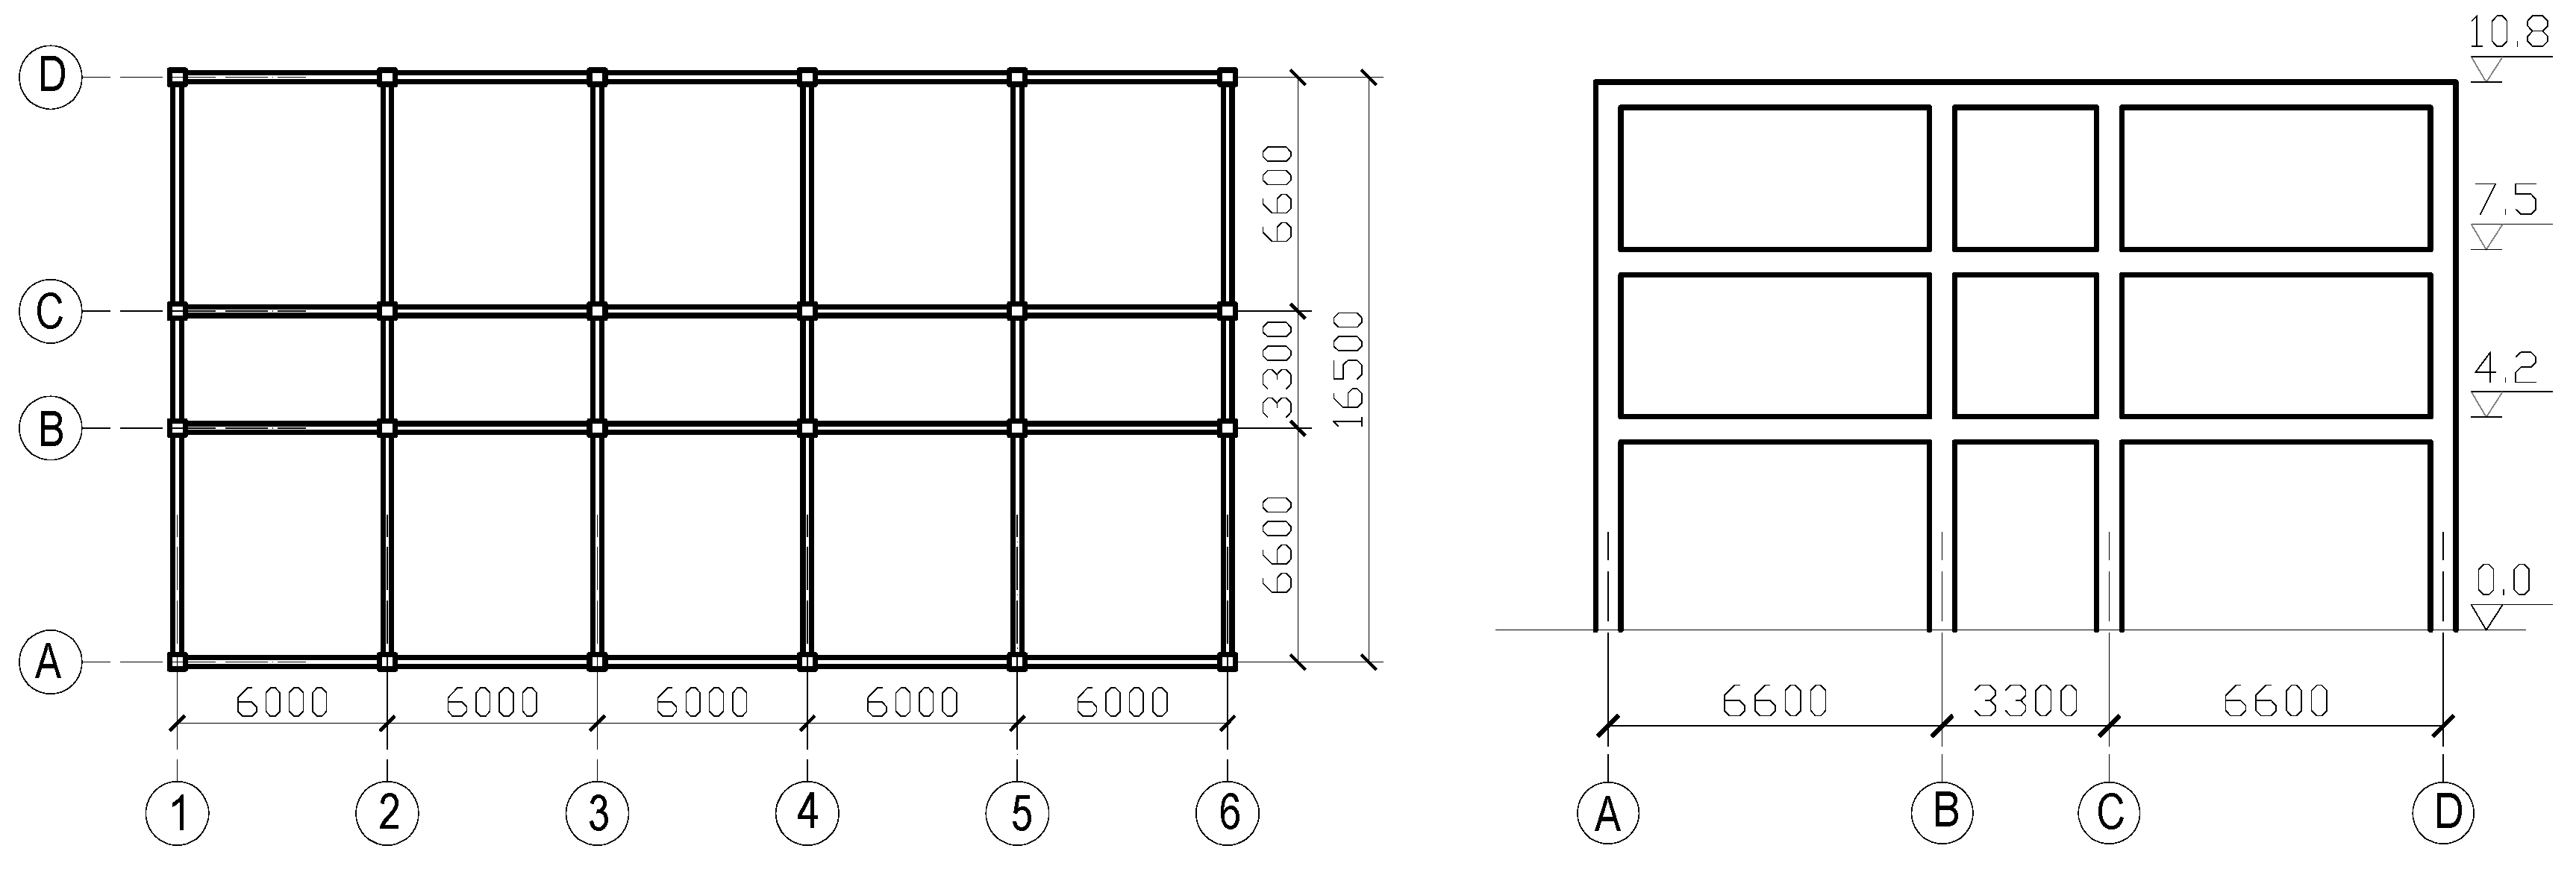
Four RC frames with 3, 8, 12, and 18 stories are shown in
Figure 4 (design information is in reference [
32]). The architectural elevation of four buildings are similar. For each building, the height of the first story and the standard floor are 4.2 m and 3.3 m, respectively. In total, the height of 3-, 8-, 12-, 18-story buildings are 10.8 m, 27.3 m, 40.5 m, 60.3 m. The design earthquake intensities for the frames are PGA = 0.15 g (seismic hazard corresponds to 10% exceedance probability in 50 years at the building site). The site type is II and group is I in Chinese seismic design code [
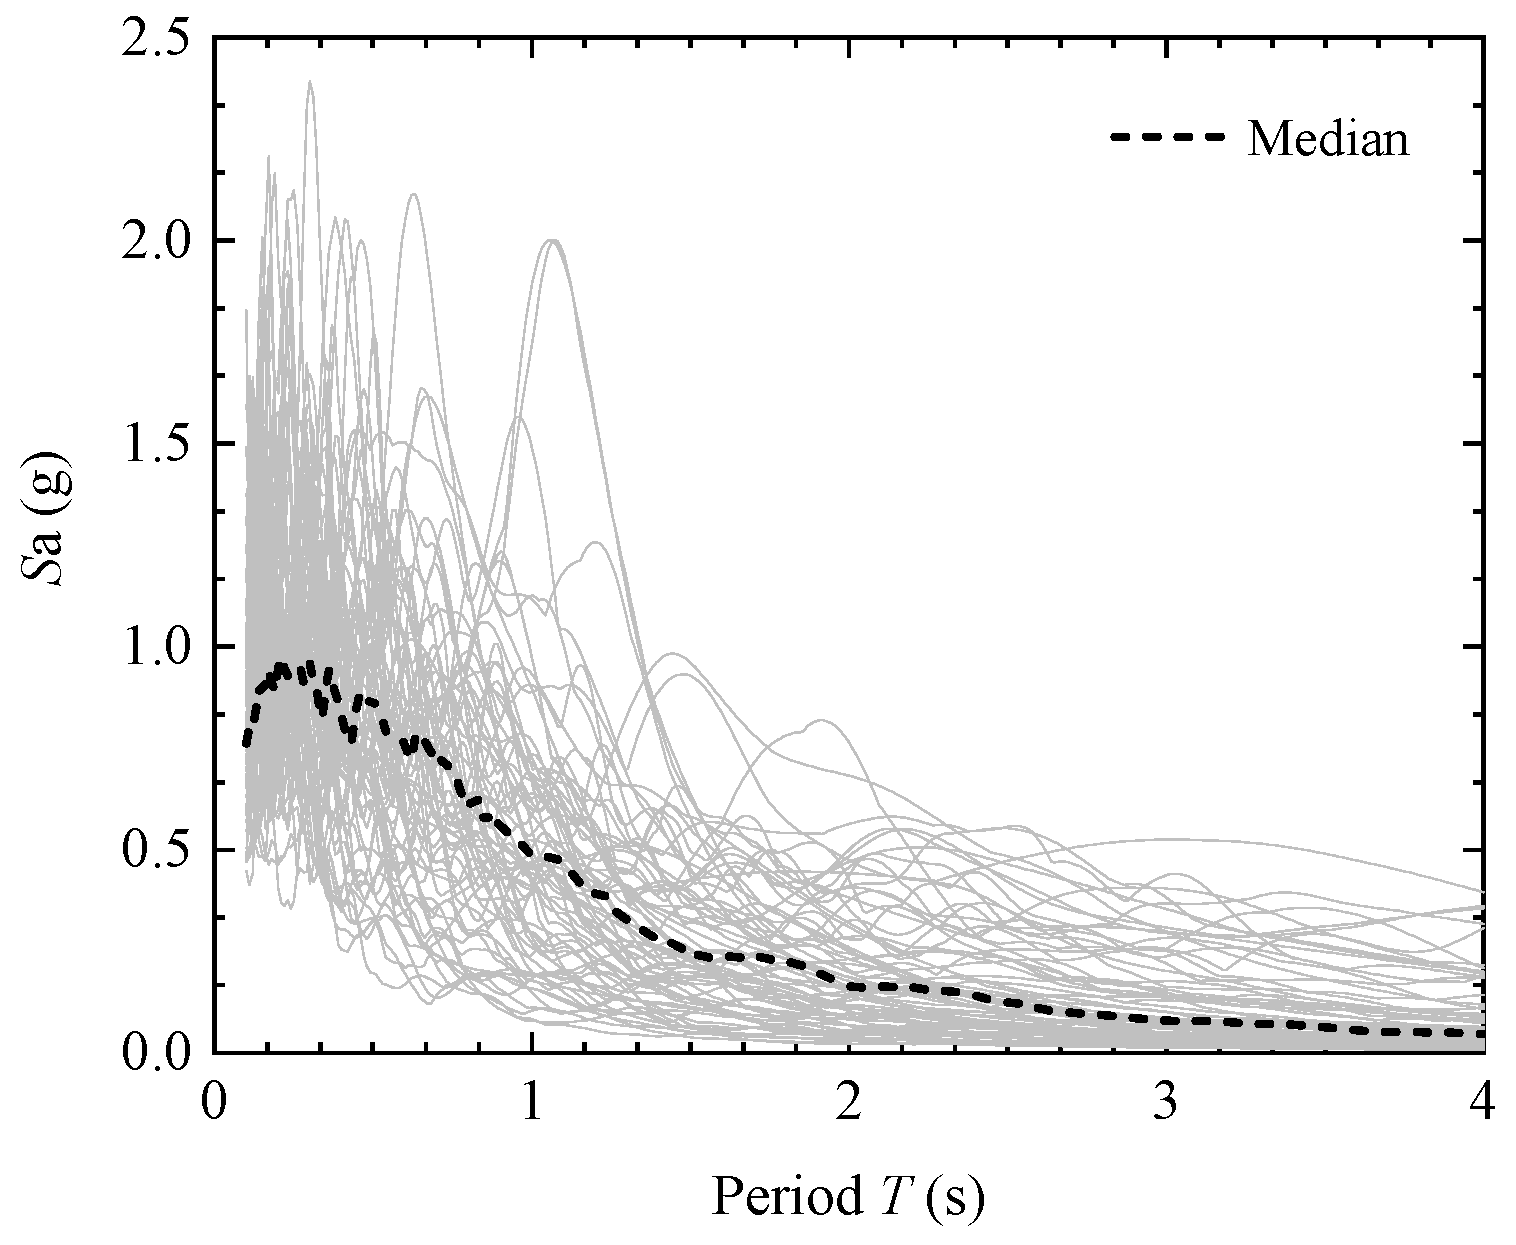
25]. A total of 80 ground motion records recommended in reference [
32] are used in the analyses. The acceleration spectra of ground motions are shown in
Figure 5. The ground motion records are selected from strong earthquakes, whose source magnitudes are mainly ranges from 5.0 to 8.0. The records from such strong earthquakes usually cause severe building damage. Three input ground motion intensities are considered with PGA = 0.056 g, 0.316 g, and 0.45 g (corresponds to frequent, rare and very rare earthquake intensities with 63% and 2~3% exceedance probabilities in 50 years, and 10
−4 exceedance probability per year, respectively).
The well-known Idarc program [
34] is used in the modelling of the frames to obtain the story capacity curves and structural responses in the later sections with the beam-column model. Idarc has been widely used by many researchers in inelastic structural damage analysis [
35,
36,
37]. The OpenSees program is used to build the idealized shear-building models and obtain the structural responses. The “Hysteretic material” model in the OpenSees program [
38] is used, in which the backbone curve parameters are determined with the methods in
Table 1 and hysteretic rule parameters use the default values. The residual capacity point is set as (2
Dp, 60%
Vy). The damping ratio used in the analyses is 0.05.
4. Results
The actual story capacity curves should be obtained first, then the idealization methods are used to derive the shear-building models. The actual story capacity curves of structure can be obtained by two methods: (1) incremental dynamic analysis (IDA) method, through which the story capacity curves can be obtained by increasing the PGA of ground motion records as input to the structures, the maximum story shear and maximum story ratio are obtained during the time history analysis, thus producing story shear force versus inter-story drift ratio (IDR) curves; and (2) the pushover method, through which the story shear versus IDR curves can be obtained by monotonically increasing the lateral loads along the structural height until the prescribed displacement is reached.
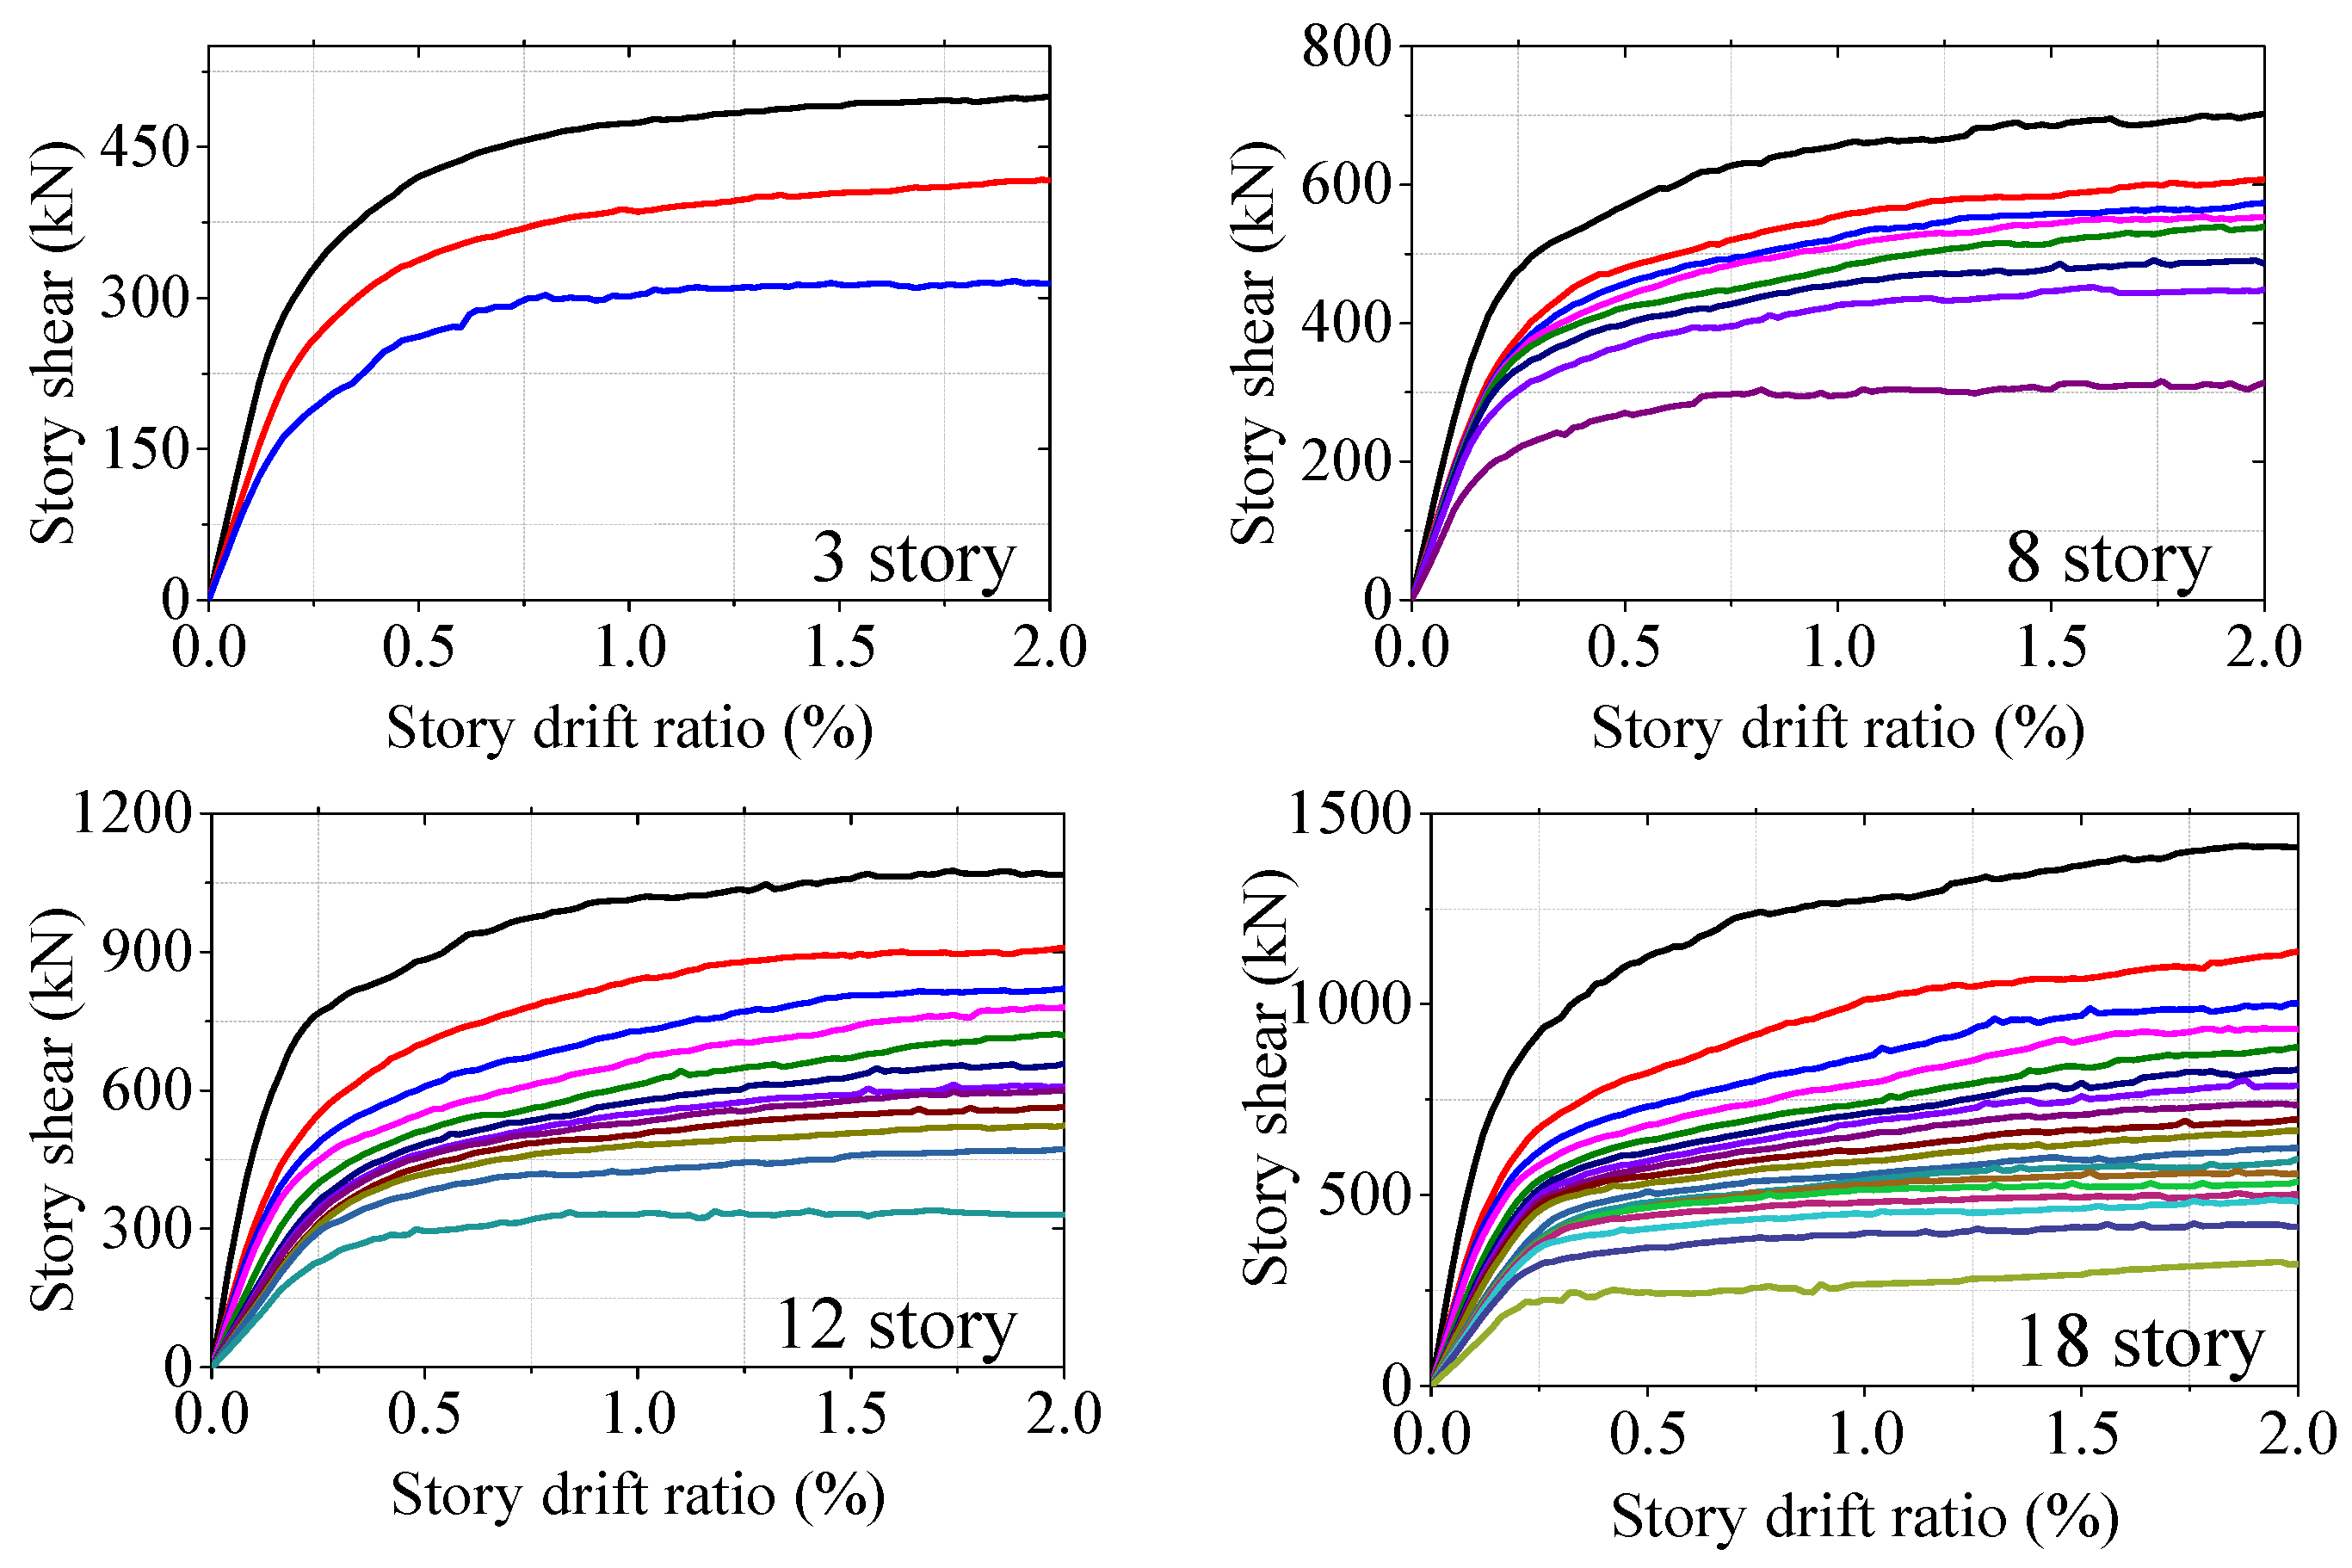
Figure 6 shows the story capacity curves of the 3-, 8-, 12-, and 18-story frames by using IDA method. Every line in
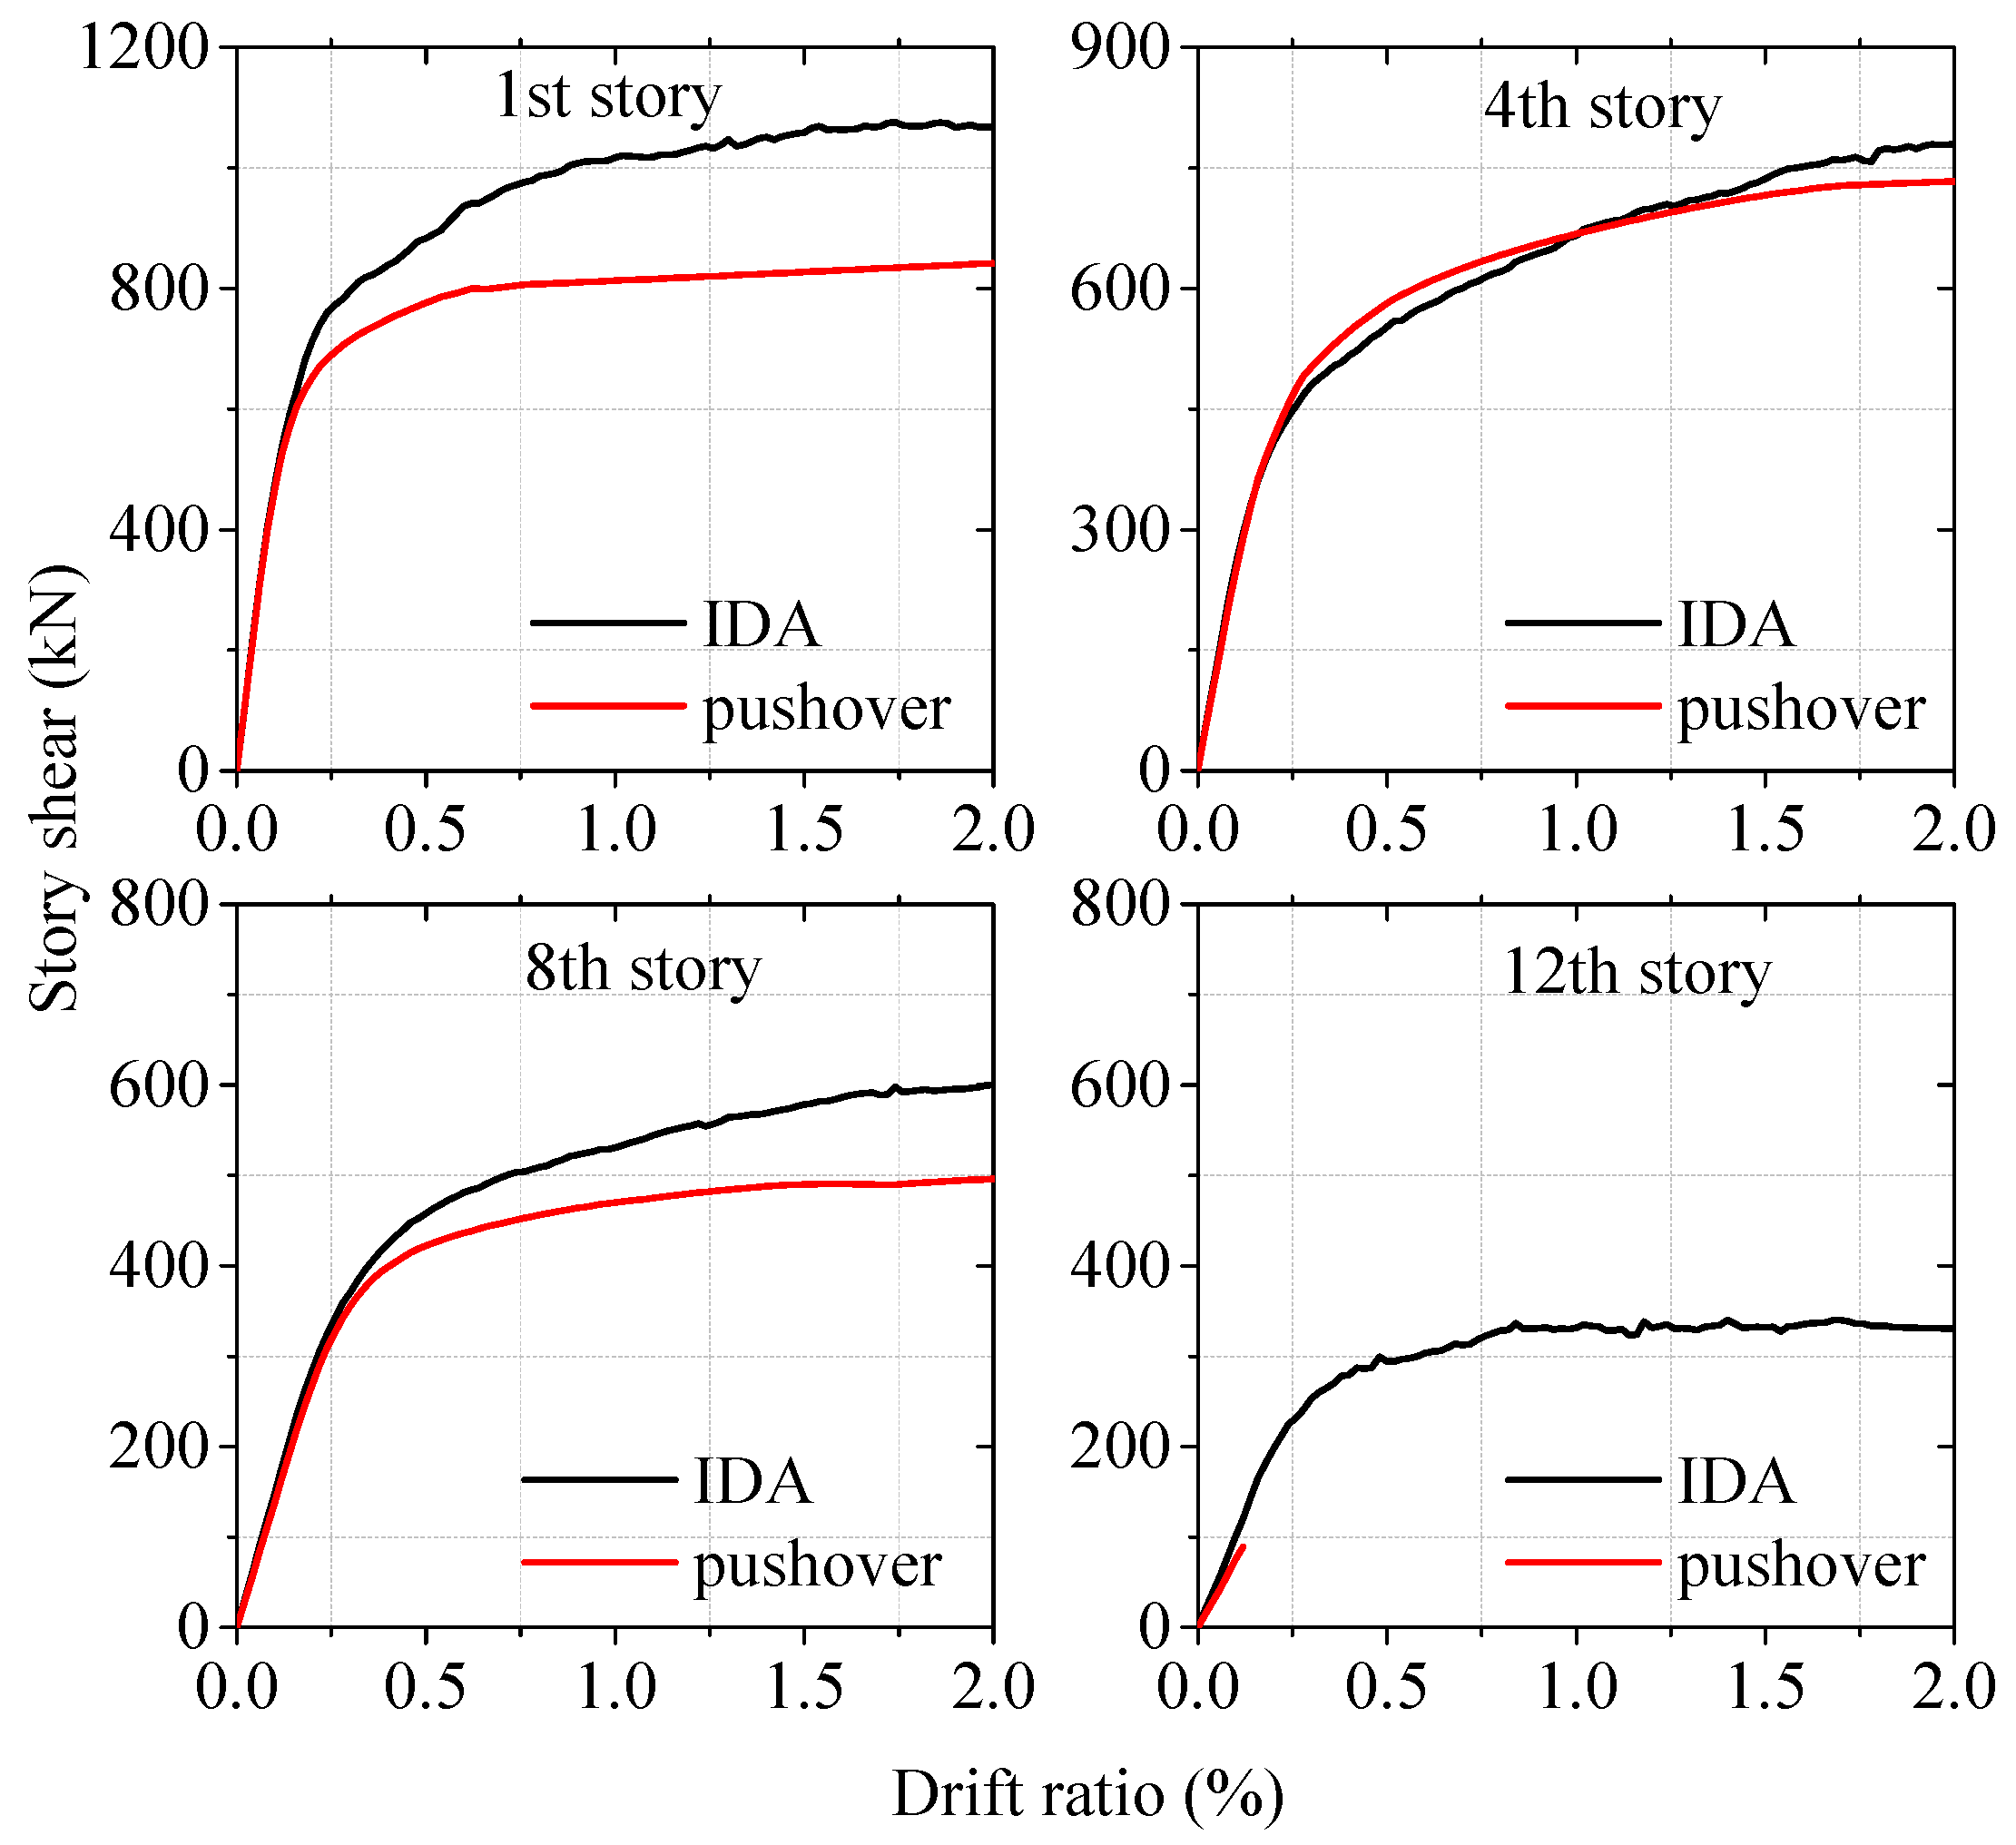
Figure 6 represents the capacity curve of each story of the frames. In order to compare the story capacity curves obtained by IDA and pushover methods. The actual story capacity curves of the 12-story frame obtained by the two methods are presented in
Figure 7, using the 12-story frame as an example. The inverted triangular lateral load distribution is adopted in the pushover method.
As can be seen in
Figure 7, the whole story capacity curves can be obtained using the IDA method. However, for the pushover method, the whole story capacity curves can be obtained in the low and middle stories (1st, 4th, and 8th stories), while the whole story capacity curve cannot be obtained in the upper story (12th story). The capacity curve of the 12th story does not increase with the increase of top displacement. This is because the damages mainly occur in the low or middle stories, the upper stories experience elastic unloading even when the top displacement is getting bigger. It means the capacity curve of the upper stories cannot reach the inelastic stage in the pushover procedure. A similar phenomenon can be also observed in the 3-, 8-, and 18-story frame structures. A similar observation was also obtained in the authors’ previous study, regardless of the lateral load patterns used in pushover analysis, e.g., the uniform pattern, linear pattern, parabolic pattern, and modal adaptive pattern [
39].
Note again that the pushover is a simplified method and lacks a rigorous theoretical foundation, the predefined lateral load distributed along the building height is different from the real situation in the earthquake, and this causes the result that some stories may experience an unloading phenomenon when the structure is severely damaged in the other stories. The whole story capacity curve cannot be obtained due to the unloading phenomenon for some stories in the pushover method. The existing non-seismically designed buildings are usually poorly detailed (i.e., the use of plain steel bars, the use of concrete with low compression strength, the short length of column lap splices, the inadequate anchorage of reinforcement, and the poorly confined beam-column joint regions), which substantially increase number of parameters related to structural weaknesses, and decisively affect the seismic response and structural integrity. The implementation of the pushover method in the case of existing non-seismically designed buildings is even more inaccurate. Compared with the pushover method, the dynamic analysis is regarded as a more accurate method [
37,
40,
41,
42]. Thus, the IDA method is adopted to obtain the story capacity curves in this study because it can get the whole story capacity curves of all stories.
In this section, the accuracies of the shear-building models by different idealization methods will be investigated. The structural dynamic property (period) and responses (displacement, i.e., the story drift ratio, and acceleration) calculated by the beam-column model in Idarc program and shear-building models using different idealization methods are compared. It is reasonable to assume that the results calculated by the beam-column model in Idarc program are more accurate. Thus, based on the results calculated by the beam-column model in the Idarc program, the accuracy and applicability of different idealization methods are discussed.
4.1. Comparison of Structural Period
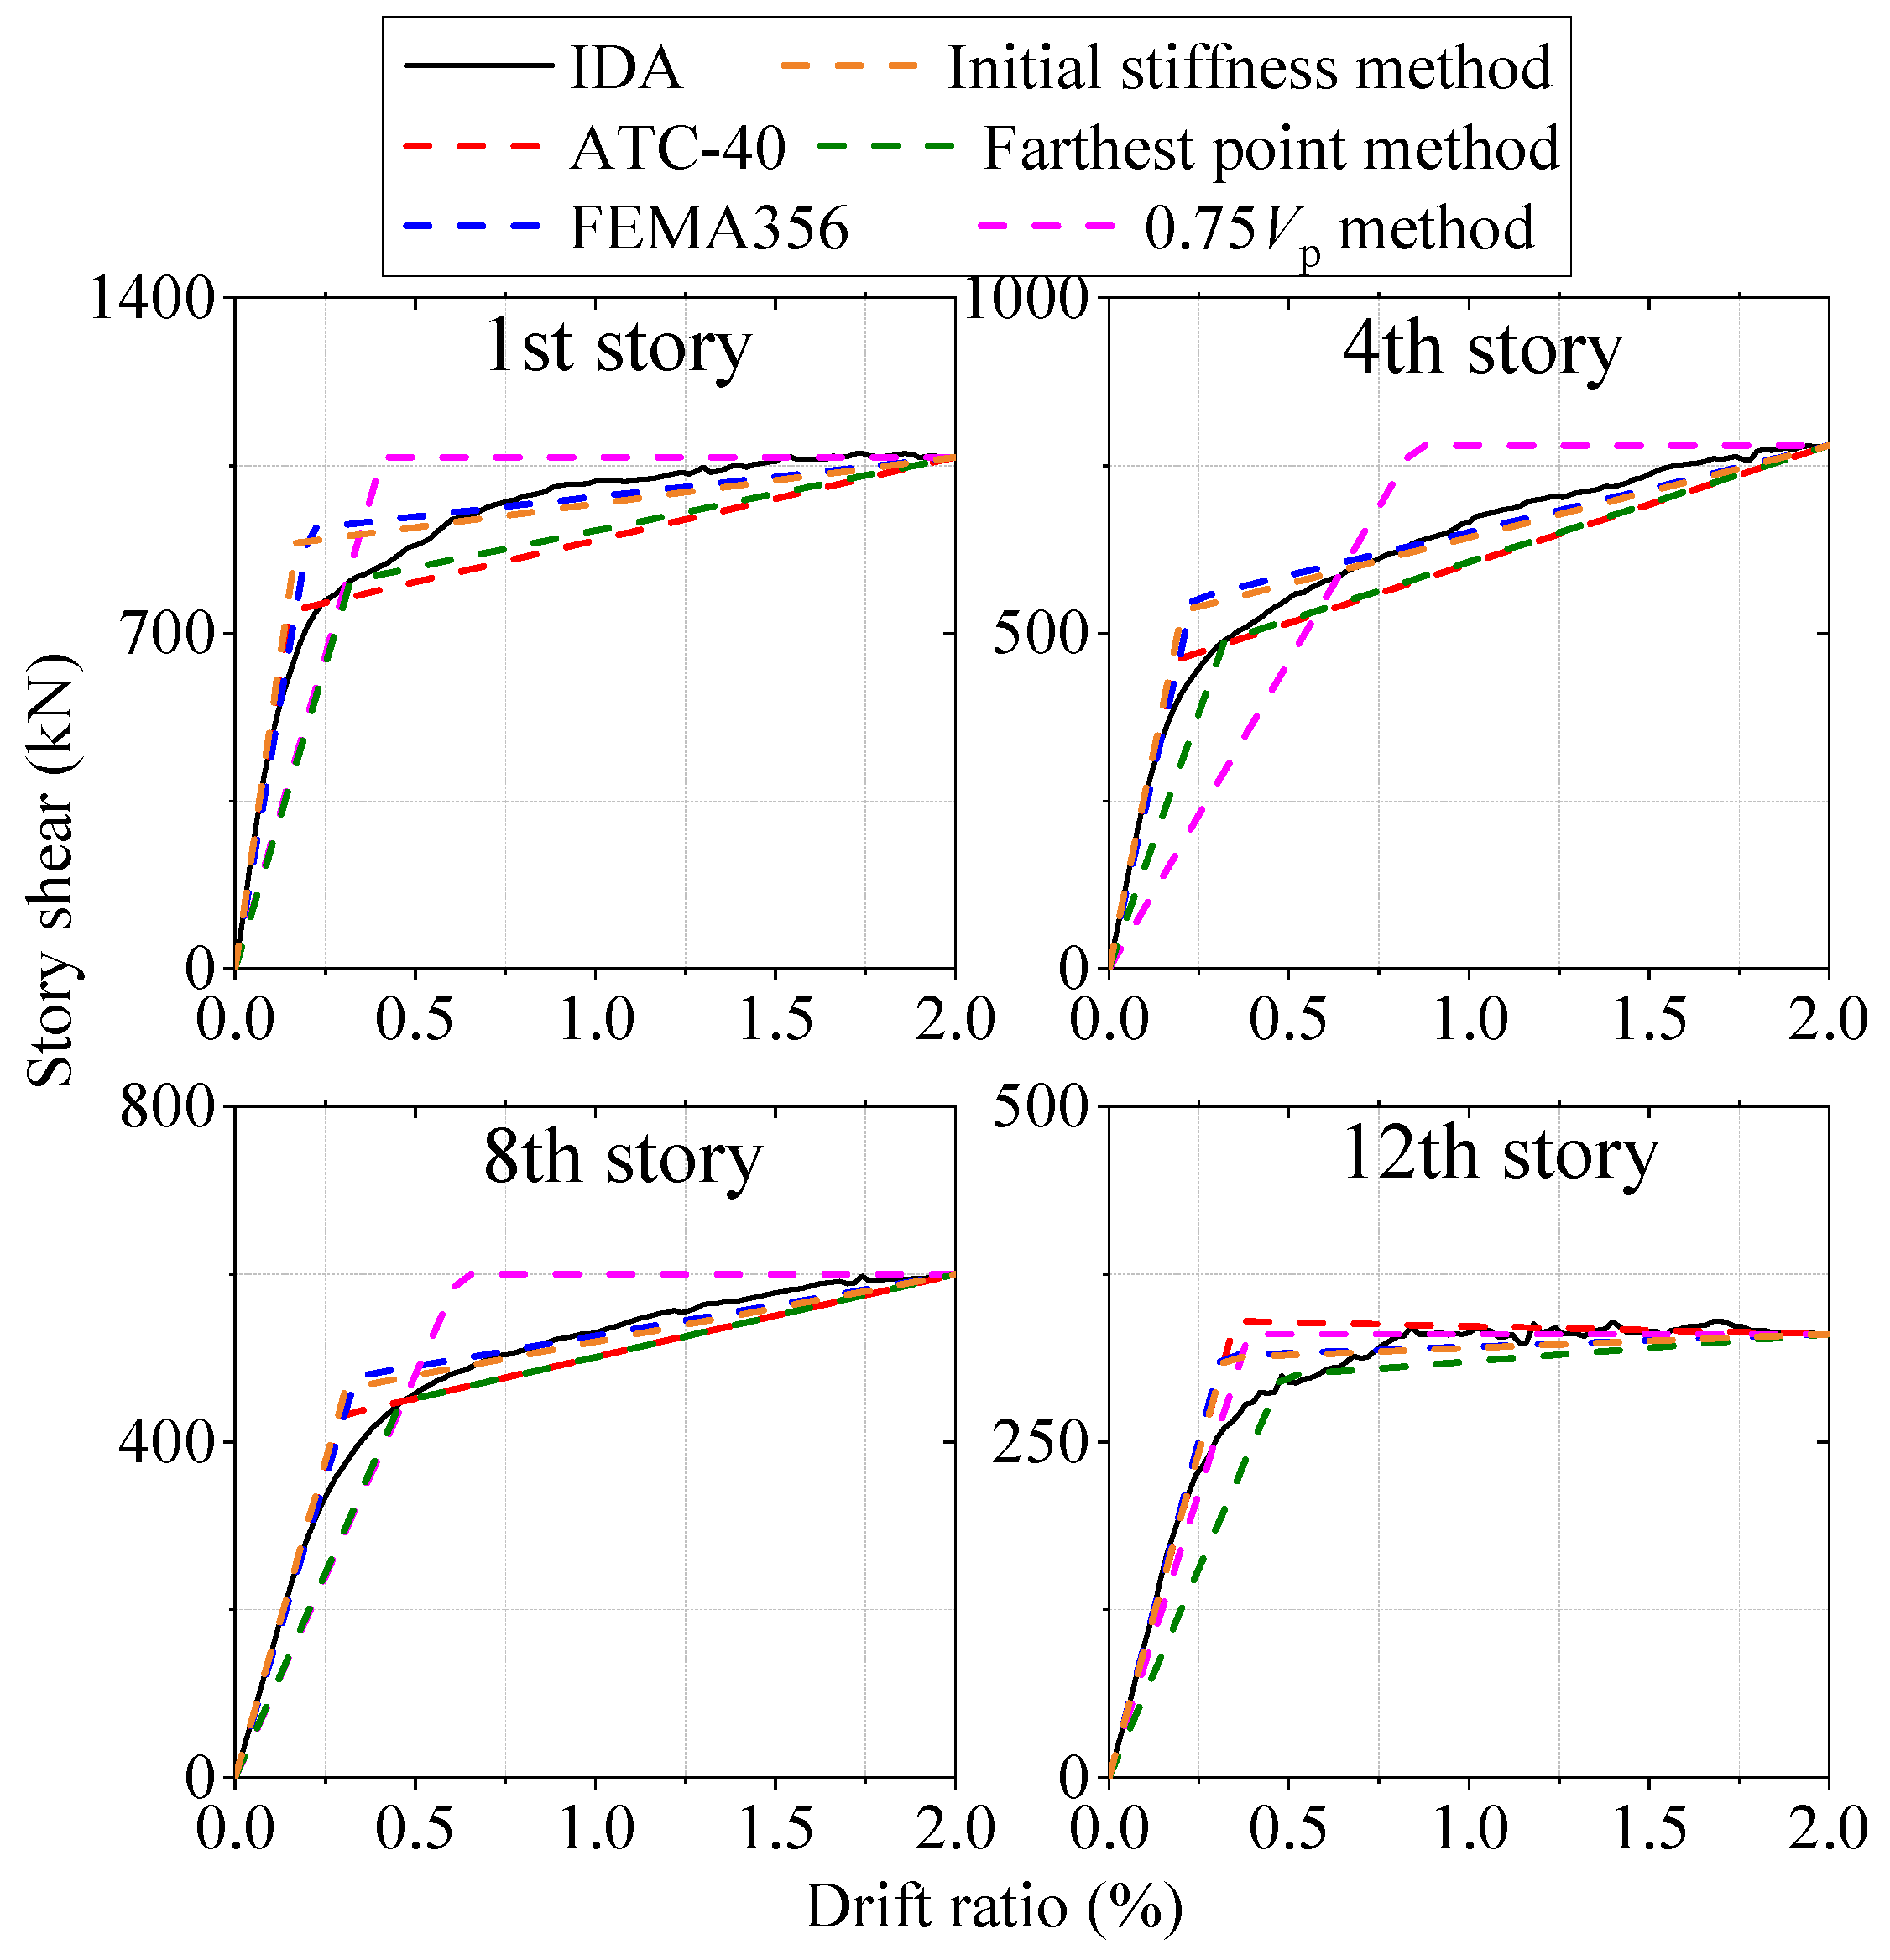
The actual story capacity curves of the frames are obtained by the IDA method. Then the five idealization methods are adopted to provide idealization of the actual capacity curves, as shown in
Figure 8. The 0.75
Vp method greatly overestimates the yield point compared with the IDA curve. The 0.75
Vp and farthest point methods underestimate the elastic stiffness.
The errors of the structural periods obtained by shear-building models using the five idealization methods are discussed. The error index used in the study is presented as
where
TIdarc is the structural period obtained by beam-column model, and
Tsm is the structural period obtained by shear-building models using different idealization methods.
Table 2 shows the error of the structural periods. For the 12-story frame, the period calculated using the 0.75
Vp and farthest point methods overestimate the period due to the underestimation of the elastic stiffness, which can be seen in
Figure 6. For the 0.75
Vp method, the errors of the first and second periods are 35.39% and 34.43%, respectively. For the farthest point method, the errors of the first and second periods are 35.39% and 42.62%, respectively. The errors of the first and second periods from the ATC-40, FEMA 356 and initial stiffness methods are all below 10%.
Similar conclusions can be also observed in the 3-, 8-, and 18-story frames. The average errors of the 0.75Vp and farthest point method are 40.81% and 44.64%, respectively. The average errors of the ATC-40, FEMA 356 and initial stiffness methods are no more than 10.12%. In general, the 0.75Vp and farthest point method greatly overestimated the period, the average error of period of these two methods are more than 40%. The errors of the other three methods (the ATC-40, FEMA 356 and initial stiffness methods) are no more than 10.15%, which are in an acceptable range in engineering. The initial stiffness method provides the best prediction on periods of the actual buildings.
4.2. Comparison of Structural Responses
The structural responses are average values of the results obtained by the 80 ground motion records used in
Section 3. The error index of structural response is presented as
where
RESIdarc is the structural responses (inter-story drift ratio or accelerations) obtained by beam-column model, and
RESsm is the structural responses (inter-story drift ratio or accelerations) obtained by shear-building models using different idealization methods.
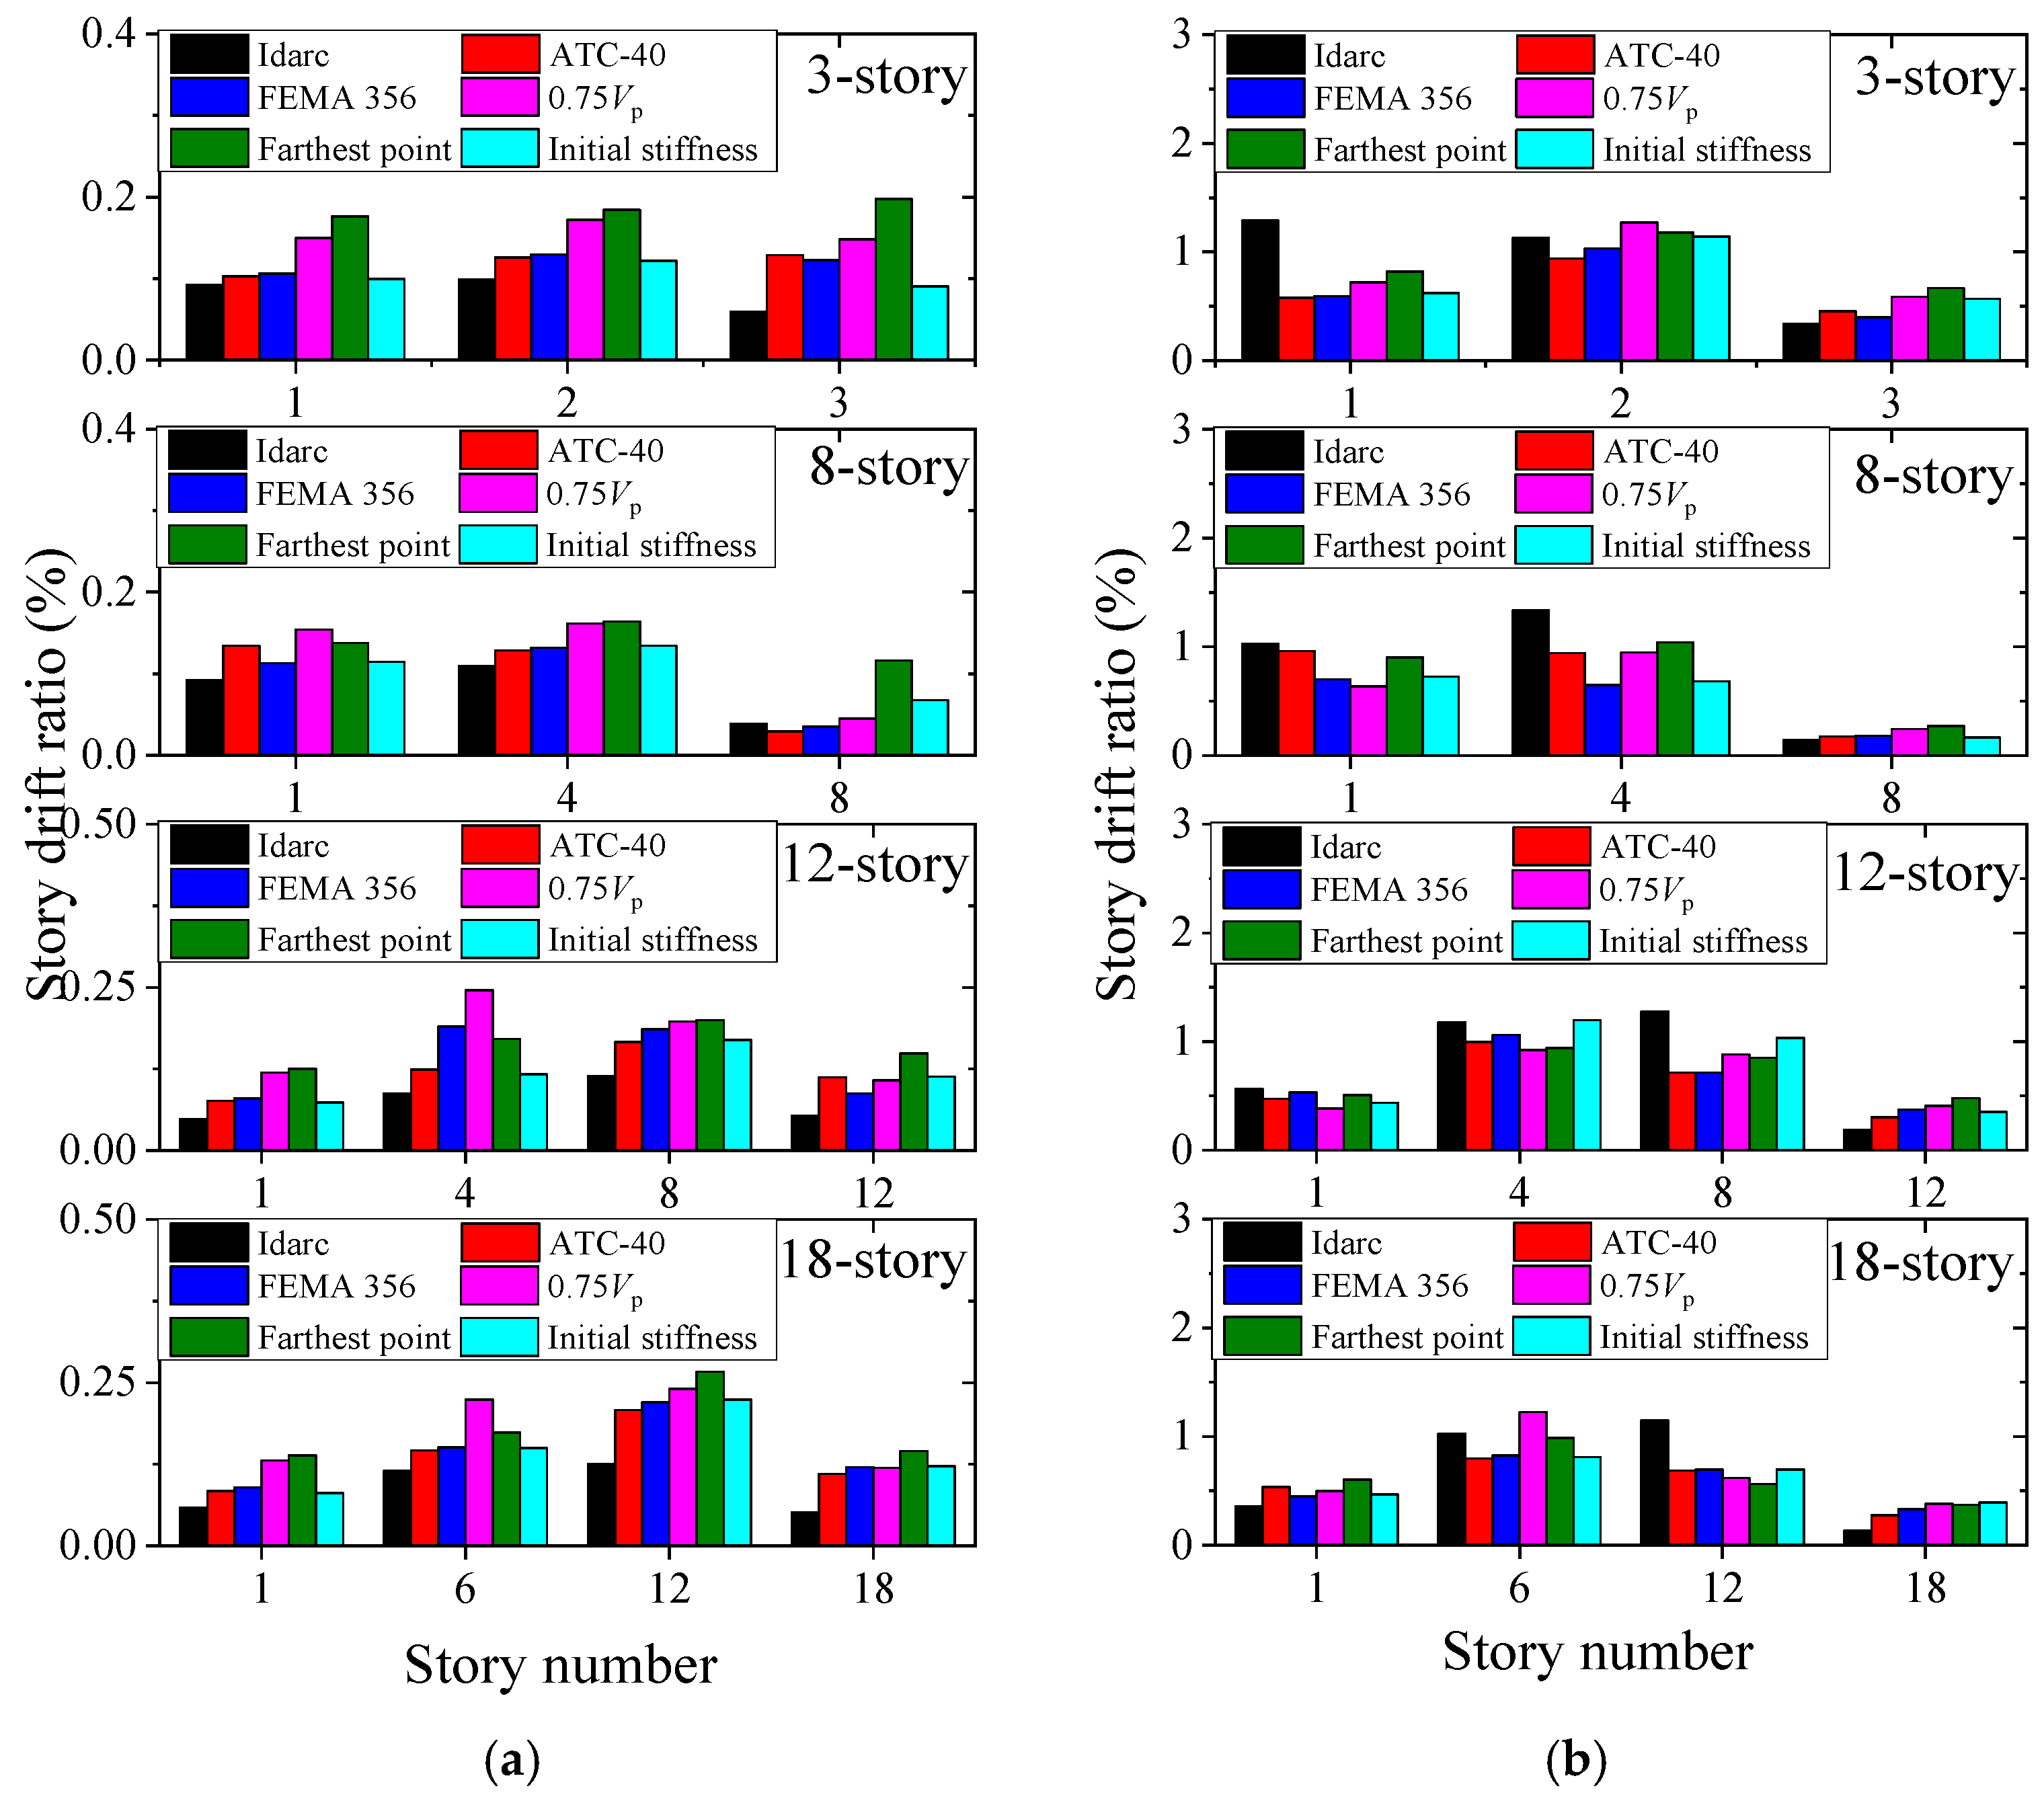
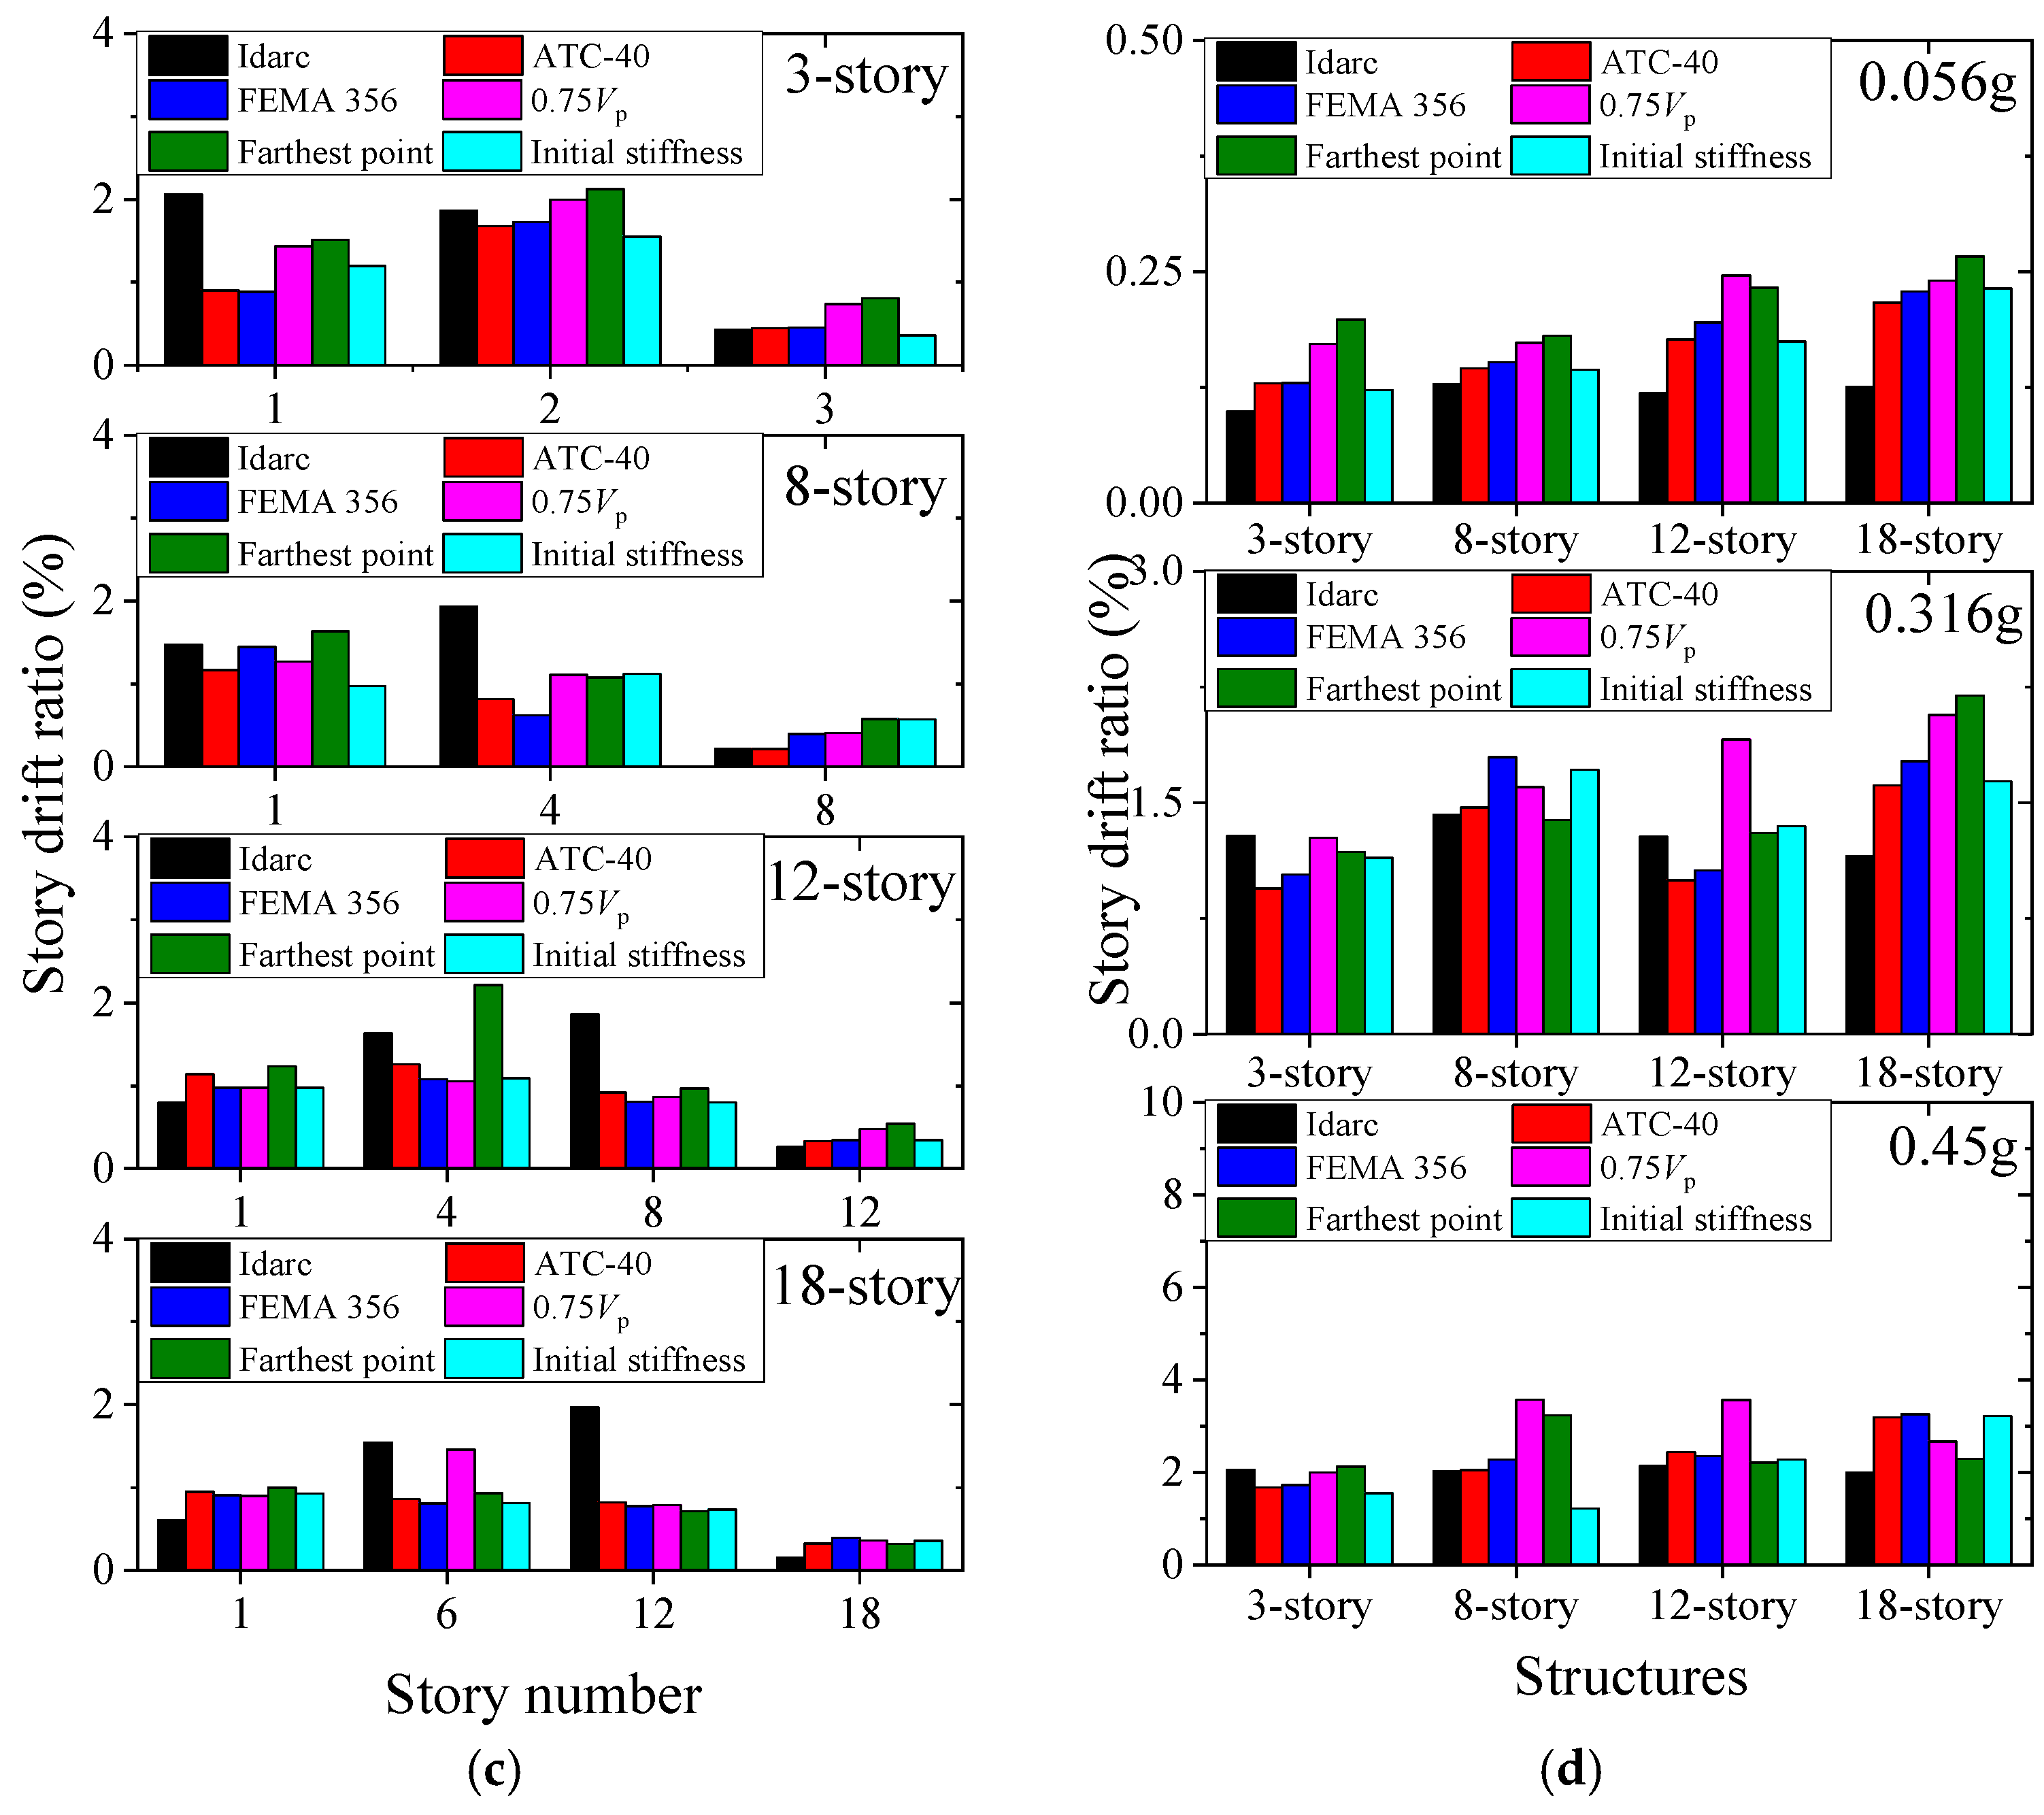
Figure 9a–c show the inter-story drift ratios (IDRs) obtained by Idarc program and the five shear-building models at different seismic intensities.
Table 3 shows the error of IDRs obtained from the shear-building models compared with beam-column model in Idarc program. As shown in
Table 3, the minimum error is 23.25%, and the maximum error reaches 109.8%. The average errors of IDRs are all above 30%. Among the five different idealization methods, the average errors of ATC-40 and initial stiffness methods are about 40%, while the average error of farthest point method reaches 64.14%.
Figure 9d shows the maximum IDRs of the structures obtained by different methods. The “maximum” here denotes that it firstly averages the IDR results of 80 ground motions of each story, and then the maximum value within all the stories is used.
Table 4 shows the error of maximum IDRs obtained from the shear-building models compared with beam-column model. As can be seen form
Table 4, the errors of the maximum IDRs are much smaller compared with those errors in
Table 3 (the reason is because the comparison only focuses on the maximum values regardless of which story they occur in). The minimum error is 3.16% in
Table 4. The average error of the ATC-40 method is about 30%, which is the most accurate among the five idealization methods.
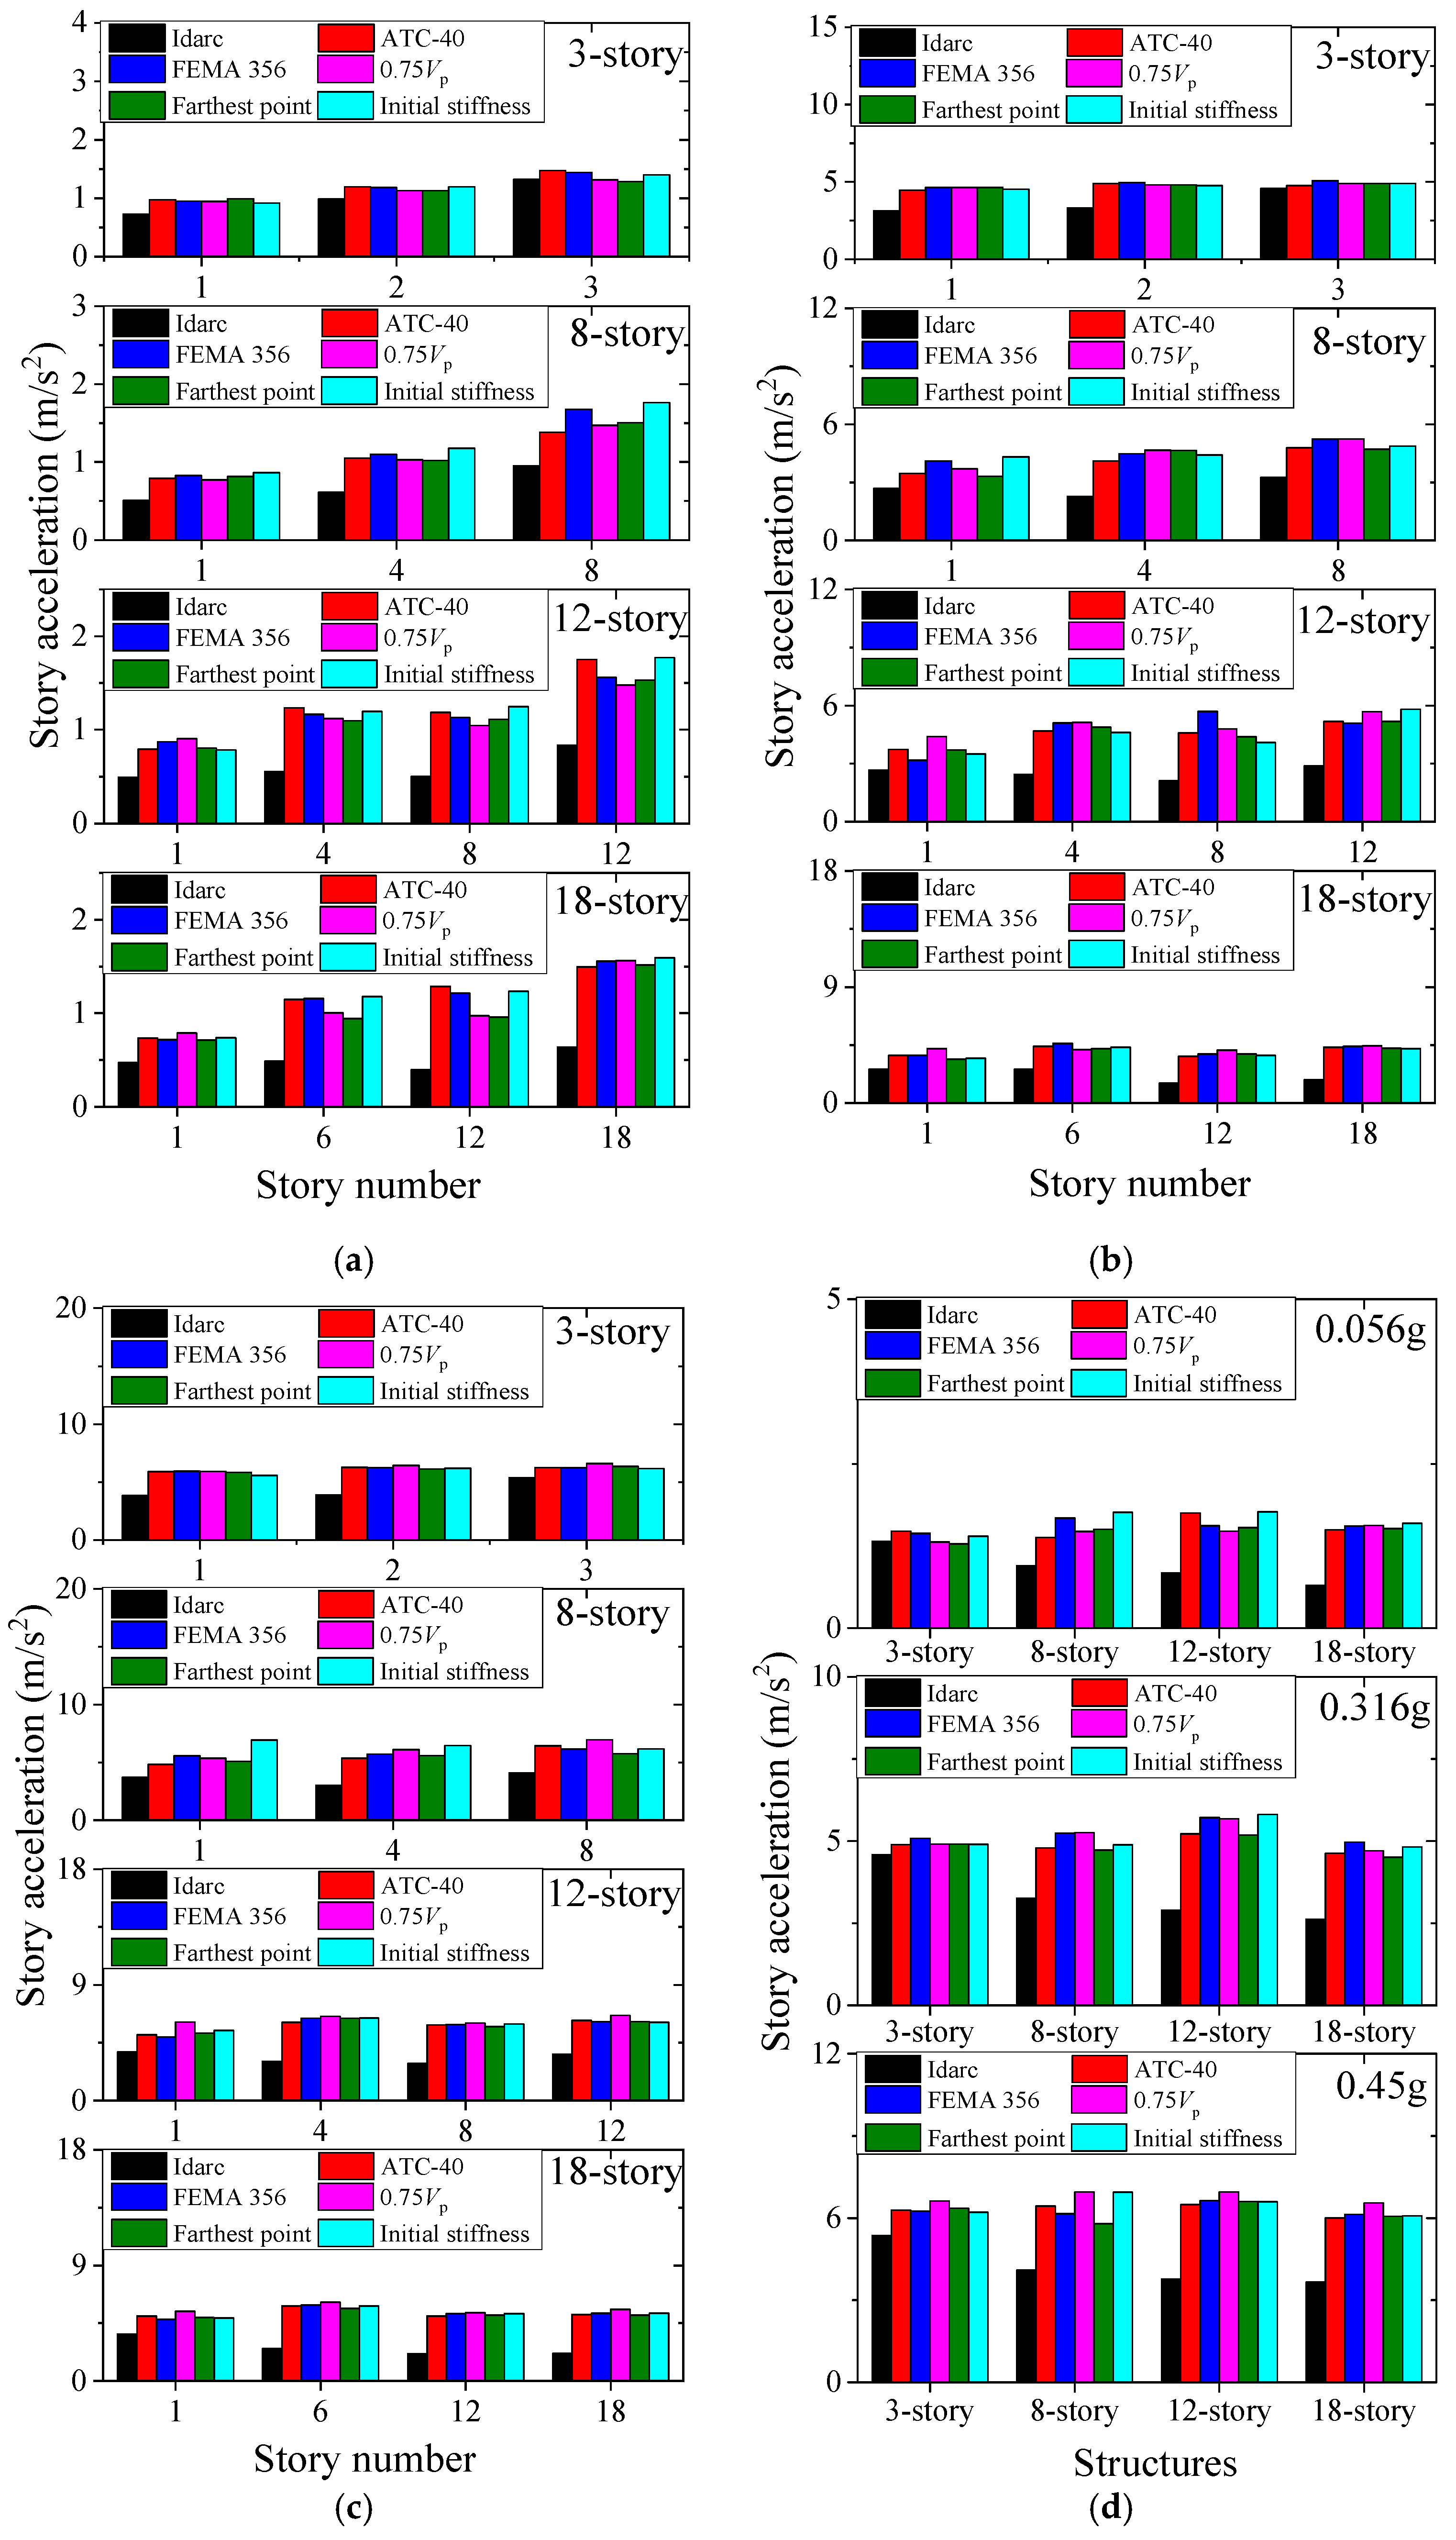
Figure 10 shows the accelerations obtained by beam-column model and the five idealized methods at different seismic intensities.
Table 5 and
Table 6 show the error of accelerations obtained from the five idealized methods compared with beam-column model. As shown in
Figure 10, all the five idealization methods cause remarkable errors in prediction of the accelerations compared with those of the beam-column model. The accuracy of the farthest point method is relatively more accurate than the other four methods. Comparing
Table 3 and
Table 4, the errors of the acceleration estimation are higher than those of the IDRs.
5. Conclusions and Discussion
The study focuses on the accuracies of idealization methods of shear-building models. Five idealization methods are adopted to provide idealization of the actual story capacity curve. The main conclusions and discussions are summarized as follows:
- (1)
The story shear versus displacement curves need to be obtained first to idealize the shear-building model. The story shear versus displacement curves can be obtained by the pushover method. However, in some cases, not all story shear versus displacement curves can be obtained by the pushover method. This is caused by the elastic unloading phenomenon even when the top displacement is getting bigger in some stories of the structures. When the top displacement is monotonically increased in the pushover method, the damages usually mainly occur in some weak stories, while the other stories are still in the elastic stage, and will experience elastic unloading even if the top displacement is getting bigger. The story shear versus displacement curves can be obtained by using IDA method, which can avoid the limitation of the pushover method;
- (2)
The farthest point method and the 0.75Vp method greatly overestimated the period. The errors of periods by these two methods are more than 40%. The overestimation of the periods is due to the underestimation of the elastic stiffness in these two methods. The errors of the other three methods are in an acceptable range in engineering. The initial stiffness method provides the best prediction on periods of the actual buildings;
- (3)
For the structural responses, all the five methods provide better prediction on the maximum IDRs (or accelerations), i.e., without considering the maximum values occur at which story. For the structural maximum IDRs, the average errors of the ATC-40 and initial stiffness method are about 30%, which are smaller than the other three idealization methods. For the structural maximum accelerations, the average errors of all the methods are above 55%, and the farthest point method provides better prediction than the other four idealization methods;
- (4)
For the five idealization methods of shear-building models, which have different backbone curves but same hysteretic rule, the differences in the structural response prediction can be within about 20%. However, the differences between the results obtained by beam-column model and the shear-building models are much larger. This implies the hysteretic rule and negative-stiffness region in the backbone curve may also have obvious influence on the prediction results, because in this study the backbone curve before the negative-stiffness region is simplified based on the actual story capacity curve, whereas the hysteretic rule and negative-stiffness region are assumed in the calculation. Note that in practical analyses, the negative-stiffness region is also usually assumed due to the story capacity curve in this region may lack of data or not be accurate.
Recent years, the city or regional earthquake response analysis are hot topics which need huge computational workload. It is impractical to adopt the beam-column models in dynamic time analysis in the city or regional earthquake response analysis. The modeling requires idealized shear-building models for building, because it is a feasible way to balance the accuracy and computational workload. Note that rational use of idealized shear-building models in such analyses is needed. The reason is that, in these studies, the analytical formulas in seismic design code and overstrength factors are usually used to determine the backbone curve before the negative-stiffness region, the backbone curve after the negative-stiffness region, and the hysteretic rule are all assumed. Therefore, the accuracy even may be lower than result of the present study because both the analytical formulas overstrength factors have errors to the actual structural story capacity. The other issue is many optimum seismic design methods are derived based on idealized shear-building models. Those methods are promising, but it is very important to guarantee that the designed structure has similar story behaviour (backbone curve and hysteretic rule) to the idealized shear-building model.
The main conclusions of this paper are obtained by analysis of the RC frames, and only periods, displacement and acceleration responses are selected to investigate the accuracy of the idealization methods. Whether the conclusions are applicable to other structural response parameters (i.e., energy dissipation and damage index) need to be investigated in future research.
Author Contributions
Conceptualization, S.L. and Z.Z.; methodology, S.L. and Z.Z.; software, Z.Z. and Y.H.; validation, Z.Z. and Y.H.; formal analysis, Z.Z. and Y.H.; investigation, Z.Z.; writing—original draft preparation, Z.Z., Y.H. and S.L.; writing—review and editing, Z.Z., Y.H. and S.L. All authors have read and agreed to the published version of the manuscript.
Funding
Institute of Engineering Mechanics, China Earthquake Administration: 2017B17; National Natural Science Foundation of China: U1939210, 41861134010; Natural Science Foundation of Heilongjiang: YQ2019E021, LH2019E097.
Data Availability Statement
The data presented in this study are available on request from the corresponding author.
Conflicts of Interest
The authors declare no conflict of interest.
References
- Ganjavi, B.; Hajirasouliha, I.; Bolourchi, A. Optimum lateral load distribution for seismic design of nonlinear shear-buildings considering soil-structure interaction. Soil Dyn. Earthq. Eng. 2016, 88, 356–368. [Google Scholar] [CrossRef]
- Abtahi, S.; Mahsuli, M.; Ghannad, M.A. Probabilistic evaluation of soil-structure interaction effects on strength demands of shear buildings. J. Struct. Eng. 2020, 146, 04019166. [Google Scholar] [CrossRef]
- Tian, Y.; Sun, C.; Lu, X.; Huang, Y. Quantitative analysis of site-city interaction effects on regional seismic damage of buildings. J. Earthq. Eng. 2020, 1–21. [Google Scholar] [CrossRef]
- Asadi-Ghoozhdi, H.; Attarnejad, R. The effect of nonlinear soil-structure interaction on the ductility and strength demands of vertically irregular structures. Int. J. Civ. Eng. 2020, 18, 1209–1228. [Google Scholar] [CrossRef]
- Naserkhaki, S.; Aziz, F.N.A.; Pourmohammad, H. Parametric study on earthquake induced pounding between adjacent buildings. Struct. Eng. Mech. 2012, 43, 503–526. [Google Scholar] [CrossRef]
- Hoskere, V.; Park, J.-W.; Yoon, H.; Spencer, B.F., Jr. Vision-based modal survey of civil infrastructure using unmanned aerial vehicles. J. Struct. Eng. 2019, 145, 04019062. [Google Scholar] [CrossRef]
- Ikeda, A.; Fujita, K.; Takewaki, I. Takewaki, Story-wise system identification of actual shear building using ambient vibration data and ARX model. Earthq. Struct. 2014, 7, 1093–1118. [Google Scholar] [CrossRef]
- Valdez, J.M.; Alvarez-Icaza, L.; Sanchez-Sesma, F.J. Shear building stiffness estimation by wave traveling time analysis. Struct. Control Health Monit. 2018, 25, e2045. [Google Scholar] [CrossRef]
- Yang, J.-H.; Lam, H.-F. An efficient adaptive sequential Monte Carlo method for Bayesian model updating and damage detection. Struct. Control Health Monit. 2018, 25, e2260. [Google Scholar] [CrossRef]
- Yuen, K.-V.; Huang, K. Real-time substructural identification by boundary force modeling. Struct. Control Health Monit. 2018, 25, e2151. [Google Scholar] [CrossRef]
- Rahbari, N.M.; Azar, B.F.; Talatahari, S.; Safari, H. Semi-active direct control method for seismic alleviation of structures using MR dampers. Struct. Control Health Monit. 2013, 20, 1021–1042. [Google Scholar] [CrossRef]
- Alhan, C.; Sürmeli, M. Shear building representations of seismically isolated buildings. Bull. Earthq. Eng. 2011, 9, 1643–1671. [Google Scholar] [CrossRef]
- Gu, X.; Yu, Y.; Li, Y.; Li, J.; Askari, M.; Samali, B. Experimental study of semi-active magnetorheological elastomer base isolation system using optimal neuro fuzzy logic control. Mech. Syst. Signal Process. 2019, 119, 380–398. [Google Scholar] [CrossRef]
- Fujita, K.; Takewaki, I. Sustainable building design under uncertain structural-parameter environment in seismic-prone countries. Sustain. Cities Soc. 2011, 1, 142–151. [Google Scholar] [CrossRef] [Green Version]
- Ganjavi, B.; Hao, H. Optimum lateral load pattern for seismic design of elastic shear-buildings incorporating soilstructure interaction effects. Earthq. Eng. Struct. Dyn. 2013, 42, 913–933. [Google Scholar] [CrossRef]
- Li, S.; Yu, B.; Gao, M.; Zhai, C. Optimum seismic design of multi-story buildings for increasing collapse resistant capacity. Soil Dyn. Earthq. Eng. 2019, 116, 495–510. [Google Scholar] [CrossRef]
- Lu, Y.; Hajirasouliha, I.; Marshall, A. Performance-based seismic design of flexible-base multi-storey buildings considering soil-structure interaction. Eng. Struct. 2016, 108, 90–103. [Google Scholar] [CrossRef]
- Chopra, A.K.; Goel, R.K. A modal pushover analysis procedure for estimating seismic demands for buildings. Earthq. Eng. Struct. Dyn. 2002, 31, 561–582. [Google Scholar] [CrossRef] [Green Version]
- Chopra, A.K.; Goel, R.K. Envelope-based pushover analysis procedure for the approximate seismic response analysis of buildings. Earthq. Eng. Struct. Dyn. 2014, 43, 77–96. [Google Scholar] [CrossRef]
- Xu, B.; Wu, Z.; Yokoyama, K.; Harada, T.; Chen, G. A soft post-earthquake damage identification methodology using vibration time series. Smart Mater. Struct. 2005, 14, S116–S124. [Google Scholar] [CrossRef]
- Xiong, C.; Lu, X.; Lin, X.; Xu, Z.; Ye, L. Parameter determination and damage assessment for tha-based regional seismic damage prediction of multi-story buildings. J. Earthq. Eng. 2017, 21, 461–485. [Google Scholar] [CrossRef]
- Xiong, C.; Lu, X.; Guan, H.; Xu, Z. A nonlinear computational model for regional seismic simulation of tall buildings. Bull. Earthq. Eng. 2016, 14, 1047–1069. [Google Scholar] [CrossRef]
- Lu, X.; Guan, H. Earthquake Disaster Simulation of Civil Infrastructures: From Tall Buildings to Urban Areas, 2nd ed.; Springer: Singapore, 2021; ISBN 978-981-15-9531-8. [Google Scholar] [CrossRef]
- Seismic Evaluation and Retrofit of Existing Buildings; ASCE/SEI 7-16; American Society of Civil Engineers: Reston, VA, USA, 2016.
- Code for Seismic Design of Buildings; GB50010-2010; Ministry of Housing and Urban-Rural Development of P. R. China: Beijing, China, 2010.
- Design of Structures for Earthquake Resistance. Part 1: General Rules, Seismic Action and Rules for Buildings; Eurocode 8; European Committee for Standardization: Brussels, Belgium, 2004.
- Minimum Design Loads for Buildings and Other Structures; ASCE/SEI 41-13; American Society of Civil Engineers: Reston, VA, USA, 2014.
- Prestandard and Commentary for the Seismic Rehabilitation of Buildings; American Society of Civil Engineers: Reston, VA, USA, 2000.
- Improvement of Nonlinear Static Seismic Analysis Procedures; FEMA 440; Applied Technology Council: Redwood City, CA, USA, 2005.
- Park, K. State of the art report ductility evaluation from laboratory and analytical testing. In Proceedings of the Ninth World Conference on Earthquake Engineering, Tokyo, Japan, 2–6 August 1988. [Google Scholar]
- Feng, P.; Cheng, S.; Bai, Y.; Ye, L. Mechanical behavior of concrete-filled square steel tube with FRP-confined concrete core subjected to axial compression. Compos. Struct. 2015, 123, 312–324. [Google Scholar] [CrossRef]
- Sun, Y. Study on the Inelastic Displacement Estimation of Aseismatic Structures. Master’s Thesis, Harbin Institute of Technology, Harbin, China, 2006. [Google Scholar]
- Seismic Evaluation and Retrofit of Concrete Buildings; ATC-40; Applied Technology Council: Redwood City, CA, USA, 1996; Volume 1.
- Valles, R.E.; Reinhorn, A.M.; Kunnath, S.K.; Li, C.; Madan, A. Idarc 2D Version 4.0: A Program for the Inelastic Damage Analysis of Buildings; Report No. NCEER-96-0010; National Center for Earthquake Engineering Research, State University of New York at Buffalo: New York, NY, USA, 1996. [Google Scholar]
- Katsanos, E.I.; Sextos, A.G. Inelastic spectra to predict period elongation of structures under earthquake loading. Earthq. Eng. Struct. Dyn. 2015, 44, 1765–1782. [Google Scholar] [CrossRef]
- Zhai, C.; Chang, Z.; Li, S.; Xie, L. Selection of the Most Unfavorable Real Ground Motions for Low- and Mid-rise RC Frame Structures. J. Earthq. Eng. 2013, 17, 1233–1251. [Google Scholar] [CrossRef]
- Li, S.; He, Y.; Wei, Y. Truncation method of ground motion records based on the equivalence of structural maximum displacement responses. J. Earthq. Eng. 2021, 5, 1–22. [Google Scholar] [CrossRef]
- Open System for Earthquake Engineering Simulation (OpenSees). 2016. Available online: https://opensees.berkeley.edu/wiki/index.php/Command_Manual (accessed on 20 February 2022).
- Zhai, C.; Li, S.; Sun, Y. Inelastic displacement ratio spectra for reinforced concrete regular frame structures. Eng. Mech. 2009, 9, 88–94. [Google Scholar] [CrossRef] [Green Version]
- Krawinkler, H.; Seneviratna, G. Pros and cons of a pushover analysis of seismic performance evaluation. Eng. Struct. 1998, 20, 452–464. [Google Scholar] [CrossRef]
- Li, S.; Zuo, Z.; Zhai, C.; Xie, L. Comparison of static pushover and dynamic analyses using RC building shaking table experiment. Eng. Struct. 2017, 136, 430–440. [Google Scholar] [CrossRef]
- Daei, A.; Poursha, M. On the accuracy of enhanced pushover procedures for seismic performance evaluation of code-conforming RC moment-resisting frame buildings subjected to pulse-like and non-pulse-like excitations. Structures 2021, 32, 929–945. [Google Scholar] [CrossRef]
Figure 1.
Shear-building model used to derive the design procedure.
Figure 1.
Shear-building model used to derive the design procedure.
Figure 2.
Schematic diagram of five methods for idealizing the story capacity curves. (a) ATC-40; (b) FEMA 356 (also FEMA 440, ASCE 41-13); (c) 0.75Vy; (d) farthest point; (e) initial stiffness; (f) negative-stiffness region–Case 1; (g) negative-stiffness region–Case 2.
Figure 2.
Schematic diagram of five methods for idealizing the story capacity curves. (a) ATC-40; (b) FEMA 356 (also FEMA 440, ASCE 41-13); (c) 0.75Vy; (d) farthest point; (e) initial stiffness; (f) negative-stiffness region–Case 1; (g) negative-stiffness region–Case 2.
Figure 3.
Flowchart of this paper.
Figure 3.
Flowchart of this paper.
Figure 4.
Elevation of the RC frame structures (Unit: mm) (3-story frame as an example and other frames having same configuration but different numbers of stories).
Figure 4.
Elevation of the RC frame structures (Unit: mm) (3-story frame as an example and other frames having same configuration but different numbers of stories).
Figure 5.
The acceleration spectra of ground motions (PGA = 0.45 g).
Figure 5.
The acceleration spectra of ground motions (PGA = 0.45 g).
Figure 6.
Actual story capacity curves by using IDA method.
Figure 6.
Actual story capacity curves by using IDA method.
Figure 7.
Comparison of actual story capacity curves by IDA and pushover methods (using a 12-story frame as an example).
Figure 7.
Comparison of actual story capacity curves by IDA and pushover methods (using a 12-story frame as an example).
Figure 8.
Idealization of the actual story capacity curves (using 12-story frame as an example).
Figure 8.
Idealization of the actual story capacity curves (using 12-story frame as an example).
Figure 9.
Story drift ratios caculated by beam-column model and five shear-building models. (a) PGA = 0.056 g; (b) PGA = 0.316 g; (c) PGA = 0.45 g; (d) PGA = 0.056 g, 0.316 g, and 0.45 g (maximum within all stories).
Figure 9.
Story drift ratios caculated by beam-column model and five shear-building models. (a) PGA = 0.056 g; (b) PGA = 0.316 g; (c) PGA = 0.45 g; (d) PGA = 0.056 g, 0.316 g, and 0.45 g (maximum within all stories).
Figure 10.
Story accelerations caculated by beam-column model and five shear-building models. (a) PGA = 0.056 g; (b) PGA = 0.316 g; (c) PGA = 0.45 g; (d) PGA = 0.056 g, 0.316 g, and 0.45 g (maximum within all stories).
Figure 10.
Story accelerations caculated by beam-column model and five shear-building models. (a) PGA = 0.056 g; (b) PGA = 0.316 g; (c) PGA = 0.45 g; (d) PGA = 0.056 g, 0.316 g, and 0.45 g (maximum within all stories).
Table 1.
Idealization methods to determine the story backbone curve before the maximum shear point.
Table 1.
Idealization methods to determine the story backbone curve before the maximum shear point.
| No. | Reference | Description of Idealization before Point (Dp, Vp) |
|---|
| 1 | ATC-40 [33] | 1. α1Ke is determined to represent an average stiffness in the range in which the structural strength has leveled off;
2. Ke is determined by constructing a secant line passing through the point on capacity curve corresponding to a shear of 0.6Vy. Vy is the intersection of the Ke and α1Ke lines;
3. The determination of Vy needs iteration to check the point where the Ke line crosses the capacity curve if it is equal to 0.6Vy. |
| 2 | FEMA 356 [28]
FEMA 440 [29]
ASCE 41-13 [27] | This is the same as the ATC-40 method but the α1Ke is not pre-determined. Ke and α1Ke are defined based on the equal-area principle from 0 to the Dp. Iteration is needed in this procedure. |
| 3 | Park [30]
(0.75Vp method) | 1. α1Ke is a leveled line passing the point (Dp, Vp);
2. Ke is a line passing the point on the capacity curve corresponding to a shear of 0.75Vp. |
| 4 | Feng et al. [31]
(farthest point method) | 1. A line is drawn from 0 to the point (Dp, Vp), then the point that has the maximum perpendicular distance from the capacity curve to this line is found. The point is set as (Dy, Vy);
2. Ke and α1Ke can be determined by point (Dy, Vy). |
| 5 | Chopra and Goel [18]
(initial stiffness method) | 1. Ke is set as the initial tangent stiffness.
2. α1Ke is determined by equal-area method from 0 to the point (Dp, Vp). |
Table 2.
Errors of first and second periods calculated by using different models.
Table 2.
Errors of first and second periods calculated by using different models.
| Frame | 3-Story | 8-Story | 12-Story | 18-Story | Average Error |
|---|
| Methods | T1 | T2 | T1 | T2 | T1 | T2 | T1 | T2 | |
|---|
| Idarc | 0.54 | 0.16 | 1.19 | 0.38 | 1.78 | 0.61 | 2.73 | 0.93 | |
| ATC-40 | 0.61
(12.96%) | 0.23
(43.75%) | 1.22
(2.52%) | 0.42
(10.53%) | 1.78
(0.00%) | 0.65
(6.56%) | 2.63
(−3.66%) | 0.96
(3.23%) |
(9.45%) |
| FEMA 356 | 0.61
(12.96%) | 0.23
(43.75%) | 1.21
(1.68%) | 0.42
(10.53%) | 1.79
(0.56%) | 0.66
(8.20%) | 2.68
(−1.83%) | 0.98
(5.38%) |
(10.15%) |
| 0.75Vp | 0.76
(40.74%) | 0.28
(75.00%) | 1.55
(30.25%) | 0.54
(42.11%) | 2.41
(35.39%) | 0.82
(34.43%) | 3.72
(36.26%) | 1.23
(32.26%) |
(40.81%) |
| Farthest point method | 0.83
(53.70%) | 0.32
(100.00%) | 1.53
(28.57%) | 0.55
(44.74%) | 2.41
(35.39%) | 0.87
(42.62%) | 3.33
(21.98%) | 1.21
(30.11%) |
(44.64%) |
| Initial stiffness method | 0.61
(12.96%) | 0.21
(31.25%) | 1.16
(−2.52%) | 0.40
(5.26%) | 1.77
(−0.56%) | 0.66
(8.20%) | 2.73
(0.73%) | 0.93
(10.75%) |
(8.26%) |
Table 3.
Errors of calculated inter-story drift ratios (average value of all the stories).
Table 3.
Errors of calculated inter-story drift ratios (average value of all the stories).
| Error | ATC-40 | FEMA356 | 0.75Vp | Farthest Point | Initial |
|---|
| 0.45 g | 3-story | 23.25% | 23.43% | 35.92% | 42.55% | 25.06% |
| 8-story | 40.82% | 42.26% | 41.95% | 48.40% | 48.51% |
| 12-story | 46.60% | 43.34% | 47.98% | 39.26% | 43.32% |
| 18-story | 61.44% | 63.62% | 54.96% | 58.46% | 56.87% |
| 0.316 g | 3-story | 35.34% | 26.70% | 43.40% | 46.26% | 40.27% |
| 8-story | 26.70% | 33.41% | 29.03% | 28.55% | 32.84% |
| 12-story | 36.26% | 34.11% | 30.90% | 30.69% | 22.84% |
| 18-story | 53.67% | 49.56% | 56.43% | 56.02% | 51.29% |
| 0.056 g | 3-story | 52.12% | 50.98% | 95.47% | 136.81% | 28.00% |
| 8-story | 26.73% | 36.22% | 62.00% | 80.28% | 34.55% |
| 12-story | 53.59% | 68.32% | 109.80% | 109.08% | 50.63% |
| 18-story | 52.06% | 60.24% | 94.44% | 93.37% | 58.47% |
| Average error | | 42.38% | 44.35% | 58.52% | 64.14% | 41.05% |
Table 4.
Errors of calculated inter-story drift ratios (maximum value within all the stories).
Table 4.
Errors of calculated inter-story drift ratios (maximum value within all the stories).
| Error | ATC-40 | FEMA356 | 0.75Vp | Farthest Point | Initial |
|---|
| 0.45 g | 3-story | 18.52% | 16.11% | 2.92% | 3.16% | 24.68% |
| 8-story | 1.49% | 12.71% | 76.82% | 60.41% | 39.65% |
| 12-story | 13.76% | 9.52% | 65.82% | 3.00% | 5.83% |
| 18-story | 59.84% | 63.13% | 33.81% | 14.93% | 61.11% |
| 0.316 g | 3-story | 26.68% | 19.66% | 1.19% | 8.35% | 11.23% |
| 8-story | 3.22% | 26.13% | 12.51% | 2.46% | 20.46% |
| 12-story | 21.98% | 17.07% | 49.51% | 1.85% | 5.38% |
| 18-story | 39.76% | 53.48% | 79.58% | 90.40% | 42.13% |
| 0.056 g | 3-story | 30.84% | 31.59% | 74.28% | 100.43% | 23.42% |
| 8-story | 13.61% | 18.80% | 35.22% | 41.03% | 12.60% |
| 12-story | 48.65% | 64.02% | 106.57% | 95.67% | 46.56% |
| 18-story | 72.74% | 82.50% | 92.04% | 112.71% | 85.10% |
| Average error | | 29.26% | 34.56% | 52.52% | 44.53% | 31.51% |
Table 5.
Errors of calculated story accelerations (average value of all the stories).
Table 5.
Errors of calculated story accelerations (average value of all the stories).
| Error | ATC-40 | FEMA356 | 0.75Vp | Farthest Point | Initial |
|---|
| 0.45 g | 3-story | 43.93% | 43.92% | 47.86% | 42.84% | 39.95% |
| 8-story | 72.65% | 86.11% | 91.02% | 75.89% | 93.60% |
| 12-story | 96.72% | 99.07% | 109.65% | 96.45% | 100.26% |
| 18-story | 147.50% | 151.84% | 159.08% | 142.03% | 151.72% |
| 0.316 g | 3-story | 31.61% | 36.37% | 33.43% | 33.43% | 31.96% |
| 8-story | 65.60% | 74.58% | 86.95% | 75.88% | 82.80% |
| 12-story | 99.81% | 116.21% | 110.90% | 95.01% | 97.55% |
| 18-story | 129.70% | 134.95% | 147.31% | 131.70% | 130.05% |
| 0.056 g | 3-story | 22.34% | 19.97% | 14.93% | 18.02% | 17.81% |
| 8-story | 60.03% | 76.53% | 56.31% | 65.42% | 90.12% |
| 12-story | 116.12% | 106.28% | 98.74% | 96.42% | 119.68% |
| 18-story | 145.84% | 148.44% | 120.21% | 116.45% | 150.51% |
| Average error | | 85.99% | 91.19% | 89.70% | 82.46% | 92.17% |
Table 6.
Errors of calculated story accelerations (maximum value within all the stories).
Table 6.
Errors of calculated story accelerations (maximum value within all the stories).
| Error | ATC-40 | FEMA356 | 0.75Vp | Farthest Point | Initial |
|---|
| 0.45 g | 3-story | 17.25% | 16.56% | 23.41% | 18.50% | 15.77% |
| 8-story | 57.37% | 50.42% | 70.05% | 41.54% | 69.66% |
| 12-story | 71.87% | 75.81% | 84.08% | 74.81% | 74.67% |
| 18-story | 63.77% | 67.55% | 78.99% | 65.51% | 66.09% |
| 0.316 g | 3-story | 6.92% | 10.89% | 7.15% | 7.15% | 7.11% |
| 8-story | 46.88% | 60.71% | 61.15% | 44.76% | 49.66% |
| 12-story | 80.16% | 97.10% | 96.01% | 78.94% | 100.37% |
| 18-story | 76.77% | 89.90% | 79.55% | 72.03% | 84.13% |
| 0.056 g | 3-story | 11.62% | 9.10% | 0.63% | 2.80% | 5.90% |
| 8-story | 45.25% | 76.42% | 54.76% | 58.30% | 85.31% |
| 12-story | 107.53% | 84.77% | 75.12% | 81.40% | 109.88% |
| 18-story | 130.86% | 139.90% | 141.15% | 133.85% | 145.86% |
| Average error | | 59.69% | 64.93% | 64.34% | 56.63% | 67.87% |
| Publisher’s Note: MDPI stays neutral with regard to jurisdictional claims in published maps and institutional affiliations. |
© 2022 by the authors. Licensee MDPI, Basel, Switzerland. This article is an open access article distributed under the terms and conditions of the Creative Commons Attribution (CC BY) license (https://creativecommons.org/licenses/by/4.0/).


