Article

Proportion and Performance Optimization of Lightweight Foamed Phosphogypsum Material Based on an Orthogonal Experiment

1
College of Civil Engineering, Guizhou University, Guiyang 550025, China
2
Department of Civil Engineering, Guiyang College of Information Science and Technology, Guiyang 550025, China
3
Guizhou LianJian Civil Engineering Quality Inspection and Monitoring Center Co., Ltd., Guiyang 550025, China
*
Author to whom correspondence should be addressed.
Buildings 2022, 12(2), 207; https://doi.org/10.3390/buildings12020207
Submission received: 7 January 2022 / Revised: 30 January 2022 / Accepted: 3 February 2022 / Published: 11 February 2022
(This article belongs to the Special Issue Sustainability and Resiliency of Building Materials and Structures)

Abstract

:
A lightweight foam phosphogypsum material (LFPM) was prepared by multi-factor orthogonal and optimization experiments. The effects of foam, quicklime, silica fume and cement on the mechanical and physical properties of this LFPM were studied. The orthogonal experimental results showed that the silica fume content exhibited the most significant effect on the strength of this material, and the cement content exhibited the most obvious influence on the softening coefficient. The comprehensive index analysis indicated that the LFPM with 8% foam, 3.5% quicklime, 3% silica fume and 15% cement was selected as the optimal proportion. The 28 d compressive strength and flexural strength were 3.15 and 0.97 MPa, respectively. The dry density was 809.1 kg/m3, and the 28 d softening coefficient was 0.628. The optimization experimental results showed that the strength and dry density of the sample increased first and then decreased with an increase in the foam stabilizer content. The strength and dry density increased, and water absorption decreased with increasing waterproof agent content.

1. Introduction

Phosphogypsum (PG) is a by-product of solid waste produced from the production of wet-process phosphoric acid; for instance, one ton of phosphoric acid produces 5 tons of phosphogypsum [1,2]. PG is mainly composed of calcium sulfate dihydrate (CaSO4·2H2O), accounting for more than 90% of its structure. In addition, it also contains a small amount of impurities such as phosphoric acid, fluorine, silicon, iron, aluminum and organic matter [2,3,4,5]. Currently, approximately 20–30 billion tons of PG are produced annually, which has created tremendous pressure for environmental protection and has created a huge challenge for its recycling [6]. Large amounts of PG not only occupy a large number of land resources, but they also cause serious pollution problems to soil, water, and the atmosphere, as well as to human settlement environments. Therefore, it is a great challenge for governments and relevant enterprises to accelerate PG consumption and to develop new uses.
Currently, PG is mainly used in the cement industry, construction road industry, agriculture, and sulfuric acid and sulfate industries [7]. PG is mainly used in cement production as a mineralizer, retarder, and activator [8,9,10]. In the most used industry, construction road, PG is mainly used to prepare PG bricks and blocks [11,12,13], paper gypsum board [2], construction gypsum powder [14], road construction [15,16], and mine filling [17]. Due to advantages such as thermal insulation, sound insulation and fire resistance, researchers at home and abroad have paid more attention to the development of new PG building materials in recent years [18]. Among them, lightweight foam phosphogypsum material (LFPM), with a large consumption of gypsum, has many advantages, such as being light weight and having thermal insulation and sound insulation as well as fire resistance [13,19]. Therefore, investigations regarding the properties of LFPMs have attracted considerable attention in the preparation of phosphogypsum materials. In order to use PG to prepare lightweight building materials, Wang et al. [20] added 25% Portland cement, 10–20% fly ash, 10% ground slag, 6% hydrated lime and 60% foam into PG to prepare lightweight building materials with a compressive strength of 1.7 MPa, bulk density of 521.7 kg/m3 and thermal conductivity of 0.0724 w/(m⋅k). Feng et al. [1] studied the effects of foam volume and cement content on thermal conductivity, the water resistance coefficient and the mechanical strength of foamed phosphogypsum, and obtained the effect of the foam content for each performance. Cement can increase thermal conductivity, water resistance and mechanical strength. Additionally, hemihydrate phosphogypsum (HPG), as a base material, is used to prepare composite materials by adding mineral admixtures, alkaline substances, water reducing agents, retarders and cement (Jian Wang [21], Jun Zhou [12], Xiaoyu Guo [22], Zhu Lu [23]). On the basis of this composite material, the foam is used to prepare lightweight phosphogypsum materials. A microscopic analysis was performed to develop well-qualified products meeting the requirements of relevant reference standards. Gypsum exhibits excellent fire resistance, air permeability, sound absorption and decorative effects, which are appropriative to apply to lightweight insulation materials [24,25]. Many researchers have performed numerous studies on the waterproofness of gypsum products and have also made many meaningful achievements [26,27,28,29,30,31]. One fundamental method is to add organic additives (e.g., paraffins, stearic acid and organosilicon) into gypsum materials, which form a waterproof film on the surface of the gypsum crystals to reduce the dissolution rate of gypsum. Another method is to directly incorporate Portland cement, blast furnace slag or active minerals consisting of amorphous silicon into gypsum to produce hydraulically rigid products. These products are wrapped on the surface of the gypsum to reduce its dissolution rate. Another strategy is to directly spray an organic waterproofing agent onto the surface of the gypsum or to cover the waterproofing layer on the surface of the gypsum. However, these techniques, owing to their temporary effects, cannot fundamentally solve the long-term waterproofing and moisture-proofing problems of gypsum products. In addition, the mechanical strength of gypsum is relatively low, and various fibers are usually used as reinforcing materials in gypsum products to improve their mechanical properties [32,33,34,35,36,37]. However, most of these above-mentioned studies were based on compact gypsum. Compared with compact gypsum, foam gypsum has a high porosity and large pore size. Moreover, the effects of water repellents, fibers, and admixtures on gypsum-based foam materials have rarely been reported in the existing studies.
In this work, hemihydrate phosphogypsum (HPG) and raw phosphogypsum (RPG) (70:30) were chosen as the main raw materials. The foam, admixture and other additives were mixed to prepare light phosphogypsum materials to investigate the properties. The material proportion and property optimization were carried out by multi-factor orthogonal experiments and optimization tests. The intuitive, range, analysis of variance and comprehensive analysis were investigated in the orthogonal test to obtain the optimal mix proportion. The effects of additives on the properties of LFPMs were further optimized on the basis of the optimal mix proportion. Moreover, the internal morphology of this LFPM was analyzed by scanning electron microscope (SEM).

2. Materials and Methods

2.1. Materials

(1)
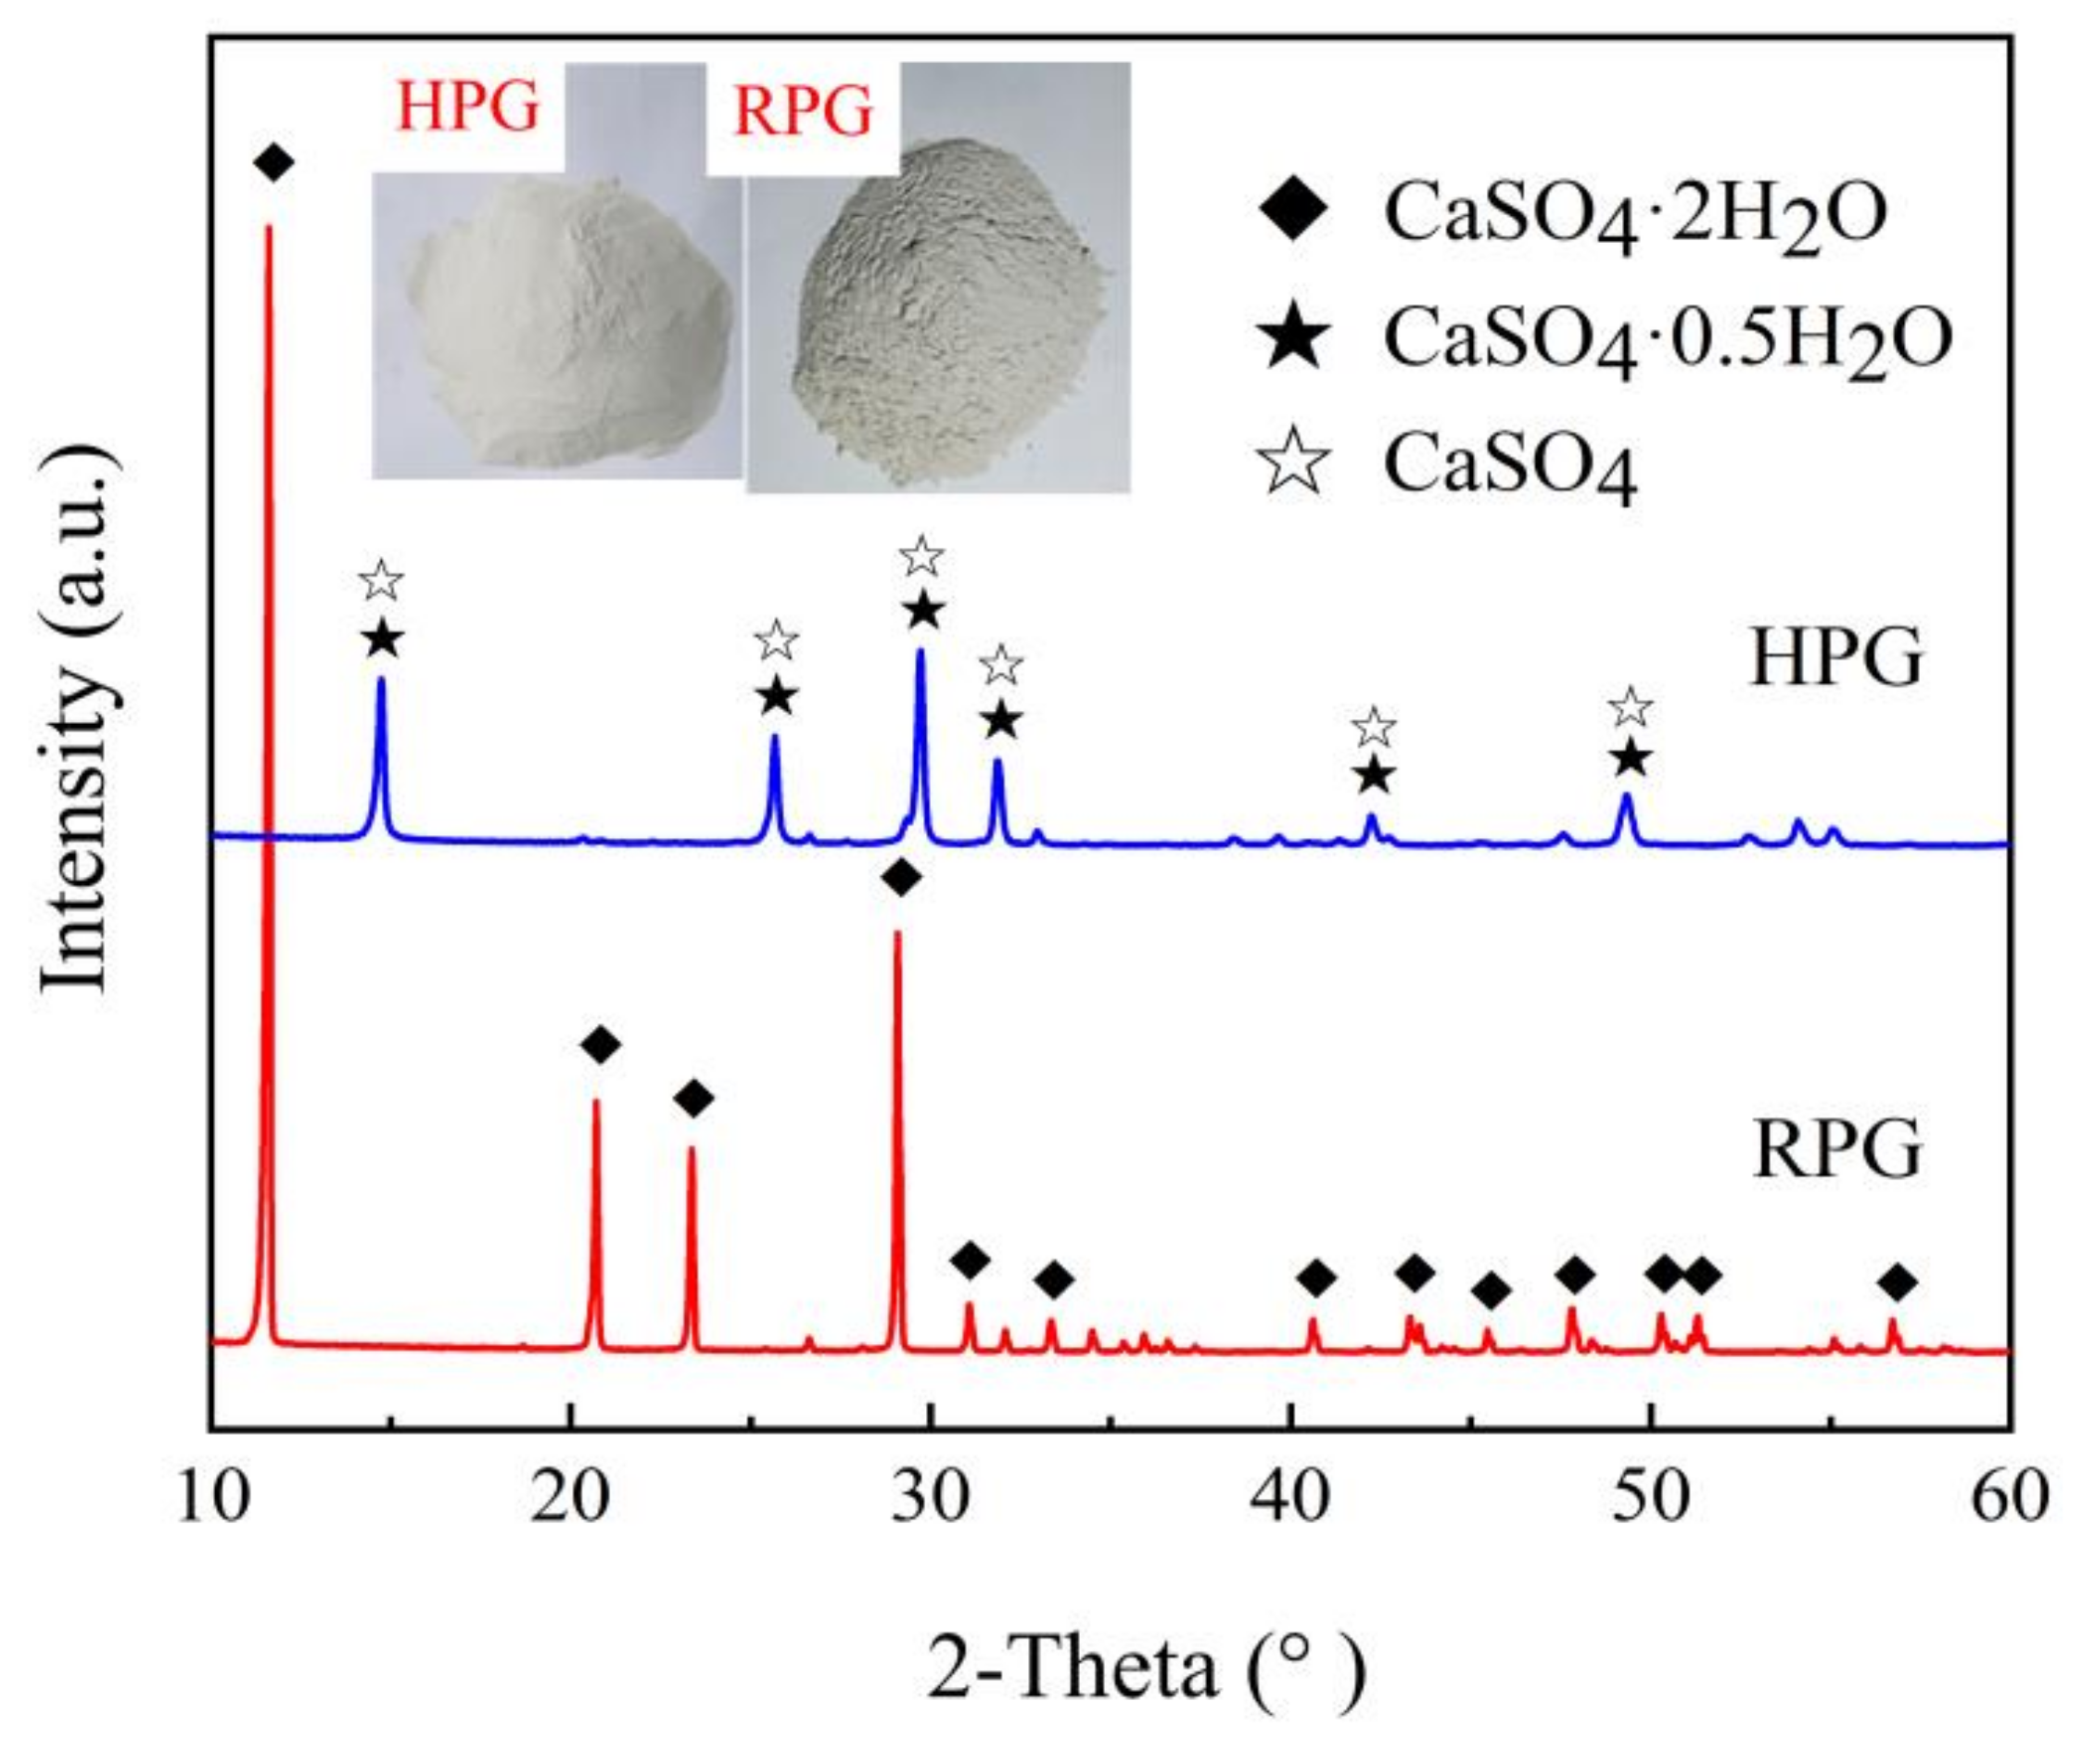
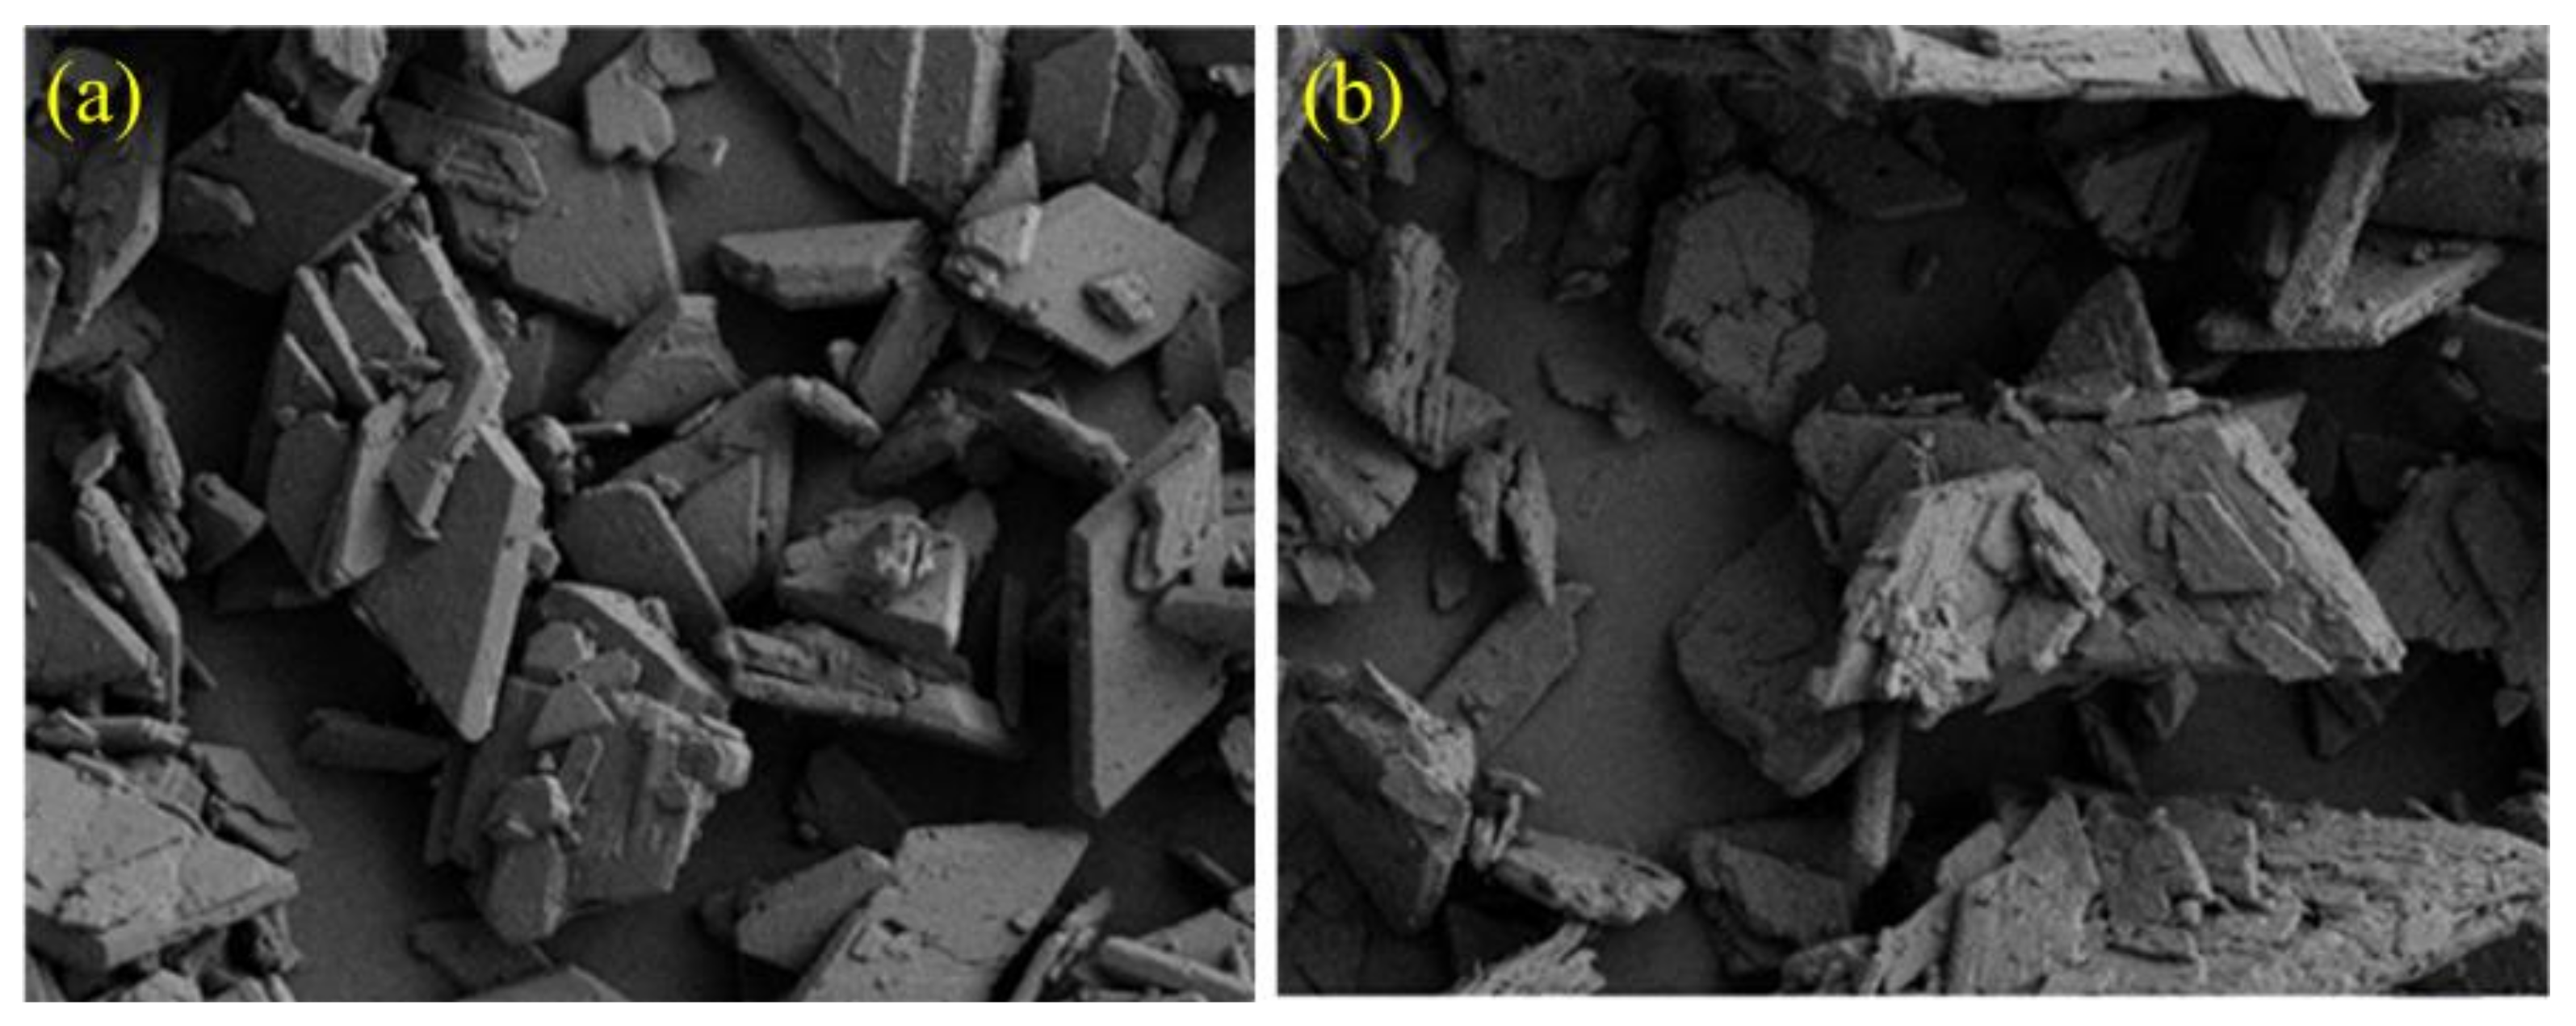
Phosphogypsum (PG) was divided into raw phosphogypsum (RPG) and hemihydrate phosphogypsum (HPG). RPG: from Guizhou Kai Phosphate phosphogypsum Comprehensive Utilization Co., Ltd., Guiyang, China, gray, moisture content 21.98%, PH value 6.8. After natural drying and passing through 0.15 mm square hole sieve for backup use; HPG: placed 0.15 mm RPG in 160 °C oven to bake for 2 h, sealed and aged for about 7 d. The raw material and XRD spectrum of RPG and HPG is given in Figure 1, and the morphology of RPG and HPG from scanning electron microscope (SEM) is listed in Figure 2.
(2)
Cement: PO 42.5 cement purchased from market; silica fume: produced by Gongyi Hengnuo Filter Co., Ltd., Gongyi, China (gray powder); lime: Yibin Chuanhui Biotechnology Co., Ltd., Yibin, China, Production (white powder); water reducing agent: polycarboxylate water reducing agent (powder), Shanghai Chenqi Chemical Technology Co., Ltd., Shanghai, China, Production; foaming agent: polymer compound foaming agent, produced by Hefei Baile Energy Equipment Co., Ltd., Hefei, China, with foaming multiple > 20 times and PH value of 7.2; foam stabilizer: produced by Hengshui Zhongda New Materials Co., Ltd., Hengshui, China; waterproofing agent: redispersible powder, market. The main chemical components of the main raw materials are shown in Table 1.

2.2. Experimental Design

RPG: HPG relative dosage ratio was set to be 3:7 in the experiments, the ratio between water and material was 0.25, and water reducing agent dosage was 0.72%. The dry mass percentage of foam, cement, silica fume and lime was calculated according to experimental requirements.
(1)
Orthogonal experiment
The orthogonal design of the experiment was a method to arrange and analyze experiments with factors and levels utilizing the orthogonal table. Representative tests were selected from all combinations to analyze the comprehensive experiments and to obtain the optimum combination through these test results [38]. In order to study the effect of foam and admixture on the compressive and flexural strength, dry density, and the softening coefficient of the LFPM, a four-factor and four-level orthogonal table L16 (45) was used to design the experimental ratio. The four factors included foam (A), quicklime (B), silica fume (C) and cement (D). The specific values of each factor level are shown in Table 2, and each mass dosage was the proportion fraction of total dry mass. The orthogonal experiment results were discussed from intuitive, range, variance and comprehensive analysis to determine the optimum proportion.
(2)
Optimization experiment
The existing investigations [26,39] indicated that the poor water and moisture resistance of the LFPM limited the application of gypsum. In addition, a large number of bubbles with nonuniform sizes were generated during the early preparation, which had an effect on the property promotion of gypsum-based materials. The foam stabilizer can improve stability and uniformity, and the waterproof agent can reduce the water absorption of the material. Therefore, the influence of the foam stabilizer and waterproof agent on the strength, dry density and softening coefficient of the composites was analyzed. Specifically, based on the recommended optimal mix proportion from orthogonal experiments, foam stabilizer and waterproofing agent were added. According to the relevant references, the foam stabilizer content was 0.1%, 0.2%, 0.3%, 0.4%, 0.5%, and the waterproofing agent content was 1.5%, 3.0%, 4.5%, 6%, 7.5%, respectively. The effect of the dosage on the performance of LFPM was discussed.
(3)
Main test instruments
The test instruments in the present study are listed in Table 3.
(4)
Sample preparation and experimental method
According to the mix proportion of each group, the dry material and additives were poured into the mixing barrel, and the mixing machine was used to evenly stir. After adding water, the foam was poured into the mixing barrel and stirred evenly and then placed into the 100 × 100 × 100 mm and 40 × 40 × 160 mm triple mold, and then vibrated and scraped. After 24 h curing in the natural environment, the molds were removed and maintained for 7, 14, and 28 d and dried to constant weight. The corresponding performance indexes of the specimens at different ages were determined. Dry density and absolute dry compressive strength was measured according to Chinese standard JGT266-2011 foam concrete standard specification [40]. The absolute dry flexural strength was measured according to the Chinese standard GB/T9776-2008 building gypsum determination [41]. The water resistance index softening coefficient test referred to China standard JC/T698-2010 gypsum block [42]. The microstructure was scanned using a scanning electron microscope (SEM, ZEISS MERLIN Compact).

3. Results and Discussions

3.1. Results of Orthogonal Experiments

3.1.1. Intuitive Analysis

After the LFPM samples were cured under natural conditions for 7, 14 and 28 d, the strengths at different ages were measured by compressive and flexural testing machines. Dry density and softening coefficients were measured at 28 d. The test results of compressive strength, flexural strength, dry density and softening coefficient are shown in Table 4.
The strength of the fourth group was highest, and the dry density and softening coefficient were also relatively high. The 28 d compressive and flexural strength reached 4.85 and 1.54 MPa, respectively. The dry density was 885.8 kg/m3, and the 28 d softening coefficient was 0.703. Figure 3 shows the comparison of 7, 14, and 28 d compressive strength, flexural strength, 28 d softening coefficient, and dry density for 16 groups of specimens. From Figure 3a,b, a small strength difference of the LFPM between 14 and 28 d was observed, indicating that most of the hydration reactions were completed after 14 d of curing. In the test, the dry density of the 10th group was 756.7 kg/m3, which was the minimum value in the present study. For the 10th group, the 28 d compressive and flexural strengths were 2.51 and 0.79 MPa, respectively, and the softening coefficient was 0.61.

3.1.2. Range Analysis

The range analysis method refers to the R method [43]. In the analysis of the orthogonal experimental results, the larger the R value of a certain factor, the greater the influence of this factor on the test index. Therefore, the importance of each factor was determined by the R value in this work. The calculation formula of the range (R) is as follows:
K m n = 1 N * i = 1 N p i
R m = max K m 1 , K m 2 , , K m n min K m 1 , K m 2 , , K m n
In the formula: Kmn is the average value of the corresponding index at the n level of the m-th factor; pi is the index value; Rm is the range of factor m.
The compressive strength, flexural strength, dry density and softening coefficient of the LFPM at different ages (7, 14 and 28 d) were analyzed by range analysis, and the corresponding results are summarized in Table 5.
It can be seen from Table 5 that the primary and secondary order of influencing factors of 28 d strength was silica fume > foam > cement > quick lime (C > A > D > B); the primary and secondary order of influencing factors of 14 d strength was silica fume > foam > quicklime > cement (C > A > B > D); the order of influencing factors of 7 d compressive and flexural strength was silica fume > quicklime > foam > cement (C > B > A > D), and silica fume > foam > quicklime > cement (C > A > B > D). Therefore, the silica fume content was the first major factor affecting the early and late strength of LFPM. Foam content was the second major factor on 7 d flexural strength and 14 and 28 d compressive and flexural strengths. Compared with the cement content, the lime content occupied the main position in the early stage, and the influence of cement was more obvious in the later stage. The order of dry density influence factor was silica fume > foam > lime > cement (C > A > B > D). For LFPM, the smaller dry density represented the better property. From Table 4, the influences of various factors on dry density are explained by the range results. The range of silica fume and foam content was between 863.8 and 863.3, which stated that the silica fume and foam content had a primary influence on the dry density. The primary and secondary factors for the softening coefficient were cement > quicklime > silica fume > foam (D > C > B > A). This result can show that cement is a major factor on the softening coefficient of LFPM, followed by silica fume. It can be summarized from Table 5 that the silica fume content has the greatest influence on the compressive strength, flexural strength and dry density of each age. Regarding the above results, the optimal ratio scheme of each performance is listed in Table 5.

3.1.3. Analysis of Variance

Analysis of variance (ANOVA) is the most common statistical processing method for experimental results [38] and is used to determine a significant effect factor of LFPM. ANOVA can distinguish the reason for the result difference between each level of each factor (different factor level or experimental error) [4]. The total variation values in this experiment were composed of four parts: factors A, B, C, and D; thus, the corresponding error variation was calculated. Therefore, the decomposition formula of the square sum and degree of freedom in variance analysis is:
SST = SSA + SSB + SSC+ SSD + SSe
dfT = dfA + dfB + dfC + dfD + dfe
n represents the number of the tests; a, b, c and d represent the level of different factors (A, B, C and D); ka, kb, kc and kd represent the level under repetition of factors A, B, C and D. In this experiment, n = 16, a = b = c = d = 4, ka = kb = kc = kd = 4. The equations from (3) to (9) were utilized to calculate the variation and degrees of freedom caused by factors A–D.
C0 = T2/n
SST = Σx2 − C0
SS A = Σ T A 2 / k a C 0
SS B = Σ T B 2 / k b C 0
SS C = Σ T C 2 / k c C 0
SS D = Σ T D 2 / k d C 0
dfe = dfTdfAdfBdfCdfD
C0 is the correction number; SST is the total sum of squares; SSA is the sum of squares of factor A; SSB is the sum of squares of factor B; SSC is the sum of squares of factor C; SSD is the sum of squares of factor D; dfA, dfB, dfC and dfD are the degrees of freedom of factors A, B, C and D, respectively; dfT is the total degree of freedom; dfe is the degree of freedom of error.
According to the above calculation rules, ANOVA was conducted on the strength, dry density and softening coefficient at 28 d, and the experimental results are shown in Table 6. The meaning of each indicator in Table 6 is as follows: (1) The source of difference comes from the factor, interaction or error. (2) SS is the sum of squares between the factor and error. (3) DF (degree of freedom) is the degree of freedom of each factor, which is the difference between level factor number and 1. Since the degree of freedom of each factor was 4 in the orthogonal experiment, the degree of freedom of each factor was 3. (4) MS (mean square) is the mean square divided by degrees of freedom. (5) The F value is the ratio of two mean squares (effect term/error term). The larger F value (compared with the standard F value at a given significant indigenous level) indicates the more obvious effect (difference). The smaller error term represents the higher test accuracy. The F value is obtained by dividing the effect value MS by the error MS, and the ratio is compared with the critical value F in the table to determine a significant factor. In Table 6, * is indicated in F(0.1). The ANOVA results of the LFPM are shown in Table 6, indicating that the results from the significant variance analysis of different factor influences are consistent with the range analysis results.
The optimal mix ratio of the dry density test was A3B1C1D2 (foam 8%, quicklime 2.5%, silica fume 2%, cement 10%). The optimal proportion for 28 d compressive strength and flexural strength was A1B4C2D4 (7% foam, 4% quicklime, 3% silica fume and 15% cement). The optimal mix proportion of 28 d softening coefficient was A2B4C1D3, (7.5% foam, 4% quicklime, 2% silica fume and 12.5% cement). The critical value of F(0.1) was 5.39; therefore, cement and silica fume content have significant effects on the 28 d softening coefficient at F(0.1) and have no obvious effect on 28 d strength and dry density.

3.1.4. Comprehensive Analysis

The orthogonal experimental results of the LFPM were comprehensively analyzed for each performance index to obtain the optimal mix proportion. The 28 d compressive strength, flexural strength, dry density and 28 d softening coefficient were selected as performance indexes. The compressive strength and dry density were the main indexes, and the flexural strength and softening coefficient were the secondary indexes. The influences of various factors on 28 d compressive strength, flexural strength, dry density and softening coefficient of this material are shown in Figure 4.
It can be seen from Figure 4a,b that with the increase in foam content, the compressive and flexural strengths decreased and increased slightly at a foam content of 8%. The softening coefficient fluctuated up and down, and the range of softening coefficient of the LFPM was 0.04 in the range analysis, illustrating a small effect. However, the minimum dry density appeared at the foam content of 8%. The dry density and compressive strength were considered first to select the optimal dosage. Therefore, the foam content was selected to be 8.0% according to the experimental results of the dry density, compressive strength and flexural strength.
Figure 4c,d shows that the compressive strength and dry density increased significantly with an increase in lime content. The flexural strength and softening coefficient decreased at first and then increased significantly with an increase in lime content. When the content of quicklime was 4%, the properties of the composites reached the maximum value, and the compressive strength, flexural strength, dry density and softening coefficient were 3.34 MPa, 1.02 MPa, 850.6 kg/m3 and 0.676, respectively. However, when the content was 4%, some microcracks were observed on the surface, which affected the smoothness and cleanliness of the specimen. This was because excessive lime was added to generate needle-column calcium vanadate and a large number of C-S-H gel expanded, causing microcracks. However, when the lime content was 3.5%, the surface of the LFPM specimen was smooth and tidy, and fewer microcracks were observed. Moreover, at a content of 3.5%, the compressive strength, flexural strength, dry density and softening coefficient were 2.95 MPa, 0.95 MPa, 825.3 kg/m3 and 0.654, respectively. Compared with the content of 4%, the flexural strength and softening coefficient exhibited small differences, and the dry density decreased by 25.3 kg/m3. Therefore, the lime content was selected to be 3.5% in this study.
Figure 4e,f shows the effects of the silica fume content on the compressive strength, dry density, flexural strength and softening coefficient of the LFPM. The dry density, compressive strength and flexural strength first increased rapidly and then decreased at the transition content of 3%. Although the dry density of this material was highest at 3% content, the compressive and flexural strength reached the maximum value (3.59 and 1.12 MPa). Moreover, the softening coefficient appeared to be a rapid reduction as the content exceeded 3% from Figure 4f. When the appropriate amount of silica fume was added in the excitation of the alkaline environment, due to the good chemical activity and micro-aggregate effect of silica fume [44], the main component SiO2 quickly reacted with Ca (OH)2 to generate a large number of C-S-H gels, which compacted the internal structure of the matrix, improving the dry density and strength of the LFPM. However, excessive silica fume can result in hydration heat generated by the chemical reaction inside the sample to produce temperature stress. The higher temperature stress can lead to the microcracks at the interfaces, which was seen to reduce the strength of materials. Therefore, the optimal content of silica fume was 3% according to the effect of silica fume content on the compressive and flexural strength of the LFPM.
From Figure 4g,h, the softening coefficient of this material increased until 12.5% with an increase in cement content and exhibited a slight decrease at 15%. The compressive strength and flexural strength exhibited a decrease at 10% content and increased during the content range from 10% to 15%. Additionally, the dry density fluctuated up and down during the range from 10% to 15%. The appropriate addition of cement hydrated to form acicular and reticular ettringite crystals; therefore, the strength and softening coefficient of the LFPM increased due to the high hardness of the ettringite crystals [22]. The hydration process of the cement absorbed water; thus, the water demand of the material relatively increased. Ordinary Portland cement, as an additive, improved the water resistance of phosphogypsum in the LFPM and increased the compactness of the gypsum products [45]. The tricalcium aluminate hydrated in Portland cement to form calcium aluminate crystals, and SO42 − ionized by CaSO4·2H2O in the calcium aluminate crystal binding system to form ettringite crystals. The chemical reaction formula is shown in Equation (12). Therefore, the strength and softening coefficient of this composite can improve by adding an appropriate amount of cement. At the cement content of 15%, the compressive strength, flexural strength and dry density was 3.37 MPa, 1.04 MPa and 815 kg/m3, respectively. Therefore, the optimal dosage of 15% was determined from the softening coefficient and strength results.
3 CaO Al 2 O 3 + 3 CaSO 4 2 H 2 O + 26 H 2 O 3 CaO Al 2 O 3 3 CaSO 4 32 H 2 O
Based on the effects of the above factors on the performance of the LFPM, the optimal mix proportion of various factors was determined to be A3B3C2B4 from the orthogonal experiments of the LFPM; namely, the foam content was 8%, the lime content was 3.5%, the silica fume content was 3%, and the cement content was 15%. In order to verify this mixture ratio, the verification experiments were conducted on the A3B3C2B4 specimen, and the experimental results are summarized in Table 7. These data revealed that the performance parameters of A3B3C2B4 can meet the standard requirements of A09- and C3-qualified products in JGT266-2011 foam concrete. The test block with the smooth surface of foamed phosphogypsum material prepared under the combination ratio of A3B3C2B4 is shown in Figure 5.

3.2. Optimization Experimental Results

3.2.1. Results analysis

Table 8 and Table 9 give the experimental results of A3B3C2B4 specimens with foam stabilizer and waterproofing agents, respectively. The effects of foam stabilizer content and waterproofing agent content on the performance parameters are summarized in Figure 6.
It can be seen from Table 8 and Figure 6a,b that with the increase in foam stabilizer, the strength and dry density first increased and then decreased, and the softening coefficient increased. The appropriate foam stabilizer made the foam more stable and uniform and made the internal structure denser. As the foam stabilizer content was 0.2%, the compressive strength, flexural strength and dry density at 7 and 28 d reached the maximum value. The compressive and flexural strengths at 28 d were 4.08 and 1.26 MPa, respectively. The dry density was 830.3 kg/m3, and the softening coefficient was 0.6. It was suggested that the optimal content of the foam stabilizer was located in the range from 0.1% to 0.2%. From Table 9 and Figure 6c,d, the waterproof agent content exhibited a significant effect on the performance of the foamed phosphogypsum material. With an increase in the waterproof agent content, the strength, dry density and water absorption increased; however, the softening coefficient decreased. This was because the waterproof agent (latex powder) dispersed in water enhanced the flexibility and adhesion of the material, thereby increasing the strength of the material [13]. Moreover, the bubbles became smaller and denser, and the distribution was more uniform, reducing the porosity of the material. Additionally, the hydrophobicity of the waterproofing agent resulted in a decrease in water. Therefore, the dry density of the LFPM increased. At 6% waterproofing agent, the 28 d compressive strength and flexural strength reached 8.6 and 2.77 MPa, respectively, the dry density was 1014 kg/m3, and the water absorption was 0.238. However, it was recommended that the dry density of this material remain lower than 900 kg/m3; therefore, the content of waterproofing agent was considered in the range from 2% to 4.5%.

3.2.2. Microstructure Analysis

The microstructures of the blank group sample, the A3B3C2B4 sample with 0.2% foam stabilizer, and the A3B3C2B4 with 3% waterproof agent were obtained by scanning electron microscope (SEM) as shown in Figure 7.
It can be seen from the SEM images, magnified 100 times, in Figure 7a–c that the size of cell in the sample after adding foam stabilizer and waterproofing agent became more uniform and fuller. The number of string holes decreased obviously, and the filler between the cells increased. These mechanisms led to an increase in the dry density and strength of the A3B3C2B4 LFPM sample. Moreover, from Figure 7d–f, the samples with foam stabilizer and waterproofing agent possessed thicker and denser pore walls and more needle-like substances and crystals. This observed effect was significantly increased in the samples with waterproofing agent, which made the materials more compact and the pores more stable through enhancing the flexibility and adhesion of materials.

4. Conclusions

The lightweight foam phosphogypsum material (LFPM) was prepared, and its properties were investigated using the multi-factor orthogonal and optimization experiments. The effects of foam, quicklime, silica fume and cement on the mechanical and physical properties of this LFPM were discussed. The optimal proportion of this material was determined to study the effects of the foam stabilizer content and waterproofing agent content. The main conclusions are summarized as follows:
(1)
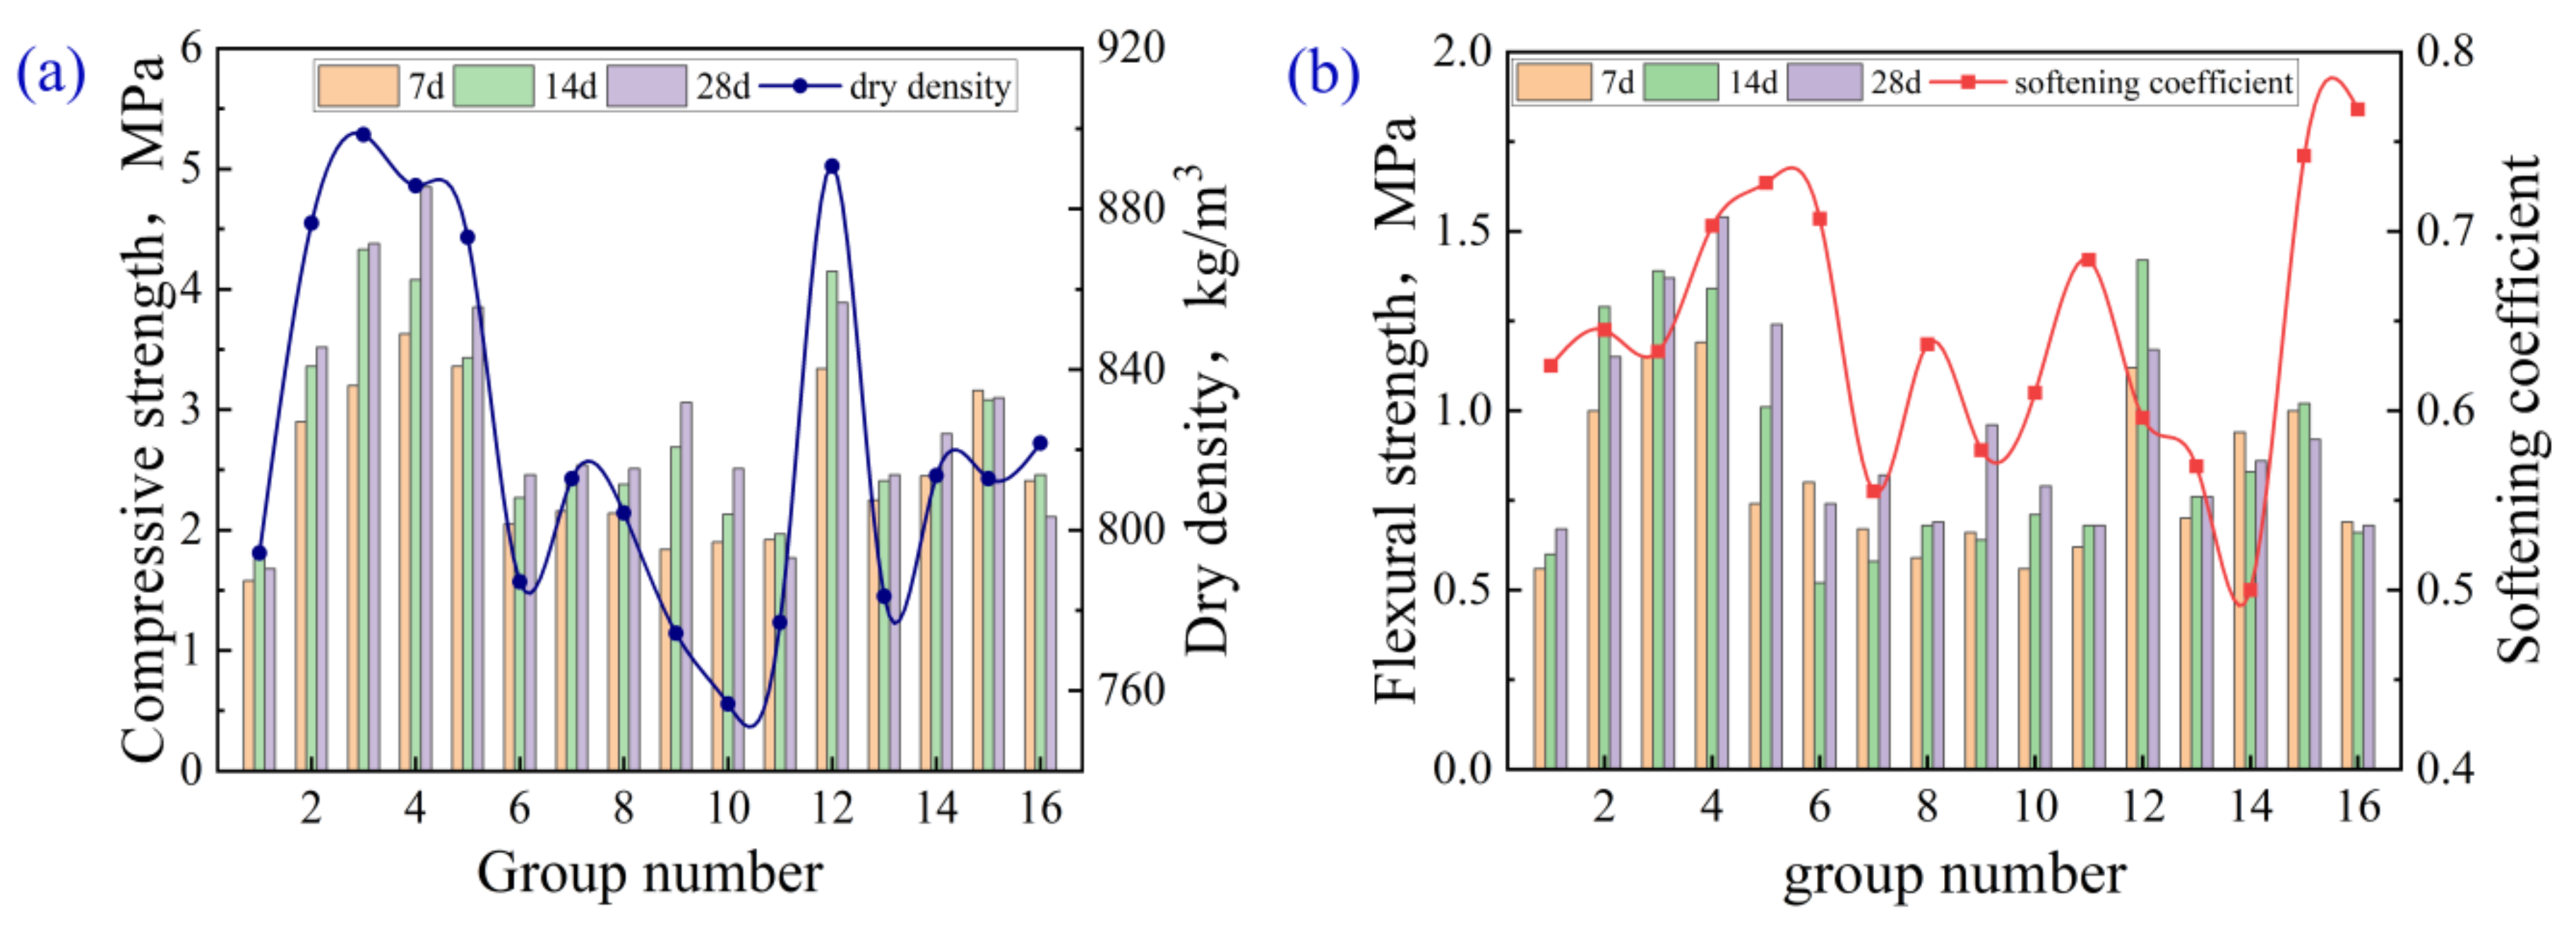
The orthogonal experimental results showed that the LFPM with 7% foam, 4% quicklime, 5% silica fume and 15% cement (A1B4C4D4) exhibited the highest strength and dry density. The 28 d compressive strength and flexural strength reached 4.85 and 1.54 MPa, respectively, and the dry density was 885.8 kg/m3.
(2)
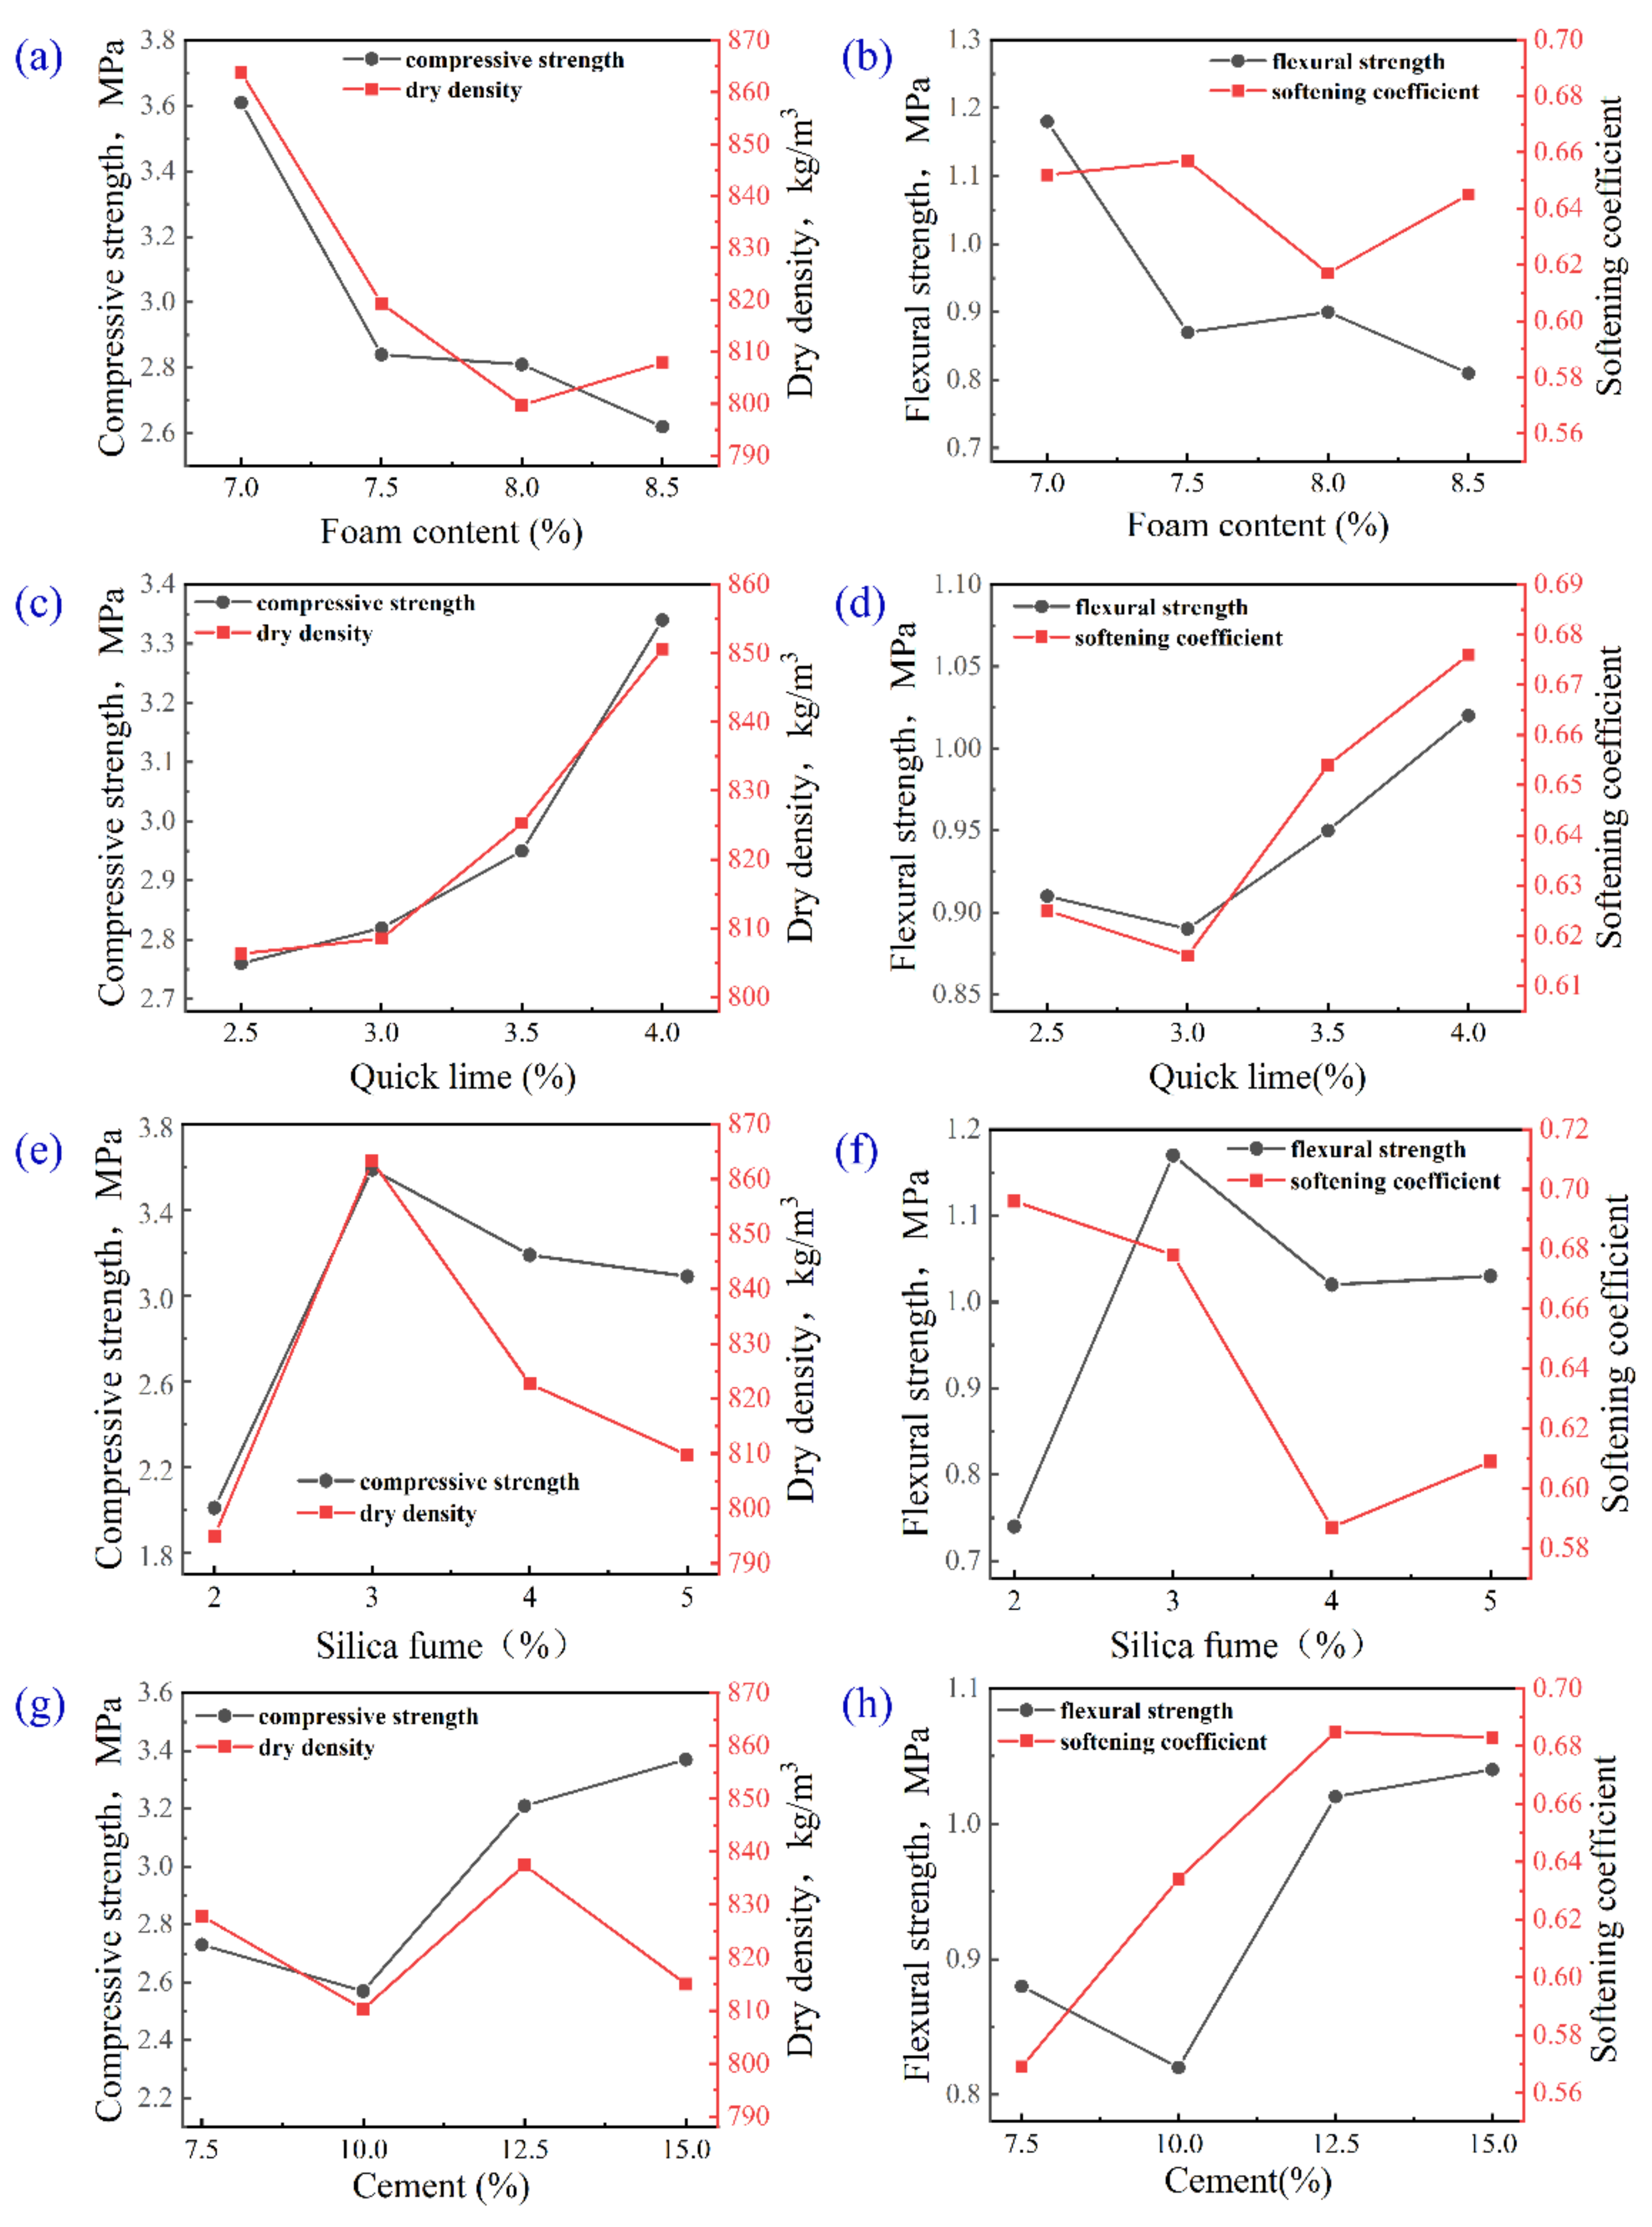
The effects of the various factors were discussed through intuitive analysis and range analysis, which indicated that the silica fume had the greatest impact on the strength of the LFPM at the early and late stages, followed by foam content. Cement can improve the later strength, and the cement content exhibited the greatest influence on the softening coefficient of this material. The results of the range analysis and intuitive analysis showed that the optimal proportion of the dry density test scheme was A3B1C1D2 (8% foam, 2.5% quicklime, 2% silica fume and 10% cement), the optimum proportion of the 28 d compressive and flexural strengths test scheme was A1B4C2D4 (7% foam, 4% quicklime, 3% silica fume and 15% cement), and the optimal proportion of the 28 d softening coefficient was A2B4C1D3 (7.5% foam, 4% quick lime, 2% silica fume and 12.5% cement). The influences of the cement content and silica fume content exhibited remarkable influence on the softening coefficient of this material.
(3)
The orthogonal experimental results stated that the optimal proportion was A3B3C2B4 (8% foam content, 3.5%lime content, 3% silica fume content, 15% cement content). The compressive and flexural strengths of the mixture at 28 d were 3.15 and 0.97 MPa, respectively, and the dry density and the 28 d softening coefficient were 809.1 kg/m3 and 0.628, respectively. The performances of A3B3C2B4 LFPM meet the standard requirements of A09-and C3-qualified products in JGT266-2011 foam concrete.
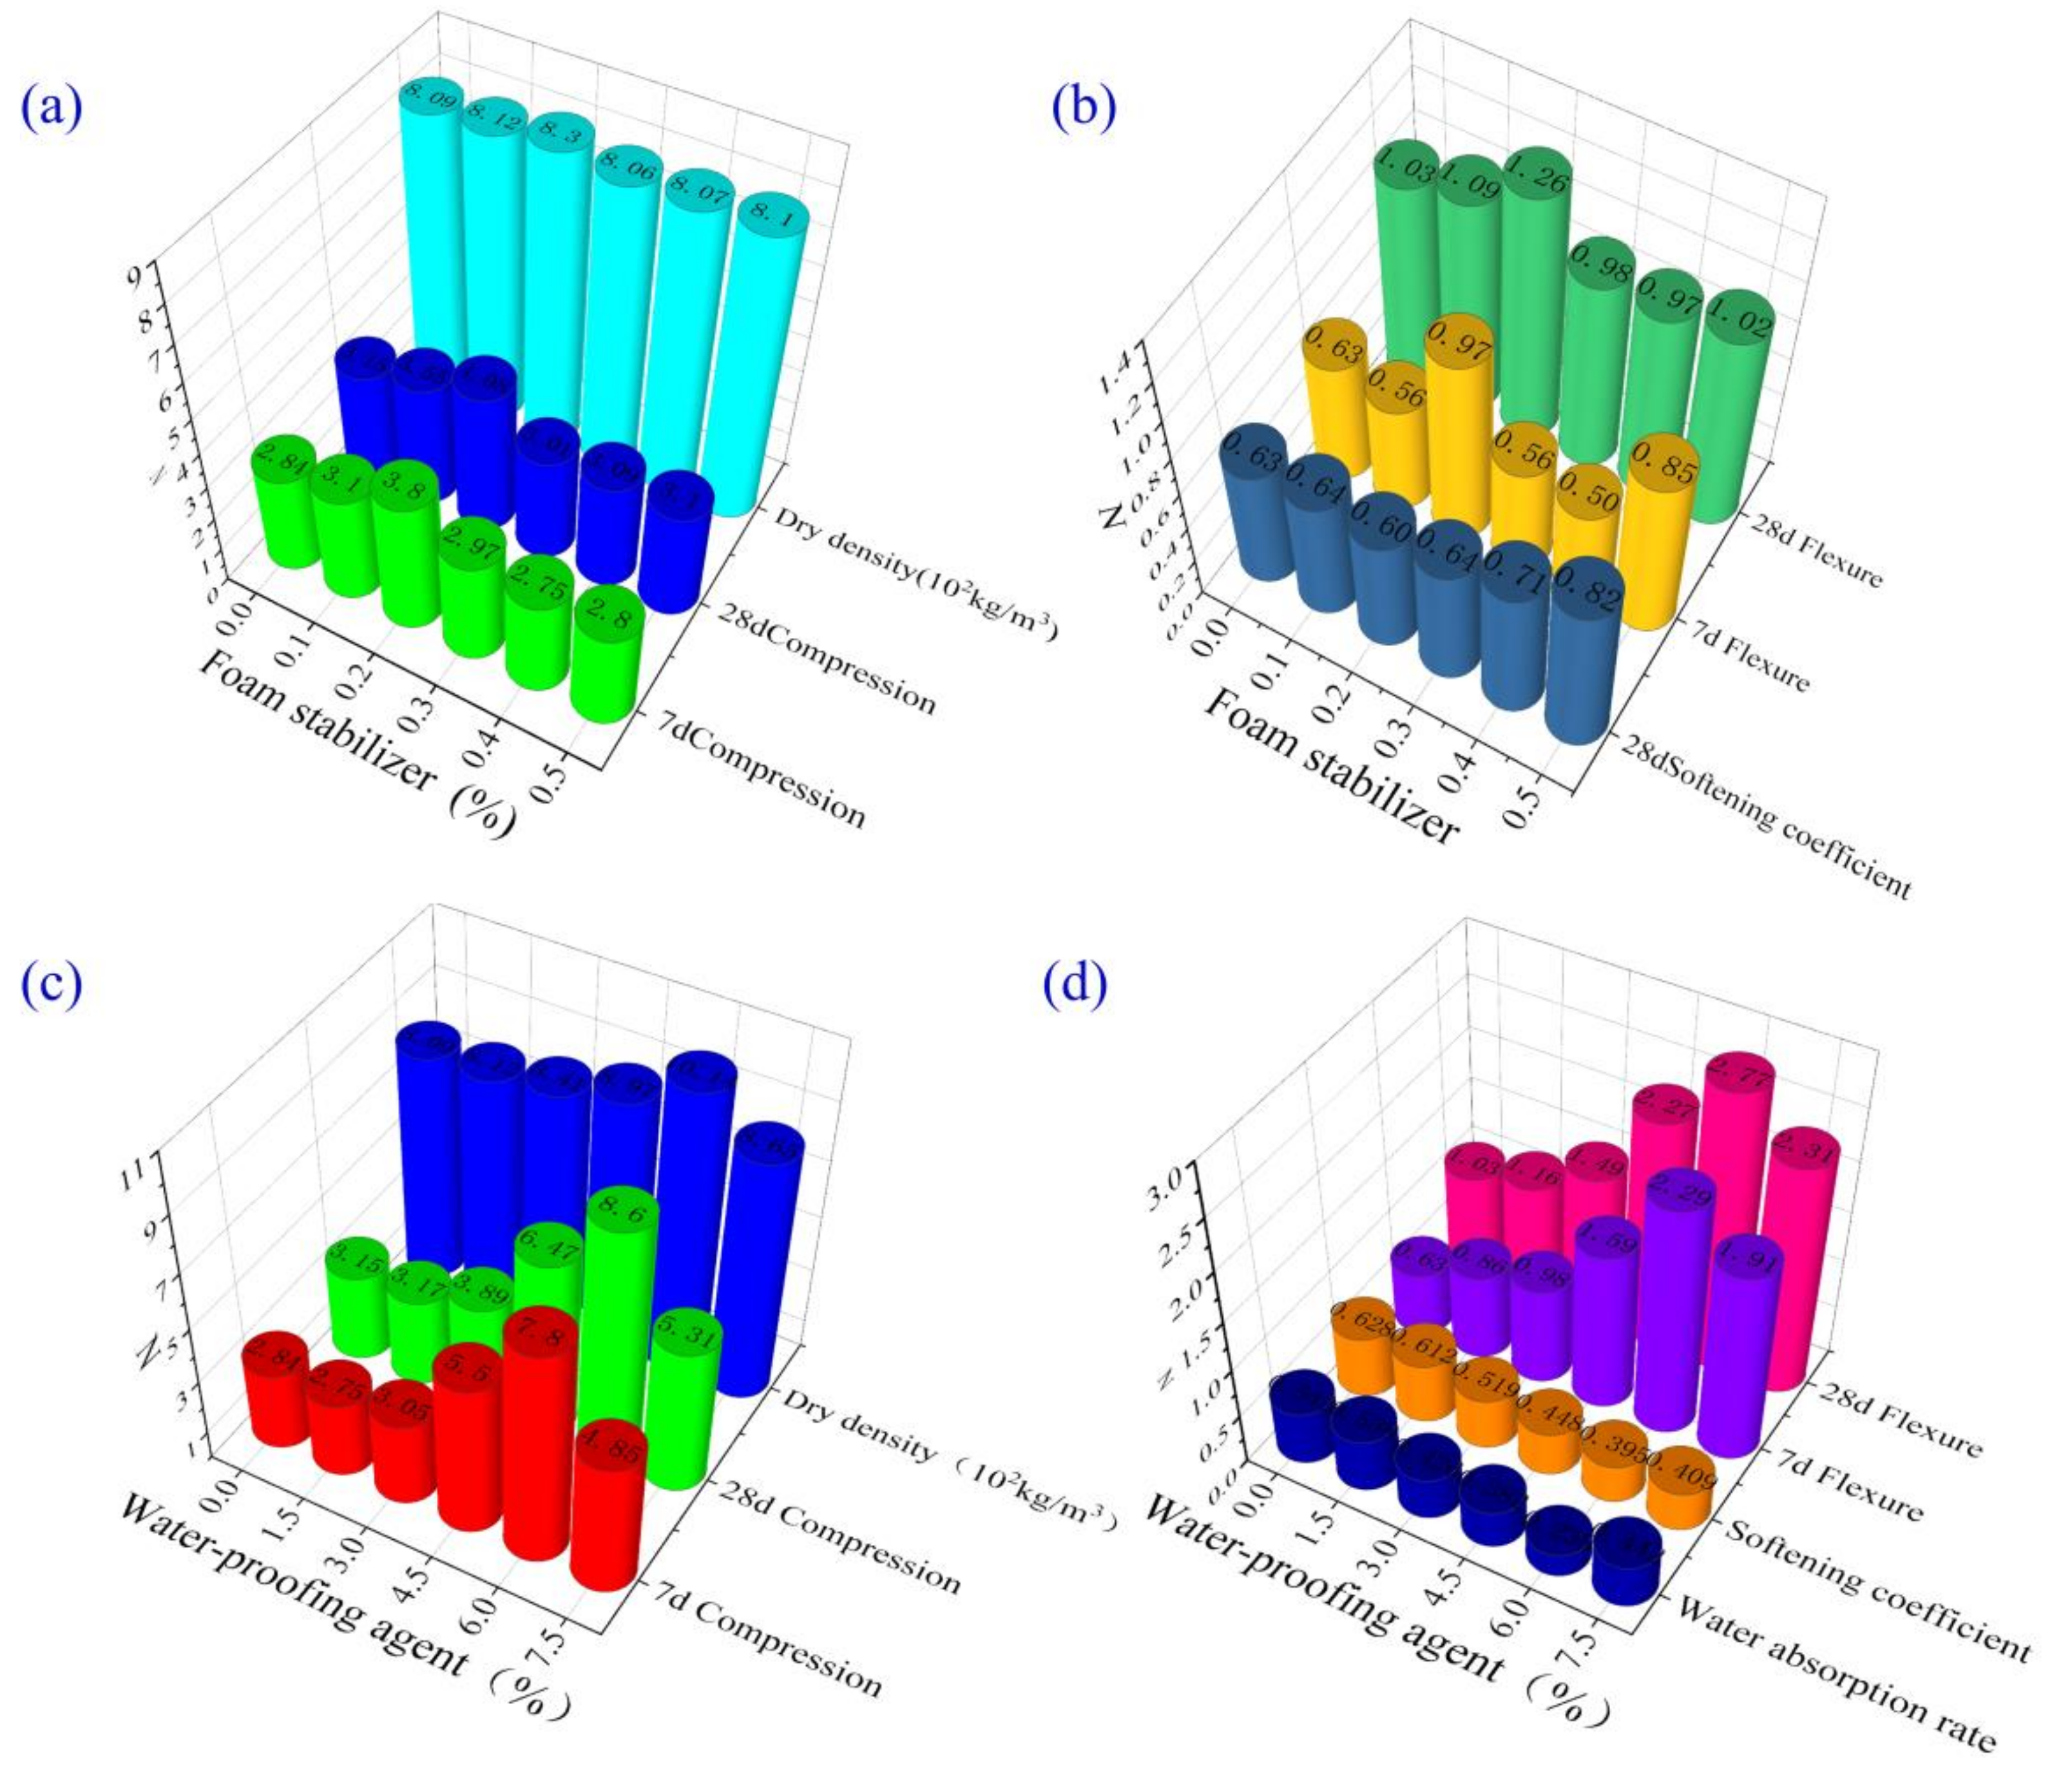
(4)
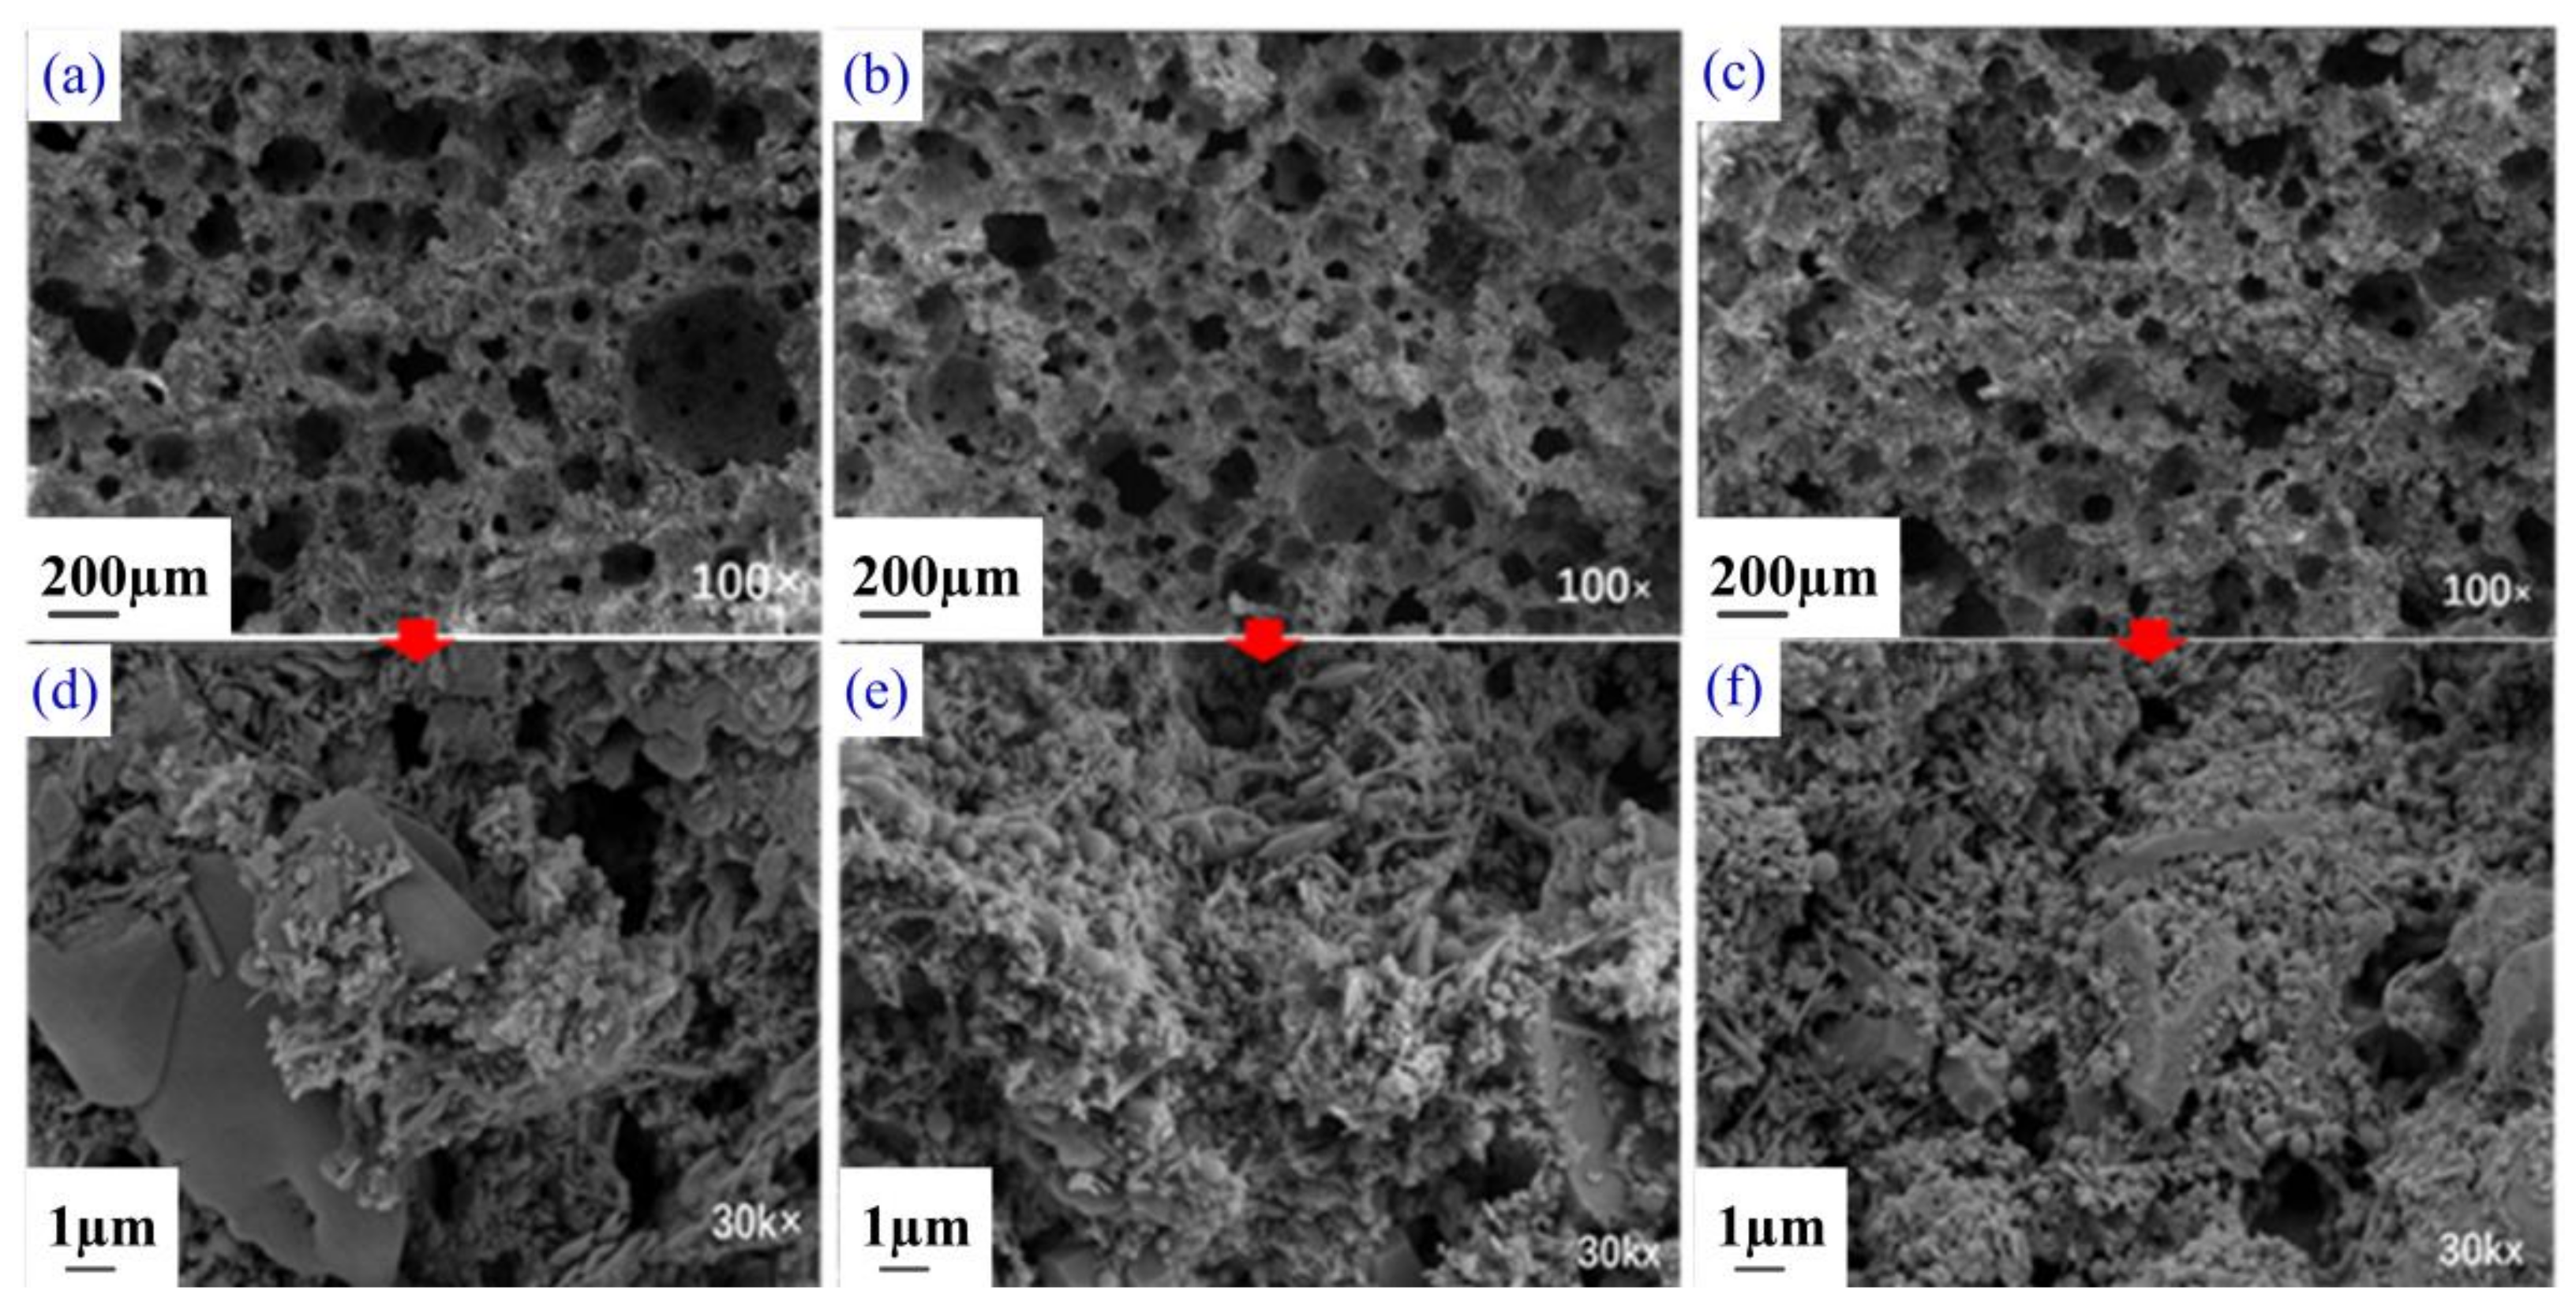
The optimization test results showed that the foam stabilizer and waterproof agent dosage had obvious influences on the properties of LFPM. At the foam stabilizer dosage of 0.2%, the compressive and flexural strengths were 4.08 and 1.26 MPa, respectively, the dry density was 830.3 kg/m3, and the softening coefficient was 0.6. Compared with the properties of the material without foam stabilizer, the compressive and flexural strengths increased by nearly 30%; however, the dry density only increased by 2%. It was suggested that the optimum dosage of the foam stabilizer was in the range from 0.1% to 0.2%. At the waterproofing agent dosage of 6%, the 28 d compressive strength and flexural strength were 8.6 and 2.77 MPa, respectively. Moreover, the dry density was 1014 kg/m3, and the water absorption was 0.238. The compressive strength and flexural strength increased by 173% and 186%, respectively, and the water absorption reduced by 56%. Comprehensive analysis suggested that the dosage of waterproofing agent ranged from 2% to 4.5%. Additionally, microscopic analysis showed that the increase in density and strength of the LFPM was caused by the more uniform size and the reduction in the number of holes.
(5)
The LFPM in this paper had good characteristics in new building materials. The use of RPG was economical and practical and improved the utilization rate of phosphogypsum.

Author Contributions

Data curation, T.Z.; Formal analysis, L.C.; Funding acquisition, D.K.; Investigation, T.Z. and X.M.; Methodology, X.M.; Project administration, D.K.; Resources, K.Y.; Supervision, L.W.; Writing—original draft, T.Z.; Writing—review and editing, D.K. All authors have read and agreed to the published version of the manuscript.

Funding

This research was funding by the National Natural Science Foundation of China (grant number 51968009 and 52168027), Science and Technology Planning Project of Guizhou Province (grant number (2020)1Y244 and (2021)4023) and Civil Engineering First-Class Discipline Construction Project of Guizhou Province (grant number QYNYL (2017)0013).

Institutional Review Board Statement

Not applicable.

Informed Consent Statement

Not applicable.

Data Availability Statement

Not applicable.

Conflicts of Interest

The authors declare no conflict of interest.

Abbreviations

PGphosphogypsum
RPGraw phosphogypsum
HPGhemihydrate phosphogypsum
LFPMlightweight foam phosphogypsum material
SEMscanning electron microscope
XRDX-ray diffraction
R methodrange analysis method
ANOVAanalysis of variance
SSsum of squares
DFdegree freedom
MSmean square

References

  1. Feng, L.; Jin, K.; Wang, H. Research on the Thermal Conductivity and Water Resistance of Foamed Phosphogypsum. Coatings 2021, 11, 802. [Google Scholar] [CrossRef]
  2. Zhou, J.; Li, X.; Zhao, Y.; Shu, Z.; Wang, Y.; Zhang, Y.; Shen, X. Preparation of paper-free and fiber-free plasterboard with high strength using phosphogypsum. Constr. Build. Mater. 2020, 243, 118091. [Google Scholar] [CrossRef]
  3. Fornés, I.V.; Vaiiukynien, D.; Nizeviien, D.; Dorosevac, V.; Michalik, B. A comparative assessment of the suitability of phosphogypsum from different origins to be utilised as the binding material of construction products. J. Build. Eng. 2021, 44, 102995. [Google Scholar] [CrossRef]
  4. Zhang, L.; Zhang, A.; Li, K.; Wang, Q.; Han, Y.; Yao, B.; Gao, X.; Feng, L. Research on the pretreatment and mechanical performance of undisturbed phosphogypsum. Case Stud. Constr. Mater. 2020, 13, e00400. [Google Scholar] [CrossRef]
  5. Rashad, A.M. Phosphogypsum as a construction material. J. Clean. Prod. 2017, 166, 732–743. [Google Scholar] [CrossRef]
  6. Cao, Y.; Cui, Y.; Yu, X.; Li, T.; Chang, I.; Wu, J. Bibliometric analysis of phosphogypsum research from 1990 to 2020 based on literatures and patents. Environ. Sci. Pollut. Res. 2021, 28, 66845–66857. [Google Scholar] [CrossRef]
  7. Liu, L.; Zuo, H.; Xu, Z. Resource utilization approach of industrial gypsum and its prospect. Inorg. Chem. Ind. 2021, 53, 1–9. (In Chinese) [Google Scholar]
  8. Liu, S.; Fang, P.; Ren, J.; Li, S. Application of Lime Neutralised Phosphogypsum in Supersulfated Cement. J. Clean. Prod. 2020, 272, 122660. [Google Scholar] [CrossRef]
  9. Jin, Z.; Ma, B.; Su, Y.; Lu, W.; Qi, H.; Hu, P. Effect of calcium sulphoaluminate cement on mechanical strength and waterproof properties of beta-hemihydrate phosphogypsum. Constr. Build. Mater. 2020, 242, 118198. [Google Scholar] [CrossRef]
  10. Zeng, L.L.; Bian, X.; Zhao, L.; Wang, Y.J.; Hong, Z.S. Effect of phosphogypsum on physiochemical and mechanical behaviour of cement stabilized dredged soil from Fuzhou, China. Geomech. Energy Environ. 2020, 25, 100195. [Google Scholar] [CrossRef]
  11. Shi, Y. Study on Preparation Technology of Cement-Based and Phosphogypsum-Based Foams. Ph.D. Thesis, Kunming University of Science and Technology, Kunming, China, 2020. (In Chinese). [Google Scholar]
  12. Zhou, J.; Hui, G.; Zhu, S.; Wang, Y.; Yan, C. Utilization of waste phosphogypsum to prepare non-fired bricks by a novel Hydration–Recrystallization process. Constr. Build. Mater. 2012, 34, 114–119. [Google Scholar] [CrossRef]
  13. Wang, G. Experimental Study on Fit Ratio and Basic Properties of Foamed Phosphogypsum Wall Material. Ph.D. Thesis, Zhengzhou University, Zhengzhou, China, 2019. (In Chinese). [Google Scholar]
  14. Zhang, K. Study on Preparation of Building Gypsum Powder by Modifying Agent—Calcination Combined with Modified Wet Fluoro Gypsum. Ph.D. Thesis, Central South University, Changsha, China, 2013. (In Chinese). [Google Scholar]
  15. Amrani, M.; Taha, Y.; Kchikach, A.; Beznaazoua, M.; Hakkou, R. Phosphogypsum recycling: New horizons for a more sustainable road material application. J. Build. Eng. 2020, 30, 101267. [Google Scholar] [CrossRef]
  16. Folek, S.; Walawska, B.; Wilczek, B.; Miskiewicz, J. Use of phosphogypsum in road construction. Pol. J. Chem. Technol. 2011, 13, 18–22. [Google Scholar] [CrossRef] [Green Version]
  17. Jiang, G.; Wu, A.; Wang, Y.; Lan, W. Low cost and high efficiency utilization of hemihydrate phosphogypsum: Used as binder to prepare filling material. Constr. Build. Mater. 2018, 167, 263–270. [Google Scholar] [CrossRef]
  18. Liu, F.; Wu, J.; Wang, C. Study on properties of yellow phosphorus slag—Phosphogypsum composite cementitious material. Mater. Rep. 2007, 5, 530–532. (In Chinese) [Google Scholar]
  19. Shi, C. The Research on Preparation and Performance of Gypsum-Based Foam Insulation Material. Ph.D. Thesis, Hunan University, Changsha, China, 2016. (In Chinese). [Google Scholar]
  20. Wang, T.; Gao, X.J.; Wang, J. Preparation of Foamed Phosphogypsum Lightweight Materials by Incorporating Cementitious Additives. Mater. Sci. 2019, 25, 340–347. [Google Scholar] [CrossRef] [Green Version]
  21. Wang, J. Preparation and Basic Properties of Foamed Phosphogypsum Lightweight Material. Ph.D. Thesis, Harbin Institute of Technology, Harbin, China, 2016. (In Chinese). [Google Scholar]
  22. Guo, X.; Singh, S.K.; Zhou, C.; Ling, X.; Li, J.; Fan, C. Preparation and Characterization of Lightweight Wall Materials Based on a Binder Mainly Including Phosphor-gypsum. J. Adv. Concr. Technol. 2020, 18, 689–698. [Google Scholar] [CrossRef]
  23. Zhu, L. Preparation and properties of phosphogypsum-based functional foam gypsum. Ph.D. Thesis, Wuhan University of Technology, Wuhan, China, 2018. (In Chinese). [Google Scholar]
  24. Karni, J.; Karni, E. Gypsum in construction: Origin and properties. Mater. Struct. 1995, 28, 92–100. [Google Scholar] [CrossRef]
  25. Lushnikova, N.; Dvorkin, L. Sustainability of gypsum products as a construction material. Sustain. Constr. Mater. 2016, 25, 643–681. [Google Scholar]
  26. Kondratieva, N.; Barre, M.; Goutenoire, F.; Sanytsky, M. Study of modified gypsum binder. Constr. Build. Mater. 2017, 149, 535–542. [Google Scholar] [CrossRef]
  27. Li, J.; Li, G.; Yu, Y. The influences of gypsum water-proofing additive on gypsum crystal growth. Mater. Lett. 2007, 61, 872–876. [Google Scholar] [CrossRef]
  28. Singh, M.; Garg, M. Investigation of a durable gypsum binder for building materials. Constr. Build. Mater. 1992, 6, 52–56. [Google Scholar] [CrossRef]
  29. Singh, M.; Garg, M.; Rehsi, S. Durability of phosphogypsum based water-resistant anhydrite binder. Cem. Concr. Res. 1990, 20, 271–276. [Google Scholar] [CrossRef]
  30. Magallanes-Rivera, R.; Juarez-Alvarado, C.; Valdez, P.; Mendoza-Rangel, J.M. Modified gypsum compounds: An ecological-economical choice to improve traditional plasters. Constr. Build. Mater. 2012, 37, 591–596. [Google Scholar] [CrossRef]
  31. Singh, M.; Garg, M. Relationship between mechanical properties and porosity of water-resistant gypsum binder. Cem. Concr. Res. 1996, 26, 449–456. [Google Scholar] [CrossRef]
  32. Hua, S.; Wang, K.; Yao, X.; Xu, W.; He, Y. Effects of fibers on mechanical properties and freeze-thaw resistance of phosphogypsum-slag based cementitious materials. Constr. Build. Mater. 2016, 121, 290–299. [Google Scholar] [CrossRef]
  33. Gencel, O.; Jose, D.; Sutcu, M.; Koksal, F.; Rabanal, F.P.A.; Martinez-Garrera, G. A novel lightweight gypsum composite with diatomite and polypropylene fibers. Constr. Build. Mater. 2016, 113, 732–740. [Google Scholar] [CrossRef]
  34. Martias, C.; Joliff, Y.; Favotto, C. Effects of the addition of glass fibers, mica and vermiculite on the mechanical properties of a gypsum-based composite at room temperature and during a fire test. Compos. B Eng. 2014, 62, 37–53. [Google Scholar] [CrossRef]
  35. Iucolan, F.; Liguori, B.; Aprea, P.; Caputo, D. Thermo-mechanical behaviour of hemp fibers-reinforced gypsum plasters. Constr. Build. Mater. 2018, 185, 256–263. [Google Scholar] [CrossRef]
  36. Zhu, C.; Zhang, J.; Peng, J.; Cao, W.; Liu, J. Physical and mechanical properties of gypsum-based composites reinforced with PVA and PP fibers. Constr. Build. Mater. 2018, 163, 695–705. [Google Scholar] [CrossRef]
  37. Gencel, O.; Diaz, J.; Sutcu, M.; Koksal, F.; Rabanal, F.P.A.; Martinez-Barrera, G.; Brostow, W. Properties of gypsum composites containing vermiculite and polypropylene fibers: Numerical and experimental results. Energy Build. 2014, 70, 135–144. [Google Scholar] [CrossRef]
  38. Feng, J.; Yin, G.; Tuo, H.; Nu, Z. Parameter optimization and regression analysis for multi-index of hybrid fiber-reinforced recycled coarse aggregate concrete using orthogonal experimental design. Constr. Build. Mater. 2020, 267, 121013. [Google Scholar] [CrossRef]
  39. Guo, L.; Jian, L.; Rui, G. Investigation of the water resistance of gypsum materials. ZKG Int. 2003, 56, 87–93. [Google Scholar]
  40. JG/T 266-2011, Foamed Concrete, China Standards Press, Beijing, China. Available online: https://www.chinesestandard.net/PDF/English.aspx/JGT266-2011 (accessed on 6 January 2022).
  41. GB/T 9776-2008, Building Gypsum, China Standards Press, Beijing, China. Available online: https://www.chinesestandard.net/PDF/English.aspx/GBT9776-2008 (accessed on 6 January 2022).
  42. JC/T 698-2010, Gypsum Block, China Standards Press, Beijing, China. Available online: https://www.chinesestandard.net/PDF/English.aspx/JCT698-2010 (accessed on 6 January 2022).
  43. Zhao, F.; Hu, J.; Zeng, P.; Wang, L.; Zhao, L. Optimization of the ratio of base phosphogypsum cemented backfill based on orthogonal experiment. Chin. J. Nonferrous Met. 2021, 31, 10. (In Chinese) [Google Scholar]
  44. Nili, M.; Afroughsabet, V. Combined effect of silica fume and steel fibers on the impact resistance and mechanical properties of concrete. Int. J. Impact Eng. 2010, 37, 879–886. [Google Scholar] [CrossRef] [Green Version]
  45. Zhang, F.; Li, G.; Li, J.; Ma, Y.; Tang, H.; Zhang, J.; Liu, L. The Experimental Research on Additive Improving Water Resistance of Gypsum. Non-Met. Mines 2015, 38, 26–28. (In Chinese) [Google Scholar]
Figure 1. XRD spectra of raw materials RPG and HPG.
Buildings 12 00207 g001
Figure 2. SEM morphology of RPG (a) and HPG (b).
Buildings 12 00207 g002
Figure 3. Test results of (a,b) orthogonal samples.
Buildings 12 00207 g003
Figure 4. Relationship between strength, dry density and softening coefficient of each factor. (a) Effects of foam content on compressive strength and dry density;(b) Effects of foam content on flexural strength and softening coefficient; (c) Effects of quick lime on compressive strength and dry density; (d) Effects of quick lime on flexural strength and softening coefficient; (e) Effects of silica fume on compressive strength and dry density; (f) Effects of silica fume on flexural strength and softening coefficient; (g) Effects of cement on compressive strength and dry density; (h) Effects of cement on flexural strength and softening coefficient.
Buildings 12 00207 g004
Figure 5. The surface of the A3B3C2B4 specimen.
Buildings 12 00207 g005
Figure 6. The effects of foam stabilizer and waterproofing agent content on the properties of the LFPM. (a,b) Effects of the foam stabilizer, (c,d) Effects of the water-proofing agent.
Buildings 12 00207 g006
Figure 7. Microscopic examination of the sample: (a,d) blank group; (b,e) foam stabilizer content 0.2%; (c,f) water-proofing agent content 3%.
Buildings 12 00207 g007
Table 1. Main chemical compositions of raw materials (wt/%).
ItemSO3CaOSiO2P2O5Fe2O3Al2O3
RPG55.2839.522.680.890.370.3
HPG53.641.842.710.860.380.29
Silica fume/0.1196.740.010.080.32
cement3.9661.7119.90.174.465.16
quick lime0.23898.2920.599/0.1110.14
Table 2. Factor levels of orthogonal experiments.
LevelsFactors
A (%)B (%)C (%)D (%)
17.02.52.07.5
27.53.03.010.0
38.03.54.012.5
48.54.05.015.0
Table 3. The test instruments.
Serial NumberApparatusModelManufacturer
1Electronic weight scaleZCSRui ‘an Hao Exhibition Scale Co., Ltd., Guiyang, China
2Microcomputer controlled pressure testing machineCXYAW-2000SZhejiang Chenxin Machinery Equipment Co., Ltd., Zhejiang,
China
3Automatic cement bending and compression integrated machineYAW-300Zhejiang Lixian Test Instrument Manufacturing Co., Ltd., Zhejiang, China
4Electric drying ovenXMA-2000Shanghai Qiuzuo Scientific Instruments Co., Ltd., Shanghai, China
5X-ray diffractionEmpyreanPANalytical B.V.
6scanning electron microscopeZEISS Gemini 300Thermo Scientific, Germany
7Electric agitatorOULAIDEGerman Olyde Company, Germany
8Electric vibrating screen machineZBSX-92AZhejiang Shangyu Zhangxing Yarn Screen Factory, Zhejiang, China
9Cement mortar test mold40 × 40 × 160 mmZhejiang Qishun Instrument Technology Co., Ltd., Zhejiang, China
10Concrete test block mold100 × 100 × 100 mmHebei Xinfu Zhengyuan Environmental Protection Equipment Manufacturing Co., Ltd., Hebei, China
11Thermal conductivity instrumentCD-DR3030Shenyang Ziweiheng Testing Equipment Co., Ltd., Shenyang, China
12Micro-cement foaming machineTH-29AZhejiang Tenghe Machinery Co., Ltd., Zhejaing, China
Table 4. Orthogonal experimental results.
Group NumberDry Density
(kg/m3)
7 d
Compressive Strength
(MPa)
14 d Compressive Strength
(MPa)
28 d Compressive Strength
(MPa)
7 d
Flexural Strength
(MPa)
14 d
Flexural Strength
(MPa)
28 d
Flexural Strength
(MPa)
28 d
Softening Coefficient
1794.31.581.761.680.560.60.670.625
2876.52.903.363.521.001.291.150.645
3898.53.204.334.381.151.391.370.633
4885.83.634.084.851.191.341.540.703
5873.03.363.433.850.741.011.240.727
6787.12.052.272.460.800.520.740.707
7812.82.162.392.540.670.580.820.555
8804.32.142.382.510.590.680.690.637
9774.31.842.693.060.660.640.960.578
10756.71.902.132.510.560.710.790.610
11777.01.921.971.770.620.680.680.684
12890.73.344.153.891.121.421.170.596
13783.52.252.412.460.700.760.760.569
14813.62.452.452.800.940.830.860.500
15812.83.163.083.101.001.020.920.742
16821.72.412.462.110.690.660.680.768
Table 5. Results of range analysis.
Types of Range LevelABCDSignificanceOptimal Solution
compressive strength
(MPa)
R7dk12.832.261.992.38
k22.432.333.192.3
k32.252.612.412.72C > B > A > DA1B4C2D3
k42.572.882.492.67
Range0.580.621.20.42
R14dk13.382.572.122.69
k22.622.553.512.53
k32.742.942.963.09C > A > B > DA1B4C2D3
k42.63.272.753.03
Range0.780.721.390.56
R28dk13.612.762.012.73
k22.842.823.592.57
k32.812.953.193.21C > A > D > BA1B4C2D4
k42.623.343.093.37
Range0.990.581.590.8
flexural strength (MPa)R7dk10.980.670.670.82
k20.700.830.970.73
k30.740.860.840.79C > A > B > DA1B4C2D4
k40.830.900.780.91
Range0.280.230.30.18
R14dk11.160.750.620.86
k20.700.841.190.85
k30.860.920.890.94C > A > B > DA1B4C2D3
k40.821.030.850.88
Range0.460.280.570.09
R28dk11.180.910.690.88
k20.870.891.120.82
k30.900.950.971.02C > A > D > BA1B4C2D4
k40.811.020.981.04
Range0.380.140.430.22
dry density
(kg/m3)
R28dk1863.8806.3795827.9
k2819.3808.5863.3810.3
k3799.7825.3822.7837.5C > A > B > DA3B1C1D2
k4807.9850.6809.7815.0
Range64.144.468.227.1
softening coefficientR28dk10.6520.6250.6960.569
k20.6570.6160.6780.634
k30.6170.6540.5870.685D > C > B > AA2B4C1D3
k40.6450.6760.6090.683
Range0.0400.0610.1090.116
Table 6. Results of ANOVA.
ItemFactorSSDFMS (Effect)MS9 (Error)FSignificance
dry density (kg/m3)A979233263.91940.01.68C > A > B > D
B503431678.11940.00.86
C1031733438.91940.01.77
D18293609.71940.00.31
28 d compressive strength
(MPa)
A2.3030.770.701.09C > A > D > B
B0.8130.270.700.39
C5.5131.840.702.62
D1.7630.590.700.84
28 d
flexural strength
(MPa)
A0.3330.1110.0741.49C > A > D > B
B0.0430.0140.0740.19
C0.3830.1280.0741.72
D0.1430.0450.0740.62
28 d softening coefficientA0.003730.001240.000721.72D* > C* > B > A
B0.009130.003050.000724.22
D0.033130.011030.0007215.26
C0.035430.011790.0007216.31
Table 7. Verification experiment results of the optimal mix ratio.
28 d Compressive Strength (MPa)Dry Density (kg/m3)28 d Flexural Strength (MPa)28 d Softening Coefficient
Results3.15809.10.970.628
Table 8. Optimization results of specimens with different foam stabilizer contents.
Group NumberFoam Stabilizer (wt%)Dry Density (kg/m3)7 d Compressive Strength (MPa)28 d Compressive Strength (MPa)7 d
Flexural Strength (MPa)
28 d
Flexural Strength (MPa)
28 d
Softening Coefficient
10809.12.843.150.631.030.628
20.1812.43.103.550.561.090.635
30.2830.33.804.080.971.260.603
40.3805.62.973.010.560.980.636
50.4806.72.753.090.50.970.71
60.5810.12.803.100.851.020.822
Table 9. Optimization results of specimens with different waterproofing agent contents.
Group NumberWaterproofing Agent (wt%)Dry
Density
(kg/m3)
7 d
Compressive Strength (MPa)
28 d
Compressive Strength (MPa)
7 d
Flexural Strength (MPa)
28 d
Flexural Strength (MPa)
28 d
Softening Coefficient
Water Absorption
10809.12.843.150.631.030.6280.542
21.5812.32.753.170.861.160.6350.538
33.0840.63.053.890.981.490.6030.426
44.5896.85.56.471.592.270.6360.382
56.01013.87.88.62.292.770.710.238
67.5865.34.855.311.912.310.8220.442
Publisher’s Note: MDPI stays neutral with regard to jurisdictional claims in published maps and institutional affiliations.

